modelling and stress analysis of lumbar...
TRANSCRIPT

MODELLING AND STRESS ANALYSIS OFLUMBAR SPINE
SITI SYAZNI BINTI ZULKIFLI
UNIVERSITI SAINS MALAYSIA
2015
MODELLING AND STRESS ANALYSIS OFLUMBAR SPINE
by
SITI SYAZNI BINTI ZULKIFLI
Thesis submitted in fulfilment of the requirementsfor the degree of
Master of Science
February 2015

ii
AKNOWLEDGEMENTS
First and foremost, Alhamdullillah to Allah s.w.t., the Most Gracious and
Most Merciful for His blessings, finally I completed my thesis successfully. Here I
would like to express my gratitude to everyone who supported and assisted me
during the process of completing this thesis.
I also would like to express my thanks and appreciation to my project
supervisor, Dr. Inzarulfaisham Abd Rahim for his continuous support and guidance
given for this project. During thesis progresses, he always gave me his valuable ideas
and comments which were very useful for me. Without his guidance, feedback and
contribution, it would be very difficult to complete it within the time given.
Besides that, thanks to Mr. Mohamad Ikhwan Zaini Ridzwan for giving me
an information, materials and support especially regarding using MSC. Mentat/Marc
software. I wish to thank Dr. Imran bin Yusuf from USM Healthy Campus for
helping and providing me with the spinal data. Further gratitude should be dedicated
to laboratory technicians, staff and lecturers in the School of Mechanical
Engineering, USM for their help throughout my studies here.
In this opportunity, I would like to thank my parents, Zulkifli and Roshani
who always give motivational support and encouragement for me. Not forgetting to
thank my all friends who supported me throughout the whole process of completing
this master project. Finally my greatest appreciation goes to my beloved husband
Mohd Shafry Abdul Aziz for giving me an endless support and love that strengthen
me to overcome all the problems while completing my studies.

iii
TABLE OF CONTENTS
AKNOWLEDGEMENTS............................................................................................ ii
TABLE OF CONTENTS............................................................................................ iii
LIST OF TABLES .....................................................................................................vii
LIST OF FIGURES .................................................................................................... ix
LIST OF ABBREVIATIONS...................................................................................xiii
ABSTRAK ................................................................................................................ xiv
ABSTRACT............................................................................................................... xv
CHAPTER 1 ................................................................................................................ 1
INTRODUCTION ....................................................................................................... 1
1.0 Background of the Study............................................................................... 1
1.1 Problem Statement ........................................................................................ 3
1.2 Objectives ...................................................................................................... 3
1.3 Scope of Work and Limitations..................................................................... 4
1.4 Outline of the Thesis ..................................................................................... 4
CHAPTER 2 ................................................................................................................ 6
LITERATURE REVIEW............................................................................................. 6
2.0 Anatomy of the spine .................................................................................... 6
2.0.1 Orientation of human spine.................................................................... 7
2.0.2 Functions of the human spine ................................................................ 8

iv
2.0.3 The Vertebral Body................................................................................ 8
2.0.4 The Intervertebral Disc ........................................................................ 11
2.0.5 The Motion Segment............................................................................ 12
2.1 Geometry of vertebra................................................................................... 14
2.2 Computational model of the lumbar spine .................................................. 15
2.3 Properties of materials................................................................................. 20
2.4 Loads and boundary conditions................................................................... 20
2.5 Finite element analysis ................................................................................ 23
2.6 Summary ..................................................................................................... 23
CHAPTER 3 .............................................................................................................. 25
METHODOLOGY..................................................................................................... 25
3.0 Overview ..................................................................................................... 25
3.1 Processing of medical images and 3D model reconstruction...................... 25
3.1.1 Processing of CT scanner’s images using MIMICS. ........................... 26
3.1.2 Rendering Technique ........................................................................... 28
3.1.3 Image segmentation ............................................................................. 31
3.1.4 Forming and exporting MedCAD model ............................................. 33
3.2 Reverse Engineering (RE)........................................................................... 34
3.2.1 The cloud of points and mesh processing ............................................ 34
3.2.2 The surface reconstructions................................................................. 36
3.3 Finite Element Analysis (FEA) ................................................................... 37
3.3.1 Solid model reconstruction and meshing ............................................. 37
v
3.3.2 Model validation .................................................................................. 40
3.3.3 Load and boundary conditions ............................................................. 41
3.3.4 Material Properties ............................................................................... 44
3.3.5 Structural Analysis ............................................................................... 45
3.3.6 Flowchart of the methodology ............................................................ 46
CHAPTER FOUR...................................................................................................... 48
RESULTS AND DISCUSSION ................................................................................ 48
4.0 Discussion on the bone model..................................................................... 48
4.1 Axial Compression Force ............................................................................ 48
4.2 Flexion......................................................................................................... 55
4.3 Extension ..................................................................................................... 56
4.4 Lateral bending............................................................................................ 58
4.5 Torsion......................................................................................................... 61
4.6 Analysis on the lumbar spine structure ....................................................... 64
4.7 Concluding remarks .................................................................................... 66
CHAPTER 5 .............................................................................................................. 67
CONCLUSIONS AND RECOMMENDATIONS .................................................... 67
5.1 Conclusions ................................................................................................. 67
5.2 Recommendations for Future Work ............................................................ 68
REFERENCES........................................................................................................... 69
APPENDIX A ............................................................................................................ 74
APPENDIX B ............................................................................................................ 77

vi
APPENDIX C ............................................................................................................ 78
APPENDIX D ............................................................................................................ 79
APPENDIX E ............................................................................................................ 81

vii
LIST OF TABLES
Table 2. 1 : Details of human spine curvatures (Hansen, 2010). ................................. 6
Table 2. 2 : Features of lumbar vertebra (Hansen, 2010 and Gregory & Susan, 2005).
................................................................................................................. 10
Table 2. 3 : Function of intervertebral disc (Peter, 2011). ......................................... 11
Table 2. 4 : Techniques used to develop the three dimensional model...................... 17
Table 3. 1 : Isometric view of lumbar vertebra. ......................................................... 39
Table 3. 2 : Lumbar vertebra geometries. .................................................................. 40
Table 3. 3 : Intervertebral disc geometries................................................................. 41
Table 3. 4 : The structure of finite element model. .................................................... 41
Table 3. 5 : Material properties of 3D model............................................................. 45
Table 3. 6 : Functions of Msc. Nastran and Marc processor...................................... 46
Table 4. 1 : Surface area of the upper vertebral body, facet joint and intervertebral
disc .......................................................................................................... 49
Table 4. 2 : Pressure acting on the upper vertebral body and facet joint surface....... 49
Table 4. 3 : Comparison for Von Mises Stress and Maximum Displacement on the
single unit vertebra L5 from present study with Nabhani & Wake (2002)
................................................................................................................. 50
Table 4. 4 : Maximum displacement (in mm) and Maximum Von Mises Stresses (in
MPa) at different vertebral levels for different loads applied. ................ 51
Table 4. 5 : Pressure acting on the upper vertebral body (UV) and facet joint surface
at different vertebral levels for different additional loads applied. ......... 51
Table 4. 6 : Maximum Equivalent Von Mises stress and maximum displacement for
FSU unit (lifting load and without lifting load). ..................................... 52
viii
Table 4. 7 : Maximum Von Mises stress, Maximum displacement and Rotation at
each FSU unit for different flexion moments.......................................... 55
Table 4. 8 : Maximum Von Mises stress, Maximum displacement and Rotation at
each FSU unit for different extension moments...................................... 57
Table 4. 9 : Maximum Von Mises stress, Maximum displacement and Rotation at
each FSU unit for different lateral bending moments. ............................ 59
Table 4. 10 : Maximum Von Mises stress, Maximum displacement and Rotation at
each FSU unit for different torsion moments. ...................................... 61
Table 4. 11 : Analysis result for the whole lumbar (L1 to L5) under different loading
conditions.............................................................................................. 65

ix
LIST OF FIGURES
Figure 2. 1: Views of Anterior, Posterior and Left Lateral Spinal Column (Hansen,
2010).......................................................................................................... 7
Figure 2. 2 : Body planes and motions (Wilkie et al., 2012). ...................................... 8
Figure 2. 3 : Typical vertebra regions (Gregory & Susan, 2005). ............................... 9
Figure 2. 4 : Features of an Articulated Lumbar Vertebrae and superior view of L2
vertebra (Hansen, 2010).......................................................................... 9
Figure 2. 5 : Facet joint orientation in the lumbar spine (Banton, 2012). .................. 10
Figure 2. 6 : (a) Midsagittal section of two lumbar vertebrae and the intervertebral
disc (Gregory & Susan, 2005) and (b) Intervertebral disc segment
(Peter, 2011).......................................................................................... 11
Figure 2. 7 : Motion of two adjacent vertebrae from side view (a) Flexion, (b)
Normal and (c) Extension (Gregory & Susan, 2005). .......................... 13
Figure 2. 8 : Motion of two adjacent vertebrae from back view (a) Normal and (b)
Lateral (left) (Gregory & Susan, 2005). ............................................... 13
Figure 2. 9 : Motion of two adjacent vertebrae from back view (rotation) (Maeda,
1996). .................................................................................................... 13
Figure 2. 10 : Instantaneous axes of rotation of the lumbar vertebrae (White &
Panjabi, 1990)..................................................................................... 21
Figure 2. 11 : Typical load-displacement response for a spinal unit (White & Panjabi,
1990)................................................................................................... 22
Figure 2. 12 : Ranges of motion throughout the normal spine (White & Panjabi,
1990)................................................................................................... 22
Figure 3. 1 : Types of 2D slices (a) Parallel and (b) Divergent. ................................ 26
Figure 3. 2 : Images of CT scanner’s used in this study. ........................................... 26

x
Figure 3. 3 : Orientation setting for data of 2D images. ............................................ 27
Figure 3. 4 : Data of 2D CT scan images obtained from University Sains Malaysia
(a) coronal view, (b) axial view, (c) sagittal view and (d) isometric
view....................................................................................................... 28
Figure 3. 5 : Data of 3D images of lumbar spine and IVD extracted from previous CT
scan data images (a) front view, (b) side view, (c) back view and (d)
isometric view....................................................................................... 28
Figure 3. 6 : Lumbar spine region taken from VR technique. ................................... 29
Figure 3. 7 : Threshold value steps (a) Drawing profile line, (b) Selecting start line
and (c) Adjusting threshold value. ........................................................ 30
Figure 3. 8 : Results obtained for a bone from (a) Threshold value range and (b)
Region growing..................................................................................... 31
Figure 3. 9 : Segmentation of lumbar spine model (L1-L5) and IVD. (a) front view,
(b) side view and (c) isometric view..................................................... 32
Figure 3. 10 : Polylines on the outer surface of human spine model (L1-L5 and IVD).
(a) polylines with 3D object and (b) polylines. .................................. 33
Figure 3. 11 : Data obtained from polylines (L1 and IVD12). .................................. 35
Figure 3. 12 : DSE workbench step (a) mesh created - Mesh Creation, (b) mesh
edited and removed (Mesh Cleaner) and (c) mesh closed (Mesh
Cleaner). ............................................................................................. 36
Figure 3. 13 : Mesh created in CATIA DSE workbench (L1 and IVD12). ............... 36
Figure 3. 14 : Mesh creation (dark brown) and surface reconstruction (light brown).
............................................................................................................ 37
Figure 3. 15 : Surface of 3D model created in QSR workbench (L1 and IVD12)..... 37
Figure 3. 16 : Meshing of 3D human spine model (a) Lumbar L1 and (b) IVD12.... 39
xi
Figure 3. 17 : Restraint at the bottom surface of the 3D model (a) front view and (b)
side view and pressure applied on the surface of 3D model (c) upper
vertebral body and (d) facet joint. ...................................................... 42
Figure 3. 18 : Pressure applied on the vertebra surface. ............................................ 43
Figure 3. 19 : Definition of the loads. ........................................................................ 44
Figure 3. 20 : Research flow chart. ............................................................................ 46
Figure 3. 21 : Detail process for modelling and simulation of lumbar spine............. 47
Figure 4. 1 : Comparison distribution of the Von Mises Stresses of L5 under
compression of weight of the upper body. (a) present study and (b)
Nabhani and Wake, 2002...................................................................... 50
Figure 4. 2 : Maximum Von Mises Stress versus axial compressive force. .............. 52
Figure 4. 3 : Maximum displacement versus axial compressive force. ..................... 53
Figure 4. 4 : Comparison of maximum displacement versus axial compressive force
for FSU L2/L3. ..................................................................................... 54
Figure 4. 5 : Comparison of maximum displacement versus axial compressive force
for FSU L4/L5. ..................................................................................... 54
Figure 4. 6 : Rotation (in degree) at L1/L2, L2/L3, L3/L4 and L4/L5 for different
flexion moments. .................................................................................. 56
Figure 4. 7 : Rotation (in degree) at L1/L2, L2/L3, L3/L4 and L4/L5 for different
extension moments. .............................................................................. 58
Figure 4. 8 : Rotation (in degree) at L1/L2, L2/L3, L3/L4 and L4/L5 for different
lateral moments..................................................................................... 60
Figure 4. 9 : Rotation (in degree) at L1/L2, L2/L3, L3/L4 and L4/L5 for different
lateral moments..................................................................................... 62
Figure 4. 10 : Degree of rotation versus moment for L1/L2 FSU unit. ..................... 63

xii
Figure 4. 11 : Degree of rotation versus moment for L2/L3 FSU unit. ..................... 63
Figure 4. 12 : Degree of rotation versus moment for L3/L4 FSU unit. ..................... 64
Figure 4. 13 : Degree of rotation versus moment for L4/L5 FSU unit. ..................... 64
Figure 4. 14 : Maximum Von Mises stress versus moment for lumbar spine. .......... 65
Figure 4. 15 : Maximum Displacement versus moment for lumbar spine................. 65
Figure 4. 16 : Maximum degree of rotation versus moment...................................... 66

xiii
LIST OF ABBREVIATIONS
2D Two Dimensional
3D Three Dimensional
CATIA Computer Aided Three-dimensional Interactive Application
CT Computer Tomography
DICOM Digital Imaging and Communication in Medical
DOF Degree of freedom
FE Finite Element
FSU Functional spinal unit
IGES Initial Graphic Exchange Specification
L1 to L5 Lumbar One to Lumbar Five
MedCAD Medical Computer Aided Design
MIMICS Materialise’s Interactive Medical Image Control System
MRI Magnetic Resonance Image
RE Reverse Engineering
RP Rapid Prototyping
VR Volume Rendering
xiv
PEMODELAN DAN ANALISIS TEGASAN TERHADAP TULANG
BELAKANG LUMBAR
ABSTRAK
Pemodelan dan analisa terhadap tulang belakang lumbar adalah penting untuk
meramal kesan beban dan pergerakan badan dalam aktiviti kehidupan harian. Dalam
kajian ini, jumlah beban yang berbeza dan momen disiasat. Analisa ini diberi
tumpuan kepada penumpuan tegasan yang tinggi kerana kawasan ini lebih cenderung
untuk patah. Dalam usaha untuk meramalkan tindak balas biomekanik daripada
tulang belakang lumbar, model unsur terhingga tiga dimensi L1 sehingga L5
termasuk cakera diantara tulang telah dibina dengan mengekstrak data imbasan
tomografi yang diambil daripada wanita Malaysia. Analisa telah dijalankan di bawah
pelbagai beban seperti beban paksi, momen hadapan, belakang, sisi dan kilasan
untuk menentukan agihan tegasan dan perubahan bentuk pada model. Hasil kajian
menunjukkan bahawa tekanan maksimum Von Mises adalah yang paling rendah di
bahagian tulang L5, iaitu 1.37 MPa berbanding bahagian tulang L1 iaitu 4.29 MPa.
Sementara itu, bagi anjakan maksimum, tulang L5 juga lebih rendah berbanding
dengan L1 iaitu 0.31 x 10⁻⁵ mm dan 1.51 x 10⁻⁵ mm masing-masing. Bahagian
pedikel adalah kawasan yang tertakluk kepada tekanan yang paling besar dan lebih
cenderung untuk terdedah kepada penyakit-penyakit degeneratif dan kecederaan
dikenalpasti. Analisa ini juga telah dilakukan di lumbar tulang belakang keseluruhan
dan hasilnya menunjukkan bahawa tekanan Von Mises adalah paling tinggi di bawah
momen sisi dan rendah di bawah momen kilasan. Berdasarkan tahap darjah putaran,
ia menunjukkan bahawa tulang belakang lumbar yang paling fleksibel di bawah
momen hadapan dan kurang fleksibel di bawah masa kilasan.
xv
MODELLING AND STRESS ANALYSIS OF LUMBAR SPINE
ABSTRACT
The lumbar spine modelling and analysis are crucial for prediction of the load
impact and body movement in daily life activities. In this research, different load
amount and moment are investigated. The analysis focuses on the high stress
concentration since this area tends to get fractures. In order to predict the
biomechanical response of lumbar vertebra, the three-dimensional finite element
model of L1 to L5 included intervertebral disc was constructed by extracting the
computed tomography scan data from Malaysian female. Analysis was performed
under various loadings such as axial load, flexion, extension, lateral and torsion to
determine the stress distribution and deformation on the model. The result shows that
Maximum Von Mises Stress is lowest at vertebra L5, which is 1.37 MPa compared
to vertebra L1 which is 4.29 MPa. Meanwhile, for the maximum displacement,
vertebra L5 also lower compared to vertebra L1 which is 0.31 x 10⁻⁵ mm and 1.51 x
10-5 mm respectively. The pedicle region is the areas that are subjected to the greatest
stresses and which are more likely to be susceptible to degenerative diseases and
injuries are identified. The analysis also was performed on the whole lumbar vertebra
and the result shows that the Von Mises stress was highest under lateral moment and
lowest under torsion moment. Based on the degree of rotation, it shows that the
lumbar spine most flexible under flexion moment and less flexible under torsion
moment.

1
CHAPTER 1
INTRODUCTION
1.0 Background of the Study
The human spine is a complex biomechanical structure that provides
stability to the human body. It protects the spinal cord inside the vertebral
segment and allows different motions and movement while encountering a
variety of loading conditions. Basically the spine consists of muscles, bones,
tendons, cartilage, joints, ligaments, and other soft tissues. Recently, there has
been growing concern with the degeneration in the human spine. The lowest
part of the spine also known as the lumbar spine bears the highest load of
upper body and cause a low back pain when lifting an excessive load or doing
wrong movement activities. This back pain limits normal activity or impairs
your quality of life. According to (American Association of Neurological
Surgeons, 2012), almost all people have been facing low back pain once in
their lifetime.
Numerical simulation are used to investigate the properties of
biological material, including basic structures and functions in lumbar spine.
The finite element analysis (FEA) is a common tool in numerical simulation,
which can be applied in various ways to study a complex biological system.
By applying finite element analysis on the model, the detailed information
regarding the stress distribution, deformation and rotation can be obtained in
addition to the experimental technique. In order to investigate the clinical
problem regarding the human spine as well as to predict the biomechanical
behaviour under different movements, the finite element model is very

2
effective and helpful in addition to the experimental approach (Shenghui et
al., 2005)
Various methods and techniques can be applied to predict the
biomechanical behaviour of the three dimensional model of the human spine.
For example, a three dimensional finite element model can be created by
using data from dual-energy X-ray absorptiometry (DXA) scan, magnetic
resonance images (MRI), X-ray image and computed tomography (CT) scan
image. The developed model also be analyzed for different structures such
whole spine, cervical, thoracic, lumbar, thoracolumbar, individual vertebrae,
functional spinal unit (FSU) or more stacked vertebrae, intervertebral disc,
vertebra and soft tissue. For more accurate results, different material
properties of the vertebra, disc and soft tissue are taken into consideration.
The use of finite element model can enhance interpretation, visual
evaluation and better understanding of the consequences of each situation
which include contact pressure, stress distribution, rotation of the motion and
deformation under several parameters. In addition the conversion of 2D
image data into 3D models, patients follow-up and screening could be
replaced by using the 3D surface topography which can reduce the
unnecessary radiation exposure and also surgical treatment could be
optimized using simulations before applying the operation. This can
minimize problems that potentially can occur after treatment. The used 3D
model enables surgeons to visualize the actual surgical process through
virtual animation or simulation (Rubelisa CG et al., 2008). The results from
these models can be used to identify areas that are subjected to the greatest

3
stresses and which are more likely to be susceptible to degenerative diseases
and injuries.
1.1 Problem Statement
The third region of human spine also known as lumbar spine bears the
most weight of the body. This region always associated with low back pain
due to heavy activities and wrong body posture movement. For example, a
degenerative disc disease, herniated disc from a slip and fall or spinal stenosis
from aging, bone spur, muscle or joint strain, and other disorders on human
spine especially at lumbar spine region can cause low back pain. This spine
disorder can cause limited movement and difficulty in having normal life.
There is need to identify the relationship between load impact and moment
applied on the lumbar spine under normal movement without effect the
lumbar spine.
1.2 Objectives
The hypothesis of this study is the degenerative of lumbar spine
vertebra under normal activities life will affect peoples’ movement. It is the
relationship between the load impact while lifting objects and movement of
the body during daily life that this study seeks to establish. The objectives of
this study are:
To predict the biomechanical response of lumbar vertebra based on
the stress distribution, deformation of the body and degree of motion
by performing the stress analysis under various loading conditions
such as flexion, extension, lateral and torsion.
To determine the highest impact area on the interest subject during
load and moment applied.

4
1.3 Scope of Work and Limitations
In this study, a 3D finite element model of the lumbar spine was
developed based on the CT scanned images using MIMICS software and
reconstructing the surface using CATIA software. Load and boundary
conditions were applied to the model using Msc. Patran and Mentat software,
to predict the stress distribution of the spine using Msc. Nastran and Marc
software processor. The model was limited to the lumbar vertebra spine
section (L1 to L5) and intervertebral disc with all soft tissues were removed
during the modelling process.
The limitation of this study is the representation of the complex
connection of the bone between vertebra itself and other soft tissues nearby.
This bone was segmented on every part together with the vertebra and disc
because of the different types of structures and materials. However, the most
important objective was to prepare an accurate model for simulation in order
to assess the effect of structural geometry on the stress distribution under
several load conditions.
1.4 Outline of the Thesis
Chapter 1 covers a brief introduction on the research background
regarding the biomechanical structure of human spine, especially at the lower
part which is known as the lumbar spine. The problems related to the lumbar
spine are discussed. The objectives of this research are also explained
together with the scope of work and limitations of the research work.
Chapter 2 focuses on the spine anatomy and methods approached by
other researchers. Hence, several journals, books and other resources related
to this study were used as references and guidance to compare the methods,

5
dimension of vertebra geometry, properties of the material to a get better
understanding in order to develop the three dimensional model. In general, it
is divided by two common methods which are either by experimentation or
simulation. Based on all the information gathered, the most preferable
method is discussed and explained.
Chapter 3 explains the procedure which begins with the construction
of the three-dimensional model using data of a Malaysian female until the last
analysis process of the model of the lumbar spine. Data from Digital Imaging
and Communication in Medical (DICOM) taken by a Computer Tomography
(CT) scanning machine are further reconstructed and modified using
Materialise’s Interactive Medical Image Control System (MIMICS)
and Computer Aided Three-dimensional Interactive Application (CATIA)
software. The load and boundary conditions were applied using software
MSC PATRAN and MENTAT. In order to access the results, the final stage
was completed by using MSC NASTRAN and MARC as a processor.
Chapter 4 presents the analysis of several cases different parameters
and the results obtained from finite element analysis are discussed. Based on
the differential pressure acting on the lumbar spine surface, the Von Mises
stress, minimum stress, maximum stress and deformation compare with the
other researcher work.
Finally, chapter 5 concludes the research work. Recommendations for
future work are also suggested.

6
CHAPTER 2
LITERATURE REVIEW
2.0 Anatomy of the spine
The human spinal column also known as vertebral column is a complex
mechanical structure. The spinal column is formed by stacking these vertebrae on top
of one another. These columns are important in order to protect the spinal cord and
act as the human body main upright support. This column is made up of 24 vertebrae,
including the sacrum and it is divided into five main sections as cervical, thoracic
(mid region), lumbar (lower back), sacral and coccyx. The lumbar spine or low back
bears the highest load among human spine and mostly involves with an incidence of
trauma and degeneration (Gregory & Susan, 2005). Table 2. 1 shows the detailed
explanation on human spine curvature meanwhile Figure 2. 1 shows anterior,
posterior and left lateral views of spinal column and vertebrae parts (Hansen, 2010).
Table 2. 1 : Details of human spine curvatures (Hansen, 2010).
Concave Curve Types DetailsAnteriorly(Kyphosis)
Thoraciccurvature(thoracickyphosis)
A primary curvature present in the fetus (imagine thespine in the “fetal position”
Sacral curvature A primary curvature present in the fetusPosteriorly(Lordosis)
Cervicalcurvature(cervical lordosis)
Is acquired secondarily when the infant can supportthe weight of its own head
Lumbar curvature(lumbar lordosis)
Is acquired secondarily when the infant assumes anupright posture and supports its weight

7
Figure 2. 1: Views of Anterior, Posterior and Left Lateral Spinal Column (Hansen,2010).
2.0.1 Orientation of human spine
In order to understand and describe the direction of the human anatomy
effectively, the body planes and motions are commonly used. The human body has
three planes which are coronal (frontal), sagittal (median) and transverse (horizontal)
planes and they move in many directions such as superior (cranial - to the top),
inferior (caudal - to the bottom), anterior (ventral - to the front), posterior (dorsal - to
the back), medial (midline of the body) and lateral (away from the midline of the
body). Figure 2. 2 shows planes and the motions of the entire human body.

8
Figure 2. 2 : Body planes and motions (Wilkie et al., 2012).
2.0.2 Functions of the human spine
The human spine has three primary biomechanical functions. First,
supporting the body by transferring the weights of the upper body (head and trunk)
and any additional weights lifted from the body to the pelvis. Second, providing
mobility of the trunk under sufficient physiological motions. Finally, it’s protecting
the spinal cord and spinal nerve roots from potential damaging forces and motions
produced by both physiological movements and properties of the normal spine
anatomy (Gregory & Susan, 2005 and Hansen, 2010).
2.0.3 The Vertebral Body
A typical vertebra is divided into vertebral body and vertebral arch. There
two bone regions are composed of an outer layer called compact bone (cortical) and
a core layer called spongy bone (cancellous) as shown in Figure 2. 3. The density of
bone in the vertebrae varies amongst individuals increase significantly and reaches a
peak during the mid-twenties (Gilsanz et al., 1988).

9
Figure 2. 3 : Typical vertebra regions (Gregory & Susan, 2005).
Figure 2. 4 shows the important parts of the lumbar spine contain bones,
joints and several features of the vertebra. The lumbar consists of five total large
vertebrae and support the weight of the upper body. Table 2. 2 explained several
features of the lumbar vertebra. The lumbar regions are different compared to
thoracic or cervical although as we can see them almost similar. Appendix A shows
the different features among these vertebrae.
Figure 2. 4 : Features of an Articulated Lumbar Vertebrae and superior view of L2vertebra (Hansen, 2010).

10
Table 2. 2 : Features of lumbar vertebra (Hansen, 2010 and Gregory & Susan, 2005).
Features DetailsBody The weight-bearing portion of a vertebra that tends to increase in
size as on descends the spinePedicles The pedicles create the narrow anterior portions of the vertebral
arch. Short, thick, and rounded and attach to the posterior and lateral
aspects of the vertebral body. A groove or vertebral notch id formed above (superior vertebral
notches) and below (inferior vertebral notches) the pediclesbecause the pedicles are smaller than the vertebral bodies.
Lamina The lamina is continuous with the pedicles. They are flattenedfrom anterior to posterior and from the broad posterior portion ofthe vertebral arch. They curve posteromedially to unite with thespinous process, completing the vertebral foramen.
Articular process(facets)
Two superior and two inferior facets for articulation withadjacent vertebrae: -
Superior articular process (prezygapophysis)- The articular surfaces are directed more or less
backward and project upward from a lower vertebra Inferior articular process (postzygapophysis)- The articular surfaces are directed more or less
forward and outward and project downward from ahigher vertebra.
Figure 2. 5 shows the facet orientation of the lumbar spine facilitates more
degree of flexion and extension direction than rotation. In the lumbar spine, flexion
and extension motions increase in the range of the top to the bottom with exception
of the lumbosacral joint (L5-S1). With regards to lateral bending in the lumbar spine,
each lumbar segment presents with approximately the same amount of movement.
Likewise, axial rotation in the lumbar spine is very limited and nearly equal among
each segment (Banton, 2012).
Figure 2. 5 : Facet joint orientation in the lumbar spine (Banton, 2012).

11
2.0.4 The Intervertebral Disc
Figure 2. 6 shows the intervertebral discs (IVDs) are structures located in
between two stacked of vertebrae and contacted by vertebral (cartilaginous) end plate
and IVD consists of nucleus pulposus (ability to bind water and swell) and annulus
fibrosus (collagen gel or multi-layered cartilage), which also react like a cushion
disc. IVD transfers and distributes a loading through the vertebral column and limits
motion of the intervertebral joint. The function of the disc is to maintain the
changeable space between two adjacent vertebral bodies, the disc aids with the
flexibility of the spine while ensuring that too much motion is not occurring between
spinal segments. In addition, the IVDs simultaneously help to assimilate compressive
loads placed on the spine properly. Table 2. 3 shows the summarized details related
to IVD.
(a) (b)
Figure 2. 6 : (a) Midsagittal section of two lumbar vertebrae and the intervertebraldisc (Gregory & Susan, 2005) and (b) Intervertebral disc segment (Peter, 2011).
Table 2. 3 : Function of intervertebral disc (Peter, 2011).
Part DetailsVertebral endplate
Barrier though, which nutrients must pass to nourish the disc
Nucleus pulposus Distributes weight and shock evenly from one vertebral bodyto the next
Serves as a pivot point for motionAnnulus fibrosus Firmly joins one vertebral body to the next while allowing
motion Determines the spine of the openings in the spine for the nerve
exits

12
The discs are usually named by using the two vertebrae that surround the
disc, for example, the L4-5 disc is named by referring to the vertebra directly below
L5 disc. The shape of the IVD is determined by the shape of the two vertebral bodies
to which it is attached. The thickness of the IVDs varies from one part of the spine to
the next. The discs are the thickest in the lumbar region and thinnest in the upper
thoracic region. The cervical discs are approximately two fifths the heights of the
vertebral bodies, the thoracic discs approximately one fifth the heights of their
vertebral bodies, and the lumbar discs approximately one third the heights of lumbar
vertebral bodies. The discs of the cervical and lumbar regions are thicker anteriorly
than posteriorly, helping to create the lordosis found in these regions (Peter et al.,
1995).
2.0.5 The Motion Segment
The motion segment or also known as a functional spinal unit (FSU),
comprises of two stacked of vertebrae, the intervertebral disc and the soft tissue
(Stephen, 2008). The FSU unit is often used to measure biomechanical properties,
response and to determine angle deflection by six degrees of freedom of the spine.
For example, the FSU in the lumbar motion segment was studied to access the
biomechanical response under dynamic load in flexion motion (Osvalder et al.,
1993).
Movement between two typical adjacent vertebrae depends on the thickness
of the discs and the shape of articular process (facet). The thicker IVD of lumbar
regions gives more movements of the angle and the articular process limits the
movement of the two stacked vertebrae (Gregory & Susan, 2005). Figure 2. 7, Figure
2. 8 and Figure 2. 9 shows the normal movements also known as six degree of

13
freedom (DOF) that can occur in the spine include flexion, extension, lateral (side
bending-left) and rotation.
(a) (b) (c)
Figure 2. 7 : Motion of two adjacent vertebrae from side view (a) Flexion, (b)Normal and (c) Extension (Gregory & Susan, 2005).
(a) (b)
Figure 2. 8 : Motion of two adjacent vertebrae from back view (a) Normal and (b)Lateral (left) (Gregory & Susan, 2005).
Figure 2. 9 : Motion of two adjacent vertebrae from back view (rotation) (Maeda,1996).
14
2.1 Geometry of vertebra
The anthropometric data are referred to measurement gathered on human
dimensions which include weight, height and length. It is also used to understand the
variation in human physiology and the data obtained is different from one another
because of sex, age, race and ethnicity (McDowell et al., 2009). In order to develop
three dimensional lumbar spines with a high accuracy, geometrical data from a CT
scan is collected in two dimensional planar views and compared with the developed
model.
According to Aubin et al. (1997), in their studies was using a 3D coordinate
measuring machine (accuracy 0.1mm) to measure geometry dry cadaveric human
spine (T1-L5). Meanwhile, a fresh frozen spines of six male human (C3-S1) was
scanned with slice thickness of 1mm by the researcher Busscher et al. (2010). Then
the data obtained was measured in two dimensional with a multi-planar view system.
Other researchers, Tan et al. (2002) studied on 60 lumbar vertebrae taken
from 12 cadavers of lumbar vertebrae L1-L5 of an Asian (Singaporean) in order to
measure the quantitative three-dimensional anatomy of the lumbar region. That
research was done by varying the different parameters on the interested subject and
compared the measured data with the Causian specimens of other studies. The three-
dimensional digitizer was used to take the measurement. The reading of means and
standard errors for each of the vertebrae body, pedicle, spinal canal, transverse
process and spinous process such as linear dimension (mm), surface area (mm2) and
angular dimensions (o) was obtained for each lumbar vertebra.
Meanwhile, the data regarding the coordinating system of the model and
geometry of the lumbar spine are taken from Stokes & Gardner-Morse (1999). The
15
study was performed by crossing the musculature in the lumbar spine region. The
coordinating centres, mean length, and average of each vertebra were used to
reconstruct the spinal segment. Each coordinating point (x, y, z) in existing vertebral
was transmitted into the global coordinate system (X, Y, Z). Then, the position of
global coordinates obtained for the vertebral body centres.
In addition, the dimensions of six geometrical parameters of the L1-L4
lumbar segment were measured by Robin et al. (1994). However, other researchers
Wolf et al. (2001), have shown anatomical parameters which are represented in a cut-
away view of the vertebra and mean values of the height of the intervertebral discs
Eijkelkamp et al. (2010) and they are slightly different parameters as mentioned
before.
2.2 Computational model of the lumbar spine
The spine constructed in the biomechanical study is mainly approached by
two main methods either by using computational modelling or experimental analysis.
In the computational modelling, for example finite element model which is
constructed using a computer also needs to be validated using measurement data
taken by experiment. However, computational modelling can provide information
which cannot be easily measured by the experimental method such as internal stress
inside the lumbar spine. Furthermore, the analysis can be repeated under various
parameters loading conditions in finite element model, but not in the experimentation
because the original structure of the subject may change due to excessive load or
movement.
In recent years, various finite element models of the lumbar spine have been
researched and reported. This is because the lumbar spine has become a common

16
medical problem which affects 8 out of 10 people and mostly deals with low back
pain during their entire lives (National Institute of Neurological Disorders and
Stroke, 2012).
The development of finite element model contributes a great understanding
regarding human spine and components nearby. The model is mainly used in medical
field to understand biomechanical function of how the spine behaviours under a
healthy, diseased or damaged condition. Moreover, it is also useful in applications
and designing of spinal instrumentation (Fagan et al., 2002). Other than that, the
model is also helpful for creating new spinal implants and also suitable to investigate
clinical problems such as comparing with experimental approach in order to predict
the biomechanical behaviour (Shenghui et al., 2005).
The model was developed using different techniques either by using
experiments or simulation. For example, 3D geometrical data from male lumbar
spine cadaver (L2/L3) obtained using a highly accurate flexible touch-probe digitizer
(Faroarm-Bronze Series, Faro Technologies, Inc) was used to develop a three-
dimensional finite element model (Kim-Kheng et al., 2002). Meanwhile Lavaste et
al. (1992) also used digitizer to construct the three dimensional model geometry from
two X-rays, which taken from anterior, posterior and lateral view. In order to
describe the entire lumbar vertebra’s geometry, six main parameters taken from
different parts of vertebra were used.
Besides that, Nabhani & Wake (2002) reconstructed the models of L4/5
vertebrae (Asian male) by taking all the co-ordinating data points from slices by
using probe and then stored them in a computer. This data was converted into a
compatible format before transferring into I-DEA software. Meanwhile, by using CT
17
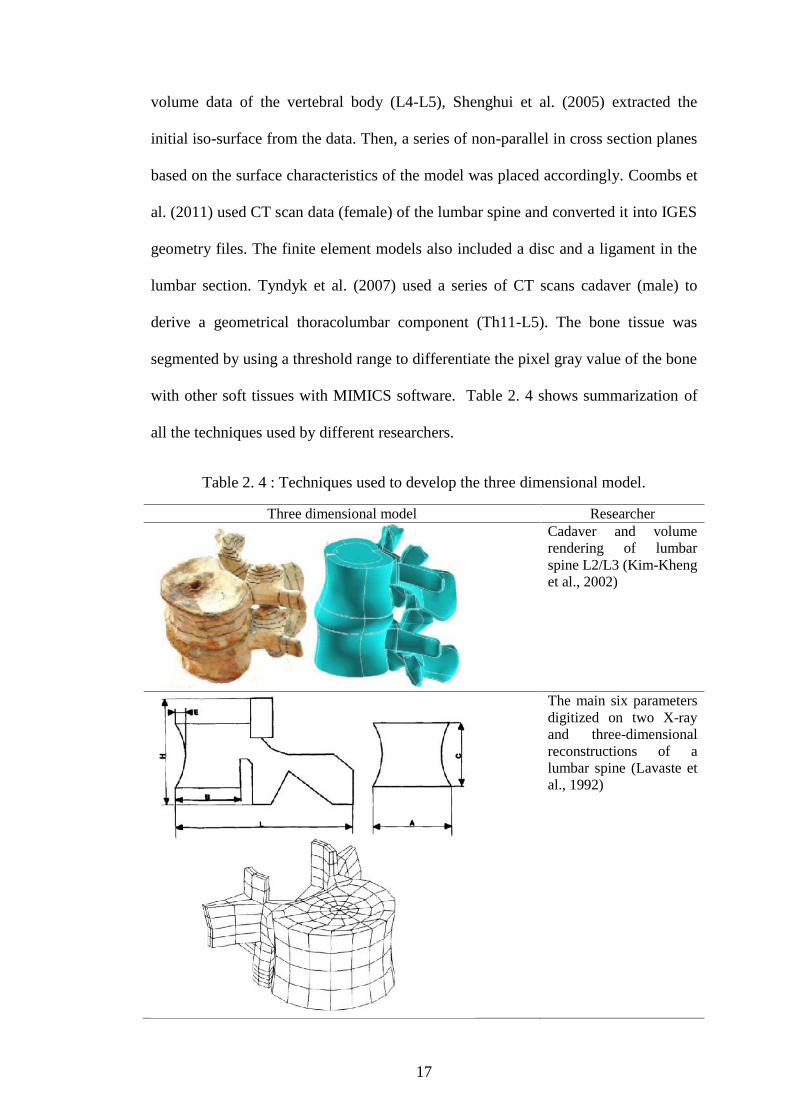
volume data of the vertebral body (L4-L5), Shenghui et al. (2005) extracted the
initial iso-surface from the data. Then, a series of non-parallel in cross section planes
based on the surface characteristics of the model was placed accordingly. Coombs et
al. (2011) used CT scan data (female) of the lumbar spine and converted it into IGES
geometry files. The finite element models also included a disc and a ligament in the
lumbar section. Tyndyk et al. (2007) used a series of CT scans cadaver (male) to
derive a geometrical thoracolumbar component (Th11-L5). The bone tissue was
segmented by using a threshold range to differentiate the pixel gray value of the bone
with other soft tissues with MIMICS software. Table 2. 4 shows summarization of
all the techniques used by different researchers.
Table 2. 4 : Techniques used to develop the three dimensional model.
Three dimensional model ResearcherCadaver and volumerendering of lumbarspine L2/L3 (Kim-Khenget al., 2002)
The main six parametersdigitized on two X-rayand three-dimensionalreconstructions of alumbar spine (Lavaste etal., 1992)

18
Table 2.4. Continued.
Three dimensional model ResearcherSolid model of L5vertebra (Nabhani &Wake, 2002)
Model of initial surfacemodel and “the bestcross-section planes” innon-parallel series (L4-L5) (Shenghui et al.,2005)
CT scan of lumbar spine andfull model in Abaqus CAEsoftware (Coombs et al.,2011)
Segmentation of CT scandata, surface model, andfinite element model ofvertebra (Th11-L5) (Tyndyket al., 2007)

19
In order to analyze the three dimensional model, several parameters has been
chosen and applied by other researchers to their development model. First, parameter
that has been taken into consideration is mesh generation. The meshing types chosen
depend on the dimension of the model either two or three dimensions (composed of
points and elements) and structure itself either simple or complex. Because of
complexity of the lumbar spine structure, usually a tetrahedral or hexahedral type is
chosen. Appendix B shows the different types of meshing will result different
amounts of elements and the tetrahedral mesh divides more elements compared to
hexahedral within the same volume.
According to other findings, the model developed by different methods was
analyzed using many ways and various conditions were applied to it. For example,
Kim-Kheng et al. (2002) converted the data into IGES before importing into the FE
modelling software and ANSYS for the 3D FE mesh construction. The FE model
consisted of 817 (noded elements) and 8,281 solids (8-noded elements) with 32,641
DOF. Meanwhile, Pitzen et al. (2002) investigated the biomechanical behaviour of
the lumbar spine under the compression load by modelling the nonlinear finite
element model (L3/4) by dividing the structure into several parts. It is much easy to
characterize and model the lumbar mathematically by developing a simple FE model.
The element described in the geometry model is connected with nodes.
Tyndyk et al. (2007) have similar investigations in the extended
thoracolumbar region by using a series of medical images (CT data) to generate
anatomical 3D FE models. There were two modelling methods as CAD and STL-
CAD which were used to create a complex model of the spine. These different
methods have resulted in different time consumptions when meshing on the model.
The CAD used the conventional mapped mesh meanwhile STL-CAD used the

20
combined 3D tetrahedral element with brick elements which was less time
consuming. The finite element models of vertebrae generated by Nabhani & Wake
(2002) then were made to use 3D, solid, linear, tetrahedral elements. The volumes of
each model were meshed separately with different meshing parameters.
2.3 Properties of materials
The properties of the model must be defined according to the actual human
lumbar spine before analyzing the developed model. The material properties shown
in Appendix C were taken from the findings of Lavaste et al. (1992); Robin et al.
(1994); Ezquerro et al. (2004); Guan et al. (2006) and Kuo et al. (2010) for
investigating the biomechanical behaviour of the human lumbar spine.
The studies by Nabhani & Wake (2002) focused on the modelling and analysis
of the three dimensional finite element model of lumbar spine L5. The lumbar
structures produced were assumed as a solid and hollow cortical bone and were
analyzed by using finite element analysis and model. Over the years, finite element
method has been recognized as a complementary to the experimental approach in
investigating clinical problems and also it is helpful to predict the biomechanical
behaviour (Kim-Kheng et al., 2002).
2.4 Loads and boundary conditions
In order to study the different parameters such as effects variation of material
property and load cases, different spinal segments, both simple and complex FE
models of single vertebrae (Nabhani & Wake, 2002), functional spinal unit (motion
segment) (Pitzen et al., 2002; Coombs et al., 2012 and Lodygowski et al., 2005),
whole lumbar spine (Shirazi-Adl & Parnianpour, 2000 and Kim et al., 2007), and

21
extended spine (Ezquerro et al., 2004; Tyndyk et al., 2007 and Han et al., 2011) have
been proposed.
The 3D model of the developed lumbar spine was further processed in order
to evaluate the data. The ways of load and boundary conditions were applied to make
each of the study different from another. Figure 2. 10, Figure 2. 11 and Figure 2. 12
shows the type of movement, typical load-displacement and range of motion
respectively on the lumbar vertebrae, which is applied when the human body is
moved. For example, Nabhani & Wake (2002) developed three types of models
which were solid cortical bone, hollow cortical shell, and cortical shell and
cancellous centre. The same load was applied to these models to verify the maximum
and minimum Von Mises stresses and also maximum displacement that can be
occurred. The load used to be about 65% of overall weight body and it is distributed
to the upper vertebral body (70%) and superior articular processes (30%). The
arranging of both compressive and shears force gave a more accurate mathematical
model than just by applying a vertical load on the upper vertebral body only.
Figure 2. 10 : Instantaneous axes of rotation of the lumbar vertebrae (White &Panjabi, 1990).

22
Figure 2. 11 : Typical load-displacement response for a spinal unit (White & Panjabi,1990).
Figure 2. 12 : Ranges of motion throughout the normal spine (White & Panjabi,1990).
Meanwhile, Tyndyk et al. (2007) used the three specific loading conditions
where a load was applied to the first model to a rigid plate located on the first
vertebra (Th11). The second model used a compressive force which was divided into
upper vertebral body (75%) and to facet joint (25%). Then, the same condition was
applied to the third model like in the second model, but the force (Z-axis) acted on
facet joint was at an angle of approximately 50o. The same force in an axial direction
was applied to these entire models.

23
2.5 Finite element analysis
Finite element analysis is a commonly used technique in research activities
and industries. It saves a lot of cost since the new designs are allowed to be tested
through computer analysis before manufacturing the prototype, examined the
components and systems which cannot be readily be experimented and even do the
investigation to ‘diagnose’ the design (Fagan et al., 2002). For example, Rohlmann et
al. (2008) used finite element analysis to predict mechanical behaviours such as IVD
rotations, pressures and forces in the facet joint of the lumbar spine after a total disc
replacement under several factors. Meanwhile, Hsieh et al. (2007) also chose finite
element analysis in order to study the injuries of the lumbar spine on collision. The
real impact force of a traffic accident was used as a boundary condition parameter in
their study in order to examine how many injuries were occurred.
The finite element analysis was also used by Galbusera et al. (2011) to
investigate degenerative changes of the intervertebral disc. The changes, especially
in disc composition such as disc height loss and water loss were analyzed with a
combination of poroelastic non-linear finite element model of L4-L5. Besides that, in
implant research, such as comparison to determine which one the best dynamic
spinal fixator between Dynesys (DY) and K-ROD (KD), Lin et al. (2013) designed
these spinal fixator. These spinal fixator functions are to provide flexibility and to
restore spinal stability. The analysis was conducted together with finite element
models of the degenerated lumbar spine to examine the biomechanical effects of the
spinal fixator in the human body system.
2.6 Summary
The literature review showed the recent research trend in the study of
modelling and stress analysis of lumbar spine in particular on types of gender,

24
material properties and load/boundary conditions. It is clear that different parameter
applied such as load and moment during analysis can be related to the biomechanical
response. Each of lumbar vertebrae has a different maximum degree of rotation since
it is located at different level and also has different size of the vertebra. The
relationship between load impact while lifting objects and movement of the body of a
Malaysian female has never been reported. It is important to determine how these
two conditions affect daily life activities.