modelling of the removal of livestock-related airborne contaminants via biofiltration dennis mcnevin...
Post on 20-Dec-2015
216 views
TRANSCRIPT

Modelling of the removal of livestock-related airborne
contaminants via biofiltration
Dennis McNevin and John Barford
Department of Chemical Engineering
University of Sydney
Australia

Biofiltration
ORGANICMATERIAL
ODOROUS AIR
WATER,NUTRIENTSCLEAN AIR
HUMIDIFIER

Mathematical model
aqueous phase
gaseous phase
z
z+dz
solid support
biofilm

Solid filter medium
bulk density of the dry solid (g per m3 dry solid)voidage of the dry solid (m3 space per m3 dry solid)water content of the solid (m3 water per g dry solid)interfacial area available for heat and mass transfer (m2 per g dry solid)partition coefficient (g.m-3 compound j in the gas phase at equilibrium with 1 g.m-3 compound j adsorbed onto the solid)
s
dry
W
a
j
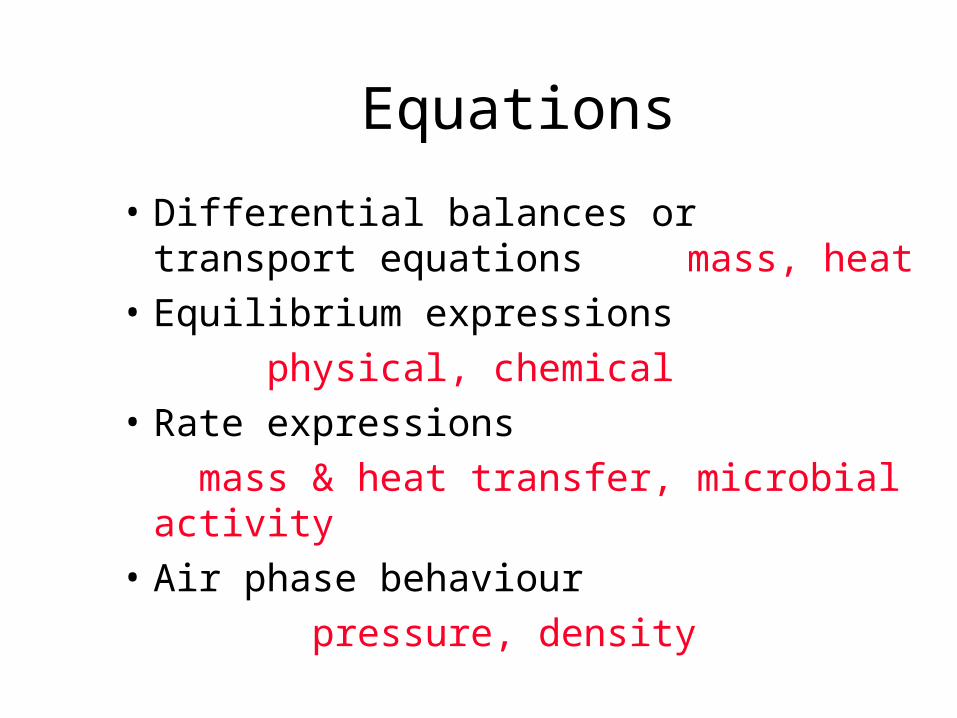
Equations
• Differential balances or transport equations mass, heat
• Equilibrium expressions
physical, chemical
• Rate expressions
mass & heat transfer, microbial activity
• Air phase behaviour
pressure, density

Bioconversions aerobic
Organic carbon oxidation
VOC CO2 + H2O chemoheterotrophs
Nitrification
NH4+ NO2
- Nitrosomonas spp.
NO2- NO3
- Nitrobacter spp.
Sulfide oxidation
S2- SO42- Thiobacillus spp.

Aqueous phase mass balances
Aqueous species divided into four groups:
dissociating non-dissociating
volatile NH3, H2S, CO2 VOC, O2, N2
non-volatile
HNO2, HNO3,H2SO4
Ca2+, Cl-

Volatile, non-dissociating species
j = VOC, O2, N2
• Diffusion
• Bulk flow
• microbial production/consumption
• mass transfer from air/biofilm interface
C
tD
C
z
u C
zr
k a
WC Cl j
l jl j l l j
jl j
l j l j,
,, , ,
, , 2
2

Non-volatile, non-dissociating species
j = Ca2+, Cl-
• Diffusion
• Bulk flow
C
tD
C
z
u C
zl j
l jl j l l j,
,, ,
2
2

Dissociating species
C Cl j l k
k, ,
j k
NH3 NH4+, NH3
H2S H2S, HS-, S2-
CO2 H2CO3, HCO3-, CO3
2-
HNO2 HNO2, NO2-
HNO3 HNO3, NO3-
H2SO4 H2SO4, HSO4-, SO4
2-

Volatile, dissociating species
j = NH3, H2S, CO2
• Diffusion
• Bulk flow
• microbial production/consumption
• mass transfer from air/biofilm interface
,
,, , ,
, ,
C
tD
C
z
u C
zr
k a
WC Cl j
l jl j l l j
jl j
l j l j 2
2

Non-volatile, dissociating species
j = HNO2, HNO3, H2SO4
• Diffusion
• Bulk flow
,
,, ,C
tD
C
z
u C
zrl j
l jl j l l j
j 2
2

Interfacial equilibrium
• Partition coefficient for mass
• Antoine equation for temperature
jg j
l j
C
C
,
,
log P ab
c TH O2

Chemical equilibriumDissociation
• Water
• Acids
• Bases
H O H OH2 K H OHw
HA H A
KH A
HAA
B H O BH OH 2
KBH OH
BB

Chemical equilibriumElectroneutrality
n Cj l jj
n j, 0
j H+ NH4+ Ca2+ OH- Cl-
nj +1 +1 +2 -1 -1
j HCO3- CO3
2- HS- S2- NO2-
nj -1 -2 -1 -2 -1
j NO3- HSO4
- SO42-
nj -1 -1 -2

Mass transfer
• Air phase
Wakao & Kaguei (1982)
• Aqueous phase (diffusion controlled)
Sh Sc 2 11 1 3 0 6. Re/ .
kD
l jl j
biofilm,
,
kD Sh
g jg j
particle,
,
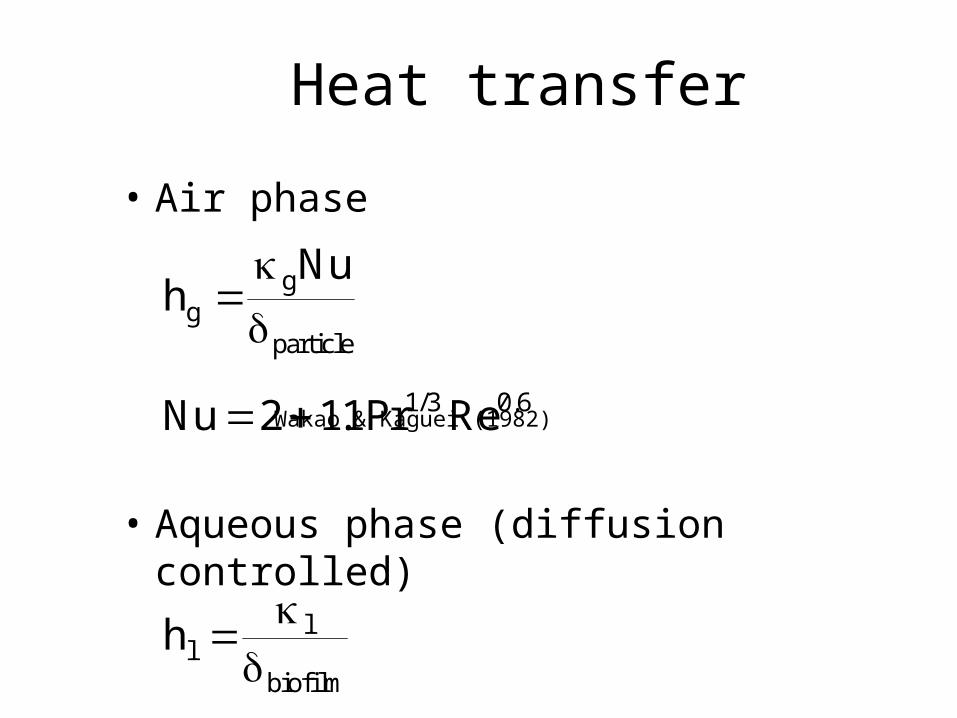
Heat transfer
• Air phase
Wakao & Kaguei (1982)
• Aqueous phase (diffusion controlled)
Nu 2 11 1 3 0 6. Pr Re/ .
h ll
biofilm
hNu
gg
particle

Gross rate of biomass growth
Monod (1942)
dxdt
x xC
K Ck
grossk k k k
l j
k j l jj
max ,
, ,
Cl,j
0.5max
max
K

Net rate of biomass growth
Endogenous or maintenance metabolism
gives a “true” growth rate:
k = VOC oxidisers, nitrifiers, sulfide
oxidisers
dxdt
dxdt
xk
net
k
grosskend
k
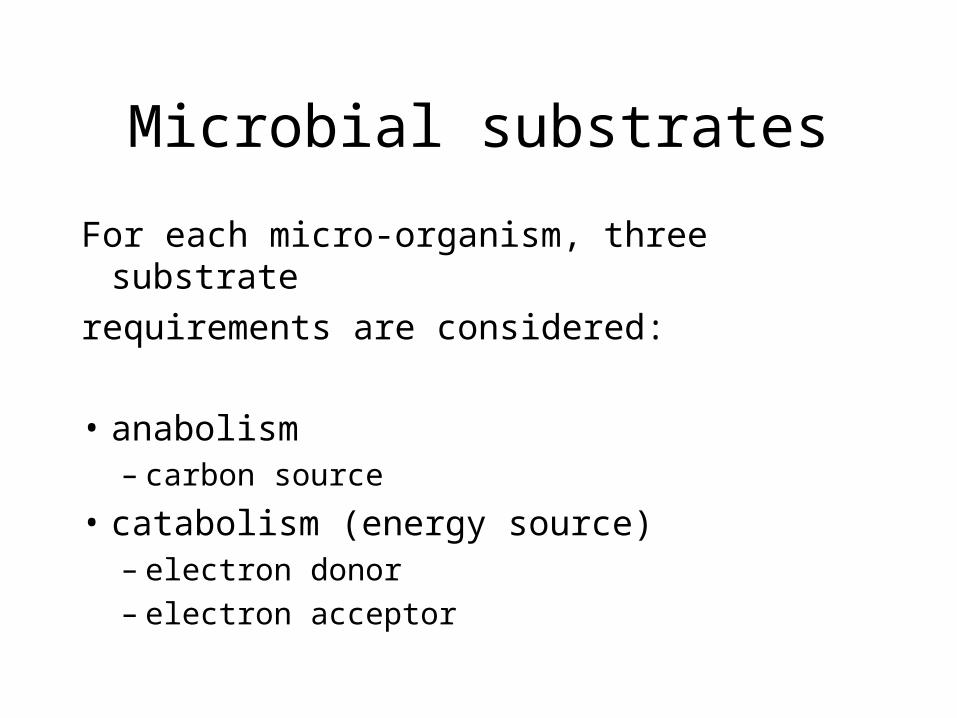
Microbial substrates
For each micro-organism, three substrate
requirements are considered:
• anabolism– carbon source
• catabolism (energy source)– electron donor– electron acceptor

Case study Nitrification
• Anabolism (balanced for carbon)
• Catabolism
5 2 5 7 2CO biomass C H NO ...
NH O NO H H O4 2 2 2
32
2
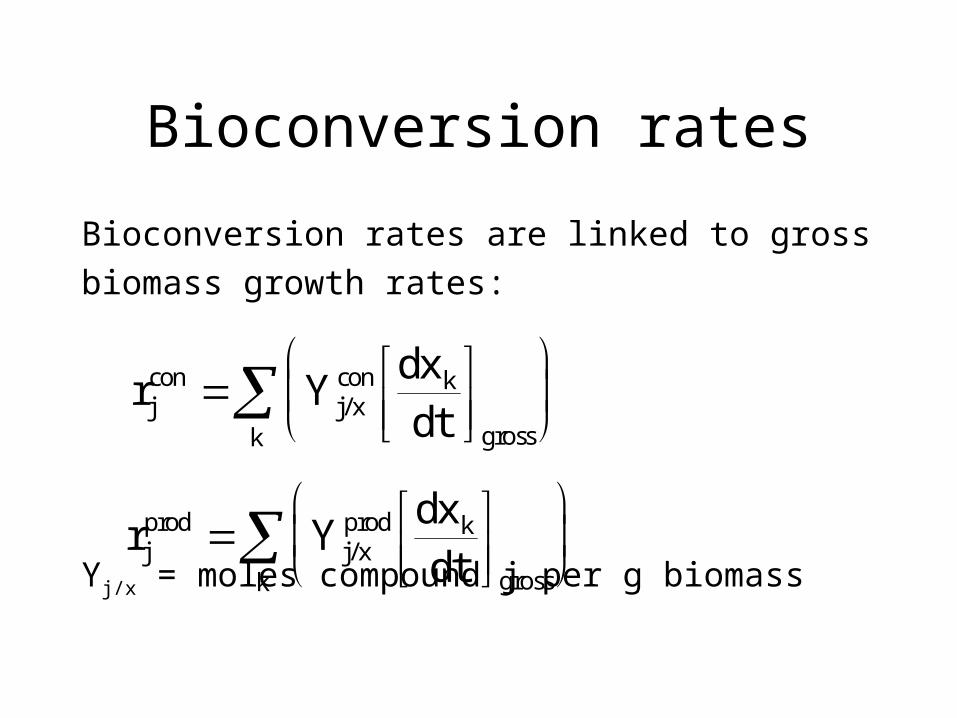
Bioconversion rates
Bioconversion rates are linked to gross
biomass growth rates:
Yj/x = moles compound j per g biomass
r Ydxdtj
conj xcon k
grossk
/
r Ydxdtj
prodj xprod k
grossk
/

pH and growth rate
k
kopt H H
1 2
1
/
/ /
1
0-log -logpHopt
opt
pH

Temperature and growth rate
k
kopt
kopt
ER T T
exp1 1
1/Topt
1/T0
lnopt

Numerical solution
• P.D.E.’s converted to O.D.E.’s by discretising the spatial dimension with finite (backward) differences
• Biofilter height divided into n equal elements. In the ith element:yz
y yZ
i i
1
2
2
1 1
2
2yz
y y y
Z
i i i

Numerical solution (cont.)
• System of O.D.E.’s and algebraic equations solved by SPEEDUP (Aspen Technology, 1994)
• Modified Gear’s method integrator selected

Comparison with experimental data
Hodge & Devinny (1995)
• Compost biofilter for removal of ethanol
• Solid medium characteristics: = 0.45
W = 60 %
= 247 000 g dry compost per m3
= 0.001 m (a = 0.004 m2g-1)
= 0.0003
s
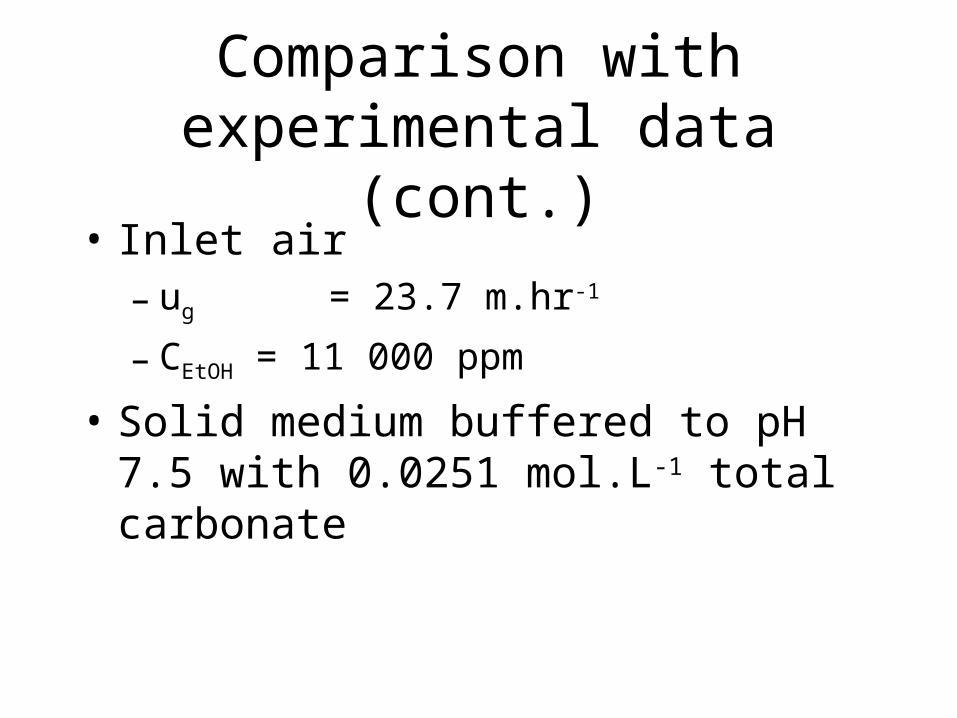
Comparison with experimental data (cont.)
• Inlet air– ug = 23.7 m.hr-1
– CEtOH = 11 000 ppm
• Solid medium buffered to pH 7.5 with 0.0251 mol.L-1 total carbonate

Air phase ethanol concentration
0
2000
4000
6000
8000
10000
12000
0 100 200 300 400 500
TIME (hours)
ET
HA
NO
L C
ON
CE
NT
RA
TIO
N (
pp
m)
Inlet ethanol concentration
Ethanol concentration at 20 % oflength
Ethanol concentration at 40 % oflength
Ethanol concentration at 60 % oflength
Ethanol concentration at 80 % oflength
Outlet ethanol concentration
Simulation

Carbon dioxide concentration profile
0
0.1
0.2
0.3
0.4
0.5
0.6
0.7
0.8
0.9
1
0 20 40 60 80 100
HEIGHT (cm)
NO
RM
AL
ISE
D C
O2
CO
NC
EN
TR
AT
ION
Model
Hodge & Devinny
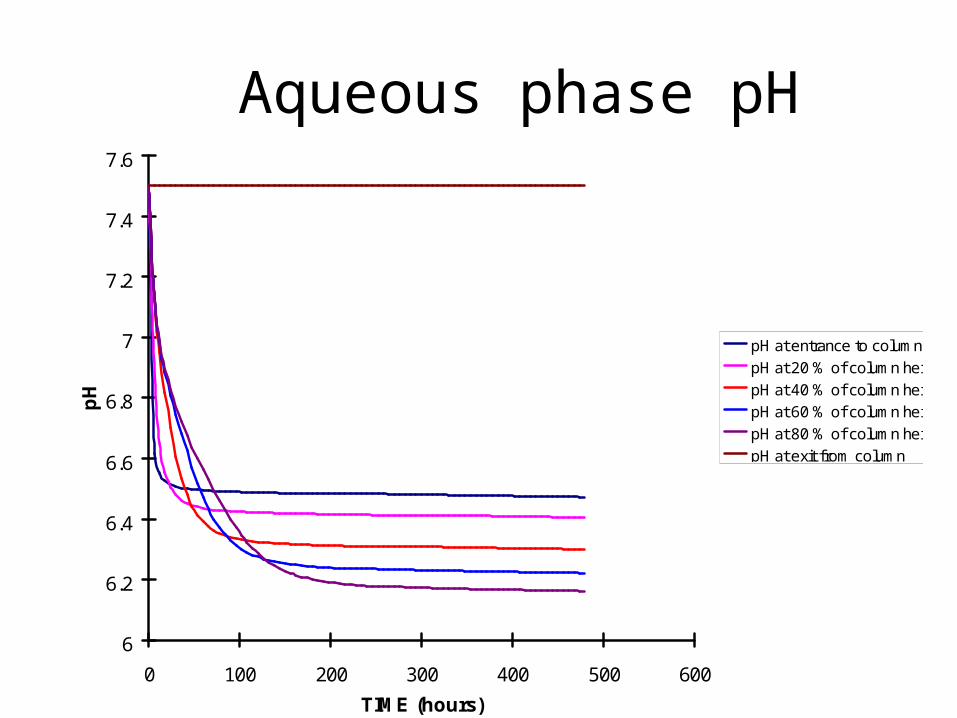
Aqueous phase pH
6
6.2
6.4
6.6
6.8
7
7.2
7.4
7.6
0 100 200 300 400 500 600
TIME (hours)
pH
pH at entrance to column
pH at 20 % of column height
pH at 40 % of column height
pH at 60 % of column height
pH at 80 % of column height
pH at exit from column

Tuning the model
Requires knowledge of:• microbiological constants
– kinetic
– stoichiometric
• thermodynamic equilibrium constants– physical
– chemical
• rheological properties

Design variables
• Choice of solid medium
• Column dimensions– diameter– height
• boundary conditions
• initial conditions
s dry jW a, , , ,

Reaction vs diffusion limitation
• Reaction limitation:– low Thiele number, – high solubility, C*– low half-saturation constant, K
• Diffusion limitation– high Thiele number,– low solubility, C*– high half-saturation constant, K
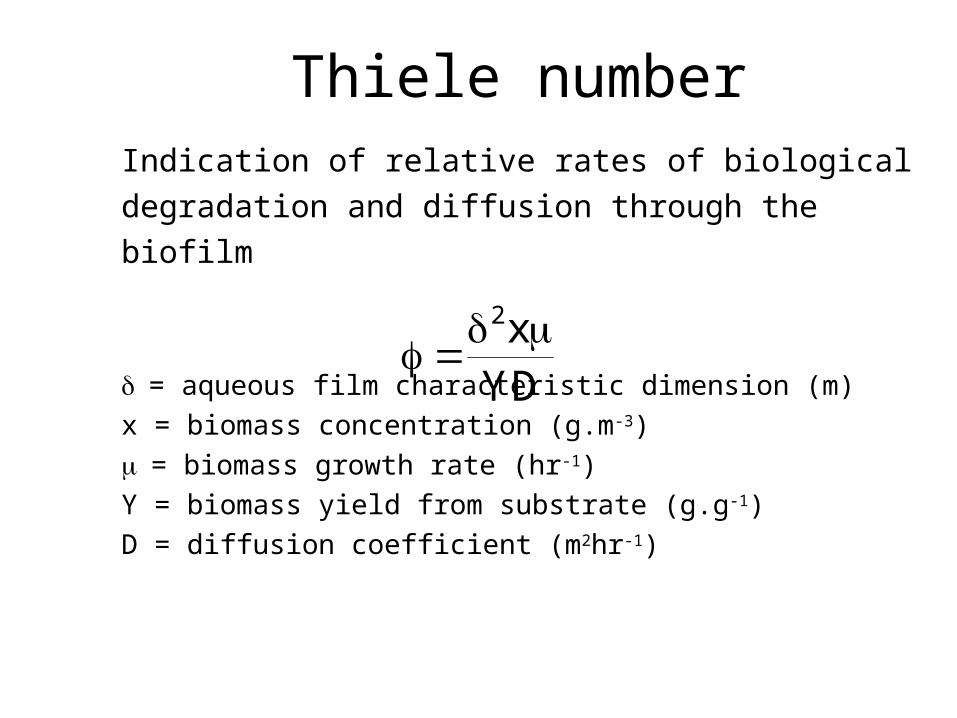
Thiele numberIndication of relative rates of biological
degradation and diffusion through the
biofilm
= aqueous film characteristic dimension (m)
x = biomass concentration (g.m-3)
= biomass growth rate (hr-1)
Y = biomass yield from substrate (g.g-1)
D = diffusion coefficient (m2hr-1)
2xYD

In conclusion ...
• Numerical model successfully predicts VOC removal via biofiltration
• Model reveals information useful for optimising microbial activity
• Model may be tuned for a particular application