modelling the carrying capacity and coexistence of pika ......modelling the carrying capacity and...
TRANSCRIPT

Modelling the carrying capacity and coexistence of pika and livestock in the mountain steppe of the South Gobi, Mongolia.
V. Retzer (1), C. Reudenbach (2)
(1) Chair of Biogeography, Universität Bayreuth, 95440 Bayreuth, Germany. Tel.: +49 921 552259; fax: +49 621 552315. E-mail address: [email protected](2) Department of Geography, Philipps-Universität Marburg, Germany
1. AbstractForage competition between small mammals and livestock is of crucial importance in most semi-arid and arid regions of the world. In order to improve the forage availability for livestock small mammals have been the target of eradication worldwide. However, in most of these regions the ecosystems are governed by non-equilibrium processes which have overwhelming influence on livestock densities. Due to these ecosystems' highly variable natural environment, field observations are usually insufficient to describe the whole system as they usually are too short to cover all significant states. Thus we used field information on processes and additional literature information to drive a dynamic model simulating forage competition between the Mongolian pika (Ochotona pallasi) and livestock in the Mongolian South-Gobi.
The regulatory mechanisms of pika's territoriality and herders' migration strategy as implemented in the model proved to be sufficient to keep the densities of both herbivore groups within the observed and denoted limits. Both groups can coexist because each has exclusive access to a forage resource unavailable to the other group: pika have the ability to bite down the vegetation deeper than livestock can while the herders drive livestock to better pasture grounds out of reach of the pika when forage is scarce. Nevertheless, both groups react to the frequent periods of forage scarcity and thus indirectly interact via forage competition.
The model shows that the large increase in livestock numbers after the Mongolian socio-economic transformation cannot be singularly explained by favourable weather conditions during that period. Only a change in herding strategies with higher livestock densities can explain the observed increase in numbers. However, the larger numbers were short-lived as the risky strategy succumbed to to adverse weather conditions in the late 1990s and livestock numbers crashed in reality as well as in the model. This indicates that in the non-equilibrium system livestock numbers are regularly forced well below the average carrying capacity. Thus, livestock densities are largely controlled by the variability of the abiotic conditions – namely precipitation – and previous levels of livestock densities cannot be increased in the long term as herding strategies are already optimised.
Keywords
small mammal, precipitation variability, non-equilibrium ecosystem, pastoralism, competition, grazing, Mongolia, modelling, carrying capacity
Printed in 2005 in Ecological Modelling 189 (1-2): 89-104 1

2. IntroductionCompetition and predator-prey dynamics have long been regarded as major factors driving ecosystem processes and population dynamics (MacArthur, 1972; Stephens & Krebs, 1986). Both aspects, however, are difficult to be studied in the field, competition because it cannot be measured directly and predator-prey dynamics because a long time series of data is needed especially for larger animals.
Due to the high inter-annual variability forage competition is even more difficult to assess in non-equilibrium ecosystems , as an extremely long time-series of field data is needed and such data are generally lacking. Process-oriented modelling is an well established approach to overcome this problem, and models focussing on the comprehension of ecosystem processes requiring only a few parameters can help to promote the understanding of the effects of competition (Bossel, 1994; Gotelli, 2001). Existing models in the field of range ecology dealing with processes are focussing either on detailed studies of the grazing process (Cohen et al., 1999; Hutchings & Gordon, 2001), grazing impact on vegetation (Weber et al., 1998; Jeltsch et al., 2001), a general description of the predator-prey dynamics (Neubert et al., 2004; Tschirhart, 2004), optimal harvesting (Hearne et al., 1996; Virtala, 1996, Georgiadis et al., 2003; Stigter & van Langevelde, 2004; Jensen, 2005), or with evaluating the ecological sustainability of management alternatives (Cooper & Huffacker, 1997; Janssen et al., 2000; Diaz-Solis et al., 2003). Wu et al. (1996) suggest a general model for grazing systems in semi-arid areas using probabilistic and fuzz parameters, but do not include forage competition between the herbivores. Regarding forage competition between livestock and wild herbivores existing models focus on the competition of livestock with large wild herbivores (van Kooten et al., 1997; O'Connor & Kiker, 2004), but although long term livestock carrying capacity in semi-arid regions under high inter-annual precipitation variability and the competition between small mammals and livestock are of global interest, the authors are not aware of any other model dealing with both aspects. Therefore, here we present the results of our model for assessing pika's status as a 'rodent pest' and derive implications on the long term carrying capacity of the dry mountain steppe in southern Mongolia.
1.1. The case study in southern Mongolia
The biomass production of the Mongolian steppes is the basis for the nutrition of about 26,1 million heads of livestock (2001), which in turn are the livelihood basis of the country's rural population (National Statistical Office of Mongolia, 2002). The predominant management strategy is pastoral nomadism; it accounts for about 30% of the GDP in Mongolia (Worldbank, 2002). The abiotic conditions of livestock herding are extreme, with winter temperatures dropping to –40°C, a short vegetation period and high rainfall variability (Barthel, 1983). Any deterioration of the forage availability results in higher mortality and thus negatively affects the 185,546 herders’ households (2001), which directly depend on their animals (National Statistical Office of Mongolia, 2002).
Therefore the competition for forage with wild herbivores is a point of concern. While many wild large herbivore species have been severely reduced in numbers in the past (Reading et al., 1999a; Reading et al., 1999b; Mix, 2000) the focus still is on small mammals. The interactions between herbivores of different sizes are manifold. Extensive literature exists on the positive feedbacks of prairie dogs (Cynomys spp.) and their colonies on the forage availability of bison in the North-American steppe (prairie) (Coppock et al., 1983; Krueger, 1986; Kotliar et al., 1999; Bangert & Slobodchikoff, 2000; Fahnestock & Detling, 2002). But in the steppes of Mongolia and Inner Mongolia another small mammal, the Brandt’s vole (Microtus brandti) is regarded as a pest. It could be shown that Brandt’s voles initiate a successional cycle on their burrows towards plants which are less favourable as livestock forage (Samjaa et al., 2000). The impact of Brandt’s vole is especially disastrous during their population outbreaks and it seems to be facilitated by high densities of livestock grazing (Shi et al., 2002;
Printed in 2005 in Ecological Modelling 189 (1-2): 89-104 2

Zhang et al., 2003). Similar processes have been reported from the steppes of Eastern Mongolia for the Daurican pika (Ochotona daurica) (Shi et al., 2002; Zhang et al., 2003a; Zhang et al., 2003b). Negative effects on livestock have resulted in eradication programmes for both small mammals in Mongolia and in China (Shi et al., 2002; Zhang et al., 2003a).
Mongolia has been undergoing a fast and relatively smooth transformation from a Soviet satellite state to a free market economy after a peaceful 'revolution' in 1991 (Fish, 2001). The collapse of the socialist system and the associated breakdown of the economy led to a sharp drop in urban employment. Many Mongolians balanced the resulting unemployment by turning back to the roots: they started to survive as pastoralists and the so called “new nomads” were born (Müller, 1995; Janzen & Bazargur, 1999; Janzen, 2000). This lead to an extreme increase in livestock numbers until 1999 and an equally sharp decline until 2002 following sub-optimal weather conditions. The impact of this new era in pastoral nomadism in Mongolia on the ecosystems is still not well established, though concern has arisen that it may facilitate pasture degradation (Batkhishig & Lehmkuhl, 2003).
In the “Gobi Gurvan Saykhan” national park the example of the Brandt's vole in Northern Mongolia in combination with the increase of livestock after the transformation gave rise to concern that a similar vicious cycle would be initiated in the mountain steppes of the South Gobi. There, the Mongolian pika (Ochotona pallasi) is the dominant and most prominent small mammal (Nadrowski et al., 2002). Not much is known about its biology nor about its interactions with its physical environment and competition with other herbivores (Smith et. al., 1990, Schneider, 1988). Therefore, a research project was set up to investigate their biology and potential for competition with livestock to assess their function within the ecosystem. Data from 1 1/2 years of fieldwork within this project were used to set up and drive the model presented.
The following four questions which arose from the fieldwork were the guidelines to define and focus the aims of the model:
1. Is long-term coexistence of pika and livestock possible, as fieldwork suggests?
2. How strong is the impact of competition on either side?
3. Are the high numbers of livestock after the transformation the result of a series of 'good' years of relatively favourable weather conditions, or did herding strategies change?
4. What can we learn about the long-term carrying capacity of the system?
The model therefore should be capable of projecting the dynamics and the interaction of the densities of small wild herbivores (pika) and large domestic herbivores (livestock) in a qualitatively and quantitatively valid fashion.
3. Material and methods
3.1. Study area
The field data was gathered in the mountain steppe of the Gobi Gurvan Saykhan range in Southern Mongolia from June 2000 to September 2001, and again in June/July 2002. The study site was situated on the southern face of the Dund Sayhan Mountain (Middle Beauty) at about 2350m at the upper end of the pediment. The area is semi-arid; rainfall is concentrated in the summer months and is very variable inter-annually as well as spatially (Barthel, 1983). The summer of 2000 was about average, while the consecutive two years were very dry.
The whole area is used as pasture by nomadic herders. As common in Mongolia, the large livestock species camels (Camelus bactrianus), horses (Equus caballus), cattle (Bos taurus)
Printed in 2005 in Ecological Modelling 189 (1-2): 89-104 3

and yak (Bos grunniens) roam freely, while sheep (Ovis aries) and goat (Capra hircus) are herded and return to the ger (mobile home) every night. Pika are abundant in this altitude and show densities of 25-35 animals per hectare (Nadrowski et al., 2002). There are also other small mammalian herbivores including the Mongolian gerbil (Meriones unguiculatus) or Grey hamster(Cricetulus migratorius) and large wild herbivores such as Black-tailed and Mongolian gazelles (Gazella subgutturosa and Procapra gutturosa), Siberian ibex (Capra sibirica) and Argali wild sheep (Ovis ammon) in the area. They are sub-summarised under the terms 'pika' for small herbivores and 'livestock' for large herbivores respectively because those two groups account for more than 95% of the biomass in each herbivore group (Nadrowski et al., 2002; Retzer, 2004).
3.2. Field methods
The data on pika were gathered using a regular live-trapping scheme with Sherman live-traps and observation of the animals on 1 ha. Trapping data were used for the calculation of pika numbers and their reproductive potential. The observational data on pika behaviour, especially on their territoriality were used to model pika's mortality rate (called 'pika's territoriality death' in the model description). Data on burrow densities and burrow areas were recorded by mapping and measuring out more than 40 burrows. Burrow creation and decay was followed on one marked burrow over two consecutive years. Livestock densities were observed from an elevated observation point.
Production data of vegetation were assessed by double-sampling of an exclosure experiment. It consisted of four different variants: 1. access for livestock and pika possible (no fence at all), 2. access only for livestock (low, narrow wire fence), 3. access only for pika (high, wide wire fence) and 4. no grazing (combination of the two fence types). Each variant was replicated four times. Data collection took place in roughly monthly intervals. This experiment was used to calculate pika requirements, pika's foraging advantage, rain use efficiency of the vegetation, and the amount of biomass which could be harvested by the scientist, but was not accessible to the animals (~30 kg/ha). Similar exclosure experiments on pika burrows were used to assess the influence of the pika's digging activity on vegetation productivity (Wesche et al., 2003; Retzer, 2004).
Basically all data on pika, pika burrows, and pika behaviour were collected by Nadrowski (Wesche et al., 2003; Nadrowski et al., 2002), while data on vegetation productivity, food competition, and livestock densities came from Retzer (2004). Additionally, information was gathered from interviews with local herders and by participatory observation. For more details regarding the investigation methods see Retzer (2004) and Nadrowski et al. (2002).
Further information was acquired from the literature. An array of statistical yearbooks on Mongolian agriculture provided especially useful information on the development of the livestock sector (National Statistical Office of Mongolia, 1996; 1998; 2000; 2001; 2002; 2003). The precipitation data for Dalandzadgad from 1937-2002 were obtained from the Meteorological Service of Mongolia. The data up to 1999 are compiled in Bergius (2002); those for 2000-2002 were directly obtained from the Meteorological Office in Dalandzadgad. Long-term precipitation data reconstructed from tree ring investigations in northern Mongolia for the period 1651-1995 (Pederson et al., 2001a,b) were used for validation and to check the long-term stability of the system.
4. Model descriptionQualitatively the validity of the model is assumed, when a stable system can be reproduced over a period of 50 years. Stability in this context does not mean constant population numbers but that the population numbers vary within a reasonable (observed) range and that none of the populations becomes extinct. Quantitative validity is given when the population
Printed in 2005 in Ecological Modelling 189 (1-2): 89-104 4

densities and phytomass production under drought conditions are close to those observed during the field campaign.
Time steps of one year were chosen as the model's temporal resolution. This means that all intra-annual (seasonal) processes have to be balanced before being included into the model. The spatial level was standardised to one hectare, ignoring any spatial gradients. Furthermore, for simplicity all simulated stocking rates of livestock are expressed in terms of livestock units, the Mongolian Sheep Unit (MSU). One MSU roughly represents the grazing capacity of one Mongolian sheep, 365 kg dry matter per year (Shurentuja et al., 2002).
The model simulates the functional response of competition between two groups of herbivores. The central variables steering the system dynamics are the production of vegetation biomass triggered by precipitation and the intake by livestock and pika. The main regulation of animal densities and the prerequisite for coexistence of both herbivore groups are two different foraging strategies. Through their smaller size pika can exploit a higher percentage of the available vegetation than livestock on the site (Farnsworth et al., 2002; Retzer, 2004), while livestock can avoid severe forage shortages by movement to better pastures (Sheehy, 1993).
All variables used to drive the model are listed in the appendices. Appendix 1 lists the initial values derived from field data, the runtime variables, and the constants from literature and field observations, while appendix 2 lists the Gauss normally distributed filter functions deduced from the statistical livestock data.
4.1. Production of vegetation biomass Ecosystems which are primarily driven by low amounts of precipitation of high variability are supposed to behave in a non-equilibrium manner (Behnke et al., 1993; Sullivan, 1996). Under these conditions the influence of the variable rainfall pattern on plant production is much more important than density-dependent feedback mechanisms from herbivores. Fernandez-Gimenez & Allen-Diaz (1999) showed in a recent case study in neighbouring Bayankhongor Aymag that the desert-steppe under investigation behaved in a non-equilibrium way, while the steppe reacts in an in an intermediate way and mountain-steppe in a more equilibrial way. In terms of annual precipitation and its coefficient of variation our study site lies somewhere between the desert-steppe and steppe of Fernandez-Gimenez & Allen-Diaz. Additionally no gradient of grazing impact could be found in the investigation area except from the trampling impact at the immediate surroundings of wells (Stumpp et. al., in press). Therefore, non-equilibrium conditions were assumed for the model. This implies that vegetation growth is triggered by precipitation only, and that density effects of livestock on vegetation are neglected. Thus, vegetation growth is directly triggered by the annual precipitation dynamics.
The experimentally derived rain use efficiency (RUE) of the vegetation describes the production of dry vegetation per mm of precipitation (Le Houerou, 1984) and can be used to convert annual precipitation sums into productivity for estimating potential livestock production (Guevara et al., 1996). However, as pika burrows are more fertile than the steppe matrix, the area has to be split into two zones of productivity: burrow area (BA as derived from the field experiments) and steppe matrix area (SA). Pika burrows are by the factor bV more productive than the steppe matrix. Therefore overall rain use efficiency (RUE) is calculated from the rain use efficiency derived from the field experiments for the steppe matrix (rueS) by:
RUE=rueS∗S ABA∗bV
The annual precipitation data from Dalandzadgad are continuously available from 1937. The amount of precipitation was comparable to the precipitation recorded at the camp during the
Printed in 2005 in Ecological Modelling 189 (1-2): 89-104 5

investigation and is therefore used to drive the model (R). However, RUE cannot be used directly as an estimator for phytomass production as a constant amount of vegetation biomass per hectare can be harvested by the human researcher but cannot be consumed by any of the herbivores (v). This is due to the harvest method, as all phytomass which could be reached was collected. However, it turned out that from this an amount of approximately 30 kg/ha was not accessible to neither livestock nor small mammals as this phytomass remained on the plots during winter regardless of grazing intensity (Retzer, 2004). Therefore, this amount of phytomass has to be subtracted from the produced phytomass in order to get the net vegetation biomass V:
V=RUE∗R−v
4.2. CompetitionThe core idea of the implementation of competition is based on a comparison of the forage demand of pika and livestock with the net available vegetation biomass. Using the ratio of forage demand of pika (FP) and livestock (FL) and net vegetation biomass (V), the potential consumption ratio (PCR) is standardised according to:
PCR=F PF L−V
V
to derive a dimensionless unit. The mean PCR ( PCR ) of the actual and the previous year is then:
PCR=PCRtPCRt−1
2
PCR is used as a binary decision criterion to determine whether or not both populations have access to a sufficient amount of forage to satisfy their needs. Competition occurs if PCR is greater than zero. Consequently animals will starve if other adaptation opportunities such as hay stocking or emigration prove inefficient to make up for the missing forage. Due to a coarse classification of the observed and statistically derived numbers of herbivores the following conditions were implemented.
The starvation process of the pika population is initiated if:
PCR0
and that of livestock if:
PCR0
In general, these conditions can be interpreted as a simple implementation of the metabolism of both the herbivore groups: while livestock can partially rely on stored body fat from last year, and therefore can cope with some adverse conditions, pika do not store body fat and need constant access to forage. The impacts of competition on the herbivore populations, such as emigration, starvation, etc. are discussed in the separate sections of livestock density dynamics and pika dynamics.
4.3. Livestock density dynamicsThe density of domestic herbivores for centuries has been largely controlled by the opportunistic management decisions of the herders. They try to optimise (= maximise numbers while minimising losses) their livestock numbers by adapting their migration strategies to the
Printed in 2005 in Ecological Modelling 189 (1-2): 89-104 6

forage availability(Dean & Macdonald, 1994; Ward et al., 1998; Illius et al., 1998). This assumes that livestock are slaughtered before they reach maximum age; therefore, death from old age can be ignored. Livestock losses due to diseases and predator attacks are relatively rare and poorly documented. Furthermore, such losses often are interrelated with other causes such as drought. Thus, such losses have not been modeled separately but sub-summarised under other causes of livestock deaths. Water as a limiting factor can be neglected because water points and wells are frequent around the mountains of the Gobi Gurvan Sayhan (Schmidt, 2000). Animal diseases do not seem to be a major problem at the moment and are explicitly not included into the model. The processes regulating the livestock population thus are reproduction (Abel & Blaikie, 1990; Scoones, 1993; Georgiadis et al., 2003), slaughter, and starvation. Regarding the migration strategy herders generally have the intention to stay where they have traditional pasture rights. As a result they immigrate with a higher priority than they emigrate.
Therefore, the fundamental processes for livestock dynamics are reproduction, emigration (leaving the model hectare in search for better pasture elsewhere), immigration (returning to the model hectare), starvation and slaughtering. Because the model has a timely resolution of one year, the following basic assumption regarding the timing of the processes are made:
1. The first response to lack of forage is emigration.
2. Starvation takes place if insufficient forage availability cannot be balanced any longer by energy stored as body fat.
3. Slaughtering affects all livestock, emigrating or not, except those that died of starvation.
4. Immigration is possible only if the estimation of forage availability indicates a surplus when compared to the forage needs of the livestock already in place.
Emigration
Whenever forage is not sufficient (PCR>0) herders have to decide whether or not they migrate their livestock towards another pasture. The emigration decision is based on the standardised PCR as a direct reaction to the forage competition of any given year:
• If −1PCR0 forage is sufficient and there is no need to emigrate.
• If 0≤PCR1 forage supply is insufficient and herders start emigrating.
To meet the assumed trend to minimise emigration activities, an empirically derived linear relationship is implemented for the factor of livestock emigration mL which intends to minimise emigration activities. The upper threshold should be smaller than 1.0 and therefore is set to 0.9. The factor of herders' emigration wish (mH) is then derived from:
mH=a mH PCR∗s mH
The forage deficit (Fd) is calculated from the actual demands of pika and livestock populations according to:
Fd=V −F PF L To simulate the fact that herders do not have exact knowledge of future precipitation and phytomass production, the amount of total forage deficit is multiplied with a normally distributed Gauss filter function (see appendix 2 gFd) to add some statistical noise. Furthermore, only non-slaughtered livestock on the 1-ha plot can emigrate. Therefore the number of emigrating livestock is at most L-Lst. The number of emigrating livestock is then finally de
Printed in 2005 in Ecological Modelling 189 (1-2): 89-104 7

rived from:
Lm=gF d
fL∗mH if gF d0∧mH0∧LmL−Lsl
Immigration
The model variables describing emigration and immigration have to be based on different premises to avoid an unreal auto-correlation of herders' decisions. Furthermore, the decision for immigration is more speculative, as the decision to immigrate has to be made early in the year without exact knowledge about precipitation and vegetation productivity. Therefore, at the 'beginning' of each year potentially available phytomass (Ve) is estimated using a normalised running mean of precipitation for the last three years (R3). Subsequently the intensity of the herders' wish to immigrate is derived from a linear relationship depending on the normalised rainfall by comparing this estimated forage availability to the forage demand of the actual stocking rate (= potential livestock deficit). If there is more available phytomass, additional livestock immigrates. The number of immigrating livestock (Lr) is determined by multiplying this herders' immigration wish (rH) with the deficit of livestock with respect to the estimated available biomass (Ve) and livestock already in the area (L).
Vegetation biomass of the actual year is estimated according to:
V e=R3∗RUE−F P−v
And the intensity of herders' immigration wish according to:
rH =a HrR3−R
r∗s Hr
The number of immigrating livestock is subsequently calculated as:
Lr=V e−F L
fL∗rH if rH 0
This implementation is based on the assumption that external herders only want to immigrate if there is sufficient forage for both the livestock already on the plot and the immigrating livestock. The numbers of immigrating livestock are simply added to the numbers of livestock already in the area. This implementation results in a decoupling of the emigration and immigration controls avoids artificial feedback between both the processes.
It has to be stressed that although the parameters currently used to control the emigration and immigration dynamics (a(Hm), s(Hm), a(Hr), and s(Hr)) are fixed empirically, they are not arbitrary. The criterion was that in the long run the migration strategy has to maintain a balance between emigration and immigration. Thus several combinations of values were tested and the one resulting in the smallest influx of livestock into the model hectare was finally chosen. A small influx could be tolerated because the Mongolian statistical data indicate that the South-Gobi has a negative livestock balance as reproduction numbers are lower than would be necessary to sustain livestock numbers. Therefore, it can be assumed that more livestock enter the area than leave it..
Reproduction
The main process resulting in an increase of livestock numbers is the reproduction of the animals. As no significant correlation with high explanatory value between reproduction and several precipitation parameters could be found, it is implemented randomly using the Mon
Printed in 2005 in Ecological Modelling 189 (1-2): 89-104 8

golian statistics of livestock reproduction rates since 1939. Each time step a random Gauss normally distributed reproduction rate (rpL) based on the statistical moments derived from these figures (appendix 2 presents the coefficients) is applied to the actual total numbers of livestock:
Lrp=rpL∗LLr
Slaughtering
The slaughter rate (slL) is implemented analogously to the reproduction rate. A random Gauss normally distributed slaughter rate (appendix 2) with the parameters derived from the Mongolian statistics on agriculture is applied:
Lsl=slL∗L
Starvation
Livestock die of starvation (Lst) – if they did not emigrate or were slaughtered – if the mean PCR of two subsequent years PCR is positive. This conditions indicate that livestock could not fill up fat deposits for two subsequent years and therefore is prone to die from starvation:
Lst=stL∗L if PCR0∧L−LmLsl 0
Livestock numbers
Summarising all the previous equations the integral number of livestock at each time step is derived from:
L=LLrLrp−L sl−Lst−Lm
4.4. Pika population dynamicsThe dynamical patterns of the population of pika were implemented according to the following field observations:
1. Each pika needs a burrow for survival. The burrow protects it from cold and predators and provides sleeping, nesting, and storage chambers for hay. As each pika generally inhabits its own burrow and defends a territory, the number of available burrows limits the number of overwintering adult pika. Therefore, the maximum number of pika is a functional relation of the number of available burrows (~ territories).
2. Burrow creation and decay is a very slow process: within one year changes are barely visible.
3. Under average conditions pika always reproduce a sufficient number of juveniles to 'refill' any empty burrows.
4. Pika have a competitive advantage in obtaining and storing forage in comparison to livestock.
Pika's territorial behaviour allows for an elegant simplification of the implementation of pika's death. As the territories are occupied by the most vital individuals, those pika without a burrow are much more likely to fall prey to a predator or die of diseases. Furthermore, any time one of the 'burrow owners' dies of any of these causes it will be replaced by the fittest animal without a territory. This allows to summarise all causes for death – except starvation – under a single parameter 'pika territoriality death'. As the burrows are remarkably stable we also re
Printed in 2005 in Ecological Modelling 189 (1-2): 89-104 9

gard the modeled pika population as stable in the long term and assume that any extraordinary events killing a large part of the population such as epidemics are compensated for by the surplus juveniles from a nearby population.
According to these observations pika minimum population is primarily determined by the factor of forage availability, while the maximum number is controlled by the available territories. As the number of burrows is relatively static, the crucial point in modelling the population dynamics of pika is the implementation of their forage advantage.
Pika's forage advantage
Pika’s competitive forage advantage consists of two different features: pika graze more efficiently (Retzer, 2004) and additionally they can extend this advantage into the next year by storing hay for winter. Therefore pika’s advantage (fPat) is split into two: the vegetation exclusively available to pika due to their grazing advantage (Vag) and the vegetation exclusively available to them due to the advantage gained by storing this forage as hay (Vah). Pika’s competitive advantage subsequently is used to calculate pika’s minimum population density (Pm):
V ag=V∗ fPat∗1− fPah
V ah=V t−1∗ fPah∗ fPat
Pm=V agV ah
fP
As data is lacking, the percentage of pika’s advantage realised by storing hay is assigned based on a small set of field data only and therefore somehow arbitrary. However, the effect of varying the percentage of the advantage gained by storing hay (fPah) is minor.
Territoriality and starvation
As explained above, the number of overwintering adult pika is limited by the number of available burrows (B). Furthermore, pika can die of starvation if forage is scarce. Due to the temporal resolution of one year the parallel processes cannot be separated exactly. However, the calculation of the number of pika dying of one of the different causes has to be decoupled to ensure that one individual cannot die twice from different causes.
To translate the field observations into model terminology, pika which do not die a natural death of old age either die because they have no burrow for protection or of starvation. In the model the first routine calculated is that for pika dying of predation or exhaustion when they have no territory (= territoriality death, Ptd). Here, the number of available territories is represented by the number of burrows of the previous year (Bt-1) to decouple the processes in time. The number of pika dying of territoriality death can thus be calculated as:
Ptd=P j if: P jB t−1∗ pB−1
Subsequently those pika occupying a territory can die of starvation (= death by starvation, Psd) if forage is insufficient (PCR>0). The number of pika actually dying of starvation is therefore calculated according to:
P sd=P−Ptd−Pm if: PCR0∧PmP tdP
Printed in 2005 in Ecological Modelling 189 (1-2): 89-104 10

Reproduction of pika
Pika’s reproduction is calculated as a net reproduction rate (rP). This linear relationship of the precipitation conditions of the previous two years (R2) and the observed birthrate per ratio of female pika in the population (p) is derived from the conversion of the absolute field observations. The benefit of this approach is that natural death by aging can be neglected.
rP=a rPs rP∗Rm2∗p
The resulting number of juvenile pika Pj is then derived from:
P j=P−Pa
Pika population density
The integral change of pika population is finally derived from summarising the single processes in time:
P=P j−P tdP sd
4.5. Burrow dynamicsThe number of burrows (B) limits the adult pika population. Unfortunately there is almost no knowledge on the burrow-digging behaviour of pika. To avoid artefacts it was assumed that the number of burrows observed in the field is representative of the current long-term local phytomass production. Therefore the number of new burrows (nB) is modeled dynamically but fixed within narrow margins. It is assumed that only juvenile pika contribute to the digging of new burrows while adult pika preserve the burrow they inhabit but do not dig new ones. Therefore, burrows decline only if they are uninhabited (Be). The change in the number of burrows ∆B is derived from:
Be=B−P∗pB if BP∗pB
B=nB∗P j−dB∗Be
5. Results & discussion
5.1. Population dynamics and coexistence
The simulated densities of pika and livestock are shown in Figure 1. The values for both groups remain within reasonable limits derived from field observations. For example the minimum, mean, and maximum livestock densities in the model are 0.23, 0.61, and 1.58 MSU, respectively. The mean value of monthly livestock observations from January to September 2001 yielded a monthly minimum density of 0.05, a mean of 0.32, and a maximum of 0.68 MSU/ha. As the year 2001 was characterised by a heavy drought, it seems reasonable that the yearly minimum value of the model is similar, though still slightly lower, than the mean value recorded in the field. Furthermore, it seems reasonable that the maximum monthly average livestock density recorded in June 2001 (0.68 MSU/ha), the only month with at least some precipitation, can be sustained during a whole year with average precipitation and thus justifies the mean annual livestock density of 0.61 MSU/ha simulated in the model. Also the fact that the maximum annual livestock density derived from the model is five times higher than the mean density during a year of drought seems warranted considering the large small-scale variation in livestock densities found in non-equilibrium nomadic systems (Ellis et al., 1993; Desta & Coppock, 2002).
Printed in 2005 in Ecological Modelling 189 (1-2): 89-104 11

Regarding the dynamics of the pika population, two qualitative criteria are of utmost importance: the population does not become extinct nor does it show mass population outbreaks. The simulated values for pika show a minimum density of 15.0, an mean of 28.3, and a maximum of 39.9. As these figures are mean values of adult pika per year they cannot be compared directly to the number of individuals recorded in the field. However, as far as it can be judged from the available data, these values are also in accordance with the observations of Karin Nadrowski who found approximately 30 overwintering adult individuals in the winter of 2000/2001 (Nadrowski et al., 2002). Pika density was considerably lower in the second dry year in a row (Nadrowski pers. comm.) justifying the minimum value of 15.0 individuals.
5.2. Competition between livestock and pika
The first and seemingly most trivial result of the model is that both groups can coexist in the long term although they feed on the same plant resources. However, the competition has tremendous influence on the population dynamics of both herbivore groups (see Table 1). The correlation between the densities of pika and livestock and the potential consumption rate as an estimator for competition intensity is significantly positive. This is logical as high numbers of herbivores increase the potential consumption rate. Precipitation of the actual year is significantly negative correlated with PCR because high precipitation initiates high phytomass production and thus reduces competition. Furthermore, the precipitation of the previous year is positively correlated with PCR as high precipitation in one year leads to an increase in herbivore densities which in turn face intensified competition the next year when precipitation is usually lower (cf. Desta & Coppock, 2002). The same mechanisms work the other way round. Low precipitation in one year leads to a reduction of herbivore numbers and thus competition is reduced when the next year experiences a higher level of precipitation. This pattern is driven by the fact that years with high and low precipitation tend to alternate as can be seen by the significant negative correlation of the precipitation of the actual versus the previous year.
However, the three variables livestock, pika, and precipitation are not significantly correlated. This demonstrates the dynamical nature of the model as herbivore densities do not simply run in parallel to the available forage but react sensitively to the competition pressure.
Competition affects both herbivore groups. Figure 2 shows the development of pika and livestock densities under competition and in absence of the other herbivore group. Without competition both the groups increase in abundance: pika from an mean of 28.3 to 36.7 individuals and livestock from 0.61 to 0.93 MSU. Accordingly, the mean potential consumption rate decreases from -0.08 to -0.54 when pika are the only consumers and to -0.15 when livestock are the only herbivore group. Obviously livestock can make better use of the available phytomass than pika whose maximum number is restricted by its need for burrow territories. Although the simulation suggests that the number of livestock can increase in the absence of pika, the effect is not as strong. The figures mentioned above are derived from a simulation run with the number of pika set to zero while all other model components remained unchanged. In the absence of pika, however, their burrows are non-existent as well and the increased phytomass production in these places is no longer available. If this fact is included without pika and their burrows the effect on mean livestock numbers is reduced by half to 0.77 MSU.
5.3. Transformation
Figure 3 shows a comparison of the development of the livestock numbers in the South-Gobi Aymag and the projected development of livestock densities on the "balanced model ha". Of course the numbers cannot be compared with each other directly. Generally the livestock numbers of the South-Gobi Aymag fluctuate much less than those of the model. However, the explanation for this is simple. As the aymag covers an area of 1,654,000 km2 while the
Printed in 2005 in Ecological Modelling 189 (1-2): 89-104 12

model simulates the variation on 1 balanced hectare, migration within the aymag due to spatial variation of precipitation can level out many of the extremes experienced at the smaller scale of the 1 ha model plot (Oba et al., 2003). Unfortunately, livestock data on aymag scale from 1935 to 1970 are only available in 5-years intervals. This makes the curve look relatively static in comparison with the years succeeding 1970 but there is no reason to believe that inter-annual variations were smaller during this time.
The precipitation conditions at the beginning of the 1990s were relatively good, but this alone is not enough to explain the tremendous increase in livestock numbers observed during this time (see Figure 3). Therefore, a simulation run was set up transferring the increasing pressure on the herders to keep higher numbers of livestock to feed a growing rural population. As most herders do not have access to a functioning market the only variable the herders can actually influence is the migration strategy. Therefore, an increased willingness for remigration under good conditions was implemented to simulate the herders' attempt to exploit the available phytomass even more effectively. This sensitivity simulation runs served to find out whether these changes could explain the observed increases in livestock numbers.
Indeed, Figure 3 shows that a more rigid remigration strategy in combination with a series of years of good rainfall allows herders to exploit the available forage reserves more effectively and livestock numbers can be increased by more than 50 %. However, this effect turns out to be only temporary: in relatively favourable precipitation conditions during the 1990s a more intensive stocking system results in higher livestock numbers. But the effect ceases and livestock numbers decrease again dramatically when the period of good weather ends. The high risk strategy (see also Templer et al., 1993 on risk management) takes its toll when three subsequent years of low precipitation (2000-2002) reduce the livestock numbers back to pre-transformation level – in reality as well as in the model ( Figure 3). This collapse of the livestock populations indicates that changing the migration strategy is not a long-term option. The management is near the optimum and cannot be intensified further without violating the boundaries of the system.
The series of rainfall events in the 1990s is an exception to the long-term distribution of precipitation intensities: This time span is characterised by above-average precipitation levels with relatively low inter-annual variability. For example from 1993-1997, precipitation was above-average. Since the beginning of recordings in Dalandzadgad this was the first time that five subsequent years received above-average precipitation. Also, extreme events occurred only rarely: during the 1990s the deviation of the precipitation of each year was constantly less than 40 % of the mean. In the five previous decades extreme years with more than 40 % deviation from the mean occurred at least twice, on average 3.6 times, and at most 6 times per decade! In 1998 and 1999 the situation changed. In both years a slightly below-average precipitation was recorded (-5 % and -9 %). The years 2000-2002 all received well below-average precipitation (-24 %, -35 %, and -41 % respectively). Again, five subsequent years with below-average precipitation in a row have not been recorded previously.
As shown from the precipitation data the situation in the 1990s was much more an equilibrium-situation than in the decades before. Especially the absence of years with precipitation well below average, which usually efficiently decreased livestock numbers every few years, allowed the build-up of high livestock numbers. For five years livestock numbers could grow continually until the growth was halted by average conditions in 1998 and 1999. Finally the risk of stocking a non-equilibrium system according to equilibrium conditions took its toll: the increased livestock numbers could not be maintained in the bad conditions of 2000-2003 and a high proportion of livestock died in the dzud1 of 2000-2003 (National
1 Dzud is a Mongolian term describing severe winter weather causing episodic mortality in
herbivore, especially livestock populations (see also Begzsuren et al., 2004).
Printed in 2005 in Ecological Modelling 189 (1-2): 89-104 13

Statistical Office of Mongolia, 1996, 1998, 2000, 2001, 2002, 2003).
The consequence of the observed and simulated patterns for the long term carrying capacity is clear: the relatively good distribution of precipitation in the 1990s allowed a large number of Mongolians to escape the hardships of a collapsing state by living self-sufficiently from their herds (Janzen & Bazargur, 2003). But it cannot be expected that the carrying capacity can be expanded much beyond what has been already realised in the 1930s-1980s. This also means that the number of people living from herding in Mongolia cannot increase in the long term, either. The population of Mongolia can only increase further sustainably if other means of earning their livelihood become more and more available (Janzen, 2000). Pastoral nomadism could absorb a part of the shock from the transformation, but will not feed a substantially higher number of people in future.
5.4. Outlook
As shown above, amount and distribution of the precipitation are crucial to the functioning of the system. The 1990s were an exception to the previous recordings. Yet, it cannot be distinguished whether this was a mere coincidence, or whether these are first signs of changed precipitation patterns in the context of climate change. Bolortsetseg & Tuvaansuren (1996) predict negative effects for the pasture production in the Gobi desert area because increasing temperatures may lead to a general decline in livestock intake and average daily weight gain especially in late summer.
If phases of good precipitation, as observed in the 1990s, become more frequent, this will alter the dynamics driving Mongolian pastoralism towards a more equilibrial system. This implies that livestock numbers will much more frequently be near the 'actual carrying capacity' (see Behnke et al., 1999) and much more seldomly clearly below it. Under such conditions the questions of potential overgrazing and regulations of pasture use become much more important than previously to avoid degradation.
Further investigations will account for long-term precipitation datasets (dendrochronology) as well as future climate simulations as derived from ECHAM4 (Roeckner et al., 1996). While the long-term precipitation dataset will provide a better understanding of the sensitive variables and dynamics of the model, the latter approach will be applied to investigate the utility of the model for investigations of climate change-related scenarios. The model is suited to investigate the effects of climate change projections on the precipitation patterns in Mongolia by using the results of climate simulations as precipitation input parameters. Further changes in temperatures, however, have to be considered indirectly via their effect on the rain use efficiency of the vegetation.
Furthermore, we plan to develop a spatially explicit model based on the model presented here. It will incorporate vegetation dynamics derived from satellite images (NDVI) and will explicitly address migration strategies employed by the herders to investigate the impact of herder mobility on large-scale carrying capacity.
Acknowledgments
This research was jointly funded by the German Science Foundation and the German Ministry for Economic Co-operation and Development by the research grant Mi 271/12. The authors want to thank Georg Miehe for the initiation of the project, Karin Nadrowski for sharing her findings on pika population dynamics, and two anonymous reviewers for their comments which helped improving the manuscript.
Printed in 2005 in Ecological Modelling 189 (1-2): 89-104 14

6. References
Abel, N.O.J. and Blaikie, P., 1990. Land degradation, stocking rates and conservation policies for the communal rangelands of Botswana and Zimbabwe. Pastoral Development Network Paper 29a, Overseas Development Institute, London, 25 pp.
Bangert, R.K. and Slobodchikoff, C.N., 2000. The Gunnison's prairie dog structures a high desert grassland landscape as a keystone engineer, J Arid Environ. 46, 357-369.
Barthel, H., 1983. Die regionale und jahreszeitliche Differenzierung des Klimas in der Mongolischen Volksrepublik, Studia Geographica 34, 1-91.
Batkhishig, O. and Lehmkuhl, F., 2003. Degradation und Desertifikation in der Mongolei, Petermann. Geogr. Mitt. 147, 48-49.
Begzsuren,S., Ellis,J.E., Ojima,D.S., Coughenour,M.B. & Chuluun,T. (2004). Livestock responses to droughts and severe winter weather in the Gobi Three Beauty National Park, Mongolia, J Arid Environ. 59: 785-796.
Behnke, R.H., Scoones, I., and Kerven, C., 1993. Range ecology at disequilibrium. New models of natural variability and pastoral adaption in African savannas. Overseas Development Institute, London, 248 pp.
Bergius, J., 2002. Untersuchungen zu Klimaschwankungen in der Mongolischen Südgobi. Fachbereich Geographie, Universität Marburg, unpublished Diploma thesis, 105 pp.
Bolortsetseg, B. and Tuvaansuren, G., 1996. The potential impacts of climate change on pasture and cattle production in Mongolia, Water Air Soil Poll. 92, 95-105.
Bossel, H., 1994. Modeling and Simulation. AK Peters, Wellesley, 484 pp.Cohen, Y., Pastor, J., and Moen, R., 1999. Bite, chew, and swallow, Ecol. Modelling, 116, 1-14.Cooper,K., and Huffaker, R., 1997. The long-term bioeconomic impacts of grazing on plant
succession in a rangeland ecosystem, Ecol. Modelling, 97, 59-73.Coppock, D.L., Detling, J.K., Ellis, J.E., and Dyer, M.I., 1983. Plant-herbivore interactions in a
North American mixed-grass prairie. II. Responses of bison to modification of vegetation by prairie dogs, Oecologia 56, 10-15.
Dean, W.R.J. and Macdonald, I.A.W., 1994. Historical changes in stocking rates of domestic livestock as a measure of semi-arid and arid rangeland degradation in the Cape Province, South Africa, J Arid Environ. 26, 281-298.
Diaz-Solis, H., Kothmann, M.M., Hamilton, W.T., and Grant, W.E., 2003. A simple ecological sustainability simulator (SESS) for stocking rate management on semi-arid grazinglands, Agr. Syst. 76, 655-680.
Ellis, J.E., Coughenour, M.B., and Swift, D.M., 1993. Climate variability, ecosystem stability, and the implications for range and livestock development. In: Behnke, R.H., Scoones, I., and Kerven, C. (Eds.), Range ecology at disequilibrium. Overseas Development Institute, London, pp.31-41.
Fahnestock, J.T. and Detling, J.K., 2002. Bison-prairie dog-plant interactions in a North American mixed-grass prairie, Oecologia 132, 86-95.
Farnsworth, K.D., Focardi, S., and Beecham, J.A., 2002. Grassland-herbivore interactions: How do grazers coexist?, Am. Nat. 159, 24-39.
Fernandez-Gimenez, M.E. & Allen-Diaz, B., 1999. Testing a non-equilibrium model of rangeland vegetation dynamics in Mongolia. J. Appl. Ecol. 36, 871-885.
Fish, M.S., 2001. The Inner Asian anomaly: Mongolia's democratization in comparative perspective, Communis. Post-Commun. 34, 323-338.
Georgiadis, N., Hack, M., and Turpin, K., 2003. The influence of rainfall on zebra population dynamics: implications for management, J. Appl. Ecol. 40, 125-136.
Gotelli, N.J., 2001, A primer of ecology. Sinauer, Sunderland, 206 pp.
Printed in 2005 in Ecological Modelling 189 (1-2): 89-104 15

Guevara, J.C., Estevez, O.R., and Torres, E.R., 1996. Utilization of the rain-use efficiency factor for determining potential cattle prodcution in the Mendezo plain, Argentinia, J Arid Environ. 33, 347-353.
Hearne, J., Lamberson, R., and Goodman, P., 1996. Optimising the offtake of large herbivores from a multi-species community, Ecol. Modelling, 92, 225-233.
Hutchings,N.J., and Gordon, I.J., 2001. A dynamic model of herbivore-plant interactions on grasslands, Ecol. Modelling, 136, 209-222.
Illius, A.W., Derry, J.F., and Gordon, I.J., 1998. Evaluation of strategies for tracking climatic variation in semi-arid grazing systems, Agr. Syst. 57, 381-398.
Janssen, M.A., Walker, B.H., Langridge, J., and Abel, N., 2000. An adaptive agent model for analysing co-evolution of management and policies in a complex rangeland system, Ecol. Modelling, 131, 249-268.
Janzen, J., 2000. Present state of development and perspectives after ten years of transformation, Berliner Geowissenschaftliche Abhandlungen A 205, 149-152.
Janzen, J. and Bazargur, D., 1999. Der Transformationsprozeß im ländlichen Raum der Mongolei und dessen Auswirkungen auf das räumliche Verwirklichungsmuster der mobilen Tierhalter, Abhandlungen Anthropogeographie 60, 47-81.
Janzen, J. and Bazargur, D., 2003. Wandel und Kontinuität in der mobilen Tierhaltung der Mongolei, Petermann. Geogr. Mitt. 147, 50-57.
Jeltsch, F., Stephan, T., Wiegand, T., and Weber, G.E., 2001. Arid Rangeland Management Supported by Dynamic Spatially Explicit Simulation Models. In: Breckle, S. W., Veste, M., and Wucherer, W. (Editors), Sustainable Land Use in Deserts, Springer, Berlin, Heidelberg, New York, pp. 229-240.
Jensen, A.L., 2005. Harvest in a fluctuating environment and conservative harvest for the Fox surplus production model, Ecol. Modelling, 182, 1-9.
Kotliar, N.B., Baker, B.W., and Whicker, A.D., 1999. A critical review of assumptions about the prairie dog as a keystone species, Environ. Manage. 24, 177-192.
Krueger, K., 1986. Feeding relationships among bison, pronghorn, and prairie dogs: an experimental analysis, Ecology 67, 760-770.
Le Houerou, H.N., 1984. Rain use efficiency: a unifying concept in arid-land ecology, J Arid Environ. 7, 213-247.
MacArthur, R. H., 1972. Geographical Ecology, Harper and Row, New York. 269 pp.Mix, H., 2000. Gazelle populations and wildlife management in the area of Gobi Gurvan Saikhan
National Park. Report to gtz Nature Conservation and Buffer Zone Management Project, Berlin, 16 pp.
Müller, F.-V., 1995. New nomads and old customs: general effects of privatisation in rural Mongolia, Nomadic Peoples 36/37, 175-194.
Nadrowski, K., Retzer, V., and Miehe, G., 2002. Small mammal and livestock grazing: Can the Mongolian Pika (Ochotona pallasi) be considered a "rodent pest"?, Verhandlungen der Gesellschaft für Ökologie 32, 149.
National Statistical Office of Mongolia, 1996. Agriculture in Mongolia 1971-1995 A statistical Profile. National Statistics Office of Mongolia, Ulaanbaatar, 519 pp.
National Statistical Office of Mongolia, 1998. Mongolian Statistical Yearbook 1998, http://nso.mn/yearbook/1998/index.asp, last access: 15-4-2004.
National Statistical Office of Mongolia, 2000. Mongolian Statistical Yearbook 1999. National Statistical Office of Mongolia, Ulaanbaatar, 221 pp.
National Statistical Office of Mongolia, 2001. Mongolian Statistical Yearbook 2000. National Statistical Office of Mongolia, Ulaanbaatar, 136 pp.
National Statistical Office of Mongolia, 2002. Mongolian Statistical Yearbook 2001. National Statistical Office of Mongolia, Ulaanbaatar, 301 pp.
National Statistical Office of Mongolia, 2003. Mongolian Statistical Yearbook 2002. National
Printed in 2005 in Ecological Modelling 189 (1-2): 89-104 16

Statistical Office of Mongolia, Ulaanbaatar, 323 pp.Neubert, M.G., Klanjscek, T., and Caswell, H., 2004. Reactivity and transient dynamics of
predator-prey and food web models, Ecol. Modelling, 179, 29-38.Oba, G., Weladji, R.B., Lusigi, W.J., and Stenseth, N.C., 2003. Scale-dependent effects of
grazing on rangeland degradation in northern Kenya: A test of equilibrium and non-equilibrium hypotheses, Land Degrad. Dev. 14, 83-94.
O'Connor, T.G. and Kiker, G.A., 2004. Collapse of the Mapungubwe society: Vulnerability of pastoralism to increasing aridity, Clim. Change 66, 49-66.
Pederson, N., Jacoby, G.C., D'Arrigo, R.D., Cook, E.E., Buckley, B., Dugarjav, C., and Mijidorj, R., 2001a. Hydrometeorological reconstructions for Northeastern Mongolia derived from tree rings: AD 1651-1995, J. Climate 14, 872-881.
Pederson, N., Jacoby, G.C., D'Arrigo, R.D., Cook, E.E., Buckley, B., Dugarjav, C., and Mijidorj, R., 2001b. Hydrometeorological reconstructions for Northeastern Mongolia derived from tree rings: AD 1651-1995: Urgun Nars annual precipitation data, International Tree-Ring Data Bank. IGBP PAGES/World Data Center for Paleoclimatology, Data Contribution Series #2001-026. NOAA/NGDC Paleoclimatology Program, Boulder CO, USA. ftp://ftp.ngdc.noaa.gov/paleo/treering/reconstructions/mongolia/urgun_nars_precip.txt
Reading, R.P., Amgalanbaatar, S., and Lhagvasuren, L., 1999a. Biological assessment of Three Beauties of the Gobi National Conservation Park, Mongolia, Biodivers. Conserv. 8, 1115-1137.
Reading, R.P., Mix, H., Lhagvasuren, B., and Blumer, E.S., 1999b. Status of wild Bactrian camels and other large ungulates in south-western Mongolia, Oryx 33, 247-255.
Retzer,V. (2004). Carrying capacity and forage competition between livestock and a small mammal, the Mongolian Pika (Ochotona pallasi), in a non-equilibrium ecosystem, South-Gobi, Mongolia. Verlag Görich & Weiershäuser, Marburg, PhD-thesis, Philipps-University Marburg. 272 pp.
Roeckner, E., Arpe, K., Bengtsson, L., Christoph, M., Claussen, M., Dümenil, L., Esch, M., Giorgetta, M., Schlese, U., and Schulzweida, U, 1996. The atmospheric general circulation model ECHAM-4: Model description and simulation of present-day climate. Reports of the Max-Planck-Institute, Hamburg, No. 218, 90 pp.
Samjaa, R., Zöphel, U., and Peterson, J., 2000. The impact of the vole Microtus brandti on Mongolia steppe ecosystems, Marburger Geographische Schriften 135, 346-360.
Schmidt, S., 2000. Wächter der Drei Schönheiten, Akzente 4, 38-41.Schneider, E., 1988. Pfeifhasen oder Pikas.In: Grzimeks Enzyklopädie Säugetiere, Band 3,
Kindler, München, 314-324.Scoones, I., 1993. Why are there so many animals? Cattle population dynamics in the communal
areas of Zimbabwe. In: Behnke, R. H., Scoones, I., and Kerven, C. (Eds.), Range ecology at disequilibrium. Overseas Development Institute, London, pp. 62-76.
Sheehy, D.P., 1993. Grazing management strategies as a factor influencing ecological stability of Mongolian grasslands, Nomadic Peoples 33, 17-30.
Shi, D.Z., Wan, X.R., Davis, S.A., Pech, R.P., and Zhang, Z.B., 2002. Simulation of lethal control and fertility control in a demographic model for Brandt's vole Microtus brandti, J. Appl. Ecol. 39, 337-348.
Shurentuja, B., Ellis, J.E., Ojima, D.S., Detling, J.K., and Chuluun, T., 2002. Herbaceous forage variability and carrying capacity in the Gobi Three Beauty Mountains National Park of Mongolia. In: Chuluun, T. and Ojima, D.S. (Eds.), Fundamental Issues Affecting Sustainability of the Mongolian Steppe, IISNC, Ulaanbaatar, pp. 177-191.
Smith, A.T., Formozov, A.N., Hoffmann, R.S., Zheng, C., and Erbajeva, M.A., 1990. The Pikas. In: Chapman, J.A. and Flux, J.A.C. (Eds.), Rabbits, hares and pikas: status survey and conservation action plan, IUCN, Gland, Schweiz, pp. 14-60.
Stephens, D.W., and Krebs, C.J., 1986. Foraging theory. Princeton University Press, Princeton, NY, 247 pp.
Printed in 2005 in Ecological Modelling 189 (1-2): 89-104 17

Stigter, J.D., and van Langevelde, F., 2004. Optimal harvesting in a two-species model under critical depensation - The case of optimal harvesting in semi-arid grazing systems, Ecol. Modelling, 179, 153-161.
Stumpp, M., Wesche, K., Retzer, V., and Miehe, G., 2005. Grazing-mediated gradients in south Mongolian desert steppes indicate a non-equilibrium system with low degradation risk, Mt. Res. Dev. 25(3), 245-252.
Sullivan, S., 1996. Towards a non-equilibrium ecology: perspectives from an arid land, J Biogeography 23, 1-5.
Templer, G., Swift, J., and Payne, P., 1993. The changing significance of risk in the Mongolian pastoral economy, Nomadic Peoples 33, 105-122.
Tschirhart, J., 2004. A new adaptive system approach to predator-prey modeling, Ecol. Modelling, 176, 255-276.
van Kooten, G.C., Bulte, E.H., and Kinyua, P., 1997. Game cropping and wildlife conservation in Kenya: a dynamic simulation model with adaptive control, Agr. Syst. 54, 439-462.
Virtala, M., 1996. Harvesting a lichen-reindeer system in an uncertain environment, Ecol. Modelling, 89, 209-224.
Ward, D., Ngairorue, B.T., Kathena, J., Samuels, R., and Ofran, Y., 1998. Land degradation is not a necessary outcome of communal pastoralism in arid Namibia, J Arid Environ. 40, 357-371.
Weber, G.E., Jeltsch, F., van Rooyen, N., and Milton, S.J., 1998. Simulated long-term vegetation response to grazing heterogeneity in semi-arid rangelands, J. Appl. Ecol., 35, 687-699.
Wesche, K., Nadrowski, K., Enkhjargal, D., and Undrakh, R., 2003. Small mammal burrows as special habitats in southern Mongolian mountain steppes, Verhandlungen der Gesellschaft für Ökologie 33, 356.
Worldbank, 2002. Mongolia at a glance, http://www.worldbank.org/data/countrydata/aag/mng_aag.pdf, last access: 7-4-2003.
Wu, H.I., Li, B.L., Stoker, R., and Li, Y., 1996. A semi-arid grazing ecosystem simulation model with probabilistic and fuzzy parameters, Ecol. Modelling, 90, 147-160.
Zhang, Z.B., Pech, R., Davis, S., Shi, D.Z., Wan, X.R., and Zhong, W.Q., 2003. Extrinsic and intrinsic factors determine the eruptive dynamics of Brandt's voles Microtus brandti in Inner Mongolia, China, Oikos 100, 299-310.
Zhang, Z., Zhong, W., and Fan, N., 2003. Rodent problems and management in the grasslands of China. In: Singleton, G., Hinds, L., Krebs, C.J., and Spratt, D.M. (Eds.), Rats, Mice and People: Rodent Biology and Management, Australian Centre for International Agricultural Research, Canberra, Australia, pp. 316-319.
Printed in 2005 in Ecological Modelling 189 (1-2): 89-104 18

Figure 1: Simulated densities of pika and livestock from 1937 to 2002. The upper part of the graph depicts the annual precipitation in Dalandzadgad used to drive the model.
Figure 2: Densities of pika and livestock in the presence of the other herbivore group (with competition) and in the absence of the other herbivore group (without competition).
Printed in 2005 in Ecological Modelling 189 (1-2): 89-104 19
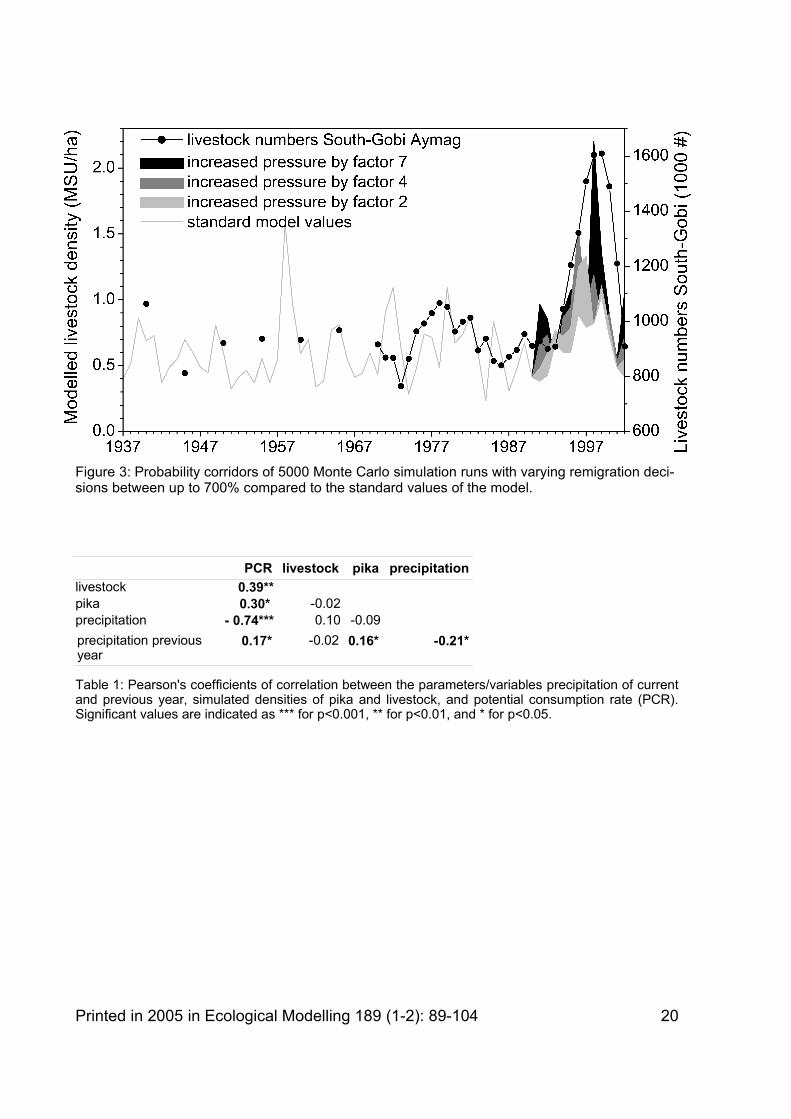
Figure 3: Probability corridors of 5000 Monte Carlo simulation runs with varying remigration decisions between up to 700% compared to the standard values of the model.
PCR livestock pika precipitationlivestock 0.39**pika 0.30* -0.02precipitation - 0.74*** 0.10 -0.09precipitation previous year
0.17* -0.02 0.16* -0.21*
Table 1: Pearson's coefficients of correlation between the parameters/variables precipitation of current and previous year, simulated densities of pika and livestock, and potential consumption rate (PCR). Significant values are indicated as *** for p<0.001, ** for p<0.01, and * for p<0.05.
Printed in 2005 in Ecological Modelling 189 (1-2): 89-104 20

Appendix 1: Model initial values, runtime variables, and constants.
Variable Description Dimension
Value
b average burrow area in percentage of model hectare dmnl 0.00324
B number of burrows (initial value 30) dmnl rtBA percentage area of the model-hectare covered with pika
burrows: BA=B∗bdmnl rt
Be number of empty burrows dmnl rtdB factor of empty burrows decaying dmnl 0.0005nB factor of burrows built per juvenile pika 1/individual 0.001pB number of burrows per pika (1 due to territoriality) 1/individual 1F L potential forage demand of actual livestock population = fL*L kg rtF P potential forage demand of actual pika population = fP*P
(see also Appendix 2)kg rt
Fd forage deficit kg rtmH intensity of herders’ emigration wish dmnl rta mH y-intercept of mH linear relationship dmnl 1smH slope of mH linear relationship dmnl 0.7rH intensity of herders’ immigration wish dmnl rta rH y-intercept of rH linear relationship dmnl 1s rH slope of rH linear relationship dmnl 0.7L number of livestock (initial value 0.4) MSU rtLm number of emigrating livestock MSU rtLr number of immigrating livestock MSU rtLrp number of born livestock (“reproduced”) MSU rtLsl number of slaughtered livestock MSU rtLst number of starving livestock MSU rtfL forage intake per year and livestock kg/MSU 365stL factor of livestock starvation dmnl 0.4mL factor of livestock emigration dmnl rtrpL reproduction rate of livestock (see also Appendix 2) dmnl rtslL livestock slaughter rate (see also Appendix 2) dmnl rtstL livestock starvation rate dmnl rtp ratio of female pika dmnl 0.6P number of pika (initial value 30) individual rtPa number of adult pika that survived winter in their burrows:
Pa=B t−1
pB
individual rt
P j juvenile pika individual rtPm pika's minimum population sustained by their competitive
forage advantageindividual rt
P sd number of starving pikas individual rtPtd pika mortality due to territoriality constraints individual rtfP forage intake by pika kg/individua
l5
fPah percentage of pika's total forage realized by hay stocking dmnl 0.1
Printed in 2005 in Ecological Modelling 189 (1-2): 89-104 21

Variable Description Dimension
Value
fPat pika’s total competitive forage advantage (percentage from available biomass)
dmnl 0.21
rP reproduction rate of pika dmnl rta rP y-intercept of rP linear relationship dmnl 0.2s rP slope of rP linear relationship dmnl 0.2PCR standardized potential consumption ratio dmnl rtr mean precipitation of time serie mm 131R annual precipitation of Dalandzadgad mm data
Rn average of the previous n years precepitation : ∑t=0
n Rt
n mmrt
R2s standardized deviation of the previous 2 years' precipitation
from the long-term mean: Rt−1Rt−2
2∗r
dmnl rt
RUE rain use efficiency of the vegetation (= production of dry phytomass per mm precipitation)
kg/mm rt
rueS rain use efficiency of the steppe-matrix, which is the production of phytomass per mm precipitation
kg/mm 3.22
S A percentage of area with steppe vegetation: S A=1−BA dmnl rtt time yr rtv constant of vegetation biomass not available to herbivores kg 30V net vegetation biomass kg rtV ag growing vegetation biomass exclusively available for pikas kg rtV ah vegetation biomass exclusively available for pikas as hay
from the previous yearkg rt
V e vegetation biomass estimated by the herders from their knowledge on previous precipitation prior to migration
kg rt
bV factor of higher productivity of vegetation biomass on pika burrows
dmnl 2.9
Appendix 2: Parameters of the Gauss normally distributed filter functions
Variable Minimum Maximum Mean StandarddeviationgF d Fd−0.5∗F d Fd0.5∗F d Fd 50rpL 0.15 0.4 0.3039 0.0414slL 0.2 0.36 0.284 0.032
Printed in 2005 in Ecological Modelling 189 (1-2): 89-104 22