modelling the effect of sea level rise on tropical cyclone
TRANSCRIPT

Modelling the effect of sea level rise on tropical cyclone
storm surge impact
Gaëlle Faivre, Dan Ware and Rodger Tomlinson
a Griffith Centre for Coastal Management, Griffith University, Southport, QLD 4215, Australia.
Email: [email protected]
Abstract: Across Northern Australia Tropical Cyclones (TC) present a major hazard for coastal
communities. Improvements to building codes and investments in disaster planning have had demonstrable
impact on the resilience of exposed communities however the hazard to life posed by Storm Tide inundation
remains a major concern. Projected sea level rise due to climate change over the course of this century
suggests that the impact of Storm Tide events will be more significant in the future as higher sea levels
expose a wider area to inundation. While knowledge of climate change impacts on the frequency and
intensity of Tropical Cyclones has implications for storm tide impacts Climate Change damage assessments
frequently assume the relationship between storm tide impacts and sea level rise to be linear.
During Tropical Cyclone events, Storm Tide continues to increase in height in relatively shallow waters. This
suggests that the nature of the relationship between sea level rise and Storm Tide impact may not be linear
which has significant implications for climate change damage assessments and subsequent adaptation
strategies proposed.
To examine the effect of sea level rise on Storm Tide impacts this paper presents the results of a storm tide
inundation model of Cyclone Yasi run over varying water levels to simulate sea level rise. TC Yasi was a
very destructive and powerful tropical cyclone that made landfall with a category 5 intensity on the southern
tropical coast near Mission Beach, Australia between midnight and 1am early on Thrusday 3rd
February,
2011. ArcGIS is used to assess the impact of inundation across various indicators such as area of land,
population impacted and lengths of roads inundated. By comparing the impact of the inundation for the
model runs at various water depths the relationship between Storm Tide Impact and sea level rise is
identified.
Our study provides insight into the future behavior of Storm Surge events as sea levels rise that can inform
climate change adaptation planning and vulnerability assessments.
This comparison of the modelled storm surge inundation depth for Cyclone Yasi considers cyclone wind and
pressure fields generated with parametric techniques such as Holland et al. (2010) wind field profile. The
storm tide was simulated using Mike 21 hydrodynamic software with offshore bathymetry obtained from
multiple local, state and federal agencies and adjusted to AHD and the land elevation was obtained from 1-m
LiDAR data supplied by the Queensland State government..
Keywords: Climate change, storm tide impacts, sea level rise, natural hazards, inundation
21st International Congress on Modelling and Simulation, Gold Coast, Australia, 29 Nov to 4 Dec 2015www.mssanz.org.au/modsim2015
1469

Faivre et al., Modelling the effect of sea level rise on tropical cyclone storm surge impact
1. INTRODUCTION
Tropical cyclones generate extreme winds that produce storm surge at the coastline typically where winds are
blowing onshore. Storm surge is described as a rise in sea level above the predicted astronomical tides, as a
result of wind associated with low pressure weather systems typically associated with tropical cyclones.
Storm surge can be very dangerous and poses a critical risk to human life during tropical cyclones. Storm
surges may reach magnitudes of 1 to 10 metres above the tide depending on the intensity of the cyclone, its
size and forward speed, and the local characteristics of the coastline.
The impact of a storm surge is highly dependent on the phase of the tide, and will have greater impact if it
arrives during a high tide. This may result in extremely high water levels. When forecasting the cyclone, the
timing of the cyclone landfall relative to the tide is uncertain making it difficult to predict an exact water
level. Additionally, the peak of the storm surge may occur prior to or after the cyclone making landfall. It can
also occur without the cyclone even crossing the coast.
Storm tide is the water level resulting from the combination of the storm surge with the astronomical tide
2. CLIMATE CHANGE AND STORM TIDE
Current approaches to estimating the impact of climate change on storm tide hazard for coastal areas have
assumed a linear relationship between hazard and sea level rise (Climate Change Risks to Australia’s Coast,
2009). Given the influence of bathymetry on Storm Tide heights and the continued propagation of Storm
Tides into relatively shallow waters there is a potential for a nonlinear relationship between sea level rise and
storm tide impact.
Tropical cyclones are influenced by a number of factors and generally more tropical cyclones cross the coast
during La Niňa (Bureau of Meteorology, BOM). Under future climate, the intensity of tropical cyclones may
increase but frequency may stay the same or decrease. Knutson et al. reported that greenhouse warming will
cause the globally increased the intensity of TC by 2-11% by 2100. In contrast to the increasing intensity,
existing modelling studies also consistently project decreases in the globally averaged frequency of TC by 6-
34%. However the IPCC remains skeptical for the attribution of any detectable changes in tropical cyclone
activity to anthropogenic influences. There are too many uncertainties in the historical tropical cyclone
records and the understanding of physical mechanisms linking tropical cyclone metrics to climate change is
still incomplete for attribution of a single cyclonic event to human causation.
While there remains uncertainty in the future change in tropical cyclone frequency projected by climate
models, increases in storm surges and extreme sea-levels are likely to occur in the association with tropical
cyclones under future change (BOM). The Intergovernmental Panel on Climate Change report (IPCC, 2014)
shows that the ongoing climate change will increase sea level. Global mean sea level rise is caused by an
increased in the volume of the global ocean.
Coastal areas are put under greater risk from flooding due to climate change. By the end of the 21st century,
about 70% of the coastlines worldwide are projected to experience sea level change within 20% of the global
mean sea level change (AR5, Chapter 13). With around 85% of Australia’s population living along the coast
(Australian Government, 2009), rising sea levels and storm surge could lead to significant impact on many of
coastal towns and cities in Australia. Nearly, 39 000 residential properties are located within 110 meters of
soft, erodible shorelines (Australian Government, 2009). Moreover Australia’s population grew by 1.4 %
during the year ended 31 December 2014 (Australian Bureau of Statistics, 2014) and the growth rate is
expected to increase exacerbating this problem..
This paper will examine the effect of sea level rise on storm tide impact using a storm tide inundation model
of the Tropical Cyclone Yasi. Two inundation models have been used to find the impacts caused by storm
tide over the land. We will try to provide a relationship between the impacts caused by storm tide combined
with sea levels. This study could provide insight into the future behavior of storm surge events as sea level
rise that can provide climate adaptation planning and vulnerability assessments.
2.1. Sea level projections
In projecting the impact of climate change on global sea levels the IPCC AR5 provides a series of projections
based on four scenarios of the future greenhouse gas emissions. These scenarios called Representative
Concentration Pathways (RCP) are consistent with a wide range of possible changes in future anthropogenic
greenhouse gas emissions. Many projections under RCP have been released by the IPCC (Table 1).
1470

Faivre et al., Modelling the effect of sea level rise on tropical cyclone storm surge impact
Table 1. Projected global sea levels rise by the end of the century relative to 1986-2005 for scenarios RCP
2.5, RCP 4.5, RCP 6.0 and RCP 8.5
RCP
Scenarios
Projected sea level (m) By 2100 Occurrence
RCP 2.6 0.28-0.61 Lowest emission scenario Likely unavoidable
RCP 4.5,
RCP 6.0
0.36-0.73 Emissions stabilize by the end
of the century
In line with global emissions and observations
RCP 8.5 0.52-0.98 Emissions continue to rise throughout the 21st century
High-end
The AR5 report does not rule out the possibility of higher sea levels but there is not enough evidence to say
what the chances are to have higher sea levels than the RCPs scenarios shown in Table 1 or if sea levels are
linked to anthropogenic activities. A study by Grinsted, et al. (2010) indicates that sea level rise will be
nearer to 70-160 cm, or about three times the projections by the IPCC.
There is very high confidence that sustained warming greater than a certain threshold above preindustrial
would lead to the near-complete loss of the Greenland ice-sheet. Some part of the mass loss might be
irreversible (ARP5, Chapter13). Medium confidence that GMSL rise by 2300 will be less than 1m for a
radiative forcing corresponding to C02 concentrations below 500ppm.
3. MODELLING APPROACH
This study uses a validated model of Tropical Cyclone Yasi (Burston, 2014) and runs the model for
incremental sea level rise amounts of 0.1m between 0m AHD and 1.5 m AHD. The results of these model
runs were applied to two different inundation model approaches – a hydrodynamic and a bathtub model. The
outputs of these inundation models are compared based on the impacts of the modeled inundation.
3.1. TC Yasi case study
TC Yasi developed as a Tropical low north-west of Fiji on January 29, 2011. Yasi made landfall over South
Mission Beach, North Queensland, Australia as a Category 5 system with maximum wind gusts of 290 km/hr
at around midnight on February 3, 2011 (BOM). A five metre tidal surge was observed at the Department of
Environment and Resource Management (DERM) storm tide recorder at Cardwell, which is 2.3 metres above
the Highest Astronomical Tide (HAT). TC Yasi made landfall at close to low tide, and the storm tide was 4.5
m relative to mean sea level (AHD). If the TC Yasi made landfall a few hours earlier at the same time of the
high tide, the maximum storm tide could have been an additional 2 m higher (Burston et al, 2014).
The model was forced by spatially and temporally varying wind and pressure fields representing the cyclonic
wind speeds and atmospheric pressure. The wind field for TC Yasi was generated using the Holland et al.
(2010) parametric model applied to the Bureau of Meteorology (BOM) best track for TC Yasi. Windfield
generation and discussion of the measured wind are explained in the paper of Burston et al., (2014).
This model was also forced by three spatially and temporally varying boundary water levels representing the
astronomical tide as described in Figure 1. The water level level boundaries representing the astronomical
tide were derived from DHI’s Global Tidal Model KMS (Burston and Symonds, 2013).
The model has been calibrated and validated with storm tide gauges operated by the Queensland Department
of Science, Information Technology, Innovation, and the Arts (DSITIA) and data supplied by Maritime
Safety Queensland. The model is able to well projected the magnitude and phasing of the peak storm surge
resulting from TC Yasi. Calibration and validation are both detailed in Burston et al. (2014).
3.1 Hydrodynamic model – MIKE 21 – FM
We used MIKE 21 FM, a two dimensional depth integrated finite volume hydrodynamic models to simulate
storm tides covering the entire Queensland coastland. Both models have been used by Griffith Coastal Centre
of Management (GCCM) over the period of May 2012 to August 2014 under the “Storm Surge Modelling for
Emergency Response Management in Queensland” project (Burston et al., 2014).
The Coral Sea HD model is bound by the shoreline and as such does not include the terrestrial environment
and inundation is mapped using a bath-tub approach. The alternative approach the Coral Sea Inundation
model includes the terrestrial environment and is bound at the 15m AHD contour and includes an integrated
inundation map.
The Coral Sea HD model is constructed in MIKE21 Flexible Mesh (FM) by DHI, and its establishment and
calibration are documented in Burston and Symonds (2013). The Coral Sea inundation model is similar to the
1471

Faivre et al., Modelling the effect of sea level rise on tropical cyclone storm surge impact
model used in Burston et al., (2013) with slight improvement in the resolution in the coastal area (between
10m to 100 m along the coast) and an updated bathymetry from a 30s DEM and from 1m LIDAR data
supplied by the Queensland State government. The model bathymetry is the best available as sourced from
multiple local, state, and federal agencies and industry, and adjusted to AHD (Figure 1). The land elevation
was obtained from 1m LIDAR data supplied by the Queensland State government (Burston et al., 2013). The
high resolution mesh covers coastal and inland areas lower than 15m AHD.
Figure 1. Coral Sea hydrodynamic model extent, bathymetry, boundaries and calibration sites (left) and
Coral Sea inundation model zoomed in the area between Hull Heads and Cardwell (right).
Open land boundaries have been used in The Coral Sea inundation model to model the coastal inundation.
Parameters of each model are detailed in Table 2 below.
Table 2. Properties of the Coral Sea model and of the Coral Sea inundation model.
Coral Sea HD model Coral Sea inundation model
Number of element 113 899 279 837
Number of nodes 59 266 147 561
Spatial Resolution 1-2 km nearshore~2 km over GBR ~30 m land /sea interface
Smallest element 150 m 4 m
The bed resistance type has been chosen to Manning number for both models. A constant value of 30 m1/3
/s is
applied for the ocean area and a spatial varying number over the land. A range of sea levels varying from 0.1
m to 1.5 m has been added to the tidal boundaries to project the inundated areas for each scenario of sea level
rise under the TC Yasi case.
4. INUNDATION MODEL
4.1. Sea level rise utilizing Bath-tub approach
In this approach the inundation surface is generated from nearshore storm tide levels and intersects with
terrain elevation. This method is debatable because it is assumed that no energy loss due to storm time
propagates over onshore areas. However a bath-tub approach could give an estimate of the spatial variation in
storm surge over the land and this approach determines the flooded area quicker than the HD inundation
model.
4.2. Sea level rise utilizing hydrodynamic modelling approach
Coastal inundation is the flooding of a part of a land that is normally fry by sea water (GCCM report 145,
Burston and al.). For tropical cyclones, this is caused by elevation off sea level due to storm tide and large
wave (wave set-up and wave run-up). Two inundation approaches have been used in this paper to estimate
the impact of coastal inundation under sea level rise scenarios.
The Coral Sea Inundation model built with MIKE 21 FM is used to calculate possible flooding from storm
surges in the coastal zone. This model has been calibrated and validated under TC Yasi. The Coral Sea
inundation model gives an estimation of the flooding but it would need more resolution to ensure that all
possible routes of flooding from the sea are considered. The model is driven by varying sea water levels at
the open sea boundary. Rainfalls have not been considered for this model.
1472
Faivre et al., Modelling the effect of sea level rise on tropical cyclone storm surge impact
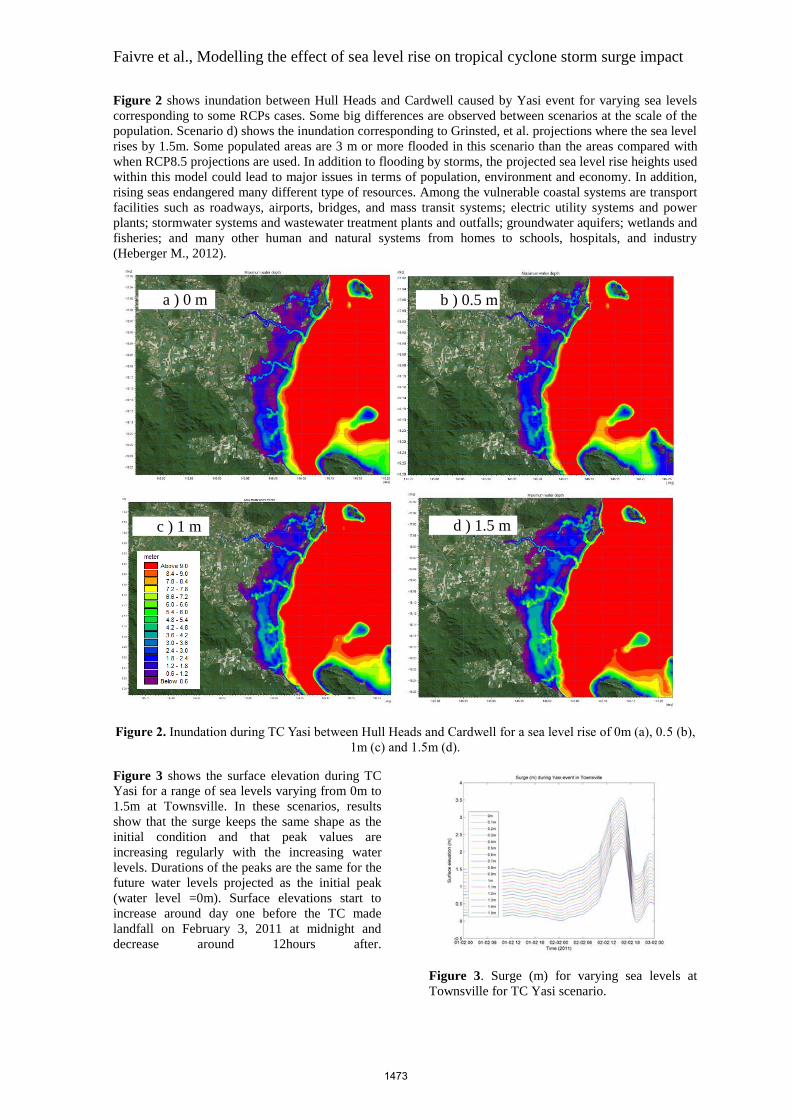
Figure 2 shows inundation between Hull Heads and Cardwell caused by Yasi event for varying sea levels
corresponding to some RCPs cases. Some big differences are observed between scenarios at the scale of the
population. Scenario d) shows the inundation corresponding to Grinsted, et al. projections where the sea level
rises by 1.5m. Some populated areas are 3 m or more flooded in this scenario than the areas compared with
when RCP8.5 projections are used. In addition to flooding by storms, the projected sea level rise heights used
within this model could lead to major issues in terms of population, environment and economy. In addition,
rising seas endangered many different type of resources. Among the vulnerable coastal systems are transport
facilities such as roadways, airports, bridges, and mass transit systems; electric utility systems and power
plants; stormwater systems and wastewater treatment plants and outfalls; groundwater aquifers; wetlands and
fisheries; and many other human and natural systems from homes to schools, hospitals, and industry
(Heberger M., 2012).
Figure 2. Inundation during TC Yasi between Hull Heads and Cardwell for a sea level rise of 0m (a), 0.5 (b),
1m (c) and 1.5m (d).
Figure 3 shows the surface elevation during TC
Yasi for a range of sea levels varying from 0m to
1.5m at Townsville. In these scenarios, results
show that the surge keeps the same shape as the
initial condition and that peak values are
increasing regularly with the increasing water
levels. Durations of the peaks are the same for the
future water levels projected as the initial peak
(water level =0m). Surface elevations start to
increase around day one before the TC made
landfall on February 3, 2011 at midnight and
decrease around 12hours after.
Figure 3. Surge (m) for varying sea levels at
Townsville for TC Yasi scenario.
a ) 0 m
c ) 1 m d ) 1.5 m
b ) 0.5 m
1473
Faivre et al., Modelling the effect of sea level rise on tropical cyclone storm surge impact
4.3. Comparison of the impact between the two approaches
Based on the 2009 1m- LIDAR data supplied by Queensland State government, the sea level rise predicted
for 2100 and after and the TC Yasi (2011), we have simulated the flooding due to the storm tide using both a
hydrodynamic inundation model and a bath-tub approach. As shown in Figure 3, flood depths have been
calculated for a range of sea level rise scenarios. Area and population impacted under these scenarios have
been deducted from these two approaches (Figure 4). For this analysis, the inundation from the HD
inundation model and the bath-tub inundation were respectively overlaid with a population mesh block from
2011 supplied by the Australian Bureau of Statists (ABS).
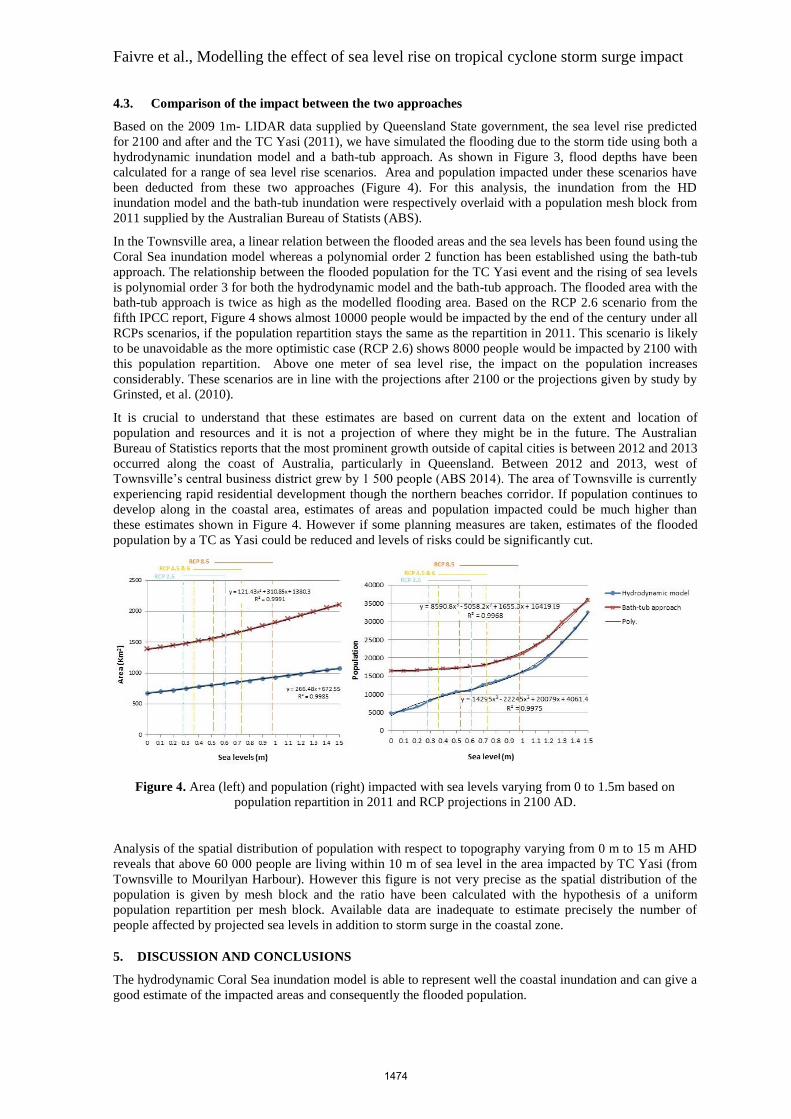
In the Townsville area, a linear relation between the flooded areas and the sea levels has been found using the
Coral Sea inundation model whereas a polynomial order 2 function has been established using the bath-tub
approach. The relationship between the flooded population for the TC Yasi event and the rising of sea levels
is polynomial order 3 for both the hydrodynamic model and the bath-tub approach. The flooded area with the
bath-tub approach is twice as high as the modelled flooding area. Based on the RCP 2.6 scenario from the
fifth IPCC report, Figure 4 shows almost 10000 people would be impacted by the end of the century under all
RCPs scenarios, if the population repartition stays the same as the repartition in 2011. This scenario is likely
to be unavoidable as the more optimistic case (RCP 2.6) shows 8000 people would be impacted by 2100 with
this population repartition. Above one meter of sea level rise, the impact on the population increases
considerably. These scenarios are in line with the projections after 2100 or the projections given by study by
Grinsted, et al. (2010).
It is crucial to understand that these estimates are based on current data on the extent and location of
population and resources and it is not a projection of where they might be in the future. The Australian
Bureau of Statistics reports that the most prominent growth outside of capital cities is between 2012 and 2013
occurred along the coast of Australia, particularly in Queensland. Between 2012 and 2013, west of
Townsville’s central business district grew by 1 500 people (ABS 2014). The area of Townsville is currently
experiencing rapid residential development though the northern beaches corridor. If population continues to
develop along in the coastal area, estimates of areas and population impacted could be much higher than
these estimates shown in Figure 4. However if some planning measures are taken, estimates of the flooded
population by a TC as Yasi could be reduced and levels of risks could be significantly cut.
Figure 4. Area (left) and population (right) impacted with sea levels varying from 0 to 1.5m based on
population repartition in 2011 and RCP projections in 2100 AD.
Analysis of the spatial distribution of population with respect to topography varying from 0 m to 15 m AHD
reveals that above 60 000 people are living within 10 m of sea level in the area impacted by TC Yasi (from
Townsville to Mourilyan Harbour). However this figure is not very precise as the spatial distribution of the
population is given by mesh block and the ratio have been calculated with the hypothesis of a uniform
population repartition per mesh block. Available data are inadequate to estimate precisely the number of
people affected by projected sea levels in addition to storm surge in the coastal zone.
5. DISCUSSION AND CONCLUSIONS
The hydrodynamic Coral Sea inundation model is able to represent well the coastal inundation and can give a
good estimate of the impacted areas and consequently the flooded population.
1474

Faivre et al., Modelling the effect of sea level rise on tropical cyclone storm surge impact
Further improvements in the resolution of the model would allow representing the flooding road and
infrastructures but this work will increase runtime. The bath-tub approach is able to represent flooded road
and infrastructures quicker than the modelling approach. Additional progress in the model could be realised
such as including waves set-up. Repartition of the population per houses instead of per mesh block could
significantly improve the estimates of population impacted with sea level rises.
By the 2080s, many millions more people than today are projected to experience floods every year due to sea
level rise according to the Fifth Assessment Report (2014).
With almost 85 % of Australians living in the coastal area and a prominent growth outside of capital cities
occurring along the coast of Australia, Australian’s population is directly concerning by rising sea levels and
increased incidence of extreme weather events. Coastal living will be more vulnerable to storm tide and
adaptation planning need to be considered for the future development of the cities and towns along the coast.
REFERENCES
Australian Bureau of Meterology, BOM (2015). Tropical Cyclones Trends. Archived from the original on 30
September 2015
Australian Bureau of Meteorology. BOM, (2011). Severe Tropical Cyclone Yasi, 30 January – February
2011. Archived from the original on 30 September 2015.
Australian Bureau of Statistics, ABS, (2014). Regional population growth, Australia, 2012-13.
Australian Government Department of Climate Change (DCC) (2009). Climate change risks to Australian’s
coast: a first pass national assessment.
Burston, J.M., Faivre, G., (2014). Storm Surge Modelling for Emergency Response Management in
Queensland: Final Project Report. Report 157. Griffith Centre for Coastal Management.
Burston, J.M. (2013). Coral Sea Hydrodynamanic Model Storm Surge Validation Report. Technical Report
142. Griffith Centre for Coastal Management.
Burston, J.M. and Symonds, A.M. (2013). Coral Sea Hydrodynamanic Model Set-up and Calibration.
Technical Report 140. Griffith Centre for Coastal Management.
Burston, J.M., Nose T., Tomlinson R. (2013). Real-time numerical simulation of storm surge inundation
using high-perfoormance computing for disaster management, Queensland, Griffith Centre for Coastal
Management.
Grinsted, A., Moore, J.C. and Jevrejeva, S. (2010). Reconstructing sea level from paleo- and projected
temperatures 200 to 2100 AD. Climate Dynamics, 34 (4), 461-472.
Heberger, M., Cooley, H., Moore, E., Herrera, P., (2012). Al, July 2012. The impacts of sea level rise on the
San Francisco Bay. California Climate Change Center. California Energy Commission.
Holland, G.J. (1980). An analytical model of the wind and pressure profiles in hurricanes. Mon. Wea. Rev.
108, 1212–1218.
Holland, G.J., Belanger, J.I., and Fritz, A. (2010). A revised model for radial profiles of hurricane winds.
Mon. Wea. Rev. 138: 4393-4401.
IPCC (2014): Climate Change 2014: Synthesis Report. Contribution of Working Groups I, II and III to the
Fifth Assessment Report of the Intergovernmental Panel on Climate Change [Core Writing Team, R.K.
Pachauri and L.A. Meyer (eds.)]. IPCC, Geneva, Switzerland, 151 pp.
Knutson, Thomas R. et al. “Tropical Cyclones and Climate Change.” Nature Geosci 3.3 (2010) : 157-163.
Nose, T., Burston, J.M. (2014). Investigation of Techniques for Storm Tide Inundation Mapping. Technical
Report 145. Griffith Centre for Coastal Management.
1475