modelling the hydrodynamic characteristics of tidal flow ... stream/baston and harris.pdf · tidal...
TRANSCRIPT

Modelling the Hydrodynamic Characteristics of Tidal Flow in the Pentland Firth
S. Baston1, R.E. Harris2
ICIT, Institute of Petroleum Engineering Heriot-Watt University - Orkney Campus
Old Academy, Back Road Stromness, KW16 3AW Orkney, UK
[email protected] [email protected]
Abstract— The recent award of licences by The Crown Estate for ‘Round 1’ marine energy development sites in the Pentland Firth and Orkney Waters (PFOW) has focussed the attention of stakeholders on the need for a vastly improved understanding of the local and regional marine environment. The potential environmental intervention effects resulting from ‘extensive’ installation of marine energy devices, necessitates rapid, accurate, baseline environmental assessments to be undertaken. This paper addresses the implementation of the SUNTANS model to simulate the complex flow characteristics in the Pentland Firth. Validation is achieved through comparisons made with field sourced data. A sensitivity analysis of the bottom friction coefficient, which is a parameter required by the model directly related to how much energy is dissipated by seabed friction, is presented along. Results show that the model outputs fit better to field data using a higher value of this parameter than typically assumed, which is sensible because of the size grain of boulders located in the Pentland Firth.. Keywords— Tidal energy, tidal stream, renewable energy, SUNTANS, coastal hydrodynamics, numerical modelling
I. INTRODUCTION Renewable energy is recently becoming increasingly
important in social and economical decision-making. European plans on tackling climate change expect that the contribution from renewable energy will be 20% of total energy production in the year 2020 [1]. While offshore wind power is the most established marine renewable energy sector, technologies to harness energy from tides and waves are rapidly developing [2].
An increasing number of companies are seeking the opportunity to test their devices hoping to reach commercial scale. In response to this demand, in Scotland, The Crown Estate has award licences for ten sites in the Pentland Firth and Orkney Waters [3].
In Marine Renewable Energy (MRE), technological issues of design and efficiency play key roles in resource exploitation. However, with technology strongly linked to environmental conditions, it is also necessary to have detailed knowledge of relevant environmental variables. Energy generation is a complex issue and many aspects must be taken into account from different points of view such as social, economical and environmental. Much of the basis of the
recent developments of tidal energy technology comes from the existing wind and oil and gas industries. So although there is a need for continued research on the mechanism of power extraction, policy questions focused on the effects which this technology may have on the natural environment is also of significant interest.
Fig. 1 Pentland Firth and Orkney Waters development sites. Green areas are farms of wave devices and orange ones exploitation sites of tidal devices. (The Crown Estate, 2010)
Tidal Energy Conversion (TEC) refers to the harnessing of
the kinetic energy of a tidal stream using an underwater rotary turbine or another type of movable device that in turn drives an electrical generator. Economic exploitation of tidal energy requires placement of such devices within a sufficiently energetic tidal stream. Strong tidal currents may be found commonly in coastal areas with complex shorelines and in archipelagos where topography forms a local constriction that produces flow acceleration. The most important variables considered for the development of a tidal energy extraction farm are that the water depth is within operational limits (25-45 m), the location is most accessible to an exploitable grid connection and peak spring tidal velocities reach at least 3 m/s [4]

Due to there being relatively few places around the world with sufficiently energetic tidal streams, tidal energy resources tend to be very localized and limited, hence the optimisation of turbine packing density is essential. Therefore there is a need to develop models capable of solving flow on the scale of an individual turbine and to extend these models to turbine arrays. For a suitable extraction site primary constraints on power harvesting come from site size, array interactions, co-existence with other marine resource uses, and possible environmental impacts. The nature of these constraints are as yet poorly known, and research is needed in order to obtain an accurate estimation of the magnitude of the energy resource and to gather information to allow cost-effective exploitation of this resource in ways that are consistent with the need to preserve the marine and the near-shore environment.
The standard method of tidal energy resource estimation has been to determine the average kinetic energy (hereafter KE) on a cross-sectional slice and then assume that some fraction of that energy could be extracted without significant environmental impacts [5], this being known as Significant Impact Factor (SIF). However, KE flux can over- and underestimate the power from turbines by an order of magnitude [6] because the KE flux is not related to the power available to a turbine farm. The nature of the resource is likely to be site-specific and the interactive and additive effects of multiple extraction sites in the same region on system-wide far-field effects must also be taken into account. Vennell [7], [8] estimates the power available using a 1D numerical model and including turbines in a simplified manner.
Numerical models provide excellent tools for in-depth analysis of the tidal energy resource for a particular location given sufficiently ‘accurate’ data to drive the particular model and time to implement. The local and far-field effects of energy extraction upon the tidal flow, also called mesoscale impacts, are usually modelled using shallow water equation solvers. Bryden et al [5], [9], [10] modelled far-field effects using 1D, steady-state flow as a prototype for the more complicated time-dependent problem. This would appear to be the first attempt at demonstrating far-field effects as a consequence of kinetic power extraction from tidal streams. Couch and Bryden [11] also applied 2D models for preliminary investigations of far-field effects. Depth averaged 2D models are suitable for this purpose. Sutherland et al [12], using the TIDE2D model, agreed with the theory proposed by Garrett and Cummins [6]. Blunden and Bahaj [13] employed TELEMAC-2D to model changes in the horizontal velocity field for an array of turbines deployed in the vicinity of Portland Bill (UK). Karsten et al [14] implemented the 2D FVCOM model to estimate and examine far-field effects of extracting tidal energy in the Bay of Fundy (Canada). Walkington and Burrows [15] researched the energy resource and the impacts of the extraction on hydrodynamics using 2D ADCIRC model. Carballo et al [16] evaluated tidal stream energy resources in the Ría de Muros (NW Spain) using the 2DH mode of the commercial software Delft3D-Flow.
Neither 1D nor 2D models are capable of fully investigating the effects of KE extraction on the baroclinic
tidal regime. However, 3D hydrodynamic models incorporate an accurate representation of the flow structure interaction between the tidally driven current and rotating TEC devices. 3D models would also allow the energy dissipated by turbines to be properly differentiated from that associated with bottom friction. There is a lack of research work relating to tidal energy using 3D numerical models. They are computationally expensive and this cost increases as turbines are included, but this kind of tool is related to get an accurate representation of device-flow interaction. Shapiro [17] used a 3D ocean circulation model (POLCOMS) to estimate the maximum extractable energy at different depths and Kawase and Thyng [18] have calibrated and validated the same model that is presented in this paper, applied at Puget Sound (USA).
Coastal and estuarine processes distinguish themselves most significantly from regional and global processes in that they result from the interaction of ocean currents with complex boundaries and steep bathymetry [19]. Tidal currents are usually harder to predict than tidal elevations and thus present a more stringent test of the capability of the numerical model to predict the vertical variation of tidal currents. Assessment of energy resource in shallow seas and coastal waters, where tidal currents become much larger and non-linear processes become more significant, require the use of advanced models able to solve the complex equations associated with most physical processes. Thus, numerical models are essential to calculate the amount of the tidal energy flux entering the Pentland Firth and estimate the amount of the energy dissipated through it, allowing optimisation of device arrays with respect to device orientation and placement, modelling of environmental effects of extraction for both near-field and far-field, etc.
The development of a 3D model to simulate the complex flow characteristics in the Pentland Firth is discussed below. This model will be used for tidal resource and environmental impact assessment. In this paper we describe the model configuration and its initial calibration and validation.
II. PFOW IMPLEMENTATION The Pentland Firth (Fig. 1) is a channel that separates the
Orkney Islands from the Scottish mainland. This channel connects the Atlantic Ocean with the North Sea and due to its high tidal races, in combination with deep water, has been chosen as one of the main tidal energy exploitation sites in the UK [20]. This study determined that the extractable annual kinetic energy flux through the Pentland Firth was ~22 TWh. Subsequent studies estimated that just 20 per cent of this value, 4.5 TWh/y, might be extractable [21]. Implementation of numerical models is important in terms of evaluating the energy resource and understanding the potential environmental effects resulting from extensive installation of marine energy devices.
In order to improve our understanding of the hydrodynamics in this complex marine environment, a three-dimensional numerical model is being implemented. The model is based on the Stanford Unstructured Non-hydrostatic Terrain-following Adaptive Navier-Stokes Simulator

(SUNTANS) [22]. The code has been developed to simulate the nonlinear, non-hydrostatic internal wave field in the littoral ocean. At present, we are using it to predict sea surface height variation (tidal elevation) and tidal currents through the water column, i.e. to simulate barotropic tides, but in the future other variables such as salinity and water density will be included. SUNTANS uses an unstructured numerical grid in the horizontal plane, which allows for high resolution in localised regions of flows in the vicinity of complex coastlines or embayments, and a z-level vertical coordinate system.
The bathymetry (Fig. 2) includes information from several resources including Admiralty charts (UKHO) and port authorities. The model domain covers the Pentland Firth, with a mean depth of 60 m and a maximum of around 100 m at particular points, and the Scapa Flow area, where the mean depth is about 30 m. The domain is discretised into an unstructured triangular grid on average 150 m horizontal resolution (distance between nodes in the smallest cell is 21.5 m and 796 m in the biggest one), and twenty vertical levels with 4.9 m vertical resolution. Total number of cells is 387093 almost ten times the number of cells in the surface plane of 38342. The grid has two open boundaries, the west side from the Atlantic Ocean and the east side bordering the North Sea.
Fig. 2 Bathymetry (in m) interpolated onto the Pentland Firth grid, including
ADCP target location used to validate the model
Boundary conditions are given by the first eight tidal constituents as computed by OTIS (Oregon State University Tidal Inversion Software), a tidal global model based in TOPEX/Poseidon altimetry data validated by comparison to
tide gauges [23], [24]. As previously mentioned, the sea water density is held constant and uniform; only barotropic tidal response is considered at this stage. Temperature and salinity open boundary conditions as well as freshwater input will be incorporated into the model in the future.
III. RESULTS The first step in the implementation of a numerical model is
its validation. Utilization of numerical models as a tool to predict and describe the complex hydrodynamics in a high energetic place as the Pentland Firth is a challenge, such as is the collection of measurements using ADCPs. Comparison of SUNTANS outputs against a data acquisition study carried out in 2001, in which 3 moored ADCPs were deployed for a month in order to get tidal stream observations. Details of this campaign are summarised in Table 1. The model was validated against three control points (Fig. 2).
TABLE I CHARACTERISTICS OF ADCP FIELD CAMPAIGN
Site Number of bins (4 m
with)
Deepest and shallowest
bin depth (m) Duration Date
deployed
1 17 77-13 32.5 days 14/09/2001 2 17 75-11 31.25 days 19/09/2001 3 15 67-11 30 days 15/09/2001
Results of ten days simulation are presented. Fig. 4 shows
comparison at three depths, near-surface, mid-column and near-seabed. In general, the SUNTANS model captures the large-scale dynamics by correctly computing the spring and neap tides, both in phase and magnitude, but field data shows higher speeds than that simulated. Therefore, the model underpredicts measured velocities in this ADCP data study.
As expected, from that ADCP data analysis the velocity decreases with increasing depth, which is also correctly reproduced by the model. However, asymmetry on tidal cycle (difference between correlative peaks of ebb and flow) is appreciate in ADCP data, mainly at site 1, which is higher in the uppermost layer and much more evident in spring tides. At present, the simulation is not reproducing this asymmetry identified at ADCP data, therefore further research is required to identify the discrepancies noted.
Site 2, where a priori the dynamics was expected to be more complex, show good correlation through the water column. It is noteworthy that modelled tidal speed in this site is on average 1 m/s higher than at the other two sites.
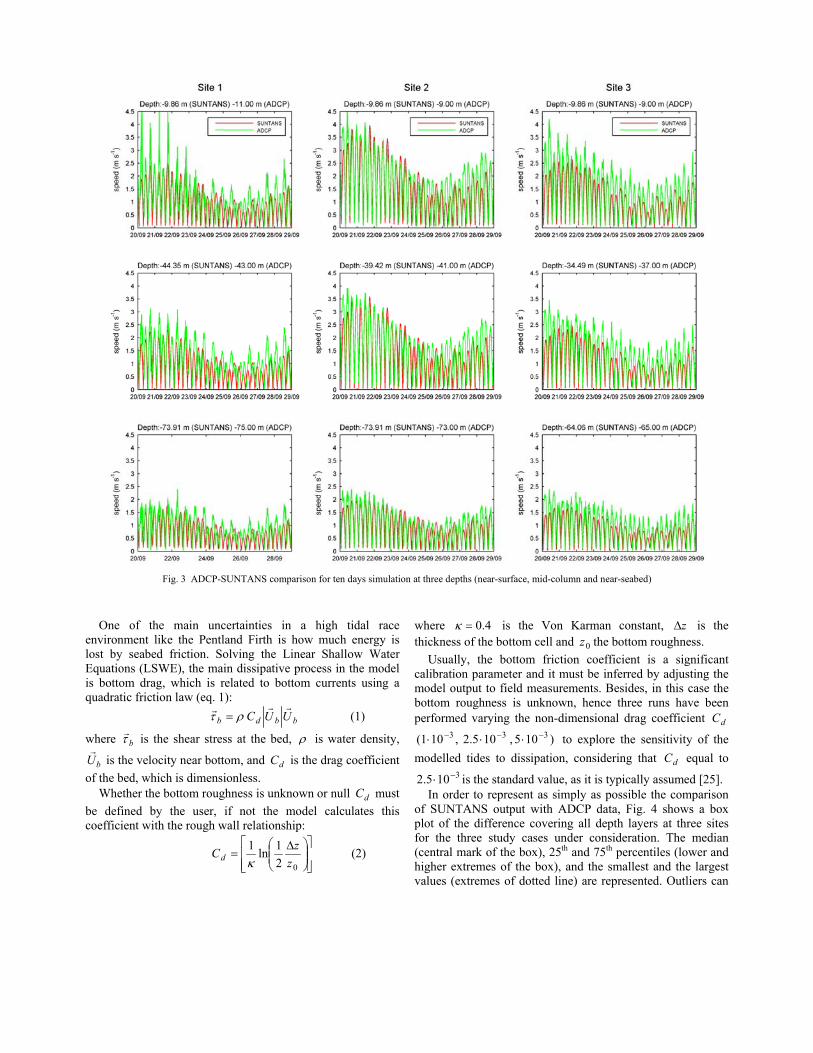
Fig. 3 ADCP-SUNTANS comparison for ten days simulation at three depths (near-surface, mid-column and near-seabed)
One of the main uncertainties in a high tidal race
environment like the Pentland Firth is how much energy is lost by seabed friction. Solving the Linear Shallow Water Equations (LSWE), the main dissipative process in the model is bottom drag, which is related to bottom currents using a quadratic friction law (eq. 1):
bbdb UUCrrr
ρτ = (1)
where bτr
is the shear stress at the bed, ρ is water density,
bUr
is the velocity near bottom, and dC is the drag coefficient of the bed, which is dimensionless.
Whether the bottom roughness is unknown or null dC must be defined by the user, if not the model calculates this coefficient with the rough wall relationship:
⎥⎥⎦
⎤
⎢⎢⎣
⎡⎟⎟⎠
⎞⎜⎜⎝
⎛ Δ=
021ln1
zzCd κ
(2)
where 4.0=κ is the Von Karman constant, zΔ is the thickness of the bottom cell and 0z the bottom roughness.
Usually, the bottom friction coefficient is a significant calibration parameter and it must be inferred by adjusting the model output to field measurements. Besides, in this case the bottom roughness is unknown, hence three runs have been performed varying the non-dimensional drag coefficient dC
)105,102.5,10(1 333 −−− ⋅⋅⋅ to explore the sensitivity of the modelled tides to dissipation, considering that dC equal to
3102.5 −⋅ is the standard value, as it is typically assumed [25]. In order to represent as simply as possible the comparison
of SUNTANS output with ADCP data, Fig. 4 shows a box plot of the difference covering all depth layers at three sites for the three study cases under consideration. The median (central mark of the box), 25th and 75th percentiles (lower and higher extremes of the box), and the smallest and the largest values (extremes of dotted line) are represented. Outliers can

be identified as well (red crosses). Depth layers are plotted at the three sites, with layer 1 representing the shallowest and the highest number representing the deepest. Looking at the results for standard value of dC (middle column), the main conclusion is that in site 1 and 3 ADCP velocities are on average slightly higher than SUNTANS predicts, but this difference is less than 0.5 m/s through the water column. The mean value of the difference in site 2 is negative in upper layers and positive in lower layers of the water column, which suggests that SUNTANS predicts higher values of velocity than measured data in this location in comparison with the other two. It is noteworthy that the degree of dispersion of data is higher in site 2 than in other sites, but it is always found that it decreases with depth for this data set. There are, however, a large number of outliers in deeper layers of site 1. This suggests that SUNTANS predicts higher tidal races at deep layers in this site than the measured ADCP values.
Table II shows the depth averaged value of mean value. As expected, the boxes distribution through the water column does not change for the different simulations. In site 2 and site 3 the mean difference is higher in the deepest layers. In site 1 and 2 the lowest differences are in middle layers, from nine to eleven. The most homogeneous difference in depth is found in site 3.
TABLE II DEPTH AVERAGED VALUE OF MEDIAN OF DIFFERENCE BETWEEN ADCP DATA
AND MODEL RESULTS VARYING CD COEFFICIENT (M/S)
Cd Site 1 Site 2 Site 3 0.001 0.3014 0.2349 0.4259 0.0025 0.2536 0.1564 0.3969 0.005 0.2075 0.0854 0.3671
Analysing the dC effect we can see how the median of the
boxes is closer to zero, i.e. results fits better to measured data, using the higher value of dC )105( 3−⋅ .
The relationship between the bottom friction coefficient and Courant number ( C ) is as follows:
2
2C
gCd = (3)
and the expression of C for turbulent flows is:
⎟⎟⎠
⎞⎜⎜⎝
⎛=
0
12log18z
hC (4)
being h the depth.
Figure 4: Box-plot comparison for the three simulations varying bottom friction coefficient. Central mark of the box is the median, lower and higher edges of
the boxes represent 25th and 75th percentiles, and the smallest and the largest values of the difference are pointed down by the extremes of dotted line. Red crosses are outliers. Green line indicates no differences.

Using those equations, assuming 70 m depth and a uniform
and flat seabed, which 30 10−=z m, the bottom friction
coefficient would be 3102 −⋅=dC . The value of 3105 −⋅=dC is related to a bottom roughness of 0.375 m, which is reasonable in the study area. There is no definite correlation between the grain size and the bottom roughness ( 0z ). Usually 0z is larger than the median grain size; a first approximation might be 900 2 dz ⋅= [26], where 90d is grain size at which 90% of the sample is finer. Hence, the highest value of bottom friction coefficient under consideration would imply 2090 ≈d cm.
Fig. 5 shows photographs of the seabed in the Pentland Firth in different locations and boulders that easily reach the 25 cm of diameter.
Figure 5: Pentland Firth seabed photographs. 1 and 3 are at East of Swona
and Stroma, 2 between both islands and 4 at the West side. Resource: Marine Scotland
The aim of this paper is presenting the PFOW SUNTANS
model implementation. A first validation of the model has been undertaken, which has inducted that the bottom friction coefficient input at the model should be higher than typically assumed ( 3102.5 −⋅ ). Further research is required in order to analyse the parameter sensitivity of the model - how will be the model respond to higher grid resolution, improved boundary conditions, improved bathymetry or incorporation of density characteristics.
IV. DISCUSSION The initial results from the model presented here indicate
that this is a very useful model for the study of tidal dynamics of the Pentland Firth and Orkney Waters. Its implementation could form the basis for assessment of tidal energy devices in order to evaluate the energy resource and the environmental impacts of multi-array installation.
In terms of flow characteristics, the SUNTANS results agree with [21] where velocities of 6 m/s in spring tides had
been identified through the Pentland Firth along with characteristic flow distribution around islands including eddies. A more detailed analysis of results is presently being undertaken to validate the tidal hydrodynamics through depth.
A range of models are available to study the hydrodynamic characteristics of tidal energy exploitation sites. Model selection depends on the questions being addressed. Developers are interested in two main aspects: a) a further understanding of vertical variations of tidal races, due to the wide range of tidal device design, not all of them are located on the seabed, therefore it is important be able to predict the velocity profile and b) the flow behaviour near the device, to assess the disruption in the flow dynamics due to energy extraction as a consequence of spatial interaction of device arrays, i.e. the near-field effects of energy extraction. At the same time, environmentalists and regulators need to know the potential far-field effects of device farm installation. SUNTANS is well-suited to research both the near and far-field MRE installation effects [27], because it is designed to simulate the flow on an estuary scale but the three-dimensional solution also makes it capable of simulating device effects to the required accuracy.
Validation of the model using ADCP data has been presented, and concludes that this first stage SUNTANS model can be applied to reproduce the tidal dynamics in the Pentland Firth. The ADCP error velocity generally increases with distance from the instrument. This could explain some of the differences between model and measured data where higher degrees of uncertainty in shallower layers of the water column were observed. Hence, better quality of field data is required in order to achieve accurate validation; velocities data used in this paper are averaged every 10 minutes with a bin width of 4 metres, which is insufficient for macro/micro modelling comparison. As the model simulates more complex physical processes more accurate field measurements are necessary. At this stage of model development the authors consider that the comparison carried out in this paper demonstrate its suitability to furthering research applied in this complex hydrodynamic site.
Further research is needed to calibrate the bottom friction coefficient. The value of the bottom drag coefficient of 0.005 agrees with that used by Davies and Kwong [28], used to calculate tidal energy fluxes and dissipation on the European continental shelf. Besides, because of the Pentland Firth seabed size grain the bottom roughness is expected to be around 0.375 m or higher, it is sensible that the best correlation between ADCP data and SUNTANS results correspond to the higher value of bottom friction coefficient evaluated. The seabed in the Pentland Firth is characterised by undifferentiated solid rock, i.e. it is free of non cohesive sediment.
A PFOW SUNTANS model, running a 3D baroclinic simulation including the effects of stratification and the non-hydrostatic approximation to solve the flow-topography interaction, is under development to improve the theoretical prediction of tidal flows in the Pentland Firth.

ACKNOWLEDGMENT We are grateful for the help provided by Oliver Fringer and
his group at Stanford University in setting up SUNTANS for the Orkney Waters domain. We acknowledge ERI for providing the ADCP data and the Oregon State University for free access to the OTIS database solution. Further acknowledges are made to Ian Chisholm and Karl Stephen for the technical support. Referees are acknowledged for their comments. This work is supported by SRDG programme.
REFERENCES [1] J. M. Barroso, “Europe 2020: A European Strategy for smart,
sustain% able and inclusive growth,” European Commission, COM (3.3. 2010), 2010.
[2] European Ocean Energy Association, Oceans of energy European Ocean Energy Roadmap 2010-2050. Belgium: European Ocean Energy Association.
[3] The Crown Estate, “World’s First Wave and Tidal Energy Leasing Round.” [Online]. Available: http://www.thecrownestate.co.uk/newscontent/92-pentland-firth-developers.htm. [Accessed: 14-Apr-2011].
[4] S. J. Couch and I. Bryden, “Tidal current energy extraction: hydrodynamic resource characteristics,” Proceedings of the Institution of Mechanical Engineers, Part M: Journal of Engineering for the Maritime Environment, vol. 220, no. 4, pp. 185-194, Jan. 2006.
[5] I. G. Bryden and S. J. Couch, “How much energy can be extracted from moving water with a free surface: A question of importance in the field of tidal current energy?,” Renewable Energy, vol. 32, no. 11, pp. 1961-1966, Sep. 2007.
[6] C. Garrett and P. Cummins, “The power potential of tidal currents in channels,” Proceedings of the Royal Society A: Mathematical, Physical and Engineering Science, vol. 461, no. 2060, pp. 2563 -2572, 2005.
[7] R. Vennell, “Tuning turbines in a tidal channel,” Journal of Fluid Mechanics, vol. 663, pp. 253-267, 2010.
[8] R. Vennell, “Tuning tidal turbines in-concert to maximise farm efficiency,” Journal of Fluid Mechanics, vol. 671, no. 1, pp. 587-604, 2011.
[9] I. Bryden and G. T. Melville, “Choosing and evaluating sites for tidal current development,” Proceedings of the Institution of Mechanical Engineers, Part A: Journal of Power and Energy, vol. 218, no. 8, pp. 567-577, 2004.
[10] I. G. Bryden and S. J. Couch, “ME1--marine energy extraction: tidal resource analysis,” Renewable Energy, vol. 31, no. 2, pp. 133-139, Feb. 2006.
[11] S. J. Couch and I. G. Bryden, “Large-scale physical response of the tidal system to energy extraction and its significance for informing environmental and ecological impact assessment,” in OCEANS 2007 - Europe, 2007, pp. 1-5.
[12] G. Sutherland, M. Foreman, and C. Garrett, “Tidal current energy assessment for Johnstone Strait, Vancouver Island,” Proceedings of the Institution of Mechanical Engineers, Part A: Journal of Power and Energy, vol. 221, no. 2, pp. 147-157, 2007.
[13] L. S. Blunden and A. S. Bahaj, “Effects of tidal energy extraction at Portland Bill, southern UK predicted from a numerical model,” 2007.
[14] R. H. Karsten, J. M. McMillan, M. J. Lickley, and R. D. Haynes, “Assessment of tidal current energy in the Minas Passage, Bay of Fundy,” Proceedings of the Institution of Mechanical Engineers, Part A: Journal of Power and Energy, vol. 222, no. 5, pp. 493-507, 2008.
[15] I. Walkington and R. Burrows, “Modelling tidal stream power potential,” Applied Ocean Research, vol. 31, no. 4, pp. 239-245, 2009.
[16] R. Carballo, G. Iglesias, and A. Castro, “Numerical model evaluation of tidal stream energy resources in the Ría de Muros (NW Spain),” Renewable Energy, vol. 34, no. 6, pp. 1517-1524, 2009.
[17] G. I. Shapiro, “Effect of tidal stream power generation on the region-wide circulation in a shallow sea,” Ocean Science, vol. 7, pp. 165-174, 2011.
[18] M. Kawase and K. M. Thyng, “A Three-dimensional Hydrodynamic Model of Inland Marine Waters of Washington State, United States, for Tidal Resource and Environmental Impact Assessment.”
[19] O. B. Fringer, J. C. McWilliams, and R. L. Street, “A New Hybrid Model for Coastal Simulations,” Oceanography, vol. 19, no. 1, pp. 65-77, Mar. 2006.
[20] Carbon Trust and Black & Veatch, Tidal Stream-Phase II: UK Tidal Stream Energy Resource Assessment. .
[21] I. G. Bryden, S. J. Couch, A. Owen, and G. Melville, “Tidal current resource assessment,” in IMechE, 2007, vol. 221.
[22] O. B. Fringer, M. Gerritsen, and R. L. Street, “An unstructured-grid, finite-volume, nonhydrostatic, parallel coastal ocean simulator,” Ocean Modelling, vol. 14, no. 3-4, pp. 139-173, 2006.
[23] G. D. Egbert, A. F. Bennett, and M. G. G. Foreman, “TOPEX/POSEIDON tides estimated using a global inverse model,” Journal of Geophysical Research, vol. 99, no. 12, pp. PP. 24,821-24,852.
[24] G. D. Egbert and S. Y. Erofeeva, “Efficient Inverse Modeling of Barotropic Ocean Tides,” 2002. [Online]. Available: http://journals.ametsoc.org/doi/abs/10.1175/1520-0426(2002)019%3C0183%3AEIMOBO%3E2.0.CO%3B2. [Accessed: 09-Nov-2010].
[25] M. O. Green and I. N. McCave, “Seabed drag coefficient under tidal currents in the eastern Irish Sea,” Journal of Geophysical Research, vol. 100, no. 8, pp. PP. 16,057-16,069.
[26] H. Chanson, The hydraulics of open channel flow�: an introduction basic principles, sediment motion, hydraulic modelling, design of hydraulic structures, 2nd ed. Oxford [UK]�;;Burlington MA: Elsevier Butterworth Heinemann, 2004.
[27] B. L. Polagye, “Hydrodynamic effects of kinetic power extraction by in-stream tidal turbines,” 2009.
[28] A. M. Davies and S. C. M. Kwong, “Tidal energy fluxes and dissipation on the European continental shelf,” Journal of Geophysical Research, vol. 105, no. 9, p. 989.