modelling, tools and uncertainty analysis
TRANSCRIPT

Special HTGR topics:Modelling, Tools and Uncertainty
analysis
Frederik ReitsmaNuclear Power Technology Development Section
Department of Nuclear Energy
Joint IAEA-ICTP Workshop on the Physics and Technology of
Innovative High Temperature Nuclear Energy Systems

Required Analysis for Design

Nuclear
Engineering
Analysis
(NEA)
NEA to CFD
Reactor Power
Profile
CFD to NEA
Reactor Flow Distribution
and Temperatures
Structural
Analysis
(SAG)
Thermal Fluid
Analysis
(TFAG)
Computational
Fluid
Dynamics
(CFD)
TFAG to CFD
Cycle Flow
Conditions
CFD to TFAG
Detailed Flow
Distributions
CFD to SAG
Detailed Component
Temperatures
Engineering Analysis Synergy-----------------------------------
TFAG to/from NEA
Detailed Flow
Distributions and Neutronic
Data
CFD to SAG
Fluid/Structure Interaction
Confidentia
l /
Copyright
HTR 2010 –
Prague, Oct 18-20,
3
1Reactor Core
3
91
Annular
Flow Path
93 95
136
137
138
140
142
RD
146
148
RD
1703 1705
RD
1707
18011802
1803
1804
1805
CHT
1806
Core sturcture graphiteCHT
1807
Core
BarrelCHT
1808
RPVCHT
1809
CHT
1818
CHT
1819 RCCS
2
H
4
M
6
Reactor Outlet
78
PT
90
Reactor_Inlet
PHT
9294
96
98
H
139
141
145
MT
147
M
1704 1706
1810 1811
1812
18131814 1815
1816
MT
1817
P
Control rod bypass flow

Nuclear Engineering Analysis ReactorCore Neutronics / Thermal
Hydraulics
Analyze Neutronic Design for
feedback to both engineering
and safety
Steady-State (VSOP, MCNP)
and Transient (TINTE) Analysis
Input to engineering on core
component temperatures, power
profiles etc.
Input to safety on maximum fuel
temperatures, control rod worth
etc.
Fission Product Releases
Determine Fission Product
Releases for both normal
operation and accident
scenarios
Using Diffusion Theory
(GETTER, NOBLEG)
Input to the rest of the source
term analysis chain
Shielding and Activation
Analyze Shielding and
Activation of core structures and
surrounding
Monte Carlo Analysis (MCNP)
or simplified transport analysis
(MicroShield)
Input to engineering on core
component activities for
maintenance / decommissioning
Input to safety for worker dose
Fuel Source Term
Neutron and Photon source
from spent and used fuel
Input to the development of the
used and spent fuel tanks and
waste handling
Dust Generation and
Activation
Graphite and metallic dust
generation in the core and fuel
handling system and activation
of the dust
HTR 2010 – Prague, Oct
18-20, 20104

Nuclear Engineering Analysis
PlantHelium Pressure Boundary
Source Term
Analyze the source term within
the helium pressure boundary
during normal operation and
releases in accident scenarios
New code under development
(DAMD)
Considers behaviour of dust and
fission products in the system
Shielding and Activation
Analyze Shielding and
Activation of components
Monte Carlo Analysis (MCNP)
or simplified transport analysis
(MicroShield)
Input to engineering on
component activities for
maintenance and
decommissioning
Input to safety for worker dose
Building Retention
Analyze the behaviour of the
building for accident scenarios
Accident analysis code
(ASTEC)
Input to the building design and
safety
Public Dose
Analyze the expected public
dose in accident scenarios
Input to the building design and
safety
HTR 2010 – Prague, Oct 18-20, 2010 5
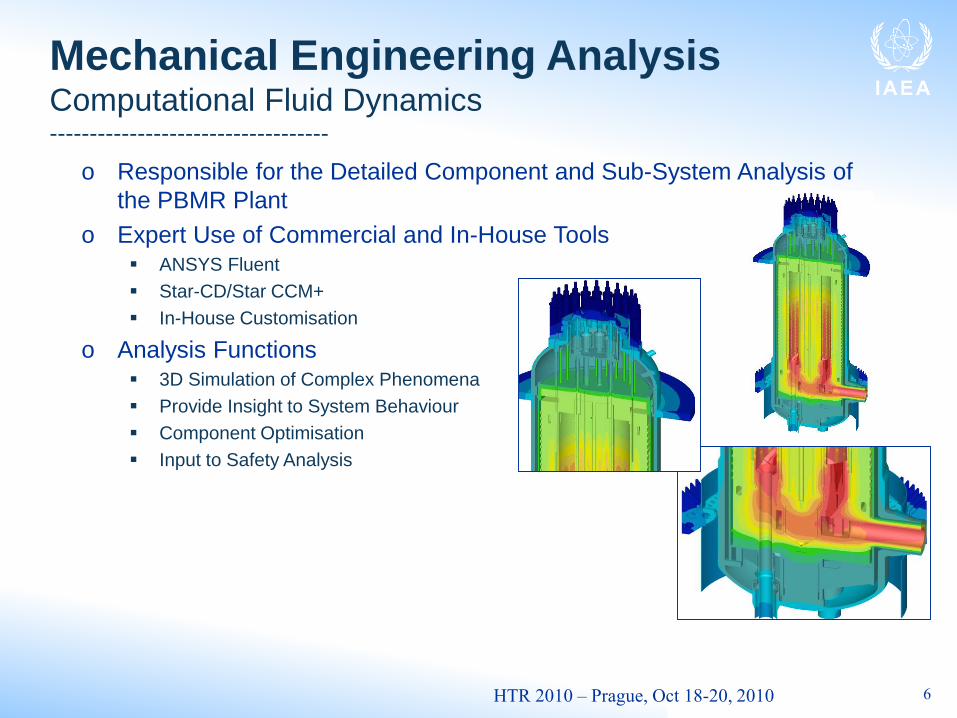
o Responsible for the Detailed Component and Sub-System Analysis of
the PBMR Plant
o Expert Use of Commercial and In-House Tools▪ ANSYS Fluent
▪ Star-CD/Star CCM+
▪ In-House Customisation
o Analysis Functions▪ 3D Simulation of Complex Phenomena
▪ Provide Insight to System Behaviour
▪ Component Optimisation
▪ Input to Safety Analysis
Mechanical Engineering AnalysisComputational Fluid Dynamics -----------------------------------
HTR 2010 – Prague, Oct 18-20, 2010 6
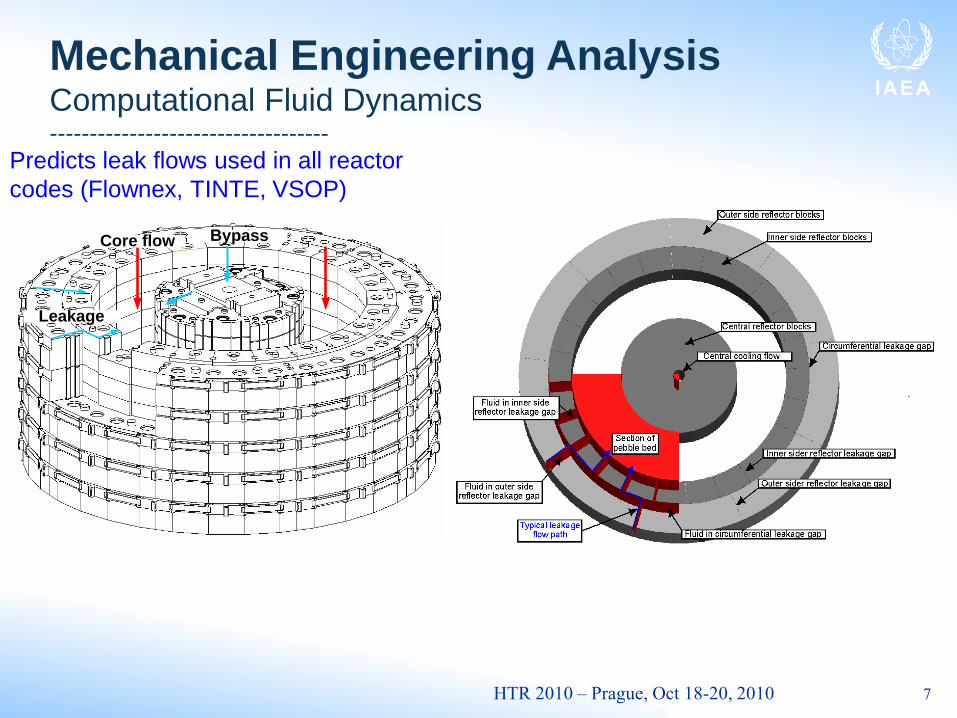
Mechanical Engineering AnalysisComputational Fluid Dynamics -----------------------------------
HTR 2010 – Prague, Oct 18-20, 2010 7
Core flow Bypass
Leakage
Predicts leak flows used in all reactor
codes (Flownex, TINTE, VSOP)

Mechanical Engineering AnalysisStructural Analysis-----------------------------------
o Responsible for the Structural Analysis of the
PBMR Plant
o Expert Use of Commercial Tools
▪ Nastran/Patran
▪ Marc/Mentat
▪ PFC 3D
▪ Dytran
o Analysis Functions
▪ Modelling Complex Structural Systems
▪ Interpreting Load Information with Respect to
ASME Codes
▪ Structural Verification
▪ Input to Safety Analysis
See Paper 158 Geometric layout optimisation of
graphite reflector components by Christiaan
Erasmus & Michael Hindley HTR 2010 – Prague, Oct 18-20, 2010 8

Mechanical Engineering AnalysisStructural Analysis -----------------------------------
Sphere Flow Analysis
HTR 2010 – Prague, Oct 18-20, 2010 9

Nuclear and Mechanical Engineering
Analysis Software
Mech Eng Analysis:
ANSYS
Star-CD
Fluent
MSC
Flownex
RELAP
iSight
Matlab
EFD.Lab
PFC3D + 3DEC
Risk Spectrum
HRA Calculator
Fuelnet
Nuclear Eng Analysis:
VSOP
TINTE / MGT
RELAP
NOBLEG
GETTER
RADAX
DAMD
MCNP
ASTEC
SCALE
GENII
AMBER
MicroShield
NJOY
ATILLA
DIREKT
Spectra
MONK
Open Foam
Salome
vulaSHAKA
HTR 2010 – Prague, Oct 18-20, 2010 10
Analysis Software Verification and Validation
V&V plans (and many other supporting documents)
Procedures accepted by NNR
Software Engineering focus areas:
Analysis software development and implementation of associated quality and V&V processes
Legacy analysis software reverse engineering
Legacy software maintenance
Methods and software development

Uncertainty Analysis

Introduction
• Traditionally conservative analyses are used for nuclear power
plant safety and licensing analyses
• Reliable and high fidelity codes and models allows the use of best-
estimate plus uncertainty analysis (as replacement)
• Methodologies to determine the uncertainties in a consistent way
have been developed and applied for LWRs
• We need to determine if the same methods can be used for other
reactor technologies, where the sources and magnitude of
uncertainties are different.
• Also, since very limited experimental results are available for
HTGRs some approaches used in the LWR methodology cannot
be followed
• The evaluation of uncertainties in high temperature gas-cooled
reactors analysis are being investigated within the IAEA
coordinated research project1217 May 2017AMNT Berlin 2017

Purpose:
• To determine the uncertainty in HTGR calculations at all stages of coupled
reactor physics, thermal-hydraulics and depletion calculations
• Follow the approach of the OECD / NEA UAM LWRs; and aims to:
– establish and utilize a benchmark for uncertainty analysis in best-
estimate coupled HTGR modelling and analysis
– use as a basis a series of well defined problems with complete sets of
input specifications.
– subdivide the coupled system calculation into several steps, each of
which can contribute to the total uncertainty
– identify input, output, and assumptions for each step.
– the resulting uncertainty in each step will be calculated (including
propagating from previous steps).
– where possible have reference results and/or experimental results to
be used
1317 May 2017AMNT Berlin 2017
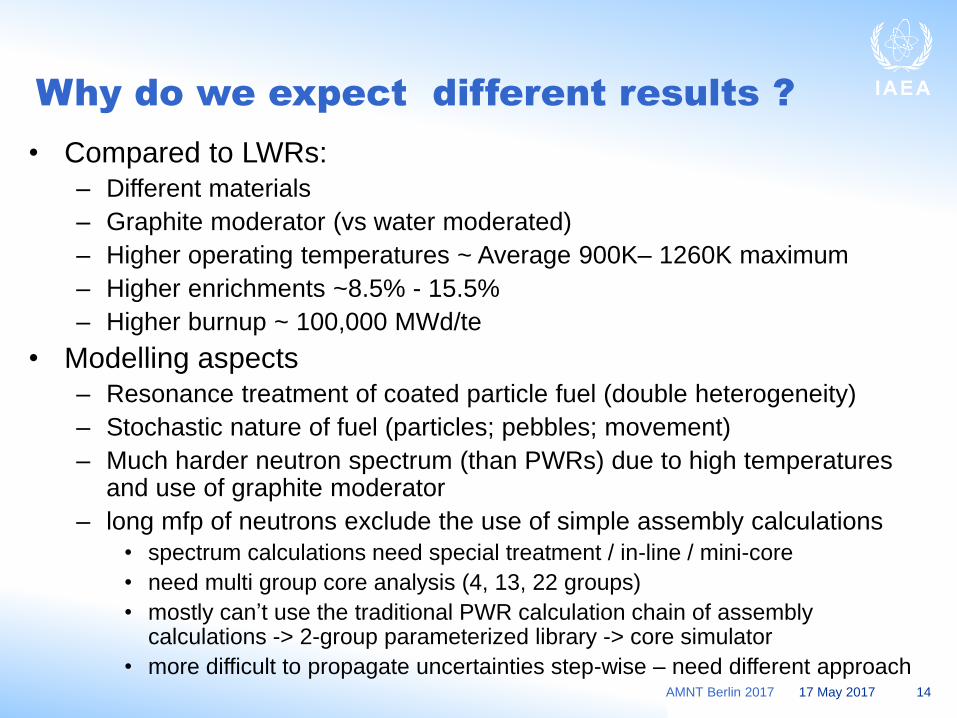
Why do we expect different results ?
• Compared to LWRs:
– Different materials
– Graphite moderator (vs water moderated)
– Higher operating temperatures ~ Average 900K– 1260K maximum
– Higher enrichments ~8.5% - 15.5%
– Higher burnup ~ 100,000 MWd/te
• Modelling aspects
– Resonance treatment of coated particle fuel (double heterogeneity)
– Stochastic nature of fuel (particles; pebbles; movement)
– Much harder neutron spectrum (than PWRs) due to high temperatures and use of graphite moderator
– long mfp of neutrons exclude the use of simple assembly calculations
• spectrum calculations need special treatment / in-line / mini-core
• need multi group core analysis (4, 13, 22 groups)
• mostly can’t use the traditional PWR calculation chain of assembly calculations -> 2-group parameterized library -> core simulator
• more difficult to propagate uncertainties step-wise – need different approach1417 May 2017AMNT Berlin 2017

CRP on HTGR Uncertainty in Analysis
• Objective:– To contribute new knowledge towards improving the fidelity of
calculation models in the design and safety analysis of high temperature gas-cooled reactors by fully accounting for all sources of uncertainty in calculations.
17 May 2017AMNT Berlin 2017 151
5
A Set of
Problems Method A
Method B
Method C
Tool A
Tool B
Tool C
Uncertainty Data
Physical Data
Technological Data
Model Approximations
Sensitivity and Uncertainty Analyses
Uncertainties of
Input Parameters
Uncertainty
Propagation

Reference designs
Prismatic Design:
The MHTGR (an earlier General
Atomics 350MWth design considered
for NGNP) was adopted as the main
prismatic reference design.
OECD / NEA UAM-10+ 16
Permanent
Reflector (2020
Graphite)
Replaceable
Reflector Block
(H-451 Graphite)
Replaceable Reflector
Block with CR Hole
(H-451 Graphite)
Fuel Block with
RSC Hole (H-451
Graphite)
Fuel Block (H-451
Graphite)
Core Barrel
(Alloy 800H) Coolant Channel RPV (SA-533B)
Neutronic
Boundary
Outside Air
120o Symmetry Line
Pebble Bed Reactor Design:
The HTR-Module-based design, upgraded to 250MWth will be the reference design with some simplifications introduced.

Phases
17
Exercise I-1 & I-2: Local Neutronics; Cell and lattice
Exercise I-3 & I-4: Local Thermal-hydraulic; SS and transient
Phase ILocal stand-alone
Exercise II-1:& II-2 Global Core Neutronics (SS and Kinetics)
Exercise II-3 & II-4: Global Thermal-fluid (SS and transient)
Phase IIGlobal stand-alone
Exercise III-1: Coupled Steady-state CalculationsPhase III
Design Calculations
Exercise III-2: Coupled Depletion
Exercise IV-1: Coupled Core Transient CalculationPhase IV
Safety Calculations
Exercise IV-2: Coupled System Transient Calculation
OECD / NEA UAM-10+
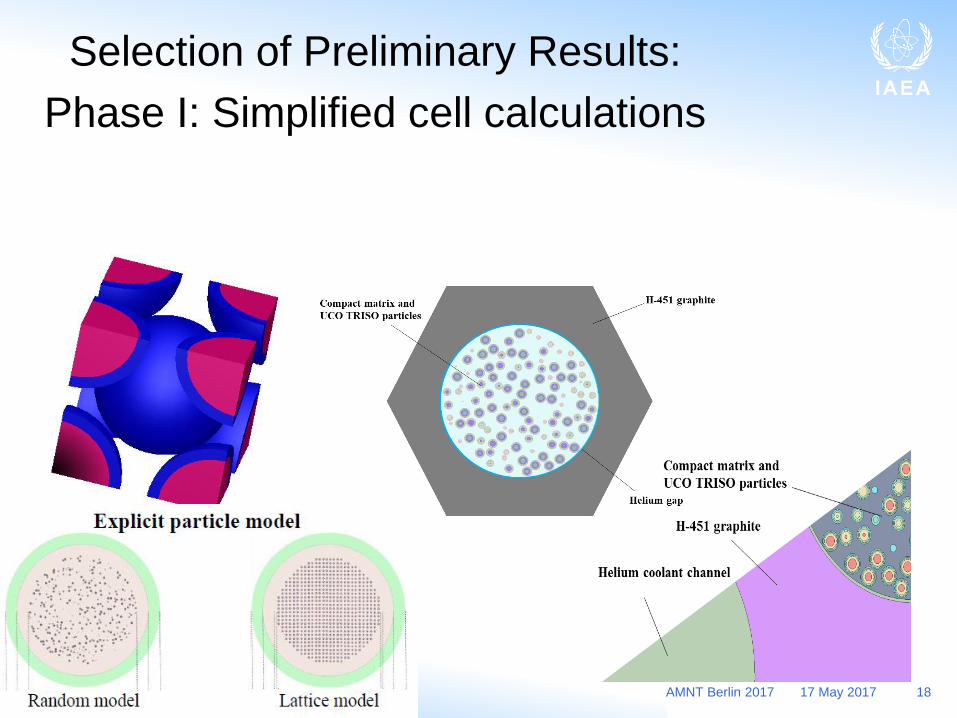
Selection of Preliminary Results:
Phase I: Simplified cell calculations
17 May 2017AMNT Berlin 2017 18

Importance of correctly modelling the
double heterogeneity
• Results show that the correct resonance treatment is required to model the double heterogeneity (I: small kernels and II: fuel compacts in blocks / pebbles)
– Need explicit random models or regular lattice definition of the fuel kernels, or
– Approximate models with the Reactivity-Equivalent Physical Transformation (RPT) or use the two-step DOUBLE_HET approach as implemented in SCALE
17 May 2017AMNT Berlin 2017 19

Model effects
• Large difference in reactivity (always known):
• Noticeable differences in uncertainty estimate
• RPT gives similar results than reference
17 May 2017AMNT Berlin 2017 20
SERPENT
HFP
Difference = Random - #,
# = Lattice, Homogenized, RPT, unit [pcm]
Random Lattice VWH RPT
Hexagonal 1.25239 ± 0.00013 610± 13 5446 ± 20 45 ± 19
Triangular 1.31492 ± 0.00013 -641 ± 17 6325 ± 20 59 ± 18
Relative standard deviation of kinf (%Δk/k) due to cross
section covariance data
CZP HFP
Ex. I-1a (VWH) 0.527 ± 0.0002 0.579 ± 0.0003
Ex. I-1b (RPT) 0.508 ± 0.0002 0.547 ± 0.0003

Further development in methods,
updated cross section libraries and
covariance matrices
Example:
• SCALE6.2. has been released in April 2016
• ENDF-B/VII.0 and ENDF-B/VII.1 are available in SCALE6.2
• Comparison for KENO-VI
• Updated cross section library
• Updated cross section covariance data
17 May 2017AMNT Berlin 2017 21

Further development in methods,
updated cross section libraries and
covariance matrices
• CZP – Fresh Pebble cell
• There was an improvement of MG resonance self-shielding
treatment methodology in SCALE6.2.
• Reactivity reduction (~600 pcm) is observed in ENDF/B-
VII.1 because of change in graphite XS
17 May 2017AMNT Berlin 2017 22
SCALE6.1 SCALE6.2 Code update SCALE6.2 XS Update
ENDF7.0a* ENDF7.0b Diff. (b-a) ENDF7.1b* Diff. (7.1-7.0)
MG Lattice 1.58546 14 1.58997 14 451 1.57097 13 -1449
CE Lattice 1.58628 14 1.58653 12 25 1.57932 14 -696
MG DH 1.57744 12 1.58333 12 589 1.57636 11 -108
CE RPT 1.58533 13 1.58518 18 -15 1.57867 15 -666
MG RPT 1.58517 14 1.58598 14 81 1.57869 13 -648*a: Calculated by KENO-VI in SCALE6.1, *b: Calculated by KENO-VI in SCALE6.2
AMNT Berlin 2017 23
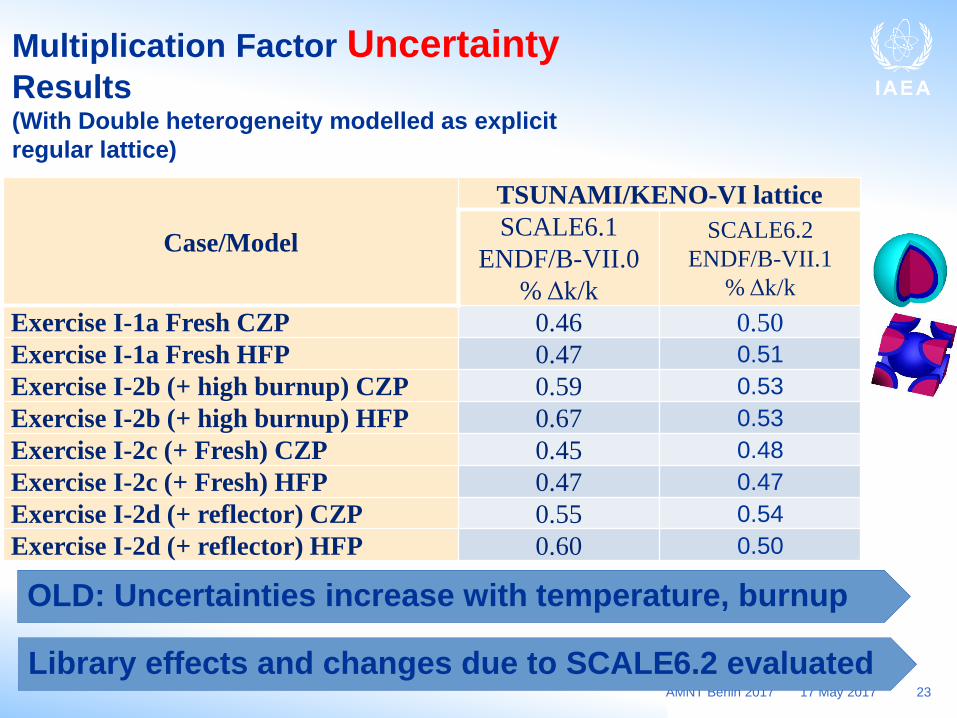
Multiplication Factor UncertaintyResults(With Double heterogeneity modelled as explicit
regular lattice)
17 May 2017
Case/Model
TSUNAMI/KENO-VI lattice
SCALE6.1
ENDF/B-VII.0
% Δk/k
SCALE6.2
ENDF/B-VII.1
% Δk/k
Exercise I-1a Fresh CZP 0.46 0.50
Exercise I-1a Fresh HFP 0.47 0.51
Exercise I-2b (+ high burnup) CZP 0.59 0.53
Exercise I-2b (+ high burnup) HFP 0.67 0.53
Exercise I-2c (+ Fresh) CZP 0.45 0.48
Exercise I-2c (+ Fresh) HFP 0.47 0.47
Exercise I-2d (+ reflector) CZP 0.55 0.54
Exercise I-2d (+ reflector) HFP 0.60 0.50
OLD: Uncertainties increase with temperature, burnup
Library effects and changes due to SCALE6.2 evaluated

Manufacturing uncertainties
• Manufacturing uncertainties derived from the
fuel used in the ASTRA facility
• Can be modelled in SAMPLER / SCALE6.2
in combination with the cross section
covariance, or separately
• Variations may be correlated or bounded by
other fuel parameters, i.e. total number of
kernels in a pebble will be bounded by mass
of U loaded
17 May 2017AMNT Berlin 2017 24

CRP: Example of manufacturing variation
Description 1σ uncertainty (%)
Fuel pebble
Outer radius of fuel pebble ± 0.03%
Radius of inner fuel zone ± 0.60%
Packing fraction of fuel pebble ± 0.26%
Heavy metal mass in pebble ± 0.082%
Density of graphite matrix in pebble core and pebble shell ± 0.16%
Density of graphite reflector ± 1.18%
RPT radius only for RPT model RPT radius table
TRISO particle
Fuel kernel radius ± 0.98%
Porous carbon layer thickness ± 7.45%
IPyC layer thickness ± 5.56%
SiC layer thickness ± 1.96%
OPyC layer thickness ± 1.75%
UO2 fuel enrichment ± 0.14%
UO2 kernel density ± 0.10%
Porous carbon layer density ± 2.97%
IPyC layer density ± 1.54%
SiC layer density ± 0.92%
OPyC layer density ± 1.59%17 May 2017 25AMNT Berlin 2017

Single fuel parameter perturbation tests
17 May 2017 26
Parameter -1sigma -1/2sigma Unperturbed +1/2sigma +sigma (Max-Min)
Kernel radius 1.57533 1.57588 1.57601 1.57655 1.57752 219
1st Layer thickness 1.57659 1.57653 1.57625 1.57617 1.57594 65
2nd Layer thickness 1.57635 1.57618 1.57625 1.57622 1.57618 17
3rd Layer thickness 1.57643 1.57631 1.57640 1.57636 1.57602 41
4th Layer thickness 1.57630 1.57617 1.57625 1.57630 1.57639 22
Pebble-core radius 1.57683 1.57643 1.57625 1.57577 1.57577 106
Pebble radius 1.57605 1.57632 1.57625 1.57613 1.57645 40
Heavy metal mass 1.57671 1.57646 1.57601 1.57636 1.57618 70
Kernel mat. fraction 1.57613 1.57629 1.57601 1.57653 1.57646 52
1st Layer 1.57621 1.57642 1.57625 1.57655 1.57642 34
2nd Layer 1.57646 1.57617 1.57625 1.57615 1.57629 31
3rd Layer 1.57627 1.57639 1.57625 1.57615 1.57632 24
4th Layer 1.57629 1.57627 1.57625 1.57636 1.57641 16
Graphite 1.57575 1.57603 1.57625 1.57644 1.57641 69
Pebble PF 1.57627 1.57636 1.57625 1.57623 1.57645 22
Input variations taken from the ASTRA specification AMNT Berlin 2017

Manufacturing uncertainty
results
Description Avg. keff std. of keff of samples
Ex.I-1a DOUBLEHET CZP 1.5763 133 pcm (0.08%)
HFP 1.4991 150 pcm (0.10%)
Ex.I-1b DOUBLEHET CZP 1.1054 111 pcm (0.10%)
HFP 1.0706 120 pcm (0.11%)
17 May 2017AMNT Berlin 2017 27
• Initial 130 runs (Wilk’s formula)– Need to perform more calculations to confirm / input
uncertainties / parameters may not be independent
• First results obtained seems to be consistent with the parameter study
• The uncertainties introduced are substantially smaller than the contribution of the cross section uncertainties

Comparative results:
Prismatic cell calculations
• Prismatic compact with surrounding graphite
• First (unverified) results submitted (blind calculations)
– Eigenvalue
– Uncertainties
– Contributors to uncertainty
– 1-group cross section17 May 2017AMNT Berlin 2017 28

Eigenvalue
17 May 2017AMNT Berlin 2017 29
1.30000
1.30500
1.31000
1.31500
1.32000
1.32500
k-e
ff

Eigenvalue uncertainty
17 May 2017AMNT Berlin 2017 30
0.45
0.50
0.55
0.60
0.65
0.70
0.75
0.80
0.85
Un
ce
rtain
ty (
%)
k uncertainty

17 May 2017AMNT Berlin 2017 31
0.24
0.26
0.28
0.30
0.32
0.34
0.36
0.38
0.40
0.42
0.44
0.46
0.48
0.50
Rela
tive
co
ntr
ibu
tio
n t
o u
nce
rtain
ty i
n k
(%
de
lta
k/k
)Contribution to k-eff uncertainty: U-238 n,g (MT=102)

17 May 2017AMNT Berlin 2017 32
0.10
0.15
0.20
0.25
0.30
0.35
0.40
0.45
0.50
0.55
0.60
0.65R
ela
tive
co
ntr
ibu
tio
n t
o u
nce
rtain
ty i
n k
(%
de
lta
k/k
)
Contribution to k-eff uncertainty: U-235 nu-bar (MT=452)
AMNT Berlin 2017 33
Summary for Phase I
• Uncertainties in calculated k-eff (due to cross section uncertainties)
– Similar but slightly larger than for LWR / thermal systems
– All effects due to models, libraries and covariance sets to be quantified
• Proper treatment of the double heterogeneity is required to correctly determine the contribution of cross section uncertainties to k-eff
– Uncertainties calculated with the Reactivity-Equivalent Physical Transformation method show good agreement
• Some of the top five contributors identified also found to contribute to the uncertainties in light water reactor test cases
238U(n,), 235U(nubar), 235U(n,), 235U(fission),
239Pu(nubar)
but others, 135Xe(n,) and graphite capture or elastic scattering.
• Comparing results and updated SCALE 6.2– New covariance matrices / Updated cross sections / update models
– DOUBLEHET available in SAMPLER
– Manufacturing variations can be added
• Other Phase 1 exercises to be completed
17 May 2017
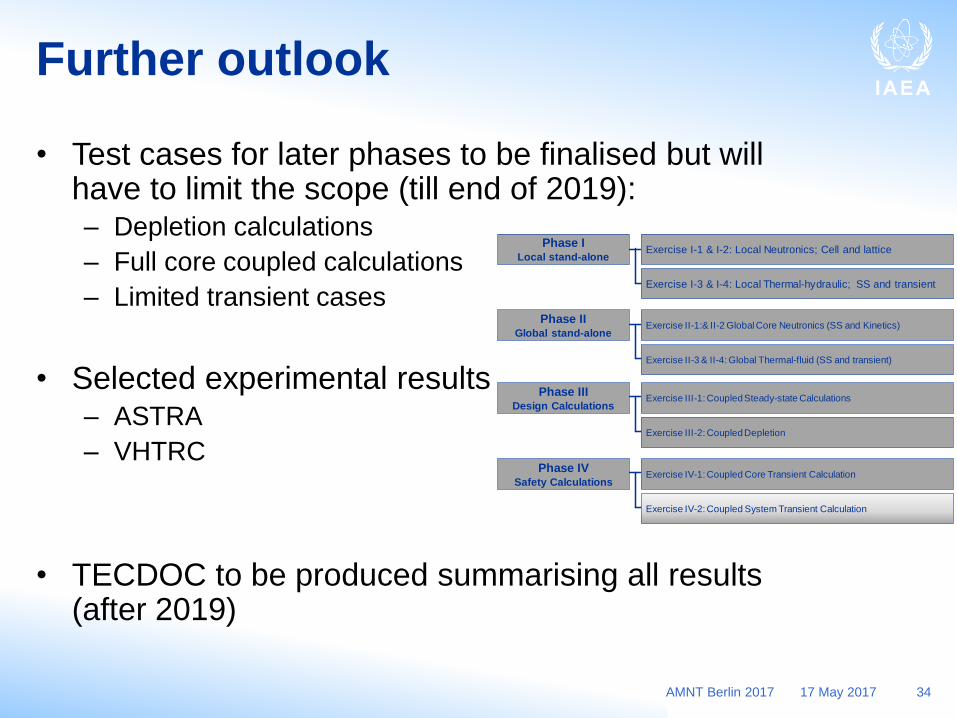
Further outlook
• Test cases for later phases to be finalised but will have to limit the scope (till end of 2019):– Depletion calculations
– Full core coupled calculations
– Limited transient cases
• Selected experimental results– ASTRA
– VHTRC
• TECDOC to be produced summarising all results (after 2019)
17 May 2017AMNT Berlin 2017 34
Exercise I-1 & I-2: Local Neutronics; Cell and lattice
Exercise I-3 & I-4: Local Thermal-hydraulic; SS and transient
Phase ILocal stand-alone
Exercise II-1:& II-2 Global Core Neutronics (SS and Kinetics)
Exercise II-3 & II-4: Global Thermal-fluid (SS and transient)
Phase IIGlobal stand-alone
Exercise III-1: Coupled Steady-state CalculationsPhase III
Design Calculations
Exercise III-2: Coupled Depletion
Exercise IV-1: Coupled Core Transient CalculationPhase IV
Safety Calculations
Exercise IV-2: Coupled System Transient Calculation

IEU-COMP-THERM-008
(ASTRA)
17 May 2017AMNT Berlin 2017 35
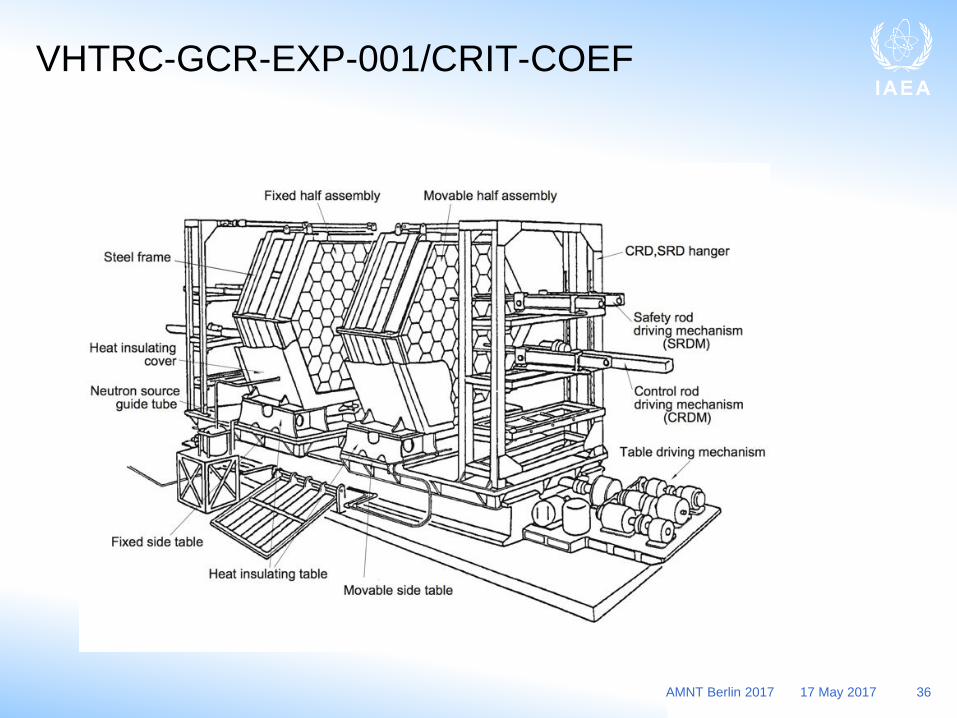
VHTRC-GCR-EXP-001/CRIT-COEF
17 May 2017AMNT Berlin 2017 36

Concluding comment:
• Impact of the CRP is substantial !
– More than 12 papers and publications within the last 18
months alone
– 1xMSc and 1xPhD study completed
– At least 2x PhD projects direct coupled to the project –
several others related
• Several codes are being further developed to be
able to do this work
• Knowledge gained will be beneficial for design and
safety analysis of future HTGRs
17 May 2017AMNT Berlin 2017 37

Power and flux shaping
Number of passes…
Comparison study between different pass cases in VSOP HTR models
Wilna Geringer
Frederik Reitsma
HTR 2010 – Energy for Industry
5th International Conference on High Temperature Reactor Technology

HTR 2010 –
Prague, October
18-20, 2010 39
HTR Module – Power profile results
– For an optimal core design it is required to achieve a flattened power distribution over the core.
– Fresher fuel mixture causes peaking at the top of the core (in the low pass numbers)
– Radial power profile impact is limited (small benefit for multiple passes)
0
0.5
1
1.5
2
2.5
3
3.5
4
0 100 200 300 400 500 600 700 800 900
Re
lati
ve
Ax
ial
Po
we
r D
en
sit
y
Axial height (outer flow channel mesh midpoints) [cm]
OTTO
2 Pass
4 Pass
6 Pass
8 Pass
10 Pass
12 Pass
14 Pass
15 Pass
0.8
0.9
1.0
1.1
1.2
Zone 1 Zone 2 Zone 3 Zone 4 Zone 5
Rela
tive r
ad
ial p
ow
er
pro
file
OTTO
2 pass
4 pass
6 pass
8 pass
10 pass
12 pass
14 pass
15 pass
Zones over radial length
HTR 2010 –
Prague, October
40
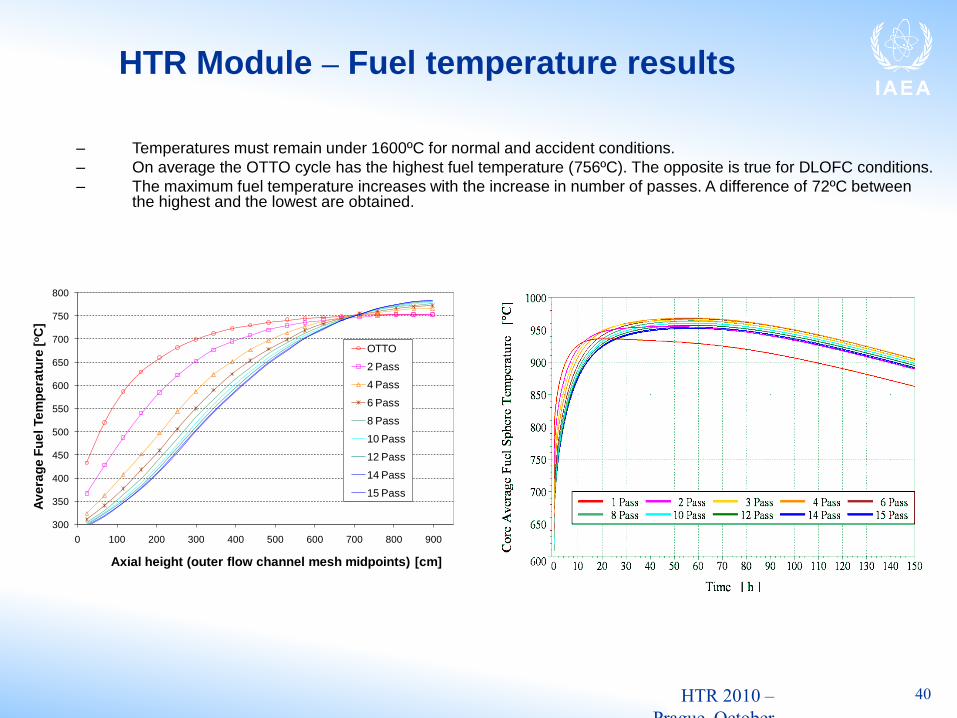
HTR Module – Fuel temperature results
– Temperatures must remain under 1600ºC for normal and accident conditions.
– On average the OTTO cycle has the highest fuel temperature (756ºC). The opposite is true for DLOFC conditions.
– The maximum fuel temperature increases with the increase in number of passes. A difference of 72ºC between the highest and the lowest are obtained.
– For DLOFC conditions the OTTO-pass case and the two-pass case goes above specified conditions and temperatures over and at 1900ºC and 1700ºC are achieved respectively.
300
350
400
450
500
550
600
650
700
750
800
0 100 200 300 400 500 600 700 800 900
Av
era
ge
Fu
el
Te
mp
era
ture
[oC
]
Axial height (outer flow channel mesh midpoints) [cm]
OTTO
2 Pass
4 Pass
6 Pass
8 Pass
10 Pass
12 Pass
14 Pass
15 Pass

HTR 2010 –
Prague, October
41
HTR Module – Fuel temperature results
– Temperatures must remain under 1600ºC for normal and accident conditions.
– On average the OTTO cycle has the highest fuel temperature (756ºC). The opposite is true for DLOFC conditions.
– The maximum fuel temperature increases with the increase in number of passes. A difference of 72ºC between the highest and the lowest are obtained.
– For DLOFC conditions the OTTO-pass case and the two-pass case goes above specified conditions and temperatures over and at 1900ºC and 1700ºC are achieved respectively.
300
350
400
450
500
550
600
650
700
750
800
0 100 200 300 400 500 600 700 800 900
Av
era
ge
Fu
el
Te
mp
era
ture
[oC
]
Axial height (outer flow channel mesh midpoints) [cm]
OTTO
2 Pass
4 Pass
6 Pass
8 Pass
10 Pass
12 Pass
14 Pass
15 Pass

HTR 2010 –
Prague, October
42
PBMR 400MW – Multi-pass results
Case Fuel
residence
time [days]
Av. discharge
burnup
[MWD/t]
Neutron
leakage
6 956 94023 14.8%
10 972 95582 14.6%
12 975 95952 14.6%
0
0.5
1
1.5
2
2.5
0 200 400 600 800 1000 1200
Relative axial height (outer flow channel)
Re
lati
ve
ax
ial p
ow
er
de
ns
ity
PBMR-400: 6-pass
PBMR-400: 10-pass
PBMR-400: 12-pass
HTR-Modul: 6-pass
HTR-Modul: 10-pass
HTR-Modul: 12-pass
Overall performance:– Small increase in the average
discharge burnup with the increased
number of passes.
– The peaking of the PBMR 400MW is
larger than for the HTR-Module.
– The power and temperature
behaviour of the PBMR 400 MW
design are similar to those for the
HTR-Module, but due to the higher
peaking and the effect of the control
rod design it benefit even more from
additional passes.
Case Max. Fuel
Power [kW]
Av. Fuel
Temp. [oC]
Max. Fuel
Temp. [oC]
6 3.00 884 1104
10 2.86 871 1107
12 2.83 868 1109

Graphite fluence behaviour and core
structure lifetime evaluation
GEOMETRIC LAYOUT OPTIMISATION OF GRAPHITE REFLECTOR COMPONENTSChristiaan [email protected]
& Michael [email protected]
Formerly Pebble Bed Modular Reactor (Pty) Ltd.Centurion, South Africa.
Presented By
F ReitsmaPebble Bed Modular Reactor (Pty) Ltd.Centurion, South Africa.

Purpose of Analyses
• The aim of the graphite analyses is to assess the life that can be expected from the replaceable reflector components
• Graphite core structures are subject to extreme thermal loading
• Fast neutron fluence causes material property changes that lead to extremely non-linear material behavior
• Material properties change
with temperature and
neutron fluence
• The graphite shrinks and
swells
HTR 2010 – Prague, Oct 18-20, 2010

Behavior
• The load induced shrinkage and swelling can cause:
– High internal stresses
– Gross geometric deformations
• We ultimately have to determine the safe stress levels and lifetimes of the core
components
HTR 2010 – Prague, Oct 18-20, 2010

HTR 2010 –
Prague, Oct 18-20,
2010 46
Baseline Results
• Predicted Failure probability of baseline block

Baseline Results
• Stress intensity (Maximum deformation
energy MDE) in baseline block at predicted
end of life
HTR 2010 –
Prague, Oct 18-20,
47

Proposed Design Results
• Predicted Failure probability of proposed
blocks
HTR 2010 –
Prague, Oct 18-20,
48
HTR 2010 –
Prague, Oct 18-20,
49
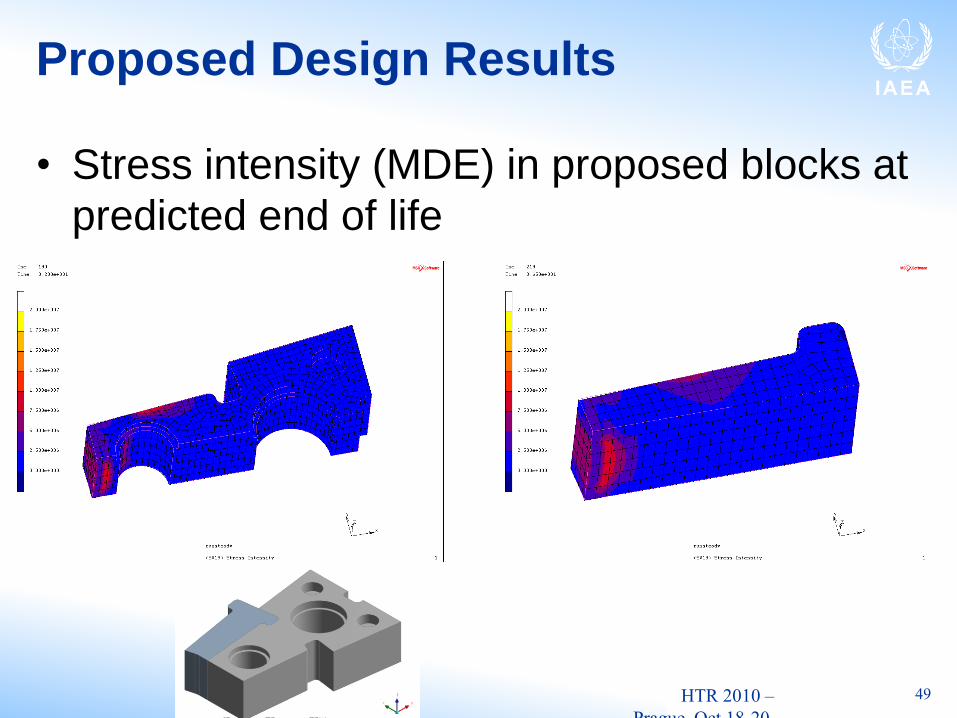
Proposed Design Results
• Stress intensity (MDE) in proposed blocks at
predicted end of life

HTR 2010 –
Prague, Oct 18-20,
50
Further Improvements
• Using topology optimization the following further Improvement can
be obtained.
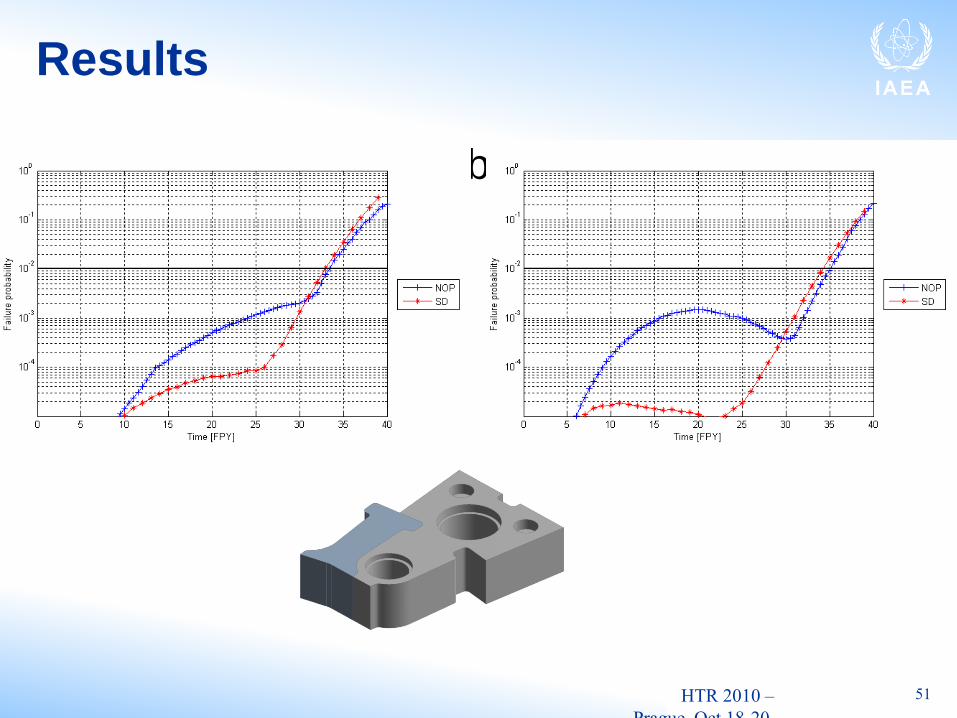
Results
• Predicted Failure probability of proposed
blocks
HTR 2010 –
Prague, Oct 18-20,
51

Graphite Dust
EXAMINATION OF DUST IN AVR PIPE
COMPONENTS

Collecting loose dust
• The expected loose dust should be collected after removal of the first plug. ….. Then the pipes were turned so that the open end was located at the bottom and the pipe walls were knocked with a hammer for some minutes. The sample collectors were removed after a settling time of more than one hour. ….. The amount of loose dust material was negligible and was nearly invisible between the swarf. … it was not possible to isolate the small amounts (approximately below 1 mg) of loose dust from the swarf therefore no further investigations could be made.
53
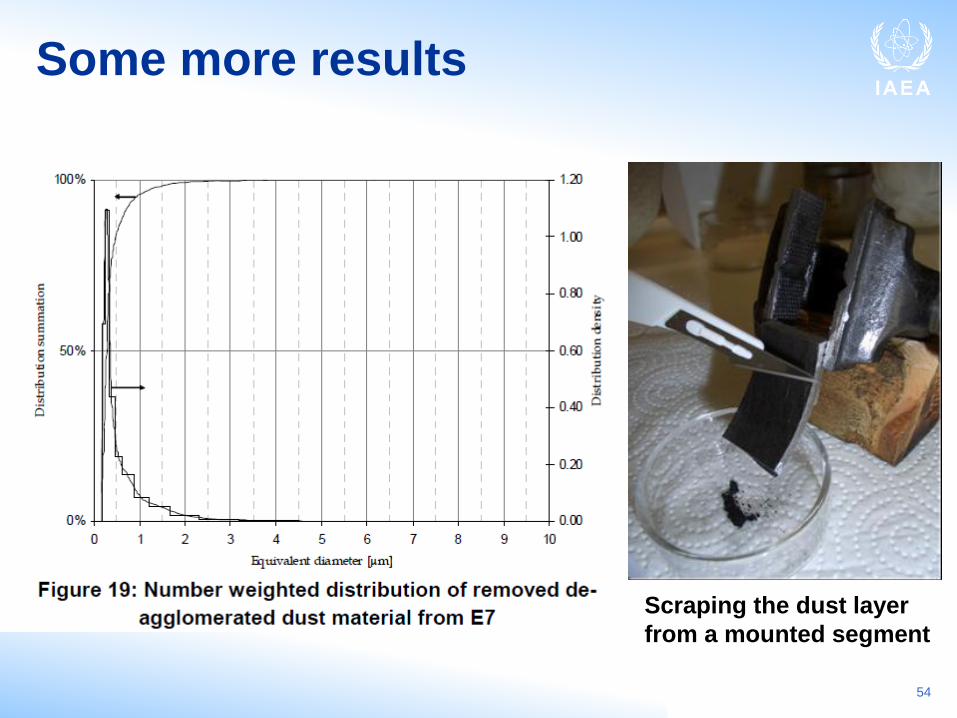
Some more results
54
Scraping the dust layer
from a mounted segment

Main aspects
• Dust itself is not an issue
• Dust can serve as a means of transport of fission products that adhere to the dust surfaces
• Dust sources– Mechanical
– Chemical
• Deagglomerated dust distribution (<1 micron) not consistent with mechanical wear and tear – more consistent with chemical forming
• AVR experience may not be consistent with what can be expected – Water ingress
– Oil ingress
– Small mechanical loadings
55

“fresh fuel can cluster together and cause
huge power peaking or hot spots”
.. Not true
Papers by PBMR and INL
(not the reason for high temperatures in AVR.. Not impossible to quantify… not a safety concern due to margins)
M&C2005
INVESTIGATION OF THE POWER PEAKING IN THE PBMR PEBBLE-BED REACTOR
Frederik Reitsma and Wessel R. Joubert
Nuclear Engineering Analysis (NEA), PBMR (Pty Ltd)
Abderrafi M. Ougouag and Hans D Gougar
Idaho National Laboratory, Idaho Falls

M&C2005
Results & Conclusions
• Results– Large safety limits
• increase in power per fuel sphere still far below set limit ☺• 2.8 kW reference far below 4.5kW/fs i.e. PBMR set limit
– Displacement• 3.0 kW per fuel sphere estimated for a cluster of 20 fresh fuel elements
– Clustering (35cm x 30cm ring on power peak)• large increase in volumentric power density: 11.3 MW/m3 -> 18.7 MW/m3
• only 3.1 kW per fuel sphere for large cluster
– Small increase in maximum fuel temperatures ☺
• Why?– flux and spectrum dominated by environment– in a cluster all the FS’s is now contributing equally – small local
variation in powers• Simple approach used show no severe effects due to
displacement of clustering
AVR – “hot spots” and high measured
temperatures
The Re-evaluation Of The AVR Melt-wire Experiment Using Modern Methods With Specific Focus On Bounding The Bypass Flow Effects.
CF Viljoen, S Sen, F Reitsma, O Ubbink, P Pohl, H Barnert
4th International Topical Meeting on High Temperature Reactor Technology

HTR
Conference
September
Background
• AVR (Arbeitsgemeinschaft
Versuchsreaktor)
– Research reactor
– Test bench for different pebble fuel types
• Operated for 21 Years
• Bypass flows were not included in
calculations
– only considered after melt-wire tests in 1988

HTR
Conference
September
AVR layout
Steam
generator
Graphite
reflector
Cooling gas
blowers
Reactor
shroud
Carbon
insulation
Discharge
pipe
Graphite
reflectorCarbon
insulation
Outer Core
Control rod
borehole Reflector
nose
Thermocouples
Inner Core
Core

HTR
Conference
September
Core layout & measurements
Melt-wire
measurement
position
Thermocouple lance
positionBypass pipes
Fuelling
lines
Top plug
Control rod
nose
Wall
channeling
Annular
gap

HTR
Conference
September
Outlet Temperature
Higher & Uncertain
Average value =1024°C
Uncertainty at R=1300mm
Thermocouple lance data
900
950
1000
1050
1100
0 500 1000 1500 2000
Radius [mm]
Te
mp
era
ture
[C
] …
.

AVR-Meltwires
64
HTR
Conference
September
Melt-Wire Data in Terms of Radius
900
1000
1100
1200
1300
0 500 1000 1500 2000
Radius [mm]
Tem
pera
ture
[C
]
.
Inner CorePebbles
Outer CorePebbles
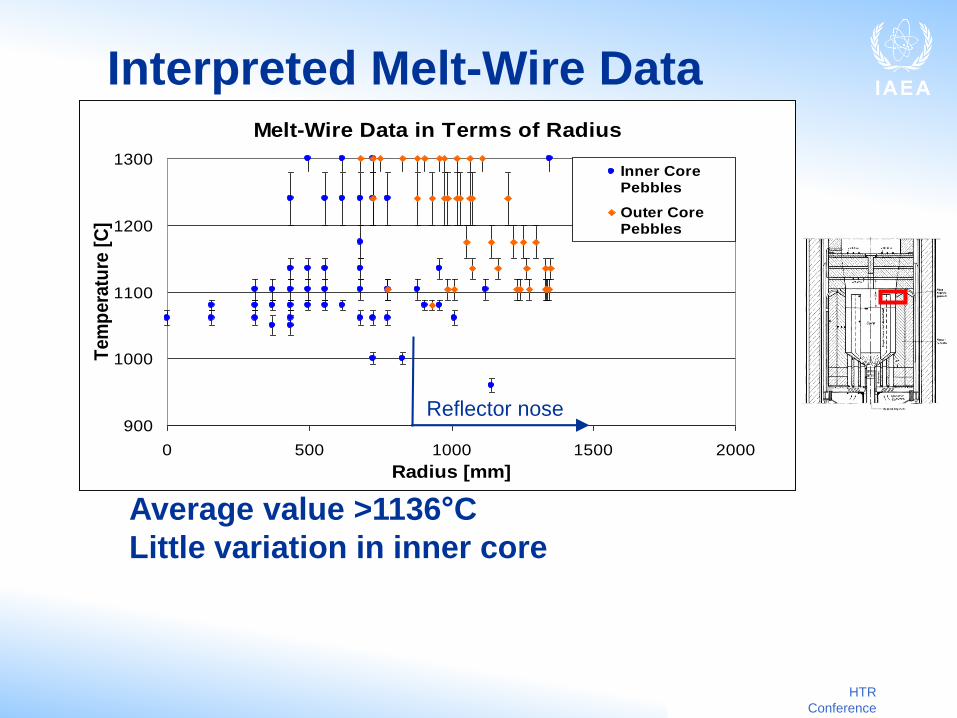
Interpreted Melt-Wire Data
Average value >1136°C
Little variation in inner core
Reflector nose

HTR
Conference
September
Melt-Wire Data in Terms of Radius
900
1000
1100
1200
1300
0 500 1000 1500 2000
Radius [mm]
Tem
pera
ture
[C
]
.
Inner CorePebbles
Outer CorePebbles
ThermocoupleLance
Interpreted Melt-Wire Data
Average value >1136°C
Little variation in inner core
Difference between meltwire data and lance
Reflector nose
?

HTR
Conference
September
Estimation of bypass flows
from measurements
Melt-wire
measurement
position
Thermocouple
lance position
T=1136°C
T=1024°C
T=263°C
Gas
Temperature81%
~9%
~10%T=950°C

HTR
Conference
September
Models
CFD
VSOP
Simplified
Geometry
CFD
Detail
Geometry
Flow distribution [%]
Porous medium
Simplified fuel composition
Temperature Power
Distribution

HTR
Conference
September
Detail Flow Model
Bottom
cone
Inlet
slots
Bypass
pipe holes
Top reflector
slots
Side fuelling
hole
Top cones

HTR
Conference
September
Detail flow model: Flow Distribution
Annular
Gap
[mm]
Flow Distribution [%]
Core
Control
Rod
Boring
Annulus
2.0 91.4 7.3 1.3
5.6 82.0 6.8 11.2
7.0 78.3 6.5 15.2

HTR
Conference
September
Simplified Coupled CFD ModelSolids Fluids
Inlet
slots
Core
Nose
Bypass

HTR Conference September 2008 72
Outlet Gas Temperature Increase
due to Bypass Flow
Case
Control
Rod
Bypass
[%]
Annular
bypass
[%]
Wall
channeling
Max Gas
Temperature
[°C]
1 0 0 No 1058
2 7 0 No 1102
3 7 10 No 1194
4 7 10 Yes 1209

HTR
Conference
September
Typical Core Conditions with Bypass
Flow
VSOP
Power Distribution
MW/m3 °C
CFD
Gas Temperature
HTR
Conference
September
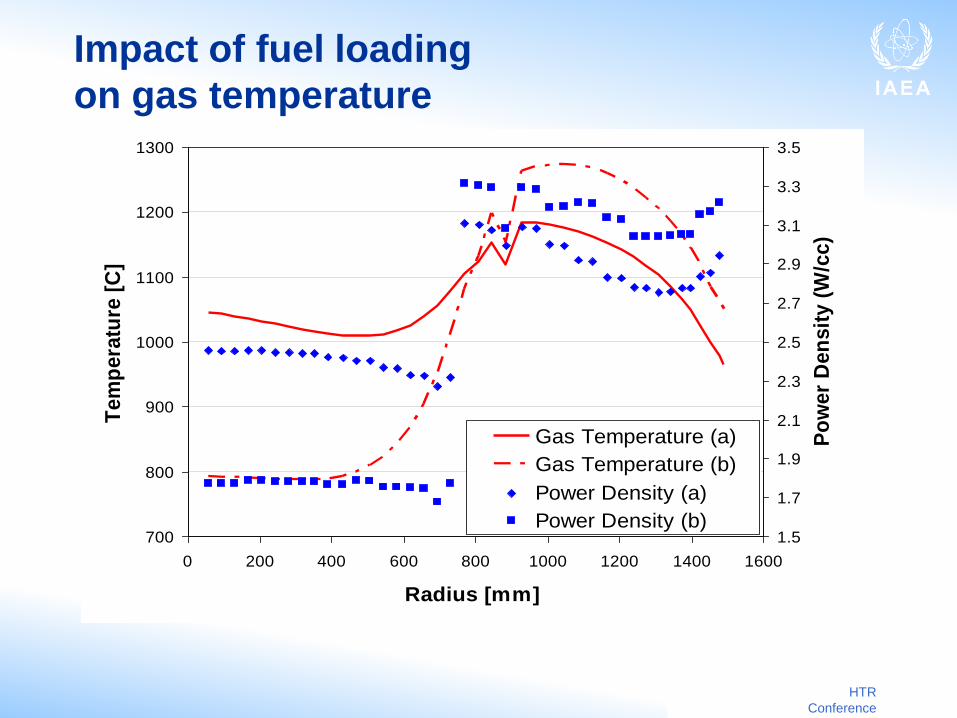
Impact of fuel loading
on gas temperature
700
800
900
1000
1100
1200
1300
0 200 400 600 800 1000 1200 1400 1600
Radius [mm]
Tem
pera
ture
[C
]
1.5
1.7
1.9
2.1
2.3
2.5
2.7
2.9
3.1
3.3
3.5
Po
wer
Den
sit
y (
W/c
c)
Gas Temperature (a)
Gas Temperature (b)
Power Density (a)
Power Density (b)

HTR
Conference
September
Conclusion
• Analysis shows bypass flows played a significant role in the AVR flow distribution
• Detail 3D thermo-hydraulic analysis is required for accurate predictions of flows and temperatures
• Uncertainties in AVR complicates comparison
– ‘As-built’ geometry
– Interpretation of measurements
• NEW: Meltwire measurements planned for HTR-10

Proceedings of HTR 2010 Prague, Czech Republic, October 18-20, 2010 Paper 193
The re-evaluation of the AVR melt-wire experiment with specific focus on different modelling strategies and
simplifications. CF Viljoen , RS Sen76

Pebble Compaction…. Earth Quakes

PBMR workshop at PHYSOR 2010 – Pittsburgh,
May 14, 2010
Pebble Beds and earthquakes
• The impact of earthquakes on the PBMR design is investigated as
part of the safety case
• Shaker-table experiments (SAMSON)– located at the HRG (Hochtemperatur-Reaktorbau GmbH) site at Jülich,
Germany
– used to postulate conservative compaction densities and times for use
in the safety studies
• Focus of this study:
– compaction of the pebble-bed or fuel region only
– no radial disturbance in the core cavity dimensions - excluded by the
core structure and graphite reflector design
– change in the bulk or average packing density during an earthquake
– Study core-neutronics and thermal-hydraulics behaviour of a
postulated SSE

PBMR workshop at PHYSOR 2010 –
Pittsburgh, May 14, 2010
SAMSON Facility
SAMSON experiments at 0.4 g
• 0.61 -> 0.613 (5 seconds)
• 0.61 -> 0.616 (15 seconds)

PBMR workshop at PHYSOR 2010 – Pittsburgh,
May 14, 2010
PBMR400 SSE postulated event
Postulate:
• Only effect is pebble bed compaction
• Decrease in pebble bed or core effective height
• Very conservative assumptions for concept design – Packing fraction increases: i) 0.61 -> 0.62 ii) 0.61 -> 0.64
– No control rod movement
• Compaction duration: i) 5 seconds ii) 15 seconds– typical range for the duration of strong shaking that results from large
earthquakes
• Includes a PLOFC and DLOFC (beyond design base)
• Reactivity increase due to:– Denser packing of fuel spheres
– Reduction of control rod effectiveness
PBMR workshop at PHYSOR 2010 – Pittsburgh,
May 14, 2010
Phenomena and restrictions
• The two major phenomena:– neutronic response of the fuel due to the bed compaction (streaming,
leakage, spectrum changes, temperature feedback)
– changes in the heat transfer (pebble bed packing fraction, reduced
core height)
• quantify the changes in: – the core reactivity
– fission power
– material temperatures
– fuel heat-up rate during the power excursion

PBMR workshop at
PHYSOR 2010 –
Actual SSE results:
0
50
100
150
200
250
300
0 5 10 15 20 25 30
Time (s)
Po
wer
(%)
• SSE – Fission Power as a % of the Steady State Values (0 s to 30 s) with RPS Trip Initiated on the Reactor Power
• Control rod insertion begins at 1.73 s as a result of the power SCRAM set point

Thank you!