models of financial markets - journal.julypress.com
TRANSCRIPT

Asian Business Research; Vol. 1, No. 2, 2016 ISSN 2424-8479 E-ISSN 2424-8983
Published by July Press
30
Models of Financial Markets
Frederick Betz1 1 Portland State University, Portland, USA
Correspondence: Frederick Betz, Portland State University, Portland, OR 97207-0751, USA.
Received: November 2, 2016 Accepted: November 17, 2016 Online Published: November 30, 2016
doi:10.20849/abr.v1i2.88 URL: http://dx.doi.org/10.20849/abr.v1i2.88
Abstract
Computer-based algorithms & models have become important in trading in financial markets. We illustrate the significance of model analysis of financial systems by a case study of BlackRock’s analytical platform called ‘Aladdin’. The nature of the model used in a computer algorithm is central to its real performance. Unreal models in financial algorithms will yield inaccurate performances. We review five fundamental models of economic dynamics: (1) traditional price-equilibrium of a commodity market, (2) Keynes-Minsky financial transactions over time, (3) price-disequilibrium of a financial market, (4) investment bank market disequilibrium process, and (5) disequilibrium financial grid of international capital flows. Empirically-valid graphic models are necessary – in order to methodologically develop societal-useful normative economic theory -- based upon the real natural-experiments of societies in economic history.
Keywords: economics, disequilibrium, financial models, financial technology
1. Case Study – BlackRock’s Aladdin
BlackRock is an asset-management company, managing about $4.1 trillion dollars of assets, with about 51% invested in equity, 29% in bonds, 7% in mixed portfolios of equity and bonds, 7% in money-market funds, 2% in hedge funds, and about 1-3% in other assets. The $4.1 trillion portfolio made it the largest asset-management fund in the world. The technology which assists the asset managers is a software platform called ‘Aladdin’. Ivy Schmerken wrote: At the heart of BlackRock's rise to prominence has been its analytics, which are housed in the firm's BlackRock Solutions technology division.” (Schmerken, 2009) Carol J. Loomis wrote: “Aladdin uses massive computing power to rationalize complex financial operations. Typically Aladdin captures the details of securities trades, values portfolios (both liquid and illiquid), and measures risk.” (Loomis, 2014)
Aladdin is operated in a data center located in Washington. The Economist wrote: “East Wenatchee, in Washington State, is known for its apples, not for its financial services. But in a data centre nestled between the orchards and hills, a cluster of 6,000 computers oversees the assets of over 170 pension funds, banks, endowments, insurance companies and others. Whirring around the clock, the machines look at what interest-rate changes, or bank collapses, or natural disasters could mean for trillions of dollars of assets. Around the world, 17,000 traders have the computers’ assessments of these risks at their fingertips when they buy or sell assets.” (Economist, 2013)
The analytical tool of Aladdin is also used by other firms to analyze their investments. The Economist wrote: “But ‘Aladdin’, the risk-management platform that occupies all those computers in the orchards, is not just used to look after BlackRock’s $4 trillion. The firm makes its facilities available in whole or in part to managers looking after $11 trillion more, a tally that has recently been growing by about $1 trillion a year. All told, Aladdin keeps its eyes on almost 7% of the world’s $225 trillion of financial assets. This is unprecedented—and it means flaws in the system could matter to more than just BlackRock, its investors and its customers. If that much money is being managed by people who all think with the same tools, it may be managed by people all predisposed to the same mistakes.” (Economist, 2013)
And in 2007-08, many of the banks in the world had made the same mistake, investing in mortgage-derivative market. U.S. Federal Government had to step in and rescue the U.S. banks and the Wall Street financial system, buying ‘toxic assets’. Then they made use of Aladdin’s analytic services. The Economist wrote: “By 2008, after 20 years of growth and the acquisition of part of Merrill Lynch, BlackRock had more than $1 trillion under management. As crashing banks revealed how spectacularly poorly the financial world had understood the complex and shady instruments it had put its money into, BlackRock, far from needing a bail-out, was something of an antidote. When the American government found itself owning or guaranteeing toxic assets, it turned to
http://abr.julypress.com Asian Business Research Vol. 1, No. 2; 2016
31
BlackRock, which was seen as having more limited conflicts of interest than everyone else concerned, to analyze, value and sell them...” (Economist, 2013)
Analytical models to analyze financial product portfolios was valuable in 2008 because the financial collapse had been due to investment in opaque derivative products, whose risk had been fraudulently evaluated by bond rating agencies. Derivatives from mortgage bonds contained large numbers of ‘sub-prime mortgages’. The sub-prime mortgages were the 'toxic' mortgages which collapsed the financial market. But the scheme of mortgage-based financial derivatives was still not enough to make big money in the securitization process. Also financial 'leverage' occurred in the purchasing of the sub-prime mortgages. Hedge funds borrowed money short-term to buy the long-term mortgages. Banks loaned short-term money to hedge-funds.
At the time, these leveraged derivative-loans was made possible by the 'cheap money' policy of the Federal Reserve under Greenspan. Morgenson and Rosner wrote: "All this is highly esoteric, of course. But the result was that Citigroup and other financial institutions were allowed to set up special investment vehicles, or SIVs, that raised money by borrowing from investors for short periods and investing the proceeds in investments with longer terms. The SIV would pocket the difference between the income generated by the mortgage and the amount paid out to investors who bought its obligations." (Morgenson and Rosner, 2011)
The mortgage derivative products were highly leveraged; and an opaqueness of the product was necessary to sell them as AAA risk -- when they were really a high risk, unstable product. In the reality of the financial portfolios of derivative products, there was a leveraging strategy based upon a short-term tactic. The 30-year prime home mortgage loans provided the interest for the securitized ten-year CDOs. Yet over time as the principle of these loans was paid down, the size of the interest payments would decrease – making any subsequent ten-year CDOs (over the 30 year-term of the mortgages) not possible to further sell. But also in the meantime, the initial CDOs were never fully paid but only financed by yearly short-term loans -- needed to be renewed each year for nearly thirty years. Thus the ‘derivatives’ were only a falsely-rated and short-term scheme, not sustainable over the long-term of the home-mortgages bonds. Sooner or later, that scheme would collapse; and it did in 2007. Morgenson and Rosner wrote: "This game worked while the mortgage mania was raging; but in 2007, when losses in subprime mortgages began to spook the markets. Investors fled SIVs in general and Citi's in particular. . . Suddenly, Citi was left with mortgages . . . (which) had to be either sold or brought back onto Citi's balance sheet at massive losses." (Morgenson and Rosner, 2011)
The so-called ‘risk-management’ models which had then been widely used by Wall Street investment banks had not worked, except for BlackRock’s Aladdin. Ivy Schmerken wrote: “BlackRock was called on for its risk analytics expertise. ‘We started to get inquiries to look at portfolios and to provide a risk assessment," relates Goldstein. . . . Known for its expertise in fixed income, BlackRock reportedly was hired by the federal government to help value and unwind the complex holdings of Bear Stearns, American International Group, and Citigroup. In addition the government engaged BlackRock to evaluate Fannie Mae and Freddie Mac, the mortgage finance giants, and to perform risk assessments of banks and insurance companies both in the U.S. and internationally.” (Schmerken, 2009)
For an analytical tool that really worked, the idea of Aladdin had been earlier conceived from the hard experience of misjudging risk. Ivy Schmerken wrote: “The roots of Aladdin started with the founding members of the firm . . . BlackRock founder and CEO Larry Fink, who previously was head of the mortgage department at First Boston, realized the lack of capabilities on the buy side to understand these products. The sell side was leveraging technology in the mortgage space, and the buy side didn't have comparable products to understand these things.” (Schmerken, 2009)
Landon Thomas wrote: “Laurence D. Fink, the leader and founder of BlackRock, the world’s largest asset manager . . . once upon a time he was a rock star on Wall Street. He had big hair and flashed turquoise jewelry, and making money had never seemed so easy. Until it wasn’t. ‘I screwed up,’ Mr. Fink declared, recalling the $100 million he blew thanks to failed mortgage trades in 1986. ‘And it was bad. . . . I believed I had figured out the market. But I was wrong because while I wasn’t watching, the world had changed.” (Thomas, 2016)
Landon Thomas Jr. added: “The immense losses at First Boston in 1986 taught a lesson that eventually shaped BlackRock. Mr. Fink realized that his clients on the “buy side” (the fund managers, insurance companies and pension funds shopping for investments) had become dependent on the ability of the “sell side” (the Wall Street investment banks) to analyze mortgages. That was because few buy-side clients had invested in computers and technology . . . . Most money management firms highlight their investment returns first, and risk controls second. BlackRock has taken a reverse approach: It believes that risk analysis, such as gauging how a security will trade if interest rates go up or down, improves investment results. That is where Aladdin comes in. Aladdin is a network of
http://abr.julypress.com Asian Business Research Vol. 1, No. 2; 2016
32
code, trades, chat, algorithms and predictive models that on any given day can highlight vulnerabilities and opportunities connected to the $15 trillion the firm tracks — $10 trillion of which belongs to outside firms that pay BlackRock a fee to have access to the platform. Aladdin fills the monitors of most BlackRock employees.” (Thomas, 2016)
Landon Thomas Jr. wrote: “Through its big data-mining risk platform, Aladdin (Asset Liability and Debt and Derivatives Investment Network) BlackRock says it has developed the market’s most highly evolved framework for stress-testing how securities will respond to certain situations — such as a sudden rise in interest rates or what happens in the event of a political surprise . . . . Aladdin promises to help firms trade, analyze and keep a compliant eye on the assets they manage. In an era of severe regulatory scrutiny, the service has become quite popular. Seventy-five firms — including Deutsche Bank’s asset management unit and Freddie Mac — managing a total of $10 trillion, now use it.” (Thomas, 2016)
2. Case Analysis
The BlackRock Aladdin platform is proprietary, and no public description of all its features and of its architecture is available. But there are some publically described aspects. Ivy Schmerken wrote: “In 1988, BlackRock cofounders Charlie Hallec, currently co-COO, and Ben Golub, the firm's chief risk officer, began building collateralized mortgage obligation (CMO) valuation models, relates Fortin. ‘That has been one of the guiding principles of the firm -- to understand the risks you are taking, to know where you are, to be able to manage them, and to know the limitations of the products and the models," he says. ‘Complete portfolio transparency was and is the theme," observes Goldstein, Over time BlackRock started to make the analytics available to its institutional clients as a risk and analytics platform, expanding it to include various advisory services and eventually the entire Aladdin platform. The company officially launched BlackRock Solutions in 2000.” (Schmerken, 2009)
The BlackRock Solutions division operates Aladdin, as its “enterprise investment system”, along with a risk reporting system, called “Green Package”, a portfolio analytics system called “PAG”, and an interactive analytics system called “AnSer”. The Economist wrote: “BlackRock Solutions is the in-house investment analytics and ‘process engineering’ department for BlackRock, which works with their portfolio management teams, risk and quantitative analysis, business operations and every other part of the firm that touches the investment process. . . . BlackRock Solutions (BRS) and the three primary divisions (which include risk management investment platform solutions, FMA, and client solutions) are services that offered to institutional clients... Aladdin keeps track of 30,000 investment portfolios, including BlackRock's own along with those of competitors, banks, pension funds, and insurers.” (Economist, 2013)
Aladdin is called it an analytical tool and not a model. This is important methodologically. Analysis and models, while complementary, are different research techniques in modern scientific method. As a clue to its analysis capabilities, we recall that Landon Thomas Jr. wrote: “Aladdin is a network of code, trades, chat, algorithms and predictive models that on any given day can highlight vulnerabilities and opportunities connected to the $15 trillion the firm tracks — $10 trillion of which belongs to outside firms that pay BlackRock a fee to have access to the platform. “ (Thomas, 2016)
To find connections between markets and their conditions, Aladdin apparently uses ‘data-mining research techniques’ which are statistical in methodology. Data-mining finds connections between data sources, such as correlations between sources or clusters of connections. Data mining does not create models but only correlations/clusters which can suggest the existence of an underlying model to explain the correlation/connections.
3. Disequilibrium Models of Financial Markets
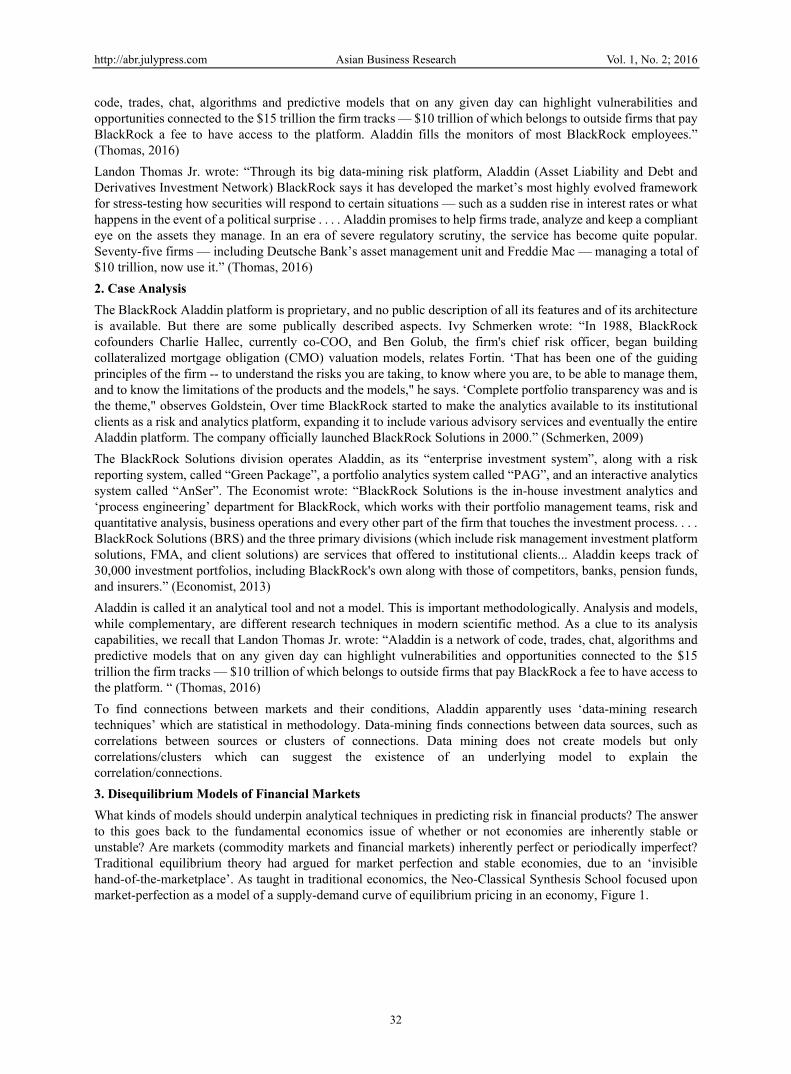
What kinds of models should underpin analytical techniques in predicting risk in financial products? The answer to this goes back to the fundamental economics issue of whether or not economies are inherently stable or unstable? Are markets (commodity markets and financial markets) inherently perfect or periodically imperfect? Traditional equilibrium theory had argued for market perfection and stable economies, due to an ‘invisible hand-of-the-marketplace’. As taught in traditional economics, the Neo-Classical Synthesis School focused upon market-perfection as a model of a supply-demand curve of equilibrium pricing in an economy, Figure 1.
http://abr.julypress.com Asian Business Research Vol. 1, No. 2; 2016
33
Figure 1. Economic equilibrium pricing of a product when supply equals demand
This is a normative theory, a desirable performance in a market. No government control over pricing is necessary, as a supply-demand equilibrium in the market sets the optimal price for the public good. However, has this equilibrium model always been empirically valid in financial markets? Not in 2007. Just earlier in 2000, equilibrium theory had been used by Allen Greenspan to argue against regulations on the derivative markets -- which, in fact, did later collapse financial markets in the global crisis of 2007-08. Historically, disequilibrium economics has appeared when financial markets goes into disequilibrium and collapses -- financial bubbles. Then bank panics freeze an economy.
The issues about stability and perfection have divided the discipline of economics into two schools. In 2009, Paul Krugman wrote: "It’s hard to believe now, but not long ago economists were congratulating themselves over the success of their field. Those successes — or so they believed — were both theoretical and practical, leading to a golden era for the profession. . . . . Few economists saw the 2008 crisis coming, but this predictive failure was the least of the field’s problems. More important was the profession’s blindness to the very possibility of catastrophic failures in a market economy. . . . (Krugman, 2009)
In 2012, Howard Davies wrote: “Reworking of economic models should be based upon history and more broadly based. . . There should be more teaching of economic history. . . . The study of economics should be set in a broader political context . . . . But it is not clear that a majority of the profession yet accepts even these modest proposals. The so-called ‘Chicago School’ has mounted a robust defense of it rational- expectations-based approach, rejecting the notion that a rethink is required. The Nobel laureate economist Robert Lucas has argued that the crisis was not predicted because economic theory predicts that such events cannot be predicted. So all is well.” (Davies, 2012)
In science, there is a difference between a model and a theory. A model is an accurate abstraction of reality of a natural object and can be directly validated (or invalidated) by comparison to observation or experiment. A theory is a semantic language of the principles upon which valid models can be constructed. In the economics model, an equilibrium-price point is desirable feature, as then the market is in balance between supply and demand. This is a desirable economic state, a normative theory and under proper economic conditions, of sufficient supply and competitive markets, an equilibrium price can be empirically real, especially for commodity markets – but not always for financial markets. The dynamics of commodity markets (equilibrium) and financial markets (disequilibrium) are empirically different.
http://abr.julypress.com Asian Business Research Vol. 1, No. 2; 2016
34
Historically, Neo-Keynesians had argued this. They said that the Neo-Classical Synthesis School economists had too narrowly viewed an economy as only a production system. For example, Ben Bernanke wrote: “Economists have not always fully appreciated the importance of a healthy financial system for economic growth or the role of financial conditions in short-term economic dynamics. . . .” (Bernanke, 2007) Hyman Minsky commented: “Ben Bernanke pointed out the dominant microeconomic paradigm is an equilibrium construct . . . that determine relative prices . . . . (The assumption is that) money and financial interrelations are not relevant to the determination of these equilibrium variables. . . . But if the basic microeconomic model is opened to include yesterdays, todays, and tomorrows . . . " (Minsky, 1993)
Earlier, Minsky had argued that introducing a time dimension into economic models was very important to capture the reality of an economy. Minsky drew upon John Maynard Keynes: "In the General Theory, Keynes sought to create a model of the economy in which money is never neutral (to pricing). He did this by creating a model . . . in which the price level of financial . . . assets is determined in (financial) markets. . . . Each capital and financial asset yields an income stream, (which) has carrying costs and possessing some degree of liquidity. . . The price level of assets is determined by the relative value. . (of) income . . . and liquidity . . ." (Minsky, 1975) Time dependence in a Keynes' model of a financial system lies in the concepts of ‘present-income’ and ‘future-liquidity’ of a ‘capital asset’.
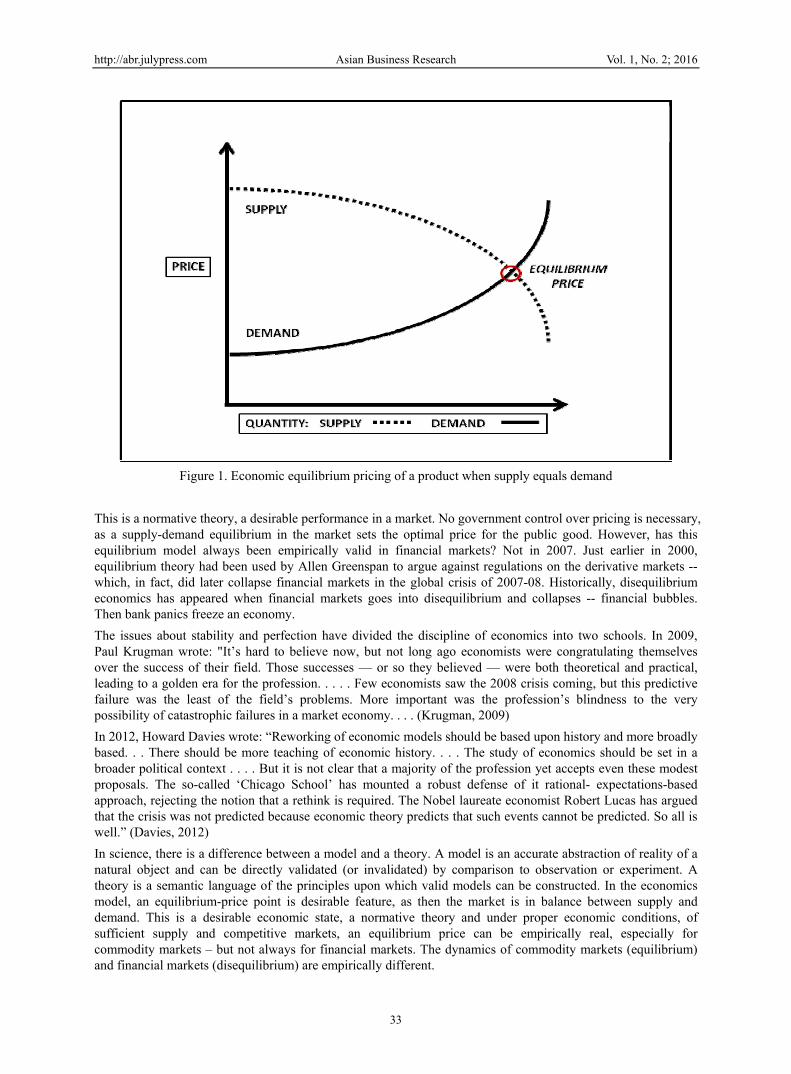
A capital asset is an investment which creates income and can later be sold. It produces an income stream (present-income) and also can be sold in the future (future-liquidity). The time dimension is from (T1) of a present-income to (T2) of future-liquidity. This present-to-future (T1 to T2) temporal process occurs in a financial system as a transaction of ‘credit-debt’. Minsky wrote: "Every capitalist economy is characterized by a system of borrowing and lending . . . . The fundamental borrowing and lending act . . . is an exchange of 'money-now' for 'money-in-the-future'. This exchange takes place . . . in a negotiation in which the borrower demonstrates to the satisfaction of the lender -- that the money of the future part of the contract will be forthcoming. . . The money in the future is to cover both the interest and the repayment of the principle of the contract." (Minsky, 1975) Figure 2 depicts a Keynes-Minsky model of a financial transaction. (Betz, 2014)
Figure 2. Keynes/Minsky Financial Process

http://abr.julypress.com Asian Business Research Vol. 1, No. 2; 2016
35
Irving Fisher (Fisher, 1933) and John Maynard Keynes (Keynes, 1936) had both identified instability as repeatedly occuring in financial markets and always resulting in a ‘debt deflation’. Later, this was elaborated by Hyman Minsky; and he argued that the ‘dimension-of-time’ needs to be introduced into economic models. (Minsky, 1975) Minsky wrote: "In the General Theory, Keynes sought to create a model of the economy in which money is never neutral (to pricing). He did this by creating a model . . . in which the price level of financial . . . assets is determined in (financial) markets. . . . Each capital and financial asset yields an income stream, (which) has carrying costs and possessing some degree of liquidity. . . The price level of assets is determined by the relative value . . (of) income . . . and liquidity . . ." (Minsky, 1982) In Keynes' model of a financial system, a ‘time-dependence’ is implicit in the concept of a ‘capital asset’ having both a ‘present-income’ and a ‘future-liquidity’.
A capital-asset is an investment which creates income and can later be sold. This is an important distinction to a commodity market; as a commodity does not necessarily create income and is usually consumed. In contrast, a capital-asset produces an income stream (present-income) and also can be sold in the future (future-liquidity). The time dimension is from (T1) of a present-income to (T2) of future-liquidity. This present-to-future (T1 to T2) temporal process occurs in a financial system as a transaction of ‘credit-debt’. A financial market makes the credit-debt contracts sellable over time, as a future-liquidity. Thus in a financial sub-system, three things are essential: (1) credit-debt transactions as a fundamental financial process, and (2) a capital-asset market for liquidity of the asset, and (3) money as a medium of value-exchange.
Thus financial markets are empirically different from commodity markets and can rise into disequilibrium – a financial bubble. Commodity markets exchange ‘commodities’; whereas financial markets exchange ‘capital assets’. The difference lies in economic value. Commodities have only one economic value: present-consumption. Capital assets, instead, have two economic values: present-rent and future-liquidity. This difference in economic values makes a difference in how economic agents behave in the two markets. In commodity markets, economic behavior aims toward a condition of supply-meeting-demand, a ‘price equilibrium’. In financial markets, economic behavior aims for higher financial leverages, progressing toward a financial bubble, a ‘price disequilibrium’.
The reason for price disequilibrium lies in ‘debt’. Debt makes a financial process operate. Yet one aspect of debt can destabilize the process; and this is 'leverage'. To increase profit, a financial system uses debt to finance the purchase of capital assets. Profits can be increased through financial leverage; and this is the financial rational of 'leverage' (more ‘present-debt’ toward greater ‘future-wealth’). However, when present-debt is too large (too highly leveraged), it might not create future-wealth but, instead, bankruptcy. Excessive 'leverage' increases the likelihood of bankruptcy and not future-wealth. This was earlier pointed out by Irving Fisher, who called a financial state of excessive-leverage as 'debt deflation.' (Fisher, 1933). Later Hyman Minsky called a state of excessive financial leverage as ‘Ponzi finance’. (Minsky, 1982)
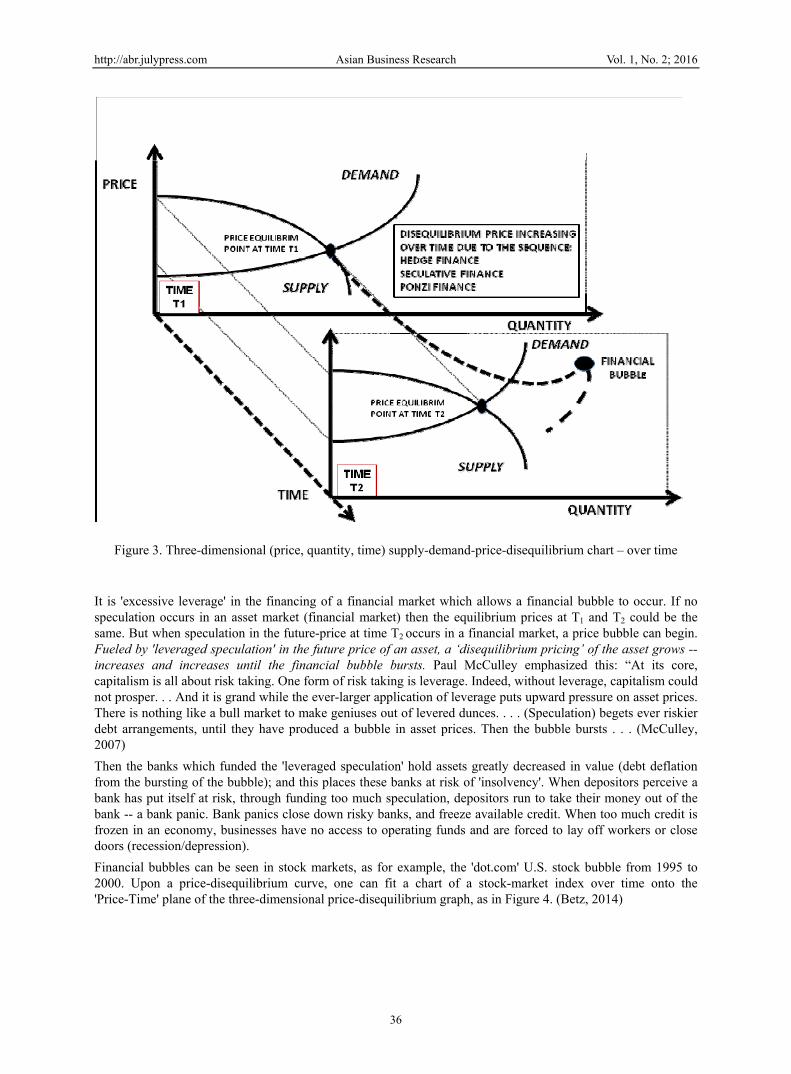
Thus leveraged ‘present-debt’ can increase ‘future-wealth’; but ‘excessive leverage’ can lead to ‘bankruptcy’. In Figure 3, one can graph this impact of leverage on a price equilibrium model – by modifying the 2-dimentional 'price-equilibrium chart’ -- with the addition of a 3rd-dimension of time. (Betz, 2014) This graph shows a supply-demand curve at two different times, T1 and later T2. In the time-dimension, one can see how a 'price-disequilibrium' situation can arise over time, as a ‘financial bubble’.
http://abr.julypress.com Asian Business Research Vol. 1, No. 2; 2016
36
Figure 3. Three-dimensional (price, quantity, time) supply-demand-price-disequilibrium chart – over time
It is 'excessive leverage' in the financing of a financial market which allows a financial bubble to occur. If no speculation occurs in an asset market (financial market) then the equilibrium prices at T1 and T2 could be the same. But when speculation in the future-price at time T2 occurs in a financial market, a price bubble can begin. Fueled by 'leveraged speculation' in the future price of an asset, a ‘disequilibrium pricing’ of the asset grows -- increases and increases until the financial bubble bursts. Paul McCulley emphasized this: “At its core, capitalism is all about risk taking. One form of risk taking is leverage. Indeed, without leverage, capitalism could not prosper. . . And it is grand while the ever-larger application of leverage puts upward pressure on asset prices. There is nothing like a bull market to make geniuses out of levered dunces. . . . (Speculation) begets ever riskier debt arrangements, until they have produced a bubble in asset prices. Then the bubble bursts . . . (McCulley, 2007)
Then the banks which funded the 'leveraged speculation' hold assets greatly decreased in value (debt deflation from the bursting of the bubble); and this places these banks at risk of 'insolvency'. When depositors perceive a bank has put itself at risk, through funding too much speculation, depositors run to take their money out of the bank -- a bank panic. Bank panics close down risky banks, and freeze available credit. When too much credit is frozen in an economy, businesses have no access to operating funds and are forced to lay off workers or close doors (recession/depression).
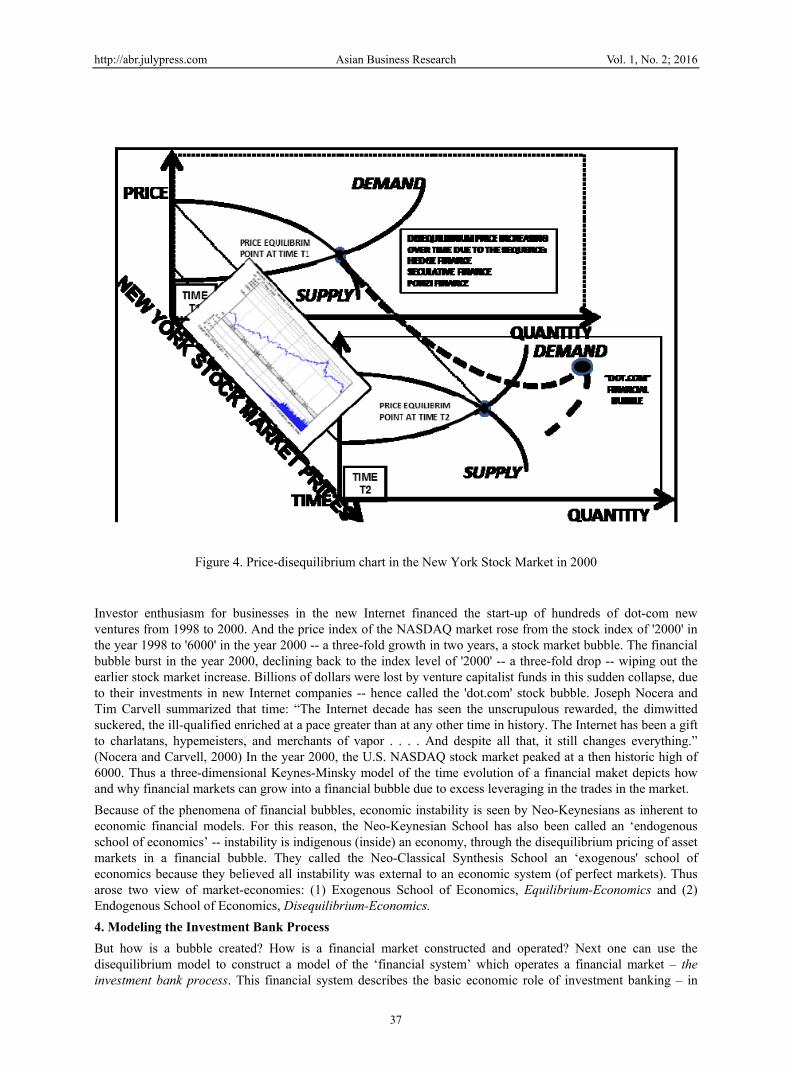
Financial bubbles can be seen in stock markets, as for example, the 'dot.com' U.S. stock bubble from 1995 to 2000. Upon a price-disequilibrium curve, one can fit a chart of a stock-market index over time onto the 'Price-Time' plane of the three-dimensional price-disequilibrium graph, as in Figure 4. (Betz, 2014)
http://abr.julypress.com Asian Business Research Vol. 1, No. 2; 2016
37
Figure 4. Price-disequilibrium chart in the New York Stock Market in 2000
Investor enthusiasm for businesses in the new Internet financed the start-up of hundreds of dot-com new ventures from 1998 to 2000. And the price index of the NASDAQ market rose from the stock index of '2000' in the year 1998 to '6000' in the year 2000 -- a three-fold growth in two years, a stock market bubble. The financial bubble burst in the year 2000, declining back to the index level of '2000' -- a three-fold drop -- wiping out the earlier stock market increase. Billions of dollars were lost by venture capitalist funds in this sudden collapse, due to their investments in new Internet companies -- hence called the 'dot.com' stock bubble. Joseph Nocera and Tim Carvell summarized that time: “The Internet decade has seen the unscrupulous rewarded, the dimwitted suckered, the ill-qualified enriched at a pace greater than at any other time in history. The Internet has been a gift to charlatans, hypemeisters, and merchants of vapor . . . . And despite all that, it still changes everything.” (Nocera and Carvell, 2000) In the year 2000, the U.S. NASDAQ stock market peaked at a then historic high of 6000. Thus a three-dimensional Keynes-Minsky model of the time evolution of a financial maket depicts how and why financial markets can grow into a financial bubble due to excess leveraging in the trades in the market.
Because of the phenomena of financial bubbles, economic instability is seen by Neo-Keynesians as inherent to economic financial models. For this reason, the Neo-Keynesian School has also been called an ‘endogenous school of economics’ -- instability is indigenous (inside) an economy, through the disequilibrium pricing of asset markets in a financial bubble. They called the Neo-Classical Synthesis School an ‘exogenous' school of economics because they believed all instability was external to an economic system (of perfect markets). Thus arose two view of market-economies: (1) Exogenous School of Economics, Equilibrium-Economics and (2) Endogenous School of Economics, Disequilibrium-Economics.
4. Modeling the Investment Bank Process
But how is a bubble created? How is a financial market constructed and operated? Next one can use the disequilibrium model to construct a model of the ‘financial system’ which operates a financial market – the investment bank process. This financial system describes the basic economic role of investment banking – in

http://abr.julypress.com Asian Business Research Vol. 1, No. 2; 2016
38
creating and selling the financial product of a capital asset. As shown in Figure 5, the investment bank process can be depicted in systems notation, with a ‘disequilibrium financial market model’ in the middle of the system – with a demand side and a supply side. (Betz, 2015)
Figure 5. Disequilibrium systems model of investment bank process
The financial market is composed of financial products – products created by investment banks. These products which match capital supply (demand side) to capital need (supply side). The investment bank creating financial products for a financial market is the center of the systems model. To the right side (supply side) of the systems model are sellers of capital assets, and to the left side are buyers of capital assets (demand side). The investment banks are the banking intermediary which creates the financial products which sell capital assets to buyers. Suzanne McGee wrote: “All of the players (on Wall Street) perform functions that link the ‘buy side,’ those who have capital and want to invest it profitably, and the ‘sell side,’ those entities in need of capital. ‘At its heart, when it is doing what it does best, Wall Street is a superb gatekeeper, making matches between investors and businesses, governments, or anyone else who needs to finance something,’ explains Mike Heffernan, a former Morgan Stanley banker.” (McGee, 2010)
As a financial intermediary, an investment bank brings together a financial supply side of capital assets to trade in a market with a financial demand side of buyers of the assets. For example, when an investment backs assists a private company in making a public offering of stock, the private company sells equity assets as stock and purchasers of the stock buy equity in the company. The source in the supply side for the financial products are sellers of capital assets. The value of the financial product is controlled by a rate of the estimated-value-of-the-asset compared to the current-asset- price trading in the financial market. In financing the creation of a financial product, investment banks often get loans from commercial banks; and there is leverage in the product-development loans.
http://abr.julypress.com Asian Business Research Vol. 1, No. 2; 2016
39
The sellers and buyers of financial products have different interests, which the investment bank must bridge in creating a financial product. Suzanne McGee wrote: “The sell side wants to get as much capital on the most favorable terms possible from the buy side— investors who range in size and importance from individuals to mutual fund conglomerates such as Fidelity, and include hedge funds, private equity funds, foundations, college endowments, pension funds, venture capital partnerships, and ultra-wealthy individual investors such as Microsoft cofounder Paul Allen or financier George Soros. In a perfect world, the sell side would love free money— with no interest payable, no specific term for repayment, and no promises about increasing the value of the investment. It is the myriad institutions that collectively make up Wall Street that (in exchange for a fee) bring together the two parties and negotiate a compromise: the terms on which the buy side is willing to invest some of its capital and the sell side is willing to agree to in order to get its hands on that capital. Banks have been fulfilling that kind of function in more limited ways for centuries. . . . Wall Street exists to help investors and those in need of capital find their way through the financing maze. Investment bankers still not only link the two sides but also help them sort out what terms are fair for the kind of capital being sought.” (McGee, 2012)
To model the demand side of financial products, the source of savings are individuals who make deposits in commercial banks, and the commercial banks purchase financial products. Also other financial institutions (mutual funds, hedge funds, pension funds, insurance companies) purchase financial products. The interest rate on the financial product is the controlling rate for its purchase by commercial banks and financial institutions. Commercial banks also make leveraged loans to traders in the financial market; and the trader’s purchase of financial products is then held as collateral by the banks. Commercial banks use interest from a financial product to pay interest to their savings depositors.
Thus the stability of the commercial banks can then depend (1) upon the quantity of financial product purchased by the bank and (2) upon the value of the collateral held on loans to traders. If the financial market collapses, then commercial banks are saddled with valueless financial products and the bad loans of the traders. The banks can become insolvent. (For example, in the New York stock market collapse of 1929, stocks held as collateral in banks which made loans to traders purchasing stocks-on-margin became valueless; and many of these banks went bust, through 1930, 1931, and 1932. Later in the 2007, the derivatives market crashed; and some large U.S. banks, holding mortgage bonds as collateral, Bear Sterns and Lehman Brothers, collapsed. Others, such as, Citigroup, AIG, etc., holding such collateral would have collapsed, except for the U.S. government bail-out.)
5. Case Study: Wall Street History of Product Innovation
This model of the investment bank process has resulted from the history of U.S. Wall Street, in the second half of the twentieth century. Wall Street had become focused upon ‘financial product innovation’. Wall Street has innovated in operations, operational innovation using computers and the Internet; but just as importantly, it has innovated in financial ‘products’. The importance of product innovation occurred in 1952, after a government deregulation of U.S. stock market fees.
Previous to 1952, the traditional function of investment banking was what is called a ‘financing life cycle’ of business. Investment banking services involves finding investors to finance the start of a business, loaning money to the business to finance its growth, taking the business public by issuing stock, maintaining a trading market in the stock, and assisting the business to issue bonds for operations or acquisitions. Some investment banks (venture capital firms) specialize in financing the ‘start-up’ stage of a new business; while the traditional Wall Street investment banks specialize in the underwriting the public offering stage. In offering public stock, investment banks had to ensure the continuing market for stock by participating in a stock exchange (e.g. having a seat on the New York Stock Exchange). Traditional investment banks also sold corporate bond issues for further corporate financing.
In a network of banking, Irving Minsky viewed investment and commercial banks as a layered banking system. (Minsky, 1982) Investment banks draw upon commercial banks for leveraged investment loans. The commercial bank takes in deposits of savings, and the investment banks produce financial products to sell to investors and commercial banks (demand for investments). However before 1952, a U.S. investment bank also earned a steady base of income from fixed fees in executing stock trading. But in 1952, the basic funding of investment bank altered as the U.S. government forced the end of fixed trading fees. While corporate start-ups, IPOs, and bonds were occasional events, earning commissions for the investment banks, the continuous trading of stocks provided a steady stream of income for the investment banks. But a large stream of steady profits from stock trading came to a sudden end for Wall Street investment banks. Suzanne McGee wrote: “May 1, 1952, has gone down in the history of the Street as “Mayday,” the date the Securities and Exchange Commission had dictated
http://abr.julypress.com Asian Business Research Vol. 1, No. 2; 2016
40
would mark the end of fixed trading commissions in the stock market. Overnight, Wall Street’s comfortable existence was shaken; its long-standing business model was turned upside down.” (McGee, 2012)
Trading stock on the New York Stock Exchange cost a fixed fee (dependent upon the dollar value of the trade). This generated a steady and large income stream for the investment banks. McGee quoted Fred Joseph, former CEO of Drexel Burnham: “I was a big producer, because I’d do one trade in connection with a deal. I could make a $ 500,000 fee without discussing it with the client. This was due to the fee being fixed and institutional investors making large and frequent trades.” (McGee, 2012)
The commissions produced large profits which financed overhead activities such as ‘investment research’ by the Wall Street banks. When the fixed commission structure was deconstructed, investment banks had to turn to intermittent and non-recurrent business activities to generate large commissions. Suzanne McGee quoted Wilbur Ross about the change: “Wall Street’s Mayday changed the whole nature of Wall Street; what we did and who we were. Research suddenly had no value in its own right and wasn’t being subsidized. So the clever people on the Street said, ‘Okay, we’ll use these smart and well-paid people to bring in investment banking business.’” (McGee, 2010)
With this change in revenue flow, Wall Street could not afford to protect the investor with financial research or even financial due diligence. This was the beginning of the evolution of Wall Street investment banks from acting as proper financial intermediaries to casino banking – trading, pumping, and dumping. Suzanne McGee wrote: “The ugly end to the U.S. dot-com boom in early 2000 drove that message home to Wall Street decision makers like nothing else had done. They had spent the waning years of the twentieth century chasing the kind of fees that had been the bread and butter of Wall Street: taking start-up technology companies public, raising both debt and equity for the likes of WorldCom and AT& T Wireless, and pocketing merger advisory fees by helping companies such as Cisco and JDS Uniphase snap up innovative young companies. . . . But that happiness could endure only as long as the market bubble kept inflating. . . . The fact was that Wall Street firms no longer needed to rely purely on the fees they earned for overseeing processes such as underwriting, sales and trading, or advising on mergers. These intermediary functions were profitable only when they could be done in tremendous volumes, as had happened at the height of the dot-com boom. The longer the slump that began in 2000 lasted, the more Wall Street needed to find an alternative source of revenue, preferably one with a higher profit margin.” (McGee, 2010)
Next after ‘Mayday’, a second ‘change’ event for Wall Street occurred, when branch offices were opened in London, for avoiding the U.S. bank regulations about international financing operations. Suzanne McGee wrote: “Wall Street’s fee income from its traditional businesses— buying and selling stock on behalf of its clients and underwriting their debt and equity businesses— was threatened. The solution? New products that would address new concerns . . . Globalization also created new market opportunities. In 1971, the United States abandoned the Breton Woods system of fixed exchange rates, creating a thriving market for options and futures contracts on foreign currencies, such as the British pound, Japanese yen, and Swiss franc. The Eurobond market was another attractive new opportunity. Born in London’s financial markets in the 1960s, it involved issuing dollar-denominated debt outside the United States, meaning that the issues didn’t need to be registered with the SEC and that the companies selling debt didn’t need to abide by U.S. accounting rules.” (McGee, 2010)
The bonds were issued in dollar currency by international companies and sold by bank offices in the City of London. Investors found the bonds acceptable in an international currency, paying good interest and avoiding regulations (banking or taxes) by particular nations. Susanne McGee wrote: “The Eurobond market was one of the fastest-growing capital markets around— and, like options, it was a lucrative alternative to plain-vanilla bond deals, rewarding underwriters with higher fees. But trying to build a Eurobond business drove home, yet again, the need for a large and stable base of capital. Not only did trying to grab market share in Eurobonds mean establishing a presence in London, but players such as Morgan Stanley and Goldman Sachs (among the early arrivals) would need to compete with giant commercial banks such as Deutsche Bank and Credit Suisse, institutions that, unlike their U.S. counterparts, faced no domestic rules against using their giant commercial banking balance sheets to help them muscle in and grab investment banking business.” (McGee, 2010)
Thus Wall Street’s first financial innovation after the Wall Street ‘Mayday” was to create and sell Eurobonds in the international financial market. This required Wall Street to establish British branches in London, to avoid the U.S. regulatory restrictions on international financial operations by US investment banks. How did establishing a London branch of a Wall Street investment bank enable the Wall Street bank to escape regulation, national or international? This occurred after the Second World War when the Bank of England decided not to regulate the British banks much (a regulatory ‘light touch’). Nicholas Shaxson wrote: “Nobody quite agrees when this new

http://abr.julypress.com Asian Business Research Vol. 1, No. 2; 2016
41
strain of offshore activity first emerged, but it was probably first spotted by a financial regulatory authority in June 1955 when staffers at the Bank of England, the UK’s central bank, noticed some odd trades going on at Midland Bank (now part of the globetrotting HSBC). Exchange rates in those days were mostly fixed against the dollar. Banks in London were not supposed to trade in foreign currencies unless it was for financing specific trades for their clients and they were not allowed to lend against deposits in foreign currencies. Midland Bank was apparently contravening UK exchange controls by taking U.S. Dollar deposits that were not related to a specific commercial transaction. And it was also offering interest rates on these dollar deposits that were substantially higher than those permitted by U.S. regulations.” (Shaxson, 2011)
The Bank of England had ‘looked the other way’ (as regulators) in allowing Midland Bank to violate regulations. This opened the lucrative investment bank business in the City of London to take dollar deposits with higher interest rates than offered in the U.S. Dollar deposits followed into the Midland Bank and to other British banks (which also had noticed the implicit ‘deregulation’); and the Eurodollar market was born.
The commercial or investment banks located in a nation could avoid their nation’s bank regulations by opening a bank branch in London. Shaxson wrote: “A Bank of England official called in Midland’s chief foreign manager for a chat, to ask why the bank was contravening official controls. Afterward he noted down that the Midland official ‘appreciates that a warning light has been shown’. Luckily for Midland, though, Britain was struggling to shore up its shaky foreign exchange reserves, and the Bank was reluctant to snuff out a new area of international business. ‘We would be wise, I believe, not to press the Midland any further,’ the Central Bank concluded.” (Shaxson, 2011)
This British practice of ‘light regulation’ (e.g. only a warning light without any regulatory restriction) by the Bank of England effectively created an unregulated international banking network (financial grid) centered in the City of London. Thus the first step in the evolution of Wall Street banking was to ‘go abroad’ to London.
6. Disequilibrium Systems Model of an International Financial Grid
In addition to models of (1) a financial transaction, (2) a disequilibrium financial market, and (3) an investment banking system, one can also construct (4) a model of international capital flows, created by investment banking system on an international scale.
For modeling the international banking grid, it is important to add ‘off-shore banking’ into the grid. The need for periodic innovation of financial products (increase financial production) increased the necessity of a global market, in which to sell more products (broaden the market). To connect these two needs (sell and buy), an international financial grid developed -- a network of banking connections. This international financial grid can be modeled by adding an international plane to the national plane of a financial market model. (Betz, 2015) In Figure 6, one can see how to add an international plane to a national plane of the disequilibrium systems model of a commercial-investment bank financial grid.

http://abr.julypress.com Asian Business Research Vol. 1, No. 2; 2016
42
Figure 6. Disequilibrium systems model of investment bank process with unregulated international banking
An investigative financial reporter, Joanne Ramos, pointed to offshore banks as critical elements of the modern international financial grid. Ramos wrote: “In a globalized economy, money moves instantly and anonymously across borders. This can benefit terrorists, drug traffickers and rogue nations in need of cash. Keeping such customers out of the world's sprawling financial system is becoming ever harder. Financial regulators have another big concern. Footloose capital transmits not just tainted money but financial crises too. The huge growth in the use of esoteric derivatives and the rise of hedge funds have made it increasingly difficult to understand where financial risk lies, partly because much of it is hidden away on islands with variable supervision. Offshore holdings now run to $5 trillion-7 trillion, five times as much as two decades ago, and make up perhaps 6-8% of worldwide wealth under management . . . . The British Virgin Islands (BVI) are home to almost 700,000 offshore companies.” (Ramos, 2007)
The offshore banking industry has turned out to be a critical institutional sector of the international financial grid, creating the market volume to buy, in large amounts, the questionable financial innovations sold by the investment banking industry. Off-shore banks buying these questionable investments were not performing ‘due diligence’ in financial trading. This was because off-shore banks had no means of investing the huge amounts of the international cash flow going into their deposits -- except through international investment banks. By 2007, as much as 6 to 8% of the world’s wealth was flowing into the offshore banking industry.
Other investigative reporters have also examined the off-shore industry. Nicholas Shaxson also emphasized the importance of the institutional role of off-shore banks: “Towering inequalities in Europe and the United States, not to mention in underdeveloped countries, cannot be understood properly without exploring the role of secrecy jurisdictions. The systematic looting of the former Soviet Union, and the merging of the nuclear-armed country’s intelligence apparatus with organized crime, is substantially a story that unfolds in London and its offshore satellites. The political strength of Saddam Hussein had important offshore underpinnings, as did the power of North Korea’s Kim Jong-Il. Prime Minister Silvio Berlusconi’s strange hold over Italian politics was significantly an offshore story. The Elf affair, which helped powerful French elites float above and out of reach of French democracy, had secrecy jurisdictions at its heart . . . . The narcotics industry alone generates some $ 500 billion in annual sales worldwide. To put this into perspective, that is twice the value of Saudi Arabia’s oil
http://abr.julypress.com Asian Business Research Vol. 1, No. 2; 2016
43
exports. The profits made by those at the top of the trade find their way into the banking system, the asset markets, and the political process through offshore facilities. You can only fit about $ 1 million cash into a briefcase. Without offshore, the illegal drugs trade would be more like a cottage industry.” (Shaxson, 2011)
The offshore banks (outside proper bank regulatory authority) make money by helping people and corporations to hide money from taxes and also to launder money gained from illegal or corrupt activities. The off-shore banking institutions include locally licensed banks and financial institutions. What happens to all these deposits (e.g. $1.4 trillion in the Cayman Islands), since the offshore banks and institutions have no financial investments in which to put all that money. They invest (buy) products sold by the investment banks with branches in the City of London. Nicholas Shaxson wrote: “London’s first claim to be a tax haven is . . . its role as the creator and developer of the Euromarkets -- Wall Street’s giant escape route from the checks and balances of U.S. financial regulation. Here the subsidiaries and affiliates of U.S. commercial banks have long been allowed to engage in, among many other things, investment banking, “casino banking,” as some have called it— something the Glass-Steagall Act of 1933 explicitly prohibited. Over the years, as this business became more integral to their global banking models, Wall Street could increasingly pressure the U.S. government to do away with the original restrictions to allow them to do at home what they already did offshore, and this was arguably the main factor that led to the repeal of Glass-Steagall in 1999.” (Shaxson, 2011)
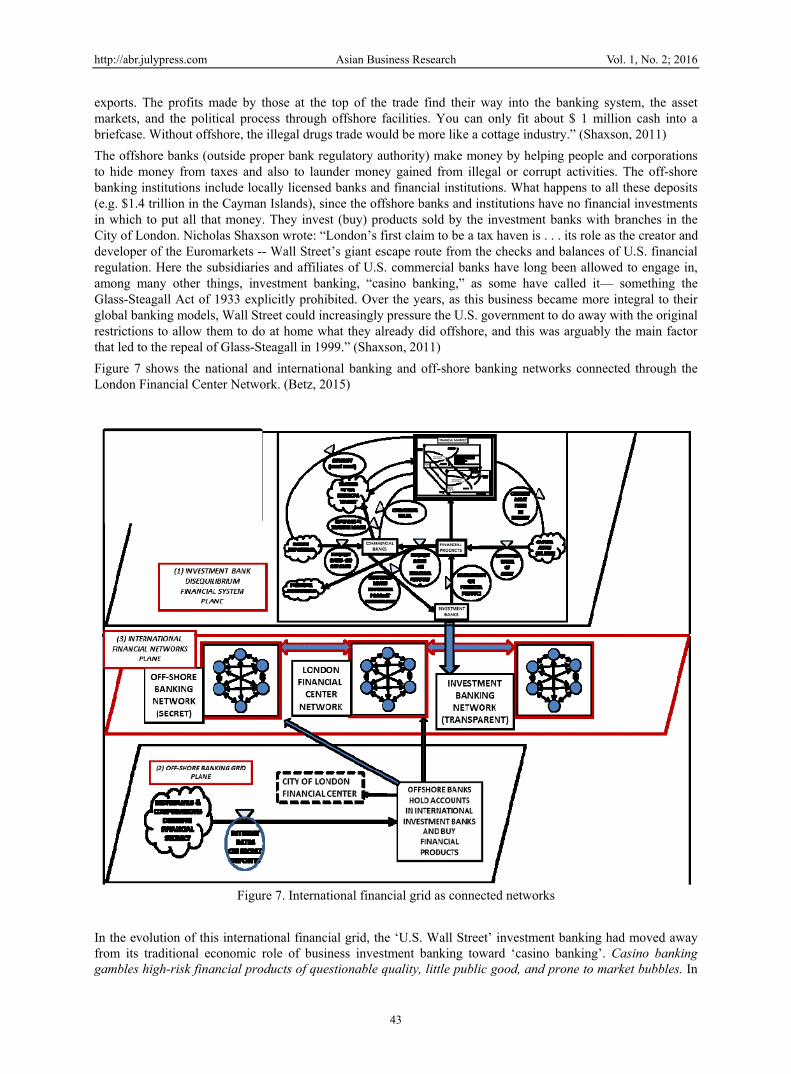
Figure 7 shows the national and international banking and off-shore banking networks connected through the London Financial Center Network. (Betz, 2015)
Figure 7. International financial grid as connected networks
In the evolution of this international financial grid, the ‘U.S. Wall Street’ investment banking had moved away from its traditional economic role of business investment banking toward ‘casino banking’. Casino banking gambles high-risk financial products of questionable quality, little public good, and prone to market bubbles. In

http://abr.julypress.com Asian Business Research Vol. 1, No. 2; 2016
44
the London-based Eurodollar market, Wall Street institutions had gone to London to engage in selling unregulated international financial products.
These London branches of Wall Street investment banks were central to the sale of the products which blew up Wall Street in 2008. Nicholas Shaxson wrote: “London provides endless loopholes for U.S. financial corporations, and many U.S. banking catastrophes can be traced substantially to those companies’ London offices. The unit that blew up the insurance company American International Group (AIG), putting the U.S. taxpayer on the hook for $ 182.5 billion, was its four hundred– strong AIG Financial Products unit, based in London. The court-appointed examiner looking into the collapse of Lehman Brothers in September 2008 found it had used a trick called Repo 105 to shift $ 50 billion in assets off its balance sheet, and that while no U.S. law firm would sign off on the transactions, a major law firm in London was delighted to oblige, without breaking the rules. . . . A little-noticed IMF paper in July 2010 estimated that by 2007 the seven largest players in the market— Lehman Brothers, Bear Stearns, Morgan Stanley, Goldman Sachs, Merrill/ BoA, Citigroup, and JPMorgan— had shifted $ 4.5 trillion off their balance sheets in this way. (Shaxson, 2011)
7. Summary
Using the case study of BlackRock’s Aladdin, we have emphasized how important are computer-based analysis and models, to modern financial markets. Then we have reviewed how ‘disequilibrium-price’ economic theory provides empirically-based models of financial dynamics and international capital flows. We have examined four models of financial systems: (1) financial transaction model, (2) disequilibrium financial market model, (3) disequilibrium investment banking model, (4) disequilibrium financial grid model. These models describe empirically the range of modern financial systems, from individual transactions to products, to markets, to international grids. All models center upon the Fisher-Keynes-Minsky insights that financial systems are inherently unstable, due to the importance of leverage in the profitability of financial trade. Modeling this empirical insight enables the practice of not just extrapolating present trends in financial markets but also enabling the anticipation of financial bubbles and crises.
Analytical financial techniques, which are not based upon empirical models but only project present trends, can miss the emergence of disruptive conditions in a market. The financial crisis of 2007-08 was not anticipated, while it could have been anticipated, based upon a Keynes-Minsky transaction model. Securitization does not create financial products which are real financial transactions. Stripping the rent form a financial asset destroys both the intrinsic economic value of the asset and of the derivative. An empirically unreal financial transaction will always eventually be found out by a practical financial market as a financial fraud. The 2005-07 U.S. mortgage derivatives of the CDOs should have been regulated, even to the extent of not allowing securitization as a legal financial transaction. This is why real models of real markets are important. Otherwise fraudulent financial products may be traded, which eventually will always lead to a financial crisis, a Fisher debt deflation – when fraudulent financial products are finally discovered to be valueless.
Data mining techniques used in analytical searches are important techniques but do not directly produce models. They produce suggestions for models, possible correlations or clusters under which may lie a model. Models show directly the relevant relationships in a phenomena, which will appear as correlations or clusters. Understanding the methodological differences between models and data-mining analytics is important.
In the present period, models with three topological planes are necessary, because of the different networks in the financial grid: (1) national investment bank network, (2) off-shore banking network, and (3) London Financial Center banking network. The two networks of national and off-shore banking networks are connected through the third network of the City of London Financial Center. This three-plane graphic model shows that the offshore-bank network is financially effective because it ties into a central location, the City of London Financial Center. The City of London does not regulate the international investment banks dealings with the offshore network – as sellers (investment banks) and buyers (offshore banks) -- of financial innovations which may or may not have any public good. And the model emphasizes that some of the international buyers of the investment banks ‘financial innovations’ were the off-shore banks which needed high-interest income to pay interest to their secret clients -- individuals and corporations depositing in the off-shore banks. These off-shore banks do not worry about the soundness of the financial products’, just as long as the investment banks assure them that they are low-risk and bear high interest.
Analysis and financial algorithms alone can not capture the full reality of financial grids -- because the different institutional practices of the different banking networks in the grid cannot be empirically depicted by one or a set of algorithms. Institutional practices need to be modeled graphically, showing the networks of connections and practices between the financial institutions, existing empirically at a specific time in the world. Graphic forms of models connect institutional practices with financial history.

http://abr.julypress.com Asian Business Research Vol. 1, No. 2; 2016
45
References
Bernanke, B. S. (2007). Regulation and financial innovation. 2007 Financial Markets Conference, Sea Island, Georgia, May 15. Federal Reserve Bank of Atlanta.
Betz, F. (2014, February). Disequilibrium Pricing Theory. Theoretical Economics Letters, 4(1). Scirp.org. Retrieved from http://www.scirp.org/journal/tel
Betz, F. (2015). Price-Disequilibrium Model of the International Financial Grid: Innovation, Crisis, and Off-Shore Banking. Business and Management Research, 4(3). Retrieved from www.sciedupress.com/bmr
Davies, H. (2012). Economics in Denial About Its Academic Merit. The Korea Herald, August 27.
Economist. (2013). BlackRock -- The monolith and the markets: Getting $15 trillion in assets on to a single risk-management system is a huge achievement. Is it also a worrying one?. Economist, December 7. Retrieved from http://www.economist.com/news/briefing/21591164-getting-15-trillion-assets-single-risk-management-system-huge-achievement
Fisher, I. (1933). The Debt-Deflation Theory of the Great Depression. Econometrica, October.
Keynes, J.M. (1936). The General Theory of Employment, Interest, and Money. New York: Harcourt Brace.
Krugman, P. (2009). The B Word. The New York Times, March 17.
Loomis, C. J. (2014). BlackRock: The $4.3 trillion force. New York Times, July 7. Retrieved from http://fortune.com/2014/07/07/blackrock-larry-fink/
McCulley, P. (2007). Teton Remarks. Retrieved from http://web.archive.org/web/20091124124300/http://www.pimco.com/LeftNav/Featured+Market+Commentary/FF/2007/GCBF+August-+September+2007.htm
McGee, S. (2010). Chasing Goldman Sachs: How the Masters of the Universe Melted Wall Street Down...And Why They'll Take Us to the Brink Again. Crown Publishing Group.
Minsky, H. (1975). John Maynard Keynes. Columbia University Press. (reprinted in 2008 by Mc Graw Hill)
Minsky, H. (1975). John Maynard Keynes. New York: Columbia University Press. (reprinted in 2008 by McGraw-Hill).
Minsky, H. (1993). Comment on Ben Bernanke, 'Credit in the Macro-economy'. Hyman P. Minsky Archive, Paper 361. Retrieved from http://digital commons.bard.edu/hm_archive/361
Minsky, H. P. (1982). Can ‘It’ Happen Again? Essays on Instability and Finance. M.E. Sharpe Inc.
Morgenson, G., & Joshua, R. (2011). Reckless Endangerment: How Outsized Ambition, Greed, and Corruption Led to Economic Armageddon. Henry Holt and Company.
Nocera, J., & Tim, C. (2000). 50 Lessons. Fortune, October 30, pp. 136-137.
Ramos, J. (2007). Places in the sun: Offshore Financial Centres. The Economist, February 22. Retrieved from http://www.economist.com/node/8695139
Schmerken, I. (2009). BlackRock’s Analytics Pay Off in More Ways Than One. Information Week: Wall Street and Technology, October 13. Retrieved from http://www.wallstreetandtech.com/risk-management/blackrocks-analytics-pay-off-in-more-ways-than-one/d/d-id/1262585?
Shaxson, N. (2011). Treasure Islands: Uncovering the Damage of Offshore Banking and Tax Havens. St. Martin's Press. Palgrave McMillan.
Thomas Jr, L. (2016). At BlackRock, a Wall Street Rock Star’s $5 Trillion Comeback. New York Times, September 15. Retrieved from http://www.nytimes.com/2016/09/18/business/dealbook/at-blackrock-shaping-the-shifts-in-power.html?ref=business
Copyrights
Copyright for this article is retained by the author(s), with first publication rights granted to the journal.
This is an open-access article distributed under the terms and conditions of the Creative Commons Attribution license (http://creativecommons.org/licenses/by/4.0/).