modèle de document - unit
TRANSCRIPT

I

II

III
Acknowledgements
This thesis has been a six month learning process which would not have been
possible without the support of numerous people. First I would like to thank my two
thesis supervisors. Simon Hallez, thank you for your guidance and consistent
support to help me understand the food system I studied and get the most out of
the time I had. Mélise Bourroulec, my sincere gratitude for your constructive
criticism and unending words of encouragement while still providing critical
feedback to push this thesis to the fullest extent. Thank you to all the colleagues
from Gabnor for making this adventure rich professionally but humanly as well.
Thank you to all the farmers and stakeholders to be willing to converse with me,
answer my questions and shared your thoughts on their food system, their
logistics, their challenges and ideas. You have been a source of positive energy
and inspiration for me. To Laura, thank you for being there during the all process
and for all the support, the positive energy you gave me as well as helping me with
my ‘frenchism’ with a smile. To the agroecology, student and friend networks,
thank you for the emails, questions, feedback, good food and bad jokes; it has
been a pleasure to have you all a part of this process and my life. And finally, a
very sincere thank you to my family, for supporting me in my endeavors to pursue
a Master in Agroecology. Thank you for your love and for believing in me!

IV

V
TABLE OF CONTENTS
Abbreviations, acronyms .................................................................................................................. VII
INTRODUCTION ................................................................................................................................ 1
PART 1: CONTEXT ............................................................................................................................ 6
1. Organic farming, change of scale and transformation: Exploring innovative methods of
organization. ................................................................................................................................... 7
2. Localizing the food sector to organize and support the organic agriculture’s change of scale.
..................................................................................................................................................... 10
3. Limits of a local food system: From viable to sustainable ....................................................... 12
4. Logistics: collaboration as a tool for optimization .................................................................... 14
5. Research questions ................................................................................................................. 21
PART 2: MATERIALS AND METHODS ........................................................................................... 22
1. Exploratory phase .................................................................................................................... 23
2. Farmers’ logistics performance evaluation .............................................................................. 26
3. Identifying inhibiting and supporting factors of logistics collaboration ..................................... 30
4. Propositions and reflections ..................................................................................................... 36
PART 3: RESULTS AND DISCUSSION .......................................................................................... 38
1. Evaluation of logistics performances ....................................................................................... 40
2. Logistic collaboration: Inhibiting and supporting factors .......................................................... 53
PART 4: PROPOSITIONS AND CONCLUSION .............................................................................. 78
1. Evaluating the potential of evolution in Nord-Pas de Calais .................................................... 79
2. Recommendations for action ................................................................................................... 85
3. Limitation of the study .............................................................................................................. 91
Works cited ....................................................................................................................................... 93
Table of contents ............................................................................................................................ 117
Table of appendices ....................................................................................................................... 119

VI
Abstract
Localizing the organic food system is a key element for sustaining the development of organic
agriculture globally. Local Food Systems (LFS) are often attributed to having advantages but their
economic, ecological and social performances are questioned mainly due to low logistics
rationalization. The organic retail-wholesale sector is particularly affected by logistics problems (low-
volume delivery, and numerous delivery points). This study evaluates collaboration as a tool for logistic
rationalization in order to facilitate the process of sustainably localizing the organic food system in the
retail-wholesale sector. Performances of current organic farmers’ logistics organization regarding their
retail-wholesale outlet are evaluated through indicator calculations. Logistics collaboration interests and
obstacles are identified through a qualitative analysis. Finally, forms of logistics collaboration are
highlighted. This study shows that the impact of increasing logistics efficiency varies greatly depending
on the products. Increasing time availability, accessing new markets and reducing logistics costs are
the main incentives for logistics collaboration, but obstacles, mainly the singularity of each system, and
lack of confidence between partners make collaboration difficult. It is important to focus attention on
making improvements at the farm level and the food system level to bring awareness to the challenges
and initiate action for sustainable beneficial change.
Key words
Local Food System (LFS), organic farming, logistics, collaboration, retail-wholesale sector
Résumé
La relocalisation de la filière bio apparaît aujourd’hui comme élément primordial au maintien de son
développement au sein des territoires. Les circuits alimentaires de proximité (CAP) sont souvent
associés à une multitude d’atouts mais des questionnements apparaissent sur leurs performances
économiques, écologiques et sociales, due notamment à une faible rationalisation logistique. Le
secteur du demi gros est particulièrement affecté par la problématique logistique (livraison de faible
volume sur de nombreux points de livraison). Cette étude évalue la collaboration comme outil de
rationalisation logistique dans une optique de relocalisation durable des filières alimentaires bio dans le
secteur demi-gros. Les performances de l’organisation logistique des agriculteurs bio pour leur
débouché demi-gros sont évaluées par le calcul d’indicateurs. Les freins et les leviers à la collaboration
logistique sont identifiés par le biais d’une analyse qualitative. Cette étude montre que l’impact d’une
optimisation logistique varie grandement en fonction de la nature de la production. La libération de
temps, l’ouverture de nouveaux débouchés et la réduction des coûts logistiques sont les intérêts
majeurs identifiés à la collaboration logistique. Cependant, des freins, comme la singularité des chaque
système ou le manque de confiance entre partenaire rendent leur mise en place difficile. Il est
important de travailler à l’échelle des producteurs mais aussi de la filière pour aider à la prise de
conscience sur la problématique et initier l’action pour la mise en place de changement durable.
Mots clés
Circuits alimentaires de proximité (CAP), agriculture bio, logistique, collaboration, secteur demi-gros

VII
Abbreviations, acronyms
ANDA: National Organization for Agricultural Development
LFS: Local Food System
CASDAR: Special Account for the Agricultural and rural Development
CEB: Organic and Ecological Center
CHR: Café, Hotel, Restaurant
CSA: Community Supported Agriculture
EU: European Union
FAO: Food and Agriculture Organization
FNAB: National Federation of Organic Farming
GABNOR: Organic Farmers Organization in Nord-Pas de Calais
GHG: Green House Gazes
IFEN: French Institute of Environment
IFOAM: International Federation of Organic Agriculture Movement
IFSTTAR: French Institute of the Transportation, Planning and Network Sciences and
Technology
INSEE: National Institute for Statistics and Economical Studies
IUT: University Institute for Technology
NRC: Non Residential Catering
GMOs: Genetically Modified Organisms
SCIC: Cooperative Society of Collective Interest
SSC: Short Supply Chain
SWOT: Strengths, Weaknesses, Opportunities, Threats
VAT: Value Added Taxes

VIII
Lists of tables
Table 1 : Difference of impacts for an efficient logistics depending on the marketing channel ....... 20
Table 2: Experts interviewed during the exploratory phase of the study ......................................... 24
Table 3 : Chosen indicators for the evaluation of logistics performances for the interviewed farmers
.......................................................................................................................................................... 27
Table 4 : Constants chosen for the study ........................................................................................ 28
Table 5 : Identified and interviewed key actors of the studied LFS (Source: Author, 2014) ............ 30
Table 6 : Analysis of evolution .......................................................................................................... 36
Table 7 : Relations between the factors of the diagnosis of evolution ............................................. 37
Table 8 : Interviewed farmers brought to anonymity and grouped by products ............................... 40
Table 9 : Results of the evaluation of economic performances of interviewed farmers logistics ..... 43
Table 10 : Results of the evaluation of logistics’ ecological performances of the interviewed farmers
.......................................................................................................................................................... 47
Table 11 : Results of the evaluation of logistics’ social performances of the interviewed farmers .. 49
Table 12 : Economic necessity to have an efficient logistics depending on the characteristics of the
products ............................................................................................................................................ 51
Table 13 : Results of the descriptive analysis of the content analysis-Interests of logistics
collaboration (Source: Author, 2014) ............................................................................................... 56
Table 14 : Results of the analysis of multiple choice grid -Interests of logistics collaboration
(Source: Author, 2014) ..................................................................................................................... 56
Table 15 : Results of the descriptive analysis of the content analysis-Obstacles of logistics
collaboration (Source: Author, 2014) ............................................................................................... 62
Table 16 : Results of the multiple choice grid analysis-Obstacles of logistics collaboration (Source:
Author, 2014) .................................................................................................................................... 62
Table 17 : Evaluation of the potential of evolution - Toward a collaborative logistics in the Nord-Pas
de Calais organic LFS for the retail-wholesale sector ...................................................................... 81

IX
Lists of figures
Figure 1: Distribution of the marketing channels in the LFS in the Nord-Pas de Calais (% of the
farmers involved in the different marketing channels) ...................................................................... 4
Figure 2: Percentage of organic product sales in France according to distribution networks ........... 8
Figure 3: Logistics steps of the food products marketing channel for the farmers .......................... 15
Figure 4: Model 1: Direct supply from the producers ....................................................................... 16
Figure 5: Model 2: Supply through platforms ................................................................................... 17
Figure 6: Model 3: Toward collaborative practices and logistics pooling ......................................... 18
Figure 7 : The steps of the content analysis .................................................................................... 32
Figure 8 : Principle of the concept tree construction ........................................................................ 34
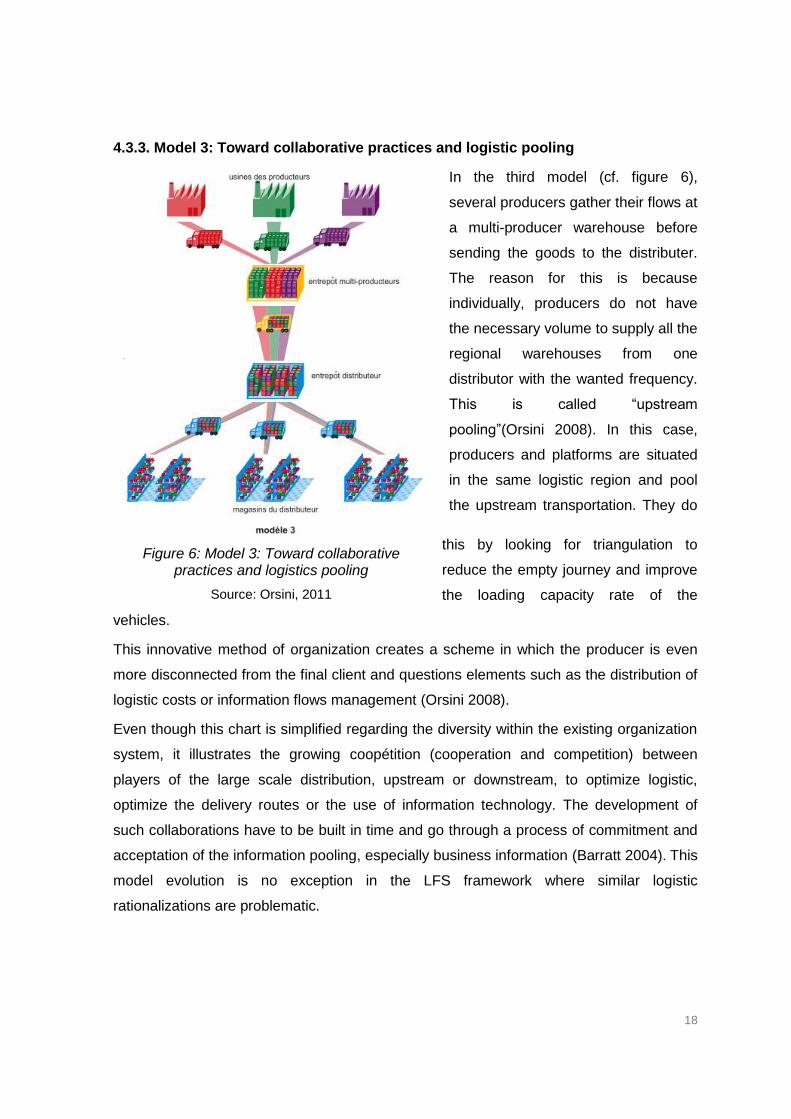
Figure 9 : Steps of the reflection process to lead toward propositions ............................................ 36
Figure 10 : Importance of retail-wholesale in the farm revenue ....................................................... 40
Figure 11 : Distribution of retail-wholesale modalities on farms marketing strategies ..................... 41
Figure 12 : Distribution retail-wholesale selling point on farms marketing strategies ...................... 41
Figure 13 : Distance farmers travel for retail-whole sale deliveries in km/week (N=18=100%) ....... 42
Figure 14: Delivery distance and selling points number .................................................................. 42
Figure 15: Distribution of logistics costs for farmers ....................................................................... 44
Figure 16: Distribution ratio logistics versus revenue in the sample interviewed (N=18) ................ 45
Figure 17 : Ratio logistics costs versus revenue (%) ....................................................................... 45
Figure 18 : Delivery distance profitability (€ gained for 100 km travelled) ....................................... 46
Figure 19: Energy intensity of the interviewed farmers (kg emitted CO₂ /100€ gained) .................. 47
Figure 20 : Energy profitability of the interviewed farmers (€ gained/kg emitted CO₂) .................... 48
Figure 21 : Distribution of logistics time management ..................................................................... 49
Figure 22 : Logistics time management for farmers ......................................................................... 49
Figure 23: Distribution of farmers depending on total logistics time for retail-wholesale (per week) 50
Figure 24 : Distribution of farmers depending on delivery time for retail-wholesale (per week) ...... 50
Figure 25 : Distribution of farmers depending on preparation time for retail-wholesale (per week) 50
Figure 26 : Distribution of farmers depending on planning time for retail-wholesale (per week) ..... 50
Figure 27 : Average points given by farmers to the different logistics collaboration interests ......... 54
Figure 28 : Logistics collaboration interests identified by farmers (Grid and content analyses) ...... 55
Figure 29 : Average points given by farmers to the different logistics collaboration obstacles ....... 60
Figure 30: Logistics collaboration obstacles identified by farmers (Content and multiple choice grid
analyses) .......................................................................................................................................... 61
1
INTRODUCTION
The famine affecting Europe after the Second World War placed productivity at the center
of farming and encouraged mechanization, industrialization and specialization of farms as
well as an industrialization of the processing sector. This is known as the green revolution
(Lampkin 2003). Quickly after, negative impacts appeared : Environmental impacts
(pollution, erosion, etc.) as well as social impacts such as isolation of farmers and a
decreasing number of farmers in the countryside (IFOAM 2010). As consequences to
these problems, especially environmental, the organic farming movement emerged in the
1980s, advocating agriculture which led to healthy products and the development of
ecologically and socially balanced farming systems (preserving soil and water quality,
reconnecting with the consumers for example) (Allard & Henning 2000). Organic farming
gained popularity after numerous food crises (bovine spongiform encephalopathy known
as mad cow disease or dioxin mainly) and the introduction of controversial new
technologies such as genetically modified organism (GMOs). The circle of organic farmers
which had been restricted, became bigger, creating major changes in the organic farming
sector (Allard & Henning 2000).
Increasing competition appeared, due to the growing amount of organic product volumes
on the market as well as the multiplication of downstream players (processers and
distributers for example) (Allard & Henning 2000). These new players often viewed the
sector differently from the initial values previously mentioned. For most of them, economic
rationalization was considered most important and tended to overshadow the social and
environmental performances. The change of scale in organic agriculture and preserving
its founding principles, especially socially and ecologically, can become a challenge in a
world where competitiveness and economic calculation are keys (Allard & Henning 2000;
Stassart & Jamar 2009).
These transformations are noticeable in the organic product marketing channels. Where
previously direct selling and short supply chains prevailed, currently, increasing amounts
of agribusiness and supermarkets disrupt the balance of the previous system and the
economic and business organization (FNAB 2014). Many of today’s major brands have
developed a competitive advantage partly thanks to their capacity to organize themselves
and adapt to the huge product variety offered by the global food supply chain. Market
globalization has led to a phenomenon of production standardization, enabling a major
economy of scale and the development of strategies facilitating optimisation of logistics
flows (Sanz & Muchnik 2011; Gonçalves 2013). This food system showed its productive

2
efficiency in a context of abundant oil resources. However more recently negative
consequences of such a dependency have been highlighted in system aspects such as
economic fragility. At the food production level, the switch to standardized and specialized
areas of production has brought questions regarding the efficiency and sustainability of
the food system (Hendrickson & Hefferman 2002; Rastoin & Ghersi 2010; Souchier 2013).
Many local players are trying to avoid the negative effects of globalization, by developing
local development-based strategies (Souchier 2013). Organic farmers were pushed to
develop, often collectively, organization at the local level to help them to defend the
elemental principles of organic farming through what is called Local Food Systems (LFS).
The increased number of local initiatives and their diversification enable new marketing
channels for local farmers (FNAB 2014).
LFS are often connected to economic, social and environmental values. However, the
performance of LFS has undergone much debate (Gonçalves 2013). Farmers involved in
LFS often see their workloads increase and often need to gather more physical material,
and financial resources than a farm involved in the classical marketing chain (Capt et al.
2011). Furthermore, some authors conclude that some LFS have lower energy efficiency
than long distribution channels and that decreasing the distances is not enough to
guarantee a better environmental sustainability (Pirog et al. 2001; Schlich & Fleissner
2005; Edward-Jonhs et al. 2008). In LFS, volumes being transported do not always
enable a high loading capacity. Transport is often done in small quantities with an
optimization level especially low at the beginning and the end of the delivery route, with a
lot of empty return. One of the main criticisms against the classical form of LFS (direct
selling, farmers market or CSA), is the lack of optimization in the supply chain
(Commissariat général au développement durable 2013; Perez-Zapico 2008).
Even though logistics is a key element in setting up a LFS, the ‘logistics’ part is often
discredited by farmers because they think they do not have enough time, skills or money
to make it evolve (Messmer 2013). Some farmers even reject the LFS because they
perceive this lack of logistic optimization as an obstacle they consider time-consuming
and unprofessional. Because of a lack of information, skills and connection to the right
networks, some farmers do not have the opportunity to develop more organized systems
or do not manage to make them economically or socially sustainable (Aubry et al. 2011).
However, even if individual strategies are the most developed, projects of a new kind are
appearing to overcome these logistic obstacles. These projects innovate in order to
increase collaboration to optimize logistics on both vertical and horizontal levels. Vertical
collaboration corresponds to contact between various types of stakeholders (farmers,

3
middlemen, consumers etc.), and horizontal collaboration refers cooperation between
actors of the same category, between farmers or between distributors for instance
(Messmer 2013; Gonçalves 2013). Nevertheless, they are not always easy to implement
in an environment of competitive logic for production. Development of tools to accompany
and strengthen these collaborations therefore seems essential (Gonçalves 2013).
Although there is room for improvement in logistics for all the marketing channels,
exploratory interviews with experts highlighted the fact that logistic rationalization is
essential to the development of the retail-wholesale sector distribution to make it more
sustainable. The retail wholesale sector is particularly affected by the logistic problems
because it concerns the delivery of a relatively low-volume of diverse products at
numerous delivery points and for a sales price close to the wholesale price.
Taking this framework into account, this study aims to evaluate to what extent
collaboration can be seen as a tool for logistic rationalization for farmers in order to
facilitate the process of sustainably localizing the organic food system in the retail-
wholesale sector.
To help address this topic the following research questions will be explored:
- What are the economic, ecological and social performances of the current
organic farmers’ logistics organization regarding their retail-wholesale outlet?
- What is inhibiting or supporting logistic collaboration among the organic
farmers involved in the local food system (LFS) (horizontal collaboration)?
- What is inhibiting or supporting logistic collaboration between organic farmers
and other stakeholders involved in LFS (vertical collaboration)?

4
To address these questions a
case study area has been
chosen in Nord Pas de Calais
region, in the North of France.
This region is a very dense
region with a population of 324
inhabitants per square
kilometers (inhab./km²) when
France have an average
population of 113 inhab./km²
(INSEE Nord Pas de Calais
2009). However farming is
important as well, as it
takes up 66% of the land.
This situation is favorable
to upkeep the traditional
direct selling, on farms or at farmers markets, even though marketing channels are
diversified (Agreste 2011). This graph illustrates the predominance of the retail outlets in
the region (cf. figure 1). However 16% of the farmers selling their products locally have at
least one retail-wholesale selling point and 7% are involved with supermarkets. Even
though it is not the majority, the development of these new outlets is important in a
perspective of opening and accessing new marketing channels for the increasing number
of organic farmers and organic products volume on the local market (Agreste 2011).
Concerning organic farming, in 2012, three French regions had less than 1% of the
available farming land grown organically. Nord-Pas de Calais region, with 0.9% of its
farming land grown organically is part of those three regions when the average in France
is 3.8%. The 286 organic farms of the region farm make up an area of 7,774 ha. This
positions the region at the 22d rank for the percentage of farming land grown organically,
the second to last in France. However, with 511 downstream actors (distributors and
processor), is positioned in the 9th rank in France (of 24). It is interesting to notice the
important number of downstream actors in the organic sector partly due to the potential
existing in the neighboring countries such as Belgium or Germany which have a
significant part of their land grown organically relatively speaking, with 4.4% and 6.2%
respectively (Agence Bio 2013).
78 %
20%
16%
9%
8%
7%
2%
117%
16 %
7 %
On farm selling
Farmers' market
Retailers
At home delivery
farmers'shop
Supermarkets
Boxes …
Retail outlets
Retail-wholesale outlets
Wholesale outlets
Distribution of the marketing channels in the LFS in the Nord-Pas de Calais (% of the farmers involved
in the different marketing channels) (A farmer can declare more than three marketing channels)
Details on modalities
depending on the type of
Figure 1: Distribution of the marketing channels in the LFS in the Nord-Pas de Calais (% of the farmers involved in the
different marketing channels)
Source: Adapted from Agreste, 2011

5
Even though Nord-Pas de Calais is not the region where the most organic farms are in
France, in the past few years a growing reflection on their marketing strategies and
logistics appeared among organic farmers in the region. During exchanges between
organic farmers, organized by the regional organic farmers’ organization, the Gabnor, they
started sharing their concerns about the efficiency of their logistics, the time they were
spending on deliveries, the economic impact of their marketing strategies as they often
have many selling points that they deliver individually. Some mentioned the interest they
could have to collaborate more, but obstacles quickly appeared preventing collaboration.
This study also aims to bring these farmers some more elements and materials to help
them move from ideas and statements toward action.
This paper is articulated in four sections. The first section explains in detail the
integrationof the work conducted within a general frame describing the problematic area in
the food system context. It shows the relevance of the problem studied and how the
specific research questions arose. The second section explains step by step the
methodology used to answer the research questions. The third section presents the
results and discusses how they are placed within the scope of reference of the initial aims.
The fourth and last section is a discussion/conclusion discussing the implication of the
results in the studied area and gives suggestions and propositions to move toward action.
This section finishes with limitations of the study and suggestions for further research.

6
PART 1: CONTEXT

7
This first section aims to explain the integration of the work conducted within a general
frame and show its relevance within the food system context. It introduce the reasons that
leaded to the objectives and research questions.
1. Organic farming, change of scale and transformation:
Exploring innovative methods of organization.
This section explains the recent evolution in organic farming that leaded to changes of
scale impacting the entire sector. The first part of this section will present organic farming
and its recent evolution, the second part gives an overview of the current organic sector
and the last one clarify the concept of ‘conventionalization’ of organic farming and how it
impacted the organic Food System.
1.1. Organic farming: evolution and changes in scale
Definitions of organic agriculture are numerous but this research will reference the
commonly cited FAO definition, “A holistic production management system that avoids the
use of synthetic fertilizers and pesticides, and genetically modified organisms, minimizes
pollution of air, soil and water, and optimizes the health and productivity of plants, animals
and people” (FAO 2007).
Organic farming has always existed along with farming. However, the first organic farmers
who called themselves that way were looking for a healthy product and the development
of an ecological and social balanced system on their farm (preserving soil and water
quality, reconnecting with the consumers, etc.). Their farms, often small sized and family
based, were relying on an approach of self-sustainability close to the European farms’
model of the 1950s (small family farms with a diversified production) (Allard & Henning
2000).
The famine affecting Europe after the Second World War changed this tradition and
placed productivity in the center of farming. This encouraged mechanization,
industrialization and specialization of farms as well as an industrialization of the
processing sector. This is known as the green revolution. Quickly after, negative impacts
appeared : Environmental impacts (pollution, erosion, etc.) as well as social impacts such
as isolation of farmers and a decreasing number of farmers in the countryside (Lampkin
2003; IFOAM 2010).
As consequences to these problems, especially environmental, a rebirth of the organic
farming movement emerged in the 1980s. The organic farming gained popularity after

8
numerous food crises (mad cow disease (bovine spongiform encephalopathy) or dioxin
mainly) and the introduction of controversial new technologies such as genetically
modified organism (GMOs). The hitherto restricted circle of organic products got bigger,
creating major changes in the organic farming sector. This evolution will be developed
further down in the paper (cf. section 1.3 of part 1) (Allard & Henning 2000).
1.2. Organic farming summarized in some numbers
At the end of 2011, data from the IFOAM (International Federation of Organic Agriculture
Movement) estimated organic agriculture covered 37.2 million of hectares of the world’s
landmass (certified or in conversion). This represents 0.9% of the agricultural land
worldwide in the 162 countries observed (Agence Bio 2013). In 11 years, between 2000
and 2011, the surface cultivated with organic farming practices has increased by 2.4
times, and the number of farms increased by 7.2 times (Agence Bio 2013). In 2012, the
European Union (EU), had 9.7 million hectares of land grown using organic agricultural
methods. This is 2.6% more than in 2011 and represents 5.4% of the agricultural land
(Agence Bio 2013).
In France in 2007, 2% of the national agricultural land was dedicated to organic farming.
This quickly rose to 3.8% in 2012, reflecting the relatively important transition movement
over the past years. 4.7% of French farms are growing organic, putting France in the 30th
position worldwide in terms of farming land dedicated to organic agriculture, and 17th
position within the EU (Agence Bio 2013).
The distribution networks1 vary in
diversity and structure depending on
the country. In France, they are
diverse but dominated by food
supermarkets and specialized organic
shops (cf. figure 2).
Worldwide consumption is becoming
more important every year. In 2011,
the market was estimated at 20.4
billion euro VAT (Value Added Taxes)
mostly situated in Germany, France,
Italy and the United Kingdom. In France, with a turnover of 4 billion euro including VAT in
1 See glossary
47 %
36 %
12 %
5 %
Hypermarkets and supermarkets Specialised shops
Direct selling
Other
Figure 2: Percentage of organic product sales in France according to distribution networks
Source: Adapted from Agence Bio, 2013

9
2012, consumption of organic products has been estimated at 2.4% of the total food
market when this was only 1.3% in 2007 (Agence Bio 2013). This increase in consumption
explains the diversification of distribution networks, especially with the arrival of large
retailers as more players got interested in this market.
The organic agriculture sector is undergoing constant evolution in both production and
distribution sectors. Regarding production, organic crop and pasture lands are increasing
while distribution networks are diversifying. These changes are intended to meet the
growing demand for organic products from consumers.
1.3. ‘Conventionalization’ of organic farming and the search for
organizational innovations
The rapid growth of the organic sector has led to change within organic farming methods.
There is increasing competition due to the growing amount of organic farmers and
available product volumes on the market as well as the multiplication of downstream
players (processers, distributers etc.). Many new players in the public and private sector
(territorial collectives, institutional organization for example) are becoming involved in the
organization of the organic sector (Allard & Henning 2000).
These new players often view the sector differently from the initial values described in
section 1.1. Economic rationalization is often considered more important and tends to
overshadow the social and environmental performances. More and more debates exist
around the development of organic farming and its future evolution. The change of scale
in organic agriculture and preserving its founding principles, especially social and
ecological, can become a challenge in a world where competitiveness and economic
calculation are keys. The risk of degrading the elemental principles increases. Some
researchers use the term ‘conventionalization’ to describe the progressive evolution of
practices which tend to push organic farming requirements to its limits. This results in a
softening of standards which potentially threatens the integrity of the organic system
(shorter crop rotations, loss of the respect for preventive approach for animal health or not
following pasture obligations for instance) (Allard & Henning 2000; Stassart & Jamar
2009).
These transformations are noticeable in the organic product marketing channels.
Previously direct selling and short supply chains prevailed, while currently increasing
amounts of agribusiness and supermarkets chains disrupt the balance and the economic
and business organization. Even if, these new players open the market and increase
demand, it also leads to a stronger pressure on prices for farmers. This pressure has lead

10
to changes in farming practices in order to cut down on production costs (farms
specialization for instance). These changes often decreases the systems’ sustainability
(FNAB 2014).
These transformations pushed some organic farmers to develop, often collectively,
innovative forms of organization enabling them to defend the elemental principles of
organic farming. The development of these initiatives at the local level are important to
secure these principles (FNAB 2014).
2. Localizing the food sector to organize and support the organic
agriculture’s change of scale.
This section explains this concept of localized food system that appears to be a solution to
support the organic agriculture’s change of scale. The terminology around local food
system and short supply chain will be clarified before highlighting how local products
became a new trend of consumption.
2.1. Short food supply chains or local food systems; trendy terms but
remains unclear
In the food sector, the question of short supply chains is central nowadays but its
definition is not well defined. The difference between short food supply chains and local
food systems remains unclear and refers to very different types of organizations
(Gonçalves 2013).
A first definition of short food supply chains has been given by former French Minister of
Farming and Fishing , Michel Barnier in 2009 as, “A way of commercializing food products
either by direct selling from producers to consumers, or by indirect selling, as long as
there is only one middleman” (Brudey & Ducrocq 2000).
This definition is very unclear as it does not take into account the notion of geographic
distance nor the middlemen’s characteristics (cooperatives, distributors or wholesalers for
example). Some see short supply chains (SSCs) with a concept of geographic proximity
and “local”, through administrative delimitation (country, county, municipality etc.), or
through an amount of kilometers (50 kilometers around the farm, 100, 150…). Others will
see SSC as a degree of commitment between the stakeholders participating in the
exchange, such as the CSA (Community Supported Agriculture) system. In CSAs, the
consumer commits financially through a payment in advance, sharing the farmer’s risks
and socially by participating in some production activities (Herault-Fournier 2010).

11
However, despite this plurality of definition, the concept of SSCs , in public debates and
academic works, always refers to distribution channels being in a geographic and
interpersonal space which is more restricted than the classical model (Gonçalves 2013).
Despite the variety of definitions used to describe SSCs, the following definition will be
used throughout this study to describe Local Food Systems (LFS): a processing or
marketing channel of food products, alternative to the dominant system, and characterized
by proximity between players of the food chain: producers, processors, distributers and
consumers. The concept of proximity does not only refer to the geographic proximity but
to its three additional dimensions, identity proximity (sharing the same values),
interpersonal proximity (enabling exchanges) and process proximity (idea of transparency)
(Herault-Fournier 2010).
2.2. Local: A new trend of consumption
The local food systems (LFS) topic emerged some years ago in the public debate as well
as in scientific research. At a global level, the interpersonal proximity is getting wider and
more complex. Many of today’s major brands have developed a competitive advantage
partly thanks to their capacity to organize themselves and adapt to the huge product
variety offered by the global supply chain. The dispersal and specialization of production
places and their disassociation with the pool of consumers explain this fact. Market
globalization has led to a phenomenon of production standardization, enabling a major
economy of scale and the development of strategies facilitating optimisation of logistic
flows. Farmers started to produce ’commodities’ rather than food and little by little lost
their place in the bargaining sector of the current food supply chain. In particular, this was
caused by by the “price leadership” competitive strategy of multinational distributors and
agribusineses (Sanz & Muchnik 2011; Gonçalves 2013).
This food system showed its productive efficiency in a context of abundant oil resources.
However more recently negative consequences of such a dependency have been
highlighted in system’s aspects such as economic fragility. At the food production level,
the switch to standardized and specialized areas of production has brought questions
regarding the efficiency of the food system. These topics include affects concerning
production areas such as loss of local biodiversity, loss of governance from the farmers,
loss of system sustainability, negative impacts on the environment, health, or even on the
local economy. Despite a ’predominance’ of the production and consumption model,
different types of alternative strategies are growing. Local players are trying to avoid the
negative effects by developing local development-based strategies (Hendrickson &
Hefferman 2002; Rastoin & Ghersi 2010; Souchier 2013).

12
For some years now, the public interest for local production has increased. In 2010, 21%
or approximately 1 in 5 French farmers sold at least a part of their products in a
geographic restricted area (Agreste 2012). The concept of proximity is becoming a key
value in the food system (Etude Xerfi 2012a). Development of LFS highly is supported by
local businesses. For example, McDonald’s is putting ‘local’ offers on the menu such as
‘Charolais’ [beef breed], the institutional catering companies, in particular SOGERES (
SODEXO chain) are starting local supply politics (Etude Xerfi 2012b). Supermarkets in
France such as Système U, E. Leclercq shops or even the Auchan chain, develop more
and more direct partnership with local farmers. The Biocoop network, the main specialized
chain in organic products in France, also has a strategy for encouraging localized supply.
Offers for local products increase and the diversity of actors involved in this new food
model increase.
As explained throughout this section, LFS have increased in response to the limitations of
the dominant global system and has a growing interest of local players. The increased
number of local initiatives and their diversification enable new marketing channels for local
farmers, particularly those in the organic sector.
3. Limits of a local food system: From viable to sustainable
Local Food Systems (LFS) are often connected to economic, social and environmental
values as discussed in the previous section. However, the importance of these elements
in relation to the performance of LFS has undergone much debate (Gonçalves 2013).
3.1. Economic and social performances
LFS’s economic performances are poorly known and still forming. One of the reasons for
this is the disparity of economic performance of the farms. However, it seems
incontestable that the farms involved in LFS create more jobs than those without local
activity (Capt et al. 2011; Souchier 2013). This is partly due to the fact that these systems
are often more labor intensive (Herault-Fournier 2010; Capt et al. 2011),
In France, LFS represent three quarters of the revenue for four out of ten farmers (except
wine-growers) (Agreste 2012). However, LFS seem to increase the need for labor to
guarantee production and distribution. Farmers often see their workloads increase and
often need to gather more physical material, and financial resources than a farm involved
in the classical marketing chain. This increase of workload is not always connected to an
adequate economic profit and asks the question of how ‘livable’ is the marketing system
chosen in the construction of LFS (Capt et al. 2011).

13
Regarding social matters, LFS are often associated with the idea of direct links between
farmers and consumers and the strengthening of the concept of solidarity between
farmers and consumers but also between farmers themselves. But here disparities also
exist. The diversity of farmers committed to LFS makes the collective organization difficult
sometimes. Many are not willing to put a lot of time or money into a collective form to
develop their activity. This make some of them excluded from the farmer cooperation
networks (Gonçalves 2013).
However, more and more collective initiatives are being supported by local authorities,
and even if farmers don’t get involved in a cooperative ways of selling their products,
awareness is growing on the importance of organizing the supply chain locally (Chiffoleau
2012).
3.2. Environmental performances: Logistics as a key element for localizing
the food system.
Food products have an environmental impact for their entire life cycle: on resources
(water, soil, air, etc.), health (human toxicity, eco-toxicity), biodiversity and climate change
(Commissariat général au développement durable 2013). The environmental performance
of food chains relies on multiple parameters. Therefore, in France, where 57 % of
greenhouse gases (GHG) come from the production sector of the food chain (IFEN 2006),
the environmental impact is not only limited to the production methods but also to
processing and distribution (supply, storage, logistic) (Berger 2013).
Combinations between LFS and virtuous environmental practices are often made, but
they need to be nuanced. Indeed, LFS are not connected to specific environmental
requirements and do not always correspond to beneficial practices for the environment
(IFOAM 2010). However, it is important to remember the high portion of organic farmers
involved in LFS. In France organic farmers represent 10% of the those involved in LFS but
this is only represent 2% of French farmers overall (Agreste 2012). To best visualize this,
a systemic and multi-criteria approach can show the contributions of organic farming to
limit the environmental impact of farming: water protection, health preservation, support of
biodiversity, fight against global warming through practices that limit the carbon impact (no
fertilizers or chemicals etc.). These are some of the ecosystem services provided by
organic farming (GABNOR 2011; IFOAM 2010).
A lot of scientific research and discussion exist today around the environmental impact of
the distribution systems in LFS, especially linked to the relation made between decreasing
energy consumption and GHG emissions. Some authors conclude that some LFS have

14
lower energy efficiency than long distribution channels. They show that local food systems
are not often the most efficient logistically speaking, especially when linked to a low
optimization. Decreasing the distances is not enough to guarantee a better environmental
sustainability (Pirog et al. 2001; Schlich & Fleissner 2005; Edward-Jonhs et al. 2008).
In short supply chains, volumes being transported don’t always enable a high loading
capacity. Transport is often done for small quantities with an optimization level especially
sensitive at the beginning and the end of the journey with a lot of empty return. Moreover,
the increasing number of refrigerated rooms on farms and travels of consumers can ask
the question of energy efficiency (Commissariat général au développement durable 2013;
Redlingshofer 2008; Perez-Zapico 2008).
J
Questioning the economic, ecological and social performances must not become an
obstacle to localizing the food system. On the contrary, these reflections need to push to
rethink the local organization of supply in order to optimize its logistics, to improve its
environmental efficiency and optimize its economic and social performances. Decreasing
costs linked to a logistic rationalization could enable a better accessibility for organic
products for a wider number of consumers.
4. Logistics: collaboration as a tool for optimization
The previous section highlighted the debate existing around LFS’ social, economic and
ecological performances. This new section first explains why logistics has an important
role to play in this debate as the low performances of LFS are mostly link to a low logistics
rationalization. It also presents collaboration as a potential tool for logistics rationalization
and shows in what way the logistics problematic is important for the retail-wholesale
sector.
4.1. Why discuss logistics?
The previous sections explained the importance of environmental impact and logistics
organization within the theme of localizing the food system. The ‘logistics’ part is often
discredited by farmers because they think they do not have enough time, skills or money
to make it evolve. However, logistics are a key element in setting up a LFS (Messmer
2013).
The food ‘supply chain’ is composed of three main components, producing, processing
and transporting. The logistics step includes planning, preparing the order and delivering
the products. One of the main criticisms against the classical form of LFS (direct selling,

15
farmers market, CSA), is the lack of optimization in the supply chain. Some farmers even
reject the LFS because they perceive this lack of logistic optimization as an obstacle they
consider time-consuming and unprofessional. Because of a lack of information, skills and
connection to the right networks, some farmers do not have the opportunity to develop
more organized systems or do not manage to make them economically or socially
sustainable (Aubry et al. 2011).
Projects of a new kind are appearing to overcome these logistic obstacles. These projects
innovate in order to increase collaboration and cooperation to optimize logistics on both
vertical and horizontal levels. Vertical collaboration corresponds to contact between
various type of stakeholders (farmers, middlemen, consumers etc.), and horizontal
collaboration refers cooperation between players of the same category (between farmers,
between distributers, etc.) (Messmer 2013; Gonçalves 2013).
4.2. Logistics: Definition and functions
Logistics is defined as the “function organizing the matter channels, the art of delivering,
at the lowest cost, the right product at the right place and at the right time” (Sohier &
Sohier 2013). This includes elements necessary for product distribution from the producer
to the consumer such as transportation, logistic services (packaging, storage, etc.) and
information flows management.
Logistics exist to organize material flows and is composed by three types of operations:
- Planning operations: Order forecast, scheduling supply and flows management.
- Administrative operations: processing and monitoring the orders and physical
flows and stock running.
- Physical operations: Preparing orders, handling, transporting and storing goods
(Sohier & Sohier 2013).
As part of food production, and more precisely marketing of the agri-products, logistic
steps could be resumed as shown in the following illustration (cf. figure 3):
Preparing the
orders (sorting,
conditioning
etc.)
- Monitoring the order - Invoicing - Payment of the order
Transportation
and handling
Scheduling
supply
FA
RM
ER
S C
US
TO
ME
R
Planning
operations
Physical operations
Storage
Physical
operations
Administrative
operations
Figure 3: Logistics steps of the food products marketing channel for the farmers
Source: Auteur, 2014

16
4.3. The general evolution of logistic strategies
The majority of consumers make their purchasing in shops owned by bigger companies.
Belonging to these companies enables shops to take advantage of communication
operations and collective purchases, but also to become part of a common logistic
network for product distribution. These logistic organizations enable business
management from production and storage to the shops. Distribution operations are getting
more complex and logistics take a central place in this scheme (Orsini 2008).
Understanding the evolution of logistic strategies used in different sectors is interesting. It
acts as a base of reflection for the development of a local, collaborative distribution
systems method of localizing the food system.
This section explains the recent evolution of logistics through three diagrams (figure
references, 4, 5 and 6). It is important to recall that these logistic strategies are the results
of an adaptation to production strategies based on specialization of production units and
delocalization of supply and production. The evolution of the distribution model goes from
a simple organization connecting the producer to its point of sale directly to more complex
organization forms in which a number of transfer points are added. The illustrations are
simplified representations of the different schemes that have been developed. However, it
is enough to understand the general evolution that happed in a majority of sectors and
understand the mechanism of it. It
becomes then possible to take
inspiration from elements that can be
applied to the development of a
sustainable LFS.
4.3.1. Model 1: Direct supply from the
producers
Originally, the shops’ supply was mainly
delivered by producers who dispatched
their products directly from their
company or warehouse to the shops as
illustrated in figure 4. Each shop had
enough space to manage the safety
Figure 4: Model 1: Direct supply from the producers
Source: Orsini, 2011

17
stock2. Having security stock allowed a low delivery frequency which was necessary to
enable the producer to optimize truck storage capacity to reduce transportation costs.
Most of the time sales contracts included delivery service to the shops (Orsini 2008).
4.3.2. Model 2 : Supply through
platforms
Passing through platforms, transit
points where goods are held to be
transferred to the point of delivery
leaded to the rationalization the whole
transportation chain and reduced the
price of transportation as illustrated in
the figure 5. Previously, producers did
not charter trucks transporting only a
few products. Now they have regional
warehouses which acts as a storage
unit allowing trucks to gather and be
filled to optimum capacity with
numerous types of products to be
delivered to the necessary shops
Downstream of those warehouses, deliveries are made from the platform with filled trucks
transporting goods from various producers. This technique is called ‘downstream pooling’
(Sohier & Sohier 2013; Orsini 2008).
This model transfers the security stock from the shops to the “distributor warehouse”,
where goods are pooled for all the shops served by a specific warehouse. Meanwhile,
storage space in shops have been converted into selling areas, reducing storage costs
(Sohier & Sohier 2013; Orsini 2008).
2 Safety stock is the stock evaluated as necessary to insure the wanted service level when the
orders to deliver overtake the production capacity.
Figure 5: Model 2: Supply through platforms Source: Orsini, 2011
18
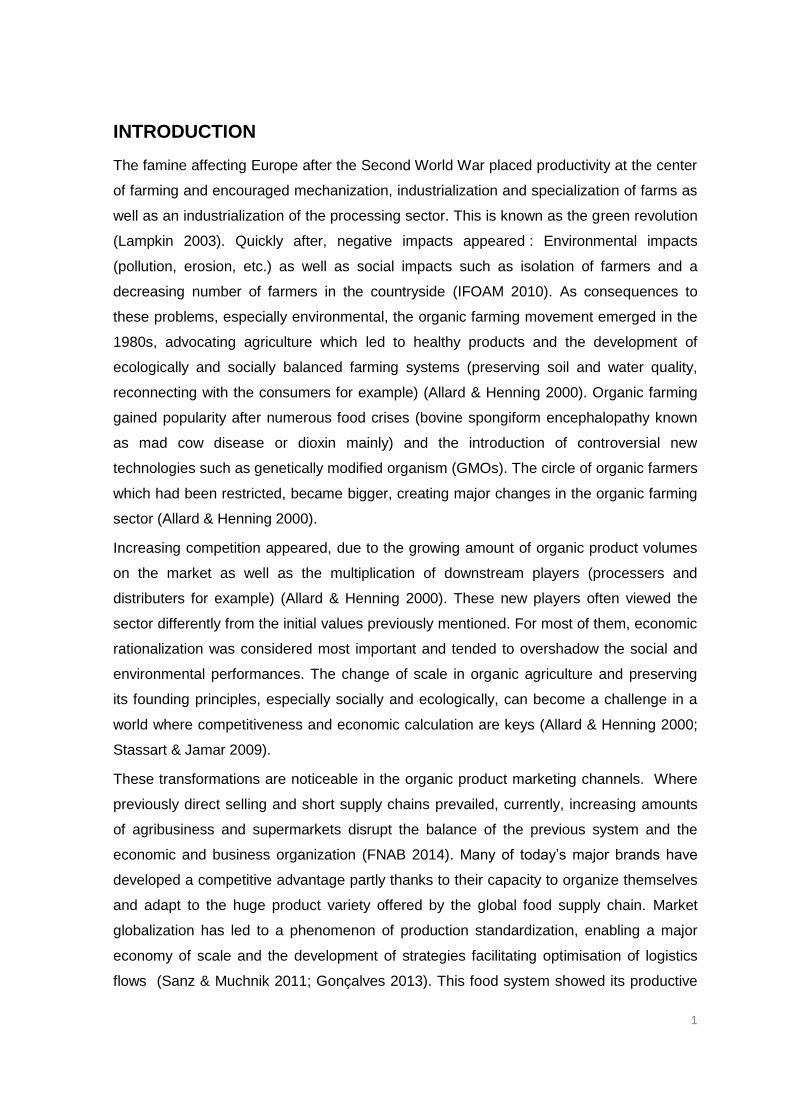
4.3.3. Model 3: Toward collaborative practices and logistic pooling
In the third model (cf. figure 6),
several producers gather their flows at
a multi-producer warehouse before
sending the goods to the distributer.
The reason for this is because
individually, producers do not have
the necessary volume to supply all the
regional warehouses from one
distributor with the wanted frequency.
This is called “upstream
pooling”(Orsini 2008). In this case,
producers and platforms are situated
in the same logistic region and pool
the upstream transportation. They do
this by looking for triangulation to
reduce the empty journey and improve
the loading capacity rate of the
vehicles.
This innovative method of organization creates a scheme in which the producer is even
more disconnected from the final client and questions elements such as the distribution of
logistic costs or information flows management (Orsini 2008).
Even though this chart is simplified regarding the diversity within the existing organization
system, it illustrates the growing coopétition (cooperation and competition) between
players of the large scale distribution, upstream or downstream, to optimize logistic,
optimize the delivery routes or the use of information technology. The development of
such collaborations have to be built in time and go through a process of commitment and
acceptation of the information pooling, especially business information (Barratt 2004). This
model evolution is no exception in the LFS framework where similar logistic
rationalizations are problematic.
Figure 6: Model 3: Toward collaborative practices and logistics pooling
Source: Orsini, 2011

19
4.4. Collaboration as a key element for LFS logistic rationalization?
Messmer (2013) identified collaboration between players as a key factor to successful
LFS. He identified the expressions of these collaborations through three main factors.
- ‘Coopetion’ which he defines as an opportunistic collaboration between various
economic players” (p.36)
- ‘Pooling’ which is connected to a “Gathering of means and “savoir faire” in order to
save more time and money” (p.36)
- Association between multiple projects or operating in networks. He identified trust
and coordination between the group members as a fundamental condition to its
success (Messmer 2013).
In practice, these collaborations can take various forms, such as development of a
network of delivery places (shops, train stations, companies etc.) to deliver/sell products,
or the pooling of well localized spaces in the logistic chain. These collaborations can also
be the pooling the labor force, or means of transportation, or compiling LFS projects or
utilizing networks which share the same values.
LFS are evolving today due to the increasing diversity of marketing channels but also from
the development of new ways of collaborating and organizing (Berger 2013). The different
diagrams about the evolution of logistic strategies seen in the previous section (cf. section
4.4), can be drawn closer to the evolution of LFS. Direct selling are following the first
model when indirect local selling which emerged in order to optimize logistics through
collaboration follow either the second or third model with more and more innovative
systems based on collaboration.
Therefore, as is the same in more classical distribution channels, in LFS decreased space
does not suppress the logistic needs. However, it is individual strategies which are being
developed even if they have limited linkages to logistic rationalization. Strategies oriented
toward vertical and horizontal collaboration are more and more recommended.
Nevertheless, they are not always easy to implement in an environment of competitive
logic for production. Development of tools to accompany and strengthen these
collaborations therefore seems essential (Gonçalves 2013).
4.5. The challenge of logistic rationalization in building a sustainable,
organic, local food system for the retail-wholesale sector
During preliminary research for this study, expert exploratory interviews put into light the
importance of logistics within retail-wholesale channels (cf. definition after the table 1)
such as specialized shops, or Non Residential Catering (NRC).The results of these
interviews are summarized in the table 1 below (cf. table 1).

20
Table 1 : Difference of impacts for an efficient logistics
depending on the marketing channel
Source: Author, 2014
Delivered volume
per delivery
point
Delivered products variety
Selling price
(Compared to average
price)
Necessity for a
rationalized logistic
Direct selling
CSA
Low High High Medium Farmers’ market
Farm shop
Indirect selling Retail-wholesale market
NRC (non
residential catering)
Low High Low High Specialized shops
Other shops
Indirect selling Wholesale market
Wholesalers
High Low Low Relatively
low Central purchasing
Although there is room for improvement, in all the different outlets, stakes of this logistic
improvement differ. The retail wholesale sector is particularly affected by the logistic
problems because it concerns a relatively low-volume of diverse products at numerous
delivery points and for a sales price close to the wholesale price (cf. table 1).
Challenges of a logistic optimization in the retail-wholesale distribution channel appear all
the more so as in a perspective of making this outlet durable and also diversify the local
organic outlets.
DEFINITION OF THE RETAIL-WHOLESALE USED IN THIS STUDY:
- Small volumes of multiple products ordered to various delivery points.
- A purchase price close to that of the wholesale market
- A high level of service (including delivery)

21
5. Research questions
Localizing the organic food system appears as a key element for sustaining the local
development of organic agriculture. LFS are often attributed to various advantages but,
more and more food system players, supported by the academic world, questioned LFS
economic, ecological and social performances, mainly due to the low logistic
rationalization. This question around logistic rationalization has been identified as
essential to the development of the retail-wholesale sector distribution to make it more
sustainable. Logistic collaboration has been identified as a key element for the logistic
optimization in the LFS. Numerous innovative projects are developing around these
collaborations. It seems important to better understand the dynamic around these
collaborations to better accompany or reinforce them as well as support the development
of existing tools.
The objective of this study is the following:
Collaboration as a tool for logistic rationalization for farmers in order to facilitate
the process of sustainably localizing the organic food system in the retail-
wholesale sector
To help address this topic the following research questions will be explored:
- What are the economic, ecological and social performances of the current
organic farmers’ logistics organization regarding their retail-wholesale outlet?
- What is inhibiting or supporting logistic collaboration among the organic
farmers involved in the local food system (LFS) (horizontal collaboration)?
- What is inhibiting or supporting logistic collaboration between organic farmers
and other stakeholders involved in LFS (vertical collaboration)?

22
PART 2: MATERIALS AND METHODS

23
In order to answer the research questions, a methodology has been set up and has been
refined throughout the research. This chapter explains the chosen methodology and details
step by step the process of it. First the exploratory phase is explained, and then the
methodology developed to evaluate the farmers’ logistics performances is described followed
by the methodology to identify the inhibiting and supporting factor of logistics collaboration.
The final part explains the methods used to help moving toward action helping to move from
the current situation as identified, to a potential wanted situation.
1. Exploratory phase
Before data collection begins, it is important to understand the context in which the research
is done in order to check the validity of the topic addressed and refine the research questions
(Quivy & Van Campenhoudt 1995). This exploratory phase has been elemental to this
research. It is composed of a reading phase and exploratory interviews. The reading phase
intends to test the quality of the research subjects, while the interviews compare the
theoretical background found through the literature review with the reality of the field
identified by key actors.
1.1. Literature review
Every research project is part of a bigger picture. It is important to get as much information
as possible on what is already known about the topic of interest. A reading phase is
necessary to situate the research in relation to other recognized scientific works to gain a
certain ‘external validity’ (Quivy & Van Campenhoudt 1995).
Scientific articles, books, theses or grey papers has been chosen and read in such a way
that it is as representative as possible on what has been published on the subject. They have
been chosen so that diversified approaches are presented and different viewpoints explored.
In this way, research has been completed on localizing the economy and the food system,
short supply chains and their limits, logistics and more specifically, the logistics linked to local
food systems. The understanding of the collaboration has been deepened. Finally, the role of
organic farming within this context has been developed, in order to understand the link
between organic farming, local food systems and logistics.
1.2. Exploratory interviews
Once the research topic was clarified, exploratory interviews helped to test the topic’s
relevance and rectify its frame. The interviews also highlight facets of the research that may
have been neglected during the literature review (Quivy & Van Campenhoudt 1995).

24
Seven expert interviews have been conducted. As evident in the table below (Cf. table 2), the
variety of profiles brought expertise on various dimensions of the themes of organic farming
and logistics collaboration.
Table 2: Experts interviewed during the exploratory phase of the study
Source: Author, 2014
Affiliation of the interviewee Field of Expertise
Researcher at IFSTTAR (French Institute of the Transportation, Planning and Network Sciences and Technology)
Short supply chains logistics
Researcher in the organization “Virage Energie Nord-Pas de Calais”
Energy transition- Food energy costs
Researcher/ Professor in logistics management at Lille University
Transportation and logistics management
Project manager on the organic sector organization in Gabnor (Nord Pas de Calais organic farmers organization)
Organization of the organic sector in the region
FNAB (National Federation of Organic Agriculture)
Organic sector localization
“Saveurs et saisons” organic shop manager Logistics management
Project manager of “Livicote” (project of mobility service)
Transportation and logistics management
In appendix the detail of the projects and studies each of them carries that are linked with
this study (See appendix 1).
These meetings have been led in a semi-structured way. Therefore, a nonbiased position
and active listening have been utilized, although when the subject drifted, interviewees were
brought back to the topic in question.
These interviews enabled a better grasp of the logistics dimension of the research and
highlighted the specificity of the retail-wholesale sector’s relationship to logistics (see part 1
section 4.5) and the importance of targeting research on this specific distribution channel as
no literature is yet available on the topic.
1.3. Setting up a ‘follow-up body’
Some of the expert interviewed during the exploratory interviews showed a high interest for
this topic research which lead to the creation of a ‘follow-up body’ for the study. This follow
up body has been gathered on three separate occasions so they could take part in shaping

25
how the research progressed. They brought their viewpoints, their knowledge and expertise
on certain facets of the research. This follow-up body enabled, on the one hand, to approve
the evolution of the study, the associated methodology and the accuracy of the analysis
made, but also to guarantee the consistency of the research with the needs and expectation
of the local actors.
The follow-up body is composed of four members who have expertise in various fields
interesting to the progress of the study: An expert in organization of the organic sector in the
case study area, an expert in transportation and logistics management, an expert in LFS
logistics, and an expert in energy transition and food energy costs (cf. table 2 and appendix 2
for more information on each of them). Each of the four members was also interviewed
during preliminary explorations and as mentioned was gathered three times during the study.
First at the beginning, to discuss and approve the methodology chosen, then a second time
to discuss and approve the choice of indicators and finally near the end, to discuss the first
results, the propositions and possible relevant actions regarding those results.
1.4. Research questions
The information gathered during the exploratory phase led to the development of research
questions and also a methodology to answer those questions. As a reminder, the objective of
this study is the following: Collaboration as a tool for logistics rationalization for farmers in
order to facilitate the process of sustainably localizing the organic food system in the retail-
wholesale sector. To help address this topic the following research questions will be
explored:
- What are the economic, ecological and social performances of the current organic
farmers’ logistics regarding their retail-wholesale outlet?
- What is inhibiting or supporting logistics collaboration among the organic farmers
involved in the local food system (LFS) (Horizontal collaboration)?
- What is inhibiting or supporting logistics collaboration between organic farmers and
other stakeholders involved in LFS (Vertical collaboration)? (cf. part 1 section 5)
Two main axes to the research appear from those research questions and will structure the
research in two parts:
- A first axis is the evaluation of economic, ecological and social performances of
the logistics of the local food system concerning the organic retail-wholesale sector.

26
- A second axis is the identification of the supporting and inhibiting factors for
logistics collaboration.
2. Farmers’ logistics performance evaluation
2.1. Indicators
In order to evaluate the farmers’ logistics performances, it has been chosen to do a
quantitative data analysis as the performances evaluation is mainly based on quantitative
data of the different farmers. For this quantitative analysis, appropriate indicators have been
identified. To ensure that all data necessary to complete the indicator calculations were
collected, this research identified each indicator prior to the data collection phase.
Indicators corresponding to an economic approach, but also those relating to ecological and
social indicators have been chosen. The reflection around sustainable logistics cannot be
restrained to single cost containment. It has to go further where cost rationalization offers a
scheme that brings together economic, social and ecological coherence. The approach
necessary is multidimensional and needs to rely on indicators corresponding to these
different dimensions.
The table 3 below highlights the indicators used within this study and explains why they have
been chosen. The three columns to the far right also show the nature of the performance to
which each is linked (economic, ecological and social) (cf. table 3).

27
Table 3 : Chosen indicators for the evaluation of logistics performances for the interviewed farmers
Source: Author, 2014
INDICATOR UNIT OF
MEASURE
INDICATOR’S DESCRIPTION
Eco
no
mic
So
cia
l
Eco
log
ical
Delivery distance to
retail-wholesale Km/week
Distance travelled per farmer on average. Enable the calculation of a variety of other economic, ecological and social indicators.
X X X
Revenue from retail-wholesale
% of the total
revenue
Determines the importance of retail-wholesale outlets in the marketing strategy of the farm.
X
Weekly revenue from retail-wholesale
€/week Enables the calculation of the other economic and ecological indicators.
X
Fuel consumption for retail-wholesale
deliveries
l/week Enables the calculation of economic and ecological indicators. X X
Planning
h/week Enables a social understanding of how the logistics is linked to the amount of labor among farmers that relates to logistics (planning, preparation and delivery).
X
Order preparation
X
Deliveries X
Total time on logistics
X
Fuel
€/week Enables an economic understanding of the details and costs associated with the current logistics.
X
Planning labor X
Preparation labor
X
Delivery labor X
Total delivery €/week Economic cost of delivery in its totality (labor and fuel) X
Total logistics costs (TLC)
€/week Highlights the cost caused by logistics (planning, preparation, delivery)
X
Delivery distance
profitability
€ gained / 100 km
Show the profitability of the distance travelled Example : 100 km of travel brings in x € of revenue
X
The cost of logistics
compared to revenue
%
Highlights the economic importance of logistics Example : 1 euro of revenue corresponds to x euro of logistics costs
X
GHG emissions CO₂ Kg/
week
Shows the ecological impact of the logistics Example : x Kg of CO2 released through logistics on
average per farmer per week
X
Energy intensity Kg CO₂
emitted / € gained
- Illustrates the ecological impact of the economic activity - Shows the dependence of the revenue for energy Example: Each euro gained causes a GHG emission of x kg
of CO₂.
X X
Energy profitability
€ gained / Kg CO² emitted
- Shows the economic profitability of the ecological impact - Shows the energy cost dependence of the revenue Example: Each kilo of emitted CO₂ corresponds to a gain of x
euro.
X X

28
The details of the calculations for each of these indicators are situated in the appendix 2 (Cf.
appendix 2).
The calculation of some indicators requires determining constants. It is the case for the
evaluation of labor costs. It has been chosen to evaluate this cost up to the French minimum
wage as detailed in the table thereafter. The fuel price as well as the equivalence between
CO₂ emissions per consumed fuel liter has also been determined (cf. table 4).
Table 4 : Constants chosen for the study Source: Author, 2014
Little data exists concerning the performance of logistics in the retail-wholesale sector.
Therefore, the construction and the choice of the indicators in table 3 could not be based on
an existing methodology. Each one of these indicators has been determined after evaluating
existing literature and consulting members of the follow-up body.
Social and economic indicators have been chosen with the help of technical advisers from
Gabnor bringing their expertise from the field and knowledge about challenges farmers face.
The expert on the LFS logistics (IFSTAAR) also brought her expertise regarding performance
evaluation, particularly economic. Ecological indicators have been chosen together with the
expert on energy transition and energy costs food, from Virage Energie (cf. table 2 for more
information in these experts).
Finally the relevance of all the indicators have been discussed and approved during a
meeting of the follow-up body before the collecting data phase, at the end of May 2014.
2.2. Determining the farmer interview sample
The study area is situated in the Nord Pas de Calais region in France and the study concerns
the organic sector while focused on the retail-wholesale outlet. Therefore in order to answer
CONSTANTS VALUE REFERENCE
Labor force cost 10 €/h
Cost of labor evaluated on the minimum wage in France (In 2014 = 9.53€ gross/h) http://travail-emploi.gouv.fr/informations-pratiques,89/fiches-pratiques,91/remuneration,113/le-smic,1027.html
Fuel cost Diesel 1.31 €/l Price on June 28, 2014
http://www.prix-carburants.gouv.fr/ Gasoline 1.55 €/l
GHG emissions
Diesel 2.67 kg CO²/l
http://www.futura-sciences.com/magazines/environnement/infos/qr/d/automobile-carburant-emet-plus-co2-essence-gasoil-947/
Gasoline 2.28 kg CO²/l

29
the research questions it has been decided to interview farmers meeting all of the following
three criteria:
- Farmers from the Nord-Pas de Calais
- Organic farmers (or transitioning)
- Farmers who rely on retail-wholesale as a big part of their farm marketing strategy.
The retail-wholesale needs to involve its own organization, especially for the distribution.
This way farmers who have some marginal retail-wholesale but integrated in logistics of other
marketing channels such as direct selling, have not been included in the study (Example :
Delivery for some specialized organic shops periodically, integrated in the CSA delivery
route).
A consultation with the adviser of Gabnor, the organic farmers’ organization in the region
helped to identify twenty eight farmers meeting the three criteria out of 286 organic farms in
the region. It has been aimed to interview all of them. Twenty-one farmers agreed to sit for
the interview. It was found that three of the 21farmers interviewed happened to not meet all
of the specified criteria. Therefore, at the end twenty one farmers were interviewed but only
eighteen were processed for the quantitative analysis, or approximately 72% of the eligible
population (18 on 25).
It is important to notice that, even though this study affect a limited number of farmers, it is
not less important in the global effort of developing the organic sector. The diversification and
organization of distribution channels are necessary to make the organic sector more durable
and to accompany its evolution in a context of increasing demand.
2.3. Developing the quantitative questionnaire
A questionnaire enables the researcher to collect quantitative data during the interviews. It
has been created for this research in order to obtain the information required to calculate
applicable indicators. It leaded to:
- Obtain general information of the farm (revenue, selling points and their nature, type
of production)
- Obtain details on the logistics for the retail-wholesale outlets on all logistics steps:
Planning operations : order anticipation and order management
Physical operations : storage, order preparation, delivery and handling
Administrative operations : delivery monitoring and invoicing
The final questionnaire is composed of closed and semi-open questions (Quivy & Van
Campenhoudt 1995) and can be found in the appendix (cf. appendix 3). The variable
identified as essential to calculate the chosen indicator has been identified in order to be

30
integrated in the questionnaire. In appendix are the details of these variables along with the
details on how they have been collected in a practical way (cf. appendix 4).
3. Identifying inhibiting and supporting factors of logistics
collaboration
3.1. Determining the system actors to interview
Logistics collaboration relates to horizontal collaboration between farmers but also vertical
collaboration between different actors of the food system. This way, those interviewed for this
research is not limited to farmers, but also includes other stakeholders involved in the retail-
wholesale local organic food system. As previously discussed, the farmers interviewed were
chosen for the evaluation of performances (Cf. section 2.2 of this part). To deepen the study
and to get a more holistic view on the organization and problems related to the sector locally,
some key actors of the local organic food sector for retail-wholesale in the region have also
been interviewed. These actors have been identified through interviews with farmers and the
advisers from the organic agriculture organization in the area using the method of snowball
sampling (Quivy & Van Campenhoudt 1995). Eight local system stakeholders have been
interviewed. Each brought elements and viewpoints from different sectors that rely on
logistics collaboration as seen in the table below (Cf. table5).
Table 5 : Identified and interviewed key actors of the studied LFS (Source: Author, 2014)
Name of institution Type of entities Role of the interviewee within the entity
Norabio Organic farmers cooperative
Assignment manager for shops supply-farmers planner
Vice-president (organic farmer)
Vert’Tige Specialized organic shop Manager (organic farmer)
2 sous de table Restaurant 100% organic In charge of supply management
CEB (Ecological and Organic Center)
Wholesaler for organic products non-perishable
Manager
SCIC of transportation
Cooperative Society of Collective Interests
Driver and manager
Terre d’Opale/ Anges Gardiens
Platform of production and diffusion of organic/local
products
Manager (Organic farmer)
Croc La Vie Institutional catering for early
childhood Charter member and manager

31
The details of the table can be found in the appendix with further information on the reason
why these stakeholders have been chosen (cf. appendix 5).
3.2. Interview guides for qualitative data collection
Interview guides have been composed in order to guide the exchange toward the
identification of supporting and inhibiting factors for logistics collaboration. Open questions
orientate the discussion and reflection of the interviewed person toward those questions.
These interview guides are semi-structured in order to avoid digressing from the objectives of
the study and allow freedom to explain and explore some perceptions in greater depth.
However the interviews stay dynamic and are based on active listening. All the interviews
have been conducted between June and August 2014.
3.2.1. Interview guide for farmers
The questionnaire for farmers (quantitative part of the interview) is followed by an interview
guide in order to collect the necessary qualitative data, data leading to answer the second
and third research questions. The interview guide is built in such a way to:
- Identify the point of view of farmers on their logistics, their interpretation of the
progress margin and possible evolution.
- Gather the experiences of collaborations and the farmers’ perception, interpretation
and perspective on them.
- Gather the farmers’ opinions on the interests and obstacles farmers identify
regarding logistics collaboration and collective organization.
This interview guide can be found in the appendix (cf. appendix 6).
A maximum of information is gathered in an open way. However, the interview ends with the
presentation of grid showing a list of interests and obstacles for logistics collaboration
identified during the exploratory phase and re-evaluated during the first interviews. Refer to
section 3.3.5 of this material and methods part.
3.2.2. Interview guide for other actors
Interviews with other system stakeholders allowed completing the approach. They enable the
researcher to get a broader view on the situation and to improve the understanding of the
obstacles and opportunities and to broaden the possible solutions.
Two kinds of actors interviewed can be distinguished:
- Downstream commercial actors: Institutional catering, commercial catering,
specialized shops and wholesaler.

32
- Actors involved in a collaboration scheme: Transportation SCIC (Cooperative
Society for Collective Interests), platform of production and distribution, cooperatives.
The objective is to gather, for the downstream key actors, information about the organization
of supply particularly for local products, and their points of view on questions relating to local
supply in the region (room for transition, difficulties, and identified challenges). For the other
actors, the objective is to gather their experiences with logistics collaboration and their
perspective on it (difficulties (past or present), evolution (past and future), and room for
maneuver).
The interviews are carried out in a flexible way but keep in mind the key elements through
the succinct interview guide. The interview guide for stakeholders can be found in the
appendix (cf. appendix 7).
3.3. Qualitative data analysis: Analysis of content
The method of “content analysis”
has been chosen for the analysis of
the qualitative data. This analysis
involves transcribing the audio
recorded information to then coding
the information in order to organize
and analyze it (Krippendorff 2003).
The content analysis is composed of
four steps detailed hereafter (cf.
figure 7).
3.3.1. Verbatim transcription of the interviews
The content of all the interviews was recorded with a handheld recorder. Then the
information was then transcribed. This text is called verbatim and is equivalent to the raw
data of the study. The data identified as irrelevant to the topic were not transcribed in order to
optimize time.
3.3.2. Code of the verbatim
Each idea of the transcribed text, verbatim, is then matched with a code. The ‘idea’ is
therefore the ‘semantic analysis unit’ that has been chosen for this study. That way, the text
Code the transcription
Concept tree
Descriptive analysis
Verbatim transcription of the interviews
Figure 7 : The steps of the content analysis
Source: Figure realized based on Krippendorff, 2003

33
is cut according to the meaning of the section, the ‘key idea’ and not taken out of context.
The code unit can be few sentences or some words, evoking an idea.
Example:
“There is nothing as good as direct contact with the client. If there is something is wrong, there is immediate exchange and feedback”
Code: Loss of contact with the client
“I don’t see myself collaborating with someone who has the same product as me”
Code: Fear of competition
Each part of the text can be matched to multiple ideas and therefore to multiple codes. Those
codes have not been chosen before the collecting data phase: this is called “open coding”
(Andreani & Conchon 2003).
3.3.3. Concept tree
Once the verbatim is coded, there is a phase more analytic during which codes are grouped
in categories.
- First similar ideas which have been matched with different codes are matched to
one overarching code
Example: ‘lack of punctuality’» and ‘Bad handling of the goods’ are gathered under ‘Bad
performances from the partner’
- Then, the different codes are organized and grouped in more general
categories. These categories can also be gathered under a wider theme. This way, a
concept tree is formed and represents the results of the work. These concepts help to
answer the objectives of the qualitative part of the study as illustrated in the figure hereafter
(cf. figure 8). Some categories or themes can be codes themselves because they are already
general. The construction of this tree is progressive and gradual and is a process that
developed throughout data collection (Touboul 2013; Andreani & Conchon 2003). The tree is
built with the codes from the farmers’ interviews and from the other system stakeholders of
the sector.

34
Each theme, category and code are then explained in a concise way and illustrated with
relevant quotes. Each theme, category or code is considered a ‘concept’ which makes up
the concept tree (Touboul 2013).
3.3.4. Descriptive analysis
It is then interesting to see the occurrence of each concept in the various verbatim. This
descriptive analysis is only done on the farmers’ interviews. Only farmers’ interviews have
been kept for this descriptive analysis in order to have results on a relatively homogeneous
population, a population that has been interviewed with the same interview guide enabling a
valid comparison.
Two types of concepts frequencies have been identified as interesting to study:
1) The percentage of interviewed farmers who mentioned the concept (category or sub
category) at least once during the interview. This data grasps the importance of the concept
in the studied population.
It is calculated this way:
Example: 62% farmers have spontaneously mentioned ‘isolation’ as an obstacle for logistics collaboration when only 19% of them spontaneously mentioned ‘Difficulty to find a fair system’.
Code 1 Code 9
Code 12 Code 11
Code 5
Code 10
Code 4 Code
13 Code 8
Code 7 Code 2
Category 1 Category 3 Category 2 (Code 3) Category 4
THEME 1 THEME 2 (Code 6)
VERBATIM
Figure 8 : Principle of the concept tree construction
Source: Figure created based on Touboul, 2013

35
2) The recurrence of the concept in the verbatim for the farmers who mention it. This
highlights the importance of some ideas in the discussion when mentioned multiple times
throughout the interview.
It is calculated this way: )
The higher the ratio, the more the idea is recurrent and important for the farmers mentioning
it. The ratio varies between 1 if the concept is mentioned once during the discussion, and 2.5
(in this study it does not go over 2.5).
Example: The concept ‘Bad handling of the goods by partners’ has a recurrence ratio of 2.5. On average each person who mentioned the idea mentioned it 2.5 times during the interview. This shows the importance of this obstacle for the farmers mentioning it.
These frequencies are calculated on an individual basis and provide information but do not
have real statistic validity.
3.3.5. Analysis of the multiple choice grid
Each farmer interviewed fills in two grids (one for the interests and one for the obstacles to
logistics collaboration) numbering from 1 to 3 (one being the most important), the interests
and obstacles that they identify as most important for logistics collaboration. These grids can
be found in appendix (cf. appendix 8). The analysis of the multiple choice grid is composed
using two approaches:
1) The first does not take into account the order given (1 to 3) but rather the simple
mention of the interests of obstacles as part of the three major ones. That way it can
be seen the percentage of farmers who position various interests and obstacles as
major.
Example: 85% of the farmers positioned ‘lack of confidence’ as one of the three major
obstacles to logistics collaboration.
2) The second approach takes into account the order of importance given by the
farmers. A system of points is set up :
a. For position 1 (the most important) = 3 points
b. For position 2 = 2 points
c. For position 3 (the least important of the three) = 1 point
Each interest and obstacle receives a sum of points (sum of all the points that have been
assigned to it) which weigh the obstacle or interest with the importance assigned by the
farmers.
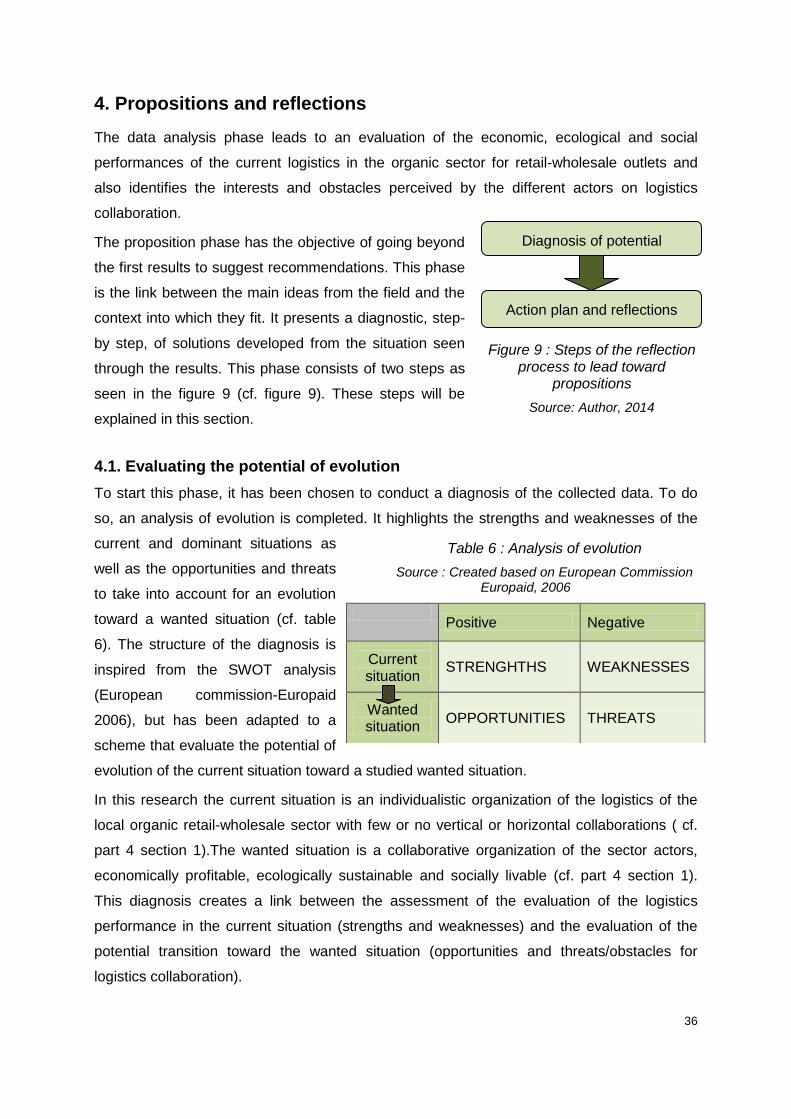
36
Diagnosis of potential
evolution
Action plan and reflections
4. Propositions and reflections
The data analysis phase leads to an evaluation of the economic, ecological and social
performances of the current logistics in the organic sector for retail-wholesale outlets and
also identifies the interests and obstacles perceived by the different actors on logistics
collaboration.
The proposition phase has the objective of going beyond
the first results to suggest recommendations. This phase
is the link between the main ideas from the field and the
context into which they fit. It presents a diagnostic, step-
by step, of solutions developed from the situation seen
through the results. This phase consists of two steps as
seen in the figure 9 (cf. figure 9). These steps will be
explained in this section.
4.1. Evaluating the potential of evolution
To start this phase, it has been chosen to conduct a diagnosis of the collected data. To do
so, an analysis of evolution is completed. It highlights the strengths and weaknesses of the
current and dominant situations as
well as the opportunities and threats
to take into account for an evolution
toward a wanted situation (cf. table
6). The structure of the diagnosis is
inspired from the SWOT analysis
(European commission-Europaid
2006), but has been adapted to a
scheme that evaluate the potential of
evolution of the current situation toward a studied wanted situation.
In this research the current situation is an individualistic organization of the logistics of the
local organic retail-wholesale sector with few or no vertical or horizontal collaborations ( cf.
part 4 section 1).The wanted situation is a collaborative organization of the sector actors,
economically profitable, ecologically sustainable and socially livable (cf. part 4 section 1).
This diagnosis creates a link between the assessment of the evaluation of the logistics
performance in the current situation (strengths and weaknesses) and the evaluation of the
potential transition toward the wanted situation (opportunities and threats/obstacles for
logistics collaboration).
Table 6 : Analysis of evolution
Source : Created based on European Commission Europaid, 2006
Positive Negative
Current situation
STRENGHTHS
WEAKNESSES
Wanted situation
OPPORTUNITIES
THREATS
Figure 9 : Steps of the reflection process to lead toward
propositions
Source: Author, 2014

37
This leads to rely on the weaknesses of the current situation to justify the evolution toward
the wanted situation. The means put to make the situation evolve need to rely on the
potential of the opportunities but as well to take into account the identified threats. All this is
done recognizing the strengths of the current system and trying to keep them in the new one.
1) Strengths are the positive points of the current situation
2) Weaknesses are the negative points of the current situation. Weaknesses push the
situation to evolve toward a different situation: the wanted situation.
3) Opportunities are the elements that have been identified as being positive aspects
and on which future actions and plans can be built. Opportunities should be taken
advantage of.
4) Threats are the difficulties, the obstacles that can inhibit the evolution of the situation
toward the wanted situation. In this case preventing evolution toward a collaborative
logistics of the organic sector for retail-wholesalers in the region. Threats are
essential to take into account during the development of projects and action plans
(European commission-Europaid 2006).
Once the diagnosis is completed, it is through the relationships between the factors of the
diagnosis that the ideas of propositions and action plans appear as illustrated in table 7.
4.2. Future and plan of action
Once the diagnostic of evolution is clear, complete and validated, ideas of action plans and
strategies are identified, suggested and discussed. Propositions are described in a way that
makes concrete application possible. Then a discussion is carried out on the study and its
limits. These reflections can be the starting point for further studies and complementary
discussion.
Table 7 : Relations between the factors of the diagnosis of evolution
Source: adapted from European Commission, 2006
Current dominant situation
List of strengths List of weaknesses
How to keep the strengths of the
current situation?
How to take advantage of the weaknesses of the current situation?
Wanted situation
List of opportunities
How to maximize the opportunities?
How to take advantage of the opportunities to
encourage situation evolution while
keeping the strengths of the current system?
How to correct the weaknesses of the current situation by
taking advantage of the opportunities related to the change of situation?
List of threats
How to minimize the
threats?
How to reduce the threats during
evolution of the situation while preserving the strengths of the
current situation?
How to use the weaknesses of the
current system to lift the threats and obstacles
during evolution?

38
PART 3: RESULTS AND DISCUSSION

39
This section presents the results and discussion relating to the data collected for this
research and is divided in two parts. Each corresponds to one axis of the study as explained
in the methodology (Cf. section 1.4 of the materials and methods):
- The first axis of the study is the evaluation of the economic, ecological and social
performances of logistics in the local food system concerning the organic retail-
wholesale sector. (Addresses research question 1)
- The second axis concerns the identification of the supporting and inhibiting factors for
logistics collaboration. This will be presented through exploring the interests and
obstacles perceived by farmers and other organic retail-wholesale actors involved in
logistics collaboration as well as the possible forms that logistics collaboration can
take. (Addresses research question 2 and 3)

40
0%
20%
40%
60%
80%
100%
1 2 3 4 5 6 7 8 9 10 11 12 13 14 15 16 17 18 Farmers Retail-wholesale revenue (%) Revenue without retail-wholesale (%)
1. Evaluation of logistics performances
In this section, results concerning the current farmers’ logistics are presented and discussed.
The lack of existing references regarding farmers’ logistics performances made it difficult for
the results to be compared with a frame of reference. However, this study fit into a process of
reference building and therefore the comparison and analysis of farmers amongst
themselves is completed.
1.1. General characteristics of the interviewees
Of the 21 farmers interviewed, the quantitative data are based on only the 18 fitting to the
sample characteristics as outlined in the methodology (cf. part 2, section 2.2). In order to
keep their anonymity, numbers have been attributed to farmers. For improved readability,
they have been grouped per production type as seen in the following table (cf. table 8). This
allows the reader to easily recognize obvious differences or similarities between production
types.
Table 8 : Interviewed farmers brought to anonymity and grouped by products
Source: Author, 2014
On average for the sample interviewed, the revenue for retail-wholesale of the farms is 46%
of the total revenue. This varies much depending on the farm, going from 5% to 100% of the
revenue as we can see in the following graph (cf. figure 10). However, it is important to
remember that for all the farmers, this distribution channel leads to a distinct method of
logistics organization, particularly concerning delivery.
Production type (Color coding used in some
charts)
Vegetable Orchards Dairy
products Meat
products Bread and
grains
Corresponding number in the graphs
N° 1 to 8 N° 9 to
12 N° 13 to
16 N° 17 N° 18
Figure 10 : Importance of retail-wholesale in the farm revenue
Source: author, 2014

41
0
1
2
3
4
5
6
7
8
1 2 3 4 5 6 7 8 9 10 11 12 13 14 15 16 17 18
Modalit
y num
ber
Farmers
Retail-wholesale modalities Other modalities
The marketing channel on
average corresponds to 2.6
types of selling modalities3 for
retail-wholesale with 5.3
modalities total average on
the farm (cf. figure 11). This
illustrates the high variety of
distribution channels per farm
as well as in retail-wholesale.
This brings complexity to the
organization as each modality
has specific constraints.
There is an average 20.4
different selling points per farm. Half of them (10.1 per farm) relate to retail-wholesale with
differences depending on the farms as the figure 12 shows (cf. figure 12). The number of
selling points seems to be correlated
to the type of production. Farmers
producing diversified vegetables
(n°1 to 8) have an average of 7.25
selling points and 4.5 of them for
retail-wholesale when the farmers in
arboriculture (n° 9 to 12) have an
average of 19 selling points for 10 in
retail-wholesale. The farmers
producing dairy products (n°13 to
16) have a significant number of
selling points with an average of 51,
mainly caused by one farm having
120 selling points. This variation in the number of selling points can be partly explained by
the products sold. Cheese for example is a value added product with a lower stock rotation
than vegetables for instance. It is then necessary to have more selling points for cheese as
lower amounts are sold at each point.
3 Homogeneous class of selling points (for example institutional catering, shops or farmers’ shop in
retail-wholesale sector)
0
20
40
60
80
100
120
140
1 2 3 4 5 6 7 8 9 10 11 12 13 14 15 16 17 18
Selli
ng
po
int
nu
mb
er
Farmers
Distribution retail-wholesale selling point on farms marketing strategies
Other selling points
Retail-wholesale selling points
Figure 11 : Distribution of retail-wholesale modalities on farms marketing strategies
Source: Author, 2014
Figure 12 : Distribution retail-wholesale selling point on farms marketing strategies
Source: Author, 2014

42
However overall, the high number of delivery points in the sample illustrates the
characteristics given for retail-wholesale (cf. part 1, section 4.5). The high number of selling
points and the variety of modalities reveal the corresponding logistics organization
challenges.
The delivery distance farmers travel for retail-
wholesale ranges between 60 and 1500
kilometers per week for an average of 293.
While almost half of the farmers travel less
than 200 km per week (8 on 18), 4 travel more
than 300 as shown in the figure 13 (cf. figure
13).
It is important to notice that the delivery
distance does not always correlate with a larger
number of selling points as illustrated in the
figure 14 (cf. figure 14). It is highly dependent
on the logistics organization of each farmer’s system and its unique characteristics such as
geographic situation of
the farm and products
delivered. Some
products need to be
delivered fresh and
therefore more frequently
than others such as leafy
and fragile vegetables
(farmers n°1 to 8) or
bread (farmer n°18).
Farmer 18 is a good
example of this and
produces bread
requireingalmost daily
delivery to 20 selling points. Creating an efficient logistics organization is then important
because it directly affects the revenue of the farm and the labor hours concerning logistics.
0
5
10
15
20
25
30
35
0
200
400
600
800
1000
1200
1400
1600
1800
1 2 3 4 5 6 7 8 9 10 11 12 13 14 15 16 17 18
Re
tail-wo
lesale
sellin
g po
ints n
um
be
r
De
live
ry d
ista
nce
(km
/we
ek)
Farmers
Retail-wholesale delivery distance
Retail-wholesale selling points
8
6
4 <200 km
Between 200 and 300 km
> 300 km
Figure 14 : Distance farmers travel for retail-whole sale deliveries in km/week
(N=18=100%)
Source : Author, 2014
Figure 13: Delivery distance and selling points number
Source: Author, 2014

43
In order to aim for a sustainable logistics organization for the organic food system in retail-
wholesale, the evaluation of performances needs to be multidimensional. Logistics reflection
needs to go beyond the cost rationalization and have an ecological and social dimension as
well. The analysis of the logistics organization performances has different levels of
evaluation: An economic approach, an ecological approach and a social approach.
1.2. Economic dimension
Logistics costs are not often taken into consideration by farmers who have little awareness of
the costs that their organization requires. It is more specifically the time spent for logistics
that is not considered working hours. The evaluation of economic performances of logistics
has an objective to highlight the real cost implied by the logistics if an hour dedicated to
logistics is paid as such (French minimum wages4). The results found are displayed below
and involve details on the distribution of costs depending on the logistics items but are also
shown in relation to the revenue and delivery distance for retail-wholesale activity (cf. table
9):
4 French minimum wage is 9.53€ /hour gross. Round up at 10€/hour for the study
Table 9 : Results of the evaluation of economic performances of interviewed farmers logistics
Source: Author, 2014
Minimum Average Maximum
Planning costs €/week 3 27 150
% of logistics costs 2% 14% 59%
Order preparation costs €/week 10 50 200
% of logistics costs 7% 29% 58%
Delivery labor costs €/week 30 60 140
% of logistics costs 16% 37% 53%
Fuel costs €/week 7 32 101
% of logistics costs 5% 20% 34%
Delivery costs (delivery labor + fuel)
€/week 42 92 241
% of total logistics costs 21% 57% 87%
Total logistics costs €/week 79 169 438
Ratio logistics costs versus revenue
% of the revenue 4% 23% 62%
Profitability per kilometer € gained/ 100 km
travelled 100 574 3036

44
The figure 15 highlights the distribution of the different logistics costs per farmers. Some
trends appear for similar products on certain logistic items such as preparation costs as
described hereafter.
The planning costs take into account the time spent on client relations, order taking and other
administrative tasks (cf. part 2, section 2.1). The planning costs vary greatly depending on
the individual systems but
also the products for sale.
Planning cost varies from 3 €
per week to 150 € and can
represent from 2 to almost
60 % of the logistic costs (cf.
table 9). The significance of
these costs often correlates
to a high number of selling
points.
Order preparation costs take
into account the time spent
to prepare orders (sorting,
cleaning, packaging or making batches for example). These costs can range from 10 € to
200 € per week and represent an average of 29% of the logistics costs. They highly depend
on the products. Indeed, the vegetable and orchard farmers (farmers 1 to 12 in figure 15)
have products that require time to sort, clean or box compared to other products such as
cheese, meat or bread.
Delivery is the main logistic cost. It represents by itself 57% of the logistic costs and can go
up to 87% in the sample interviewed for this study. It takes into account the delivery labor
cost (time spent in transit and at the clients) and the fuel costs. Labor represents 37% of the
delivery costs and is rather homogeneous depending on the products as illustrated in the
figure 15. 20% is the average fuel costs. It depends on the delivery distance and the type of
vehicle used. Even though it is not the highest logistics cost, it is important to take into
account in the current context of the fossil fuel crisis and increasing energy prices.
One of the most interesting economic indicators is the ratio of logistics costs versus revenue.
This one assesses the percentage of the revenue dedicated to logistics costs. On average
23% of the revenue is spent on logistics costs. This means that for each euro gained, 0.23
euro is spent for logistics. One farmer of the sample uses 0.62 € of logistic costs for each
euro gained. However, this can be explained by an marketing strategy based on an online
0%
10%
20%
30%
40%
50%
60%
70%
80%
90%
100%
1 2 3 4 5 6 7 8 9 10 11 12 13 14 15 16 17 18 Farmers
Delivery fuel costs Delivery labor costs Preparation costs Planning costs
Figure 15: Distribution of logistics costs for farmers
Source: Author, 2014

45
5
5 3
5 < 11%
Between 11 and 23%
Between 23 and 34 %
> 34%
ordering system for delivered boxes5, which requires a lot of travel far from the farm, a lot of
time to prepare the
individualized boxes for
the consumers, as well
as the time necessary
for the delivery (two
hours per delivery
points). It is interesting to
see the difference of the
logistics costs versus
revenue ratio
(representation of
average ratio for the
different production in
the figure 17). This ratio is the most important for vegetables farmers with an average ratio
up to 34%. This can be partly explained by the preparation costs being more important for
this product along with low added value to the final product and the need for freshness
implying a high frequency of delivery. Almost all 5 farmers who have a logistics costs versus
revenue ratio of over 34% we can
see in the pie cart (cf. figure 16) are
vegetable farmers (4 on 5) when all
those that have a ratio under 11%
produce high added-value products
such as cheese, processed meat,
bread or cider (cf. figure 15 and 16).
This illustrates how product
characteristics influence this ratio.
Another interesting indicator is the
delivery distance profitability revealing the amount of money gained per 100 km travelled.
The average delivery distance profitability for the sample interviewed is 574 € per 100 km
5 Created 3 years ago in France, ‘La Ruche Qui Dit Oui’ is an internet platform linking farmers and
consumers. It is online-selling tool. With 10% of the revenue transferred to the company in charge of
the website and 10% to the delivery point, this modality has been considered as retail-wholesale in this
study (price close to the wholesale market). www.laruchequiditoui.fr/
0%
10%
20%
30%
40%
50%
60%
1 2 3 4 5 6 7 8 9 10 11 12 13 14 15 16 17 18
% lo
gist
ics
cost
s o
n t
he
re
ven
ue
Farmers
Ratio logistics costs versus revenue (%)
Average vegetable farmers Average orchard farmers Average dairy farmers
Figure 16 : Ratio logistics costs versus revenue (%)
Source: Author, 2014
Figure 17: Distribution ratio logistics versus revenue in the sample interviewed (N=18)
Source: Author, 2014

46
0
500
1000
1500
2000
2500
3000
1 2 3 4 5 6 7 8 9 10 11 12 13 14 15 16 17 18
€ g
ain
ed
pe
r 1
00
km
tra
velle
d
Farmers
Average vegetable farmers
Average orchard farmers
Average dairy farmers
travelled. However
the variations are
important as seen in
the figure 18. When 5
farmers have a
delivery distance
profitability lower than
200€ per 100 km
travelled, the same
amount gain more the
700 € for the same
distance travelled (cf.
figure 18). If we put
aside the meat farmer
(n°17 on the graphs)
who has a high value-added product (meat) and a very specific selling system (a unique
shop), the average goes down to 429 € for 100 km travelled. With no surprise the average
delivery distance profitability is the lowest for vegetable farmers, down to 316 € per 100 km
travelled (cf. figure 18). This is in accordance with the analysis made on the difference of the
results for the ratio logistics costs versus revenue made above. Vegetable farming produces
a low added-value product and has then lower delivery distance profitability than other
production for a similar delivered volume. The load’s worth highly influences this indicator.
For orchard farmers, even though the added-value of the final product is low, the good
preservation capacity of the fruits (mainly apple in the region studied), leads to a lower
delivery frequency and that way a better optimization of the deliveries through bigger volume
for the same selling point.
However, when looking at these results it is important to be aware that these indicators don’t
take into account the production costs but only the logistics costs. Even though they have
economic indicators which seem better than vegetable farmers especially, livestock farmers
have much higher production costs.
Figure 18 : Delivery distance profitability (€ gained for 100 km travelled)
Source: Author, 2014
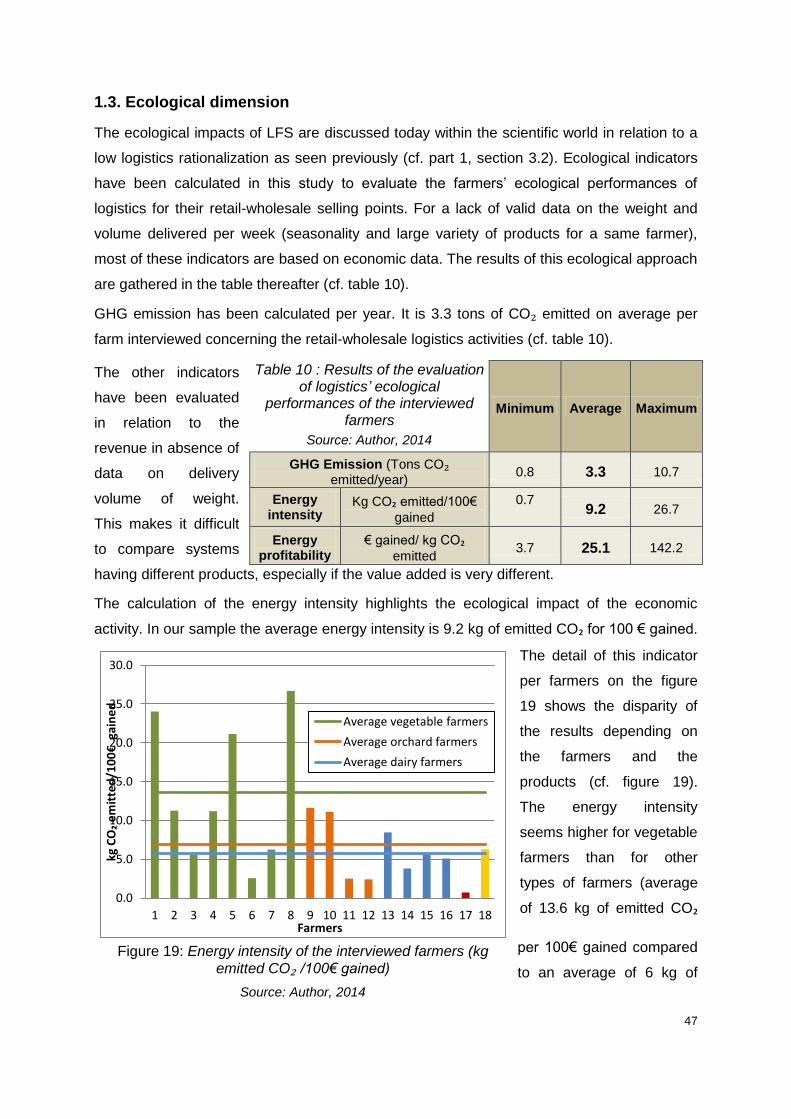
47
0.0
5.0
10.0
15.0
20.0
25.0
30.0
1 2 3 4 5 6 7 8 9 10 11 12 13 14 15 16 17 18
kg C
O₂
em
itte
d/1
00
€ g
ain
ed
Farmers
Average vegetable farmers
Average orchard farmers
Average dairy farmers
1.3. Ecological dimension
The ecological impacts of LFS are discussed today within the scientific world in relation to a
low logistics rationalization as seen previously (cf. part 1, section 3.2). Ecological indicators
have been calculated in this study to evaluate the farmers’ ecological performances of
logistics for their retail-wholesale selling points. For a lack of valid data on the weight and
volume delivered per week (seasonality and large variety of products for a same farmer),
most of these indicators are based on economic data. The results of this ecological approach
are gathered in the table thereafter (cf. table 10).
GHG emission has been calculated per year. It is 3.3 tons of CO₂ emitted on average per
farm interviewed concerning the retail-wholesale logistics activities (cf. table 10).
The other indicators
have been evaluated
in relation to the
revenue in absence of
data on delivery
volume of weight.
This makes it difficult
to compare systems
having different products, especially if the value added is very different.
The calculation of the energy intensity highlights the ecological impact of the economic
activity. In our sample the average energy intensity is 9.2 kg of emitted CO₂ for 100 € gained.
The detail of this indicator
per farmers on the figure
19 shows the disparity of
the results depending on
the farmers and the
products (cf. figure 19).
The energy intensity
seems higher for vegetable
farmers than for other
types of farmers (average
of 13.6 kg of emitted CO₂
per 100€ gained compared
to an average of 6 kg of
Table 10 : Results of the evaluation of logistics’ ecological
performances of the interviewed farmers
Source: Author, 2014
Minimum Average Maximum
GHG Emission (Tons CO₂ emitted/year)
0.8 3.3 10.7
Energy intensity
Kg CO₂ emitted/100€
gained
0.7
9.2 26.7
Energy profitability
€ gained/ kg CO₂ emitted
3.7 25.1 142.2
Figure 19: Energy intensity of the interviewed farmers (kg
emitted CO₂ /100€ gained)
Source: Author, 2014

48
CO₂ for the others). The differences within the same category of farmers however, are
difficult to analyze. The energy intensity depends on the proximity of consumer pool (city or
touristic area), the quantity of delivered products (value of the delivery) and the distribution
strategy of each individual farm. The limited number of farmers representing the same type
of production limits the in-depth analysis of this study. Only a hypothetic reflection can be
done.
The energy profitability
shows the economic
profitability of the ecological
impact, that is to say the
money gained per kilogram
of emmited CO₂. When the
average is 25.10 € gained
per kg of emmited CO₂,
almost all the vegetable
farmers are under 20 € with
an average at 13 €. The
energy profitability reachs 25
€ for orchard farmers (cf.
figure 20). This difference
with vegetable farmers is parlty due to the different preservation capacity of the products as
said before (cf. part 3 section 1.2). The logistic stakes are especially high for vegetable
farmers caused by the characteristics of production. The very high profitability the farmer 17
as explained in the previous section (cf. part 3 section 1.2), is due to the products, meat,
which has a high price per kilo, and the distribution strategy on a single farmers’ shop.
Logistic rationalization would lead to a diminution of the energy intensity as well and an
improvement of the energy profitability on the different systems.
0
20
40
60
80
100
120
140
1 2 3 4 5 6 7 8 9 10 11 12 13 14 15 16 17 18
€ g
ain
ed
/kg
em
itte
d C
O₂
Farmers
Average vegetable farmers
Average orchard farmers
Average dairy farmers
Figure 20 : Energy profitability of the interviewed farmers (€ gained/kg emitted CO₂)
Source: Author, 2014

49
1.4. Social dimension
One of the main reflections from farmers regarding logistics is about time management. Time
distribution is a recurrent subject talked about during the farmer interviews (time spent in
transportation and selling takes away from their primary job: production). However, even if
reflection exists on the topic,
working hours spent on logistics
are often not considered as
‘working’ hours for farmers.
Information on the time
dedicated to logistics is
important to highlight this often
neglected element. The table 11
summarizes the data obtained
which is related to the social performance evaluation (cf. table 11).
On the 18 interviewed farmers for this
quantitative approach, the average logistics
time is 12.5 hours per week which is more than
one full day of work (cf. table 11).
As the figure 21 illustrates, almost half of this
logistics time corresponds to delivery. However
planning and preparation also have their
importance. Almost 4 hours per week are
dedicated to preparing orders on average and 3
hours for planning.
The detail from farmers’
logistics time management is
shown in the figure 21
depicts a large degree of
heterogeneity. Vegetable
farmers (n° 1 to 8) have
lower amount of time
dedicated to logistics than
others in general. However,
to make assumptions for
other production types
Table 11 : Results of the evaluation of logistics’ social performances of the interviewed farmers
Source: Author, 2014 Minimum Average Maximum
Planning time (h/week) 0.3 2.8 15.0
Preparation time (h/week)
1.0 3.9 20.0
Delivery time (h/week) 3.0 5.6 14.0
Logistic time (h/week)
5.8 12.5 35.5
0.0
5.0
10.0
15.0
20.0
25.0
30.0
35.0
40.0
1 2 3 4 5 6 7 8 9 10 11 12 13 14 15 16 17 18
Ho
urs
sp
en
t to
logi
stic
s
Farmers
Delivery time
Preparation time
Planning time
23%
32%
45% Planning time
Preparation time
Delivery time
Figure 21 : Distribution of logistics time management
Source: Author, 2014
Figure 22 : Logistics time management for farmers
Source: Author, 2014

50
5
7 1
5 < 2h
Between 2h and 4h
Between 4h and 5h30
> 5h30
5
8 0
5 < 35 min
Between 35 min and 2 h
Between 2 h and 2h30
> 2h30
5
4 5
4 < 9h Between 9h and 12h Between 12h and 18h > 18h
6
3 4
5 < 4h
Between 4h and 5h
Between 5h and 7h30
>7h30
seems difficult when looking at the orchard farmers (9 to 12 in the graph) and dairy farmers
(13 to 16). The distribution of time for logistics is mainly due to the internal organization of
each farm. As we explained in section 1.2 of the part, Farmer 1 mainly sells his products
though La Ruche Qui Dit Oui, the online platform explained page 45, modality which
demands a lot of time for order preparation and, in this specific case, delivery time (delivery
points far from the farm). This explains the high amount of time spent for logistics
(35.5h/week). Farmers 17 and 18 have specific logistics challenges due to their production
(meat for the 17 and bread for the 18). We can see that the logistics strategy of the meat
farmer requires a lot of planning hours (many clients even if one selling point), while the
farmer producing bread has a big portion of his logistic hours for daily delivery all over the
region.
The distribution of the hours spent on logistics is that half of the farmers spend between 35
minutes and 2 hours per week for planning as shown in the figure 23. It is interesting to
notice that almost 1 farmer in 3 spend more than 2h30 for planning the retail-wholesale
deliveries. For preparation, 1 farmer in the 3 spent between 2 and 4 hours (cf. figure 24).
However, 1 on 3 spent more than 5h30 on preparation, mostly vegetable farmers. As
previously discussed in section time dedicated to logistics is often reduced to deliveries.
However, as shown in the graphs below, planning and preparation are also to taken into
account in the farmers’ reflection regarding logistics organization and rationalization. For
deliveries, the contrast is important as shown in the figure 25. When 1 on 3 farmers spend
less than 4 hours for deliveries per week, almost as much spend more than 7h30 (cf. figure
Figure 23: Distribution of farmers depending on total logistics time for retail-wholesale (per week)
Figure 24 : Distribution of farmers depending on delivery time for retail-wholesale (per week)
Source: Author, 2014
Figure 26 : Distribution of farmers depending on planning time for retail-wholesale (per week)
Figure 25 : Distribution of farmers depending on preparation time for retail-wholesale (per week)

51
25). This time for delivery seems especially important for dairy farmers in cheese production
(farmer 13 to 16 in the detailed figure 22) due to a high number of selling points for small
amount of product.
This section has shown that the hours farmers spend on logistics vary greatly depending on
their logistic organization as well as the characteristics of their products.
1.5. Logistics performance assessment
The results of this evaluation of farmers’ logistics performance have highlighted the
uniqueness of each farm’s logistics organization. However, trends appeared depending on
each farm’s products. The effects of the logistics organization strategy depend on the
characteristics of the products. The economic impact of higher logistic efficiency varied
greatly depending on the type of products. As summarized in the table hereafter (cf. table
12), the added-value of the final product, the necessary delivery frequency and the logistics
costs versus revenue ratio all help to determine the overall economic impacts relating to the
implementation of an effective logistics strategy.
Table 12 : Economic necessity to have an efficient logistics depending on the characteristics of the products
Source: Author, 2014
Vegetable farmers
Orchard farmers
Dairy and meat farmers (cheese, and
other high added-value products)
Added-value of the final product Low Low High
Delivery frequency (freshness needed for the
delivered product) High Low Low
Part of the revenue dedicated to logistics (logistics costs versus revenue ratio)
High High Low
Economic necessity to have an efficient logistics
High Medium Low
Changes in logistic organization appear to affect most vegetables farmers’ economic
performance as they are selling a low added -value product with a high delivery frequency.
The part of the revenue dedicated to logistics is high whence a high economic necessity to
have an efficient logistics.
The various impacts of the logistics organization have been highlighted in this section, from
the economic to social or ecological impacts. This multidimensional aspect of logistics shows
the importance for a general reflection on logistic organization and its rationalization.
The economic necessity to have efficient logistics varies depending on the type of products produced on the farm. Main characteristics of the products impact this necessity differently:
Characteristics not having much impact on the necessity to have efficient logistics
Characteristics deeply impacting the necessity to have efficient logistics

52
Logistic collaboration is a rationalization tool as explained in the section 4.4 of part 1. This
tool appears as interesting and able to adapt to a local reflection on logistic organization of
the organic retail-wholesale food system. However, developing sustainable logistic
collaborations, whatever its form is far from easy. The second part of this chapter will
evaluate the situation regarding logistic collaboration focusing on its perception for farmers or
other stakeholders of the local organic retail-wholesale food system. First the interests will be
presented and then the obstacles that face logistics collaboration vocalized by farmers and
other stakeholders from the studied food system as well as possible forms that logistics
collaboration can take.

53
2. Logistic collaboration: Inhibiting and supporting factors
The interviews as well as the exploratory phase highlighted interests and obstacles for
logistics collaboration. Even though the focus thus far has been on farmers, key actors of
local organic food system for retail-wholesale take are also included in the study (cf.
part…method). This section will first explain the interests identified by the actor of the local
organic food system for retail-wholesale (farmers and other interviewed stakeholders)
regarding logistics collaboration then go over obstacles identified in terms of horizontal and
vertical collaboration. Finally, five main forms of logistic collaboration will be explained, forms
that has been vocalized by the actors or read in literature.
Inhibiting and supporting factors are essential to take into account in a broader reflection
about developing sustainable organic local food systems in retail-wholesale sector as well as
other distribution channels.
Once knowledgeable about this information, it becomes possible to work on schemes
inspired by existing forms of logistics collaboration while paying attention to identified
obstacles. Existing projects and future ideas can then bring solutions to overcome these
obstacles. The identified interests help the actors (especially farmers) understand
expectations and concerns, in order to enable them to adapt and set up projects that fit to
those expectations.
This part is based on the “content analysis” of the transcribed interviews of twenty one
farmers and seven key stakeholders of the local organic food system for retail-wholesale.
The quantitative data of this part are based on the analysis of the interviews of farmers only
as explain in part 3.3 of the methodology. They are based on:
- The descriptive analysis of the content analysis (cf. part 2, section 3.3.4)
- The analysis of the multiple choice grid presented to the interviewed farmers (cf.
part 2, section 3.3.5)
The reflection of the seven other key actors of the local food system in the region have been
taking into account to support the results of the farmers interview and to bring more holistic
vision of the subject, a vision on the food system scale.

54
2.1. Logistic collaboration: Multiple interests to support
One of the interesting results of this study is the identification of logistics collaboration
interests but more than that the understanding of the farmers’ perception on it. Indeed, it is
important to integrate the farmer’s view in the reflection about logistic optimization in the local
food system. Identify the main interests they associate with logistics collaboration can
highlight the main driver of change and that way fit as much as possible a potential change to
their realities.
The analysis of the multiple choices grid presented to farmers gives the following results (cf.
figure 27).
Five interests associated with logistic collaboration have been identified by the content
analysis done:
- Reducing logistics costs - Reducing GHG emission
- Increasing time availability - Increasing exchanges
- Accessing new markets
Among these five interests associated with logistics collaboration this pie chart (cf. figure 27)
emphasizes the importance of three of them for farmers: logistic costs reduction, increasing
time availability and new market opening up. These interests include various categories
depending on the farmer’s approach of the interest. It is interesting to take into account the
various approaches to be the most accurate possible in the propositions. The following graph
shows the percentage of farmers having mentioned the different interests (cf. figure 28):
- In their spontaneous reflection during the interview (content analysis)
- In a more guided reflection after introduction of the multiple choice grid. Interests
that they identified as part of the 3 most important one (multiple choice grid analysis)
Figure 27 : Average points given by farmers to the different logistics collaboration interests
Source: Author, 2014
1.8
0 1.8
0 0
1.9
0.1 0.5
Increasing time availability Accessing new market
Reducing logistics costs Increasing exchanges
Reducing GHG emission
A multiple choices grid is presented to farmers. Each of them pick the interests he identifies as the 3 main ones to logistics
collaboration and classify them by importance: - 3 points for most important - 2 points for the second - 1 points for the third
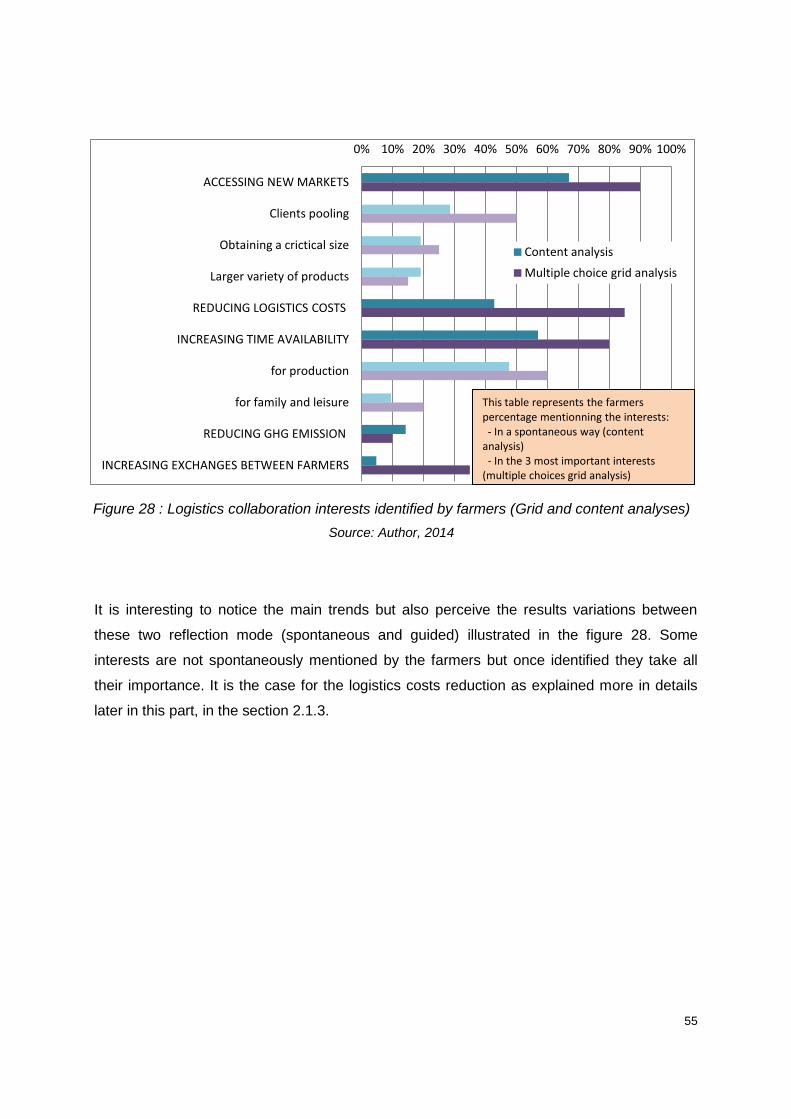
55
It is interesting to notice the main trends but also perceive the results variations between
these two reflection mode (spontaneous and guided) illustrated in the figure 28. Some
interests are not spontaneously mentioned by the farmers but once identified they take all
their importance. It is the case for the logistics costs reduction as explained more in details
later in this part, in the section 2.1.3.
0% 10% 20% 30% 40% 50% 60% 70% 80% 90% 100%
ACCESSING NEW MARKETS
Clients pooling
Obtaining a crictical size
Larger variety of products
REDUCING LOGISTICS COSTS
INCREASING TIME AVAILABILITY
for production
for family and leisure
REDUCING GHG EMISSION
INCREASING EXCHANGES BETWEEN FARMERS
Content analysis
Multiple choice grid analysis
This table represents the farmers percentage mentionning the interests: - In a spontaneous way (content analysis) - In the 3 most important interests (multiple choices grid analysis)
Figure 28 : Logistics collaboration interests identified by farmers (Grid and content analyses)
Source: Author, 2014

56
The following tables (table 13 and 14) gather the main results of the quantitative analysis.
The first one show the details of the descriptive analysis of the content analysis when the
second one the results of the multiple choices grid analysis. The complete table is to find in
the appendix (cf. appendix 9). O
Table 13 : Results of the descriptive analysis of the content analysis-Interests of logistics collaboration (Source: Author, 2014)
Table 14 : Results of the analysis of multiple choice grid -Interests of logistics collaboration (Source: Author, 2014)
Now the different interests to logistics collaboration will be detailed and explain.
CONTENT ANALYSIS
THEME CATEGORY PRECISIONS ON THE CATEGORY
Percentage of farmers having spontaneously
mentioned this interest during the
discussion
Recurrence of this interest on the speech
of the farmers mentioning it
Interests to logistics
collaboration
Accessing new markets
Client pooling 29%
67%
1
Obtaining a critical size
19% 1
Larger variety of products
19% 2
Increasing time
availability
For production 48%
57% 1.6
For family and leisure 10% 2.5
Logistics costs reduction 43% 1.1
GHG emission reduction 14% 1
Increasing exchanges between farmers
5% 1
MULTIPLE CHOICE GRID ANALYSIS
THEME CATEGORY How many farmers
chose it as part of the 3 major interests
Average points given for this interest on the sample (on a scale from
1 to 3)
Interests to logistics
collaboration
Accessing new markets 90% 1.8 Increasing time availability 80% 1.8
Logistics costs reduction 85% 1.9 GHG emission reduction 35% 0.5
Increasing exchanges between farmers
10% 0.1

57
2.1.1. Accessing new markets
Opening new market appears as the main perceived interest for the interviewed farmers. 14
farmers on 21 mentioned it spontaneously during the interview and 19 on 21 chose it as part
of the three main interests to logistics collaboration after the presentation of the multiple
choice grid. This opening to new market is associated to three different reasons:
- Client pooling: Collaboration can create new markets opportunities because,
as this farmer explains:
“Maybe that collaborating will enable me to get into some shops where I don’t go, into places where
another one goes” (Farmer18, Interview 01 July 2014)
- Obtaining a critical size: As this farmer explains,
“Sometimes people have the feeling that farmers are so small it is not even interesting to work with
them […] we could carry a bit more weight” (Farmer 15, Interview 23 June 2014)
Indeed, certain forms of collaboration lead to bigger volumes for sell through production
pooling from multiple farmers. This can enable farmers to reach markets that were
individually impossible to reach such as institutional catering.
- Larger assortment: Collaboration can also enable an increasing products
diversity offered for sell (variety of products linked to a variety of farmers and productions).
This is interesting for the clients who then have to deal with a single contact to gather the
products that interest them. It is the opinion of the interviewed wholesaler/distributor:
“As a result (speaking about collaboration and pooling of products) there is a true offer and we give a
visibility to the regional products for other regions. We don’t need to work local where the offer
already exist, but people like me it is to work out of the region”(Distributor, Interview 28 July 2014)
2.1.2. Increasing time availability
The increasing time availability is associated to an optimization and pooling of delivery time
especially: Less time in transportation it is more time for other things. This increasing time
availability appears as the second major interest to logistics collaboration identified by the
interviewed farmers. 12 farmers out of 21 mentioned it spontaneously during the interviews
and 17 choose it as one of the three main interests. This increasing time availability is
identified at two different levels:
- Increasing time availability for production, because, as this orchard farmer
explains,
“Improve the time to production is the daily preoccupation. The time spent in the car we don’t spend it
in the field” (Farmer 9, Interview 04 July 2014)
More time to production to increase the quality or the quantity of the current production.
- Increasing time availability for other things,

58
“The time that you spent with your client you don’t spend it with you children” (Farmer 1, Interview
18 June 2014)
As this vegetable farmer, mother of two children, numerous are the farmers questioning their
working time and livability of their farming systems, especially vegetable farmers as talked
about in the part 1, section 3.1.
It is interesting to notice that ¾ of the farmers chose this interest to have more time to
production. However, the two farmers who mentioned this interest to have time for other
things mentioned it with a recurrence ratio of 2.5 that is to say the highest recurrence ratio of
the study (cf. table 14). This shows how important it is for these farmers to improve the
livability of their systems.
2.1.3. Reducing logistics costs
“Less time on the road, less equipment wear: the benefits is above all economic” (Farmer 18,
Interview 1st July 2014)
The third interest to logistics collaboration mentioned by farmers is the cost reduction. 12
farmers on 21 spontaneously mentioned this economical aspect during the interviews when
18 chose it as part as the three main interests to logistic collaboration. This logistics cost
reduction is caused by a decreasing fuel costs, vehicle wear, working hours spent to logistics
activities such as delivery or preparation.
It is important to notice the difference between the numbers of farmers spontaneously
mentioning this economic aspect (8 on 21) and the number who choose it among the list (18
on 21) (cf. table 28). 10 more farmers mentioned it as part of the three main interests
(multiple choices grid). This illustrates well the discredit the economical impact of the logistic
organization among farmers. Logistic is not directly and spontaneously linked to an
economical dimension as developed more in section 3.1 of the part 1.
2.1.4. Reducing Green House Gases (GHG) emission
“The coherence of the approach. We already had it said that short supply chains did not always have
a better energy efficiency” (Farmer 17, Interview 19 June 2014)
This farmer’s quote summarizes well this ecological aspect of collaboration. The ecological
dimension of logistic collaboration is the fourth interests mentioned. 3 farmers on 21
mentioned it spontaneously when 7 choose it as one of the three main interests to logistic
collaboration. This ecological aspect is associated to GHG emission reduction that a more
optimized logistic leads to (travelled distance reduced and optimization of means of
transportation mainly).

59
2.1.5. Increasing exchanges
The last interests mentioned was the increasing exchanges that collaboration can create.
Developing communication and link between farmers lead most of the time to an increase of
different forms of exchanges: information exchanges (technical, economic or ideas for
example); service exchanges (mutual help between farmers who are part of a same project
as more easily done) or products supplement, because as this vegetable farmer explains,
“Logistic collaboration leads to something really nice. It is: I have too much of that, and you, you
don’t have enough of that, we can get along” (Farmer 20, Interview 08 July 2014)
However this interest is far from being the main one perceived to logistic collaboration. Only
one farmer mentioned it spontaneously and two chose it as one of the main interests.
2.2. Logistics collaboration: obstacles to consider
Another important result for the reflection around logistics organization in the organic LFS is
the obstacles inhibiting logistics collaboration as perceived by different interviewed actors.
This part presents the necessary elements to understand these perceptions for farmers as
well as other actors of the organic retail-wholesale sector.
Two aspects will be presented in this part:
- The obstacles to logistics collaboration in general, particularly based on the farmers
interviews and span both vertical and horizontal forms of collaboration (content analysis and
multiple choice grid analysis).
- The obstacles to vertical collaboration, focusing on the larger food system and the
relationships between different actors and stakeholders (based on the content analysis of all
the verbatim).
2.2.1. General obstacles
After analyzing the data collected and constructing the concept tree, eight categories of
obstacles have been identified:
- Lack of confidence
- Singularity of each system
- Loss of human relations
- Cultural elements
- Loss of independence
- Isolation from other farmers
- Difficulty to find a fair system
- Lack of time to reflect on their organization

60
The analysis of the multiple choice grid shows the predominance of two main obstacles as
illustrated in the pie chart (cf. figure 29): The lack of confidence (cf. section 2.2.1.2) for
more details) and the singularity of each system (cf. section 2.2.1.1). By themselves they
represent more than half of the “potential obstacles” for farmers.
The obstacles associated with logistics collaboration in general are numerous and in
varying categories (mainly human and technical). The following graph presents details on
the importance of the different obstacles in a spontaneous reflection (content analysis)
and a more guided reflection (multiple choice grid). It shows details on the different
obstacle categories (clearer colors) (cf. figure 30). Further discussion on these results will
be done later on in this section.
1.7
1.6 1
0.8
0.6 0.4
Lack of confidence
Singularity of each system
Loss of human relationship
Cultural elements
Loss of independance
Isolation from other farmers
Difficulty to find a fair system
Lack of time to reflect on their organization
A multiple choices grid is presented to farmers. Each of them pick the obstacles he identifies as the 3 main ones to logistics
collaboration and classify them by importance: - 3 points for most important - 2 points for the second - 1 points for the third
Figure 29 : Average points given by farmers to the different logistics collaboration obstacles Source : Author, 2014

61
Figure 30: Logistics collaboration obstacles identified by farmers (Content and multiple choice grid analyses) Source: Author, 2014
The following tables (cf. tables 15 and 16) gather the results of the farmer interviews
analysis. The importance of each obstacle is highlighted:
- In their spontaneous reflection during the interview (number of farmers
spontaneously mentioning the obstacle and the recurrence ratio for those who mentioned
it)
- In a more guided reflection after presentation of the grid (number of farmer
choosing the obstacle as part of the three major ones and number of points given to the
obstacles in general (from 1 to 3, 1 being the most important).
This simplified table presents a quick visualization of the quantitative information that will
be used in the detailed explanation following. The complete table can be found in the
appendix (cf. appendix 10).
0% 10% 20% 30% 40% 50% 60% 70% 80% 90% 100%
SINGULARITY OF EACH SYSTEM
Products variety
Different working hours
Different vision of the profession
client variety
Container/packaging variety
LACK OF CONFIDENCE
Between partner-competition
Between partners-ponctuality
Between partners-Handling of goods
Lack of self-confidence
LOSS OF HUMAN RELATIONSHIP
With the client
Lacking "Change of scenery"
ISOLATION FROM OTHER FARMERS
CULTURAL ELEMENTS
Individualism
Resistance to change
LOSS OF INDEPENDANCE
LACK OF TIME TO REFLECT ON THEIR …
DIFFICULTY TO FIND A FAIR SYSTEM
Content analysis
Multiple choice grid analysis
This table represents the farmers percentage mentionning the obstacles: - In a spontaneous way (content analysis) - In the 3 most important obstacles (multiple choice grid analysis)

62
Table 15 : Results of the descriptive analysis of the content analysis-Obstacles of logistics collaboration (Source: Author, 2014)
CONTENT ANALYSIS
THEME CATEGORY CATEGORY SPECIFICS
Number of farmers mentioning the
obstacle during the interview
Recurrence of this obstacle in the speech of the farmers having
mentioning it
Obstacle inhibiting logistics
collaboration
Singularity of each system
Product variety 42%
100%
1.8
Client variety 10% 1.0
Container/Packaging variety 10% 1.0
Different working hours 24% 1.4
Different vision of the profession 14% 2.3
Lack of confidence
Competition 38%
90%
1.4
Low performances
of the partners
Punctuality 33% 1.4
Handling of the goods
10% 2.5 Lack of self-confidence 10% 1.0
Loss of human
relationship
With the client 48% 62%
1.7
Lacking "change of scenery" 14% 1.0
Isolation from other farmers 62% 1.4
Cultural elements
Resistance to change 10% 48%
1.0
Individualism 38% 1.3
Loss of independence 24% 2 Lack of time to reflect on their organization 24% 1.6
Difficulty to find a fair system 19% 1.0
Table 16 : Results of the multiple choice grid analysis-Obstacles of logistics collaboration (Source: Author, 2014)
MULTIPLE CHOICES GRID ANALYSIS
THEME CATEGORY
Percentage of farmers who chose it as part of the 3
major obstacle
Average points associated to the
obstacle (1 to 3 scale, 1 being the most
important)
Obstacles inhibiting logistics
collaboration
Singularity of each system 85% 1.6
Lack of confidence 85% 1.7
Loss of human relationship 40% 1
Isolation 15% 0.4
Cultural elements 40% 0.8
Loss of independence 25% 0.6
Lack of time to reflect on their organization 0% 0
Difficulty to find a fair system 0% 0

63
Now the obstacles will be explained in detail.
2.2.1.1. Singularity of each system
The singularity of each system appears as the main obstacle for farmers. All farmers
mentioned it spontaneously during the interview and 18 of 21 positioned it as one of the
three major obstacles for logistics collaboration (cf. table 15 and 16). Each farming system
is singular: different products, different individuals, different marketing strategies and
different logistics organization. This diversity can be seen as strength as seen in the
previous section, as it increase the diversity of the offer increasing the access of new
markets and the exchanges between farmers (cf. section 2.1.5 of this part) but can also
make collaboration more difficult for numerous reasons:
- Variety of products: The variety of products can create some difficulties for
collaboration such as:
o Refrigeration for products that need different storage temperature (dairy
products, meat for example), as this dairy farmer explains :
“Cheese […] requires refrigeration, and not everyone is equipped with refrigeration” (Farmer 16,
Interview 24 June 2014)
In her interview, Farmer 16 described this challenge when specifically addressing the
topic of transporting goods collaboratively.
o Current laws and regulations are also preventing farmer’s from
collaborating with one another
“Can we mix apples and vegetables? This is another question. We need the products that are
compatible” (Farmer 4, Interview 25 June 2014)
This compatibility needs to be present according to existing rules (for example the
prohibition to mix meat and dairy products in the same fridge if not individually packed).
o Seasonality
“The problem is that we do not sell to our clients all year long, there is a 2 to 3 month period when
our goats don’t give milk, therefore there is no delivery” (Farmer 15, Interview 23 June 2014)
This goat farmer raises an issue. Some products have irregular availability throughout the
year. It can then be more difficult to collaborate in the long run with them on deliveries.
- Client portfolio variety:
“The neighbors are not organic; we do not have the same clients” (Farmer 14, Interview 15 July
2014)
Some farmers have very different and well defined distribution channels and sometimes
they perceive this diversity as an obstacle to collaboration. However, it is important to
notice that client variety has also been identified as an interest for logistics collaboration

64
because of the potential for accessing new markets through pooling (cf. section 2.1.1 of
this part). This challenge therefore depends on the perception of the individual farmers.
- Container/Packaging variety:
“At the beginning his crates were in a standardized format so it matched well with our crates, and
then, he changed and I could not manage to close the door of my truck” (Farmer15, Interview 23
June 2014)
This testimony illustrates a fact: containers are a key element of logistics organization.
Their diversity, shape or size can make collaboration difficult because of a lack of
containers harmonization.
- Different vision of the profession: Farmers, are individual :
“We do not all have the same way to approach the profession and everything that comes with that”
(Farmer 9, Interview 4 July 2014)
Therefore farmers have different working hours and yearly rhythms. Through ‘approaches
of the profession’ this farmer was referring to the way to manage the production in link
with the different ways to manage an orchards, some choose to trust more natural
processes (beneficial insects and natural environment for example) when others are more
much active (pruning, choosing the varieties, treatment) and can see the other way to
manage the orchard as passive, careless or lazy and that way being less inclined to
collaborate with them. Although only 3 farmers mentioned this obstacle, the 2.3
recurrence ratio shows the omnipresence of this obstacle in the speech of the farmers
mentioning it, often related to a negative collaborative experience.
2.2.1.2. Lack of confidence
19 farmers mentioned ‘lack of confidence’ as an obstacle spontaneously and almost the
same amount positioned it as part of the three main ones for logistics collaboration (see
tables 15 and 16). This lack of confidence can be seen at two levels:
- Lack of confidence between partners: Collaboration requires a certain confidence
and trust between partners in order to succeed. This confidence is far from being
spontaneous and easy, especially for farmers, and relates to two aspects.
o Competition:
“Unveil where you go, [and] there is the aspect of competition. You go there and you steal one
client. It is something that people don’t say but it is what they think” (Farmer 18, Interview 1st July
2014)
Mentioned spontaneously by 7 farmers on 21, this obstacle especially exists between
farmers who have the same products as this farmer explains:
“I have a hard time believing that we can make [a successful collaboration between] two people
with the same products […] there is something not sane about it” (Farmer 9, Interview 4 July
2014)

65
o Low performances of the partners:
“When you are already late, ready to leave, and the other is not there yet because he is late, it puts
back the entire schedule” (Farmer 17, Interview 19 June 2014)
This obstacle is associated with the lack of punctuality from some stakeholders, but also
inappropriate handling of the products, especially fragile products (leafy vegetables and
yoghurt for example) because, as this farmer explains,
“It is trust; you entrust your products to someone. If the other stops in the sun for an hour, and it
were salads, you can imagine?” (Farmer 1, Interview 18 June 2014)
Even though this obstacle was only spontaneously mentioned by 2 farmers of the 21
interviewed, it was with a 2.5 recurrence ratio, the highest of the study. This shows the
importance of this obstacle for the farmers who mentioned it. Here too, it is often linked to
a bad experience of collaboration in their past as is the case for this vegetable farmer
quoted above.
- Lack of self-confidence: As this organic shop manager explains,
“The relationship of trust is easier when you trust the product you send. Here too, it is farmers’
psychology. If my carrot is perfect, I easily delegate, but if my carrot is not so great …” (Organic
shop manager and farmer, Interview 9 July 2014)
This organic shop manager explain through this quote the fact that some farmers prefer
selling directly to the client because they think that they might have more chance to sell
their products as the selection process would be less rigorous because of the direct
human interaction with the client. That way a farmer who trusts her products collaborates
more easily because she delegates more easily the act of sale.
2.2.1.3. Loss of human relationship
Loss of human relationship is mentioned spontaneously by 13 farmers of 21 but only 8
placed it in the top three major obstacles to logistic collaboration. This obstacle is
associated with the delegation of the delivery resulting in a loss of contact with the client.
Two approaches of this loss are seen:
- The loss of client relation
“For me the relation with the client is paramount […] In case of problems, if we explain them, the
clients understand” (Farmer 14, Interview 15 July 2014)
“The danger with subcontracting is the risk of losing the ability to intervene and react quickly. If
there is a problem with the product, Dimitri, the driver, will refer it to Isabelle that will refer it to
Alexandre, who will refer it to the administration council…it will be too late then” (Manager of a
organic shop and farmer, Interview 9 July 2014)
Explanations in case of problems, timely responses and possible interventions, are
reasons why contact with the client is perceived as important for some, but also for
identifying potential clients, because, as this farmer says,

66
“There is no one better than the farmer to sell his product” (Farmer 12, Interview 19 June 2014)
- ‘Change of scenery’: As this farmer shares, for some,
“Delivering is nice, it enables me to see people from the cooperative or the shops, exchange, speak
a little bit. If not, we keep to ourselves and we don’t see anybody” (Farmer 4, Interview 25 June
2014)
The loss of human relationship has also a more social dimension,
“The social link is vital; it pushes to see other things, to go out of the farm. It gives ideas” (Farmer
13, Interview 17 June 2014)
Even if only 3 farmers of 21 mentioned it this way, it seems important to notice the need
for social links and the willingness for some farmers to get away from the production
environment and exchanges ideas, information, or quite simply, have a change of
scenery.
2.2.1.4. Cultural elements
All farmers are imprints of a culture which influences their habits and ways of being and
behaving. Some of these cultural elements also influence the development of logistics
collaboration. 9 farmers interviewed of 21 spontaneously acknowledge the influence of
their individual culture as an obstacle to logistics collaboration and almost as many place
them as one of the three major obstacles to logistic collaboration. This obstacle has two
main components:
- Individualism of the farming community actors because for some,
“Farmers work in a very individual way but not to say individualistic. As a result everyone does
their own stuff” (Farmer 18, Interview 1st July 2014)
More than a quarter on the interviewed farmers spontaneously mentioned this obstacle
and link it as a characteristic of the farming community, as the culture of their region
(Flanders especially).
- Resistance to change because as this goat farmer explains,
“As always, when you are used to work a certain way, you keep working that way” (Farmer15,
Interview 23 June 2014)
2.2.1.5. Isolation from other farmers
Isolation is an obstacle spontaneously mentioned by 13 farmers on 21, but only 3 of them
situate it as part of the three major obstacles. The number of farmers in the countryside
decreases every year. The number of organic farms has been divided by four in less than
50 years in France (Agence Bio 2013).This leaded to a higher isolation of each one of
them making exchange more difficult. This isolation is even more present for organic
farmers. In the Nord-Pas de Calais region the 275 organic farmers only represent 0.9% of
the farming land area (cf. introduction) creating large spans of distance between them.

67
This distance can be an obstacle to the development of collaboration as this farmer
shares:
“Here we are almost alone […] we are pretty limited. Try to find somebody with whom I could
collaborate, but it is not crowed around here” (Farmer 7, Interview 18 June 2014)
2.2.1.6. Loss of independence
“I would not put all my eggs in the same basket. You can easily be dumped [by someone you tried
to collaborate with and depended on] from one day to another and then be in deep doo-doo”
(Farmer 19, Interview 24 July 2014)
The loss of independence has been listed among the main obstacles to logistics
collaboration. This obstacle can be linked to the poor performances of partners of the rural
individualistic culture. Working together can be coupled with ‘going down together’ in case
of bad performances from one of the partners. Working together is accepting that you are
not alone on the logistics chain and leave space for others when, as this farmer says,
“A farmer is very proud, because it is his product. It is your thing so you are very proud on the
follow-up of your work. It is a little bit like an artist” (Farmer 12, Interview 19 June 2014)
This loss of control on the logistics is a social obstacle to take into account in the
construction of a more sustainable organic retail-wholesale food system in the region.
2.2.1.7. Lack of time to reflect on their organization
As Ison (2008) explains, it is important to understand the whole, to put things into context
and establish their relationships between the parts of the system, in order to develop
successful parts. There is balance to find between systemic thinking, based on
understanding the interaction of the system, and systematic thinking which is more of a
step by step thinking oriented on the parts of the system (Ison 2008).
However, as this farmer explains:
“We can’t see the forest and the trees; we are too focused on doing our own things. We need
someone to step back from the system and offer something new and then, we start to get interested.
But we have too much work, too many things to sort out” (Farmer20, Interview 08 July 2014)
He expressed the lack of time he has to reflect on his organization, and see it as an
obstacle to see opportunities in the system that could help him organize better its logistics.
This lack of perspective, partly due to the amount of time spent on logistics, is an obstacle
for farmers to reach this systemic thinking and inhibits a better understanding of the food
system they are in. They don’t have the time to look for new information, information on
the journey of each one of the neighbors that could help them to make sustainable and
adequate decision in relation with their logistics through the development of new forms of
organizing through collaboration.

68
Even though none of the farmers chose this obstacle as one of the three main one to
logistics collaboration, 5 of them (of the 21 interviewed) mentioned it during the interviews.
2.2.1.8. Difficulty finding a fair system
“For me, the most difficult thing is to find a fair exchange” (Farmer 9, Interview 4 July 2014)
The last obstacle has been mentioned by 4 farmers of 21 interviewed, and is often related
to an experience of partnership, collaboration, most often informal relationship with they
found unfair.
2.2.2. Vertical logistics collaboration obstacles
Forms of logistics collaboration can be horizontal, between farmers, but also vertical,
between different stakeholders of the food system as seen in section 4.4 of part 1. Even
though the previously identified obstacles for logistics collaboration are taken into account
for the development of vertical collaboration, other more specific obstacles have been
identified through the content analysis. This part summarizes these.
2.2.2.1. Low integration of logistics costs by the farmers
The disconnection between farmers and their logistics costs is a perceived as an obstacle
to logistics collaboration. Most of the farmers interviewed were not aware of the costs that
their logistics organizations demand. In this way they do not directly integrate the
economic benefits of collaboration and show some reluctance to paying for a logistics
service as these testimonies reflect:
“What needs to be explained to some members is that, yes, it is 10% of direct debit, but what is the
time spent to sell a ton of potatoes, carrots in a shop? The 90€ that you give (for potatoes), you
easily spent a couple of hours” (Cooperative chair member and farmer, Interview 9 July 2014)
“I tax them up to 12%. But if [farmers] would have to go by themselves, it would be much more
than that. They are not aware of that” (Manager of a transportation pooling initiative, Interview
25 July 2014)
2.2.2.2. Difficulty to integrate the respective constraints between downstream and
upstream
When we speak about logistics collaboration we speak about a relationship between
multiple actors, multiple entities and individuals. In order to create a sustainable
collaboration it is necessary to build relationships collectively and listen to one another.
Integrating the constraints and restrictions of the others is one dimension of this listening.
During interviews, the difficulty of integrating these constraints appeared under different
forms.
69
- Selection process rigor: This has been mentioned by farmers but as well
downstream actors. This refers to the control that verifies the conformity of the goods,
either in compliance with a regulation or according to specific requirements and can many
aspects from cosmetic appearance to sugar content. A lack of understanding of how this
selection process is executed exists for some farmers who are then hesitant to work with
an entity such as a cooperative and prefer to deliver directly to the client. The farmers see
this direct link with the client not only as a way to limit the number of times their products
go through the selection process but also because they feel knowing the client personally
makes them more likely to take the product without question (a social quality addressed in
detail in section 2.2.1.3 of this part). This organic shop manager summarizes the
situation well:
“We need not to fall into the excess of the conventional selection process, but not [sacrifice quality
either]. Norabio [organic cooperative] products have been refused at Biocoop [organic shop
chain], even though those products have been accepted at the cooperative. And this because
Biocoop knows very well that, because of the distribution chain, it is going to be sold no sooner
than three days after being received from the platform. It is important to integrate the constraints
from the other. The farmer complains because Norabio is too strict, but Norabio integrates the
conditions. If not, farmers need to deliver directly, with the constraints that this creates” (Organic
shop manager and farmer, Interview 9 July 2014)
- Orders consistency: The need for orders consistency is even more important when
the client is industrialized. For example, in institutional catering, there are performances to
maintain in order to keep the costs low. This is why there is an importance for consistency
in product quality and availability as the institutional catering manager explains:
“We are not many in the kitchen and there are performances to keep if we want to keep the costs
stationary. If we do not have the products in time, it really put us in trouble. We need to have a
peace of mind concerning our suppliers and this is super important in terms of consistency”
(Institutional catering manager, Interview 23 July 2014)
- Order-delivery period: The period between when the order is made and the
delivery is important in the discussion between different LFS actors. Farmers want to have
their order in advance as much as possible in order to have time to plan and prepare it.
However, most of the clients want to give their orders at the latest time possible to gain
flexibility. This creates a situation perceived as this one:
“They need to stop to placing their orders last minute. We bust our butt to deliver not to lose the
client, but we are killing ourselves doing that” (Production and distribution platform manager,
Interview 25 June 2014)
- Free delivery value: Some establishments institute a free delivery value. This is the
minimum amount of money needed per order to be delivered free of charge with minimal
loss of profit. Coming from a logistics optimization strategy, this free delivery value is

70
sometimes perceived as disconnected from the reality of the stakeholders (Storage
limitation, limited cash advance). This is what this restaurant manager explains:
“Norabio[organic cooperative] pushes me to work with them but they have a free delivery value up
to 500 € on vegetables. This means that I need to order a lot for at least one and a half weeks. We
need to be able to store this amount of vegetables […but] we cannot store 500 € of vegetables, it
takes too much space in fridges” (Commercial catering manager, Interview 23 July 2014)
- Need for flexibility:
“At the multimodal platform, it was this time or that time, and you absolutely need somebody when
you go. You do not have access to the warehouse; it is them who bring you the products. It is very
inflexible” (Commercial catering manager, Interview 23 July 2014)
Some professions require some flexibility for their supply. That is the case for restaurants.
This flexibility is not often included in the offers made to them.
2.2.2.3. Lack of collective vision in the long run
As shown in this study, this lack of communication leads to an absence of cooperation
and that way an absence of real strategies at the food system level. Reasons for this lack
of communication are numerous, from a diversity of visions and approaches to simply lack
of stakeholder knowledge amongst themselves as previously discussed. However this
work at the food system level seems essential to the collective construction of a
sustainable and rationalized retail-wholesale organic food system. Working at the food
system level leads to an integrated approach that is crucial to address the complexity of
the food system and its interactions (Francis et al. 2003). Some actors recognize this lack
of communication such as the local and organic products production and distribution
platform manager interviewed:
“Demonstrate to one another that we can be complementary […] they didn’t believe me that it was
possible make two complementary systems work together […]the challenge is to make and
understand that : Let’s get interdependent[…]in order to develop efficient economic logistics”
(Production and distribution platform manager, Interview 25 June 2014)
This lack of food system level vision is also associated to the tendency to find short term
solutions without going into depth with the problem, trying to find the root of it and then
developing possible solutions as this board member of the organic cooperative of the
region explains:
Once again, on the subjects we deal with at Norabio, when we have a small problem we give a
small solution. No! We should take the problem and try to step back from it, looking at things in a
global way (Cooperative board member, Interview 9 July 2014)
These solutions might be more complex and harder to apply, but they are long term
solutions. This stepping back usually brings wider reflection including different
stakeholders of the food system.

71
2.2.2.4. Lack of planning between clients and farmers
One of the obstacles often mentioned by the actors from the food system is the lack of
planning between clients and farmers. This obstacle is sometimes linked to a lack of
willingness from farmers to fit to the demand or the retailers to fit to the offer. It is the point
of view of this distributor of organic products:
“There is a lack of willingness to fit to the demand from farmers[…]Regional farmers are
interested in processing only when they have surplus or are bothered with a size. It is not like that
[…] you need to match market demand” (Organic product distributor, Interview 28 July 2014)
Some stakeholders of the retail-wholesale identify some disconnection between their
needs and what is offered presently in the region. Such as this restaurant manager:
“In organic until now, it is you who needs to make the effort to look for your products. In supply, it
is mainly that. It is a lack of centralization of the offer for commercial catering” (Commercial
catering manager, Interview 23 July 2014)
2.2.2.5. Consumers’ education
Setting up vertical collaboration can be difficult because of the consumer/client education.
Seasonality or aspects of the product are dimensions that can make cooperation difficult.
Indeed,
“We need that people don’t insist on ordering products that we do not have in stock, such as
strawberries in winter for example” (Production and distribution platform manager, Interview 25
July 2014)
The acknowledgment of seasonality by clients or consumers is not always there and
therefore the demand can be in disconnection with the realities of production. It is the
same for the aspects of the products for consumers that are too used to products from the
vast selection of large retailers and supermarkets. This creates problems such as
production waste as in nature; fruits and vegetables are growing in different shapes and
size. There is work in communication necessary to suppress this obstacle:
“I think that shops in the Nord-Pas de Calais have interest to say that potatoes, if there is a little
bit of black, or the carrot if it is a bit funny looking, it is nothing. But communicate about it: it is an
excess of large retailers that lead you to think that way…We need to communicate” (Cooperative
board member, Interview 9 July 2014)
Through ‘think that way’; this cooperative board member was referring to the consumers
being used having products calibrated, from similar shapes and size, results of the
rigorous selection process from large retailers and supermarkets.

72
2.3. Logistics collaboration: Potential strategies
In order to highlight the possible leverages to logistics collaboration, it is interesting to
understand the forms that they can take. The content analysis as well as (personal
reading or literature review?) led to the identification of some of them. This part reports
this information.
2.3.1. Transportation pooling
The most natural solution coming to mind when thinking about logistics collaboration is
transportation pooling meaning gathering to group some travels. Different approaches are
considered.
- Informal mutual aid:
“She buys my tomatoes, my wife takes them when she goes to work, she meets her at the toll…we
reached an agreement” (Farmer 21, Interview 17 June 2014)
This form of collaboration is most used by farmers but often comes with problems,
especially in relation to low performances of the partners (punctuality or inappropriate
handling for example) or the feeling of unfair system.
- ‘Travel exchanges’ : Various farmers mentioned this idea:
“Some kind of a car-pooling: I have that amount of space in my car, every week I go here, there
and there and go through this city and this place (Farmer 8, Interview 2nd July 2014)
This idea comes from the “fodder exchange” already existing for the organic farmers of
the region. The farmers having fodder to sell or willing to buy put their offer on a website
organized by the Gabnor, the organization of organic farmers in the region. The idea is to
offer the travel made, the frequency, space available on an internet platform that can then
be linked with potentially interested people
- Collection: Pooling of travels can be done by a collection from the farms to put the
products on common points (cooperative or platform for example).
“We need to start a collection service for farmers […] if we bring them this service they would be
more inclined to drop some things such as delivering directly to shops, because it is in their interest
to have it collected. They gain time and still keep the traceability of their products” (Cooperative
board member and farmer 19, Interview 24 July 2014)
- Delivery in order to pool travels to clients. The SCIC of transportation is a form of
delivery pooling as explained more in the example interviewed (cf. focus on SCIC of
transportation hereafter)

73
“I imagine a truck that would go, gather the farmers’ supply, and then organize its own
distribution route on farmers markets or shops” (Farmer 12, Interview 19 June 2014)
2.3.2. Products pooling
Logistics collaboration can also include pooling products. This enables farmers or other
food system actors to create a coherent catalog bound to a specific type of client. This
would open access to new markets that cannot be reached by an individual offer. For
example:
- A CHR catalog bounds for Café, Hotel and Restaurant:
“We are forming a distributors pool with CHR axed catalog because CHR it is not the same
organization as institutional catering. We have a common catalog where each of the 4 entities put
their own items and then any CHR will be able to order to a single entity […] The objective is to
have a coherent catalog, choices” (Commercial catering manager, Interview 25 July 2014)
This commercial catering manager is explaining the project that he started a year ago with
three other actors from the food system, one distributor, two retail-wholesalers and him,
responsible for the supply in his organic restaurant. They all had trouble obtaining local
products to buy, especially processed products, and then decided to pool their products
and clients. That way, when one of them found products or clients, he presents a catalog
with the products of the three others. This catalog presents choices and diversity that fit to
CHR demand.
- Institutional catering catalog:
“It is part of ‘Terre d’Opale6’, from the beginning, to gather the offering capacity to face demand
and address new markets on which too many people hit a brick wall, for example institutional
catering” (Production and distribution platform manager, Interview 25 July 2014)
6 See Focus on Terre d’Opale p. 75 for more information
FOCUS ON…SCIC of transportation
Cooperative Society of Collective Interests for transportation
In a few words: This cooperative Society of Collective Interests for transportation
includes 8 farmers who pooled a truck and a driver to do the deliveries. Each of them,
and the driver brought a start-up capital to the SCIC, and 12% of the revenue made
with the deliveries goes back to the SCIC to make it function.
Who is part of it: 8 farmers (2 are organic) from Boulonnais area.
Logistics collaboration implemented:
- Delivery pooling (truck and driver)
74
When speaking about people ‘hitting the brick wall’ because of institutional catering
market, this manager vocalize a reality of institutional catering for many farmers.
Nowadays, as local food still represents a small portion of the volume bought by
institutions, the demand is often very irregular for farmers, in time and in volume. It is then
difficult for farmers to organize an efficient logistics around it.
Moreover, institutional catering has very specific needs because of the volume needed
and the industrialized aspect of production asked by rules as this institutional catering
manager explains:
“In my profession, it is very important to have a single representative, being Norabio7 or
Spéninque or Fort & Vert. But somebody who collects offers, gathers it and does a single delivery”
(Institutional catering manager, Interview 6 August 2014)
This manager vocalizes the importance he sees in having few clients to buy from in order
to facilitate logistics.
- A farmer catalog to meet the demand for products assortment because,
“Logistics collaboration leads to something really nice. It is: I have too much of that, and you, you
don’t have enough of that, we can get along” (Farmer 20, Interview 08 July 2014)
This farmer expresses a very common phenomenon between farmers being farmers
buying products from one another in order to extend the diversity of their offer when they
sell directly to consumers (farmers’ markets or on farm selling for example).
- Private individual catalog:
“I worked with farmers who had an online shop, 1200 clients, something like that. Some of the
farmers would bring their products to one of them; they received the orders and delivered to
everybody” (Farmer 8, Interview 2nd July 2014)
2.3.3. Logistics equipments pooling
“I think that cooperation it is good for group purchasing and negotiating equipment: Refrigerated
trailer, or refrigerated display case” (Farmer 17, Interview 19 June 2014)
As this farmer vocalizes, logistics collaboration can also be on logistics organization
equipment, especially for expensive ones such as refrigerated truck.
2.3.4. Concerted planning
Concerted planning has the objective of collectively planning production in order to
overcome the individual constraints and meet client demand. This concerted planning can
be done at different levels:
7 See Focus on Norabio p. 76 for more information

75
- Within a horizontal collaboration between farmers in order to agree on the
production of each of them depending on their capacity and will of each individual
(technical knowledge, personal drive) and farms (soil characteristics and size for
example). It is the case for these two interviewed farmers:
“We work together. He produces more in spring and I do more in fall. That way instead of offering
small quantities of everything all the time, we plan together” (Farmer 20, Interview 8 July 2014)
Terre d’Opale is a good example of horizontal collaboration (cf. focus on…Terre d’Opale
for more information). Its manager is rooted in the principle that:
The farmer doesn’t have the vocation to be the flunky of a bunch of consumers by trying, on his
own, to offer all the possible vegetables that the consumer, in his desire of diversity, wants […] In
Terre d’Opale8 we work depending on the capacity of everyone […] It is in the interest of some to
leave somebody else grow the radishes, or all the soils are not fitted for growing carrots”
(Production and distribution platform manager, Interview 25 July 2014)
- Within a vertical collaboration between farmers and other actors of the food system.
This can help the production to be more closely meet the demand:
He made me some pâtés and ready-cooked dishes[…] with him, two times a year we work on the
evolution, on consumer feedback on the products[…] I finally have a processor who is attentive to
demand, we work together and we move forward”(Organic product distributor, Interview 28 July
2014)
This distributor expressed the difficulty he had to find local farmers interested in working
with him to meet demand and the importance it is for him, and for farmers to work together
in order to meet the demand and that way securing the market.
8 See Focus on Terre d’Opale for more information
FOCUS ON…Terre d’Opale
Production and distribution platform for organic and local product
In a few words: Terre d’Opale is a production and distribution platform for organic and
local products. Production pooling enables farmers! to sell organic vegetables and fruits
boxes in the area from Dunkerque to Boulogne in France as well as deliver to institutional
catering.
Who is part of it: Various organic farms and 3 social gardens ‘Graine de Cocagne’
(rehabilitation entities through farming for people facing social exclusion)
Logistics collaboration implemented:
- Concerted planning between farmers on products to grow
- Product pooling
- Transportation pooling

76
“Today I manage to find supplies, but in the region there are not enough. There is maybe more
upstream work to plan. I have needs during the year and I would be willing if they produced more
[…] if we could anticipate our volumes more, to contractualize our volumes, and invest in storage
rooms, set up the necessary equipment. It is an investment but you can pool those. Me, carrots,
potatoes, I could have one or two more months in the year” (Institutional catering manager,
Interview 6 August 2014)
This manager vocalized the concept of concerted planning between the client and its need
throughout the year and the farmer with his production capacity.
2.3.5. Common platform
Setting up a platform has been one of the first steps in the reflection of logistics
rationalization in most of the industrial sectors as seen in section 4.3.2 of part 1 (Orsini
2008). This transit point, central or delocalized, where goods are held to be transferred to
the point of delivery, leads to the rationalization the whole transportation chain and
reduces the price of transportation. They can be of different kinds:
- Central platform, central place where products from multiple farmers are
gathered before being redistributed to different selling points. Section 4.3.2 of part 1
already described this type of downstream pooling which is closest to the n°2 model
(Orsini 2008). In the Nord-Pas de Calais region the cooperative Norabio9 plays the part of
this platform.
9 See Focus on Norabio for more information
FOCUS ON…Norabio
Cooperative 100% organic Nord-Pas de Calais
In a few words: Created in 2000, Norabio is the only 100% organic cooperative in the
region Nord-Pas de Calais. It has for objective to sell the regional organic products
and organize the marketing of organic products in order to help farmers to keep
control of the marketing negotiation.
Who is part of it: 129 organic farmers in total, 57 for the marketing of their products
and the others for supply pooling.
Logistics collaboration implemented:
- Farmers’ supply pooling (seeds, seedlings, fertilizers and other supplies)
- Product pooling (Creation of different catalogs: catalog wholesale, retail-
wholesale, and private individual boxes).
- Marketing activities pooling (Order anticipation and management pooled)
- Delivery pooling (1 driver and 1 refrigerated truck)

77
- Decentralized platform, functioning as warehouses for multiple farmers as
described in the model n°3 of logistics organization (cf. section 4.3.3 of part 1). Several
farmers gather their flows at a multi-farmer warehouse before sending the goods to the
distributer. The reason for this is because individually, producers do not have the volume
necessary to supply the central platform with the wanted frequency. This is called
‘upstream pooling’. The idea is present among some stakeholders:
“I think that the idea of decentralized platform would be good. It could make Norabio more visible
and say, yes, we are a local cooperative and we are not only in Gondecourt” (Cooperative board
member and farmer 19, Interview 24 July 2014)
“I think it would be interesting to have local platforms that have an influence in their area and that
work with the cooperative” (Production and distribution platform manager, Interview 25 July
2014)
- Dematerialized platform can also function as downstream or upstream
pooling but through an online tool to facilitate collaboration between farmers because,
“In the organic world, we miss out on all the web experiences […] dematerialized platform for the
Avesnois farmers, it could be pretty interesting. Then it could be a truck that goes to Lille once a
week to deliver.” (Farmer 12, Interview 19 June 2014)
This could be done in the form of a product pooling from different farmers on a same
internet platform, accessible to potential clients as this platform manager imagines it:
“Post the fruits of his farm to a computer that will send it to the ‘cloud’ to say to a certain number
of partners, ‘I have this to offer’. These offers are storable, buyable and geo-localized. That way,
every time that you take your truck, your know that it will not come back empty” (Production and
distribution platform manager, Interview 25 July 2014)
The second section of this part highlighted that even though a lot of interests are linked to
logistics collaboration, numerous are the obstacles that make it difficult to implement
collaboration. However, the last part showed the great variety of logistics collaboration
strategies possible. It is then important to find the form(s) of collaboration the most
appropriate to the situation.

78
PART 4: PROPOSITIONS AND CONCLUSION

79
This study has evaluated the economic, ecological and social performances of the current
situation surrounding the organic local food system (LFS) of the retail-wholesale sector in
Nord-Pas de Calais. This thesis has thus far highlighted the margins of progress which
are sometimes necessary to develop a sustainable LFS. Collaboration has been studied
as one of the potential leverage items for improving the economic, ecological and social
performances through identifying collaborative interests and potential forms collaboration
can take. However, obstacles to logistics collaboration have also been identified.
It is important to go beyond these first results to suggest recommendations. Linking the
main ideas from the field and the context into which they fit is a key step for moving
toward action.
This section will start with an evaluation of the potential of evolution in Nord-Pas de Calais
to then move toward the development of some propositions to help move toward action
and suggestions for further research. This section finishes with limitations of the study.
1. Evaluating the potential of evolution in Nord-Pas de Calais
This section evaluates the potential of evolution in Nord-Pas de Calais and reviews the
most important elements to take into account in this process of moving toward concrete
action. It highlights the strengths and weaknesses of the current situation along with the
opportunities and difficulties perceived to move toward the wanted situation (cf. part 2,
section 4.1 for more information on the methodology). The wanted situation is, for this
study, a collaborative form of logistics organization at the LFS level as has been
highlighted in the farmer and stakeholder interviews in the previous chapter.
This diagnosis guides reflection on recommendations that will help make the current
situation evolve toward the wanted situation. Suggestions rely on the opportunities
identified while building on the current situation’s strengths while limiting its weaknesses.
Suggestions also take into account the obstacles identified in order to find adequate
solutions.
In this study the current situation is the individualized logistics organization of the organic
farmers for retail-wholesale distribution channels meaning an organization with little
vertical or horizontal collaboration between stakeholders. The wanted situation, on the
contrary, is a local organic food system with a collaborative organization leading to a
situation economically profitable, ecologically sustainable and socially livable.

80
- Economically profitable because, as seen in the section 1.2 of part 3, the economic
performances of farmers logistics organization can be very low. It is important for the
food system to be sustainable in the long term, and that the hours of work done are
paid, at least up to the French minimum wage, to not endanger the survival of farms.
- Ecologically sustainable because today GHG emissions are at the center of reflection
and it is important that everyone limits their emissions. This is also consistent with the
fundamental principles of organic farming being to aim for a healthy product and the
development of an ecological and social balanced system on their farm (preserving
soil and water quality, reconnecting with the consumers mainly) discussed in section
1.1 of part 1.
- Socially livable because distribution of working hours on the farms and amount of
time dedicated to logistics are important parts of the matter discussed by farmers
currently. These dimensions are connected to the challenge of achieving a certain
degree of livability with current farming systems, especially for vegetable farmers (cf.
section 1.4 of the third section).

81
Table 17 : Evaluation of the potential of evolution - Toward a collaborative logistics in the Nord-Pas de Calais organic LFS for the retail-wholesale sector
The results of this diagnosis are gathered into a matrix in the table 17, as explained in the
methodology (cf. section 4.1 of the second part). The matrix is explained in the first part of
the section.
The dominant current situation, individual retail-wholesale with little vertical or horizontal
collaboration, have strengths but also weaknesses.
1 Strengths of the current situation -Individual logistics
organization
Two main strengths are associated with the individual logistics organization:
- Strong contact with the client is possible due to the individual organization of
the marketing channel creating direct and regular contact with the client during delivery
TOWARD A COLLABORATIVE LOGISTICS ORGANIZATION
Retail-wholesale sector in the Nord-Pas de Calais organic local food system
Individual retail-
wholesale
Current
dominant
situation
Little vertical or
horizontal
collaboration
STRENGTHS
Strong link with the client
Flexibility and independence
WEAKNESSES
Discredit of logistics by farmers
- High logistics costs in a context of
increasing fossil energy cost.
- High working hours allocated to logistics
tasks
- High environmental costs
Collaborative
retail-wholesale
Wanted
situation
- Economically
profitable
- Ecologically
sustainable
- Socially
livable
OPPORTUNITIES
Increasing amount of farmers
questioning their logistics
Perceived interest to logistics
collaboration by key actors of the food
system (Increasing time availability,
accessing new markets, decreasing
logistics costs)
Existing involved stakeholders,
“champions” having a holistic vision of
organic food system development.
Existing success stories of rationalized
logistics organization in the region
THREATS
Singularity of each system limiting
transportation pooling between farmers
Isolation, geographic remoteness of
farmers
Potential loss of human relationship
Lack of confidence between farmers
(competition, punctuality)
Individualistic culture
Necessity to take the time to reflect to
build a long term vision
Difficulty to integrate the respective
constraints between downstream and
upstream
Lack of planning between clients and
farmers

82
and order organization. This strong link is associated to numerous benefits such as quick
reaction in case of problems, canvassing other products or simply providing a social link,
getting out of the farm, seeing different people and being in contact with new ideas or
information.
- The individual logistics organization also brings independence and flexibility.
Working individually leads to more freedom in the choices made or the decisions taken.
This brings a certain rapidity of action through a real control of the logistics tools which
can be difficult in a collaborative scheme.
2 Weaknesses of the current situation-Individual logistics
organization
The weaknesses of the current situation are the main reasons that this study commenced.
Indeed, LFS have been questioned on their economic, social and ecological performances
(cf. section 3 of part 1). The individual organization of farmers leads to a poor
rationalization of the distribution channels and logistics. This leads to:
- High logistics costs with 23% of the revenue corresponding to logistics on
average reaching 34% for the vegetable farmers interviewed (cf. section 1.2 of part 3).
- High working hours dedicated to logistics, especially in the retail-wholesale
because of the characteristics of this distribution channel (little volume of varied products
to numerous delivery points) (cf. section 1.4 of part 3). It is on average 12h30 per week
dedicated to logistics for the interviewed farmers going up to 35h30. These numbers
illustrate the need to develop systems that are livable for the farmers involved in them (cf.
section 1.4 of part 3).
- And finally the ecological costs of individual logistics organization with low
rationalization are high. Ecological impacts of LFS are more and more discussed among
the academic sphere (cf. section 1.3 of part 3). The study shows that the average energy
intensity is 9.2 kg of CO₂ for 100 € of revenue that is to say a average of 3.3 tons of
emitted CO₂ per year due to the logistics organization of the retail-wholesale distribution
channel.
These economic, social and ecological results could be improved by a better logistics
rationalization. That can be done through an increasing collaboration between the food
system actors. This is the studied scenario for the wanted situation. It is now important to
highlight the opportunities that can help and obstacles that can hinder the development of
the wanted situation; this collaborative retail-wholesale distribution channels for organic
farmers in the studied area, the Nord-Pas de Calais.

83
3 The opportunities for an evolution toward the wanted situation
Opportunities are the elements on which it is possible to rely to make the current situation
evolve toward the wanted situation. At the individual farmers’ system level, two
opportunities stand out. The first is one of the reasons this study was requested by
Gabnor. It corresponds with the questioning of some farmers on their logistics
organization. For the past two years, reflections about logistics organization and its
optimization have been brought up by farmers and discussed during meetings and
workshops organized by the organization of organic farmers in the region, Gabnor (as
seen in the presentation of the case study area in the introduction). This study presents an
opportunities by reflecting upon these questions and can help farmers to realize possible
ways to reach solutions; for example evaluating logistics organization performances.
A second opportunity has been highlighted by this study. As seen in the section 2.1 of the
results, farmers have interest in logistics collaboration. The perceived interests
identified previously allow an understanding of the farmers’ expectations and concerns
among one another and that way adapt the dialogue when introducing new projects of
logistics collaboration appropriately.
At the food system level, for the local organic food system for retail-wholesale in the area
of research, the presence of actors having a holistic vision of the development of organic
farming are an important opportunity situation evolution. Indeed, these people often are
those that initiate, inspire or lead innovative initiatives locally. These ‘champions’, as
defined by J. Bagdonis et al. ((Bagdonis et al. 2008), play a major role, not only at an
operational level but as well for implementing projects. Indeed, these champions bring
energy, motivation, passion and commitment. Their network and their resources are keys
to enhancing change and evolution. They can be the link between different stakeholders
by maintaining the energy and the enthusiasm in a process of evolution and
implementation of innovative collaborative system for logistics organization. These
‘champions’ are present at different level of the food system. Some are farmers, often
representatives in farmers organization (such as the organic farmer’s organization Gabnor
or the organic cooperative Norabio), others are active in other parts of the LFS such as
organic shop owners or institutional catering managers.
The identified ‘champions’ are often linked to an example of collaborative logistics in
the region. These examples are a source of inspiration. Indeed, a better understanding of
their current functioning, their history and evolution and the difficulties they came across is
a good basis for reflection. It is important to rely on what exists in order to integrate their
potential in a scheme of action. The cooperative Norabio is the main example of logistics

84
collaboration in the region. It is a tool with a major potential as it already gathers 129
farmers and has a sphere of influence at the regional level (see Focus on…Norabio 76).
The production and distribution platform Terre d’Opale is another example of a tool to take
into account in the reflection around logistics organization at the regional level because it
is innovative on elements such as concerted planning for example. (cf. Focus on…Terre
d’Opale p 75). Other examples exist such as farmer’s shops (product pooling), SCIC of
transport is an example of transport pooling (cf. Focus on…SCIC of transport p. 73) and
distributor pool (product and marketing pooling). An understanding of these examples can
add constructive elements to a broader reflection at the food system level.
The differences depending on the region infer different ‘champions’ and initiatives. There
is no one solution that can be applied everywhere, but a rather the interaction between the
existing strengths and opportunities of the current local food system and the wanted
situation chosen.
4 Threats preventing evolution of situation toward the wanted
situation
The identified threats are a summary of the obstacles identified in the results and
discussion of the qualitative analysis (cf. section 4.1 of the part 2 for more information on
the methodology).
Technical obstacles can inhibit logistics collaboration. These technical obstacles can be
caused by the singularity of individual farming systems, and are linked to the variety of
products (different seasonality, refrigeration material necessary and current laws and
regulations), variety of containers/packaging, or working hours (cf. section 2.2.1.1 of the
results and discussion). This obstacle is recognized by all the interviewed farmers as a
limiting factor for collaboration, especially for transportation pooling between farmers (cf.
section 2.2.1.1 of the results and discussion). Another technical obstacle is the isolation
from other farmers, the geographic distance between them (cf. section 2.2.1.5 of the
results).
The obstacles can also be human such as the fear for a loss of direct relationship with
client mentioned by half of the interviewed farmers, direct relationship present in the
current situation of individual organization mentioned in the strengths of the situation (cf.
section 2.2.1.3 of the results). The lack of confidence among farmers is another human
obstacle for logistics collaboration mentioned by up to 90% of the interviewed farmers (cf.
section 2.2.1.2 of the results). This lack of confidence between partners is mainly due to
lack of punctuality or bad handling of goods. Finally the individualist culture is perceived

85
as an obstacle for 40% of the farmers and mentioned by other LFS actors (cf. section
2.2.1.4 of the results).
Other obstacles have been highlighted such as the necessity to reflect on the current
situation in order to enable a long term vision; the difficulty to integrate the respective
constraints between downstream and upstream and the lack of planning between clients
and farmers (cf. section 2.2.2 of the results).
This diagnostic summarizes the current situation in the studied region regarding the
strategic vision of an evolution toward a more collaborative system economically
profitable, ecologically sustainable and socially livable as defined earlier in this section (cf.
p. 80). What recommendations can be made from this diagnosis to initiate the evolution of
the reflection toward action? This is the content of the next part of this section.
2. Recommendations for action
The development of a collaborative and rationalized logistics can only be done at the food
system level through cooperation between the various food system actors as a systemic
thinking is necessary to understand the interactions and practices of the current situation
to move toward a wanted situation (Ison 2008). However farmers remain key actors of the
LFS and it is through their choice of marketing channels and logistics that a larger scheme
of collaborative logistics can emerge. Working at the farmers’ ‘level is necessary in
parallel to working at the food system level.
In this way, the diagnosis highlights two levels of action:
- 1) Work at the farmer’s level in the region
- 2) Work at the LFS level in the region

86
For each level of action, recommendations are suggested in response to the diagnosis of
evolution potential made previously. For each of these approaches, a main idea is
expressed and explained, followed by ideas for action or further studies.
5 Farmers’ approach
Farmers are the main actors of the organic LFS. It has been shown in the results that
most of the farm not aware of the impact of their logistics on the economy of their farm or
their working time (cf. section 2.2.2.1 of the results). In order to start a reflection on
logistics organization at the food system level for the organic retail-wholesale sector and
before speaking about rationalization and logistic collaboration, it is important to increase
the farmers’ knowledge and awareness on these topics.
5.1 Individual diagnostic on logistics performances
The disconnection between farmers and their logistics costs has been highlighted
previously (cf. section 2.2.2.1 of the results). Time spent on logistics and the associated
costs are often neglected and excluded from the general farm strategy. Farmers
questioning their logistics organization are an identified opportunity to move toward a
more collaborative organization.
Two levels of
work
Farmers’ approach Food system’s approach
Exchanges and reflection
between farmers
Training for logistics
management tools
Individual evaluation of logistics
performances on farms Building a shared vision for
sustainable logistics in the organic
LFS in the retail-wholesale sector
in the Nord-Pas de Calais
Further study on the constraints
from downstream/upstream
Awareness/education campaign
for consumers
From
awareness to
rallying
Action Action-Collaboration Action plan
Ideas and
further studies

87
Giving farmers elements, individually, about the performance of their logistics, is a key
step to initiate reflection on their marketing strategy and the impact of their logistics.
Helping them evaluate the social, economic and ecological performances of their logistics
at the farm level, can initiate a more global reflection at the food system level as it will help
them perceive the multidimensional aspect of their logistics, help them grasp the
interconnectedness between the parts, the subsystem as Armson (2011) call them, and
understand the impact that change in a subsystem or its relationship to other subsystems,
at the farm level, can have in the system as a whole, the LFS in the region (Armson
2011). This study brings a framework to this diagnostic as it led to the identification of key
indicators and a method to calculate them (cf. section 2.1 of the materials and methods).
From the indicators used in this study, it is possible to build an individual diagnostic of
logistics performances. This diagnosis brings a social, economic and ecological dimension
in order to bring farmers’ attention to the multidimensional impact of their logistics. This
diagnostic can be completed at different levels on the farm and it can be helpful to
compare, on a same farm, the different modalities or delivery routes depending on the
accessible data, to compare their efficiency and profitability and then be able to orient
choices and marketing strategies. An organization such as Gabnor, regional organic
farmers’ organization, could facilitate this process of increasing farmers’ awareness.
Appendix 11 highlights an example of diagnosis that has been done for an interviewed
farmer (cf. appendix 11).
Organize an exchange between farmers around the results of these individual
performances is important to initiate a collective reflection. The reflection should be guided
in a way to identify the reasons leading to differences between farmers, to highlight the
elements that make an efficient system, thinking about the strengths of efficient
organization and emphasize ideas and sources of inspiration to stimulate the reflection of
each farmer. The discussion can be canalized to different genres of organization
depending on the need: planning, preparation, and delivery, order management or
collaboration, for example. As has been seen in the previous section, the results of the
diagnostic vary greatly depending on the product. Different products have different
logistics characteristics. The singularity of each system can make the comparison of the
logistics strategies performances difficult. This is why it is important to compare systems
that are more or less equivalent. For that reason it could be constructive to organize the
exchange between farmers through groups of the same category of products.

88
5.2 Training for logistics management tool
As highlighted throughout this study, logistics organization is not limited to the only
organization of delivery. As seen in the results, 23% of the time dedicated to logistics is for
planning, from taking the order to invoicing. It represents 14% of the logistics costs. It is
important for farmers to gain knowledge about how to optimize this part of the logistics.
Training farmers to use a logistics management tool can be a starting point to enable
farmers to compare the different selling points, to follow the details of the sales, the
revenue, and the volume of products associated or the regularity of the orders for
example. Knowing these information can help to make decisions and formulate logistics
strategies in the future.
Few are the farmers using computer tools to follow their deliveries and orders. It is only 5
farmers of 18 interviewed who have a computerized data. Another way to increase
farmers knowledge about logistics is to train them to use software for logistics
management which can be an Excel tool (or Open office for a free software), or more
sophisticated software depending on the expectations of farmers, their involvement and
the how they plan to use the data. This type of training can be especially relevant for dairy
farmers having planning costs more important than the others due to a high number of
selling points and that way have a more complex logistics to follow orders and sales.
6 Food system approach
Even if the work at the farmers’ level is necessary to increase their knowledge about
logistics, it is only efficient if correlated with a more holistic reflection at the food system
level (Francis et al. 2003). This study shows that logistic costs are underestimated and
that farmers often ‘offer’ this service to their client, either because it has always been that
way or because they are afraid of losing their clients. To involve various actors of the LFS
in the reflection, from farmers to consumers can lead to a better understanding of the
realities of everyone. Building a collective vision can be a way to involve and gather the
actors of the organic LFS in a project of developing a sustainable logistics as will be
explore in the following section.
6.1 Building a shared vision
Numerous are the key stakeholders and projects identified in the organic LFS for retail-
wholesale sector in the Nord-Pas de Calais region. However, communication linkages are
missing. One of the identified obstacles inhibiting logistics collaboration is the lack of
reflection to realize a long-term vision. This obstacle has been mentioned by five
interviewees. How to create the link between these initiatives, these actors, and these
89
projects? How can the awareness and involvement of stakeholders of the LFS be
facilitated? Building a collective vision in the long run on the theme of developing
sustainable logistics in the retail-wholesale sector of the organic LFS in Nord-Pas de
Calais can be a suggestion.
“If a person is dreaming, it is just a dream; but if several people dream together, it is the
beginning of something new” Brazilian
“If you want to build a ship, don’t content yourself with gathering the men, the wood and
the steel, but tell them about the seas the vessel will sail to and fro to make them dream
about it” Antoine de St-Exupéry
A visioning process can be described as a way or tool to move out of a “messy situation”
towards a future wanted situation. It can be difficult to create a consensus because of
conflicting interests and different world views (Checkland & Poulter 2006). Visioning is a
method that enables the stakeholders to move away from these constraints and review
the challenges as possibilities, where current limitations do not suppress ideas and
inspirations. In Marjory Parker’s book Creating Shared Visions, a vision is about getting
inner experience of a future wished situation, which are so clear and concrete that we can
feel them if they are realized. When visioning, the idea is not to rush into action planning
but first take time to think about where we want to go in the long term, regardless of the
potential hindrances, and then to think about the best way to get there (Parker 1990).
A very valuable start point to a visioning session is a ‘Brain-stilling exercise’, which has
the purpose of opening up the minds of the participants, and clearing out perceptions of
the current problems and worries. This is done in a form of a relaxation, or meditation
where participants close their eyes and clear their minds. Brain-stilling is followed by an
introduction to the visioning session – bringing the participants to the future, which the
participants then describe from their open mind. A good way to guide participants in their
visioning work is to end the introduction with open questions to help participants structure
their thoughts and ideas. Finally, the participative building of the vision takes place, based
on exchange about the vision of each one. It is during this phase that convergences and
conflicts appear (Parker 1990).
This exercise enables participants to imagine a global solution for the wanted situation
instead of limiting themselves to problem solving. Problem solving is centered on
difficulties and usually results in addressing each problem individually without having a
holistic approach. By creating space for ideas and visions to emerge, you enable people
to contemplate what they truly want to see in the future and to express ideas that they

90
may not allow themselves to develop because of the predetermined limitations often
imposed by society (Parker 1990).
Once the objectives are defined and agreed upon through the shared vision, the
stakeholders can think about the first steps to reach the vision depending on the current
situation. For this research, these actions take into account the current situation,
summarized in the potential of evolution diagnosis in the previous part (cf. section 1 of this
last part). They rely on the identified opportunities and take into consideration the
obstacles to bring actions that have the best chance to lead to positive and constructive
results. It is important to have regular time for exchanges among the stakeholders of the
LFS throughout the years, to evaluate the evolution of the situation, discuss the
challenges found, the successes, and remembers the shared objective and vision.
6.2 Further studies on downstream and upstream respective
constraints
Another action possible at the food system level is to do further studies on downstream
and upstream respective constraints in order to facilitate vertical collaboration between
different actor of the food system. The difficulty to integrate constraints between
downstream and upstream is an obstacle to logistics collaboration, especially to
collaboration in time, through a sustainable and cordial relationship between farmers and
clients. Within every aspect of the logistics chain, selection process rigor, order-delivery
period, need for flexibility or consistency, free delivery value, etc. are all examples where
every actor of the food system has specific constraints. In order to maximize vertical
collaboration it is important to minimize these constraints.
Further study could be done on identifying the constraints of the downstream and
upstream actors, explaining the reasons these constraints exist and identifying possible
forms of collaboration/ organization overcoming these constraints and highlighting
conditions under which collaboration can be sustainably established. It could be
constructive to gather representatives of farmers (including representatives of different
products to demonstrate varying constraints) and clients (varying depending on the nature
of the modality).
6.3 Education/awareness campaign for consumers
Consumer education is an obstacle that appears through the “difficulty to integrate the
respective constraints from downstream and upstream”. Six of the interviewees of this
study mentioned consumers’ consumption preferences as an obstacle to the
implementation of vertical logistics collaboration (cf. section 2.2.2.5 of the results).

91
Consumer demand is often disconnected from the local reality of production because they
are not in sync with the seasonality of the products offered. Moreover consumers are used
to standardized products coming from the drastic selection process of the supermarkets
and major retail-wholesalers which leads to a significant refusal rate and waste of food.
This problem is especially present in shops where there is often no direct link between the
farmer and its products.
It is important to involve all the parties of the food system in order to handle the complexity
of change, to ‘close the loop’ (p. 112). Consumers are not always involved in the matter of
changing the food system, and don’t always make the connection between their food,
agriculture and the environment they live in (Francis et al. 2003).
Communication on this topic in shops is an important part of changing consumers’
consumption habits. Informing on seasonality and aspects of products, popularizing
explication on what led to the standardization of products, advertizing the diversity of
shapes and size are example of actions that could be done to that purpose, or
communicating on taste and originality. Existing campaigns already exist on local and
seasonal food such as the campaign “Organic and local, it’s the ideal” started in
September 2014, by the FNAB, the national federation for organic farmers in France.
However, not many exist on the aspects and issues surrounding the standardization of
products and waste.
It is through constant and varied work with consumers that they can be deconditioned
from the system in which they have always evolved to build new references and lead,
finally, to a relaxing of the selection process and decrease food waste.
3. Limitation of the study
The major limits of this study are linked to the quantitative analysis necessary for the
evaluation of logistics performances. Indeed, farming being an activity which is seasonal,
it is difficult to estimate data such as average revenue delivered every week or travel
distance per week as it can vary greatly from month to month or year to year. To try to be
as precise as possible volumes and kilometers have been estimated per year to then be
brought back to weekly frequencies. It could be more precise to do this evaluation of
logistics performances on a longer run with a sample of chosen farmers in order to gather
more precise data.
Data on volume or weight of products were in the questionnaire to gather ecological
indicators not independent on from the economic factor (revenue) and be able to compare
systems of different products. However, the data collection phase showed its limits.

92
Seasonality and great variation from week to week made it too complex to gather that
information in the frame of this study with the time allotted.
Moreover, as no literature exists about logistics performances of organic LFS for the retail-
wholesale sector, the absence of existing references prevented comparison and
integration of the results in a broader scheme. This study was interested to highlight the
differences between the different productions. It would be now interesting to focus a study
on specific products such as vegetables or dairy products, for example, in order to gather
enough data to find correlations between logistics performances and marketing strategies.
It would be as well helpful to study in more details the existing projects of logistics
collaboration in the studied area, highlighting their challenges and strengths and analyzing
their evolution in time within the food system.
This study is a broad study, building a base, a reference for further studies.

93
Works cited
Agence Bio, 2013. L’agriculture biologique, ses acteurs, ses produits, ses territoires.
Agence francaise, Montreuil-sous-Bois, France, 254 p.
Agreste, 2011. Nord-Pas de Calais, recensement agricole 2010, Circuits courts. Agreste
Nord-Pas de Calais, 6-7.
Agreste, 2012. Rescencement agricole 2010-Commercialisation des produits agricoles-Un
producteur sur cinq vend en circuit court. Agreste primeur, 4-5.
Allard, G.; & Henning, J., 2000. L’agriculture biologique face à son développement -
Organic Agriculture Faces its Development INRA Editions, ed., Versailles, France,
396 p.
Andreani, J.-C. & Conchon, F., 2003. Méthodes d’analyse et d'interprétation des études
qualitatives : Etat de l'art en marketing. Revue francaise du marketing, 1-26.
Armson, R., 2011. Understanding systems, in: Armson, R., Growing wings on the way-
Systems thinking for messy situations. Triarchy Press, ed.,Devon, UK, pp. 133-159.
Aubry, C., Bressoud, F. & Petit, C., 2011. Les circuits courts en agriculture revisitent-ils
l’organisation du travail dans l’exploitation ?, in: Béguin P., Dedieu B., Sabourin E. Le
travail en agriculture : Son organisation et ses valeurs face à l’innovation,
L’Harmattan ed., Paris, France, pp. 19-35.
Bagdonis, J.M., Hinrichs, C.C. & Schafft, K. a., 2008. The emergence and framing of farm-
to-school initiatives: civic engagement, health and local agriculture. Agriculture and
Human Values 26(1-2), 107-119.
http://link.springer.com/10.1007/s10460-008-9173-6 [Retrieved April 4, 2014].
Barratt, M., 2004. Understanding the meaning of collaboration in the supply chain. Supply
Chain Management: An International Journal 9(1), 30-42.
Berger, B., 2013. Performance environnementale des circuits courts. Référence Circuits
courts, 16 p.
Brudey, N. & Ducrocq, C., 2000. La distribution. 3ème édition, collection «. V. E. ». Edition
Vuibert, Paris, France, 145 p.
Capt, D., Chiffoleau, Y. & Gauche, A., 2011. Elaboration d’un référentiel technico-
économique dans le domaine des circuits courts de commercialisation. Partie 1
Cadre d’analyse, méthodologie et synthèse des résultats Légumes et Produits laitiers

94
en circuits courts. Rapport pour le Ministère de l’Agriculture, de l’Alimentation, de la
Pêche, de la Ruralité et de l’Aménagement du Territoire, 54 p.
Checkland, P. & Poulter, J., 2006. A Fleshed-out account of SSM, in Checkland, P.,
Poulter, J., Learning For Action: A Short Definitive Account of Soft Systems
Methodology, and its use Practitioners, Teachers and Students. Edition John Wiley
& Sons Ltd, pp. 23-63.
Chiffoleau, Y., 2012. Circuits courts alimentaires, dynamiques relationnelles et lutte contre
l’exclusion en agriculture. Economie rurale (332), 88-101.
Commissariat général au développement durable, 2013. Consommer local, les avantages
ne sont pas toujours ceux que l’on croit. Le point sur-Economie et évaluation, 158
(2013), p.4.
http://www.developpement-durable.gouv.fr/IMG/pdf/LPS158.pdf. [Retrieved June,
25th, 2014]
Edward-Jonhs, G. et al., 2008. Testing the assertion that “local food is best”: the
challenges of an evidence-based approach. Trends in Food Science & Technology,
19(5), 265-274.
Etude Xerfi, 2012a. Le marché des produits biologiques à l’horizon 2015, 25p.
Etude Xerfi, 2012b. Stratégie de croissance et de différentiation sur les marché des
produits alimentaires régionaux, 62p.
European commission-Europaid, 2006. SWOT Analysis, 15 p.
FAO, 2007. Conférence internationale sur l’agriculture biologique et la sécurité
alimentaire-FAO (Organisation des Nations Unies pour l'alimentation et L'agriculture).
p.1.
http://www.fao.org/organicag/ofs/index_fr.htm [Retrieved May 22, 2014].
FNAB, 2014. Une économie bio qui concilie intérêts privés et bien commun. In
L’agriculture biologique : Prix Nobel de l'économie ? - Concilier intérêts privé et
général, zoom sur les pratiques collectives des producteurs bio. Paris, 1-11.
Francis, C. et al., 2003. Agroecology: The Ecology of Food Systems. Journal of
Sustainable Agriculture 22(3), 99-118.
GABNOR, 2011. Les services environnementaux pour construire une économie agricole
durable. , 9 p.
http://www.gabnor.org/images/stories/Documents/Documentation/services_environ
nementaux.pdf. [retrieved June, 29, 2014)

95
Gonçalves, A., 2013. La performance des organisations logistiques des circuits courts de
distribution- Une analyse des déterminants et leviers d ’amélioration. Univérsité Lille
1., 245 p.
Hendrickson, M.K. & Hefferman, W.D., 2002. Opening spaces through relocalisation:
locating potential resistance in the weaknesses of the global food system. Sociologia
Ruralis, 42(4), 348-369.
Herault-Fournier, C., 2010. Les circuits courts : Définition (s) et enjeux. Les Carnets Pro
de Liproco n°1, 10 p.
IFEN, 2006. Source d’impact d'émission de gaz à effet de serre dans la chaîne
alimentaire, 39 p.
IFOAM, 2010. Organic food and farming- A system approach to meet the sustainability
challenge. IFOAM EU Group, 24 p.
INSEE Nord Pas de Calais, 2009. Population du Nord-Pas-de-Calais : stabilité
d’ensemble, dynamiques territoriales contrastées. Page de profils 50, 6 p.
Ison, R.L., 2008. Systems thinking and practice for action research, in Peter W. and
Bradbury Reason, The Sage Handbook of Action Research Participative Inquiry and
Practice. Hilary edition, London, UK, 139-158.
Krippendorff, K., 2003. Content analysis : an introduction to its methodology 3rd Revise.
Edition SAGE Publications Inc, 456 p.
Lampkin, N., 2003. Organic farming-Agriculture with a Future, in Organic farming.
Dunfermline, FIF, edition B. W. B. Ltd, United Kingdom: Old Pond Publishing, pp.1-
10.
Messmer, J.-G., 2013. Les circuits courts multi-acteurs : Emergence d ’ organisations
innovantes dans les filières courtes alimentaires. Rapport INRA-MaR/S, 69 p.
Orsini, D., 2008. La logistique de la grande distribution. Sétra (Service d’études
Techniques des route et autoroute), 26 p.
Parker, M., 1990. Creating Shared Vision: The story of a pioneering approach to
organizational revitalization., Oak Park, USA, 456 p.
Perez-Zapico, B., 2008. Une évaluation de l’impact du transport dans l'alimentation.
Comparaison entre circuits courts et circuits longs du Pays de Dinan. Université
Rennes 2-Haute Bretagne, 132 p.
Pirog, R. et al., 2001. Food , Fuel , and Freeways : An Iowa perspective on how far food
travels, fuel usage, and greenhouse gas emissions. Leopold Center for Sustainable
Agriculture, 37 p.

96
https://www.leopold.iastate.edu/sites/default/files/pubs-and-papers/2011-06-food-
fuel-and-freeways-iowa-perspective-how-far-food-travels-fuel-usage-and-
greenhouse-gas-emissions.pdf. [retrieved July, 2014]
Quivy, R. & Van Campenhoudt, L., 1995. Manuel de recherche en sciences sociales 2e
édition. Dunod, ed., Paris.,France, 284 p.
Rastoin, J.-L. & Ghersi, G., 2010. Le système alimentaire mondial. Concepts et méthodes,
analyses et dynamiques Éditions Q., Versailles., France, 565 p.
Redlingshofer, B., 2008. L’impact des circuits courts sur l’environnement, in Marechal, G.,
Les circuits courts alimentaires. Bien manger dans les territoires. Dijon, France, pp.
175-185.
Sanz, C.J. & Muchnik, J., 2011. Introduction : Ancrage et identité territoriale des systèmes
agroalimentaires localisés. Economie rurale, 322, 4-10.
Schlich, E.H. & Fleissner, U., 2005. The ecology of scale: assessment of regional energy
turnover and comparison with global food. International Journal of Life Cycle
Assessment 10(3), 219-223.
Sohier, J. & Sohier, D., 2013. Logistique 7ème ed. edition Vuibert, Paris, France, 181 p.
Souchier, R., 2013. Made in local: Emploi, croissance, durabilité : et si la solution était
locale ? Edition Eyrolles, Paris, France, 312 p.
Stassart, P.M. & Jamar, D., 2009. AB et verrouillage des systèmes de connaissances
Conventionalisation des filières agroalimentaire bio. Innovations Agronomiques 4,
313-328.
Touboul, P., 2013. Guide méthodologique pour réaliser une thèse qualitative, 25 p.

97
Appendices
Appendix 1: Expert Interviews - Details on the experts
Affiliation of the
interviewee
Field of
Expertise Projects similar to the study
Researcher at IFSTTAR
(French Institute of the
Transportation, Planning
and Network Sciences and
Technology)
Short supply
chains logistic
organization
- PhD thesis on “The logistic
organization performances of local food
system” (2013)
- Study in process on logistic
alternative for short supply chains in
Nord Pas de Calais (2014-2016)
Researcher in the
organization “Virage
Energie Nord-Pas de
Calais”
Energy
transition- Food
energy costs
- Study on energy sobriety
including a ‘food’ scenario with an
section on localizing the food system
(2013)
- Study in process about the
assessment of energy content of local
meals (2014)
Researcher/Professor in
logistic management at Lille
University 3.
Transportation
and logistics
management
Head of his department and interested
in the rural problematic around logistics
and transportation.
Project manager on the
organic sector organization
in Gabnor
(Nord Pas de Calais organic
farmers organization)
Organization of
the organic
sector in the
region
Work to structure the organic sector
and develop distribution channels for
organic products.
FNAB (National Federation
of Organic Agriculture)
Organic sector
localization
Study in process on localizing the
organic fruits and vegetables
“Saveurs et saisons”
manager
Logistic
management
Manager of an organic bakery and
organic shop specifically concerned
with logistic matters
Project manager of
“Livicote”
Transportation
and logistics
management
Project of mobility service associating
carpooling and car-sharing between
individuals on rallying points
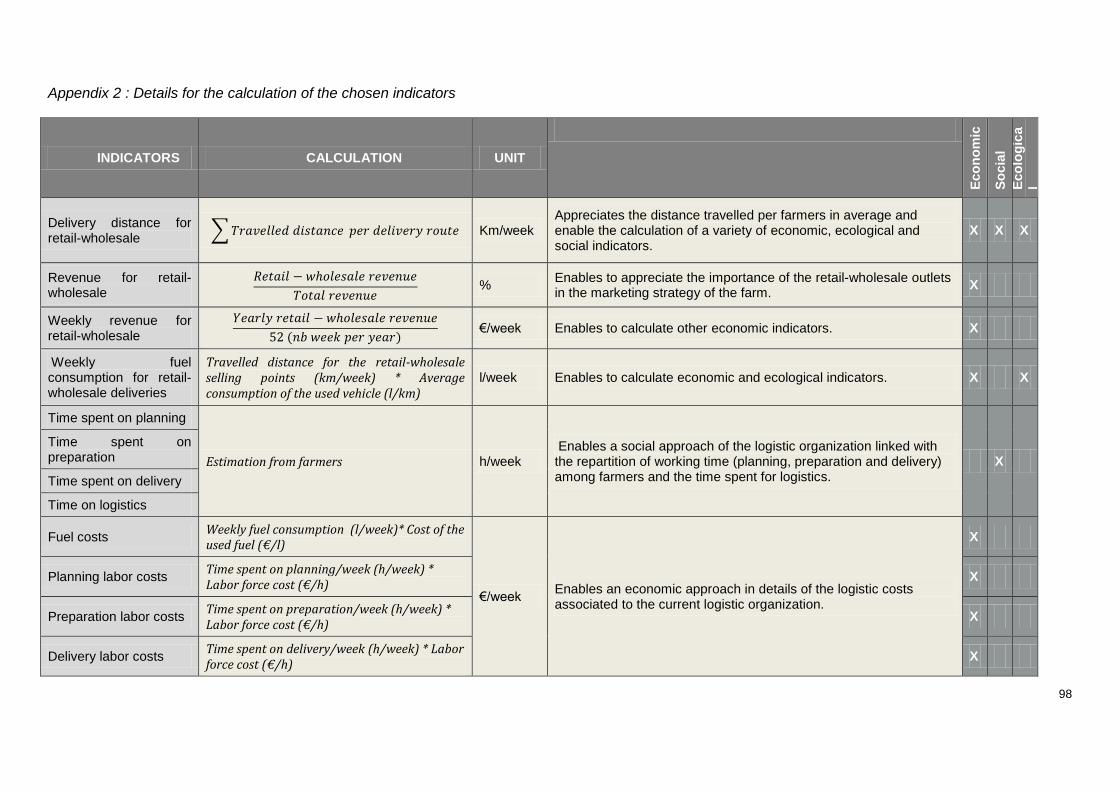
98
Appendix 2 : Details for the calculation of the chosen indicators
INDICATORS CALCULATION UNIT
Eco
no
mic
So
cia
l
Eco
log
ica
l
Delivery distance for retail-wholesale
Km/week Appreciates the distance travelled per farmers in average and enable the calculation of a variety of economic, ecological and social indicators.
X X X
Revenue for retail-wholesale
%
Enables to appreciate the importance of the retail-wholesale outlets in the marketing strategy of the farm.
X
Weekly revenue for retail-wholesale
) €/week Enables to calculate other economic indicators. X
Weekly fuel consumption for retail-wholesale deliveries
Travelled distance for the retail-wholesale selling points (km/week) * Average consumption of the used vehicle (l/km)
l/week Enables to calculate economic and ecological indicators. X X
Time spent on planning
Estimation from farmers h/week Enables a social approach of the logistic organization linked with the repartition of working time (planning, preparation and delivery) among farmers and the time spent for logistics.
X
Time spent on preparation
Time spent on delivery
Time on logistics
Fuel costs Weekly fuel consumption (l/week)* Cost of the used fuel (€/l)
€/week Enables an economic approach in details of the logistic costs associated to the current logistic organization.
X
Planning labor costs Time spent on planning/week (h/week) * Labor force cost (€/h)
X
Preparation labor costs Time spent on preparation/week (h/week) * Labor force cost (€/h)
X
Delivery labor costs Time spent on delivery/week (h/week) * Labor force cost (€/h)
X

99
INDICATORS CALCULATION UNIT
Eco
no
mic
So
cia
l
Eco
log
ical
Delivery costs Delivery labor cost (€/week) + Fuel costs (€/week)
€/week Summarizes the economic cost of delivery in its totality (labor and fuel)
X
Total logistics costs Planning labor cost (€/week) + Preparation labor cost (€/week) + Delivery costs (€/week)
€/week Highlights the global cost caused by logistics (planning, preparation, delivery)
X
Ratio logistics costs versus revenue
Total logistics costs (€/week)/ (€/week)
% Highlights the weight of logistic organization
Example : 1 euro of revenue correspond to x euro of logistic costs X
Delivery distance profitability
(Weekly revenue (€/week)/ Nb km travelled/ week (km/week))*100
€ gained / 100 km travelled
Show the profitability of the travels
Example : 100 km of travel brings in x € of revenue X
GHG emission Weekly fuel consumption (l/week)* GHG emission corresponding to the corresponding fuel (kg CO²/l)
CO₂ Kg/
week
Shows the ecological cost of the logistic organization
Example : The logistic organization of farmers release in average x
kg of CO₂/week/farmer
X
Energy intensity CO² emission (kg/week)/Weekly revenue (€/week)
Kg CO₂ emitted / € gained
- Illustrates the ecological impact of the economic activity - Shows the dependence of the revenue toward energy
Example: Each euro gained causes a GHG emission of x kg of
CO₂.
X
Energy profitability Weekly revenue (€/week)/ Weekly fuel consumption (l/week)
€ gained / Kg CO² emitted
- Shows the economic profitability of the ecological impact - Shows the dependence of the revenue toward energy
Example: Each kilo of emitted CO₂ corresponds to a gain of x
euro.
X X

100
Appendix 3 : Farmers’ questionnaire
Marketing channel (modality)
Selling points (Where) When (delivery) ? Sold volume of
products in the selling points (ton or %)
What kinds of products are concerned by this outlet?
Revenue (€)
CSA type
On farm selling
Farmers market
Farmers’ shop
Cooperative
Shops
NRC (institutional catering or restaurants)
Supermarkets
Other (precise)
Total revenue on the farm
Portion of the revenue dedicated to the organic part of the farm (%)
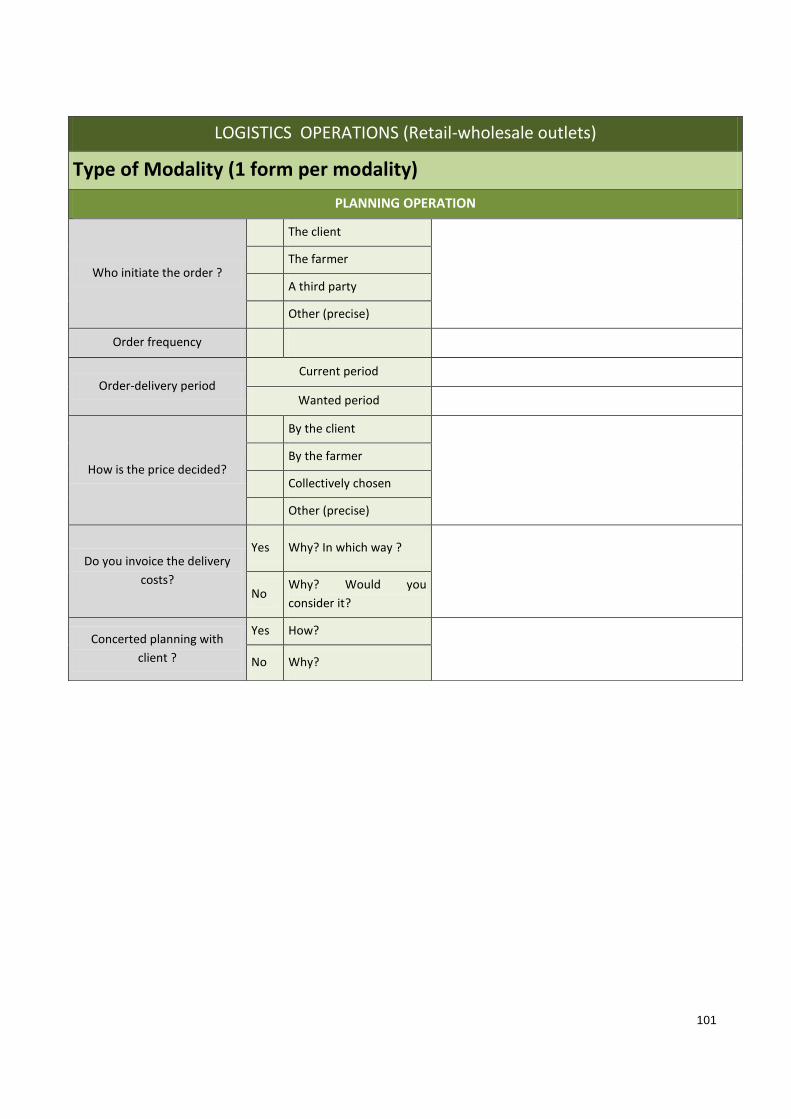
101
LOGISTICS OPERATIONS (Retail-wholesale outlets)
Type of Modality (1 form per modality)
PLANNING OPERATION
Who initiate the order ?
The client
The farmer
A third party
Other (precise)
Order frequency
Order-delivery period Current period
Wanted period
How is the price decided?
By the client
By the farmer
Collectively chosen
Other (precise)
Do you invoice the delivery
costs?
Yes Why? In which way ?
No Why? Would you
consider it?
Concerted planning with
client ?
Yes How?
No Why?

102
ADMINISTRATIVE OPERATIONS
Following of
the orders
Software
By hand
Not much following
Other (precise)
Order payment
When?
During delivery
Monthly
Yearly
Other (precise)
Which
way?
Cash
Check
Bank transfert
Other (precise)
GENERAL ELEMENTS (all modalities included)
Time spent on
planning h/week
Who does it?
Satisfactory?
Suitable organization?
Farm : Date :

103
LABO
PHYSICAL OPERATIONS
Order
preparation
Who?
How?
Where?
How much time? h/week
Handling
Who?
How?
How much time? h/week
Container/packaging
type
Crate
Boxes
Palette
Other (precise)
Transportation
Transportation mean
Truck
Van
Car
Other (precise)
Nature
Personal
Professional
Shared/pooled
Cold management
Refrigerated truck
Fridge
Ice box
Other (precise)
Capacity (m3 or ton)
Fuel type
Diesel
Gasoline
Electricity
Filling rate At the start
Empty return?
Collaboration with
other farmers ?
Yes (how and why)
No (Reason ?)
How much time?
h/week
Satisfactory situation?
Storage
Capacity
Type
Refrigerated
Dry
Other (precise)
Pooling with other farmers?
Farm : Date :

104
Appendix 4: Details of calculation of the chosen indicators
VARIABLES DETAILS OF HOW WERE GATHERED THE VARIABLES
Total number of modalities
Deduced from the selling points listed by farmers during the interviews
Total number of selling points
Number of retail-wholesale selling points
Number of retail-wholesale modalities
Main sale product(s) Five categories : vegetables, dairy products, meat products, arboriculture and bread/flour
Distance per delivery route (km/week)
Deduced from the description of the different delivery routes of the farmers (selling points, day and order).
If a deliveries are made less than weekly, distances are brought back to a weekly amount (Ex: If 100 km are travelled every other week,
50 km are calculated per week)
Total distance for retail-wholesale (km/week)
Sum of the distance travelled for all delivery routes
Average fuel consumption of the vehicle used (l/km)
If farmers do not know the average consumption of their vehicle, this is deduced from the model of the vehicle.
Annual revenue (€) Estimation from the farmers
Revenue from retail-wholesale (€)
Estimation from the farmer on the distribution of the revenue depending on the modalities
Planning for retail-wholesale (h/week)
Time spent on orders anticipation, orders management and administrative follow up.
Estimation from the farmers
Preparation for retail-wholesale (h/week)
Time spent on orders preparation (cleaning, sorting, making delivery batches, packaging)
Estimation from the farmers
Delivery for retail-wholesale (h/week.)
Time spent during the deliveries (travel and handling)
Estimation from the farmer
Fuel type Enable to evaluate fuel costs to the closest of reality (difference between gasoline and diesel) as well as the GHG emission.

105
Appendix 5 : Details on interviewed key stakeholders of the local and organic retail-wholesale food system in Nord-Pas de Calais
Name of
institution Type of entities
Role of the
interviewee
within the
entity
Reason for interviewing
Norabio
Organic
farmers
cooperative
Assignment
manager for
shops supply-
farmers planner
100% organic cooperative in the
Nord Pas de Calais region
positioned on retail-wholesale
outlets
Vice-president
(organic farmer)
Viewpoint of an administrator of
Norabio on the logistics subject
Vert’Tige Specialized
organic shop
Manager
(organic farmer)
Viewpoint of a shop depending on
local supply
2 sous de
table
Restaurant
100% organic
In charge of
supply
management
Viewpoint of commercial catering
depending on local supply
CEB
(Ecological
and Organic
Center)
Wholesaler for
organic
products non-
perishable
Manager
Viewpoint of a wholesaler on local
supply and the challenges
associated with it
SCIC of
transportation
Cooperative
Society of
Collective
Interests
Driver and
manager
Experience of shared-use truck
and driver between farmers
(organic and conventional)
Terre d’Opale/
Anges
Gardiens
Platform of
production and
diffusion of
organic and
local products
Manager
(Organic farmer)
Experience working with a
functioning example of logistics
collaboration (horizontal
collaboration between farmers)
Croc La Vie
Institutional
catering for
early childhood
Charter member
and manager
Viewpoint of institutional catering
on organic local supply

106
Appendix 6 : Interview guide for farmers-Logistics collaboration
LOGISTICS COLLABORATION
How do you
evaluate the
logistics
performances on
the farm ?
Satisfactory
Why?
What could be
improved?
Average
(possible
improvement)
Bad
Experiences with
collaboration/
collective
organizations?
(currently or in
the past)
Yes Assessment
No Reasons?
Do you know the
logistics of the
farmers around
you?
Very good
Possible
collaborations? A little
Not at all
What are the interests to logistics
collaboration according to you?
What are the obstacles to
logistics collaboration according
to you?

107
Appendix 7: Interview guide for studied LFS key stakeholders (besides farmers)
Interview guide for downstream commercial players
- Organization of the current supply
- Description
- Portion of local products
- Local supply
- Why?
- Difficulties?
- Evolutions?
- Constraints?
- Improvement possible? Which one?
- Logistics collaboration?
- Experience?
- With who?
- Why?
- Obstacles?
- Interests?
- Potential collaborations?
Interview guide for players involved in a collaboration scheme
- Functioning of the current organization
- Description
- Collaboration part
Description
With who?
How
- History
- Why did you start the collaboration?
- Encountered challenges?
- Evolutions?
- Constraints?
- Possible improvements? Which ones?
- Possible future?

108
Appendix 8 : Multiple choice grids for farmers-logistics collaboration
According to you what are the main
interests for logistics
collaboration?
Reducing logistics costs
Decreasing GHG gazes
Accessing new markets
Accessing information
Increasing time availability for production
Positive image that it brings
Increasing time availability for family or leisure
Other (precise)
Main obstacles to logistics
collaboration according to you
Bad performances of the partners Lack of confidence
between partners
Competition
Loss of contact with the client
Loss of relationship
Loss of social link
Fear of the implementation phase Cultural elements
Different working hours
Increasing complexity of the organization
No logistics competencies
Isolation from other farmers
Seasonality
Products variety, no match with my own products
(regulation, temperature)
Interdependence
Loss of dependence
Loss of control of my logistics
Lack of information about the delivery route of everyone Lack of information,
knowledge toward partners
Lack of information on the motivation and objectives of everyone
Other (Precise)
Farm : Date :

109
Appendix 9 : Detailled quantitative results linked to the interests to logistics collaboration identified by interviewed farmers
CONTENT ANALYSIS
MULTIPLE CHOICE GRID ANALYSIS
THEME CATEGORY PRECISIONS ON THE CATEGORY
Percentage of farmers having spontaneously mentioned this
interest during the discussion
Recurrence of this interest on the speech of the
farmers mentioning it
How many farmers chose it as part of
the 3 major interests
Average points given for this interest on the
sample (on a scale from 1 to 3)
Interests to logistics
collaboration
Accessing new markets
Client pooling 29%
67%
1 50%
90%
0.9
1.8 Obtaining a critical size 19% 1 25% 0.5
Larger variety of products
19% 2 15% 0.4
Increasing time availability
For production 48%
57%
1.6 60%
80%
1.5
1.8 For family and leisure 10% 2.5 20% 0.3
Logistics costs reduction 43% 1.1 85% 1.9
GHG emission reduction 14% 1 35% 0.5
Increasing exchanges between farmers 5% 1 10% 0.1

110
Appendix 10 : Detailled quantitative results linked to the obstacles for logistics collaboration identified by interviewed farmers
CONTENT ANALYSIS MULTIPLE CHOICE GRID ANALYSIS
THEME CATEGORY CATEGORY SPECIFICS
Number of farmers
mentioning the obstacle during the interview
Recurrence of this obstacle in the speech of the
farmers having mentioning it
Percentage of farmers who chose it as part of the 3
major obstacle
Average points associated to the obstacle (1 to 3 scale, 1 being the most
important)
Obstacles for logistics
collaboration
Singularity
of each
system
Product variety 43%
100%
1.8
85% 1,6 Client variety 10% 1,0
Container/Packaging variety 10% 1,0
Different working hours 24% 1,4
Different vision of the profession 14% 2,3
Lack of confidence
Competition 38%
90%
1,4
85% 1,7 Low
performances of the partners
Punctuality 33% 1,4
Handling of the goods
10% 2,5
Lack of self-confidence 10% 1.0
Loss of human relationship
With the client 48% 62%
1,7 40% 1 Lacking "change of scenery" 14% 1,0
Isolation from other farmers 1,4 15% 0,4
Cultural elements Resistance to change 10%
48% 1,0
40% 0,8 Individualism 38% 1,3
Loss of independence 24% 2 25% 0,6
Lack of time to reflect on their organization 24% 1.6 0% 0
Difficulty to find a fair system 19% 1.0 0% 0

111
DIAGNOSTIC
LOGISTICS PERFORMANCES Retail-wholesale outlets
Farmer 1
July 2014
This document has been realized further to an interview realized the 18 June 2014 on
logistics organization in the retail-wholesale outlets. Data correspond to the data gathered
during this interview.
This document presents an individual analysis on logistics and its performances. It is
composed on:
- Presentation of the general characteristics of the retail-wholesale activity
- Economic performances of the logistics on the farm
- Ecological performances of the logistics on the farm
- Social performances of the logistics on the farm
Appendix 11 : Example of logistics performances done for farmer 1 of the interviewed sample

112
0%
10%
20%
30%
40%
50%
60%
70%
80%
90%
100%
1 2 3 4 5 6 7 8 9 10 11 12 13 14 15 16 17 18
Farmers
Importance of retail-wholesale in the farm revenue
Retail-wholesale revenue (%)
Revenue without retail-wholesale (%)
44%
39%
22%
Distance farmers travel for retail-whole sale deliveries in km/week (N=18=100%)
<200 km
Between 200 and 300 km
> 300 km
486
= Number of km
travelled/week (retail-wholesale activity)
73 %
= Portion of the
retail-wholesale activity in the
total revenue on the farm
89% = Portion of the farm selling points that are retail-wholesale
GENERAL CHARACTERISTICS OF THE RETAIL-WHOLESALE ACTIVITY
TOTAL on the farm
RETAIL-WHOLESALE
Modality number:
Outlet having the same characteristics (example: CSA, farmer’s markets, supermarkets, shops)
6 3
Number of selling points: 9 8

113
0
50
100
150
200
250
300
350
400
450
500
1 2 3 4 5 6 7 8 9 10 11 12 13 14 15 16 17 18
Co
ût
logi
stiq
ue
(€
/se
m.)
Répartition des coûts logistiques demi-gros selon les agriculteurs (€/sem.)
Delivery fuel costs (€/week)
Delivery labor costs (€/week)
Preparation labor costs (€/week)
Planning labor costs (€/week)
1€ of revenue
=
0.62 € of logistics costs
ECONOMIC APPROACH
Detail modalities
Logistics costs (€/week) RETAIL-
WHOLSALE
La Ruche qui Dit Oui (CSA
type)
Norabio (cooperative)
Fort & Vert (retail-
wholesaler)
Planning costs (€/week) 15 € 5 € 5 € 5 €
Preparation costs (€/week) 200 € 80 € 60 € 60 €
Delivery costs (€/week)
Labor costs (€/week) 140 € 223 €
100 € 130 €
20 46 €
20 47 €
Fuel (€/week) 83 € 30 € 26 27
Total logistics costs 428€/week 215 €/week 111 €/week 112 €/week
0%
10%
20%
30%
40%
50%
60%
1 2 3 4 5 6 7 8 9 10 11 12 13 14 15 16 17 18
% lo
gist
ics
cost
s o
n t
he
re
ven
ue
Farmers
Ratio logistics costs versus revenue (%)
Average vegetable farmers
Average orchard farmers
Average dairy farmers
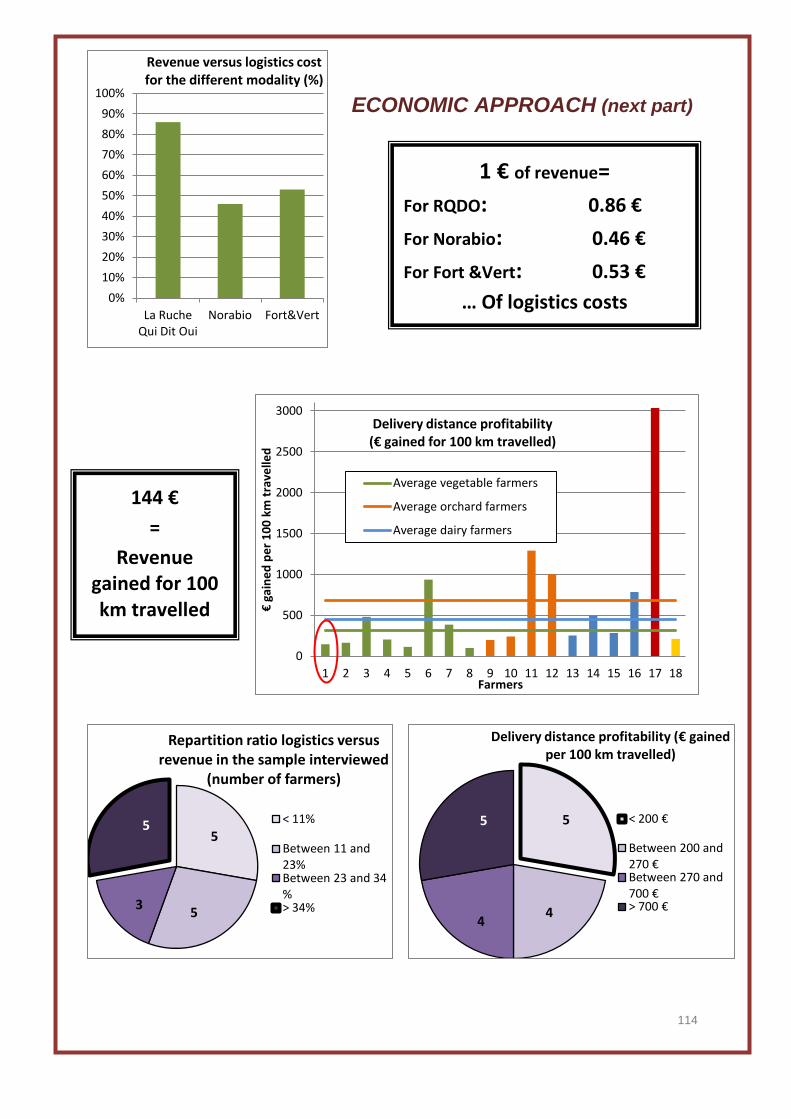
114
0
500
1000
1500
2000
2500
3000
1 2 3 4 5 6 7 8 9 10 11 12 13 14 15 16 17 18
€ g
ain
ed
pe
r 1
00
km
tra
velle
d
Farmers
Delivery distance profitability (€ gained for 100 km travelled)
Average vegetable farmers
Average orchard farmers
Average dairy farmers
5
4 4
5
Delivery distance profitability (€ gained per 100 km travelled)
< 200 €
Between 200 and 270 € Between 270 and 700 € > 700 €
1 € of revenue=
For RQDO: 0.86 €
For Norabio: 0.46 €
For Fort &Vert: 0.53 €
… Of logistics costs
144 €
=
Revenue gained for 100 km travelled
ECONOMIC APPROACH (next part)
0%
10%
20%
30%
40%
50%
60%
70%
80%
90%
100%
La Ruche Qui Dit Oui
Norabio Fort&Vert
Revenue versus logistics cost for the different modality (%)
5
5 3
5
Repartition ratio logistics versus revenue in the sample interviewed
(number of farmers)
< 11%
Between 11 and 23% Between 23 and 34 % > 34%

115
0.0
5.0
10.0
15.0
20.0
25.0
30.0
1 2 3 4 5 6 7 8 9 10 11 12 13 14 15 16 17 18
kg C
O₂
em
itte
d/1
00
€ g
ain
ed
Farmers
Energy intensity (kg emitted CO₂ /100€ gained)
Average vegetable farmers
Average orchard farmers
Average dairy farmers
0
20
40
60
80
100
120
140
1 2 3 4 5 6 7 8 9 10 11 12 13 14 15 16 17 18
€ g
ain
ed
/kg
em
itte
d C
O₂
Farmers
Energy profitability (€ gained/kg emitted CO₂
Average vegetable farmers
Average orchard farmers
Average dairy farmers
28%
22% 22%
28%
Energy profitability (€ gained/l consummed fuel)
< 23€ gained/l
Between 23 and 42 €/l
Between 42 and 66 €/l
> 66 €/l
17%
39% 17%
28%
Energy intensity (l of consummed fuel/100€ gained)
< 1.5 l of fuel/100 € gained Between 1.5 and 2.3 l /100 € gained Between 2.3 and 4.3 l d/100 € gained > 4.3 l /100 € gained
ECOLOGICAL APPROACH
1 l de gasoline consumed =
2.67 kg of CO₂ emitted
La Ruche qui dit Oui
Norabio Fort &Vert DEMI-GROS
Energy profitability
€ gained/ l consumed fuel 11 € 12 € 10 € 11 €
€ gained/Kg CO₂ emitted 4.1 € 4.6 € 3.8 € 4 €
Energy intensity
l of consumed fuel /100€ gained 9.2 l 8.1 l 9.8 l 9 l
Kg CO₂ emitted /100€ gained 24.4 kg CO₂ 21.7 kg CO₂ 26.3 kg CO₂ 24 kg CO₂
Green House Gases emission link to retail-wholesale
activity on the farm
8.8 T CO₂/an
4.2 T CO₂/year
It is the CO₂ emission link to movement of people per house in
France
11 €
=
Revenue gained per fuel liter consumed

116
5
7 1
5
Distribution preparation time for retail-wholesale (per week)
< 2h
Between 2h and 4h
Between 4h and 5h30 > 5h30
5
8 0
5
Distribution planning time for retail-wholesale (per week)
< 35 min
Between 35 min and 2 h Between 2 h and 2h30 > 2h30
5
4 5
4
Distribution total logistics time for retail-wholesale (per week)
< 9h
Between 9h and 12h Between 12h and 18h > 18h
6
3 4
5
Distribution delivery time for retail-wholesale (per week)
< 4h
Between 4h and 5h Between 5h and 7h30 >7h30
SOCIAL APPROACH
Time spent to logistics (h/week) La Ruche qui
Dit Oui Norabio Fort & Vert
Time for planning 1h30 30 min 30 min 30 min
Time for preparation 20 h 8 h 6 h 6 h
Time for delivery 14 h 10 h 2 h 2 h
Total time for logistics 35h30 18h30 8h30 8h30
0.0
5.0
10.0
15.0
20.0
25.0
30.0
35.0
40.0
1 2 3 4 5 6 7 8 9 10 11 12 13 14 15 16 17 18
Ho
urs
sp
en
t to
logi
stic
s
Farmers
Logistics time management for farmers
Delivery time
Preparation time
Planning time

117
Table of contents
TABLE OF CONTENTS ..................................................................................................................... V
Abbreviations, acronyms .................................................................................................................. VII
INTRODUCTION ................................................................................................................................ 1
PART 1: CONTEXT ............................................................................................................................ 6
1. Organic farming, change of scale and transformation: Exploring innovative methods of
organization. ................................................................................................................................... 7
1.1. Organic farming: evolution and changes in scale ............................................................... 7
1.2. Organic farming summarized in some numbers ................................................................. 8
1.3. ‘Conventionalization’ of organic farming and the search for organizational innovations .... 9
2. Localizing the food sector to organize and support the organic agriculture’s change of scale.
..................................................................................................................................................... 10
2.1. Short food supply chains or local food systems; trendy terms but remains unclear ........ 10
2.2. Local: A new trend of consumption .................................................................................. 11
3. Limits of a local food system: From viable to sustainable ....................................................... 12
3.1. Economic and social performances .................................................................................. 12
3.2. Environmental performances: Logistics as a key element for localizing the food system.
................................................................................................................................................. 13
4. Logistics: collaboration as a tool for optimization .................................................................... 14
4.1. Why discuss logistics? ...................................................................................................... 14
4.2. Logistics: Definition and functions .................................................................................... 15
4.3. The general evolution of logistic strategies ...................................................................... 16
4.4. Collaboration as a key element for LFS logistic rationalization? ...................................... 19
4.5. The challenge of logistic rationalization in building a sustainable, organic, local food
system for the retail-wholesale sector ..................................................................................... 19
5. Research questions ................................................................................................................. 21
PART 2: MATERIALS AND METHODS ........................................................................................... 22
1. Exploratory phase .................................................................................................................... 23
1.1. Literature review ............................................................................................................... 23
1.2. Exploratory interviews....................................................................................................... 23
1.3. Setting up a ‘follow-up body’ ............................................................................................. 24
1.4. Research questions .......................................................................................................... 25
2. Farmers’ logistics performance evaluation .............................................................................. 26
2.1. Indicators .......................................................................................................................... 26
2.2. Determining the farmer interview sample ......................................................................... 28
2.3. Developing the quantitative questionnaire ....................................................................... 29
3. Identifying inhibiting and supporting factors of logistics collaboration ..................................... 30
3.1. Determining the system actors to interview ...................................................................... 30

118
3.2. Interview guides for qualitative data collection ................................................................. 31
3.3. Qualitative data analysis: Analysis of content .................................................................. 32
4. Propositions and reflections ..................................................................................................... 36
4.1. Evaluating the potential of evolution ................................................................................. 36
4.2. Future and plan of action .................................................................................................. 37
PART 3: RESULTS AND DISCUSSION .......................................................................................... 38
1. Evaluation of logistics performances ....................................................................................... 40
1.1. General characteristics of the interviewees ...................................................................... 40
1.2. Economic dimension......................................................................................................... 43
1.3. Ecological dimension ........................................................................................................ 47
1.4. Social dimension ............................................................................................................... 49
1.5. Logistics performance assessment .................................................................................. 51
2. Logistic collaboration: Inhibiting and supporting factors .......................................................... 53
2.1. Logistic collaboration: Multiple interests to support .......................................................... 54
2.2. Logistics collaboration: obstacles to consider .................................................................. 59
2.3. Logistics collaboration: Potential strategies ..................................................................... 72
PART 4: PROPOSITIONS AND CONCLUSION .............................................................................. 78
1. Evaluating the potential of evolution in Nord-Pas de Calais .................................................... 79
1 Strengths of the current situation -Individual logistics organization ................................ 81
2 Weaknesses of the current situation-Individual logistics organization ............................ 82
3 The opportunities for an evolution toward the wanted situation ..................................... 83
4 Threats preventing evolution of situation toward the wanted situation ........................... 84
2. Recommendations for action ................................................................................................... 85
5 Farmers’ approach .......................................................................................................... 86
6 Food system approach ................................................................................................... 88
3. Limitation of the study .............................................................................................................. 91
Works cited ....................................................................................................................................... 93
Table of contents ............................................................................................................................ 117
Table of appendices ....................................................................................................................... 119

119
Table of appendices
Appendix 1: Expert Interviews - Details on the experts ....................................................97
Appendix 2 : Details for the calculation of the chosen indicators ......................................98
Appendix 3 : Farmers’ questionnaire .............................................................................. 100
Appendix 4: Details of calculation of the chosen indicators ............................................ 104
Appendix 5 : Details on interviewed key stakeholders of the local and organic retail-
wholesale food system in Nord-Pas de Calais ............................................................... 105
Appendix 6 : Interview guide for farmers-Logistics collaboration .................................... 106
Appendix 7: Interview guide for studied LFS key stakeholders (besides farmers) .......... 107
Appendix 8 : Multiple choice grids for farmers-logistics collaboration ............................. 108
Appendix 9 : Detailled quantitative results linked to the interests to logistics collaboration
identified by interviewed farmers .................................................................................... 109
Appendix 10 : Detailled quantitative results linked to the obstacles for logistics
collaboration identified by interviewed farmers ............................................................... 110
Appendix 11 : Example of logistics performances done for farmer 1 of the interviewed
sample ........................................................................................................................... 111

120

121