modulation of late cretaceous and cenozoic climatedvk/dvk_reprints/kent+muttoni2012.pdf · 20...
TRANSCRIPT
CPD8, 4513–4564, 2012
Modulation of LateCretaceous and
Cenozoic climate
D. V. Kent and G. Muttoni
Title Page
Abstract Introduction
Conclusions References
Tables Figures
J I
J I
Back Close
Full Screen / Esc
Printer-friendly Version
Interactive Discussion
Discussion
Paper
|D
iscussionP
aper|
Discussion
Paper
|D
iscussionP
aper|
Clim. Past Discuss., 8, 4513–4564, 2012www.clim-past-discuss.net/8/4513/2012/doi:10.5194/cpd-8-4513-2012© Author(s) 2012. CC Attribution 3.0 License.
Climateof the Past
Discussions
This discussion paper is/has been under review for the journal Climate of the Past (CP).Please refer to the corresponding final paper in CP if available.
Modulation of Late Cretaceous andCenozoic climate by variable drawdown ofatmospheric pCO2 from weathering ofbasaltic provinces on continents driftingthrough the equatorial humid belt
D. V. Kent1,2 and G. Muttoni3,4
1Earth and Planetary Sciences, Rutgers University, Piscataway, NJ 08854, USA2Lamont-Doherty Earth Observatory of Columbia University, Palisades, NY 10964, USA3Department of Earth Sciences, University of Milan, via Mangiagalli 34, 20133 Milan, Italy4ALP – Alpine Laboratory of Paleomagnetism, via Madonna dei Boschi 76,12016 Peveragno, CN, Italy
Received: 23 August 2012 – Accepted: 28 August 2012 – Published: 13 September 2012
Correspondence to: D. V. Kent ([email protected])
Published by Copernicus Publications on behalf of the European Geosciences Union.
4513

CPD8, 4513–4564, 2012
Modulation of LateCretaceous and
Cenozoic climate
D. V. Kent and G. Muttoni
Title Page
Abstract Introduction
Conclusions References
Tables Figures
J I
J I
Back Close
Full Screen / Esc
Printer-friendly Version
Interactive Discussion
Discussion
Paper
|D
iscussionP
aper|
Discussion
Paper
|D
iscussionP
aper|
Abstract
The small reservoir of carbon dioxide in the atmosphere (pCO2) that modulates cli-mate through the greenhouse effect reflects a delicate balance between large fluxesof sources and sinks. The major long-term source of CO2 is global outgassing fromsea-floor spreading, subduction, hotspot activity, and metamorphism; the ultimate sink5
is through weathering of continental silicates and deposition of carbonates. Most car-bon cycle models are driven by changes in the source flux scaled to variable ratesof ocean floor production. However, ocean floor production may not be distinguish-able from being steady since 180 Ma. We evaluate potential changes in sources andsinks of CO2 for the past 120 Ma in a paleogeographic context. Our new calculations10
show that although decarbonation of pelagic sediments in Tethyan subduction likelycontributed to generally high pCO2 levels from the Late Cretaceous until the EarlyEocene, shutdown of Tethyan subduction with collision of India and Asia at the EarlyEocene Climate Optimum at around 50 Ma was inadequate to account for the large andprolonged decrease in pCO2 that eventually allowed the growth of significant Antarctic15
ice sheets by around 34 Ma. Instead, variation in area of continental basaltic provincesin the equatorial humid belt (5 S–5 N) seems to be the dominant control on how muchCO2 is retained in the atmosphere via the silicate weathering feedback. The arrival ofthe highly weatherable Deccan Traps in the equatorial humid belt at around 50 Ma wasdecisive in initiating the long-term slide to lower atmospheric pCO2, which was pushed20
further down by the emplacement of the 30 Ma Ethiopian Traps near the equator andthe southerly tectonic extrusion of SE Asia, an arc terrane that presently is estimatedto account for 1/4 of CO2 consumption from all basaltic provinces that account for ∼1/3of the total CO2 consumption by continental silicate weathering (Dessert et al., 2003).A negative climate-feedback mechanism that (usually) inhibits the complete collapse25
of atmospheric pCO2 is the accelerating formation of thick cation-deficient soils that re-tard chemical weathering of the underlying bedrock. Nevertheless, equatorial climateseems to be relatively insensitive to pCO2 greenhouse forcing and thus with availability
4514

CPD8, 4513–4564, 2012
Modulation of LateCretaceous and
Cenozoic climate
D. V. Kent and G. Muttoni
Title Page
Abstract Introduction
Conclusions References
Tables Figures
J I
J I
Back Close
Full Screen / Esc
Printer-friendly Version
Interactive Discussion
Discussion
Paper
|D
iscussionP
aper|
Discussion
Paper
|D
iscussionP
aper|
of some rejuvenating relief as in arc terranes or thick basaltic provinces, silicate weath-ering in this venue is not subject to a strong negative feedback, providing an avenue forsporadic ice ages. The safety valve that prevents excessive atmospheric pCO2 levelsis the triggering of silicate weathering of continental areas and basaltic provinces in thetemperate humid belt. Increase in Mg/Ca ratio of seawater over the Cenozoic may be5
due to weathering input from continental basaltic provinces.
1 Introduction
Deep water temperatures determined from the continuous benthic oxygen isotoperecord (Cramer et al., 2009, 2011; Miller et al., 2005b; Zachos et al., 2001) (Fig. 1a)document that global climate over the past 120 Myr experienced extremes ranging from10
equable polar climates with bottom water temperatures over 15 C during the Creta-ceous Thermal Maximum (CTM ∼ 90 Ma; Wilson et al., 2002) and the Early EoceneClimatic Optimum (EECO, ∼ 50 Ma) to a cooling trend during the Middle and LateEocene with a major sea level fall (Fig. 1b) at around the Eocene–Oligocene boundary(∼ 34 Ma), marking the inception of major polar (Antarctic) ice sheets.15
The equable conditions at the CTM and especially the EECO are associated withwarmer global (polar and tropical) sea surface temperatures (Pearson et al., 2001,2007) that most likely resulted from an enhanced greenhouse effect due to higher at-mospheric pCO2 concentrations as inferred from various proxies (Fig. 1c; see reviewwith references in Beerling and Royer, 2011; Royer, 2010). These high pCO2 levels20
have been conventionally attributed to higher rates of ocean crust production and asso-ciated increased outgassing (Berner et al., 1983), for example, a presumed pulse of in-creased global sea-floor spreading and the emplacement of the North Atlantic igneousprovince at the EECO (Miller et al., 2005a; Rea et al., 1990; Thomas and Bralower,2005; Zachos et al., 2001). Decreasing pCO2 levels (Pagani et al., 2005, 2011) and25
the seemingly coincident cooling trend that followed the EECO could then be due toreduced outgassing flux from lower global ocean floor production rates and eventually
4515

CPD8, 4513–4564, 2012
Modulation of LateCretaceous and
Cenozoic climate
D. V. Kent and G. Muttoni
Title Page
Abstract Introduction
Conclusions References
Tables Figures
J I
J I
Back Close
Full Screen / Esc
Printer-friendly Version
Interactive Discussion
Discussion
Paper
|D
iscussionP
aper|
Discussion
Paper
|D
iscussionP
aper|
led to a major buildup of Antarctic ice sheets at around the Eocene–Oligocene bound-ary (DeConto and Pollard, 2003), whose precise evolution may have been influencedby openings of Southern Ocean gateways (Kennett, 1977; Livermore et al., 2007; Stick-ley et al., 2004).
A spreading rate-dependent outgassing factor (Berner, 1994; Berner et al., 1983;5
Engebretson et al., 1992) is intuitively appealing and widely regarded as the most im-portant parameter driving variations in pCO2 in the current generation of carbon cyclingmodels (Berner, 2004) but there are conflicting estimates of global ocean floor produc-tion rates. For example, Muller et al. (2008) and Seton et al. (2009) postulate highproduction in the Late Cretaceous and decreasing production in the Cenozoic whereas10
Cogne and Humler (2004, 2006) show high production earlier in the Cretaceous, re-duced production in the later Cretaceous, and increasing production over the Cenozoic.Provocatively, Rowley (2002) showed that the observed area-age versus age distribu-tion of oceanic crust does not require substantial production rate changes since thebreakup of Pangea at 180 Ma; the fact that more than 50 % of oceanic lithosphere15
younger than 55.7 Ma (70 % younger than ∼ 89 Ma, 85 % younger than ∼ 120 Ma)has already been removed by subduction means that reconstructions of oceanic litho-sphere history are invariably based on substantial and often poorly constrained ex-trapolations (Rowley, 2008). Moreover, carbon-uptake by oceanic crust may tend tocancel any residual spreading rate-dependent variations in CO2 outgassing (Berner,20
1990a,b; Brady and Gislason, 1997; Staudigel et al., 1989, 1990a,b). Increased CO2flux from mantle plumes most likely occurred during the relatively short emplacementtimes of individual LIPs but the time-integrated effect may not be very important on themillion year time scale (Marty and Tolstikhin, 1998), an assessment supported by newproxy measurements of pCO2 that support models (e.g., Caldeira and Rampino, 1990;25
Dessert et al., 2001) showing that increases associated with a major LIP emplacementdecay away on less than a million year time scale (Schaller et al., 2011).
The generally high pCO2 levels and warm polar climates that characterized themid-Cretaceous to Early Eocene may have had a substantial contribution from the
4516

CPD8, 4513–4564, 2012
Modulation of LateCretaceous and
Cenozoic climate
D. V. Kent and G. Muttoni
Title Page
Abstract Introduction
Conclusions References
Tables Figures
J I
J I
Back Close
Full Screen / Esc
Printer-friendly Version
Interactive Discussion
Discussion
Paper
|D
iscussionP
aper|
Discussion
Paper
|D
iscussionP
aper|
protracted subduction of Tethyan pelagic carbonates deposited on the Indian plate dur-ing northward drift from ∼ 120 Ma until collision of Greater India with Asia (Lhasa block)at ∼ 50 Ma (Edmond and Huh, 2003; Hansen et al., 2008; Kent and Muttoni, 2008;Schrag, 2002). The ensuing long-term trend of decreasing pCO2 levels and tempera-tures from 50 Ma to the onset of Antarctic glaciation at 34 Ma may thus have resulted5
from re-equilibration to the reduced CO2 flux with the shutdown of the Tethyan decar-bonation factory. Alternatively, intense weathering of the Deccan Traps as they driftedinto the equatorial humid belt may have increased the consumption of CO2 (Dessertet al., 2003; Kent and Muttoni, 2008).
In this paper, we elaborate on the tectonic forcing of pCO2 variations using plate10
tectonic reconstructions in a paleolatitudinal reference frame and attempt to quantify(a) the decarbonation potential of Tethyan subduction since ∼ 120 Ma as a potentialadditional source of CO2, and (b) the silicate weathering potential for higher consump-tion of CO2 of continental areas and especially highly weatherable basaltic provincesas they drifted through the equatorial humid belt, the most potent venue for continen-15
tal silicate weathering (Dessert et al., 2003). We evaluate the relative contributions ofthese modes of steering atmospheric pCO2 as well as other alternative mechanisms,including proposed changes in organic carbon burial inferred from trends in δ13C car-bonate records (Katz et al., 2005) and the uplift-weathering hypothesis (Raymo andRuddiman, 1992; Raymo et al., 1988). The degree of sensitivity of global climate to20
changes in atmospheric pCO2 is difficult to gauge but we mainly seek to explain thegenerally high pCO2 levels from the CTM to EECO (∼ 90 to 50 Ma) and the decrease togenerally low pCO2 levels that characterize the Oligocene to Present (from ∼ 34 Ma).Modeling studies point to threshold decreases in atmospheric pCO2 as the most likelycauses for widespread Antarctic glaciation at around the Eocene–Oligocene boundary25
(Oi-1, ∼ 34 Ma; DeConto and Pollard, 2003; DeConto et al., 2008) and the onset ofpermanent Northern Hemisphere glaciations in the late Pliocene (∼ 3 Ma; Lunt et al.,2008).
4517

CPD8, 4513–4564, 2012
Modulation of LateCretaceous and
Cenozoic climate
D. V. Kent and G. Muttoni
Title Page
Abstract Introduction
Conclusions References
Tables Figures
J I
J I
Back Close
Full Screen / Esc
Printer-friendly Version
Interactive Discussion
Discussion
Paper
|D
iscussionP
aper|
Discussion
Paper
|D
iscussionP
aper|
2 Paleogeographic reconstructions from 120 Ma to present
In the absence of compelling evidence for long-term secular changes in global oceanfloor production and subduction rates, we assume that the background CO2 outgassingrate held steady and was comparable to the modern outgassing rate of ∼ 260 (range ofplausible estimates of 180 to 440) Tton CO2 Myr−1 (where Tton = 1012 ton = 1015 kg,5
and Myr = 106 yr)(Gerlach, 2011; Marty and Tolstikhin, 1998). To estimate contributionsof CO2 outgassing from the subduction of carbonate-rich sediments and consumptionof CO2 from silicate weathering of continental areas as they drifted through differentclimate zones, we generated paleogeographic reconstructions of the main continentsusing a composite apparent polar wander path (APWP) (Fig. 2; Table 1) and the fi-10
nite rotation poles used by Besse and Courtillot (2002) from Muller and Roest (1992),Muller et al. (1993) and Srivastava and Tapscott (1986). The composite APWP usespaleopoles from all the main continents rotated to common coordinates (in this case,North America) and averaged in a sliding 20 Myr window every 10 Myr. The mean pale-opole for 60 to 120 Ma is an average of global igneous data from Kent and Irving (2010)15
for a standstill in APW in North American coordinates; we averaged their 60, 80, 100and 120 Ma mean poles, which are independent, to derive a 60–120 Ma superpole.Mean paleopoles for 10 to 50 Ma, which are dominated by global igneous data andthus also less prone to be biased by inclination error, are from Besse and Courtillot(2002, 2003). The composite APWP should record the geocentric axial dipole field,20
hence the different APWP for the various continents shown in Fig. 2 simply reflect theirrelative motions according to the finite rotation model. Uncertainty in latitudinal posi-tions of the continents should be on the order of the radii of circles of 95 % confidencearound the mean paleopoles (∼ 3; Table 1).
The main elements of the plate tectonic scenario are the convergence of Greater In-25
dia with the Lhasa block, which was accreted to Asia before the Late Jurassic (Allegreet al., 1984; Chang and Cheng, 1973), and the convergence of Arabia with the Iranblock, which was accreted to Asia during the Late Triassic–Early Jurassic Cimmerian
4518

CPD8, 4513–4564, 2012
Modulation of LateCretaceous and
Cenozoic climate
D. V. Kent and G. Muttoni
Title Page
Abstract Introduction
Conclusions References
Tables Figures
J I
J I
Back Close
Full Screen / Esc
Printer-friendly Version
Interactive Discussion
Discussion
Paper
|D
iscussionP
aper|
Discussion
Paper
|D
iscussionP
aper|
orogeny (e.g., Muttoni et al., 2009; Zanchi et al., 2009) and was only moderately dis-rupted by oblique subduction of the Tethyan Ocean in the Cretaceous (Moghadamet al., 2009). A related tectonic feature is the extrusion of the SE Asian blocks duringthe indentation of India into Asia (Molnar and Tapponnier, 1975). There is a vast litera-ture on various aspects of the tectonics of the Himalaya and adjacent Tibetan Plateau5
(e.g., more than 330 cited references in a review paper by Yin and Harrison, 2000 andmore than 500 cited references in one by Hatzfeld and Molnar, 2010), but what is crit-ical to our analysis is to locate within these reconstructions the position of the Asianmargin (Lhasa, Iran) and of the SE Asian blocks, which was done as follows.
1. The southern (collisional) margin of the Lhasa block was drawn assuming that it10
coincided in shape and location with the northern margin of Greater India (whichis much easier to place using the APWP described above) at full India-Lhasacollision at 50 Ma; for pre-50 Ma times, the Lhasa margin was kept coherent andtherefore rotated with Asia. The ∼ 50 Ma collision age, instrumental to locate theposition of the margin, is based on several lines of geological evidence (Garzanti,15
2008; Garzanti et al., 1987; Zhu et al., 2005; and references therein), and is sup-ported by the marked decrease in convergence rate between India and Eurasiaobserved in the Indian Ocean between magnetic Anomaly 22 (∼ 49.5 Ma) andAnomaly 21 (∼ 48.5 Ma) (Copley et al., 2010; Patriat and Achache, 1984; see alsoCande and Stegman, 2011; Molnar and Stock, 2009). An age of ∼ 50 Ma for the20
India-Lhasa collision is preferred to the much younger age of ∼ 35 Ma envisagedby Aitchison et al. (2007) and Ali and Aitchison (2008) essentially for the argu-ments made by Garzanti (2008). Our reconstructions are in substantial agreementwith the available albeit sparse paleomagnetic data indicating that the marginhad a paleolatitude comprised between ∼10 N and ∼20 N in the Cretaceous-25
Early Cenozoic (Achache et al., 1984; Chen et al., 1993, 2012). Other resultsand compilations of paleomagnetic data that try to take into account sedimentaryflattening of paleomagnetic directions suggest that collision with Northern Indiaoccurred at 46±8 Ma (Dupont-Nivet et al., 2010) and that the southern margin
4519
CPD8, 4513–4564, 2012
Modulation of LateCretaceous and
Cenozoic climate
D. V. Kent and G. Muttoni
Title Page
Abstract Introduction
Conclusions References
Tables Figures
J I
J I
Back Close
Full Screen / Esc
Printer-friendly Version
Interactive Discussion
Discussion
Paper
|D
iscussionP
aper|
Discussion
Paper
|D
iscussionP
aper|
of the Lhasa block extended as far south as 20 N during the Eocene (Lippertet al., 2011), which we regard as in substantial agreement with our reconstructedtectonic framework given the uncertainties in reference paleopoles.
2. Following similar reasoning, the southern (collisional) margin of the Iran blockwas drawn assuming that it coincided with the northern margin of Arabia at full5
collision at ∼ 20 Ma. The Arabia–Iran collision may have started at ∼ 35 Ma basedon geologic evidence (Agard et al., 2005; Allen and Armstrong, 2008); however,complete Western Tethys closure seems not to have occurred until ∼ 20 Ma basedon recent apatite fission-track data indicating that the last oceanic lithospherebetween Arabia and Eurasia was not consumed until the Early Miocene (Okay10
et al., 2010).
3. The position of the SE Asia blocks (North, Central, and South Indochina, Westand East Sumatra, Borneo, and Java) have been reconstructed in the 0–40 Mainterval using the (cumulative) rotation poles of Replumaz and Tapponnier (2003)relative to Siberia (Eurasia) (Table 2). For the previous 50–120 Ma interval, the15
SE Asia blocks are considered tectonically coherent and moved with Siberia(Eurasia). Accordingly, our Cretaceous reconstructions are similar to those ofChen et al. (1993) with Indochina placed using Cretaceous paleomagnetic datafrom Yang and Besse (1993) across paleolatitudes spanning from ∼ 10 N to30 N close to Siberia. Moreover, our 65 Ma reconstruction predicts a paleolat-20
itude for western Yunnan (North Indochina block) that is consistent, within pa-leomagnetic resolution, with a paleolatitude of 17 ±9 N calculated for the areafrom (sparse) paleomagnetic data from the Paleocene (Yang et al., 2001). South-ward extrusion of the SE Asia blocks basically stopped at about 15 Ma withcessation of seafloor spreading in the South China Sea (Briais et al., 1993)25
even though overall southerly movement continued as Eurasia rotated clock-wise according to its APWP. Our reconstructions are similar to the classic India-SE Asia indentor-extrusion model (Molnar and Tapponnier, 1975; Replumaz and
4520

CPD8, 4513–4564, 2012
Modulation of LateCretaceous and
Cenozoic climate
D. V. Kent and G. Muttoni
Title Page
Abstract Introduction
Conclusions References
Tables Figures
J I
J I
Back Close
Full Screen / Esc
Printer-friendly Version
Interactive Discussion
Discussion
Paper
|D
iscussionP
aper|
Discussion
Paper
|D
iscussionP
aper|
Tapponnier, 2003; Royden et al., 2008) and differ from alternative reconstructionsthat question evidence for extrusion and locate the SE Asia blocks since beforethe onset of India-Asia collision at essentially the latitudes they are found today(Aitchison et al., 2007; Hall et al., 2008; see also exchange between Garzanti,2008, and Aitchison et al., 2008). Hall et al. (2008) support their fixist recon-5
structions citing paleomagnetic data from Borneo and surrounding regions (Fulleret al., 1999; Schmidtke et al., 1990) that (a) do not seem to indicate a clear pat-tern of clockwise rotations, and (b) show no consistent southward displacementof blocks over the Cenozoic, both expected from the extrusion model. As acknowl-edged by Fuller et al. (1999), however, the quality of the paleomagnetic data from10
Borneo is problematical given that many results come from igneous intrusionswith no control on paleohorizontal and “the intimate mixing throughout Borneo ofrotated and unrotated results is easier to explain in terms of remagnetization thanby a special distribution of local shears”. The details of the paleolatitudinal evo-lution of Borneo can hardly be resolved by these data. However, results from the15
late Cretaceous and early Cenozoic Segamat basalts and supporting data fromthe Kuantan dike swarm all from the Malaysia Peninsula indicate paleolatitudesat time of emplacement of 20 N (compared to a present-day latitude of ∼ 2.5 N)(Richter et al., 1999) and provide in our opinion robust (e.g., not influenced bysedimentary inclination flattening) paleomagnetic data in support of the SE Asia20
southward extrusion model and Eurasia clockwise rotation.
Greater India resided for much of the Mesozoic in the Southern Hemisphere as part ofthe classical Gondwana supercontinental assembly (Smith and Hallam, 1970), whichbegan to disperse in the Late Jurassic with the opening of the Somali basin (Rabinowitzet al., 1983) and the separation of East Gondwana (which included India, Madagascar,25
Antarctica, and Australia) from West Gondwana (Africa and South America). GreaterIndia commenced its ∼ 6000 km northward drift toward Lhasa (Asia) when it separated(with Madagascar) from Antarctica at around 120 Ma (Fig. 3a) and continued its journeyafter separation from Madagascar at around 84 Ma, approached the equatorial belt
4521

CPD8, 4513–4564, 2012
Modulation of LateCretaceous and
Cenozoic climate
D. V. Kent and G. Muttoni
Title Page
Abstract Introduction
Conclusions References
Tables Figures
J I
J I
Back Close
Full Screen / Esc
Printer-friendly Version
Interactive Discussion
Discussion
Paper
|D
iscussionP
aper|
Discussion
Paper
|D
iscussionP
aper|
(5 S–5 N) at 65 Ma (Fig. 3b) and began to collide with Asia at around 50 Ma (Fig. 3c).The extrusion of the SE Asian blocks with the indentation of India into Asia was suchthat at ∼ 30 Ma Borneo was approaching the equatorial humid belt (Fig. 3d). Conver-gence between Arabia–Iran caused final collision at ∼ 20 Ma, whereas the southwardextrusion of SE Asia largely ceased by ∼ 15 Ma (Fig. 3e) although continued clockwise5
rotation of Eurasia gradually brought SE Asia to its present position (Fig. 3f).
3 Did the Tethyan CO2 factory produce Cretaceous–Eocene greenhouseclimate?
The northward drift of India involved the subduction under Asia of oceanic crust thatmust have transited through the equatorial belt (Fig. 3a–c). This is because the paleo-10
magnetic (i.e., latitudinal) constraints indicate that the Lhasa (Asia) southern margin re-mained in the Northern Hemisphere (10 N–20 N) from practically the time India sepa-rated from Antarctica at ∼ 120 Ma until incipient collision at ∼ 50 Ma. In modern oceans,equatorial regions are generally associated with upwelling and high organic produc-tivity, giving rise to enhanced deposition of biogenic sediments (Berger and Winterer,15
1974) that sequester CO2 from the atmosphere. This has been especially true since thediversification of planktonic marine protists by the mid-Mesozoic, when open oceansbecame important loci of carbonate deposition, progressively replacing shallow wa-ter carbonates (Wilkinson and Walker, 1989). Calcareous nannoplankton became themost efficient sediment-forming group in Cretaceous oceans, sometimes forming thick20
chalk deposits, whereas planktonic foraminifers became relevant sediment-producersonly since the Late Cretaceous (Erba, 2004). Biogenic sediments deposited on oceaniccrust are more readily subducted than shallow water carbonates on buoyant continentalcrust, hence pelagic sediments are more prone to metamorphic decarbonation, poten-tially augmenting the global flux of CO2 to the atmosphere (Caldeira, 1992; Volk, 1989).25
The subduction of Tethyan sea floor from 120 Ma to 50 Ma may thus have constituteda productive source of additional CO2, which according to some scenarios may have
4522

CPD8, 4513–4564, 2012
Modulation of LateCretaceous and
Cenozoic climate
D. V. Kent and G. Muttoni
Title Page
Abstract Introduction
Conclusions References
Tables Figures
J I
J I
Back Close
Full Screen / Esc
Printer-friendly Version
Interactive Discussion
Discussion
Paper
|D
iscussionP
aper|
Discussion
Paper
|D
iscussionP
aper|
been responsible for the generally equable climates in the Cretaceous to Eocene (Ed-mond and Huh, 2003; Hansen et al., 2008; Kent and Muttoni, 2008; Schrag, 2002).Alternatively, much of the subducted carbon may have remained buried in a deep-seated mantle reservoir (Selverstone and Gutzler, 1993). Here we attempt to estimatethe maximum amount of subducted carbon as a source of CO2 to the atmosphere by5
invoking high biogenic productivity on oceanic crust and assuming that an appreciablefraction of the subducted carbon is returned to the atmosphere.
We estimated the productivity of the Tethyan CO2 factory over the Cretaceous–Cenozoic by reconstructing the latitudinal component of motion for a point on thenorthern margin of the Indian plate (filled star in Fig. 3a) compared with the latitudi-10
nal evolution of a point on the Lhasa southern margin (unfilled star in Fig. 3a). Thepaleolatitude curves (Fig. 4a) were used to predict the timing of subduction of oceaniccrust attached to Greater India that was loaded with equatorial (5 S–5 N) bulge sed-iments. In a simple 2-plate model, the onset of northward motion of Greater India at∼ 120 Ma presaged the onset of subduction of the equatorial bulge underneath the15
Lhasa margin at around 97 Ma and until the bulge that formed under the equatorial beltat around 72 Ma was subducted at ∼ 55 Ma and the last sediments were consumedin the trench at 50 Ma. In other words, a full equatorial load of sediment was probablycontinuously subducted in southern Asia trenches from at least ∼ 97 Ma to collision at50 Ma.20
The amount of equatorial bulge sediments subducted with time can be estimatedfrom the loading time, loading area, and mass accumulation rate, as follows:
1. The time spent by the Tethyan crust under the presumed 5 S–5 N upwelling belt(loading time) was calculated acknowledging that the Tethyan crust was loadingsediments under the 5 S–5 N belt since well before the onset of India–Asia con-25
vergence; we therefore assumed an initial, nominal loading duration of 20 Myr towhich we added the loading times directly derived from the plate’s latitudinal ve-locity (Fig. 4b). For example, oceanic crust entering the Lhasa trench at ∼ 80 Ma(Fig. 4a) was already sediment-loaded for 20 Myr when it started moving from
4523
CPD8, 4513–4564, 2012
Modulation of LateCretaceous and
Cenozoic climate
D. V. Kent and G. Muttoni
Title Page
Abstract Introduction
Conclusions References
Tables Figures
J I
J I
Back Close
Full Screen / Esc
Printer-friendly Version
Interactive Discussion
Discussion
Paper
|D
iscussionP
aper|
Discussion
Paper
|D
iscussionP
aper|
5 S at 120 Ma across the equatorial belt to 5 N at 89 Ma thus accumulating ad-ditional ∼ 31 Myr of loading (total of ∼ 51 Myr at subduction; Fig. 4b). As anotherexample, oceanic crust entering the Lhasa trench at ∼ 70 Ma (Fig. 4a) was al-ready sediment-laden for 20 Myr when it crossed the equatorial belt from ∼ 93 Mato ∼ 78 Ma accumulating an additional ∼ 16 Myr of loading (total of ∼ 36 Myr at5
subduction; Fig. 4b).
2. The surface area of Indian oceanic crust displaced northward at any given timeand eventually consumed at the trench (subduction rate) was calculated fromthe paleogeographic reconstructions (Fig. 3 and additional ones) and found tosteadily increase from ∼ 0.09 Mkm2 Myr−1 to ∼ 0.45 Mkm2 Myr−1 for a total sub-10
ducted crust of ∼ 19.0 Mkm2 (Fig. 4d). Most of this crust (∼ 14.7 Mkm2) residedon or crossed the equatorial upwelling belt before being subducted, whereas theremainder (∼ 4.3 Mkm2) was located between 5 N and the Lhasa margin andpresumably never got loaded with equatorial sediments (see Fig. 3a).
3. A nominal mass accumulation rate (MAR) of 1.5 gcm−2 kyr−115
(15 Mtonkm−2 Myr−1) for the Tethyan equatorial belt 5 S–5 N was derivedfrom estimates for the Cretaceous equatorial Pacific Ocean (Ogg et al., 1992),which is within the range of values found for the Cenozoic equatorial Pacific(Mitchell and Lyle, 2005; Mitchell et al., 2003).
Summarizing and clarifying the above, oceanic crust transiting under the equatorial20
upwelling belt gets a full biogenic (calcareous and biosiliceous) sediment load that isestimated by multiplying the loaded time (1) by the loading area (2) by the MAR value(3). This subducted load is found to vary between ∼ 60 TtonMyr−1 at ∼ 120 Ma up to∼ 220 TtonMyr−1 at ∼ 80 Ma and dropping to virtually zero at 50 Ma (Fig. 4d). Evenallowing the subducted sediment to be entirely carbonate, a recycling rate of 10 % (al-25
though generally less) based on 10Be data in arc volcanics (Tera et al., 1986) wouldimply that the amount of CO2 that was potentially generated by the decarbonation ofTethyan pelagic biogenic sediments was maximally ∼ 9.7 Tton CO2 Myr−1 at around
4524

CPD8, 4513–4564, 2012
Modulation of LateCretaceous and
Cenozoic climate
D. V. Kent and G. Muttoni
Title Page
Abstract Introduction
Conclusions References
Tables Figures
J I
J I
Back Close
Full Screen / Esc
Printer-friendly Version
Interactive Discussion
Discussion
Paper
|D
iscussionP
aper|
Discussion
Paper
|D
iscussionP
aper|
80 Ma, corresponding to only ∼ 4 % of the modern outgassing rate of ∼ 260 TtonCO2 Myr−1 (Fig. 4d).
A similar scenario of convergence and equatorial bulge subduction can be traced be-tween Arabia and Iran in the Western Tethys (Fig. 4e–h). Using the procedure outlinedabove for India, the mean latitudinal velocity of a point on northeastern margin of Arabia5
(filled circle in Fig. 3a) is used in conjunction with the paleolatitude evolution of a pointon the Southwestern Iran margin (unfilled circle in Fig. 3a) to predict that the oceaniccrust loaded with equatorial bulge sediments started subducting at around 74 Ma andended at ∼ 20 Ma with the terminal Arabia–Iran collision (Fig. 4e). The loading timeof this subducted oceanic crust was estimated to steadily increase from an initial10
value of ∼ 20 Myr (for similar reasons previously illustrated for India) to a maximum of∼ 60 Myr (Fig. 4f). The subduction rate was found to decrease from ∼ 0.18 Mkm2 Myr−1
to ∼ 0.04 Mkm2 Myr−1 for a total subducted crust of ∼ 8.1 Mkm2 (Fig. 4g). Of this crust,only ∼ 2.1 Mkm2 resided on or crossed the equatorial upwelling belt before being sub-ducted, whereas the remainder presumably never got loaded with equatorial sediments15
(see Fig. 3a). These numbers lead us to calculate a subducted sediment load thatvaries between ∼ 23 TtonMyr−1 at 70 Ma and ∼ 35 TtonMyr−1 at 20 Ma (Fig. 4h); as-suming again that the subducted sediments were entirely carbonates and a recyclingrate of ∼ 10 %, the maximum amount of CO2 that was potentially generated by the de-carbonation of these biogenic sediments was ∼ 1.6 Tton CO2 Myr−1 at around 20 Ma,20
corresponding to only ∼ 0.6 % of the modern outgassing rate of ∼ 260 Tton CO2 Myr−1
(Fig. 4h).It appears that subduction decarbonation of Tethyan pelagic sediments may have
reached ∼ 10 Tton CO2 Myr−1 from 80 to 50 Ma, which is only ∼ 4 % of the modernoutgassing rate of 260 Tton CO2 Myr−1. We can also approach this from the long-term25
mean ocean production rate of 3.4 Mkm2 Myr−1 from Rowley (2002), which would im-ply that 340 Mkm2 of oceanic crust was subducted globally in the 100 Myr from 120 Ma(about when pelagic carbonates and chalks become important) to 20 Ma (end of majorTethyan subduction after which there has been only minor overall subduction of pelagic
4525

CPD8, 4513–4564, 2012
Modulation of LateCretaceous and
Cenozoic climate
D. V. Kent and G. Muttoni
Title Page
Abstract Introduction
Conclusions References
Tables Figures
J I
J I
Back Close
Full Screen / Esc
Printer-friendly Version
Interactive Discussion
Discussion
Paper
|D
iscussionP
aper|
Discussion
Paper
|D
iscussionP
aper|
carbonates elsewhere, mainly Central America), or nearly 13-fold what was calcu-lated for subduction just of Tethyan crust (∼ 27 Mkm2 for India plus Arabia). However,a substantial fraction of the oceanic crust that was subducted must have been in thePacific which did not systematically transit through the equatorial upwelling belt andconsequently probably had a much lower MAR, perhaps by an order of magnitude5
(∼ 1.5 Mtonkm−2 Myr−1) than for equatorial bulge pelagic sedimentation (Mitchell andLyle, 2005). Even if additional subduction decarbonation doubled the rate estimatedjust for Tethyan pelagic sediments, to perhaps 20 Tton CO2 Myr−1, this would neverthe-less still be a small fraction (less than 10 %) of the modern CO2 outgassing rate. Thisleads us to conclude that unless its efficiency was much higher (Johnston et al., 2011)10
the decarbonation subduction factory was a rather small contributing factor in produc-ing higher pCO2 and presumably related warm climate in the Cretaceous–Eocene.We also note that the total deep (mantle) carbon storage of about 1000 Tton CO2for the past 125 Myr suggested by Selverstone and Gutzler (1993) to be in responseto the Alpine–Himalaya collision amounts to about the same magnitude flux (8 Tton15
CO2 Myr−1) as the decarbonation flux and would thus further reduce its relative im-portance as a net long-term source of CO2. More generally, subduction decarbonationwould seem to be precluded as a major source of CO2 prior to when open oceansbecame important loci of carbonate deposition with the abundant appearance of cal-careous plankton at ∼ 120 Ma. Edmond and Huh (2003) reached similar conclusions20
about the general efficacy of subduction decarbonation as a source of CO2.Mantle CO2 that emanated from the emplacement of submarine LIPs (e.g., Ontong
Java Plateau, South Kerguelen Plateau, Caribbean Plateau and the North Atlantic Ig-neous Province) probably significantly increased global pCO2 levels and triggered var-ious paleoceanographic events (e.g., Tejada et al., 2009) but for not much longer than25
each of their relatively short emplacement times (Self et al., 2005). This is becausemodel calculations (Dupre et al., 2003; Misumi et al., 2009) and available supportingproxy measurements (Schaller et al., 2011) indicate that the excess CO2 would beadsorbed by negative feedback mechanisms on less than a million year time scale. In
4526

CPD8, 4513–4564, 2012
Modulation of LateCretaceous and
Cenozoic climate
D. V. Kent and G. Muttoni
Title Page
Abstract Introduction
Conclusions References
Tables Figures
J I
J I
Back Close
Full Screen / Esc
Printer-friendly Version
Interactive Discussion
Discussion
Paper
|D
iscussionP
aper|
Discussion
Paper
|D
iscussionP
aper|
fact, continental LIPs are likely to be net CO2 sinks levels due to enhanced consump-tion from their weathering (Dessert et al., 2003; Schaller et al., 2012).
4 Variable weathering sinks of CO2
If the long-term source flux of CO2 stayed basically constant and experienced only tran-sient changes, persistent variations in CO2 sink fluxes must have been in the driver’s5
seat in controlling the concentration of atmospheric pCO2. The most important CO2sink is weathering of continental silicates (Walker et al., 1981), a negative feedbackmechanism dependent on surface temperature and runoff as a function of the CO2greenhouse effect and incorporated in most quantitative carbon-cycling models (e.g.,Berner, 1991, 1994, 2006; Berner and Kothalava, 2001; Berner et al., 1983).10
Recent evaluations have emphasized the importance of continental basalt weather-ing as a major sink for atmospheric CO2, representing anywhere from one-third tonearly one-half of the consumption flux from weathering of all continental silicateseven though subaerial basalt provinces today constitute less than 5 % of world landarea (Table 2 in Dessert et al., 2003). The compilation of Dessert et al. (2003) also15
shows that for a given gross basin lithology (granitic or basaltic), chemical weather-ing and CO2 consumption rates are strongly dependent on runoff and temperature,which are markedly potent in the equatorial humid belt. It is noteworthy that SE Asiain the equatorial humid belt with a mean annual temperature of 25 C and nearly140 cmyr−1 runoff has by far the highest CO2 consumption flux (1.033×10¹² mol yr−1
20
= 45.5 Mton CO2 yr−1), which constitutes nearly a third of the total CO2 consump-tion flux (3.109×10¹² mol yr−1 = 123.8 Mtonyr−1) estimated for all basaltic provinces,even though SE Asia represents less than 8 % of the surface area of all continentalbasalt provinces. In contrast, basalt provinces in cold or dry regions are not weath-ering rapidly and are thus consuming far less CO2. For example, the Siberian Traps,25
a LIP that was emplaced in the latest Permian and presently straddles the Arctic Circlewith a mean annual temperature of −10 C and 40 cmyr−1 runoff, contributes a paltry
4527

CPD8, 4513–4564, 2012
Modulation of LateCretaceous and
Cenozoic climate
D. V. Kent and G. Muttoni
Title Page
Abstract Introduction
Conclusions References
Tables Figures
J I
J I
Back Close
Full Screen / Esc
Printer-friendly Version
Interactive Discussion
Discussion
Paper
|D
iscussionP
aper|
Discussion
Paper
|D
iscussionP
aper|
1.7 % (0.053×10¹² mol yr−1 = 2.3 Mton CO2 yr−1) to the overall basalt CO2 consump-tion flux even though it represents nearly 12 % of the total surface area of continentalbasalt provinces today (Dessert et al., 2003). The Ethiopian Traps, with a comparablesurface area to the Siberian Traps, are just within the tropical arid belt with a muchhigher mean annual temperature of 21 C but only 13 cmyr−1 runoff and hence end5
up contributing only 3.9 % (0.121×10¹² mol yr−1 = 5.3 Mton CO2 yr−1) to the overallbasalt CO2 consumption flux (Dessert et al., 2003). Mg and Ca-poor granitic terraneshave CO2 consumption fluxes that are 2 to 10 times lower than basaltic provinces incomparable climate conditions (Dessert et al., 2001; Gaillardet et al., 1999).
To gauge the latitudinal position of climate belts in the past, we use values for zonal10
mean annual surface air temperature and the difference between precipitation andevaporation (P−E ) based on a general circulation model from Manabe and Bryan(1985) with idealized geography, an annual mean insolation, and atmospheric pCO2concentrations that vary from one-half to 8-times the modern (pre-industrial: 280 ppm)value. Compared with studies of silicate weathering rate using more comprehensive15
global climate numerical models (e.g., Donnadieu et al., 2006; Godderis et al., 2008)that include a variety of feedbacks as well as monsoons and other phenomena relatedto details of geography, the idealized zonal model employed here has the advantage, atthis stage, of allowing us to keep the latitudinal dependency of climate fixed while vary-ing the distribution of land masses. Although the amplitude or climate severity of P−E20
increases with increasing pCO2, the latitudinal positions of the crossovers (P−E = 0)stay relatively fixed (Manabe and Bryan, 1985). Accordingly, we set the equatorial hu-mid belt (P > E ) as occurring between 5 S and 5 N and the hemispheric limits of thetropical arid belts (P < E ) as extending from 5 to 30 latitude and that of the temper-ate humid belts from 30 to the latitudinal limits (60) of our paleogeographic maps25
(Fig. 3). Zonal mean temperatures generally increase with higher pCO2 but for anygiven pCO2 level they are uniformly high in the tropics (nominally 23 S to 23 N) be-fore decreasing to about two-thirds of equatorial values by the lower latitude regions ofthe temperate humid belts (30 N or S) and to around freezing (0 C) by 60 N or S for
4528

CPD8, 4513–4564, 2012
Modulation of LateCretaceous and
Cenozoic climate
D. V. Kent and G. Muttoni
Title Page
Abstract Introduction
Conclusions References
Tables Figures
J I
J I
Back Close
Full Screen / Esc
Printer-friendly Version
Interactive Discussion
Discussion
Paper
|D
iscussionP
aper|
Discussion
Paper
|D
iscussionP
aper|
today’s pCO2 level. The most potent and persistent combination of high temperatureand high moisture for silicate weathering clearly resides in the equatorial humid belt (5
S–5 N, a zone which constitutes 44 Mkm2 or 8.7 % of Earth’s total surface area) at anypCO2 level and that is where we focus attention in estimating CO2 consumption rates.
5 Quantification of CO2 silicate weathering sinks5
Total continental area in the equatorial humid belt was relatively steady at ∼ 12 Mkm2,which is a little more than one-quarter (27 %) of the available surface area in this zoneand about 8 % of total continental area (149 Mkm2), from at least 120 Ma to around65 Ma (Fig. 5a; see also paleogeography in Fig. 3a,b). Over this time interval, SouthAmerica had a decreasing areal contribution that was essentially balanced by Africa10
plus Arabia’s increasing areal contribution in the equatorial humid belt. Other land ar-eas had almost negligible contributions until the arrival of Greater India, whose north-ward passage through the equatorial humid belt provides the distinctive humped signa-ture of the total area curve (Fig. 5a). From the peak of 15 Mkm2 at ∼ 55 Ma, total landarea within the equatorial humid belt decreased with the northward indentation of India15
into Asia and leveled out at around 11 Mkm2 by 25 Ma when the southerly motion of SEAsia (plus the widening equatorial expanse of South America and the northerly motionof New Guinea attached to Australia) balanced the decreasing contributions from thenarrowing equatorial expanse of Africa.
The only large land-based basalt province straddling the equatorial humid belt dur-20
ing the entire Mesozoic was the 201 Ma (earliest Jurassic) Central Atlantic magmaticprovince (CAMP; Marzoli et al., 1999), whereas the 250 Ma Siberian Traps remained inhigh (> 50 N) latitudes, the 130 Ma Parana province of South America was in the aus-tral tropical arid belt, and the ∼ 120 Ma Rajmajal Traps formed poleward of 50 S in theaustral temperate humid belt (Fig. 3). Although CAMP flood basalts were apparently25
emplaced over a huge area across tropical central Pangea, only scattered dikes andsills with minor exposures of lavas in isolated rift basins now remain (McHone, 2003).
4529

CPD8, 4513–4564, 2012
Modulation of LateCretaceous and
Cenozoic climate
D. V. Kent and G. Muttoni
Title Page
Abstract Introduction
Conclusions References
Tables Figures
J I
J I
Back Close
Full Screen / Esc
Printer-friendly Version
Interactive Discussion
Discussion
Paper
|D
iscussionP
aper|
Discussion
Paper
|D
iscussionP
aper|
The bulk of the CAMP lavas were probably weathered, eroded or buried soon aftertheir emplacement in the earliest Jurassic. This is compatible with a systematic de-crease in atmospheric pCO2 from paleosols formed within less than a million years ofCAMP lavas in eastern North America that is most likely due to consumption via silicateweathering (Schaller et al., 2012). In any case, we suppose that what exposed CAMP5
fragments remained were probably too small or had already drifted out of the equato-rial humid belt to be important factors in weathering consumption by Cretaceous times.The more or less constant area (0.9 Mkm2) of basaltic rocks from 120 Ma to 50 Ma ismostly in the Andes of South America with some contribution from the Sumatra–Javaarc (Fig. 5b).10
The Deccan Traps (current surface of 0.5 Mkm2; original volume of ∼ 2 Mkm3; Cour-tillot and Renne, 2003) were emplaced at ∼ 65 Ma in the austral arid belt (Fig. 3b) andin our view became a major consumer in the long-term CO2 budget only when thecontinental LIP that was riding on the India plate drifted into the equatorial humid at50 Ma (Fig. 3c), just about when Greater India began to collide with Asia. At 30 Ma, the15
Ethiopian Traps (current surface of 0.4 Mkm2 = 1/2 of original surface; Rochette et al.,1998) erupted virtually on the equator just as the Deccan Traps drifted out of the equa-torial humid belt where Java and Sumatra already began to impinge (Fig. 3d). Tectonicextrusion of SE Asia may have effectively ceased by 15 Ma but a gradual southerlydrift due to Eurasia clockwise rotation brought Borneo into the equatorial humid belt20
(Fig. 3e) where it was eventually joined by New Guinea (attached to Australia) com-ing from the south (Fig. 3f). Today, there are more than 2 Mkm2 of highly weatherablebasaltic and mixed arc and related rocks in the equatorial humid belt (Fig. 5b).
To estimate the CO2 consumption rate of the varying land areas within the equatorialhumid belt as a function of time, we use the following rates for the dominant litholo-25
gies. The rate for basaltic-rich provinces (Deccan and Ethiopian traps, Andes, Javaand Sumatra arc) was set to a nominal value of 100 Mton CO2 Myr−1 km−2; this valuerepresents a rounded estimate falling in the lower (conservative) side of a present-dayCO2 consumption span ranging from 84.5 Mton CO2 Myr−1 km−2 for SE Asia in toto to
4530

CPD8, 4513–4564, 2012
Modulation of LateCretaceous and
Cenozoic climate
D. V. Kent and G. Muttoni
Title Page
Abstract Introduction
Conclusions References
Tables Figures
J I
J I
Back Close
Full Screen / Esc
Printer-friendly Version
Interactive Discussion
Discussion
Paper
|D
iscussionP
aper|
Discussion
Paper
|D
iscussionP
aper|
282 Mton CO2 Myr−1 km−2 for the island of Java alone (Dessert et al., 2003). A nominal1/2 of the basalt weathering rate (50 MtonMyr−1 km−2) was applied to mixed (basaltic-granitic-gneissic) land areas (South Indochina, Borneo, New Guinea) following Dessertet al. (2001); for example, the basaltic island of Reunion (21 S; ∼ 240 cmyr−1 runoff,19 C mean annual temperature) has an annual CO2 consumption rate that is roughly5
twice that of the climatically similar, mixed basaltic-granitic island of Puerto Rico (18 N,∼ 360 cmyr−1 runoff, 22 C mean annual temperature; Fig. 2 in Dessert et al., 2001).CO2 consumption rates for continental cratonic regions are expected to be much lowerdue to much less weatherable granitic lithologies (i.e., deficient in Mg and Ca) and gen-erally low topographic relief (i.e., transport-limited regimes; see Sect. 9 below). With all10
due caveats, we use 5 MtonMyr−1 km−2 for continental cratonic areas, a rate that is anorder of magnitude less than for mixed lithology land areas like New Guinea and com-patible with the relative sense of CO2 consumption rates deduced from the chemistryof large rivers in such areas (Gaillardet et al., 1999).
Paleotemperature estimates from planktonic foraminiferal oxygen isotope records15
point to tropical climate throughout the Eocene only a few degrees warmer than modernsea-surface temperatures (Pearson et al., 2007). Extrapolation to the past of modernCO2 consumption rates for the tropics should therefore provide reasonably compatibleestimates as far as the temperature component is concerned although the ancientweathering rates are still likely to be underestimated due to more vigorous hydrological20
cycles during times of higher atmospheric pCO2 levels.CO2 consumption values corresponding to these rates were calculated for areas of
subaerial basalts and mixed crust and for the remaining continental cratonic areas inthe equatorial humid belt in 5 Myr intervals (Fig. 6). Under these assumptions, areasof subaerial basalts and mixed crust contribute about 50 % more than the remaining25
much vaster continental cratonic areas (all in the equatorial humid belt) from 120 to50 Ma, after which the contribution of subaerial basalts and mixed crust eventuallyincreases to nearly 3.5 times that of the remaining continental cratonic areas. Thecombined CO2 consumption profile for all subaerial crust in the equatorial humid belt
4531

CPD8, 4513–4564, 2012
Modulation of LateCretaceous and
Cenozoic climate
D. V. Kent and G. Muttoni
Title Page
Abstract Introduction
Conclusions References
Tables Figures
J I
J I
Back Close
Full Screen / Esc
Printer-friendly Version
Interactive Discussion
Discussion
Paper
|D
iscussionP
aper|
Discussion
Paper
|D
iscussionP
aper|
(top curve in Fig. 6) has much of the character of the potent subaerial basalts and mixedcrust component, for example, the downward blip at ∼ 35 Ma is essentially due to anapparent gap of highly weatherable basalts in the equatorial humid belt between thenorthward drift of the Deccan Traps out of the belt before the eruption of the EthiopianTraps at 30 Ma (Fig. 5b). We cannot exclude that this short-term variation might in part5
be an artifact associated with uncertainties of a few degrees in paleolatitudes or withphenomena, like monsoons, not taken into account with the simple zonal climate modelused to fix the latitudinal bounds of the equatorial humid belt. Hence the smoothedcurve in Fig. 6 may provide a more substantiated representation at this juncture of thesecular change in total consumption of CO2. It is remarkable that the estimated CO210
consumption of up to 190 TtonMyr−1 from silicate weathering of only a small fractionof total land with basaltic and mixed crust provinces currently residing in the equatorialhumid belt may balance a substantial fraction (> 2/3) of modern total CO2 outgassingof 260 Tton CO2 Myr−1.
6 Role of organic carbon burial15
Burial of organic carbon can also sequester atmospheric pCO2. Secular changes of therelative fractions of carbonate and organic carbon buried in sediments and changes incarbon sinks and sources may be reflected in marine carbon-isotope records (Kumpand Arthur, 1999). Since carbonate is mostly produced in surface waters (Broecker andWoodruff, 1992; Kump, 1991), we use a compilation by Katz et al. (2005) of bulk sedi-20
ment carbonate carbon isotopes, which mainly reflect calcareous plankton. A compar-ison between this bulk sediment δ13Ccarb record and the benthic foraminifera δ13CBFrecord compiled by Cramer et al. (2009) provides some insight into the evolving role ofthe biological pump, which describes the transfer of carbon from the shallow to deepwater reservoirs. The compiled bulk sediment and benthic records are both reasonable25
continuous from ∼ 77 Ma to Present and are plotted in Fig. 7.
4532

CPD8, 4513–4564, 2012
Modulation of LateCretaceous and
Cenozoic climate
D. V. Kent and G. Muttoni
Title Page
Abstract Introduction
Conclusions References
Tables Figures
J I
J I
Back Close
Full Screen / Esc
Printer-friendly Version
Interactive Discussion
Discussion
Paper
|D
iscussionP
aper|
Discussion
Paper
|D
iscussionP
aper|
The organic fraction (forg) of the total carbon burial flux at steady state can be esti-mated using the relationship (Eq. 4 in Kump and Arthur, 1999):
forg = (δ′w −δcarb)/∆B
where δ′w is the average carbon isotopic composition of the volcanic and riverine flux5
(assumed to be −5‰), δcarb is the isotopic composition of carbonate sediments thatreflect the oceanic carbon reservoir, and ∆B represents the isotopic difference betweenthe organic matter and carbonate deposited from the ocean. If ∆B is assumed to beconstant (say −29 ‰) from 77 Ma to 15 Ma, when the rise of C4 photosynthetic path-ways may have influenced the organic carbon isotopic composition, a mean δcarb of10
2.3 ‰ would imply a mean organic burial fraction (forg ) of 0.25 over this time interval.Accounting for a photosynthetic isotope effect related to atmospheric pCO2 (expressedas a dependence of ∆B on ambient pCO2; Kump and Arthur, 1999) would tend toslightly increase the average organic burial fraction with declining atmospheric pCO2levels since 35 Ma, for example, forg would be 0.27 for pCO2 of ∼ 350 ppm.15
Two prominent features in the bulk sediment carbon isotope record deserve discus-sion. One is a huge fluctuation with a 1.5 ‰ increase starting at around 62.5 Ma thatpeaks at 57 Ma and plummeting by 2 ‰ to a prominent trough at 52 Ma (Fig. 7b). Therun-up to the carbon isotope peak at 57 Ma implies an increasing fraction of organiccarbon sequestration (forg up to 0.3). This may be related to burial of organic-rich sed-20
iments deposited on the passive margin of Greater India encountering the equatorialhigh productivity belt during final stages of transit toward the Tethyan subduction zone(Fig. 3b); the subsequent decrease in carbonate carbon isotope values (implying thatforg decreased to more typical values of ∼ 0.22) starting at around 57 Ma may mark theexhumation and oxidation of these and other organic carbon-rich Tethyan marine sed-25
iments during the early stages of the India-Asia collision, as suggested by Beck et al.(1995). The climatic effect of this large perturbation is not entirely clear: Beck et al.(1995) suggested that exhumation of organic carbon from the Tethyan colliding mar-gins may have increased atmospheric greenhouse gases sufficiently to have driven
4533

CPD8, 4513–4564, 2012
Modulation of LateCretaceous and
Cenozoic climate
D. V. Kent and G. Muttoni
Title Page
Abstract Introduction
Conclusions References
Tables Figures
J I
J I
Back Close
Full Screen / Esc
Printer-friendly Version
Interactive Discussion
Discussion
Paper
|D
iscussionP
aper|
Discussion
Paper
|D
iscussionP
aper|
global warming in the early Cenozoic even though the EECO seems to peak a fewmillion years after the signature decrease in carbonate carbon isotope ratios (Fig. 7a).
The second notable perturbation is the large (up to ∼ 2.5 ‰) decrease in both thebulk sediment and benthic records from 15 Ma to present (Fig. 7b, c). This markeddownward trend was originally interpreted by Shackleton (1987) as due to a decreasing5
fraction of organic carbon burial (ostensibly from 0.3 to 0.2) but even with validatingdata (Shackleton and Hall, 1995), its origin was considered rather enigmatic (Broeckerand Woodruff, 1992). Katz et al. (2005) suggested that about 1.1 ‰ of the decreasein the bulk sediment carbon isotope record could be accounted for by the rise of C4photosynthetic pathways over the past 15 Myr with the remaining ∼ 1.4 ‰ decrease due10
to weathering of organic-rich shales. In any case, there is no evidence for increasingorganic carbon burial over the past 15 Myr even though climate deteriorated from theMiddle Miocene climate optimum (Flower and Kennett, 1994; Miller et al., 1987; Wrightet al., 1992; You et al., 2009).
In a comparison between the bulk sediment and benthic carbonate δ13C records15
(Fig. 7B, C), the average value for benthic data between 77 Ma and 65 Ma, just beforethe Cretaceous–Paleogene boundary perturbation (D’Hondt et al., 1998), is 1.14 ‰,which is 1.13 ‰ lighter than the bulk sediment δ13C mean of 2.27 ‰ over the sameinterval. From 50 Ma, just after the Paleocene–Eocene boundary perturbation (Hiltinget al., 2008), to 35 Ma, just before Oi-1 at around the Eocene–Oligocene boundary,20
the benthic mean is 0.70 ‰, which is now 1.56 ‰ lighter than the corresponding bulksediment mean of 2.26 ‰. From 33 Ma, just after Oi-1, to 18 Ma, just before the Mid-dle Miocene Climate Optimum, the benthic mean is 0.73 ‰ and again about 1.56 ‰lighter than the corresponding bulk sediment mean of 2.29 ‰. It would thus appearthat the biological pump spun-up soon after EECO (∼ 50 Ma), which is well before the25
strengthening of ocean circulation and the inception of large Antarctic ice sheets atOi-1 at around 34 Ma (e.g., Cramer et al., 2009; Kennett, 1977). In fact, the deep waterto surface water δ13C gradient (a measure of biopump activity) was hardly differentfrom 35–50 Ma to 18–33 Ma according to these data, indicating that there had to be
4534

CPD8, 4513–4564, 2012
Modulation of LateCretaceous and
Cenozoic climate
D. V. Kent and G. Muttoni
Title Page
Abstract Introduction
Conclusions References
Tables Figures
J I
J I
Back Close
Full Screen / Esc
Printer-friendly Version
Interactive Discussion
Discussion
Paper
|D
iscussionP
aper|
Discussion
Paper
|D
iscussionP
aper|
other processes besides the redistribution of nutrients by ocean circulation to accountfor the carbon isotope profiles. We suggest that higher biological productivity was plau-sibly spurred by influx of new nutrients, notably phosphate (Schrag et al., 2002), fromenhanced weathering of continental silicates starting at EECO, which coincided withwidespread deposition of chert in the world ocean (Muttoni and Kent, 2007).5
We conclude that over the past 100 Myr (Late Cretaceous and Cenozoic), high or-ganic carbon burial, such as major oil formation in the Cretaceous (Irving et al., 1974),seemed to be more in response to higher productivity associated with elevated at-mospheric pCO2 concentrations and resulting greater nutrient supply from continentalsilicate weathering but did not seem to play a very prominent role in modulating atmo-10
spheric pCO2 over this time scale.
7 Uplift-erosion hypothesis
According to the uplift-erosion hypothesis (Raymo and Ruddiman, 1992), uplift of theHimalayas and Tibetan Plateau as a consequence of the India-Asia collision enhancedsilicate weathering rates and the associated consumption of atmospheric pCO2, caus-15
ing Earth’s climate to descend into glacial mode with the initiation of continental-scaleice sheets at ∼ 34 Ma. This was largely based on the supposition that the progres-sive increase in 87Sr/86Sr values of marine carbonates since ∼ 40 Ma (Richter et al.,1992) was due to enhanced delivery of radiogenic Sr due to increased global chemicalweathering rates from mountain building, especially the uplift of the Himalayas (Raymo20
et al., 1988). Others have argued rather persuasively, however, that most of the overallincrease in 87Sr/86Sr resulted from the unroofing and weathering erosion of particularlyradiogenic Himalayan rocks, such as leucogranites (Edmond, 1992) and metasedi-ments (Harris, 1995) including metamorphosed limestones (Quade et al., 1997), inwhich case the 87Sr/86Sr seawater curve may not serve as a simple proxy for global25
weathering rates of continental silicates. The Himalayas and Tibetan Plateau formed inthe boreal arid belt (Fig. 3d), which along with adiabatically cooler temperatures due to
4535
CPD8, 4513–4564, 2012
Modulation of LateCretaceous and
Cenozoic climate
D. V. Kent and G. Muttoni
Title Page
Abstract Introduction
Conclusions References
Tables Figures
J I
J I
Back Close
Full Screen / Esc
Printer-friendly Version
Interactive Discussion
Discussion
Paper
|D
iscussionP
aper|
Discussion
Paper
|D
iscussionP
aper|
high elevations during uplift would not make them prime candidates for strong chemi-cal weathering and high CO2 consumption. Vigorous (weathering-limited) mechanicalerosion occurred in elevated regions with high relief but silicate weathering intensity isgenerally low, even in the sediment basins like the Ganges system at lower elevations(France-Lanord and Derry, 1997).5
We had previously suggested (Kent and Muttoni, 2008) that weathering of exhumedHimalayan silicates may have taken over as an important CO2 sink as the DeccanTraps began to drift out of the equatorial humid belt, in basic agreement with the uplift-erosion hypothesis. However, while we firmly acknowledge the importance of relief inmaintaining weatherable surfaces, we suggest that it is the potency of a warm and10
humid setting that is of greater importance in the overall consumption of CO2. Wewould thus now argue that enhanced continental silicate weathering stemming from theemplacement of the Ethiopian Traps and especially the arrival and continued residenceof SE Asia in the equatorial humid belt provides a better explanation for the subsequentdrawing down of atmospheric pCO2.15
8 Implications for calcite and aragonite seas
Carbonate mineralogy has oscillated through the Phanerozic between low-Mg calciteand high-Mg conditions favoring aragonite deposition, with calcite seas usually associ-ated with greenhouse climates (most recently from the Jurassic to Eocene) and arago-nite seas with icehouse climates (most recently from Oligocene to Present) (Sandberg,20
1983) (Fig. 7). The broad secular shifts in carbonate mineralogies coincide with oscil-lations in potash evaporite composition (Hardie, 1996) and are generally attributed tochanges in Mg/Ca ratios of ancient seawater, which can be reconstructed from fluid in-clusions (Lowenstein et al., 2001), fossil echinoderms (Dickson, 2002) and carbonateveins formed in oceanic crust (Coggon et al., 2010): all show a parallel albeit poorly25
dated rise in Mg/Ca ratios starting sometime in the mid-Cenozoic. Long-term oscilla-tions in Mg/Ca ratios of seawater are typically modeled as being controlled primarily
4536

CPD8, 4513–4564, 2012
Modulation of LateCretaceous and
Cenozoic climate
D. V. Kent and G. Muttoni
Title Page
Abstract Introduction
Conclusions References
Tables Figures
J I
J I
Back Close
Full Screen / Esc
Printer-friendly Version
Interactive Discussion
Discussion
Paper
|D
iscussionP
aper|
Discussion
Paper
|D
iscussionP
aper|
by varying hydrothermal activity (a major Mg sink) driven by presumed changes inthe rate of ocean crust production (Demicco et al., 2005; Farkas et al., 2007; Hardie,1996; Stanley and Hardie, 1998). However, if rates of ocean crust production (and hy-drothermal activity) were actually steady (Rowley, 2002), and barring major changesin other potential Mg-sinks like dolomitization, changes in sources of Mg and Ca may5
have played a significant role in influencing the major cation chemistry of sea water.In particular, the mid-Cenozoic increase in Mg/Ca ratios may be due to intense weath-ering of continental mafic rocks starting with the entry of the Deccan Traps into theequatorial humid belt at 50 Ma and continuing with that of the Ethiopian Traps and upto the present with the SE Asia arc terrane, essentially part of the same process that10
we believe caused the drawdown in atmospheric pCO2. The Deccan’s initial volume of∼ 4 Mkm3 (Courtillot and Renne, 2003) means it alone contained roughly 360 Tton ofMg (nominal concentration of 3 wt %). Compared to (modern) riverine Mg flux equiva-lent to ∼ 140 Mtonyr−1 (Holland, 1984), this suggests that erosion of the Deccan couldhave contributed important extra Mg for the calcite-aragonite sea transition as well as15
extra Ca that sensibly deepened the carbonate compensation depth over the later partof the Cenozoic (Lyle et al., 2008).
9 Transport-limited negative feedback
The relatively small surficial carbon reservoir compared to the large carbon fluxes im-plies that there is close parity on million year time scales between inputs (volcanic20
outgasssing and metamorphism) and outputs (silicate weathering followed by deposi-tion of carbonate minerals and burial of organic carbon) to maintain a stable level ofCO2 in the atmosphere (Berner and Caldeira, 1997). This fine balance requires a neg-ative feedback that depends strongly on the level of atmospheric CO2. A powerful con-cept for policing the CO2 content of the atmosphere is the CO2-silicate weathering25
feedback mechanism of Walker et al. (1981) that underlies the BLAG model (Berneret al., 1983) and the GEOCARB lineage of supply-side carbon cycling models (Berner,
4537

CPD8, 4513–4564, 2012
Modulation of LateCretaceous and
Cenozoic climate
D. V. Kent and G. Muttoni
Title Page
Abstract Introduction
Conclusions References
Tables Figures
J I
J I
Back Close
Full Screen / Esc
Printer-friendly Version
Interactive Discussion
Discussion
Paper
|D
iscussionP
aper|
Discussion
Paper
|D
iscussionP
aper|
2004): increases or decreases in CO2 outgassing induce an opposing response fromhigher or lower chemical weathering rates via associated greenhouse effects. A stabi-lizing negative feedback is more difficult to identify in a sink-side model, for example,an uplift-weathering mechanism (i.e., model of Raymo and Ruddiman, 1992) left un-coupled to the CO2 content of the atmosphere would eventually produce a crash in5
atmospheric pCO2. After evaluating alternative mechanisms, such as a possible albeittenuous link between erosion and organic carbon burial (Raymo, 1994), Broecker andSanyal (1998) concluded that the pCO2 level of the atmosphere almost certainly hasto act as the controller of a silicate weathering feedback.
So what is to keep atmospheric pCO2 from plunging or wildly oscillating in our dy-10
namic geography, sink-side model? We suggest that as a continental silicate provincedrifts into the equatorial humid belt and is subject to relatively intense chemical weath-ering, there may eventually be a transition from weathering-limited to transport-limitedregimes with thickening of cation-deficient soils that will tend to retard further chemicalweathering of the bedrock; this is likely to characterize cratonic areas with low relief15
(Kump et al., 2000; West et al., 2005). In the case of continental basaltic provincesentering the equatorial humid belt, they are provided with initial relief from plume headuplift and the stacking of lava flows that would prolong the weathering-limited phase;nevertheless, they may eventually be either consumed by intense weathering or driftout of the intense weathering regime, resulting in a reduction to their contribution to20
CO2 drawdown. The Deccan and Ethiopian Traps soon enough drifted out of the equa-torial humid belt and escaped this fate of complete consumption by weathering anderosion whereas most of the once widespread CAMP lavas were evidently largely con-sumed probably not long after their emplacement at around 201 Ma (Schaller et al.,2012), leaving only a few remnants amongst the now-dispersed Atlantic-bordering con-25
tinents.An interesting exception is SE Asia, a major CO2 sink (Dessert et al., 2003) that
has been straddling the equatorial humid belt since at least 25 Ma and which, as a setof island arc terranes, has been continuously rejuvenated by uplift and magmatism
4538
CPD8, 4513–4564, 2012
Modulation of LateCretaceous and
Cenozoic climate
D. V. Kent and G. Muttoni
Title Page
Abstract Introduction
Conclusions References
Tables Figures
J I
J I
Back Close
Full Screen / Esc
Printer-friendly Version
Interactive Discussion
Discussion
Paper
|D
iscussionP
aper|
Discussion
Paper
|D
iscussionP
aper|
and therefore subjected to persistent intense weathering. There would be hardly anynegative feedback in this case, making SE Asia a prime candidate responsible forthe unregulated consumption of enough CO2 to plunge Earth’s climate system intoa glacial mode and keep it there in the later part of the Cenozoic. Higher east-westsea-surface temperature gradients and more vigorous Walker circulation in the equa-5
torial Pacific, much like normal conditions today, resulted from the end of continual ElNino due to global shoaling of the oceanic thermocline at around 3 Ma (Fedorov et al.,2006; Ravelo, 2006); we are tempted to speculate that increased rainfall over the SEAsia equatorial archipelago may have caused sufficiently higher CO2 consumption fromrunoff-enhanced silicate weathering to trigger Northern Hemisphere glaciations.10
10 Concluding remarks
We conclude that while significant variations in potential sources of CO2 such asoceanic crust production rates and hydrothermal activity cannot be precluded eventhough they are notoriously difficult to calibrate, a dynamic paleogeographic model ofvariable CO2 sinks arising from the changing latitudinal distribution of land masses,15
and especially basaltic provinces and island arc terranes, provides a measurable andhence testable mechanism to account for long-term variations in atmospheric pCO2levels over the Late Cretaceous and Cenozoic, and potentially further back in Earthhistory.
Key is the sporadic presence of highly weatherable continental basalt provinces in20
the equatorial humid belt, the engine of Earth’s climate system that is characterizedby warm temperatures and high rainfall at widely varying atmospheric pCO2 levels.With no highly weatherable basaltic provinces in the equatorial humid belt from atleast 120 Ma to 50 Ma, atmospheric pCO2 levels tended to be elevated giving riseto warm climates such as the intervals centered on the CTM and the EECO. These25
super-greenhouse conditions would have activated enhanced weathering of continentsand especially basaltic provinces in a warmer and wetter temperate humid belt. For
4539

CPD8, 4513–4564, 2012
Modulation of LateCretaceous and
Cenozoic climate
D. V. Kent and G. Muttoni
Title Page
Abstract Introduction
Conclusions References
Tables Figures
J I
J I
Back Close
Full Screen / Esc
Printer-friendly Version
Interactive Discussion
Discussion
Paper
|D
iscussionP
aper|
Discussion
Paper
|D
iscussionP
aper|
example, many of the lavas of the British Tertiary igneous province, a subprovince ofthe North Atlantic igneous province LIP of Late Paleocene to Early Eocene age thatwas emplaced and remained at mid-paleolatitudes of ∼ 45 N (Ganerød et al., 2010),were erupted subaerially (Saunders et al., 1997) and are often closely associated withwell-developed laterites, such as the 30 m-thick unit belonging to the Interbasaltic For-5
mation in Antrim, Northern Ireland (Hill et al., 2000) and the red boles on the Isles ofMull and Skye in Scotland (Emeleus et al., 1996). Elsewhere in ostensibly temperateEurope, bauxite was named from Les Baux-de-Provence in France (∼ 44 N) for a lat-eritic aluminum ore that mainly formed on carbonate rocks of Jurassic and Cretaceousage (Retallack, 2010). In western North America, some of the highest calculated de-10
nudation rates for crystalline bedrock for non-glacial times were documented in theGreen River Basin (42 N) and ascribed to enhanced silicate dissolution rates asso-ciated with elevated atmospheric pCO2 levels that occurred during the EECO (Smithet al., 2008).
These and other examples support the concept that basaltic provinces outside the15
equatorial humid belt effectively act as safety valves that limit extreme accumulations ofCO2 in the atmosphere. Nonetheless, a dynamic CO2-sink model implies that equableclimates are the norm or default mode. Ice ages are the exception, due to fortuitous lat-itudinal distributions of potent silicate weathering sinks of CO2 with only weak negativefeedback. In other words, the silicate-weathering thermostat, so effective at the high20
temperature end, sometimes cannot sufficiently decrease weathering rates of highlyweatherable (i.e., basaltic) continental provinces in the equatorial humid belt that is notwell coupled to atmospheric pCO2 levels, thus paving the way to an ice age (or at theextreme, a Snowball Earth: Hoffman and Schrag, 2002; Godderis et al., 2003).
4540

CPD8, 4513–4564, 2012
Modulation of LateCretaceous and
Cenozoic climate
D. V. Kent and G. Muttoni
Title Page
Abstract Introduction
Conclusions References
Tables Figures
J I
J I
Back Close
Full Screen / Esc
Printer-friendly Version
Interactive Discussion
Discussion
Paper
|D
iscussionP
aper|
Discussion
Paper
|D
iscussionP
aper|
Acknowledgements. We thank our respective institutions for their support that allowed us to ac-complish this bootlegged research. We especially acknowledge constructive comments and in-formative discussions after presentations of evolving versions of this work that challenged us tolook deeper and more broadly at the problem. In particular, we are grateful to Ben Cramer, BobKopp, Peter Molnar and Morgan Schaller for detailed written comments, and Wally Broecker,5
Mimi Katz and Ken Miller for valuable critical exchanges on earlier versions of the manuscript.Ben Cramer and Mimi Katz generously provided digital files of compiled carbon isotope data.Lamont-Doherty Earth Observatory contribution #0000.
References
Achache, J., Courtillot, V., and Zhou, Y. X.: Paleogeographic and tectonic evolution of Southern10
Tibet since middle Cretaceous time: new paleomagnetic data and synthesis, J. Geophys.Res., 89, 10311–10339, 1984.
Agard, P., Omrani, J., Jolivet, L., and Mouthereau, G.: Convergence history across Zagros(Iran): constraints from collisional and earlier deformation, Int. J. Earth Sci., 94, 401– 419,2005.15
Aitchison, J. C., Ali, J. R., and Davis, A. M.: When and where did India and Asia collide?, J.Geophys. Res., 112, B05423, doi:10.1029/2006JB004706, 2007.
Aitchison, J. C., Ali, J. R., and Davis, A. M.: Reply to comment by Eduardo Garzantion “When and where did India and Asia collide?”, J. Geophys. Res., 113, B04412,doi:10.1029/2007JB005431, 2008.20
Ali, J. R. and Aitchison, J. C.: Gondwana to Asia: plate tectonics, paleogeography and thebiological connectivity of the Indian sub-continent from the Middle Jurassic through latestEocene (166–35 Ma), Earth-Sci. Rev., 88, 145–166, 2008.
Allegre, C. J., Courtillot, V., Tapponnier, P., Hirn, A., Mattauer, M., Coulon, C., Jaeger, J. J.,Achache, J., Scharer, U., Marcoux, J., Burg, J. P., Girardeau, J., Armijo, R., Gariepy, C.,25
Gopel, C., Tindong, L., Xuchang, X., Chenfa, C., Guangqin, L., Baoyu, L., Jiwen, T., Nai-wen, W., Guoming, C., Tonglin, H., Xibin, W., Wanming, D., Huaibin, S., Yougong, C., Ji, Z.,Hongrong, Q., Peisheng, B., Songchan, W., Bixiang, W., Yaoxiu, Z., and Xu, R.: Structureand evolution of the Himalaya-Tibet orogenic belt, Nature, 307, 17–22, 1984.
4541

CPD8, 4513–4564, 2012
Modulation of LateCretaceous and
Cenozoic climate
D. V. Kent and G. Muttoni
Title Page
Abstract Introduction
Conclusions References
Tables Figures
J I
J I
Back Close
Full Screen / Esc
Printer-friendly Version
Interactive Discussion
Discussion
Paper
|D
iscussionP
aper|
Discussion
Paper
|D
iscussionP
aper|
Allen, M. B. and Armstrong, H. A.: Arabia-Eurasia collision and the forcing of mid-Cenozoicglobal cooling, Palaeogeogr. Palaeocl., 265, 52–58, 2008.
Beck, R. A., Burbank, D. W., Sercombe, W. J., Olson, T. L., and Khan, A. M.: Organic carbonexhumation and global warming during the early Himalayan collision, Geology, 23, 387–390,1995.5
Beerling, D. J. and Royer, D. L.: Convergent Cenozoic CO2 history, Nat. Geosci., 4, 418–420,2011.
Berger, W. H. and Winterer, E. L.: Plate stratigraphy and the fluctuating carbonate line, in:Pelagic Sediments: On Land and Under the Sea, edited by: Hsu, K. J. and Jenkins, H. C.,Special Publications of the International Association of Sedimentologists, No. 1, Blackwell10
Scientific Publications, Oxford, 11–48, 1974.Berner, R. A.: Global CO2 degassing and the carbon cycle: comment on “Cretaceous ocean
crust at DSDP sites 417 and 418: carbon uptake from weathering vs. loss by magmaticoutgassing”, Geochim. Cosmochim. Acta, 54, 2889–2890, 1990a.
Berner, R. A.: Response to criticism of the BLAG model, Geochim. Cosmochim. Acta, 54, 2893,15
1990b.Berner, R. A.: A model for atmospheric CO2 over Phanerozoic time, Am. J. Sci., 291, 339–376,
1991.Berner, R. A.: GEOCARB II: a revised model of atmospheric CO2 over Phanerozoic time, Am.
J. Sci., 294, 56–91, 1994.20
Berner, R. A.: The Phanerozoic Carbon Cycle, Oxford University Press, Oxford, 150 pp., 2004.Berner, R. A.: GEOCARBSULF: a combined model for Phanerozoic atmospheric O2 and CO2,
Geochim. Cosmochim. Acta, 70, 5653–5664, 2006.Berner, R. A. and Caldeira, K.: The need for mass balance and feedback in the geochemical
carbon cycle, Geology, 25, 955–956, 1997.25
Berner, R. A. and Kothalava, Z.: GEOCARB III: a revised model of atmospheric CO2 overPhanerozoic time, Am. J. Sci., 301, 182–204, 2001.
Berner, R. A., Lasaga, A. C., and Garrels, R. M.: The carbonate-silicate geochemical cycle andits effect on atmospheric carbon dioxide over the past 100 million years, Am. J. Sci., 283,641–683, 1983.30
Besse, J. and Courtillot, V.: Apparent and true polar wander and the geometry of the geomag-netic field over the last 200 Myr, J. Geophys. Res., 107, 2300, doi:10.1029/2000JB000050,2002.
4542

CPD8, 4513–4564, 2012
Modulation of LateCretaceous and
Cenozoic climate
D. V. Kent and G. Muttoni
Title Page
Abstract Introduction
Conclusions References
Tables Figures
J I
J I
Back Close
Full Screen / Esc
Printer-friendly Version
Interactive Discussion
Discussion
Paper
|D
iscussionP
aper|
Discussion
Paper
|D
iscussionP
aper|
Besse, J. and Courtillot, V.: Correction to “Apparent and true polar wander and the ge-ometry of the geomagnetic field over the last 200 Myr”, J. Geophys. Res., 108, 2469,doi:10.1029/2003JB002684, 2003.
Brady, P. V. and Gislason, S. R.: Seafloor weathering controls on atmospheric CO2 and globalclimate, Geochim. Cosmochim. Acta, 61, 965–973, 1997.5
Briais, A., Patriat, P., and Tapponnier, P.: Updated interpretation of magnetic anomalies andseafloor spreading stages in the South China Sea: implications for the Tertiary tectonics ofSoutheast Asia, J. Geophys. Res., 98, 6299–6328, 1993.
Broecker, W. S. and Sanyal, A.: Does atmospheric CO2 police the rate of chemical weathering?,Global Biogeochem. Cy., 12, 403–408, 1998.10
Broecker, W. S. and Woodruff, F.: Discrepancies in the oceanic carbon isotope record for thelast fifteen million years?, Geochim. Cosmochim. Acta, 56, 3259–3264, 1992.
Caldeira, K.: Enhanced Cenozoic chemical weathering and the subduction of pelagic carbon-ate, Nature, 357, 578–581, 1992.
Caldeira, K. and Rampino, M. R.: Carbon dioxide emissions from Deccan volcanism and a K/T15
boundary greenhouse effect, Geophys. Res. Lett., 17, 1299–1302, 1990.Cande, S. C. and Kent, D. V.: Revised calibration of the geomagnetic polarity time scale for the
Late Cretaceous and Cenozoic, J. Geophys. Res., 100, 6093–6095, 1995.Cande, S. C. and Stegman, D. R.: Indian and African plate motions driven by the push force of
the Reunion plume head, Nature, 475, 47–52, 2011.20
Chang, C.-F. and Cheng, H.-L.: Some tectonic features of the Mt. Jolmo Lungma area, SouthernTibet, China, Sci. Sin., 16, 257–265, 1973.
Chen, W., Yang, T., Zhang, S., Yang, Z., Li, H., Wu, H., Zhang, J., Ma, Y., and Cai, F.: Pale-omagnetic results from the Early Cretaceous Zenong Group volcanic rocks, Cuoqin, Tibet,and their paleogeographic implications, Gondwana Res., 22, 461–469, 2012.25
Chen, Y., Courtillot, V., Cogne, J.-P., Besse, J., Yang, Z., and Enkin, R. J.: The configuration ofAsia prior to the collision of India: Cretaceous paleomagnetic constraints, J. Geophys. Res.,98, 21927–21941, 1993.
Coggon, R. M., Teagle, D. A. H., Smith-Duque, C. E., Alt, J. C., and Cooper, M. J.: Reconstruct-ing past seawater Mg/Ca and Sr/Ca from mid-ocean ridge flank calcium carbonate veins,30
Science, 327, 1114–1117, 2010.
4543

CPD8, 4513–4564, 2012
Modulation of LateCretaceous and
Cenozoic climate
D. V. Kent and G. Muttoni
Title Page
Abstract Introduction
Conclusions References
Tables Figures
J I
J I
Back Close
Full Screen / Esc
Printer-friendly Version
Interactive Discussion
Discussion
Paper
|D
iscussionP
aper|
Discussion
Paper
|D
iscussionP
aper|
Cogne, J. P.: PaleoMac: A Macintosh™ application for treating paleomagnetic data and mak-ing plate reconstructions, Geochem. Geophy. Geosy., 4, 1007, doi:10.1029/2001GC000227,2003.
Cogne, J.-P. and Humler, E.: Temporal variation of oceanic spreading and crustal productionrates during the last 180 My, Earth Planet. Sc. Lett., 227, 427–439, 2004.5
Cogne, J. P. and Humler, E.: Trends and rhythms in global seafloor generation rate, Geochem.Geophy. Geosy., 7, Q03011, doi:10.1029/2005GC001148, 2006.
Copley, A., Avouac, J.-P., and Royer, J.-Y.: India-Asia collision and the Cenozoic slowdown ofthe Indian plate: Implications for the forces driving plate motions, J. Geophys. Res., 115,B03410, doi:10.1029/2009JB006634, 2010.10
Courtillot, V. E. and Renne, P. R.: On the ages of flood basalt events, C. R. Geosci., 335,113–140, 2003.
Cramer, B. S., Toggweiler, J. R., Wright, J. D., Katz, M. E., and Miller, K. G.: Ocean overturningsince the Late Cretaceous: Inferences from a new benthic foraminiferal isotope compilation,Paleoceanography, 24, PA4216, doi:10.1029/2008PA001683, 2009.15
Cramer, B. S., Miller, K. G., Toggweiler, J. R., Barrett, P. J., and Wright, J. D.: Late Cretaceous-Neogene trends in deep ocean temperature and continental ice volume: reconciling recordsof benthic foraminiferal geochemistry (δ18O and Mg/Ca) with sea level history, J. Geophys.Res.-Oceans, 116, C12023, doi:10.1029/2011JC007255, 2011.
DeConto, R. M. and Pollard, D.: Rapid Cenozoic glaciation of Antarctica induced by declining20
atmospheric CO2, Nature, 421, 245–249, 2003.DeConto, R. M., Pollard, D., Wilson, P. A., Palike, H., Lear, C. H., and Pagani, M.: Thresholds
for Cenozoic bipolar glaciation, Nature, 455, 652–656, 2008.Demicco, R. V., Lowenstein, T. K., Hardie, L. A., and Spencer, R. J.: Model of seawater compo-
sition for the Phanerozoic, Geology, 33, 877–880, 2005.25
Dessert, C., Dupre, B., Francois, L. M., Schott, J. J., Gaillardet, J., Chakrapani, G., and Ba-jpai, S.: Erosion of Deccan Traps determined by river geochemistry: impact on the globalclimate and the 87Sr/86Sr ratio of seawater, Earth Planet. Sc. Lett., 188, 459–474, 2001.
Dessert, C., Dupre, B., Gaillardet, J., Francois, L., and Allegre, C.: Basalt weathering laws andthe impact of basalt weathering on the global carbon cycle, Chem. Geol., 202, 257–273,30
2003.
4544

CPD8, 4513–4564, 2012
Modulation of LateCretaceous and
Cenozoic climate
D. V. Kent and G. Muttoni
Title Page
Abstract Introduction
Conclusions References
Tables Figures
J I
J I
Back Close
Full Screen / Esc
Printer-friendly Version
Interactive Discussion
Discussion
Paper
|D
iscussionP
aper|
Discussion
Paper
|D
iscussionP
aper|
D’Hondt, S., Donaghay, P., Zachos, J. C., Luttenberg, D., and Lindinger, M.: Organic carbonfluxes and ecological recovery from the Cretaceous–Tertiary mass extinction, Science, 282,276–279, 1998.
Dickson, J. A. D.: Fossil echinoderms as monitor of the Mg/Ca ratio of Phanerozoic oceans,Science, 298, 1222–1224, 2002.5
Donnadieu, Y., Godderis, Y., Pierrehumbert, R., Dromart, G., Fluteau, F., and Jacob, R.:A GEOCLIM simulation of climatic and biogeochemical consequences of Pangea breakup,Geochem. Geophy. Geosy., 7, Q11019, doi:10.1029/2006GC001278, 2006.
Dupont-Nivet, G., Lippert, P. C., Van Hinsbergen, D. J. J., Meijers, M. J. M., and Kapp, P.:Palaeolatitude and age of the Indo–Asia collision: palaeomagnetic constraints, Geophys. J.10
Int., 182, 1189–1198, 2010.Dupre, B., Dessert, C., Oliva, P., Godderis, Y., Viers, J., Francois, L., Millot, R., and Gaillardet, J.:
Rivers, chemical weathering and Earth’s climate, C. R. Geosci., 335, 1141–1160, 2003.Edmond, J. M.: Himalayan tectonics, weathering processes, and the strontium isotope record
in marine limestones, Science, 258, 1594–1597, 1992.15
Edmond, J. M. and Huh, Y.: Non-steady state carbonate recycling and implications for theevolution of atmospheric pCO2, Earth Planet. Sc. Lett., 216, 125–139, 2003.
Emeleus, C. H., Allwright, E. A., Kerr, A. C., and Williamson, I. T.: Red tuffs in the Palaeocenelava successions of the Inner Hebrides, Scott. J. Geol., 32, 83–89, 1996.
Engebretson, D. C., Kelley, K. P., Cashman, H. J., and Richards, M. A.: 180 million years of20
subduction, GSA Today, 2, 93–95, 1992.Erba, E.: Calcareous nannofossils and Mesozoic oceanic anoxic events, Mar. Micropaleontol.,
52, 85–106, 2004.Farkas, J., Bohm, F., Wallmann, K., Blenkinsop, J., Eisenhauer, A., van Geldern, R., Mun-
necke, A., Voigt, S., and Veizer, J.: Calcium isotope record of Phanerozoic oceans: impli-25
cations for chemical evolution of seawater and its causative mechanisms, Geochim. Cos-mochim. Acta, 71, 5117–5134, 2007.
Fedorov, A. V., Dekens, P. S., McCarthy, M., Ravelo, A. C., deMenocal, P. B., Barreiro, M.,Pacanowski, R. C., and Philander, S. G.: The Pliocene paradox (mechanisms for a perma-nent El Nino), Science, 312, 1485–1499, 2006.30
Flower, B. P. and Kennett, J. P.: The middle Miocene climatic transition: East Antarctic ice sheetdevelopment, deep ocean circulation and global carbon cycling, Palaeogeogr. Palaeocl., 108,537–555, 1994.
4545

CPD8, 4513–4564, 2012
Modulation of LateCretaceous and
Cenozoic climate
D. V. Kent and G. Muttoni
Title Page
Abstract Introduction
Conclusions References
Tables Figures
J I
J I
Back Close
Full Screen / Esc
Printer-friendly Version
Interactive Discussion
Discussion
Paper
|D
iscussionP
aper|
Discussion
Paper
|D
iscussionP
aper|
France-Lanord, C. and Derry, L. A.: Organic carbon burial forcing of the carbon cycle fromHimalayan erosion, Nature, 390, 65–67, 1997.
Fuller, M., Ali, J. R., Moss, S. J., Frost, G. M., Richter, B., and Mahfi, A.: Paleomagnetism ofBorneo, J. Asian Earth Sci., 17, 3–24, 1999.
Gaillardet, J., Dupre, B., Louvat, P., and Allegre, C. J.: Global silicate weathering and CO25
consumption rates deduced from the chemistry of large rivers, Chem. Geol., 159, 3–30,1999.
Ganerød, M., Smethurst, M. A., Torsvik, T. H., Prestvik, T., Rousse, S., McKenna, C., Hinsber-gen, J. J., and Hendriks, B. W. H.: The North Atlantic Igneous Province reconstructed andits relation to the Plume Generation Zone: the Antrim Lava Group revisited, Geophys. J. Int.,10
182, 183–202, 2010.Garzanti, E.: Comment on “When and where did India and Asia collide?” by Jonathan
C. Aitchison, Jason R. Ali, and Aileen M. Davis, J. Geophys. Res., 113, B004411,doi:10.1029/2007JB005276, 2008.
Garzanti, E., Baud, A., and Mascle, G.: Sedimentary record of the northward flight of India and15
its collision with Eurasia (Ladakh Himalaya, India), Geodinamica Acta (Paris), 1, 297–312,1987.
Gerlach, T.: Volcanic versus anthropogenic carbon dioxide, EOS, Transactions, American Geo-physical Union, 92, 201–202, 2011.
Godderis, Y., Donnadieu, Y., Nedelec, A., Dupre, B., Dessert, C., Grard, A., Ramstein, G., and20
Francois, L. M.: The Sturtian “snowball” glaciation: fire and ice, Earth Planet. Sc. Lett., 211,1–12, 2003.
Godderis, Y., Donnadieu, Y., de Vargas, C., Pierrehumbert, R. T., Dromart, G., and van deSchootbrugge, B.: Causal or casual link between the rise of nannoplankton calcification anda tectonically-driven massive decrease in Late Triassic atmospheric CO2?, Earth Planet. Sc.25
Lett., 267, 247–255, 2008.Hall, R., vanHattum, M. W. A., and Spakman, W.: Impact of India–Asia collision on SE Asia: the
record in Borneo, Tectonophysics, 451, 366–389, 2008.Hansen, J., Sato, M., Kharecha, P., Beerling, D., Berner, R., Masson-Delmotte, V., Pagani, M.,
Raymo, M., Royer, D. L., and Zachos, J. C.: Target atmospheric CO2: where should humanity30
aim?, Open Atmos. Sci. J., 2, 217–231, 2008.
4546

CPD8, 4513–4564, 2012
Modulation of LateCretaceous and
Cenozoic climate
D. V. Kent and G. Muttoni
Title Page
Abstract Introduction
Conclusions References
Tables Figures
J I
J I
Back Close
Full Screen / Esc
Printer-friendly Version
Interactive Discussion
Discussion
Paper
|D
iscussionP
aper|
Discussion
Paper
|D
iscussionP
aper|
Hardie, L. A.: Secular variation in seawater chemistry: an explanation for the coupled secu-lar variation in the mineralogies of marine limestones and potash evaporites over the past600 m.y, Geology, 24, 279–283, 1996.
Harris, N.: Significance of weathering Himalayan metasedimentary rocks and leucogranites forthe Sr isotope evolution of seawater during the early Miocene, Geology, 23, 795–798, 1995.5
Hatzfeld, D. and Molnar, P.: Comparisons of the kinematics and deep structures of the Zagrosand Himalaya and of the Iranian and Tibetan plateaus and geodynamic implications, Rev.Geophys., 48, RG2005, doi:10.1029/2009RG000304, 2010.
Hill, I. G., Worden, R. H., and Meighan, I. G.: Geochemical evolution of a palaeolaterite: theInterbasaltic Formation, Northern Ireland, Chem. Geol., 166, 65–84, 2000.10
Hilting, A. K., Kump, L. R., and Bralower, T. J.: Variations in the oceanic vertical carbon isotopegradient and their implications for the Paleocene-Eocene biological pump, Paleoceaeanog-raphy, 23, PA3222, doi:10.1029/2007PA001458, 2008.
Hoffman, P. F. and Schrag, D. P.: The snowball Earth hypothesis: testing the limits of globalchange, Terra Nova, 14, 129–155, 2002.15
Holland, H. D.: The Chemical Evolution of the Atmosphere and Oceans, Princeton UniversityPress, Princeton, p. 582, 1984.
Irving, E., North, F. K., and Couillard, R.: Oil, climate and tectonics, Can. J. Earth Sci., 11, 1–17,1974.
Johnston, F. K. B., Turchyn, A. V., and Edmonds, M.: Decarbonation efficiency in subduction20
zones: implications for warm Cretaceous climates, Earth Planet. Sc. Lett., 303, 143–152,2011.
Katz, M. E., Wright, J. D., Miller, K. G., Cramer, B. S., Fennel, K., and Falkowski, P. G.: Biologicaloverprint of the geological carbon cycle, Mar. Geol., 217, 323–338, 2005.
Kennett, J. P.: Cenozoic evolution of Antarctic glaciation, the circum-antarctic ocean and their25
impact on global paleoceanography, J. Geophys. Res., 82, 3843–3860, 1977.Kent, D. V. and Irving, E.: Influence of inclination error in sedimentary rocks on the Triassic
and Jurassic apparent polar wander path for North America and implications for Cordillerantectonics, J. Geophys. Res., 115, B10103, doi:10.1029/2009JB007205, 2010.
Kent, D. V. and Muttoni, G.: Equatorial convergence of India and early Cenozoic climate trends,30
Proc. Natl. Acad. Sci. USA, 105, 16065–16070, 2008.Kump, L. R.: Interpreting carbon-isotope excursions: Strangelove oceans, Geology, 19, 299–
302, 1991.
4547

CPD8, 4513–4564, 2012
Modulation of LateCretaceous and
Cenozoic climate
D. V. Kent and G. Muttoni
Title Page
Abstract Introduction
Conclusions References
Tables Figures
J I
J I
Back Close
Full Screen / Esc
Printer-friendly Version
Interactive Discussion
Discussion
Paper
|D
iscussionP
aper|
Discussion
Paper
|D
iscussionP
aper|
Kump, L. R. and Arthur, M. A.: Interpreting carbon-isotope excursions: carbonates and organicmatter, Chem. Geol., 161, 181–198, 1999.
Kump, L. R., Brantley, S. L., and Arthur, M. A.: Chemical weathering, atmospheric CO2, andclimate, Ann. Rev. Earth Planet. Sci., 28, 611–667, 2000.
Lippert, P. C., Zhao, X., Coe, R. S., and Lo, C.-H.: Palaeomagnetism and 40Ar/39Ar geochronol-5
ogy of upper Palaeogene volcanic rocks from Central Tibet: implications for the Central Asiainclination anomaly, the palaeolatitude of Tibet and post-50 Ma shortening within Asia, Geo-phys. J. Int., 184, 131–161, 2011.
Livermore, R., Hillenbrand, C. D., Meredith, M., and Eagles, G.: Drake Passage andCenozoic climate: an open and shut case?, Geochem. Geophy. Geosy., 8, Q01005,10
doi:10.1029/2005GC001224, 2007.Lowenstein, T. K., Timofeeff, M. N., Brennan, S. T., Hardie, L. A., and Demicco, R. V.: Os-
cillations in Phanerozoic seawater chemistry: evidence from fluid inclusions, Science, 294,1086–1088, 2001.
Lunt, D. J., Foster, G. L., Haywood, A. M., and Stone, E. J.: Late Pliocene Greenland glaciation15
controlled by a decline in atmospheric CO2 levels, Nature, 454, 1102–1105, 2008.Lyle, M., Barron, J., Bralower, T. J., Huber, M., Olivarez Lyle, A., Ravelo, A. C., Rea, D. K., and
Wilson, P. A.: Pacific Ocean and Cenozoic evolution of climate, Rev. Geophys., 46, RG2002,doi:10.1029/2005RG000190, 2008.
Manabe, S. and Bryan, K.: CO2-induced change in a coupled ocean-atmosphere model and its20
paleoclimatic implications, J. Geophys. Res., 90, 11689–11707, 1985.Marty, B. and Tolstikhin, I. N.: CO2 fluxes from mid-ocean ridges, arcs and plumes, Chem.
Geol., 145, 233–248, 1998.Marzoli, A., Renne, P. R., Piccirillo, E. M., Ernesto, M., Gellieni, G., and De Min, A.: Exten-
sive 200-million-year-old continental flood basalts of the Central Atlantic Magmatic Province,25
Science, 284, 616–618, 1999.McHone, J. G.: Volatile emissions from Central Atlantic Magmatic Province basalts: mass as-
sumptions and environmental consequences, in: The Central Atlantic Magnatic Province:Insights from Fragments of Pangea, edited by: Hames, W. E., McHone, J. G., Renne, P. R.,and Ruppel, C., Geophysical Monograph 136, American Geophysical Union, Washington,30
D.C., 241–254, 2003.Miller, K. G., Fairbanks, R. G., and Mountain, G. S.: Tertiary oxygen isotope synthesis, sea level
history, and continental margin erosion, Paleoceanography, 2, 1–19, 1987.
4548

CPD8, 4513–4564, 2012
Modulation of LateCretaceous and
Cenozoic climate
D. V. Kent and G. Muttoni
Title Page
Abstract Introduction
Conclusions References
Tables Figures
J I
J I
Back Close
Full Screen / Esc
Printer-friendly Version
Interactive Discussion
Discussion
Paper
|D
iscussionP
aper|
Discussion
Paper
|D
iscussionP
aper|
Miller, K. G., Kominz, M. A., Browning, J. V., Wright, J. D., Mountain, G. S., Katz, M. E., Sug-arman, P. J., Cramer, B. S., Christie-Blick, N., and Pekar, S. F.: The Phanerozoic record ofglobal sea-level change, Science, 310, 1293–1298, 2005a.
Miller, K. G., Wright, J. D., and Browning, J. V.: Visions of ice sheets in a greenhouse world,Mar. Geol., 217, 215–231, 2005b.5
Misumi, K., Yamanaka, Y., and Tajika, E.: Numerical simulation of atmospheric and oceanicbiogeochemical cycles to an episodic CO2 release event: Implications for the cause of mid-Cretaceous Ocean Anoxic Event-1a, Earth Planet. Sc. Lett., 286, 316–323, 2009.
Mitchell, N. C. and Lyle, M. W.: Patchy deposits of Cenozoic pelagic sediments in the CentralPacific, Geology, 33, 49–52, 2005.10
Mitchell, N. C., Lyle, M. W., Knappenberger, M. B., and Liberty, L. M.: Lower Miocene to Presentstratigraphy of the equatorial Pacific sediment bulge and carbonate dissolution anomalies,Paleoceanography, 18, 1038, doi:10.1029/2002PA000828, 2003.
Moghadam, H. S., Whitechurch, H., Rahgoshay, M., and Monsef, I.: Significance of Nain-Baftophiolitic belt (Iran): short-lived, transtensional Cretaceous back-arc oceanic basins over the15
Tethyan subduction zone, C. R. Geosci., 341, 1016–1028, 2009.Molnar, P. and Stock, J. M.: Slowing of India’s convergence with Eurasia since 20 Ma and its im-
plications for Tibetan mantle dynamics, Tectonics, 28, TC3001, doi:10.1029/2008TC002271,2009.
Molnar, P. and Tapponnier, P.: Cenozoic tectonics of Asia: effects of a continental collision,20
Science, 189, 419–426, 1975.Muller, R. D. and Roest, W. R.: Fracture zones in the North Atlantic from combined Geosat and
Seasat data, J. Geophys. Res., 97, 3337–3350, 1992.Muller, R. D., Royer, J. Y., and Lawver, L. A.: Revised plate motions relative to the hotspots from
combined Atlantic and Indian Ocean hotspot tracks, Geology, 21, 275–278, 1993.25
Muller, R. D., Sdrolias, M., Gaina, C., Steinberger, B., and Heine, C.: Long-term sea-level fluc-tuations driven by ocean basin dynamics, Science, 319, 1357–1362, 2008.
Muttoni, G. and Kent, D. V.: Widespread formation of cherts during the early Eocene climateoptimum, Palaeogeogr. Palaeocl., 253, 348–362, 2007.
Muttoni, G., Mattei, M., Balini, M., Zanchi, A., Gaetani, M., and Berra, F.: The drift history of Iran30
from the Ordovician to the Triassic, Geol. Soc. Spec. Publ., 312, 7–29, 2009.
4549

CPD8, 4513–4564, 2012
Modulation of LateCretaceous and
Cenozoic climate
D. V. Kent and G. Muttoni
Title Page
Abstract Introduction
Conclusions References
Tables Figures
J I
J I
Back Close
Full Screen / Esc
Printer-friendly Version
Interactive Discussion
Discussion
Paper
|D
iscussionP
aper|
Discussion
Paper
|D
iscussionP
aper|
Ogg, J. G., Karl, S. M., and Behl, R. J.: Jurassic through Early Cretaceous sedimentation his-tory of the Central Equatorial Pacific and of Sites 800 and 801, Proceedings Ocean DrillingProgram, Scientific Results, 129, 571–613, 1992.
Okay, A. I., Zattin, M., and Cavazza, W.: Apatite fission-track data for the Miocene Arabia-Eurasia collision, Geology, 38, 35–38, 2010.5
Pagani, M., Zachos, J. C., Freeman, K. H., Tipple, B., and Bohaty, S.: Marked decline in atmo-spheric carbon dioxide concentrations during the Paleogene, Science, 309, 600–603, 2005.
Pagani, M., Huber, M., Liu, Z., Bohaty, S. M., Henderiks, J., Sijp, W., Krishnan, S., and De-Conto, R. M.: The role of carbon dioxide during the onset of Antarctic glaciation, Science,334, 1261–1264, 2011.10
Patriat, P. and Achache, J.: India-Eurasia collision chronology has implications for crustal short-ening and driving mechanism of plates, Nature, 311, 615–621, 1984.
Pearson, P. N., Ditchfield, P. W., Singano, J., Harcourt-Brown, K. G., Nicholas, C. J., Ols-son, R. K., Shackleton, N. J., and Hall, M. A.: Warm tropical sea surface temperatures inthe Late Cretaceous and Eocene epochs, Nature, 413, 481–488, 2001.15
Pearson, P. N., vanDongen, B. E., Nicholas, C. J., Pancost, R. D., Schouten, S., Singano, J. M.,and Wade, B. S.: Stable warm tropical climate through the Eocene Epoch, Geology, 35,211–214, 2007.
Quade, J., Roe, L., DeCelles, P. G., and Ojha, T. P.: The Late Neogene 87Sr/86Sr record oflowland Himalayan rivers, Science, 276, 1828–1831, 1997.20
Rabinowitz, P. D., Coffin, M. F., and Falvey, D.: The separation of Madagascar and Africa, Sci-ence, 220, 67–69, 1983.
Ravelo, A. C.: Walker circulation and global warming: lessons from the geologic past, Oceanog-raphy, 19, 114–122, 2006.
Raymo, M. E.: The Himalayas, organic carbon burial, and climate in the Miocene, Paleoceanog-25
raphy, 9, 399–404, 1994.Raymo, M. E. and Ruddiman, W. F.: Tectonic forcing of late Cenozoic climate, Nature, 359,
117–122, 1992.Raymo, M. E., Ruddiman, W. F., and Froelich, P. N.: Influence of late Cenozoic mountain build-
ing on ocean geochemical cycles, Geology, 16, 649–653, 1988.30
Rea, D. K., Zachos, J. C., Owen, R. M., and Gingerich, P. D.: Global change at the Paleocene-Eocene boundary: climatic and evolutionary consequences of tectonic events, Palaeogeogr.Palaeocl., 79, 117–128, 1990.
4550

CPD8, 4513–4564, 2012
Modulation of LateCretaceous and
Cenozoic climate
D. V. Kent and G. Muttoni
Title Page
Abstract Introduction
Conclusions References
Tables Figures
J I
J I
Back Close
Full Screen / Esc
Printer-friendly Version
Interactive Discussion
Discussion
Paper
|D
iscussionP
aper|
Discussion
Paper
|D
iscussionP
aper|
Replumaz, A. and Tapponnier, P.: Reconstruction of the deformed collision zone betweenIndia and Asia by backward motion of lithospheric blocks, J. Geophys. Res., 108, 2285,doi:10.1029/2001JB000661, 2003.
Retallack, G. J.: Lateritization and bauxitization events, Econ. Geol., 105, 655–667, 2010.Richter, B., Schmidtke, E., Fuller, M., Harbury, N., and Samsudin, A. R.: Paleomagnetism of5
Peninsular Malaysia, J. Asian Earth Sci., 17, 477–519, 1999.Richter, F. M., Rowley, D. B., and DePaolo, D. J.: Sr isotope evolution of seawater: the role of
tectonics, Earth Planet. Sc. Lett., 109, 11–23, 1992.Rowley, D. B.: Rate of plate creation and destruction: 180 Ma to present, Geol. Soc. Am. Bull.,
114, 927–933, 2002.10
Rowley, D. B.: Extrapolating oceanic age distributions: lessons from the Pacific Region, J. Geol.,116, 587–598, 2008.
Royden, L. H., Burchfiel, B. C., and van der Hilst, R. D.: The geological evolution of the TibetanPlateau, Science, 321, 1054–1058, 2008.
Royer, D. L.: Fossil soils constrain ancient climate sensitivity, P. Natl. Acad. Sci. USA, 107,15
517–518, 2010.Sandberg, P. A.: An oscillating trend in Phanerozoic non-skeletal carbonate mineralogy, Nature,
305, 19–22, 1983.Saunders, A. D., Fitton, J. G., Kerr, A. C., Norry, M. J., and Kent, R. W.: The North Atlantic
Igneous Province, in: Large Igneous Provinces: Continental, Oceanic, and Planetary Flood20
Volcanism, edited by: Mahoney, J. J. and Coffin, M. F., Geophysical Monograph 100, Ameri-can Geophysical Union, Washington, D. C., 45–93, 1997.
Schaller, M. F., Wright, J. D., and Kent, D. V.: Atmospheric pCO2 perturbations associated withthe Central Atlantic Magmatic Province, Science, 331, 1404–1409, 2011.
Schaller, M. F., Wright, J. D., Kent, D. V., and Olsen, P. E.: Rapid emplacement of the Central25
Atlantic Magmatic Province as a net sink for CO2, Earth Planet. Sc. Lett., 323–324, 27–39,2012.
Schmidtke, E., Fuller, M., and Haston, R.: Paleomagnetic data from Sarawak, Malaysian Borneoand the Late Mesozoic and Cenozoic tectonics of Sundaland, Tectonics, 9, 123–140, 1990.
Schrag, D. P.: Control of atmospheric CO2 and climate through Earth history, Geochim. Cos-30
mochim. Acta, 66, A688, 2002.Schrag, D. P., Berner, R. A., Hoffman, P. F., and Halverson, G. P.: On the initiation of a snowball
Earth, Geochem. Geophy. Geosy., 3, 1036, doi:10.1029/2001GC000219, 2002.
4551

CPD8, 4513–4564, 2012
Modulation of LateCretaceous and
Cenozoic climate
D. V. Kent and G. Muttoni
Title Page
Abstract Introduction
Conclusions References
Tables Figures
J I
J I
Back Close
Full Screen / Esc
Printer-friendly Version
Interactive Discussion
Discussion
Paper
|D
iscussionP
aper|
Discussion
Paper
|D
iscussionP
aper|
Self, S., Thordarson, T., and Widdowson, M.: Gas fluxes from flood basalt eruptions, Elements,1, 283–287, 2005.
Selverstone, J. and Gutzler, D. S.: Post-125 Ma carbon storage associated with continent-continent collision, Geology, 21, 885–888, 1993.
Seton, M., Gaina, C., Muller, R. D., and Heine, C.: Mid-Cretaceous seafloor spreading pulse:5
fact or fiction?, Geology, 37, 687–690, 2009.Shackleton, N. J.: The carbon isotope record of the Cenozoic: history of organic carbon burial
and of oxygen in the ocean and atmosphere, Geol. Soc. Spec. Publ., 26, 423–434, 1987.Shackleton, N. J. and Hall, M. A.: Stable isotope records in bulk sediments (Leg 138), Proceed-
ings Ocean Drilling Program, Sci. Res., 138, 797–805, 1995.10
Smith, A. G. and Hallam, A.: The fit of the southern continents, Nature, 225, 139–144, 1970.Smith, M. E., Carroll, A. R., and Mueller, E. R.: Elevated weathering rates in the Rocky Moun-
tains during the Early Eocene Climatic Optimum, Nat. Geosci., 1, 370–374, 2008.Srivastava, S. P. and Tapscott, C. R.: Plate kinematics of the North Atlantic, in: The Geology
of North America, The Western North Atlantic Region, M, Geological Society of America,15
Boulder, 379–404, 1986.Stanley, S. M. and Hardie, L. A.: Secular oscillations in the carbonate mineralogy of reef-building
and sediment-producing organisms driven by tectonically forced shifts in seawater chemistry,Palaeogeogr. Palaeocl., 144, 3–19, 1998.
Staudigel, H., Hart, S. R., Schmincke, H.-U., and Smith, B. M.: Cretaceous ocean crust at DSDP20
Sites 417 and 418: carbon uptake from weathering versus loss by magmatic outgassing,Geochim. Cosmochim. Acta, 53, 3091–3094, 1989.
Staudigel, H., Hart, S. R., Schmincke, H.-U., and Smith, B. M.: Reply to “Global CO2 degassingand the carbon cycle”: a comment by Berner, R. A., Geochim. Cosmochim. Acta, 54, 2891,1990a.25
Staudigel, H., Hart, S. R., Schmincke, H.-U., and Smith, B. M.: Reply to R. A. Berner’s response,Geochim. Cosmochim. Acta, 54, 2893, 1990b.
Stickley, C. E., Brinkhuis, H., Shellenberg, S. A., Sluijs, A., Rohl, U., Fuller, M., Grauert, M.,Huber, M., Warnaar, J., and Williams, G. L.: Timing and nature of the deepening of theTasmanian Gateway, Paleoceanography, 19, PA4027, doi:10.1029/2004PA001022, 2004.30
Tejada, M. L. G., Suzuki, K., Kuroda, J., Coccioni, R., Mahoney, J. J., Ohkouchi, N.,Sakamoto, T., and Tatsumi, Y.: Ontong Java Plateau eruption as a trigger for the early Aptianoceanic anoxic event, Geology, 37, 855–858, 2009.
4552

CPD8, 4513–4564, 2012
Modulation of LateCretaceous and
Cenozoic climate
D. V. Kent and G. Muttoni
Title Page
Abstract Introduction
Conclusions References
Tables Figures
J I
J I
Back Close
Full Screen / Esc
Printer-friendly Version
Interactive Discussion
Discussion
Paper
|D
iscussionP
aper|
Discussion
Paper
|D
iscussionP
aper|
Tera, F., Brown, L., Morris, J., Sacks, I. S., Klein, J., and Middleton, R.: Sediment incorporationin island-arc magmas: inferences from 10Be, Geochim. Cosmochim. Acta, 50, 535–550,1986.
Thomas, D. J. and Bralower, T. J.: Sedimentary trace element constraints on the role of NorthAtlantic Igneous Province volcanism in late Paleocene-early Eocene environmental change,5
Mar. Geol., 217, 233–254, 2005.Volk, T.: Sensitivity of climate and atmospheric CO2 to deep-ocean and shallow-ocean carbon-
ate burial, Nature, 337, 637–640, 1989.Walker, J. C. G., Hays, P. B., and Kasting, J. F.: A negative feedback mechanism for the long-
term stabilization of Earth’s surface-temperature, J. Geophys. Res.-Atmos., 86, 9776–9782,10
1981.West, A. J., Galy, A., and Bickle, M.: Tectonic and climatic controls on silicate weathering, Earth
Planet. Sc. Lett., 235, 211–228, 2005.Wilkinson, B. H. and Walker, J. C. G.: Phanerozoic cycling of sedimentary carbonate, Am. J.
Sci., 289, 525–548, 1989.15
Wilson, P. A., Norris, R. D., and Cooper, M. J.: Testing the Cretaceous greenhouse hypothesisusing glassy foraminiferal calcite from the core of the Turonian tropics on Demerara Rise,Geology, 30, 607–610, 2002.
Wright, J. D., Miller, K. G., and Fairbanks, R. G.: Early and Middle Miocene stable isotopes:implications for deepwater circulation and climate, Paleoceanography, 7, 357–389, 1992.20
Yang, Z. and Besse, J.: Paleomagnetic study of Permian and Mesozoic sedimentary rocks fromNorthern Thailand supports the extrusion model for Indochina, Earth Planet. Sc. Lett., 117,525–552, 1993.
Yang, Z., Yin, J., Sun, Z., Otofuji, Y.-I., and Sato, K.: Discrepant Cretaceous paleomagneticpoles between Eastern China and Indochina: a consequence of the extrusion of Indochina,25
Tectonophysics, 334, 101–113, 2001.Yin, A. and Harrison, T. M.: Geologic evolution of the Himalayan-Tibetan Orogen, Ann. Rev.
Earth Planet. Sci., 28, 211–280, 2000.You, Y., Huber, M., Muller, R. D., Poulsen, C. J., and Ribbe, J.: Simulation of the Middle Miocene
Climate Optimum, Geophys. Res. Lett., 36, L04702, doi:10.1029/2008GL036571, 2009.30
Zachos, J., Pagani, M. N., Sloan, L., Thomas, E., and Billups, K.: Trends, rhythms, and aberra-tions in global climate 65 Ma to Present, Science, 292, 686–693, 2001.
4553

CPD8, 4513–4564, 2012
Modulation of LateCretaceous and
Cenozoic climate
D. V. Kent and G. Muttoni
Title Page
Abstract Introduction
Conclusions References
Tables Figures
J I
J I
Back Close
Full Screen / Esc
Printer-friendly Version
Interactive Discussion
Discussion
Paper
|D
iscussionP
aper|
Discussion
Paper
|D
iscussionP
aper|
Zanchi, A., Zanchetta, S., Garzanti, E., Balini, M., Berra, F., Mattei, M., and Muttoni, G.: TheCimmerian evolution of the Nakhlak–Anarak area, Central Iran, and its bearing for the re-construction of the history of the Eurasian margin, Geol. Soc. Spec. Publ., 312, 261–286,2009.
Zhu, B., Kidd, W. S. F., Rowley, D. B., Currie, B. S., and Shafique, N.: Age of initiation of the5
India-Asia collision in the East-Central Himalaya, J. Geol., 113, 265–285, 2005.
4554
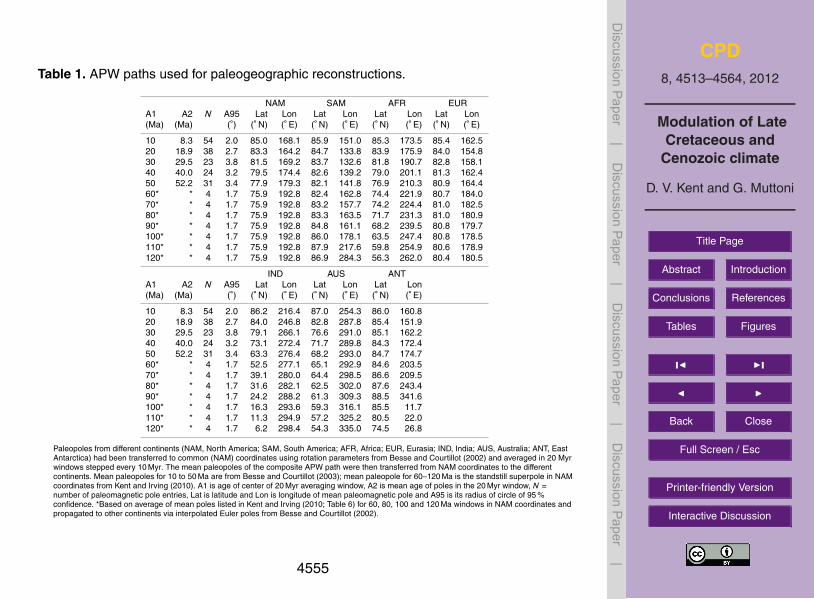
CPD8, 4513–4564, 2012
Modulation of LateCretaceous and
Cenozoic climate
D. V. Kent and G. Muttoni
Title Page
Abstract Introduction
Conclusions References
Tables Figures
J I
J I
Back Close
Full Screen / Esc
Printer-friendly Version
Interactive Discussion
Discussion
Paper
|D
iscussionP
aper|
Discussion
Paper
|D
iscussionP
aper|
Table 1. APW paths used for paleogeographic reconstructions.
NAM SAM AFR EURA1 A2 N A95 Lat Lon Lat Lon Lat Lon Lat Lon(Ma) (Ma) () ( N) ( E) ( N) ( E) ( N) ( E) ( N) ( E)
10 8.3 54 2.0 85.0 168.1 85.9 151.0 85.3 173.5 85.4 162.520 18.9 38 2.7 83.3 164.2 84.7 133.8 83.9 175.9 84.0 154.830 29.5 23 3.8 81.5 169.2 83.7 132.6 81.8 190.7 82.8 158.140 40.0 24 3.2 79.5 174.4 82.6 139.2 79.0 201.1 81.3 162.450 52.2 31 3.4 77.9 179.3 82.1 141.8 76.9 210.3 80.9 164.460* * 4 1.7 75.9 192.8 82.4 162.8 74.4 221.9 80.7 184.070* * 4 1.7 75.9 192.8 83.2 157.7 74.2 224.4 81.0 182.580* * 4 1.7 75.9 192.8 83.3 163.5 71.7 231.3 81.0 180.990* * 4 1.7 75.9 192.8 84.8 161.1 68.2 239.5 80.8 179.7100* * 4 1.7 75.9 192.8 86.0 178.1 63.5 247.4 80.8 178.5110* * 4 1.7 75.9 192.8 87.9 217.6 59.8 254.9 80.6 178.9120* * 4 1.7 75.9 192.8 86.9 284.3 56.3 262.0 80.4 180.5
IND AUS ANTA1 A2 N A95 Lat Lon Lat Lon Lat Lon(Ma) (Ma) () ( N) ( E) ( N) ( E) ( N) ( E)
10 8.3 54 2.0 86.2 216.4 87.0 254.3 86.0 160.820 18.9 38 2.7 84.0 246.8 82.8 287.8 85.4 151.930 29.5 23 3.8 79.1 266.1 76.6 291.0 85.1 162.240 40.0 24 3.2 73.1 272.4 71.7 289.8 84.3 172.450 52.2 31 3.4 63.3 276.4 68.2 293.0 84.7 174.760* * 4 1.7 52.5 277.1 65.1 292.9 84.6 203.570* * 4 1.7 39.1 280.0 64.4 298.5 86.6 209.580* * 4 1.7 31.6 282.1 62.5 302.0 87.6 243.490* * 4 1.7 24.2 288.2 61.3 309.3 88.5 341.6100* * 4 1.7 16.3 293.6 59.3 316.1 85.5 11.7110* * 4 1.7 11.3 294.9 57.2 325.2 80.5 22.0120* * 4 1.7 6.2 298.4 54.3 335.0 74.5 26.8
Paleopoles from different continents (NAM, North America; SAM, South America; AFR, Africa; EUR, Eurasia; IND, India; AUS, Australia; ANT, EastAntarctica) had been transferred to common (NAM) coordinates using rotation parameters from Besse and Courtillot (2002) and averaged in 20 Myrwindows stepped every 10 Myr. The mean paleopoles of the composite APW path were then transferred from NAM coordinates to the differentcontinents. Mean paleopoles for 10 to 50 Ma are from Besse and Courtillot (2003); mean paleopole for 60–120 Ma is the standstill superpole in NAMcoordinates from Kent and Irving (2010). A1 is age of center of 20 Myr averaging window, A2 is mean age of poles in the 20 Myr window, N =number of paleomagnetic pole entries, Lat is latitude and Lon is longitude of mean paleomagnetic pole and A95 is its radius of circle of 95 %confidence. *Based on average of mean poles listed in Kent and Irving (2010; Table 6) for 60, 80, 100 and 120 Ma windows in NAM coordinates andpropagated to other continents via interpolated Euler poles from Besse and Courtillot (2002).
4555

CPD8, 4513–4564, 2012
Modulation of LateCretaceous and
Cenozoic climate
D. V. Kent and G. Muttoni
Title Page
Abstract Introduction
Conclusions References
Tables Figures
J I
J I
Back Close
Full Screen / Esc
Printer-friendly Version
Interactive Discussion
Discussion
Paper
|D
iscussionP
aper|
Discussion
Paper
|D
iscussionP
aper|
Table 2. Total rotation poles for the SE Asian blocks.
Age W. Sumatra N. Indochina S. Indochina- C. Indochina-E. Sumatra-Java Borneo
Ma Lat Lon Ω Lat Lon Ω Lat Lon Ω Lat Lon Ω
0 0.0 0.0 0.0 0.0 0.0 0.0 0.0 0.0 0.0 0.0 0.0 0.05 13.7 94.5 5.2 11.5 90.7 5.3 11.5 90.7 5.3 11.5 90.7 5.310 11.4 96.2 9.2 9.4 92.0 9.2 9.4 92.0 9.2 9.4 92.0 9.215 14.1 102.2 9.7 7.5 91.5 9.7 7.5 91.5 9.7 7.5 91.5 9.730 10.6 90.8 21.9 7.2 86.6 22.2 7.2 86.6 22.2 7.2 86.6 22.240 4.6 93.3 28.8 5.9 88.6 28.5 1.9 90.2 29.1 4.1 90.4 33.150 4.5 93.6 29.3 5.8 89.0 29.0 1.8 90.6 29.6 4.0 90.7 33.660 3.4 99.3 30.2 4.6 95.0 29.6 0.7 96.4 30.2 2.8 95.8 34.370 3.5 99.0 29.9 4.7 94.5 29.3 0.8 96.0 30.0 2.9 95.4 34.080 3.6 98.5 29.8 4.8 94.1 29.3 0.9 95.5 30.0 3.0 95.0 34.090 3.6 98.1 30.0 4.9 93.7 29.5 1.0 95.1 30.2 3.1 94.7 34.2100 3.7 97.7 30.0 4.9 93.3 29.5 1.0 94.7 30.1 3.1 94.3 34.2110 3.7 97.8 30.2 4.9 93.4 29.7 1.0 94.8 30.4 3.1 94.4 34.3120 3.6 98.2 30.4 4.8 93.8 29.9 0.9 95.3 30.6 3.0 94.8 34.6
Rotation poles (Lat = latitude N, Lon = longitude E, Ω = rotation angle, positive counterclockwise) obtained bymultiplying the paleomagnetic Euler poles of Eurasia (derived from Table 1) with the step-by-step Euler poles of theSE Asian blocks relative to Siberia (Eurasia) accumulated in the 0–40 Ma time window (derived from Replumaz andTapponnier, 2003). For the previous 50–120 Ma interval, the SE Asia blocks are considered tectonically coherent andmoved with Siberia (Eurasia). N = North, S = South, E = East, W = West, C = Central.
4556

CPD8, 4513–4564, 2012
Modulation of LateCretaceous and
Cenozoic climate
D. V. Kent and G. Muttoni
Title Page
Abstract Introduction
Conclusions References
Tables Figures
J I
J I
Back Close
Full Screen / Esc
Printer-friendly Version
Interactive Discussion
Discussion
Paper
|D
iscussionP
aper|
Discussion
Paper
|D
iscussionP
aper|
020406080100120
A)
B)
C)
(Ma)
12r
20r
24r
26r
1n34n
M0
PALEO MIOCENEOLIGOEARLY CRET.LME
EOCENELATE CRETACEOUS PLI-PLE
GPTS
Epoch
CTM
0
4
8
12
16
20
Botto
m w
ater
tem
pera
ture
(°C)
EECO
AA
NH
Sea
Leve
ltren
d(m
)
-120
0
-80
-40
40
StomataPhytoplanktonPaleosolsLiverwortsBoronB/CaNahcolite/Trona
500
1000
1500
2000
2500
pCO 2
(pp
m)
0
Figure 1
MMCO
Fig. 1. Bottom water temperatures (A) and reconstructed sea levels (B) since the Early Creta-ceous (Cramer et al., 2011) smoothed to emphasize variations on > 5 Myr timescales. CTM isCretaceous thermal maximum, EECO is Early Eocene climatic optimum, and MMCO is MiddleMiocene climatic optimum; AA is sea-level drop at the inception of Antarctic ice sheets, and NHis sea-level drop at the inception of Northern Hemisphere ice sheets. (C) Atmospheric pCO2estimates from various proxies from compilation of Royer (2010) for pre-70 Ma interval (exceptpaleosol estimates, which are highly scattered and have not been plotted) and of Beerling andRoyer (2011) for post-70 Ma interval. Simple smoothing functions have been fit (heavy curvedline) through the mean pCO2 estimates provided in the compilations. Ages according to GPTS(geomagnetic polarity time scale) of Cande and Kent (1995). Geologic epochs are Early Creta-ceous, Late Cretaceous, Paleocene, Eocene (E for Early, M for Middle, L for Late), Oligocene,Miocene, and Pliocene and Pleistocene.
4557
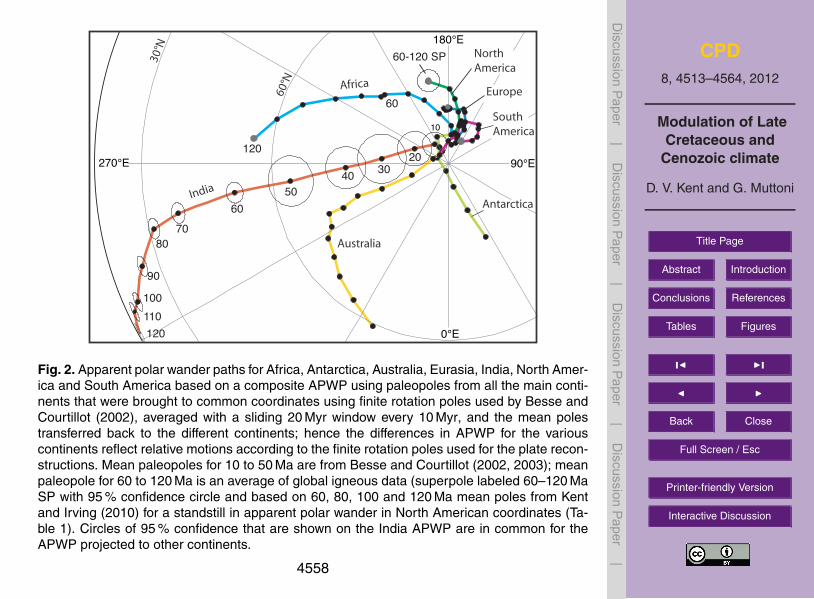
CPD8, 4513–4564, 2012
Modulation of LateCretaceous and
Cenozoic climate
D. V. Kent and G. Muttoni
Title Page
Abstract Introduction
Conclusions References
Tables Figures
J I
J I
Back Close
Full Screen / Esc
Printer-friendly Version
Interactive Discussion
Discussion
Paper
|D
iscussionP
aper|
Discussion
Paper
|D
iscussionP
aper|
180°E
0°E
270°E 20
50
3040
6070
80
90
100110120
10
60-120 SP
120
60
aidnI
acirfA
NorthAmerica
Europe
South America
N°03
N°06
90°E
Australia
Antarctica
Figure 2
Fig. 2. Apparent polar wander paths for Africa, Antarctica, Australia, Eurasia, India, North Amer-ica and South America based on a composite APWP using paleopoles from all the main conti-nents that were brought to common coordinates using finite rotation poles used by Besse andCourtillot (2002), averaged with a sliding 20 Myr window every 10 Myr, and the mean polestransferred back to the different continents; hence the differences in APWP for the variouscontinents reflect relative motions according to the finite rotation poles used for the plate recon-structions. Mean paleopoles for 10 to 50 Ma are from Besse and Courtillot (2002, 2003); meanpaleopole for 60 to 120 Ma is an average of global igneous data (superpole labeled 60–120 MaSP with 95 % confidence circle and based on 60, 80, 100 and 120 Ma mean poles from Kentand Irving (2010) for a standstill in apparent polar wander in North American coordinates (Ta-ble 1). Circles of 95 % confidence that are shown on the India APWP are in common for theAPWP projected to other continents.
4558

CPD8, 4513–4564, 2012
Modulation of LateCretaceous and
Cenozoic climate
D. V. Kent and G. Muttoni
Title Page
Abstract Introduction
Conclusions References
Tables Figures
J I
J I
Back Close
Full Screen / Esc
Printer-friendly Version
Interactive Discussion
Discussion
Paper
|D
iscussionP
aper|
Discussion
Paper
|D
iscussionP
aper|
OntongJava Manihiki
120 Ma
65 Ma
50 Ma
Figure 3a-cFigure 3d-f
30 Ma
15 Ma
0 Ma
Fig. 3. Paleogeographic reconstructions based on a composite APWP (Table 1, Fig. 2), the finite rotation poles givenby Besse and Courtillot (2002) from Muller and Roest (1992), Muller et al. (1993), and Srivastava and Tapscott (1986)for the major continents and the rotation poles of Replumaz and Tapponnier (2003) for SE Asia blocks, as discussedin text. (A) 120 Ma at about Magnetic Anomaly M0; (B) 65 Ma at about Anomaly 29; (C) 50 Ma at about Anomaly21; (D) 30 Ma at about Anomaly 11; (E) 15 Ma at about Anomaly 5 B; (F) present-day geography. The equatorialhumid belt (P > E : precipitation > evaporation) between 5 S and 5 N is represented by darker green shading, thetemperate humid belts (P > E ) from 30 to beyond the latitudinal limits (60) of our paleogeographic reconstructionsare represented by lighter green shading, with the intervening arid belts (P < E ) unshaded, all based on generalcirculation climate model with idealized geography by Manabe and Bryan (1985). Large continental basaltic provincesare shown in red, large submarine provinces in orange. Paleogeographic maps were made with PaleoMac software(Cogne, 2003).
4559

CPD8, 4513–4564, 2012
Modulation of LateCretaceous and
Cenozoic climate
D. V. Kent and G. Muttoni
Title Page
Abstract Introduction
Conclusions References
Tables Figures
J I
J I
Back Close
Full Screen / Esc
Printer-friendly Version
Interactive Discussion
Discussion
Paper
|D
iscussionP
aper|
Discussion
Paper
|D
iscussionP
aper|
-10
-5
0
5
10
15
20
25
2030405060708090100110120-40
-30
-20
-10
0
10
20
5060708090100110120
Pale
olat
itude
(°)
0
5
10
15
20
0.0
0.1
0.2
0.3
0.4
0.5
0
2
4
6
8
10
0.00
0.08
0.12
0
10
20
30
40
50
60
0
10
20
30
40
50
60
0
100
200
0
1
2
3
4
0
10
20
30
40
0.0
0.2
0.4
0.6
Subd
ucte
dcr
u st(
Mk m
2 )Lo
adin
gt im
e( M
y r)
Su bdu cti onr at e
( Mk m
2/Myr )
Subd
ucte
dse
dim
ent s
(Tto
n/M
y r)
IndiaLhasa
B)
C)
D)
A)
F)
G)
H)
E)
CO2
emitted*
( %o f
260Tto n/M
yr)
*assuming 100% carbonates and 10% sediment recycling.*assuming 100% carbonates and 10% sediment recycling.
Figure 4
Age (Ma) Age (Ma)
India-Lhasa Arabia-Iran
IndiaLhasa
Fig. 4. Caption on next page.
4560

CPD8, 4513–4564, 2012
Modulation of LateCretaceous and
Cenozoic climate
D. V. Kent and G. Muttoni
Title Page
Abstract Introduction
Conclusions References
Tables Figures
J I
J I
Back Close
Full Screen / Esc
Printer-friendly Version
Interactive Discussion
Discussion
Paper
|D
iscussionP
aper|
Discussion
Paper
|D
iscussionP
aper|
Fig. 4. Estimates of decarbonation in Tethyan subduction factory. Panels (A)–(D) refer to thesubduction of Tethyan crust between Greater India and Lhasa (Asia). (A) Paleolatitude curvesfor Northern Greater India (filled star in Fig. 3a) and Southern Lhasa block (unfilled star inFig. 3a) with 2nd order polynomial fits used to calculate the subduction time and the loadingtime of oceanic crust during passage through hypothesized equatorial upwelling belt (5 S–5 N). (B) Sediment loading time for passage through equatorial upwelling belt (5 S–5 N) ofoceanic crust subducted under Asia. Curve starts at 97 Ma with a nominal 20 Myr loading timebecause the oceanic crust was sitting in the equatorial belt since appearance of pelagic car-bonates and well before onset of subduction. (C) Amount of Tethyan crust as function of timebetween northern Greater India and southern Lhasa block that was eventually subducted un-der Asia plotted with a 2nd order polynomial fit resampled every 1 Myr (blue line) and red curveshowing subduction rate (scale on right) as 1st derivative of the polynomial subduction curve.(D) Amount of equatorial bulge sediments on Tethyan crust subducted under Asia per Myr asa function of time. The axis on the right is the CO2 emitted by these sediments expressed aspercentage of modern outgassing rate of 260 TtonMyr−1, assuming the sediments were 100 %carbonates and 10 % recycled. Panels (E)–(H) refer to the subduction of Tethyan crust betweenArabia and Iran (Asia) following the same procedure illustrated for India-Lhasa in panels (A)–(D), with the only notable differences that the time scale extends to 20 Ma and the paleolatitudecurves (in E) are for the southeastern margin of Arabia (filled circle in Fig. 3a) and the westernmargin of the Iran block (unfilled circle in Fig. 3a).
4561

CPD8, 4513–4564, 2012
Modulation of LateCretaceous and
Cenozoic climate
D. V. Kent and G. Muttoni
Title Page
Abstract Introduction
Conclusions References
Tables Figures
J I
J I
Back Close
Full Screen / Esc
Printer-friendly Version
Interactive Discussion
Discussion
Paper
|D
iscussionP
aper|
Discussion
Paper
|D
iscussionP
aper|
Cru s
t5°
S -5°
N( M
km2 )
0
2
4
6
8
10
12
14
16
S AMERICAAFRICA+ARABIAINDIASE ASIA+N GUINEAALL CRUST
A)
Basaltic + Mixed blocks
Basaltic blocks (Deccan & Ethiopian traps,Andes, Java+Sumatra arc)Mixed blocks (S. Indochina, Borneo, N. Guinea)
?
Figure 5
B)
0
1
2
Crus
t5°
S-5°
N( M
km2 )
020406080100120
Age (Ma)
Fig. 5. (A) Estimates of land area within equatorial humid belt (5 S–5 N) as a function oftime since 120 Ma obtained by applying the composite APWP (Table 1; Fig. 2) and finite ro-tation poles of Besse and Courtillot (2002) for major continental blocks and the rotation polesof Replumaz and Tapponnier (2003) for SE Asia blocks as discussed in text. (B) Estimatesof key (most weatherable in the most favorable environment) land areas comprised of vol-canic arc provinces (Java, Sumatra, Andes), large basaltic provinces (Deccan Traps, EthiopianTraps), and mixed igneous-metamorphic provinces (South Indochina, Borneo, New Guinea) inthe equatorial humid belt (5 S–5 N) as a function of time from 120 Ma to Present. The rest ofthe world’s continental regions in the equatorial humid belt are generally characterized by lowelevation (Amazon and Congo Basins), hence weathering tends to be low and transport-limited.
4562
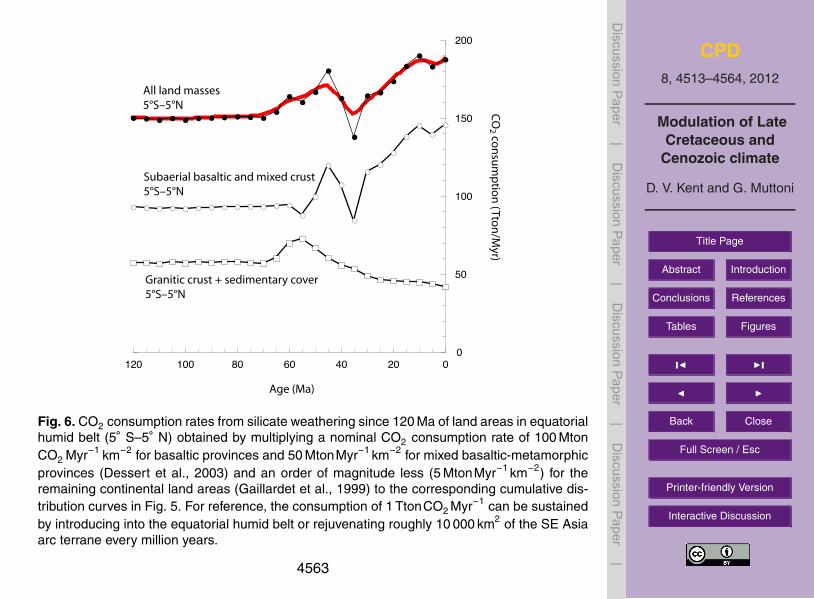
CPD8, 4513–4564, 2012
Modulation of LateCretaceous and
Cenozoic climate
D. V. Kent and G. Muttoni
Title Page
Abstract Introduction
Conclusions References
Tables Figures
J I
J I
Back Close
Full Screen / Esc
Printer-friendly Version
Interactive Discussion
Discussion
Paper
|D
iscussionP
aper|
Discussion
Paper
|D
iscussionP
aper|
All land masses5°S–5°N
Subaerial basaltic and mixed crust5°S–5°N
Granitic crust + sedimentary cover5°S–5°N
0
50
100
150
200
020406080100120
CO
2 con
sum
ptio
n (Tto
n/M
yr)
Age (Ma)
Figure 6
Fig. 6. CO2 consumption rates from silicate weathering since 120 Ma of land areas in equatorialhumid belt (5 S–5 N) obtained by multiplying a nominal CO2 consumption rate of 100 MtonCO2 Myr−1 km−2 for basaltic provinces and 50 MtonMyr−1 km−2 for mixed basaltic-metamorphicprovinces (Dessert et al., 2003) and an order of magnitude less (5 MtonMyr−1 km−2) for theremaining continental land areas (Gaillardet et al., 1999) to the corresponding cumulative dis-tribution curves in Fig. 5. For reference, the consumption of 1 TtonCO2 Myr−1 can be sustainedby introducing into the equatorial humid belt or rejuvenating roughly 10 000 km2 of the SE Asiaarc terrane every million years.
4563

CPD8, 4513–4564, 2012
Modulation of LateCretaceous and
Cenozoic climate
D. V. Kent and G. Muttoni
Title Page
Abstract Introduction
Conclusions References
Tables Figures
J I
J I
Back Close
Full Screen / Esc
Printer-friendly Version
Interactive Discussion
Discussion
Paper
|D
iscussionP
aper|
Discussion
Paper
|D
iscussionP
aper|
1 2r
20r
24r
26r
1n34n
M0
PALEO MIOCENEOLIGOEARLY CRET.LME
EOCENELATE CRETACEOUS PLI-PLE
GPTS
Epoch
Mg-Caseas
?
calcitearagonite
55
60
65
70
75
020406080100120
Age(Ma)
13C
car
bona
te (‰
)
1
2
3
0
A)
CTM
0
4
8
12
16
20
Botto
m w
ater
tem
pera
ture
(°C)
EECO
MMCO
B)
C)
D)
Figure 7
BF
Bulk
Perc
ent o
f con
stant
CO 2
out
gass
ing
Fig. 7. (A) Bottom water temperatures (Cramer et al., 2011; see caption to Fig. 1 for explanation); (B) δ13C carbonatedata from whole sediment (Bulk) (smoothed SSA curve from Katz et al., 2005) and (C) δ13C carbonate data frombenthic foraminifera (BF) from the Pacific (smoothed trend from Cramer et al., 2009), with mean values over selectedintervals (77–65 Ma, 50–35 Ma, 33–18 Ma) shown by gray bars; (D) secular change in CO2 consumption rate fromsilicate weathering of all land masses in equatorial humid belt (5 S–5 N) (smoothed curve from Fig. 6) expressed aspercentage of modern volcanic outgassing rate of 260 TtonMyr−1 (Gerlach, 2011; Marty and Tolstikhin, 1998). Agesbased on GPTS of Cande and Kent (1995). Below age axis is diagrammatic representation of oscillation betweenMg-poor calcite seas and Mg-rich aragonite seas (Sandberg, 1983).
4564