mofmos lab.pdf
TRANSCRIPT
7232019 MOFMOS LABpdf
httpslidepdfcomreaderfullmofmos-labpdf 147
983117983109983107983112983105983118983113983107983123 983119983110 983110983116983125983113983108983123 amp
983117983109983107983112983105983118983113983107983123 983119983110 983123983119983116983113983108983123
983116983105983106983119983122983105983124983119983122983129 983117983105983118983125983105983116
983106983124983109983107983112
(983113983113 983129983109983105983122 991251 983113 983123983109983117)(201598308516)
983120983154983141983152983137983154983141983140 983138983161983098
983117983155 983117983118983126983123983123983127983109983124983112983105 983106983105983116983105 983105983155983155983151983139983145983137983156983141 983120983154983151983142983141983155983155983151983154
983117983155983116983123983125983123983112983117983105
983105983155983155983145983155983156983137983150983156 983120983154983151983142983141983155983155983151983154
983108983141983152983137983154983156983149983141983150983156 983151983142 983105983141983154983151983150983137983157983156983145983139983137983148 983109983150983143983145983150983141983141983154983145983150983143
983117983105983116983116983105 983122983109983108983108983129 983107983119983116983116983109983111983109983119983110 983109983118983111983113983118983109983109983122983113983118983111 amp 983124983109983107983112983118983119983116983119983111983129
(983105983157983156983151983150983151983149983151983157983155 983113983150983155983156983145983156983157983156983145983151983150 991251 983125983111983107 983111983151983158983156 983151983142 983113983150983140983145983137)983122983141983139983151983143983150983145983162983141983140 983157983150983140983141983154 2(983142) 983137983150983140 12 (983106) 983151983142 983125983111983107 983105983107983124 1956
983105983142983142983145983148983145983137983156983141983140 983156983151 983114983118983124983125983112 983112983161983140983141983154983137983138983137983140 983105983152983152983154983151983158983141983140 983138983161 983105983113983107983124983109 983085 983105983139983139983154983141983140983145983156983141983140 983138983161 983118983106983105 amp 983118983105983105983107 991251 991256983105991257 983111983154983137983140983141 983085 983113983123983119 90012008 983107983141983154983156983145983142983145983141983140)
983117983137983145983155983137983149983149983137983143983157983140983137 983108983144983157983148983137983152983137983148983148983161 (983120983151983155983156 983126983145983137 983112983137983147983145983149983152983141983156) 983123983141983139983157983150983140983141983154983137983138983137983140 991251 500100 983124983141983148983137983150983143983137983150983137 983123983156983137983156983141 983113983150983140983145983137
7232019 MOFMOS LABpdf
httpslidepdfcomreaderfullmofmos-labpdf 247
Department of ANE MOFMOS LAB MANUAL
1
CONTENTS
SNO Name of the Experiment
Page No
MECHANICS OF FLUIDS LAB
1 CALIBRATAION OF VENTURIMETER 2 5
2 6 9
CALIBRATION OF ORIFICEMETER
3 10 14
TO CALCULATE FRICTION FACTOR FOR A GIVEN PIPE LINE
4 16 18
BERNOULLI`S EXPERIMENT
5 19 20
CALIBRATION OF A TRIANGULAR NOTCH
MECHANICS OF SOLIDS LAB
6 IZOD IMPACT TEST 21 23
7 ROCK WELLS HARADNESS 24 27
8 BRINELL`S HARDNESS 28 30
9 SPRING TEST 31 33
TORSION TEST 34 39
10
TENSILE TEST 40 45
11
7232019 MOFMOS LABpdf
httpslidepdfcomreaderfullmofmos-labpdf 347
Department of ANE MOFMOS LAB MANUAL
2
983120983122983119983111983122983105983117983117983109 983109983108983125983107983105983124983113983119983118983105983116 983119983106983114983109983107983124983113983126983109983123
983120983109983119983089983098 983120983122983119983110983109983123983123983113983119983118983105983116983113983123983117 983078 983107983113983124983113983130983109983118983123983112983113983120983124983151 983139983154983141983137983156983141 983137983150983140 983155983157983155983156983137983145983150 983137 983139983151983149983149983157983150983145983156983161 983151983142 983148983141983137983154983150983145983150983143 983145983150 983159983144983145983139983144 983155983156983157983140983141983150983156983155
983137983139983153983157983145983154983141 983147983150983151983159983148983141983140983143983141 983137983150983140 983148983141983137983154983150 983156983151 983137983152983152983148983161 983145983156 983152983154983151983142983141983155983155983145983151983150983137983148983148983161 983159983145983156983144 983140983157983141
983139983151983150983155983145983140983141983154983137983156983145983151983150 983142983151983154 983141983156983144983145983139983137983148 983141983139983151983148983151983143983145983139983137983148 983137983150983140 983141983139983151983150983151983149983145983139 983145983155983155983157983141983155
983120983109983119983090983098 983124983109983107983112983118983113983107983105983116 983105983107983107983119983117983120983116983113983123983112983117983109983118983124983123
983124983151 983152983154983151983158983145983140983141 983147983150983151983159983148983141983140983143983141 983138983137983155983141983140 983155983141983154983158983145983139983141983155 983156983151 983155983137983156983145983155983142983161 983156983144983141 983150983141983141983140983155 983151983142 983155983151983139983145983141983156983161 983137983150983140
983156983144983141 983145983150983140983157983155983156983154983161 983138983161 983152983154983151983158983145983140983145983150983143 983144983137983150983140983155 983151983150 983141983160983152983141983154983145983141983150983139983141 983145983150 983158983137983154983145983151983157983155 983156983141983139983144983150983151983148983151983143983145983141983155
983145983150 983139983151983154983141 983142983145983141983148983140983120983109983119983091983098 983113983118983126983109983118983124983113983119983118983084 983113983118983118983119983126983105983124983113983119983118 983105983118983108 983107983122983109983105983124983113983126983113983124983129
983124983151 983149983137983147983141 983156983144983141 983155983156983157983140983141983150983156983155 983156983151 983140983141983155983145983143983150 983141983160983152983141983154983145983149983141983150983156 983137983150983137983148983161983162983141 983145983150983156983141983154983152983154983141983156 983145983150 983156983144983141
983139983151983154983141 983142983145983141983148983140 983159983145983156983144 983156983144983141 983144983141983148983152 983151983142 983151983156983144983141983154 983149983157983148983156983145 983140983145983155983139983145983152983148983145983150983137983154983161 983139983151983150983139983141983152983156983155 983159983144983141983154983141983158983141983154
983137983152983152983148983145983139983137983138983148983141
983120983109983119983092983098 983120983122983119983110983109983123983123983113983119983118983105983116 983108983109983126983109983116983119983120983117983109983118983124
983124983151 983141983140983157983139983137983156983141 983156983144983141 983155983156983157983140983141983150983156983155 983156983151 983140983145983155983155983141983149983145983150983137983156983141 983154983141983155983141983137983154983139983144 983142983145983150983140983145983150983143983155 983159983145983156983144 983143983151983151983140
983155983151983142983156 983155983147983145983148983148983155 983137983150983140 983138983141983139983151983149983141 983137 983155983157983139983139983141983155983155983142983157983148 983141983150983156983154983141983152983154983141983150983141983157983154
983120983109983119983093983098 983112983125983117983105983118 983122983109983123983119983125983122983107983109 983108983109983126983109983116983119983120983117983109983118983124
983124983151 983143983154983137983140983157983137983156983141 983156983144983141 983155983156983157983140983141983150983156983155 983145983150 983138983157983145983148983140983145983150983143 983150983137983156983145983151983150983137983148 983139983137983152983137983138983145983148983145983156983145983141983155 983145983150 983156983141983139983144983150983151983148983151983143983161
983141983140983157983139983137983156983145983151983150 983137983150983140 983154983141983155983141983137983154983139983144
CODE OF CONDUCT FOR THE LABORATORIES
983105983148983148 983155983156983157983140983141983150983156983155 983149983157983155983156 983149983137983145983150983156983137983145983150 983156983144983141 983108983154983141983155983155 983107983151983140983141
983123983137983150983140983137983148983155 983151983154 983151983152983141983150983085983156983151983141983140 983155983144983151983141983155 983137983154983141 983118983119983124 983137983148983148983151983159983141983140 983110983151983151983140983155 983140983154983145983150983147983155 983137983150983140 983155983149983151983147983145983150983143 983137983154983141 983118983119983124 983137983148983148983151983159983141983140
983105983148983148 983138983137983143983155 983149983157983155983156 983138983141 983147983141983152983156 983145983150 983156983144983141 983154983137983139983147983155 983152983154983151983158983145983140983141983140
983124983144983141 983148983137983138 983156983145983149983141983156983137983138983148983141 983149983157983155983156 983138983141 983155983156983154983145983139983156983148983161 983142983151983148983148983151983159983141983140
983106983141 983120983125983118983107983124983125983105983116 983142983151983154 983161983151983157983154 983148983137983138983151983154983137983156983151983154983161 983155983141983155983155983145983151983150
983109983160983152983141983154983145983149983141983150983156 983149983157983155983156 983138983141 983141983160983141983139983157983156983141983140 983159983145983156983144983145983150 983156983144983141 983143983145983158983141983150 983156983145983149983141
7232019 MOFMOS LABpdf
httpslidepdfcomreaderfullmofmos-labpdf 447
Department of ANE MOFMOS LAB MANUAL
3
983123983144983151983157983148983140 983149983137983145983150983156983137983145983150 983155983145983148983141983150983139983141 983145983150 983156983144983141 983148983137983138 983140983157983154983145983150983143 983148983137983138983151983154983137983156983151983154983161 983155983141983155983155983145983151983150
983115983141983141983152 983156983144983141 983148983137983138 983152983154983141983149983145983155983141983155 983139983148983141983137983150
983112983137983150983140983148983141 983149983137983139983144983145983150983141983155 983159983145983156983144 983139983137983154983141
983105983148983148 983155983156983157983140983141983150983156983155 983137983154983141 983148983145983137983138983148983141 983142983151983154 983137983150983161 983140983137983149983137983143983141 983156983151 983156983144983141 983137983139983139983141983155983155983151983154983145983141983155 983140983157983141 983156983151
983156983144983141983145983154 983151983159983150 983150983141983143983148983145983143983141983150983139983141
983105983148983148 983156983151983151983148983155 983149983157983155983156 983138983141 983122983109983124983125983122983118983109983108 983145983142 983161983151983157 983156983137983147983141983150 983142983154983151983149 983156983144983141 983148983137983138 983155983157983152983141983154983158983145983155983151983154
983123983156983157983140983141983150983156983155 983137983154983141 983155983156983154983145983139983156983148983161 983120983122983119983112983113983106983113983124983109983108 983142983154983151983149 983156983137983147983145983150983143 983151983157983156 983137983150983161 983145983156983141983149983155 983142983154983151983149
983156983144983141 983148983137983138983151983154983137983156983151983154983161
983123983156983157983140983141983150983156983155 983137983154983141 983118983119983124 983137983148983148983151983159983141983140 983156983151 983159983151983154983147 983137983148983151983150983141 983145983150 983156983144983141 983148983137983138983151983154983137983156983151983154983161 983159983145983156983144983151983157983156
983156983144983141 983116983137983138 983123983157983152983141983154983158983145983155983151983154
983122983141983152983151983154983156 983145983149983149983141983140983145983137983156983141983148983161 983156983151 983156983144983141 983116983137983138 983123983157983152983141983154983158983145983155983151983154 983145983142 983137983150983161 983149983137983148983142983157983150983139983156983145983151983150 983151983142 983156983144983141
983137983139983139983141983155983155983151983154983145983141983155 983145983155 983156983144983141983154983141
Before leaving the lab
983120983148983137983139983141 983156983144983141 983139983144983137983145983154983155 983152983154983151983152983141983154983148983161
983124983157983154983150 983151983142983142 983156983144983141 983155983159983145983156983139983144983141983155
983120983148983141983137983155983141 983139983144983141983139983147 983156983144983141 983148983137983138983151983154983137983156983151983154983161 983150983151983156983145983139983141 983138983151983137983154983140 983154983141983143983157983148983137983154983148983161 983142983151983154 983157983152983140983137983156983141983155
7232019 MOFMOS LABpdf
httpslidepdfcomreaderfullmofmos-labpdf 547
Department of ANE MOFMOS LAB MANUAL
4
EXPERIMENT 1
VENTURIMETER TEST RIG
IntroductionA VENTURI METER is a device that is used for measuring the rate of flow of fluid througha pipeline The basic principle on which a Venturi Meter works is that by reducing the cross -sectional area of the flow passage a pressure difference is created between the inlet andthroat amp the measurement of the pressure difference enables the determination of thedischarge through the pipe
A Venturi Meter consists of
bull An inlet section followed by a convergent cone
bull A cylindrical throat
bull
A gradually divergent coneThe inlet section of the Venturi Meter is of the same diameter as that of the pipe which is
followed by a convergent one The convergent cone is a short pipe which tapers from theoriginal size of the pipe to that of the throat of the Venturi Meter The throat of the Venturi Meteris a short parallel side tube having its cross ndash sectional area smaller than that of the pipe Thedivergent cone of the Venturi Meter is a gradually diverging pipe with its cross ndash sectional areaincreasing from that of the throat to the original size of the pipe At the inlet and the throat of theVenturi Meter pressure taps are provided through pressure rings
General Description
The apparatus consists of (1) Venturimeter (2) Piping system (3) supply pump set (4) Measuringtank (5) Differential manometer (6) Sump
Constructional Specificationbull Flow Meters Consists of Venturimeter of size 25 mm provided for experiments The
meter has the adequate cocks also with them
bull Piping System Consists of a set of GI piping of size 25 mm with sufficient upstream
and down stream lengths provided with separate control valves and mounted on a suitablestand Separate upstream and down stream pressure feed pipes are provided for themeasurement of pressure heads with control valves situated on a common Pipe for easyoperation
bull Supply Pump Set Is rigidly fixed on sump The mono block pump with motor
operating on single phase 220240 volts 50 Hz AC supply
bull Measuring Tank Measuring tank with gauge glass and scale arrangement for quick and
easy measurement
bull Differential Manometer Differential manometer with 1 mm scale graduations to
measure the differential head produced by the flow meter
7232019 MOFMOS LABpdf
httpslidepdfcomreaderfullmofmos-labpdf 647
Department of ANE MOFMOS LAB MANUAL
5
bull Sump Sump to store sufficient water for independent circulation through the unit for
experimentation and arranged within the floor space of the main unit
Before commissioning
bull Check whether all the joints are leak proof and water tight
bull
Fill the manometer to about half the height with mercurybull Close all the cocks pressure feed pipes and manometer to prevent damage and over
loading of the manometer
bull
Check the gauge glass and meter scale assembly of the measuring tank and see that it isfixed water height and vertically
bull Check proper electrical connections to the switch which is internally connected to the
motor
Experiments
bull The apparatus is primarily designed for conducting experiments on the coefficient of
discharge of flow meters Each flow meter can be connected to the manometer through
the pressure feed opening and the corresponding cocks
bull While taking readings close all the cocks in the pressure feed pipes except the two
(Down-stream and upstream) cocks which directly connect the manometer to the requiredflow meter for which the differential head is to be measured (Make sure while takingreading that the manometer is properly primed Priming is the operation offilling the manometer upper part and the connecting pipes with water andventing the air from the pipes)
bull First open the inlet gate valve of the apparatus Adjust the control valve kept at the exit
end of the apparatus to a desired flow rate and maintain the flow steadily
bull The actual discharge is measured with the help of the measuring tank The differential
head produced by the flow meter can be found from the manometer for any flow rate
7232019 MOFMOS LABpdf
httpslidepdfcomreaderfullmofmos-labpdf 747
Department of ANE MOFMOS LAB MANUAL
6
CALIBRATION OF VENTURIMETER
Aim - To calibrate a given venture meter and to study the variation of coefficient of dischargeof it with discharge
Apparatus - Venturimeter manometer stop watch experimental set-up
Procedure-1
Start the motor keeping the delivery valve close2 The water is allowed to flow through the selected pipe by selecting the appropriate ball
valve3
By regulating the valve control the flow rate and select the corresponding pressuretapings (ie of orifice meter)
4 Make sure while taking readings that the manometer is properly primed Priming is theoperation of filling the manometerrsquos upper part and the connecting pipes with water by
venting the air from the pipes Note down the difference of head ldquohrdquo from the manometerscale
5 Note down the time required for the rise of 10cm (ie 001m) water in the collecting tankby using stop watch Calculate actual discharge using below formulaDischarge - The time taken to collect some lsquoRrsquo cm of water in the collecting tank inmsup3sec
act
A x RQ =
t
Where A = area of the collecting tank in msup2 (03m X 03m)R = rise of water level taken in meters (say 01m or 10cm)
t = time taken for rise of water level to rise lsquoRrsquo inlsquotrsquo seconds6
Using difference in mercury level ldquohrdquocalculate the theoretical discharge of venturimeterby using following expression
1 2th
2 2
1 2
a xa 2gHQ =
a -a
Where
H= difference of head in meters =m
1 2 1 2
w
S(h -h ) x ( -1) = (h -h ) x 126 m
S
a1 = area of venturi at inlet =
2
1
4
d π
a2 = area of venturi at throat =
2
2
4
d π
g =Acceleration due to gravityd1 =Inlet diameter in meters d2 =Throat diameter in meters
7232019 MOFMOS LABpdf
httpslidepdfcomreaderfullmofmos-labpdf 847
Department of ANE MOFMOS LAB MANUAL
7
7 Calculate the coefficient of discharge of orifice meter (Cd)
act
theo
QCd=
Q
8 Repeat the steps 3 to 7 for different sets of readings by regulating the discharge valve
S NoVenturi inlet diameter
d1 Throat Diameter
d2
1 25mm 135 mm
S No Time for (10 cm)raise of water
level in sec
Actualdischarge =
Qa
Differential headin mm of mercury Theoretical
discharge = Qt Cd = Qq Qt
h1 h2 H
1
2
3
4
5
6 +
78
9
10
Precautions
bull Do not run the pump dry
bull Clean the tanks regularly say for every 15days
bull Do not run the equipment if the voltage is below 180V
bull
Check all the electrical connections before runningbull
Before starting and after finishing the experiment the main Control valve should be inclose position
bull Do not attempt to alter the equipment as this may cause Damage to the whole system
Results and Conclusions
7232019 MOFMOS LABpdf
httpslidepdfcomreaderfullmofmos-labpdf 947
Department of ANE MOFMOS LAB MANUAL
8
EXPERIMENT 2
ORIFICE METER TEST RIG
IntroductionAn ORIFICE METER is a simple device used for measuring the discharge through pipesThe basic principle on which an Orifice meter works is that by reducing the cross ndash sectionalarea of the flow passage a pressure difference between the two sections before and after Orificeis developed and the measure of the pressure difference enables the determination of thedischarge through the pipe However an Orifice meter is a cheaper arrangement for dischargemeasurement through pipes and its installation requires a smaller length as compared withVenturi Meter As such where the space is limited the Orifice meter may be used for themeasurement of discharge through pipes
General Description
The apparatus consists of (1) Orifice meter (2) Piping system (3) supply pump set (4) Measuringtank (5) Differential manometer (6) Sump
Constructional Specification
bull Flow Meters Consists of Orifice meter of size 25 mm provided for experiments The
meter has the adequate cocks also with them
bull Piping System Consists of a set of GI piping of size 25 mm with sufficient upstream
and downstream lengths provided with separate control valves and mounted on a suitablestand Separate upstream and downstream pressure feed pipes are provided for themeasurement of pressure heads with control valves situated on a common plate for easy
operation
bull Supply Pump Set Is rigidly fixed on sump The mono block pump with motor
Operating on single phase 220240 volts 50 Hz AC supply
bull Measuring Tank Measuring tank with gauge glass and scale arrangement for quick and
easy measurement
bull Differential Manometer Differential manometer with 1 mm scale graduations to
measure the differential head produced by the flow meter
bull
Sump Sump to store sufficient water for independent circulation through the unit forexperimentation and arranged within the floor space of the main unit
Before Commissioning
bull Check whether all the joints are leak proof and water tight
bull Fill the manometer to about half the height with mercury
bull Close all the cocks pressure feed pipes and manometer to prevent damage and over
loading of the manometer
7232019 MOFMOS LABpdf
httpslidepdfcomreaderfullmofmos-labpdf 1047
Department of ANE MOFMOS LAB MANUAL
983097
bull Check the gauge glass and meter scale assembly of the measuring tank and see that it is
fixed water tight and vertically
bull
Check proper electrical connections to the switch which is internally connected to themotor
Experiments
bull
The apparatus is primarily designed for conducting experiments on the coefficient ofdischarge of flow meters Each flow meter can be connected to the manometer throughthe pressure feed opening and the corresponding cocks
bull
While taking readings close all the cocks in the pressure feed pipes except the two(Down-stream and upstream) cocks which directly connect the manometer to the requiredflow meter for which the differential head is to be measured (Make sure while takingreading that the manometer is properly primed Priming is the operation of filling themanometer upper part and the connecting pipes with water and venting the air from the
pipes)
bull
First open the inlet gate valve of the apparatus Adjust the control valve kept at the exitend of the apparatus to a desired flow rate and maintain the flow steadily
bull
The actual discharge is measured with the help of the measuring tank The differentialhead produced by the flow meter can be found from the manometer for any flow rate
7232019 MOFMOS LABpdf
httpslidepdfcomreaderfullmofmos-labpdf 1147
Department of ANE MOFMOS LAB MANUAL
10
CALIBRATION OF ORIFICE METER
Aim - To calibrate a given Orifice meter and to study the variation of coefficient of discharge ofit with discharge
Apparatus -Orifice meter manometer stop watch experimental set-up
Procedure-1
Start the motor keeping the delivery valve close2
The water is allowed to flow through the selected pipe by selecting the appropriate ballvalve
3 By regulating the valve control the flow rate and select the corresponding pressuretapings (ie of orifice meter)
4 Make sure while taking readings that the manometer is properly primed Priming is theoperation of filling the manometerrsquos upper part and the connecting pipes with water byventing the air from the pipes Note down the difference of head ldquohrdquo from the manometer
scale5 Note down the time required for the rise of 10cm (ie 001m) water in the collecting tank
by using stop watch Calculate actual discharge using below formula
Discharge - The time taken to collect some lsquoRrsquo cm of water in the collecting tank in msup3sec
act
A x RQ =
t
Where A = area of the collecting tank in msup2 (03m X 03m)R = rise of water level taken in meters (say 01m or 10cm)t = time taken for rise of water level to rise lsquoRrsquo in lsquotrsquo seconds
6
Using difference in mercury level ldquohrdquo calculate the theoretical discharge of venturimeterby using following expression
1 2th
2 2
1 2
a xa 2gHQ =
a -a
Where
H= difference of head in meters =m
1 2 1 2
w
S(h -h ) x ( -1) = (h -h ) x 126 m
S
a1 = area of orifice at inlet =
2
1
4
d π
a2 = area of orifice at inlet =
2
2
4
d π
g =Acceleration due to gravityd1 =Inlet diameter in meters d2 =Throat diameter in meters
7 Calculate the coefficient of discharge of orifice meter (Cd)
7232019 MOFMOS LABpdf
httpslidepdfcomreaderfullmofmos-labpdf 1247
Department of ANE MOFMOS LAB MANUAL
11
act
theo
QCd=
Q
8
Repeat the steps 3 to 7 for different sets of readings by regulating the discharge valve
S No Orifice inlet diameterd1
Orifice diameterd2
1 25mm 130
S NoTime for (10 cm)
raise of water
level in sec
Actualdischarge =
Qa
Differential head inmm of mercury Theoretical
discharge = Qt
Cd = Qa Qt
h1 h2 H
1
2
3
4
5
6
7
8
9
10
Calculation-
Precautions-
bull Do not run the pump dry
bull Clean the tanks regularly say for every 15days
bull Do not run the equipment if the voltage is below 180V
bull
Check all the electrical connections before running
bull
Before starting and after finishing the experiment the main
7232019 MOFMOS LABpdf
httpslidepdfcomreaderfullmofmos-labpdf 1347
Department of ANE MOFMOS LAB MANUAL
12
bull Control valve should be in close position
bull Do not attempt to alter the equipment as this may cause
bull Damage to the whole system
Results and Conclusions-
EXPERIMENT 3
PIPE FRICTION APPARATUS
Introduction
A pipe may be of various diameters and may have bends valves etc When a liquid isflowing through such pipes the velocity of the liquid layer adjacent to the pipe wall is zero Thevelocity of the liquid goes on increasing from the wall and hence shear stresses are produced inthe liquid due to viscosity This viscous action causes loss of energy which is usually known asFrictional loss
Here we are going to consider two important losses that occur during flow
bull
Major Losses
bull
Minor Losses
7232019 MOFMOS LABpdf
httpslidepdfcomreaderfullmofmos-labpdf 1447
Department of ANE MOFMOS LAB MANUAL
13
bull Major losses occur due to friction This friction may be due to viscosity or roughness in
the pipe
bull
Minor losses can be due to various reasons such as Inlet and Outlet of the pipe bendsgates sudden expansions and contractions The apparatus is designed to study the friction
losses that appear in long pipes and the obstructions that are encountered in the way offlow by various types of fittings
General DescriptionThe unit consists mainly of 1) Piping System 2) Measuring Tank 3) Differential Manometer 4)Supply pump set 5) Sump
bull Constructional Specification
bull Piping System Piping System of size 127 mm 20 mm and 20 mm (SS) dia With
tapings at 1 meter distance and a flow control valve
bull
Measuring Tank Measuring tank is provided to measure the discharge of water fromthe unit
bull Differential Manometer Differential manometer with 1 mm scale graduations to
measure the loss of head in the pipe line
bull Supply Pump Set Supply pump set is rigidly fixed on the sump The pump set is mono
block pump with 05 HP motor operating on single phase 220 volts 50 Hz AC supply
bull Sump Sump is provided to store sufficient waters for independent circulation through
the unit for experimentation and arranged within the floor space of the main unit
Before Commissioning
bull
Check whether all the joints are leak proof and watertight
bull
Close all the cocks on the pressure feed pipes and Manometer to prevent damage andoverloading of the manometer
bull Check the gauge glass and meter scale assembly of the measuring tank and see that it is
fixed water tight and vertical
bull
Check proper electrical connections to the switch which is internally connected to themotor
Experiments
bull
The apparatus is primarily designed for conducting experiments on the frictional losses inpipes of different sizes Three different sizes of pipes are provided for wide range ofexperiments Each individual pipe can be connected to the Manometer through thepressure feed pipes having individual quick operating cocks
bull
While taking reading close all the cocks in the pressure feed pipe except the two (upstream and downstream) cocks which directly connect the manometer to the requiredpipe for which the loss in head has to be determined (Make sure while taking readings
7232019 MOFMOS LABpdf
httpslidepdfcomreaderfullmofmos-labpdf 1547
Department of ANE MOFMOS LAB MANUAL
14
that the manometer is properly primed Priming is the operating of filling the Manometerupper part and the connecting pipes with water venting the air from the pipes)
bull First open the inlet gate valve of the apparatus Adjust the control valve kept at the exit
end of the apparatus to a desired flow rate and maintain the flow steadily
bull
The actual discharge is measured with the help of the measuring tank For each size ofthe pipe the area of cross section of flow can be calculated from the known diameter ofthe pipes From these two valves and the average velocity of stream through the pipe canbe calculated
bull The actual loss of head is determined from the Manometer readings The frictional loss of
head in pipes is given by the Darcys formulaThe friction coefficient indicates f
7232019 MOFMOS LABpdf
httpslidepdfcomreaderfullmofmos-labpdf 1647
Department of ANE MOFMOS LAB MANUAL
15
FRICTION FACTOR FOR A GIVEN PIPE LINE
Aim - To calculate the friction factor for a given pipe line
Apparatus - experimental set-up stop watch
Procedure-
1 Start the motor keeping the delivery valve close2
The water is allowed to flow through the selected pipe by selecting the appropriateball valve
3 By regulating the valve control the flow rate and select the corresponding pressuretapings
4
Make sure while taking readings that the manometer is properly primed Priming isthe operating of filling the Manometer upper part and the connecting pipes with waterventing the air from the pipes Note down the loss of head ldquohfrdquo from the manometerscale
5
Note down the time required for the rise of 10cm (ie 01m) water in the collectingtank by using stop watch Calculate discharge using below formula
Discharge - The time taken to collect some lsquoxrsquo cm of water in the collecting tank in msup3sec
A x RQ =
t
A = area of the collecting tank in msup2 (03m X 03m)R = rise of water level taken in meters (say 01m or 10cm)t = time taken for rise of water level to rise lsquorrsquo in lsquotrsquo seconds
6 Calculate the velocity of the jet by following formula
V = Discharge = Q A msecArea of the pipe
A = cross sectional area of the pipe=Πdsup2 4d = pipe diameter
7 Calculate the coefficient of friction for the given pipe by fLvsup2
hf = ---------ρgd
Wherehf - Loss of head of water = (h1-h2)(Sn So ndash 1) = (h1-h2) 1261000 m
f - Co-efficient of friction for the pipeL - Discharge between sections for which loss of head is measured (1 meter)v - Average velocity of flow in msecg - Acceleration due to gravity 981msecd - Pipe diameter in meters
8 Repeat the steps 2 to 7 for different sets of readings by regulating the discharge valve
7232019 MOFMOS LABpdf
httpslidepdfcomreaderfullmofmos-labpdf 1747
Department of ANE MOFMOS LAB MANUAL
16
Tabular Form
S No Oslash of pipeArea(a)
Time forrise of 10cm water
Discharge VelocityLoss ofHead
hf
Co-efficientof friction
f
Calculation-
bull Total Head H
H = (h1 + h2) x 126 m of waterWhere
126 = conversion factor from mercury to water head
bull
Discharge Q
WhereA = Area of collecting tank = 0125 msup2R = Rise in water level of the collecting tank cm
t = time for lsquoRrsquo cm rise of water sec100 = Conversion from cm to m
bull
Velocity V
msWhere Arsquo = area of the pipefitting in use
7232019 MOFMOS LABpdf
httpslidepdfcomreaderfullmofmos-labpdf 1847
Department of ANE MOFMOS LAB MANUAL
17
bull
Friction Factor(Major Losses) F
Where H = total head m of waterV = velocity mg = acceleration due to gravity 981mssup2L = Distance bw tapping = 15m
bull
Head Loss Due To Fittings (Minor Losses) K
Where H = total head m of waterV = velocity mg = acceleration due to gravity 981mssup2
Precautions
1) Do not run the pump dry2)
Clean the tanks regularly say for every 15days3)
Do not run the equipment if the voltage is below 180V4) Check all the electrical connections before running5) Before starting and after finishing the experiment the main control valve should be in
close position6) Do not attempt to alter the equipment as this may cause damage to the whole system
Results and Conclusions
7232019 MOFMOS LABpdf
httpslidepdfcomreaderfullmofmos-labpdf 1947
Department of ANE MOFMOS LAB MANUAL
18
EXPERIMENT 4
BERNOULLIrsquoS EXPERIMENTIntroduction
Bernoullirsquos Theorem gives the relationship between pressure head velocity head and thedatum Here the attempt has been made to study the relationship of the above said parametersusing venturimeter
General Description
bull The apparatus consists of a specially fabricated clear ACRYLIC Venturimeter
with necessary tappings connected to a Multibank Piezometer also made of clearACRYLIC
bull
The apparatus consists of two overhead tanks interconnected with the venturimeterwhich is placed in between the tanks
bull The overhead tanks are provided with the Head variation mechanism for conducting
the experiments at various heads
bull
Water in the sump tank is pumped using a Monobloc Centrifugal pump (Kirloskarmake) which passes through the control valve to the overhead tank
bull The height of the water in the collecting tank is measured using the acrylic
Piezometer to find the flowrate
bull The whole arrangement is mounted on an aesthetically designed sturdy frame
made of MS tubes and NOVAPAN Board with all the provisions for holding thetanks and accessories
Aim
o
The experiment is conducted too
Study of Pressure Gradient at different zoneso
Verification of Bernoullis Equationo
Comparative analysis under different flow rates
Apparatus
1) Venturimeter 2)Piezometer 3) Overhead Tank 4)Sump Tank 5) Centrifugal Pump
Procedure
1) Fill in the sump tank with clean water2)
Keep the delivery valve closed3)
Check and give necessary electrical connections to the system4) Switch on the pump amp Slowly open the delivery valve5)
Adjust the flow through the control valve of the pump6)
Allow the system to attain the steady state ie let the water pass from the secondoverhead tank to the collecting tank
7) Note down the Pressure head at different points of the venture meter on the multi-tubepiezometer (Expel if any air is the by inserting the thin pin into the piezometer openings)
8) Close the ball valve of the collecting tank and measure the time for the known rise ofwater
7232019 MOFMOS LABpdf
httpslidepdfcomreaderfullmofmos-labpdf 2047
Department of ANE MOFMOS LAB MANUAL
1983097
9) Change the flow rate and repeat the experiment
Observation
SlNo
Static Head Loss h Time for lsquoRrsquo
cm rise in waterlsquoTrsquo sec1 2 3 4 5 6 7 8 9 10
1
2
3
4
5
Calculations1
Discharge QA2
Where
A = Area of collecting tank = 0045 msup2R = Rise in water level of the collecting tank cmt = time for lsquoRrsquo cm rise of water sec100 = Conversion from cm to m
3 Pressure Head
Where
ρ = density of waterg = gravitational constanth = head measured m of water column
3 Velocity Head
WhereV = Q a a = Area at the particular section of the venturimeter msup2
4 Verification of BERNOULLIrsquoS EQUATIONBernoullirsquos Equation is given as
After findinga Pressure Head hb
Velocity headat different cross-section of the Venturimeter
7232019 MOFMOS LABpdf
httpslidepdfcomreaderfullmofmos-labpdf 2147
Department of ANE MOFMOS LAB MANUAL
20
Put the same in the above equation for different points and verify whether all the values obtainedare sameNote Consider the datum z to be constant
Precautions
bull
Do not run the pump drybull
Clean the tanks regularly say for every 15days
bull
Do not run the equipment if the voltage is below 180V
bull
Check all the electrical connections before running
bull Before starting and after finishing the experiment the main
bull Control valve should be in close position
bull Do not attempt to alter the equipment as this may cause
bull
Damage to the whole system
Result and Conclusion
7232019 MOFMOS LABpdf
httpslidepdfcomreaderfullmofmos-labpdf 2247
Department of ANE MOFMOS LAB MANUAL
21
EXPERIMENT 5
CALIBRATION OF A TRIANGULAR NOTCH
AIM -To find the coefficient of discharge of given triangular notch
THEORY-A notch is a device used for measuring the rate of flow of liquid through a smallchannel or a tank It may be defined as an opening in the side of a tank or small channel in suchthat a way that the liquid surfaces in the tank or channel is below the top edge of the opening
NOTCHES ARE CLASSIFIED AS-1 Rectangular notch2 Triangular notch3 Trapezoidal notch
4 Stepped notch
A triangular notch is preferred to a rectangular notch due to the following reasonsThe expression for discharge of triangular notch is compared to rectangular notch is simple Formeasuring low discharge a triangular notch gives more accurate results than a rectangular notchIn the case of triangular notch only H is required for the computation of dischargeA trapezoidal notch is a combination of rectangular and triangular notch and thus the dischargethrough trapezoidal notch is the sum of above notchesA stepped notch is a combination of rectangular notch and triangular notch The dischargethrough the stepped notch is equal to sum of discharges through the different rectangularnotches
DESCRIPTION- The apparatus consists of1) Measuring tank 2) Sump tank3) Supply pump set 4) Inlet and out let valve
Measuring tank Stainless steel tank of size 030305mm height with the gage glass a scalearrangement for quick and easy measurements A ball valve is provided to empty the tank and adrain is provided at the bottom of the tank to drain the waste water when the unit is not in useWater for independent circulation through the unit for experimentation and arranged within thefloor space of the main unitSump tank The sump tank is a size of 020303m stainless steel tank to store sufficient waterfor independent circulation through the unit for experimentation and arranged within the floorspace of the main unit about 060305m with a gauge glass and scale arrangement A ballvalve is provided to empty the tankSupply Pump set The pump is 2525mm size mono block with frac12 HP 2880 RPM singlephase 220volts AC supply Inlet and out let valve- These valves are used to control the flow ofwater at inlet and out let
PROCEDURE1 Allow the water to drain up to triangular notch
7232019 MOFMOS LABpdf
httpslidepdfcomreaderfullmofmos-labpdf 2347
Department of ANE MOFMOS LAB MANUAL
22
2 Note down the depth of the water when the water is coinciding with the v notch point
3 Collect water in collecting tank and close the drain valve and find the time taken for the rise ofwater up to 20cm
4 Calculate the discharge by using the above results
5 Now substituting the values in the formula for calculation of discharge for v- notch gives therequired result
Precautionsbull Do not run the pump dry
bull Clean the tanks regularly say for every 15days
bull Do not run the equipment if the voltage is below 180V
bull Check all the electrical connections before running
bull
Before starting and after finishing the experiment the main
bull
Control valve should be in close position
bull
Do not attempt to alter the equipment as this may cause
7232019 MOFMOS LABpdf
httpslidepdfcomreaderfullmofmos-labpdf 2447
Department of ANE MOFMOS LAB MANUAL
23
bull Damage to the whole system
Result and Conclusion
7232019 MOFMOS LABpdf
httpslidepdfcomreaderfullmofmos-labpdf 2547
Department of ANE MOFMOS LAB MANUAL
24
MECHANICSOF SOLIDS
LAB
7232019 MOFMOS LABpdf
httpslidepdfcomreaderfullmofmos-labpdf 2647
Department of ANE MOFMOS LAB MANUAL
25
7232019 MOFMOS LABpdf
httpslidepdfcomreaderfullmofmos-labpdf 2747
Department of ANE MOFMOS LAB MANUAL
983089
IZOD IMPACT TEST
AIM To perform the izod impact test on materials
APPARATUS Izod impact test machine test specimen vernier calipers steel rule
IMPACT STRENGTH The resistance of a material to fracture under sudden load application
MATERIALS Two types of test pieces are used for this test as given
1) Square cross-section
2) Round cross-section
THEORY The type of test specimen used for this test is a Square Cross-section
The specimen may have single two or three notches The testing machine shouldhave the following specifications The angle between top face of grips and face holding the specimen Vertical=900 the angle of tip of hammer =750plusmn10
The angle between normal to the specimen and underside face of the hammer at Striking point=100plusmn10
Speed of hammer at impact=399msecStriking energy=168N-m or Joules Angle
Of drop of pendulum =900 Effective
weight of pendulum=2179kg
Minimum value of scale graduation=2 Joules
Permissible total friction loss of corresponding energy=050
Distance from the axis of rotation of distance between the base of specimen notch andthe point of specimen hit by the hammer=22mmplusmn05mm
The longitudinal axes of the test piece shall lie in the plane of swing of the center ofgravity of the hammer The notch shall be positioned so that its in the plane of thehammer the notch shall be positioned its plane of symmetry coincides with the top faceof the grips for setting the specimen the notch impact strength I is calculated accordingto the following relation
Where I= impact strength in joulesm2
7232019 MOFMOS LABpdf
httpslidepdfcomreaderfullmofmos-labpdf 2847
Department of ANE MOFMOS LAB MANUAL
983090
PROCEDURE
1 For conducting Izod test a proper striker is to be fitted firmly to the bottom of thehammer with the help of the clamming piece
2 The latching take for izod test is to be firmly fitted to the bearing housing at the side of
the columns3 The frictional loss of the machine can be determined by free fall test raise the
hammer by hands and latch in release the hammer by operating lever the pointer will
then indicate the energy loss due to friction From this reading confirm that the friction
loss is not exceeding 05 of the initial potential energy Otherwise frictional loss has to
be added to the final reading
4 The specimen for izod test is firmly fitted in the specimen support with the help ofclamping screw and eacutelan key Care should be taken that the notch on the specimenshould face to pendulum striker
5 After ascertaining that there is no person in the range of swinging pendulum release the
pendulum to smash the specimen6 Carefully operate the pendulum brake when returning after one swing to stop the oscillations
7 Read-off position of reading pointer on dial and note indicated value
8 Remove the broken specimen by loosening the clamping screw
The notch impact strength depends largely on the shape of the specimen and the notch the
values determined with other specimens therefore may not be compared with each other
OBSERVATION TABLE
S No A(Area of cross K Impact energy I Impact Strength
section of observed
specimen)
RESULT
7232019 MOFMOS LABpdf
httpslidepdfcomreaderfullmofmos-labpdf 2947
Department of ANE MOFMOS LAB MANUAL
983091
Calculation Part
7232019 MOFMOS LABpdf
httpslidepdfcomreaderfullmofmos-labpdf 3047
Department of ANE MOFMOS LAB MANUAL
983092
ROCKWELL HARDNESS TEST
AIM To determine the Rockwell hardness of the given test specimen
APPARATUS Rockwell hardness testing machine test specimen
THEORY
Hardness-the resistance of a metal to plastic deformationagainst indentation scratching abrasion or cutting
The depth of penetration of the indenter measures the hardness of a material by this Rockwell ‟s hardness test method the depth of penetration is inversely
proportional to the hardness Both ball or diamond cone types of indenters are used inthis testThere are three scales on the machine for taking hardness readings
Scale bdquoA‟ with load 60kgf or 5888N and diamond indenter is used for performing tests on steel and shallow case hardened steel
Scale bdquoB‟ with load 100kgf or 9807 N and 1588mm dia ball indenter is used forperforming tests on soft steel malleable iron copper and aluminum alloys
Scale bdquoC‟ with load 150kgf or 1471 N and diamond indenter is used for performing testson steel hard cost steel deep case hardened steel other metals which harder
First minor load is applied to overcome the film thickness on the metal surfaceMinor load also eliminates errors in the depth of measurement due to spring of themachine frame or setting down of the specimen and table attachments
The Rockwell hardness is derived from the measurement of the depth of theimpression This method of test is suitable for finished or machined parts of simpleshapes
PROCEDURE
1 Select the load by rotating the nob and fix the suitable indenter
2 Clean the test piece and place on the special anvil or worktable of the machine
3 Turn the capstan wheel to evaluate the test specimen into contact with the indenterpoint
4 Further turn the wheel for three rotations forcing the test specimen against theindenter This will ensure the minor load has been applied5 Set the pointer on the scale dial at the appropriate position
7232019 MOFMOS LABpdf
httpslidepdfcomreaderfullmofmos-labpdf 3147
Department of ANE MOFMOS LAB MANUAL
983093
6 Push the lever to apply the major load A dash pot provided in the loading mechanismto ensure that the load is applied gradually
7 As soon as the pointer comes to rest pull the handle in the reverse direction slowlyThis releases the major but not the minor load The pointer will now rotate in the reversedirection
8 The Rockwell hardness can read off the scale dial on the appropriate scale after thepointer comes to rest
OBSERVATIONS
Material of the specimen =
Thickness of test specimen =
Hardness scale used =
Test Material Rockwell Scale of weights Rockwell number Average
no Rockwell
no
Scale weight indent 1 2 3
PRECAUTIONS
1 For testing cylindrical test specimens use V-type platform
2 Calibrate the machine occasionally by using standard test blocks
3 For thin metal prices place another sufficiently thick metal piece between the testspecimen and the platform to avoid any damage which may likely occur to the platform
4 After applying major load wait for some time to allow the needle to come to restThe waiting time may vary from 2 to 8 seconds
7232019 MOFMOS LABpdf
httpslidepdfcomreaderfullmofmos-labpdf 3247
Department of ANE MOFMOS LAB
MANUAL
983094
5 The surface of the test piece should be smooth and even and free from oxidescale and foreign matter6 Test specimen should not be subjected to any heating of cold working
7 The distance between the centers of two adjacent indentation should be at least 4
Times the diameter of the indentation and the distance from the center of any indentation tothe edge of the test piece should be at least 25 times the diameter of the indentation
RESULT
7232019 MOFMOS LABpdf
httpslidepdfcomreaderfullmofmos-labpdf 3347
Department of ANE MOFMOS LAB MANUAL
983095
Calculation Part
7232019 MOFMOS LABpdf
httpslidepdfcomreaderfullmofmos-labpdf 3447
Department of ANE MOFMOS LAB MANUAL
983096
BRINELLrsquoS HARDNESS TEST
AIM To determine the Brinell hardness of the given test specimen
APPARATUS Brinell hardness machine test specimen Brinells Microscope
THEORY
Indentation Hardness-A number related to the area or to the depth of
the impression made by an indenter or fixed geometry under a known fixed load
This method consists of indenting the surface of the metal by a hardened steel
ball of specified diameter D mm under a given load F kgf and measuring the average
diameter d mm of the impression with the help of Brinell microscope fitted with a scaleThe Brinell hardness HB is defined as the quotient of the applied force F divided by the
spherical area of the impression
HB= Test load in kgfsurface area of indentation
=2F πD (D- D2- d2) kgmm2
PROCEDURE
1 Select the proper size of the ball and load to suit the material under test2 Clean the test specimen to be free from any dirt and defects or blemishes
3 Mount the test piece surface at right angles to the axis of the ball indenter plunger
4 Turn the platform so that the ball is lifted up
5 By shifting the lever applies the load and waits for some time
6 Release the load by shifting the lever
7 Take out the specimen and measure the diameter of indentation by means of theBrinell microscope8 Repeat the experiments at other positions of the test piece
9 Calculate the value of HB
7232019 MOFMOS LABpdf
httpslidepdfcomreaderfullmofmos-labpdf 3547
Department of ANE MOFMOS LAB MANUAL
983097
OBSERVATIONS
Test piece material = Diameter of the ballrdquo D ldquo =
Load section FD2 = Test load =
Load application time =
Least count of Brinell Microscope =
Diameter Average
Impression F D HB
S No in kg in mm Kgmm2
(d1) (d2) (d1+d2)2
PRECAUTIONS
1 The surface of the test piece should be clean
2 The testing machine should be protected throughout the test from shock or vibration
3 The test should be carried out at room temperature
4 The distance of the center of indentation from the edge of test piece should be at
least 25 times the diameter of the indentation and the distance between the center ofthe two adjacent indentations should be at least 4 times the diameter of the indentation
5 The diameter of each indentation should be measured in two directions at rightangles and the mean value readings used the purpose of determining the hardnessnumber
7232019 MOFMOS LABpdf
httpslidepdfcomreaderfullmofmos-labpdf 3647
Department of ANE
MOFMOS LAB MANUAL
983089983088
RESULT
Calculation Part
7232019 MOFMOS LABpdf
httpslidepdfcomreaderfullmofmos-labpdf 3747
Department of ANE MOFMOS LAB MANUAL
983089983089
SPRING TEST
AIM To determine the rigidity modulus of the spring
APPARATUS Spring testing machine vernier calipers spring specimen
THEORY
Closed coiled helical springs are the springs in which helix angle is very small or inother words the pitch between two adjacent turns is small A closed coiled helical springcarrying an axial load is shown in fig
As helix angle in case of close coiled helical springs are small hence the bendingeffect on the spring is ignored and we assume that the coils of close coiled helical
springs are to stand purely tensional stresses Let d=diameter ofthe spring wire
P= pitch of the helical spring N= number ofcoils R= mean radius of the spring coil
W=axial load on spring C=modulus of rigidity
τ=maximum shear stress induced in the wire θ=angle of twist in the
spring wire and
x= deflection of spring due to axial load l= length of wire
Net twisting moment on the wire T=WR
But twisting moment is also given by T= (π 16) τd3
From 1 ad 2 WR = (π 16) τd3 τ=16WR πd
3
above equation which gives the maximum shear stress induced in the wire (1) Length of one coil=2πR
Total length of the wire=2πRn (2)
Strain energy stored by the spring due to torsion
U= (τ 4C) [(π 4)d 2πRn] (3)
Work done on the spring =average load x deflection
= (12) Wx (4)
Equating 3 and 4
(12) Wx = (32W2R3n)Cd4
7232019 MOFMOS LABpdf
httpslidepdfcomreaderfullmofmos-labpdf 3847
Department of ANE MOFMOS LAB MANUAL
983089983090
x=64WR3nCd
4
Rigidity modulus of the spring
C=64WR3nxd
4
PROCEDURE
1) Consider the spring and find out itsmean coil radius R with the help ofvernier calipers
2) Find the diameter of the spring andnumber of turns
3) Fix the spring between two hooks
4) Now load is gradually applied
5) Note the deflection from thedeflection scale for different loadsapplied
6) Calculate the rigidity modulus usingabove formula
PRECAUTIONS
1) Dimensions should be measureaccurately with the help of verniercalipers
2) Deflection from the scale should benoted carefully and accurately
OBSERVATION TABLE
Sno Load applied deflection Rigidity modulus
C
Average rigidity modulus C =
RESULT
7232019 MOFMOS LABpdf
httpslidepdfcomreaderfullmofmos-labpdf 3947
Department of ANE MOFMOS LAB MANUAL
983089983091
Calculation Part
7232019 MOFMOS LABpdf
httpslidepdfcomreaderfullmofmos-labpdf 4047
Department of ANE MOFMOS LAB MANUAL
983089983092
TORSION
AIM To conduct torsion test on mild steel or cast iron specimen to find modulus of rigidity or to find angle of twist of the materials which are subjected to torsion
APPARATUS 1 A torsion test machine along with angle of twist measuring attachment
2 Standard specimen of mild steel or cast iron
3 Steel rule
4 Vernnier caliper or a micrometer
THEORY
For transmitting power through a rotating shaft it is necessary to apply a turning
force The force is applied tangentially and in the plane of transverse cross section The
torque or twisting moment may be calculated by multiplying two opposite turningmoments It is said to be in pure torsion and it will exhibit the tendency of shearing off at
every cross section which is perpendicular to the longitudinal axis
Torsion equation
Torsion equation is given by below
T IP = CθL = TR
T= maximum twisting torque (Nmm) IP =
polar moment of inertia (mm4) τ =shear
stress (Nmm2) C=modulus of rigidity (Nmm2)
θ=angle of twist in radians L=length of shaft under torsion (mm)
Assumptions made for getting torsion equation
1 The material of the shaft is uniform through out
2 The shaft circular in section remain circular after loading
3 Plane sections of shaft normal to its axis before loading remain plane after thetorque have been applied
4 The twist along the length of the shaft is uniform throughout
5 The distance between any two normal-sections remains the same after theapplication of torque
6 Maximum shear stress induced in the shaft due to application of torque does notexceed its elastic limit
7232019 MOFMOS LABpdf
httpslidepdfcomreaderfullmofmos-labpdf 4147
Department of ANE MOFMOS LAB MANUAL
983089983093
PROCEDURE
1 Select the suitable grips to suit the size of the specimen and clamp it in themachine by adjusting sliding jaw
2 Measure the diameter at about the three places and take average value
3 Choose the appropriate loading range depending upon specimen
4 Set the maximum load pointer to zero
5 Carry out straining by rotating the hand wheel or by switching on the motor
6 Load the members in suitable increments observe and record strain reading
7 Continue till failure of the specimen
8 Calculate the modulus of rigidity C by using the torsion equation
9 Plot the torque ndashtwist graph (T Vs θ)
OBSERVATIONS
Gauge length L =
Polar moment of inertia IP =
Modulus of rigidity C =TL IP θ =
SNo Twisting Moment Angle of Twist Modulus Average
Kgf Nm Degrees Radians of rigidity CNmm2
C
RESULT
7232019 MOFMOS LABpdf
httpslidepdfcomreaderfullmofmos-labpdf 4247
Department of ANE MOFMOS LAB MANUAL
983089983094
TENSILE TEST
AIM
To conduct tensile test on a mild steel specimen and determine the following
1 Limit of proportionality 2 Elastic Limit
3 Upper yield point 4 Lower yield point
5 Ultimate strength 6 Fracture strength
7 Young`s Modulus 8 Percentage elongation
9 Percentage reduction in area 10 Ductility
11 Toughness 12 True stress amp true strain
13 Malleability
APPARATUS tensile testing machine specimen steel rule vernier caliper micrometer
THEORY
The tensile test is most applied one of all mechanical tests In this test a test specimen is fixed
into grips connected to a straining device and to a load-measuring device (One end in stationary
grips and the other in movable grips) If the applied load is small enough the deformation of any
solid body is entirely elastic An elastically deformed solid will return to its original form as soon
as load is removed However if the load is too large the material can be deformed permanently
The initial part of the tension curve which represents the manner in which solid undergoes
plastic deformation is termed as plastic The stress below which the deformation is essentially
entirely elastic is known as the elastic limit of the material In some materials like mild steel a
sudden drop in load indicating both an upper and lower yield point denotes the onset of plastic
deformation However some materials do not exhibit a sharp yield point During plastic
deformation at lager extensions strain hardening cannot compensate for the decrease in section
and thus the load passes through a maximum and then begins to decrease At this stage the
ultimate strength which is defined as the ration of the load on the specimen to the original cross-section area reaches a maximum value Until this point the deformation is uniform at all the
sections of the specimen Further loading will eventually cause bdquoneck ‟ formation and rupture
follows
7232019 MOFMOS LABpdf
httpslidepdfcomreaderfullmofmos-labpdf 4347
Department of ANE MOFMOS LAB
MANUAL
983089983095
Usually a tension test is conducted at room temperature the tensile load is applied
slowly During this test either round or flat specimens may be used The load on the specimen is
applied mechanically or hydraulically depending on the type of testing machine
1 NominalEngg stress and NominalEngg strain
Original CS area = A0 (mm2)
Original gauge length = L0 (mm) Increase in gauge length = δL0
Nominal stress = PA0 (N mm2)
Nominal strain = δL0 L0
2 Limit of Proportionality Stress is proportional to strain up to this pointNormal Stress = PA PO Normal Strain = (δ LO) ALO
3 Elastic limit When the load is removed at ldquoBrdquo the specimen will go back to originalDimensions ie LO and δ AO Nominal stress = PB AO Normal Strain = (δ LO) B LO
If the specimen is loaded beyond elastic limit it will undergo permanent strainie Plastic deformation
4 Upper yield point Nominal stress = PC AO Nominal strain = (δ LO) D LO
5 Lower yield point Nominal stress = PD AO
Nominal strain = (δ LO) D LO 6 Ultimate load or maximum load point
Nominal ultimate stress = PE AO Nominal strain = (δ LO) E LO
7 Fracture Load point F
Nominal fracture stress = PF AO
Nominal strain at fracture = (δ LO) F LO
8 Young`s modulus (E) Young`s modulus (E) = StressStrain
(In the elastic region limit of proportionality = Nominal stress at ANominal strain at A 9Modulus of resilience = (Nominal stress at elastic limit)
2 2E
Area under Engg Stress - Strain diagram up to elastic limit10 Resilience = Modulus of Resilience x Volume of specimen undergoing Tensile stress
7232019 MOFMOS LABpdf
httpslidepdfcomreaderfullmofmos-labpdf 4447
Department of ANE MOFMOS LAB MANUAL
983089983096
11 Yield point ElongationElongation taking place in the specimen from C to D this istaking place without increase in stress
12 Modulus of toughnessArea under engineering stress ndash strain diagram up to fracture13 Toughness = Modulus of toughness x Volume of specimenThis indicates theamount of energy absorbed by the specimen before fracture take place
14 Ductility= (Final length at fracture ndash original length 10) x 100
15 MalleabilityIt is the ability of the material to undergo plastic deformation prior fracture under compressive loading conditions In a tensile test it is approximatedas percentage reduction in cross sectional area of the specimen Malleability =
(AO - Af )AO) x 100
True stress ndash true strain diagram
Engineering stress is calculated based on original cross sectional area (AO) But not on the actual cross sectional area at load bdquoP‟
True stress = PA = PAO x AO A
Since volume remains constant during plastic deformation we have AO LO = AL True stress = PAO x L LO
= PAO x ((LO + δLO) LO)
= P (1+e)= Nominal stress (1+ nominal strain)
True strain = Є = 1n (1+e)
These relations are valid up to ultimate load ie up to which the strain isuniform all along the gauge length
1 True Stress at upper yield point = Nominal stress at upper yield point ( 1+e O)True strain at C = 1n (1+eo)
2 True stress at ultimate load (E1)= Nominal ultimate stress ( 1+eE)True strain at ultimate load = 1n (1+eE)
3 True stress at fracture (E1) = Pf Af
Where Af is the area of cross section at fracture can be measured True
strain at fracture = 1n (Ao Af )
Area relation is taken instead of lengths because the strains are localized in theregion between ultimate load point and fracture point
4 Strain Hardening
From lower yield point onwards increase in load is required for increase instrain Thus the stress required for further deformation is more Thisphenomenon is called strain hardening
5 True ndash stress ndash true strain curve in log ndash log co ndash ordinates
When the true ndash stress and true ndash strain are plotted on log ndash log co ndash ordinates thecurve is a straight line
7232019 MOFMOS LABpdf
httpslidepdfcomreaderfullmofmos-labpdf 4547
Department of ANE MOFMOS LAB MANUAL
983120983137983143983141 983089983097 983151983142 983090983089
6 Ductile and Brittle Materials
If a material fails without much plastic deformation it can be called brittle If the percentageelongation at fracture is less than 25 the material is classified as brittle
bull Usually the metals with FCC and CPH structures are highly ductile
PROCEDURE
1 Measure the original gauge length and diameter of the specimen
2 Insert the specimen into grips of the test machine
3 Begin the load application and record load vs elongation data
4 Take the readings more frequently as yield point is approached
5 Measure elongation values
6 Continue the test till fracture occurs
7 By joining the two broken halves of the specimen together measure the final length anddiameter of specimen at fracture
RESULTS AND DISCUSSIONS
1 Plot the Engg Stress strain curve and determine the following
bull Limit of proportionality = (Nmm2)
bull Yield strength = (Nmm2)
bull Ultimate strength = (Nmm2)
bull Young`s modulus = (Nmm2)
bull Percentage elongation = bull Percentage reduction in area =
bull Fracture strength = (Nominal Engg)
bull Toughness = Area under stress ndash strain curve up to
fracture
bull Malleability
2 Plot True Stress True strain curve after calculating true ndash stress and true strain values at various
points
Estimate1) Strength coefficient
2) Strain hardening coefficient
3) Determine whether the material is ductile or brittle4) Comment on the results
7232019 MOFMOS LABpdf
httpslidepdfcomreaderfullmofmos-labpdf 4647
Department of ANE MOFMOS LAB MANUAL
983120983137983143983141 983090983088 983151983142 983090983089
SNo Load Deformation Stress Strain E
Calculation part-
7232019 MOFMOS LABpdf
httpslidepdfcomreaderfullmofmos-labpdf 4747
Department of ANE MOFMOS LAB MANUAL

7232019 MOFMOS LABpdf
httpslidepdfcomreaderfullmofmos-labpdf 447
Department of ANE MOFMOS LAB MANUAL
3
983123983144983151983157983148983140 983149983137983145983150983156983137983145983150 983155983145983148983141983150983139983141 983145983150 983156983144983141 983148983137983138 983140983157983154983145983150983143 983148983137983138983151983154983137983156983151983154983161 983155983141983155983155983145983151983150
983115983141983141983152 983156983144983141 983148983137983138 983152983154983141983149983145983155983141983155 983139983148983141983137983150
983112983137983150983140983148983141 983149983137983139983144983145983150983141983155 983159983145983156983144 983139983137983154983141
983105983148983148 983155983156983157983140983141983150983156983155 983137983154983141 983148983145983137983138983148983141 983142983151983154 983137983150983161 983140983137983149983137983143983141 983156983151 983156983144983141 983137983139983139983141983155983155983151983154983145983141983155 983140983157983141 983156983151
983156983144983141983145983154 983151983159983150 983150983141983143983148983145983143983141983150983139983141
983105983148983148 983156983151983151983148983155 983149983157983155983156 983138983141 983122983109983124983125983122983118983109983108 983145983142 983161983151983157 983156983137983147983141983150 983142983154983151983149 983156983144983141 983148983137983138 983155983157983152983141983154983158983145983155983151983154
983123983156983157983140983141983150983156983155 983137983154983141 983155983156983154983145983139983156983148983161 983120983122983119983112983113983106983113983124983109983108 983142983154983151983149 983156983137983147983145983150983143 983151983157983156 983137983150983161 983145983156983141983149983155 983142983154983151983149
983156983144983141 983148983137983138983151983154983137983156983151983154983161
983123983156983157983140983141983150983156983155 983137983154983141 983118983119983124 983137983148983148983151983159983141983140 983156983151 983159983151983154983147 983137983148983151983150983141 983145983150 983156983144983141 983148983137983138983151983154983137983156983151983154983161 983159983145983156983144983151983157983156
983156983144983141 983116983137983138 983123983157983152983141983154983158983145983155983151983154
983122983141983152983151983154983156 983145983149983149983141983140983145983137983156983141983148983161 983156983151 983156983144983141 983116983137983138 983123983157983152983141983154983158983145983155983151983154 983145983142 983137983150983161 983149983137983148983142983157983150983139983156983145983151983150 983151983142 983156983144983141
983137983139983139983141983155983155983151983154983145983141983155 983145983155 983156983144983141983154983141
Before leaving the lab
983120983148983137983139983141 983156983144983141 983139983144983137983145983154983155 983152983154983151983152983141983154983148983161
983124983157983154983150 983151983142983142 983156983144983141 983155983159983145983156983139983144983141983155
983120983148983141983137983155983141 983139983144983141983139983147 983156983144983141 983148983137983138983151983154983137983156983151983154983161 983150983151983156983145983139983141 983138983151983137983154983140 983154983141983143983157983148983137983154983148983161 983142983151983154 983157983152983140983137983156983141983155
7232019 MOFMOS LABpdf
httpslidepdfcomreaderfullmofmos-labpdf 547
Department of ANE MOFMOS LAB MANUAL
4
EXPERIMENT 1
VENTURIMETER TEST RIG
IntroductionA VENTURI METER is a device that is used for measuring the rate of flow of fluid througha pipeline The basic principle on which a Venturi Meter works is that by reducing the cross -sectional area of the flow passage a pressure difference is created between the inlet andthroat amp the measurement of the pressure difference enables the determination of thedischarge through the pipe
A Venturi Meter consists of
bull An inlet section followed by a convergent cone
bull A cylindrical throat
bull
A gradually divergent coneThe inlet section of the Venturi Meter is of the same diameter as that of the pipe which is
followed by a convergent one The convergent cone is a short pipe which tapers from theoriginal size of the pipe to that of the throat of the Venturi Meter The throat of the Venturi Meteris a short parallel side tube having its cross ndash sectional area smaller than that of the pipe Thedivergent cone of the Venturi Meter is a gradually diverging pipe with its cross ndash sectional areaincreasing from that of the throat to the original size of the pipe At the inlet and the throat of theVenturi Meter pressure taps are provided through pressure rings
General Description
The apparatus consists of (1) Venturimeter (2) Piping system (3) supply pump set (4) Measuringtank (5) Differential manometer (6) Sump
Constructional Specificationbull Flow Meters Consists of Venturimeter of size 25 mm provided for experiments The
meter has the adequate cocks also with them
bull Piping System Consists of a set of GI piping of size 25 mm with sufficient upstream
and down stream lengths provided with separate control valves and mounted on a suitablestand Separate upstream and down stream pressure feed pipes are provided for themeasurement of pressure heads with control valves situated on a common Pipe for easyoperation
bull Supply Pump Set Is rigidly fixed on sump The mono block pump with motor
operating on single phase 220240 volts 50 Hz AC supply
bull Measuring Tank Measuring tank with gauge glass and scale arrangement for quick and
easy measurement
bull Differential Manometer Differential manometer with 1 mm scale graduations to
measure the differential head produced by the flow meter
7232019 MOFMOS LABpdf
httpslidepdfcomreaderfullmofmos-labpdf 647
Department of ANE MOFMOS LAB MANUAL
5
bull Sump Sump to store sufficient water for independent circulation through the unit for
experimentation and arranged within the floor space of the main unit
Before commissioning
bull Check whether all the joints are leak proof and water tight
bull
Fill the manometer to about half the height with mercurybull Close all the cocks pressure feed pipes and manometer to prevent damage and over
loading of the manometer
bull
Check the gauge glass and meter scale assembly of the measuring tank and see that it isfixed water height and vertically
bull Check proper electrical connections to the switch which is internally connected to the
motor
Experiments
bull The apparatus is primarily designed for conducting experiments on the coefficient of
discharge of flow meters Each flow meter can be connected to the manometer through
the pressure feed opening and the corresponding cocks
bull While taking readings close all the cocks in the pressure feed pipes except the two
(Down-stream and upstream) cocks which directly connect the manometer to the requiredflow meter for which the differential head is to be measured (Make sure while takingreading that the manometer is properly primed Priming is the operation offilling the manometer upper part and the connecting pipes with water andventing the air from the pipes)
bull First open the inlet gate valve of the apparatus Adjust the control valve kept at the exit
end of the apparatus to a desired flow rate and maintain the flow steadily
bull The actual discharge is measured with the help of the measuring tank The differential
head produced by the flow meter can be found from the manometer for any flow rate
7232019 MOFMOS LABpdf
httpslidepdfcomreaderfullmofmos-labpdf 747
Department of ANE MOFMOS LAB MANUAL
6
CALIBRATION OF VENTURIMETER
Aim - To calibrate a given venture meter and to study the variation of coefficient of dischargeof it with discharge
Apparatus - Venturimeter manometer stop watch experimental set-up
Procedure-1
Start the motor keeping the delivery valve close2 The water is allowed to flow through the selected pipe by selecting the appropriate ball
valve3
By regulating the valve control the flow rate and select the corresponding pressuretapings (ie of orifice meter)
4 Make sure while taking readings that the manometer is properly primed Priming is theoperation of filling the manometerrsquos upper part and the connecting pipes with water by
venting the air from the pipes Note down the difference of head ldquohrdquo from the manometerscale
5 Note down the time required for the rise of 10cm (ie 001m) water in the collecting tankby using stop watch Calculate actual discharge using below formulaDischarge - The time taken to collect some lsquoRrsquo cm of water in the collecting tank inmsup3sec
act
A x RQ =
t
Where A = area of the collecting tank in msup2 (03m X 03m)R = rise of water level taken in meters (say 01m or 10cm)
t = time taken for rise of water level to rise lsquoRrsquo inlsquotrsquo seconds6
Using difference in mercury level ldquohrdquocalculate the theoretical discharge of venturimeterby using following expression
1 2th
2 2
1 2
a xa 2gHQ =
a -a
Where
H= difference of head in meters =m
1 2 1 2
w
S(h -h ) x ( -1) = (h -h ) x 126 m
S
a1 = area of venturi at inlet =
2
1
4
d π
a2 = area of venturi at throat =
2
2
4
d π
g =Acceleration due to gravityd1 =Inlet diameter in meters d2 =Throat diameter in meters
7232019 MOFMOS LABpdf
httpslidepdfcomreaderfullmofmos-labpdf 847
Department of ANE MOFMOS LAB MANUAL
7
7 Calculate the coefficient of discharge of orifice meter (Cd)
act
theo
QCd=
Q
8 Repeat the steps 3 to 7 for different sets of readings by regulating the discharge valve
S NoVenturi inlet diameter
d1 Throat Diameter
d2
1 25mm 135 mm
S No Time for (10 cm)raise of water
level in sec
Actualdischarge =
Qa
Differential headin mm of mercury Theoretical
discharge = Qt Cd = Qq Qt
h1 h2 H
1
2
3
4
5
6 +
78
9
10
Precautions
bull Do not run the pump dry
bull Clean the tanks regularly say for every 15days
bull Do not run the equipment if the voltage is below 180V
bull
Check all the electrical connections before runningbull
Before starting and after finishing the experiment the main Control valve should be inclose position
bull Do not attempt to alter the equipment as this may cause Damage to the whole system
Results and Conclusions
7232019 MOFMOS LABpdf
httpslidepdfcomreaderfullmofmos-labpdf 947
Department of ANE MOFMOS LAB MANUAL
8
EXPERIMENT 2
ORIFICE METER TEST RIG
IntroductionAn ORIFICE METER is a simple device used for measuring the discharge through pipesThe basic principle on which an Orifice meter works is that by reducing the cross ndash sectionalarea of the flow passage a pressure difference between the two sections before and after Orificeis developed and the measure of the pressure difference enables the determination of thedischarge through the pipe However an Orifice meter is a cheaper arrangement for dischargemeasurement through pipes and its installation requires a smaller length as compared withVenturi Meter As such where the space is limited the Orifice meter may be used for themeasurement of discharge through pipes
General Description
The apparatus consists of (1) Orifice meter (2) Piping system (3) supply pump set (4) Measuringtank (5) Differential manometer (6) Sump
Constructional Specification
bull Flow Meters Consists of Orifice meter of size 25 mm provided for experiments The
meter has the adequate cocks also with them
bull Piping System Consists of a set of GI piping of size 25 mm with sufficient upstream
and downstream lengths provided with separate control valves and mounted on a suitablestand Separate upstream and downstream pressure feed pipes are provided for themeasurement of pressure heads with control valves situated on a common plate for easy
operation
bull Supply Pump Set Is rigidly fixed on sump The mono block pump with motor
Operating on single phase 220240 volts 50 Hz AC supply
bull Measuring Tank Measuring tank with gauge glass and scale arrangement for quick and
easy measurement
bull Differential Manometer Differential manometer with 1 mm scale graduations to
measure the differential head produced by the flow meter
bull
Sump Sump to store sufficient water for independent circulation through the unit forexperimentation and arranged within the floor space of the main unit
Before Commissioning
bull Check whether all the joints are leak proof and water tight
bull Fill the manometer to about half the height with mercury
bull Close all the cocks pressure feed pipes and manometer to prevent damage and over
loading of the manometer
7232019 MOFMOS LABpdf
httpslidepdfcomreaderfullmofmos-labpdf 1047
Department of ANE MOFMOS LAB MANUAL
983097
bull Check the gauge glass and meter scale assembly of the measuring tank and see that it is
fixed water tight and vertically
bull
Check proper electrical connections to the switch which is internally connected to themotor
Experiments
bull
The apparatus is primarily designed for conducting experiments on the coefficient ofdischarge of flow meters Each flow meter can be connected to the manometer throughthe pressure feed opening and the corresponding cocks
bull
While taking readings close all the cocks in the pressure feed pipes except the two(Down-stream and upstream) cocks which directly connect the manometer to the requiredflow meter for which the differential head is to be measured (Make sure while takingreading that the manometer is properly primed Priming is the operation of filling themanometer upper part and the connecting pipes with water and venting the air from the
pipes)
bull
First open the inlet gate valve of the apparatus Adjust the control valve kept at the exitend of the apparatus to a desired flow rate and maintain the flow steadily
bull
The actual discharge is measured with the help of the measuring tank The differentialhead produced by the flow meter can be found from the manometer for any flow rate
7232019 MOFMOS LABpdf
httpslidepdfcomreaderfullmofmos-labpdf 1147
Department of ANE MOFMOS LAB MANUAL
10
CALIBRATION OF ORIFICE METER
Aim - To calibrate a given Orifice meter and to study the variation of coefficient of discharge ofit with discharge
Apparatus -Orifice meter manometer stop watch experimental set-up
Procedure-1
Start the motor keeping the delivery valve close2
The water is allowed to flow through the selected pipe by selecting the appropriate ballvalve
3 By regulating the valve control the flow rate and select the corresponding pressuretapings (ie of orifice meter)
4 Make sure while taking readings that the manometer is properly primed Priming is theoperation of filling the manometerrsquos upper part and the connecting pipes with water byventing the air from the pipes Note down the difference of head ldquohrdquo from the manometer
scale5 Note down the time required for the rise of 10cm (ie 001m) water in the collecting tank
by using stop watch Calculate actual discharge using below formula
Discharge - The time taken to collect some lsquoRrsquo cm of water in the collecting tank in msup3sec
act
A x RQ =
t
Where A = area of the collecting tank in msup2 (03m X 03m)R = rise of water level taken in meters (say 01m or 10cm)t = time taken for rise of water level to rise lsquoRrsquo in lsquotrsquo seconds
6
Using difference in mercury level ldquohrdquo calculate the theoretical discharge of venturimeterby using following expression
1 2th
2 2
1 2
a xa 2gHQ =
a -a
Where
H= difference of head in meters =m
1 2 1 2
w
S(h -h ) x ( -1) = (h -h ) x 126 m
S
a1 = area of orifice at inlet =
2
1
4
d π
a2 = area of orifice at inlet =
2
2
4
d π
g =Acceleration due to gravityd1 =Inlet diameter in meters d2 =Throat diameter in meters
7 Calculate the coefficient of discharge of orifice meter (Cd)
7232019 MOFMOS LABpdf
httpslidepdfcomreaderfullmofmos-labpdf 1247
Department of ANE MOFMOS LAB MANUAL
11
act
theo
QCd=
Q
8
Repeat the steps 3 to 7 for different sets of readings by regulating the discharge valve
S No Orifice inlet diameterd1
Orifice diameterd2
1 25mm 130
S NoTime for (10 cm)
raise of water
level in sec
Actualdischarge =
Qa
Differential head inmm of mercury Theoretical
discharge = Qt
Cd = Qa Qt
h1 h2 H
1
2
3
4
5
6
7
8
9
10
Calculation-
Precautions-
bull Do not run the pump dry
bull Clean the tanks regularly say for every 15days
bull Do not run the equipment if the voltage is below 180V
bull
Check all the electrical connections before running
bull
Before starting and after finishing the experiment the main
7232019 MOFMOS LABpdf
httpslidepdfcomreaderfullmofmos-labpdf 1347
Department of ANE MOFMOS LAB MANUAL
12
bull Control valve should be in close position
bull Do not attempt to alter the equipment as this may cause
bull Damage to the whole system
Results and Conclusions-
EXPERIMENT 3
PIPE FRICTION APPARATUS
Introduction
A pipe may be of various diameters and may have bends valves etc When a liquid isflowing through such pipes the velocity of the liquid layer adjacent to the pipe wall is zero Thevelocity of the liquid goes on increasing from the wall and hence shear stresses are produced inthe liquid due to viscosity This viscous action causes loss of energy which is usually known asFrictional loss
Here we are going to consider two important losses that occur during flow
bull
Major Losses
bull
Minor Losses
7232019 MOFMOS LABpdf
httpslidepdfcomreaderfullmofmos-labpdf 1447
Department of ANE MOFMOS LAB MANUAL
13
bull Major losses occur due to friction This friction may be due to viscosity or roughness in
the pipe
bull
Minor losses can be due to various reasons such as Inlet and Outlet of the pipe bendsgates sudden expansions and contractions The apparatus is designed to study the friction
losses that appear in long pipes and the obstructions that are encountered in the way offlow by various types of fittings
General DescriptionThe unit consists mainly of 1) Piping System 2) Measuring Tank 3) Differential Manometer 4)Supply pump set 5) Sump
bull Constructional Specification
bull Piping System Piping System of size 127 mm 20 mm and 20 mm (SS) dia With
tapings at 1 meter distance and a flow control valve
bull
Measuring Tank Measuring tank is provided to measure the discharge of water fromthe unit
bull Differential Manometer Differential manometer with 1 mm scale graduations to
measure the loss of head in the pipe line
bull Supply Pump Set Supply pump set is rigidly fixed on the sump The pump set is mono
block pump with 05 HP motor operating on single phase 220 volts 50 Hz AC supply
bull Sump Sump is provided to store sufficient waters for independent circulation through
the unit for experimentation and arranged within the floor space of the main unit
Before Commissioning
bull
Check whether all the joints are leak proof and watertight
bull
Close all the cocks on the pressure feed pipes and Manometer to prevent damage andoverloading of the manometer
bull Check the gauge glass and meter scale assembly of the measuring tank and see that it is
fixed water tight and vertical
bull
Check proper electrical connections to the switch which is internally connected to themotor
Experiments
bull
The apparatus is primarily designed for conducting experiments on the frictional losses inpipes of different sizes Three different sizes of pipes are provided for wide range ofexperiments Each individual pipe can be connected to the Manometer through thepressure feed pipes having individual quick operating cocks
bull
While taking reading close all the cocks in the pressure feed pipe except the two (upstream and downstream) cocks which directly connect the manometer to the requiredpipe for which the loss in head has to be determined (Make sure while taking readings
7232019 MOFMOS LABpdf
httpslidepdfcomreaderfullmofmos-labpdf 1547
Department of ANE MOFMOS LAB MANUAL
14
that the manometer is properly primed Priming is the operating of filling the Manometerupper part and the connecting pipes with water venting the air from the pipes)
bull First open the inlet gate valve of the apparatus Adjust the control valve kept at the exit
end of the apparatus to a desired flow rate and maintain the flow steadily
bull
The actual discharge is measured with the help of the measuring tank For each size ofthe pipe the area of cross section of flow can be calculated from the known diameter ofthe pipes From these two valves and the average velocity of stream through the pipe canbe calculated
bull The actual loss of head is determined from the Manometer readings The frictional loss of
head in pipes is given by the Darcys formulaThe friction coefficient indicates f
7232019 MOFMOS LABpdf
httpslidepdfcomreaderfullmofmos-labpdf 1647
Department of ANE MOFMOS LAB MANUAL
15
FRICTION FACTOR FOR A GIVEN PIPE LINE
Aim - To calculate the friction factor for a given pipe line
Apparatus - experimental set-up stop watch
Procedure-
1 Start the motor keeping the delivery valve close2
The water is allowed to flow through the selected pipe by selecting the appropriateball valve
3 By regulating the valve control the flow rate and select the corresponding pressuretapings
4
Make sure while taking readings that the manometer is properly primed Priming isthe operating of filling the Manometer upper part and the connecting pipes with waterventing the air from the pipes Note down the loss of head ldquohfrdquo from the manometerscale
5
Note down the time required for the rise of 10cm (ie 01m) water in the collectingtank by using stop watch Calculate discharge using below formula
Discharge - The time taken to collect some lsquoxrsquo cm of water in the collecting tank in msup3sec
A x RQ =
t
A = area of the collecting tank in msup2 (03m X 03m)R = rise of water level taken in meters (say 01m or 10cm)t = time taken for rise of water level to rise lsquorrsquo in lsquotrsquo seconds
6 Calculate the velocity of the jet by following formula
V = Discharge = Q A msecArea of the pipe
A = cross sectional area of the pipe=Πdsup2 4d = pipe diameter
7 Calculate the coefficient of friction for the given pipe by fLvsup2
hf = ---------ρgd
Wherehf - Loss of head of water = (h1-h2)(Sn So ndash 1) = (h1-h2) 1261000 m
f - Co-efficient of friction for the pipeL - Discharge between sections for which loss of head is measured (1 meter)v - Average velocity of flow in msecg - Acceleration due to gravity 981msecd - Pipe diameter in meters
8 Repeat the steps 2 to 7 for different sets of readings by regulating the discharge valve
7232019 MOFMOS LABpdf
httpslidepdfcomreaderfullmofmos-labpdf 1747
Department of ANE MOFMOS LAB MANUAL
16
Tabular Form
S No Oslash of pipeArea(a)
Time forrise of 10cm water
Discharge VelocityLoss ofHead
hf
Co-efficientof friction
f
Calculation-
bull Total Head H
H = (h1 + h2) x 126 m of waterWhere
126 = conversion factor from mercury to water head
bull
Discharge Q
WhereA = Area of collecting tank = 0125 msup2R = Rise in water level of the collecting tank cm
t = time for lsquoRrsquo cm rise of water sec100 = Conversion from cm to m
bull
Velocity V
msWhere Arsquo = area of the pipefitting in use
7232019 MOFMOS LABpdf
httpslidepdfcomreaderfullmofmos-labpdf 1847
Department of ANE MOFMOS LAB MANUAL
17
bull
Friction Factor(Major Losses) F
Where H = total head m of waterV = velocity mg = acceleration due to gravity 981mssup2L = Distance bw tapping = 15m
bull
Head Loss Due To Fittings (Minor Losses) K
Where H = total head m of waterV = velocity mg = acceleration due to gravity 981mssup2
Precautions
1) Do not run the pump dry2)
Clean the tanks regularly say for every 15days3)
Do not run the equipment if the voltage is below 180V4) Check all the electrical connections before running5) Before starting and after finishing the experiment the main control valve should be in
close position6) Do not attempt to alter the equipment as this may cause damage to the whole system
Results and Conclusions
7232019 MOFMOS LABpdf
httpslidepdfcomreaderfullmofmos-labpdf 1947
Department of ANE MOFMOS LAB MANUAL
18
EXPERIMENT 4
BERNOULLIrsquoS EXPERIMENTIntroduction
Bernoullirsquos Theorem gives the relationship between pressure head velocity head and thedatum Here the attempt has been made to study the relationship of the above said parametersusing venturimeter
General Description
bull The apparatus consists of a specially fabricated clear ACRYLIC Venturimeter
with necessary tappings connected to a Multibank Piezometer also made of clearACRYLIC
bull
The apparatus consists of two overhead tanks interconnected with the venturimeterwhich is placed in between the tanks
bull The overhead tanks are provided with the Head variation mechanism for conducting
the experiments at various heads
bull
Water in the sump tank is pumped using a Monobloc Centrifugal pump (Kirloskarmake) which passes through the control valve to the overhead tank
bull The height of the water in the collecting tank is measured using the acrylic
Piezometer to find the flowrate
bull The whole arrangement is mounted on an aesthetically designed sturdy frame
made of MS tubes and NOVAPAN Board with all the provisions for holding thetanks and accessories
Aim
o
The experiment is conducted too
Study of Pressure Gradient at different zoneso
Verification of Bernoullis Equationo
Comparative analysis under different flow rates
Apparatus
1) Venturimeter 2)Piezometer 3) Overhead Tank 4)Sump Tank 5) Centrifugal Pump
Procedure
1) Fill in the sump tank with clean water2)
Keep the delivery valve closed3)
Check and give necessary electrical connections to the system4) Switch on the pump amp Slowly open the delivery valve5)
Adjust the flow through the control valve of the pump6)
Allow the system to attain the steady state ie let the water pass from the secondoverhead tank to the collecting tank
7) Note down the Pressure head at different points of the venture meter on the multi-tubepiezometer (Expel if any air is the by inserting the thin pin into the piezometer openings)
8) Close the ball valve of the collecting tank and measure the time for the known rise ofwater
7232019 MOFMOS LABpdf
httpslidepdfcomreaderfullmofmos-labpdf 2047
Department of ANE MOFMOS LAB MANUAL
1983097
9) Change the flow rate and repeat the experiment
Observation
SlNo
Static Head Loss h Time for lsquoRrsquo
cm rise in waterlsquoTrsquo sec1 2 3 4 5 6 7 8 9 10
1
2
3
4
5
Calculations1
Discharge QA2
Where
A = Area of collecting tank = 0045 msup2R = Rise in water level of the collecting tank cmt = time for lsquoRrsquo cm rise of water sec100 = Conversion from cm to m
3 Pressure Head
Where
ρ = density of waterg = gravitational constanth = head measured m of water column
3 Velocity Head
WhereV = Q a a = Area at the particular section of the venturimeter msup2
4 Verification of BERNOULLIrsquoS EQUATIONBernoullirsquos Equation is given as
After findinga Pressure Head hb
Velocity headat different cross-section of the Venturimeter
7232019 MOFMOS LABpdf
httpslidepdfcomreaderfullmofmos-labpdf 2147
Department of ANE MOFMOS LAB MANUAL
20
Put the same in the above equation for different points and verify whether all the values obtainedare sameNote Consider the datum z to be constant
Precautions
bull
Do not run the pump drybull
Clean the tanks regularly say for every 15days
bull
Do not run the equipment if the voltage is below 180V
bull
Check all the electrical connections before running
bull Before starting and after finishing the experiment the main
bull Control valve should be in close position
bull Do not attempt to alter the equipment as this may cause
bull
Damage to the whole system
Result and Conclusion
7232019 MOFMOS LABpdf
httpslidepdfcomreaderfullmofmos-labpdf 2247
Department of ANE MOFMOS LAB MANUAL
21
EXPERIMENT 5
CALIBRATION OF A TRIANGULAR NOTCH
AIM -To find the coefficient of discharge of given triangular notch
THEORY-A notch is a device used for measuring the rate of flow of liquid through a smallchannel or a tank It may be defined as an opening in the side of a tank or small channel in suchthat a way that the liquid surfaces in the tank or channel is below the top edge of the opening
NOTCHES ARE CLASSIFIED AS-1 Rectangular notch2 Triangular notch3 Trapezoidal notch
4 Stepped notch
A triangular notch is preferred to a rectangular notch due to the following reasonsThe expression for discharge of triangular notch is compared to rectangular notch is simple Formeasuring low discharge a triangular notch gives more accurate results than a rectangular notchIn the case of triangular notch only H is required for the computation of dischargeA trapezoidal notch is a combination of rectangular and triangular notch and thus the dischargethrough trapezoidal notch is the sum of above notchesA stepped notch is a combination of rectangular notch and triangular notch The dischargethrough the stepped notch is equal to sum of discharges through the different rectangularnotches
DESCRIPTION- The apparatus consists of1) Measuring tank 2) Sump tank3) Supply pump set 4) Inlet and out let valve
Measuring tank Stainless steel tank of size 030305mm height with the gage glass a scalearrangement for quick and easy measurements A ball valve is provided to empty the tank and adrain is provided at the bottom of the tank to drain the waste water when the unit is not in useWater for independent circulation through the unit for experimentation and arranged within thefloor space of the main unitSump tank The sump tank is a size of 020303m stainless steel tank to store sufficient waterfor independent circulation through the unit for experimentation and arranged within the floorspace of the main unit about 060305m with a gauge glass and scale arrangement A ballvalve is provided to empty the tankSupply Pump set The pump is 2525mm size mono block with frac12 HP 2880 RPM singlephase 220volts AC supply Inlet and out let valve- These valves are used to control the flow ofwater at inlet and out let
PROCEDURE1 Allow the water to drain up to triangular notch
7232019 MOFMOS LABpdf
httpslidepdfcomreaderfullmofmos-labpdf 2347
Department of ANE MOFMOS LAB MANUAL
22
2 Note down the depth of the water when the water is coinciding with the v notch point
3 Collect water in collecting tank and close the drain valve and find the time taken for the rise ofwater up to 20cm
4 Calculate the discharge by using the above results
5 Now substituting the values in the formula for calculation of discharge for v- notch gives therequired result
Precautionsbull Do not run the pump dry
bull Clean the tanks regularly say for every 15days
bull Do not run the equipment if the voltage is below 180V
bull Check all the electrical connections before running
bull
Before starting and after finishing the experiment the main
bull
Control valve should be in close position
bull
Do not attempt to alter the equipment as this may cause
7232019 MOFMOS LABpdf
httpslidepdfcomreaderfullmofmos-labpdf 2447
Department of ANE MOFMOS LAB MANUAL
23
bull Damage to the whole system
Result and Conclusion
7232019 MOFMOS LABpdf
httpslidepdfcomreaderfullmofmos-labpdf 2547
Department of ANE MOFMOS LAB MANUAL
24
MECHANICSOF SOLIDS
LAB
7232019 MOFMOS LABpdf
httpslidepdfcomreaderfullmofmos-labpdf 2647
Department of ANE MOFMOS LAB MANUAL
25
7232019 MOFMOS LABpdf
httpslidepdfcomreaderfullmofmos-labpdf 2747
Department of ANE MOFMOS LAB MANUAL
983089
IZOD IMPACT TEST
AIM To perform the izod impact test on materials
APPARATUS Izod impact test machine test specimen vernier calipers steel rule
IMPACT STRENGTH The resistance of a material to fracture under sudden load application
MATERIALS Two types of test pieces are used for this test as given
1) Square cross-section
2) Round cross-section
THEORY The type of test specimen used for this test is a Square Cross-section
The specimen may have single two or three notches The testing machine shouldhave the following specifications The angle between top face of grips and face holding the specimen Vertical=900 the angle of tip of hammer =750plusmn10
The angle between normal to the specimen and underside face of the hammer at Striking point=100plusmn10
Speed of hammer at impact=399msecStriking energy=168N-m or Joules Angle
Of drop of pendulum =900 Effective
weight of pendulum=2179kg
Minimum value of scale graduation=2 Joules
Permissible total friction loss of corresponding energy=050
Distance from the axis of rotation of distance between the base of specimen notch andthe point of specimen hit by the hammer=22mmplusmn05mm
The longitudinal axes of the test piece shall lie in the plane of swing of the center ofgravity of the hammer The notch shall be positioned so that its in the plane of thehammer the notch shall be positioned its plane of symmetry coincides with the top faceof the grips for setting the specimen the notch impact strength I is calculated accordingto the following relation
Where I= impact strength in joulesm2
7232019 MOFMOS LABpdf
httpslidepdfcomreaderfullmofmos-labpdf 2847
Department of ANE MOFMOS LAB MANUAL
983090
PROCEDURE
1 For conducting Izod test a proper striker is to be fitted firmly to the bottom of thehammer with the help of the clamming piece
2 The latching take for izod test is to be firmly fitted to the bearing housing at the side of
the columns3 The frictional loss of the machine can be determined by free fall test raise the
hammer by hands and latch in release the hammer by operating lever the pointer will
then indicate the energy loss due to friction From this reading confirm that the friction
loss is not exceeding 05 of the initial potential energy Otherwise frictional loss has to
be added to the final reading
4 The specimen for izod test is firmly fitted in the specimen support with the help ofclamping screw and eacutelan key Care should be taken that the notch on the specimenshould face to pendulum striker
5 After ascertaining that there is no person in the range of swinging pendulum release the
pendulum to smash the specimen6 Carefully operate the pendulum brake when returning after one swing to stop the oscillations
7 Read-off position of reading pointer on dial and note indicated value
8 Remove the broken specimen by loosening the clamping screw
The notch impact strength depends largely on the shape of the specimen and the notch the
values determined with other specimens therefore may not be compared with each other
OBSERVATION TABLE
S No A(Area of cross K Impact energy I Impact Strength
section of observed
specimen)
RESULT
7232019 MOFMOS LABpdf
httpslidepdfcomreaderfullmofmos-labpdf 2947
Department of ANE MOFMOS LAB MANUAL
983091
Calculation Part
7232019 MOFMOS LABpdf
httpslidepdfcomreaderfullmofmos-labpdf 3047
Department of ANE MOFMOS LAB MANUAL
983092
ROCKWELL HARDNESS TEST
AIM To determine the Rockwell hardness of the given test specimen
APPARATUS Rockwell hardness testing machine test specimen
THEORY
Hardness-the resistance of a metal to plastic deformationagainst indentation scratching abrasion or cutting
The depth of penetration of the indenter measures the hardness of a material by this Rockwell ‟s hardness test method the depth of penetration is inversely
proportional to the hardness Both ball or diamond cone types of indenters are used inthis testThere are three scales on the machine for taking hardness readings
Scale bdquoA‟ with load 60kgf or 5888N and diamond indenter is used for performing tests on steel and shallow case hardened steel
Scale bdquoB‟ with load 100kgf or 9807 N and 1588mm dia ball indenter is used forperforming tests on soft steel malleable iron copper and aluminum alloys
Scale bdquoC‟ with load 150kgf or 1471 N and diamond indenter is used for performing testson steel hard cost steel deep case hardened steel other metals which harder
First minor load is applied to overcome the film thickness on the metal surfaceMinor load also eliminates errors in the depth of measurement due to spring of themachine frame or setting down of the specimen and table attachments
The Rockwell hardness is derived from the measurement of the depth of theimpression This method of test is suitable for finished or machined parts of simpleshapes
PROCEDURE
1 Select the load by rotating the nob and fix the suitable indenter
2 Clean the test piece and place on the special anvil or worktable of the machine
3 Turn the capstan wheel to evaluate the test specimen into contact with the indenterpoint
4 Further turn the wheel for three rotations forcing the test specimen against theindenter This will ensure the minor load has been applied5 Set the pointer on the scale dial at the appropriate position
7232019 MOFMOS LABpdf
httpslidepdfcomreaderfullmofmos-labpdf 3147
Department of ANE MOFMOS LAB MANUAL
983093
6 Push the lever to apply the major load A dash pot provided in the loading mechanismto ensure that the load is applied gradually
7 As soon as the pointer comes to rest pull the handle in the reverse direction slowlyThis releases the major but not the minor load The pointer will now rotate in the reversedirection
8 The Rockwell hardness can read off the scale dial on the appropriate scale after thepointer comes to rest
OBSERVATIONS
Material of the specimen =
Thickness of test specimen =
Hardness scale used =
Test Material Rockwell Scale of weights Rockwell number Average
no Rockwell
no
Scale weight indent 1 2 3
PRECAUTIONS
1 For testing cylindrical test specimens use V-type platform
2 Calibrate the machine occasionally by using standard test blocks
3 For thin metal prices place another sufficiently thick metal piece between the testspecimen and the platform to avoid any damage which may likely occur to the platform
4 After applying major load wait for some time to allow the needle to come to restThe waiting time may vary from 2 to 8 seconds
7232019 MOFMOS LABpdf
httpslidepdfcomreaderfullmofmos-labpdf 3247
Department of ANE MOFMOS LAB
MANUAL
983094
5 The surface of the test piece should be smooth and even and free from oxidescale and foreign matter6 Test specimen should not be subjected to any heating of cold working
7 The distance between the centers of two adjacent indentation should be at least 4
Times the diameter of the indentation and the distance from the center of any indentation tothe edge of the test piece should be at least 25 times the diameter of the indentation
RESULT
7232019 MOFMOS LABpdf
httpslidepdfcomreaderfullmofmos-labpdf 3347
Department of ANE MOFMOS LAB MANUAL
983095
Calculation Part
7232019 MOFMOS LABpdf
httpslidepdfcomreaderfullmofmos-labpdf 3447
Department of ANE MOFMOS LAB MANUAL
983096
BRINELLrsquoS HARDNESS TEST
AIM To determine the Brinell hardness of the given test specimen
APPARATUS Brinell hardness machine test specimen Brinells Microscope
THEORY
Indentation Hardness-A number related to the area or to the depth of
the impression made by an indenter or fixed geometry under a known fixed load
This method consists of indenting the surface of the metal by a hardened steel
ball of specified diameter D mm under a given load F kgf and measuring the average
diameter d mm of the impression with the help of Brinell microscope fitted with a scaleThe Brinell hardness HB is defined as the quotient of the applied force F divided by the
spherical area of the impression
HB= Test load in kgfsurface area of indentation
=2F πD (D- D2- d2) kgmm2
PROCEDURE
1 Select the proper size of the ball and load to suit the material under test2 Clean the test specimen to be free from any dirt and defects or blemishes
3 Mount the test piece surface at right angles to the axis of the ball indenter plunger
4 Turn the platform so that the ball is lifted up
5 By shifting the lever applies the load and waits for some time
6 Release the load by shifting the lever
7 Take out the specimen and measure the diameter of indentation by means of theBrinell microscope8 Repeat the experiments at other positions of the test piece
9 Calculate the value of HB
7232019 MOFMOS LABpdf
httpslidepdfcomreaderfullmofmos-labpdf 3547
Department of ANE MOFMOS LAB MANUAL
983097
OBSERVATIONS
Test piece material = Diameter of the ballrdquo D ldquo =
Load section FD2 = Test load =
Load application time =
Least count of Brinell Microscope =
Diameter Average
Impression F D HB
S No in kg in mm Kgmm2
(d1) (d2) (d1+d2)2
PRECAUTIONS
1 The surface of the test piece should be clean
2 The testing machine should be protected throughout the test from shock or vibration
3 The test should be carried out at room temperature
4 The distance of the center of indentation from the edge of test piece should be at
least 25 times the diameter of the indentation and the distance between the center ofthe two adjacent indentations should be at least 4 times the diameter of the indentation
5 The diameter of each indentation should be measured in two directions at rightangles and the mean value readings used the purpose of determining the hardnessnumber
7232019 MOFMOS LABpdf
httpslidepdfcomreaderfullmofmos-labpdf 3647
Department of ANE
MOFMOS LAB MANUAL
983089983088
RESULT
Calculation Part
7232019 MOFMOS LABpdf
httpslidepdfcomreaderfullmofmos-labpdf 3747
Department of ANE MOFMOS LAB MANUAL
983089983089
SPRING TEST
AIM To determine the rigidity modulus of the spring
APPARATUS Spring testing machine vernier calipers spring specimen
THEORY
Closed coiled helical springs are the springs in which helix angle is very small or inother words the pitch between two adjacent turns is small A closed coiled helical springcarrying an axial load is shown in fig
As helix angle in case of close coiled helical springs are small hence the bendingeffect on the spring is ignored and we assume that the coils of close coiled helical
springs are to stand purely tensional stresses Let d=diameter ofthe spring wire
P= pitch of the helical spring N= number ofcoils R= mean radius of the spring coil
W=axial load on spring C=modulus of rigidity
τ=maximum shear stress induced in the wire θ=angle of twist in the
spring wire and
x= deflection of spring due to axial load l= length of wire
Net twisting moment on the wire T=WR
But twisting moment is also given by T= (π 16) τd3
From 1 ad 2 WR = (π 16) τd3 τ=16WR πd
3
above equation which gives the maximum shear stress induced in the wire (1) Length of one coil=2πR
Total length of the wire=2πRn (2)
Strain energy stored by the spring due to torsion
U= (τ 4C) [(π 4)d 2πRn] (3)
Work done on the spring =average load x deflection
= (12) Wx (4)
Equating 3 and 4
(12) Wx = (32W2R3n)Cd4
7232019 MOFMOS LABpdf
httpslidepdfcomreaderfullmofmos-labpdf 3847
Department of ANE MOFMOS LAB MANUAL
983089983090
x=64WR3nCd
4
Rigidity modulus of the spring
C=64WR3nxd
4
PROCEDURE
1) Consider the spring and find out itsmean coil radius R with the help ofvernier calipers
2) Find the diameter of the spring andnumber of turns
3) Fix the spring between two hooks
4) Now load is gradually applied
5) Note the deflection from thedeflection scale for different loadsapplied
6) Calculate the rigidity modulus usingabove formula
PRECAUTIONS
1) Dimensions should be measureaccurately with the help of verniercalipers
2) Deflection from the scale should benoted carefully and accurately
OBSERVATION TABLE
Sno Load applied deflection Rigidity modulus
C
Average rigidity modulus C =
RESULT
7232019 MOFMOS LABpdf
httpslidepdfcomreaderfullmofmos-labpdf 3947
Department of ANE MOFMOS LAB MANUAL
983089983091
Calculation Part
7232019 MOFMOS LABpdf
httpslidepdfcomreaderfullmofmos-labpdf 4047
Department of ANE MOFMOS LAB MANUAL
983089983092
TORSION
AIM To conduct torsion test on mild steel or cast iron specimen to find modulus of rigidity or to find angle of twist of the materials which are subjected to torsion
APPARATUS 1 A torsion test machine along with angle of twist measuring attachment
2 Standard specimen of mild steel or cast iron
3 Steel rule
4 Vernnier caliper or a micrometer
THEORY
For transmitting power through a rotating shaft it is necessary to apply a turning
force The force is applied tangentially and in the plane of transverse cross section The
torque or twisting moment may be calculated by multiplying two opposite turningmoments It is said to be in pure torsion and it will exhibit the tendency of shearing off at
every cross section which is perpendicular to the longitudinal axis
Torsion equation
Torsion equation is given by below
T IP = CθL = TR
T= maximum twisting torque (Nmm) IP =
polar moment of inertia (mm4) τ =shear
stress (Nmm2) C=modulus of rigidity (Nmm2)
θ=angle of twist in radians L=length of shaft under torsion (mm)
Assumptions made for getting torsion equation
1 The material of the shaft is uniform through out
2 The shaft circular in section remain circular after loading
3 Plane sections of shaft normal to its axis before loading remain plane after thetorque have been applied
4 The twist along the length of the shaft is uniform throughout
5 The distance between any two normal-sections remains the same after theapplication of torque
6 Maximum shear stress induced in the shaft due to application of torque does notexceed its elastic limit
7232019 MOFMOS LABpdf
httpslidepdfcomreaderfullmofmos-labpdf 4147
Department of ANE MOFMOS LAB MANUAL
983089983093
PROCEDURE
1 Select the suitable grips to suit the size of the specimen and clamp it in themachine by adjusting sliding jaw
2 Measure the diameter at about the three places and take average value
3 Choose the appropriate loading range depending upon specimen
4 Set the maximum load pointer to zero
5 Carry out straining by rotating the hand wheel or by switching on the motor
6 Load the members in suitable increments observe and record strain reading
7 Continue till failure of the specimen
8 Calculate the modulus of rigidity C by using the torsion equation
9 Plot the torque ndashtwist graph (T Vs θ)
OBSERVATIONS
Gauge length L =
Polar moment of inertia IP =
Modulus of rigidity C =TL IP θ =
SNo Twisting Moment Angle of Twist Modulus Average
Kgf Nm Degrees Radians of rigidity CNmm2
C
RESULT
7232019 MOFMOS LABpdf
httpslidepdfcomreaderfullmofmos-labpdf 4247
Department of ANE MOFMOS LAB MANUAL
983089983094
TENSILE TEST
AIM
To conduct tensile test on a mild steel specimen and determine the following
1 Limit of proportionality 2 Elastic Limit
3 Upper yield point 4 Lower yield point
5 Ultimate strength 6 Fracture strength
7 Young`s Modulus 8 Percentage elongation
9 Percentage reduction in area 10 Ductility
11 Toughness 12 True stress amp true strain
13 Malleability
APPARATUS tensile testing machine specimen steel rule vernier caliper micrometer
THEORY
The tensile test is most applied one of all mechanical tests In this test a test specimen is fixed
into grips connected to a straining device and to a load-measuring device (One end in stationary
grips and the other in movable grips) If the applied load is small enough the deformation of any
solid body is entirely elastic An elastically deformed solid will return to its original form as soon
as load is removed However if the load is too large the material can be deformed permanently
The initial part of the tension curve which represents the manner in which solid undergoes
plastic deformation is termed as plastic The stress below which the deformation is essentially
entirely elastic is known as the elastic limit of the material In some materials like mild steel a
sudden drop in load indicating both an upper and lower yield point denotes the onset of plastic
deformation However some materials do not exhibit a sharp yield point During plastic
deformation at lager extensions strain hardening cannot compensate for the decrease in section
and thus the load passes through a maximum and then begins to decrease At this stage the
ultimate strength which is defined as the ration of the load on the specimen to the original cross-section area reaches a maximum value Until this point the deformation is uniform at all the
sections of the specimen Further loading will eventually cause bdquoneck ‟ formation and rupture
follows
7232019 MOFMOS LABpdf
httpslidepdfcomreaderfullmofmos-labpdf 4347
Department of ANE MOFMOS LAB
MANUAL
983089983095
Usually a tension test is conducted at room temperature the tensile load is applied
slowly During this test either round or flat specimens may be used The load on the specimen is
applied mechanically or hydraulically depending on the type of testing machine
1 NominalEngg stress and NominalEngg strain
Original CS area = A0 (mm2)
Original gauge length = L0 (mm) Increase in gauge length = δL0
Nominal stress = PA0 (N mm2)
Nominal strain = δL0 L0
2 Limit of Proportionality Stress is proportional to strain up to this pointNormal Stress = PA PO Normal Strain = (δ LO) ALO
3 Elastic limit When the load is removed at ldquoBrdquo the specimen will go back to originalDimensions ie LO and δ AO Nominal stress = PB AO Normal Strain = (δ LO) B LO
If the specimen is loaded beyond elastic limit it will undergo permanent strainie Plastic deformation
4 Upper yield point Nominal stress = PC AO Nominal strain = (δ LO) D LO
5 Lower yield point Nominal stress = PD AO
Nominal strain = (δ LO) D LO 6 Ultimate load or maximum load point
Nominal ultimate stress = PE AO Nominal strain = (δ LO) E LO
7 Fracture Load point F
Nominal fracture stress = PF AO
Nominal strain at fracture = (δ LO) F LO
8 Young`s modulus (E) Young`s modulus (E) = StressStrain
(In the elastic region limit of proportionality = Nominal stress at ANominal strain at A 9Modulus of resilience = (Nominal stress at elastic limit)
2 2E
Area under Engg Stress - Strain diagram up to elastic limit10 Resilience = Modulus of Resilience x Volume of specimen undergoing Tensile stress
7232019 MOFMOS LABpdf
httpslidepdfcomreaderfullmofmos-labpdf 4447
Department of ANE MOFMOS LAB MANUAL
983089983096
11 Yield point ElongationElongation taking place in the specimen from C to D this istaking place without increase in stress
12 Modulus of toughnessArea under engineering stress ndash strain diagram up to fracture13 Toughness = Modulus of toughness x Volume of specimenThis indicates theamount of energy absorbed by the specimen before fracture take place
14 Ductility= (Final length at fracture ndash original length 10) x 100
15 MalleabilityIt is the ability of the material to undergo plastic deformation prior fracture under compressive loading conditions In a tensile test it is approximatedas percentage reduction in cross sectional area of the specimen Malleability =
(AO - Af )AO) x 100
True stress ndash true strain diagram
Engineering stress is calculated based on original cross sectional area (AO) But not on the actual cross sectional area at load bdquoP‟
True stress = PA = PAO x AO A
Since volume remains constant during plastic deformation we have AO LO = AL True stress = PAO x L LO
= PAO x ((LO + δLO) LO)
= P (1+e)= Nominal stress (1+ nominal strain)
True strain = Є = 1n (1+e)
These relations are valid up to ultimate load ie up to which the strain isuniform all along the gauge length
1 True Stress at upper yield point = Nominal stress at upper yield point ( 1+e O)True strain at C = 1n (1+eo)
2 True stress at ultimate load (E1)= Nominal ultimate stress ( 1+eE)True strain at ultimate load = 1n (1+eE)
3 True stress at fracture (E1) = Pf Af
Where Af is the area of cross section at fracture can be measured True
strain at fracture = 1n (Ao Af )
Area relation is taken instead of lengths because the strains are localized in theregion between ultimate load point and fracture point
4 Strain Hardening
From lower yield point onwards increase in load is required for increase instrain Thus the stress required for further deformation is more Thisphenomenon is called strain hardening
5 True ndash stress ndash true strain curve in log ndash log co ndash ordinates
When the true ndash stress and true ndash strain are plotted on log ndash log co ndash ordinates thecurve is a straight line
7232019 MOFMOS LABpdf
httpslidepdfcomreaderfullmofmos-labpdf 4547
Department of ANE MOFMOS LAB MANUAL
983120983137983143983141 983089983097 983151983142 983090983089
6 Ductile and Brittle Materials
If a material fails without much plastic deformation it can be called brittle If the percentageelongation at fracture is less than 25 the material is classified as brittle
bull Usually the metals with FCC and CPH structures are highly ductile
PROCEDURE
1 Measure the original gauge length and diameter of the specimen
2 Insert the specimen into grips of the test machine
3 Begin the load application and record load vs elongation data
4 Take the readings more frequently as yield point is approached
5 Measure elongation values
6 Continue the test till fracture occurs
7 By joining the two broken halves of the specimen together measure the final length anddiameter of specimen at fracture
RESULTS AND DISCUSSIONS
1 Plot the Engg Stress strain curve and determine the following
bull Limit of proportionality = (Nmm2)
bull Yield strength = (Nmm2)
bull Ultimate strength = (Nmm2)
bull Young`s modulus = (Nmm2)
bull Percentage elongation = bull Percentage reduction in area =
bull Fracture strength = (Nominal Engg)
bull Toughness = Area under stress ndash strain curve up to
fracture
bull Malleability
2 Plot True Stress True strain curve after calculating true ndash stress and true strain values at various
points
Estimate1) Strength coefficient
2) Strain hardening coefficient
3) Determine whether the material is ductile or brittle4) Comment on the results
7232019 MOFMOS LABpdf
httpslidepdfcomreaderfullmofmos-labpdf 4647
Department of ANE MOFMOS LAB MANUAL
983120983137983143983141 983090983088 983151983142 983090983089
SNo Load Deformation Stress Strain E
Calculation part-
7232019 MOFMOS LABpdf
httpslidepdfcomreaderfullmofmos-labpdf 4747
Department of ANE MOFMOS LAB MANUAL
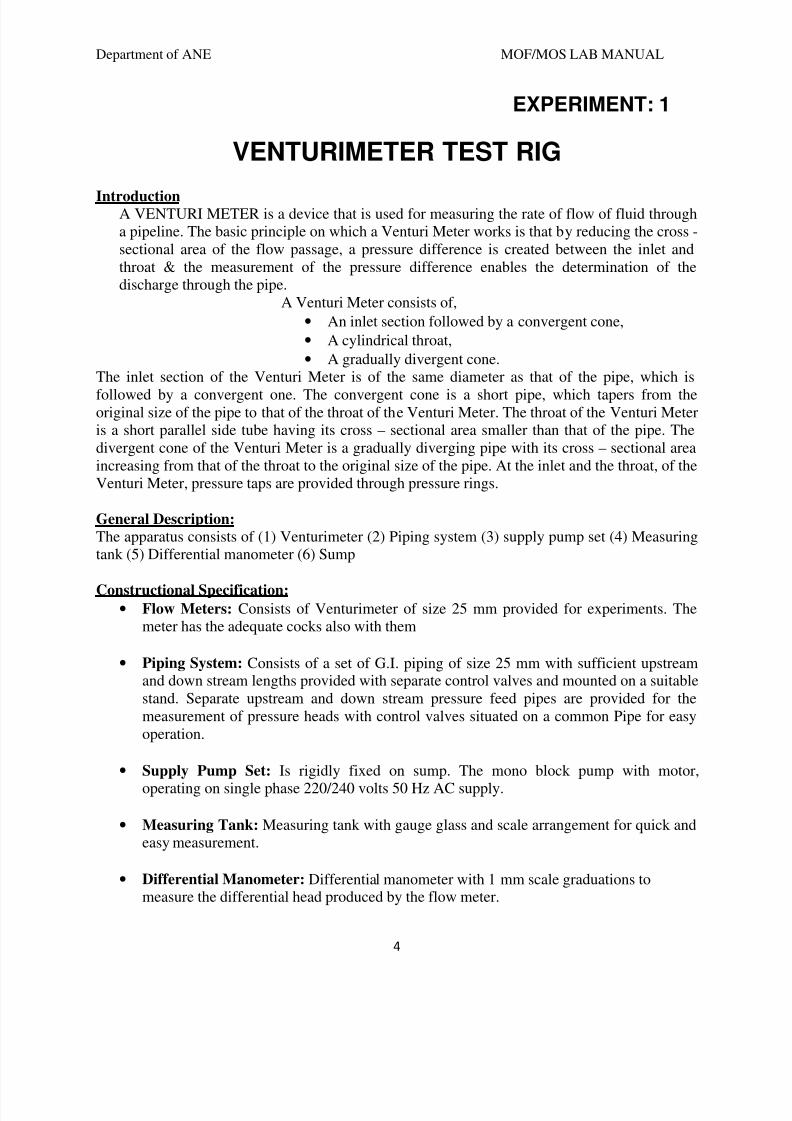
7232019 MOFMOS LABpdf
httpslidepdfcomreaderfullmofmos-labpdf 547
Department of ANE MOFMOS LAB MANUAL
4
EXPERIMENT 1
VENTURIMETER TEST RIG
IntroductionA VENTURI METER is a device that is used for measuring the rate of flow of fluid througha pipeline The basic principle on which a Venturi Meter works is that by reducing the cross -sectional area of the flow passage a pressure difference is created between the inlet andthroat amp the measurement of the pressure difference enables the determination of thedischarge through the pipe
A Venturi Meter consists of
bull An inlet section followed by a convergent cone
bull A cylindrical throat
bull
A gradually divergent coneThe inlet section of the Venturi Meter is of the same diameter as that of the pipe which is
followed by a convergent one The convergent cone is a short pipe which tapers from theoriginal size of the pipe to that of the throat of the Venturi Meter The throat of the Venturi Meteris a short parallel side tube having its cross ndash sectional area smaller than that of the pipe Thedivergent cone of the Venturi Meter is a gradually diverging pipe with its cross ndash sectional areaincreasing from that of the throat to the original size of the pipe At the inlet and the throat of theVenturi Meter pressure taps are provided through pressure rings
General Description
The apparatus consists of (1) Venturimeter (2) Piping system (3) supply pump set (4) Measuringtank (5) Differential manometer (6) Sump
Constructional Specificationbull Flow Meters Consists of Venturimeter of size 25 mm provided for experiments The
meter has the adequate cocks also with them
bull Piping System Consists of a set of GI piping of size 25 mm with sufficient upstream
and down stream lengths provided with separate control valves and mounted on a suitablestand Separate upstream and down stream pressure feed pipes are provided for themeasurement of pressure heads with control valves situated on a common Pipe for easyoperation
bull Supply Pump Set Is rigidly fixed on sump The mono block pump with motor
operating on single phase 220240 volts 50 Hz AC supply
bull Measuring Tank Measuring tank with gauge glass and scale arrangement for quick and
easy measurement
bull Differential Manometer Differential manometer with 1 mm scale graduations to
measure the differential head produced by the flow meter
7232019 MOFMOS LABpdf
httpslidepdfcomreaderfullmofmos-labpdf 647
Department of ANE MOFMOS LAB MANUAL
5
bull Sump Sump to store sufficient water for independent circulation through the unit for
experimentation and arranged within the floor space of the main unit
Before commissioning
bull Check whether all the joints are leak proof and water tight
bull
Fill the manometer to about half the height with mercurybull Close all the cocks pressure feed pipes and manometer to prevent damage and over
loading of the manometer
bull
Check the gauge glass and meter scale assembly of the measuring tank and see that it isfixed water height and vertically
bull Check proper electrical connections to the switch which is internally connected to the
motor
Experiments
bull The apparatus is primarily designed for conducting experiments on the coefficient of
discharge of flow meters Each flow meter can be connected to the manometer through
the pressure feed opening and the corresponding cocks
bull While taking readings close all the cocks in the pressure feed pipes except the two
(Down-stream and upstream) cocks which directly connect the manometer to the requiredflow meter for which the differential head is to be measured (Make sure while takingreading that the manometer is properly primed Priming is the operation offilling the manometer upper part and the connecting pipes with water andventing the air from the pipes)
bull First open the inlet gate valve of the apparatus Adjust the control valve kept at the exit
end of the apparatus to a desired flow rate and maintain the flow steadily
bull The actual discharge is measured with the help of the measuring tank The differential
head produced by the flow meter can be found from the manometer for any flow rate
7232019 MOFMOS LABpdf
httpslidepdfcomreaderfullmofmos-labpdf 747
Department of ANE MOFMOS LAB MANUAL
6
CALIBRATION OF VENTURIMETER
Aim - To calibrate a given venture meter and to study the variation of coefficient of dischargeof it with discharge
Apparatus - Venturimeter manometer stop watch experimental set-up
Procedure-1
Start the motor keeping the delivery valve close2 The water is allowed to flow through the selected pipe by selecting the appropriate ball
valve3
By regulating the valve control the flow rate and select the corresponding pressuretapings (ie of orifice meter)
4 Make sure while taking readings that the manometer is properly primed Priming is theoperation of filling the manometerrsquos upper part and the connecting pipes with water by
venting the air from the pipes Note down the difference of head ldquohrdquo from the manometerscale
5 Note down the time required for the rise of 10cm (ie 001m) water in the collecting tankby using stop watch Calculate actual discharge using below formulaDischarge - The time taken to collect some lsquoRrsquo cm of water in the collecting tank inmsup3sec
act
A x RQ =
t
Where A = area of the collecting tank in msup2 (03m X 03m)R = rise of water level taken in meters (say 01m or 10cm)
t = time taken for rise of water level to rise lsquoRrsquo inlsquotrsquo seconds6
Using difference in mercury level ldquohrdquocalculate the theoretical discharge of venturimeterby using following expression
1 2th
2 2
1 2
a xa 2gHQ =
a -a
Where
H= difference of head in meters =m
1 2 1 2
w
S(h -h ) x ( -1) = (h -h ) x 126 m
S
a1 = area of venturi at inlet =
2
1
4
d π
a2 = area of venturi at throat =
2
2
4
d π
g =Acceleration due to gravityd1 =Inlet diameter in meters d2 =Throat diameter in meters
7232019 MOFMOS LABpdf
httpslidepdfcomreaderfullmofmos-labpdf 847
Department of ANE MOFMOS LAB MANUAL
7
7 Calculate the coefficient of discharge of orifice meter (Cd)
act
theo
QCd=
Q
8 Repeat the steps 3 to 7 for different sets of readings by regulating the discharge valve
S NoVenturi inlet diameter
d1 Throat Diameter
d2
1 25mm 135 mm
S No Time for (10 cm)raise of water
level in sec
Actualdischarge =
Qa
Differential headin mm of mercury Theoretical
discharge = Qt Cd = Qq Qt
h1 h2 H
1
2
3
4
5
6 +
78
9
10
Precautions
bull Do not run the pump dry
bull Clean the tanks regularly say for every 15days
bull Do not run the equipment if the voltage is below 180V
bull
Check all the electrical connections before runningbull
Before starting and after finishing the experiment the main Control valve should be inclose position
bull Do not attempt to alter the equipment as this may cause Damage to the whole system
Results and Conclusions
7232019 MOFMOS LABpdf
httpslidepdfcomreaderfullmofmos-labpdf 947
Department of ANE MOFMOS LAB MANUAL
8
EXPERIMENT 2
ORIFICE METER TEST RIG
IntroductionAn ORIFICE METER is a simple device used for measuring the discharge through pipesThe basic principle on which an Orifice meter works is that by reducing the cross ndash sectionalarea of the flow passage a pressure difference between the two sections before and after Orificeis developed and the measure of the pressure difference enables the determination of thedischarge through the pipe However an Orifice meter is a cheaper arrangement for dischargemeasurement through pipes and its installation requires a smaller length as compared withVenturi Meter As such where the space is limited the Orifice meter may be used for themeasurement of discharge through pipes
General Description
The apparatus consists of (1) Orifice meter (2) Piping system (3) supply pump set (4) Measuringtank (5) Differential manometer (6) Sump
Constructional Specification
bull Flow Meters Consists of Orifice meter of size 25 mm provided for experiments The
meter has the adequate cocks also with them
bull Piping System Consists of a set of GI piping of size 25 mm with sufficient upstream
and downstream lengths provided with separate control valves and mounted on a suitablestand Separate upstream and downstream pressure feed pipes are provided for themeasurement of pressure heads with control valves situated on a common plate for easy
operation
bull Supply Pump Set Is rigidly fixed on sump The mono block pump with motor
Operating on single phase 220240 volts 50 Hz AC supply
bull Measuring Tank Measuring tank with gauge glass and scale arrangement for quick and
easy measurement
bull Differential Manometer Differential manometer with 1 mm scale graduations to
measure the differential head produced by the flow meter
bull
Sump Sump to store sufficient water for independent circulation through the unit forexperimentation and arranged within the floor space of the main unit
Before Commissioning
bull Check whether all the joints are leak proof and water tight
bull Fill the manometer to about half the height with mercury
bull Close all the cocks pressure feed pipes and manometer to prevent damage and over
loading of the manometer
7232019 MOFMOS LABpdf
httpslidepdfcomreaderfullmofmos-labpdf 1047
Department of ANE MOFMOS LAB MANUAL
983097
bull Check the gauge glass and meter scale assembly of the measuring tank and see that it is
fixed water tight and vertically
bull
Check proper electrical connections to the switch which is internally connected to themotor
Experiments
bull
The apparatus is primarily designed for conducting experiments on the coefficient ofdischarge of flow meters Each flow meter can be connected to the manometer throughthe pressure feed opening and the corresponding cocks
bull
While taking readings close all the cocks in the pressure feed pipes except the two(Down-stream and upstream) cocks which directly connect the manometer to the requiredflow meter for which the differential head is to be measured (Make sure while takingreading that the manometer is properly primed Priming is the operation of filling themanometer upper part and the connecting pipes with water and venting the air from the
pipes)
bull
First open the inlet gate valve of the apparatus Adjust the control valve kept at the exitend of the apparatus to a desired flow rate and maintain the flow steadily
bull
The actual discharge is measured with the help of the measuring tank The differentialhead produced by the flow meter can be found from the manometer for any flow rate
7232019 MOFMOS LABpdf
httpslidepdfcomreaderfullmofmos-labpdf 1147
Department of ANE MOFMOS LAB MANUAL
10
CALIBRATION OF ORIFICE METER
Aim - To calibrate a given Orifice meter and to study the variation of coefficient of discharge ofit with discharge
Apparatus -Orifice meter manometer stop watch experimental set-up
Procedure-1
Start the motor keeping the delivery valve close2
The water is allowed to flow through the selected pipe by selecting the appropriate ballvalve
3 By regulating the valve control the flow rate and select the corresponding pressuretapings (ie of orifice meter)
4 Make sure while taking readings that the manometer is properly primed Priming is theoperation of filling the manometerrsquos upper part and the connecting pipes with water byventing the air from the pipes Note down the difference of head ldquohrdquo from the manometer
scale5 Note down the time required for the rise of 10cm (ie 001m) water in the collecting tank
by using stop watch Calculate actual discharge using below formula
Discharge - The time taken to collect some lsquoRrsquo cm of water in the collecting tank in msup3sec
act
A x RQ =
t
Where A = area of the collecting tank in msup2 (03m X 03m)R = rise of water level taken in meters (say 01m or 10cm)t = time taken for rise of water level to rise lsquoRrsquo in lsquotrsquo seconds
6
Using difference in mercury level ldquohrdquo calculate the theoretical discharge of venturimeterby using following expression
1 2th
2 2
1 2
a xa 2gHQ =
a -a
Where
H= difference of head in meters =m
1 2 1 2
w
S(h -h ) x ( -1) = (h -h ) x 126 m
S
a1 = area of orifice at inlet =
2
1
4
d π
a2 = area of orifice at inlet =
2
2
4
d π
g =Acceleration due to gravityd1 =Inlet diameter in meters d2 =Throat diameter in meters
7 Calculate the coefficient of discharge of orifice meter (Cd)
7232019 MOFMOS LABpdf
httpslidepdfcomreaderfullmofmos-labpdf 1247
Department of ANE MOFMOS LAB MANUAL
11
act
theo
QCd=
Q
8
Repeat the steps 3 to 7 for different sets of readings by regulating the discharge valve
S No Orifice inlet diameterd1
Orifice diameterd2
1 25mm 130
S NoTime for (10 cm)
raise of water
level in sec
Actualdischarge =
Qa
Differential head inmm of mercury Theoretical
discharge = Qt
Cd = Qa Qt
h1 h2 H
1
2
3
4
5
6
7
8
9
10
Calculation-
Precautions-
bull Do not run the pump dry
bull Clean the tanks regularly say for every 15days
bull Do not run the equipment if the voltage is below 180V
bull
Check all the electrical connections before running
bull
Before starting and after finishing the experiment the main
7232019 MOFMOS LABpdf
httpslidepdfcomreaderfullmofmos-labpdf 1347
Department of ANE MOFMOS LAB MANUAL
12
bull Control valve should be in close position
bull Do not attempt to alter the equipment as this may cause
bull Damage to the whole system
Results and Conclusions-
EXPERIMENT 3
PIPE FRICTION APPARATUS
Introduction
A pipe may be of various diameters and may have bends valves etc When a liquid isflowing through such pipes the velocity of the liquid layer adjacent to the pipe wall is zero Thevelocity of the liquid goes on increasing from the wall and hence shear stresses are produced inthe liquid due to viscosity This viscous action causes loss of energy which is usually known asFrictional loss
Here we are going to consider two important losses that occur during flow
bull
Major Losses
bull
Minor Losses
7232019 MOFMOS LABpdf
httpslidepdfcomreaderfullmofmos-labpdf 1447
Department of ANE MOFMOS LAB MANUAL
13
bull Major losses occur due to friction This friction may be due to viscosity or roughness in
the pipe
bull
Minor losses can be due to various reasons such as Inlet and Outlet of the pipe bendsgates sudden expansions and contractions The apparatus is designed to study the friction
losses that appear in long pipes and the obstructions that are encountered in the way offlow by various types of fittings
General DescriptionThe unit consists mainly of 1) Piping System 2) Measuring Tank 3) Differential Manometer 4)Supply pump set 5) Sump
bull Constructional Specification
bull Piping System Piping System of size 127 mm 20 mm and 20 mm (SS) dia With
tapings at 1 meter distance and a flow control valve
bull
Measuring Tank Measuring tank is provided to measure the discharge of water fromthe unit
bull Differential Manometer Differential manometer with 1 mm scale graduations to
measure the loss of head in the pipe line
bull Supply Pump Set Supply pump set is rigidly fixed on the sump The pump set is mono
block pump with 05 HP motor operating on single phase 220 volts 50 Hz AC supply
bull Sump Sump is provided to store sufficient waters for independent circulation through
the unit for experimentation and arranged within the floor space of the main unit
Before Commissioning
bull
Check whether all the joints are leak proof and watertight
bull
Close all the cocks on the pressure feed pipes and Manometer to prevent damage andoverloading of the manometer
bull Check the gauge glass and meter scale assembly of the measuring tank and see that it is
fixed water tight and vertical
bull
Check proper electrical connections to the switch which is internally connected to themotor
Experiments
bull
The apparatus is primarily designed for conducting experiments on the frictional losses inpipes of different sizes Three different sizes of pipes are provided for wide range ofexperiments Each individual pipe can be connected to the Manometer through thepressure feed pipes having individual quick operating cocks
bull
While taking reading close all the cocks in the pressure feed pipe except the two (upstream and downstream) cocks which directly connect the manometer to the requiredpipe for which the loss in head has to be determined (Make sure while taking readings
7232019 MOFMOS LABpdf
httpslidepdfcomreaderfullmofmos-labpdf 1547
Department of ANE MOFMOS LAB MANUAL
14
that the manometer is properly primed Priming is the operating of filling the Manometerupper part and the connecting pipes with water venting the air from the pipes)
bull First open the inlet gate valve of the apparatus Adjust the control valve kept at the exit
end of the apparatus to a desired flow rate and maintain the flow steadily
bull
The actual discharge is measured with the help of the measuring tank For each size ofthe pipe the area of cross section of flow can be calculated from the known diameter ofthe pipes From these two valves and the average velocity of stream through the pipe canbe calculated
bull The actual loss of head is determined from the Manometer readings The frictional loss of
head in pipes is given by the Darcys formulaThe friction coefficient indicates f
7232019 MOFMOS LABpdf
httpslidepdfcomreaderfullmofmos-labpdf 1647
Department of ANE MOFMOS LAB MANUAL
15
FRICTION FACTOR FOR A GIVEN PIPE LINE
Aim - To calculate the friction factor for a given pipe line
Apparatus - experimental set-up stop watch
Procedure-
1 Start the motor keeping the delivery valve close2
The water is allowed to flow through the selected pipe by selecting the appropriateball valve
3 By regulating the valve control the flow rate and select the corresponding pressuretapings
4
Make sure while taking readings that the manometer is properly primed Priming isthe operating of filling the Manometer upper part and the connecting pipes with waterventing the air from the pipes Note down the loss of head ldquohfrdquo from the manometerscale
5
Note down the time required for the rise of 10cm (ie 01m) water in the collectingtank by using stop watch Calculate discharge using below formula
Discharge - The time taken to collect some lsquoxrsquo cm of water in the collecting tank in msup3sec
A x RQ =
t
A = area of the collecting tank in msup2 (03m X 03m)R = rise of water level taken in meters (say 01m or 10cm)t = time taken for rise of water level to rise lsquorrsquo in lsquotrsquo seconds
6 Calculate the velocity of the jet by following formula
V = Discharge = Q A msecArea of the pipe
A = cross sectional area of the pipe=Πdsup2 4d = pipe diameter
7 Calculate the coefficient of friction for the given pipe by fLvsup2
hf = ---------ρgd
Wherehf - Loss of head of water = (h1-h2)(Sn So ndash 1) = (h1-h2) 1261000 m
f - Co-efficient of friction for the pipeL - Discharge between sections for which loss of head is measured (1 meter)v - Average velocity of flow in msecg - Acceleration due to gravity 981msecd - Pipe diameter in meters
8 Repeat the steps 2 to 7 for different sets of readings by regulating the discharge valve
7232019 MOFMOS LABpdf
httpslidepdfcomreaderfullmofmos-labpdf 1747
Department of ANE MOFMOS LAB MANUAL
16
Tabular Form
S No Oslash of pipeArea(a)
Time forrise of 10cm water
Discharge VelocityLoss ofHead
hf
Co-efficientof friction
f
Calculation-
bull Total Head H
H = (h1 + h2) x 126 m of waterWhere
126 = conversion factor from mercury to water head
bull
Discharge Q
WhereA = Area of collecting tank = 0125 msup2R = Rise in water level of the collecting tank cm
t = time for lsquoRrsquo cm rise of water sec100 = Conversion from cm to m
bull
Velocity V
msWhere Arsquo = area of the pipefitting in use
7232019 MOFMOS LABpdf
httpslidepdfcomreaderfullmofmos-labpdf 1847
Department of ANE MOFMOS LAB MANUAL
17
bull
Friction Factor(Major Losses) F
Where H = total head m of waterV = velocity mg = acceleration due to gravity 981mssup2L = Distance bw tapping = 15m
bull
Head Loss Due To Fittings (Minor Losses) K
Where H = total head m of waterV = velocity mg = acceleration due to gravity 981mssup2
Precautions
1) Do not run the pump dry2)
Clean the tanks regularly say for every 15days3)
Do not run the equipment if the voltage is below 180V4) Check all the electrical connections before running5) Before starting and after finishing the experiment the main control valve should be in
close position6) Do not attempt to alter the equipment as this may cause damage to the whole system
Results and Conclusions
7232019 MOFMOS LABpdf
httpslidepdfcomreaderfullmofmos-labpdf 1947
Department of ANE MOFMOS LAB MANUAL
18
EXPERIMENT 4
BERNOULLIrsquoS EXPERIMENTIntroduction
Bernoullirsquos Theorem gives the relationship between pressure head velocity head and thedatum Here the attempt has been made to study the relationship of the above said parametersusing venturimeter
General Description
bull The apparatus consists of a specially fabricated clear ACRYLIC Venturimeter
with necessary tappings connected to a Multibank Piezometer also made of clearACRYLIC
bull
The apparatus consists of two overhead tanks interconnected with the venturimeterwhich is placed in between the tanks
bull The overhead tanks are provided with the Head variation mechanism for conducting
the experiments at various heads
bull
Water in the sump tank is pumped using a Monobloc Centrifugal pump (Kirloskarmake) which passes through the control valve to the overhead tank
bull The height of the water in the collecting tank is measured using the acrylic
Piezometer to find the flowrate
bull The whole arrangement is mounted on an aesthetically designed sturdy frame
made of MS tubes and NOVAPAN Board with all the provisions for holding thetanks and accessories
Aim
o
The experiment is conducted too
Study of Pressure Gradient at different zoneso
Verification of Bernoullis Equationo
Comparative analysis under different flow rates
Apparatus
1) Venturimeter 2)Piezometer 3) Overhead Tank 4)Sump Tank 5) Centrifugal Pump
Procedure
1) Fill in the sump tank with clean water2)
Keep the delivery valve closed3)
Check and give necessary electrical connections to the system4) Switch on the pump amp Slowly open the delivery valve5)
Adjust the flow through the control valve of the pump6)
Allow the system to attain the steady state ie let the water pass from the secondoverhead tank to the collecting tank
7) Note down the Pressure head at different points of the venture meter on the multi-tubepiezometer (Expel if any air is the by inserting the thin pin into the piezometer openings)
8) Close the ball valve of the collecting tank and measure the time for the known rise ofwater
7232019 MOFMOS LABpdf
httpslidepdfcomreaderfullmofmos-labpdf 2047
Department of ANE MOFMOS LAB MANUAL
1983097
9) Change the flow rate and repeat the experiment
Observation
SlNo
Static Head Loss h Time for lsquoRrsquo
cm rise in waterlsquoTrsquo sec1 2 3 4 5 6 7 8 9 10
1
2
3
4
5
Calculations1
Discharge QA2
Where
A = Area of collecting tank = 0045 msup2R = Rise in water level of the collecting tank cmt = time for lsquoRrsquo cm rise of water sec100 = Conversion from cm to m
3 Pressure Head
Where
ρ = density of waterg = gravitational constanth = head measured m of water column
3 Velocity Head
WhereV = Q a a = Area at the particular section of the venturimeter msup2
4 Verification of BERNOULLIrsquoS EQUATIONBernoullirsquos Equation is given as
After findinga Pressure Head hb
Velocity headat different cross-section of the Venturimeter
7232019 MOFMOS LABpdf
httpslidepdfcomreaderfullmofmos-labpdf 2147
Department of ANE MOFMOS LAB MANUAL
20
Put the same in the above equation for different points and verify whether all the values obtainedare sameNote Consider the datum z to be constant
Precautions
bull
Do not run the pump drybull
Clean the tanks regularly say for every 15days
bull
Do not run the equipment if the voltage is below 180V
bull
Check all the electrical connections before running
bull Before starting and after finishing the experiment the main
bull Control valve should be in close position
bull Do not attempt to alter the equipment as this may cause
bull
Damage to the whole system
Result and Conclusion
7232019 MOFMOS LABpdf
httpslidepdfcomreaderfullmofmos-labpdf 2247
Department of ANE MOFMOS LAB MANUAL
21
EXPERIMENT 5
CALIBRATION OF A TRIANGULAR NOTCH
AIM -To find the coefficient of discharge of given triangular notch
THEORY-A notch is a device used for measuring the rate of flow of liquid through a smallchannel or a tank It may be defined as an opening in the side of a tank or small channel in suchthat a way that the liquid surfaces in the tank or channel is below the top edge of the opening
NOTCHES ARE CLASSIFIED AS-1 Rectangular notch2 Triangular notch3 Trapezoidal notch
4 Stepped notch
A triangular notch is preferred to a rectangular notch due to the following reasonsThe expression for discharge of triangular notch is compared to rectangular notch is simple Formeasuring low discharge a triangular notch gives more accurate results than a rectangular notchIn the case of triangular notch only H is required for the computation of dischargeA trapezoidal notch is a combination of rectangular and triangular notch and thus the dischargethrough trapezoidal notch is the sum of above notchesA stepped notch is a combination of rectangular notch and triangular notch The dischargethrough the stepped notch is equal to sum of discharges through the different rectangularnotches
DESCRIPTION- The apparatus consists of1) Measuring tank 2) Sump tank3) Supply pump set 4) Inlet and out let valve
Measuring tank Stainless steel tank of size 030305mm height with the gage glass a scalearrangement for quick and easy measurements A ball valve is provided to empty the tank and adrain is provided at the bottom of the tank to drain the waste water when the unit is not in useWater for independent circulation through the unit for experimentation and arranged within thefloor space of the main unitSump tank The sump tank is a size of 020303m stainless steel tank to store sufficient waterfor independent circulation through the unit for experimentation and arranged within the floorspace of the main unit about 060305m with a gauge glass and scale arrangement A ballvalve is provided to empty the tankSupply Pump set The pump is 2525mm size mono block with frac12 HP 2880 RPM singlephase 220volts AC supply Inlet and out let valve- These valves are used to control the flow ofwater at inlet and out let
PROCEDURE1 Allow the water to drain up to triangular notch
7232019 MOFMOS LABpdf
httpslidepdfcomreaderfullmofmos-labpdf 2347
Department of ANE MOFMOS LAB MANUAL
22
2 Note down the depth of the water when the water is coinciding with the v notch point
3 Collect water in collecting tank and close the drain valve and find the time taken for the rise ofwater up to 20cm
4 Calculate the discharge by using the above results
5 Now substituting the values in the formula for calculation of discharge for v- notch gives therequired result
Precautionsbull Do not run the pump dry
bull Clean the tanks regularly say for every 15days
bull Do not run the equipment if the voltage is below 180V
bull Check all the electrical connections before running
bull
Before starting and after finishing the experiment the main
bull
Control valve should be in close position
bull
Do not attempt to alter the equipment as this may cause
7232019 MOFMOS LABpdf
httpslidepdfcomreaderfullmofmos-labpdf 2447
Department of ANE MOFMOS LAB MANUAL
23
bull Damage to the whole system
Result and Conclusion
7232019 MOFMOS LABpdf
httpslidepdfcomreaderfullmofmos-labpdf 2547
Department of ANE MOFMOS LAB MANUAL
24
MECHANICSOF SOLIDS
LAB
7232019 MOFMOS LABpdf
httpslidepdfcomreaderfullmofmos-labpdf 2647
Department of ANE MOFMOS LAB MANUAL
25
7232019 MOFMOS LABpdf
httpslidepdfcomreaderfullmofmos-labpdf 2747
Department of ANE MOFMOS LAB MANUAL
983089
IZOD IMPACT TEST
AIM To perform the izod impact test on materials
APPARATUS Izod impact test machine test specimen vernier calipers steel rule
IMPACT STRENGTH The resistance of a material to fracture under sudden load application
MATERIALS Two types of test pieces are used for this test as given
1) Square cross-section
2) Round cross-section
THEORY The type of test specimen used for this test is a Square Cross-section
The specimen may have single two or three notches The testing machine shouldhave the following specifications The angle between top face of grips and face holding the specimen Vertical=900 the angle of tip of hammer =750plusmn10
The angle between normal to the specimen and underside face of the hammer at Striking point=100plusmn10
Speed of hammer at impact=399msecStriking energy=168N-m or Joules Angle
Of drop of pendulum =900 Effective
weight of pendulum=2179kg
Minimum value of scale graduation=2 Joules
Permissible total friction loss of corresponding energy=050
Distance from the axis of rotation of distance between the base of specimen notch andthe point of specimen hit by the hammer=22mmplusmn05mm
The longitudinal axes of the test piece shall lie in the plane of swing of the center ofgravity of the hammer The notch shall be positioned so that its in the plane of thehammer the notch shall be positioned its plane of symmetry coincides with the top faceof the grips for setting the specimen the notch impact strength I is calculated accordingto the following relation
Where I= impact strength in joulesm2
7232019 MOFMOS LABpdf
httpslidepdfcomreaderfullmofmos-labpdf 2847
Department of ANE MOFMOS LAB MANUAL
983090
PROCEDURE
1 For conducting Izod test a proper striker is to be fitted firmly to the bottom of thehammer with the help of the clamming piece
2 The latching take for izod test is to be firmly fitted to the bearing housing at the side of
the columns3 The frictional loss of the machine can be determined by free fall test raise the
hammer by hands and latch in release the hammer by operating lever the pointer will
then indicate the energy loss due to friction From this reading confirm that the friction
loss is not exceeding 05 of the initial potential energy Otherwise frictional loss has to
be added to the final reading
4 The specimen for izod test is firmly fitted in the specimen support with the help ofclamping screw and eacutelan key Care should be taken that the notch on the specimenshould face to pendulum striker
5 After ascertaining that there is no person in the range of swinging pendulum release the
pendulum to smash the specimen6 Carefully operate the pendulum brake when returning after one swing to stop the oscillations
7 Read-off position of reading pointer on dial and note indicated value
8 Remove the broken specimen by loosening the clamping screw
The notch impact strength depends largely on the shape of the specimen and the notch the
values determined with other specimens therefore may not be compared with each other
OBSERVATION TABLE
S No A(Area of cross K Impact energy I Impact Strength
section of observed
specimen)
RESULT
7232019 MOFMOS LABpdf
httpslidepdfcomreaderfullmofmos-labpdf 2947
Department of ANE MOFMOS LAB MANUAL
983091
Calculation Part
7232019 MOFMOS LABpdf
httpslidepdfcomreaderfullmofmos-labpdf 3047
Department of ANE MOFMOS LAB MANUAL
983092
ROCKWELL HARDNESS TEST
AIM To determine the Rockwell hardness of the given test specimen
APPARATUS Rockwell hardness testing machine test specimen
THEORY
Hardness-the resistance of a metal to plastic deformationagainst indentation scratching abrasion or cutting
The depth of penetration of the indenter measures the hardness of a material by this Rockwell ‟s hardness test method the depth of penetration is inversely
proportional to the hardness Both ball or diamond cone types of indenters are used inthis testThere are three scales on the machine for taking hardness readings
Scale bdquoA‟ with load 60kgf or 5888N and diamond indenter is used for performing tests on steel and shallow case hardened steel
Scale bdquoB‟ with load 100kgf or 9807 N and 1588mm dia ball indenter is used forperforming tests on soft steel malleable iron copper and aluminum alloys
Scale bdquoC‟ with load 150kgf or 1471 N and diamond indenter is used for performing testson steel hard cost steel deep case hardened steel other metals which harder
First minor load is applied to overcome the film thickness on the metal surfaceMinor load also eliminates errors in the depth of measurement due to spring of themachine frame or setting down of the specimen and table attachments
The Rockwell hardness is derived from the measurement of the depth of theimpression This method of test is suitable for finished or machined parts of simpleshapes
PROCEDURE
1 Select the load by rotating the nob and fix the suitable indenter
2 Clean the test piece and place on the special anvil or worktable of the machine
3 Turn the capstan wheel to evaluate the test specimen into contact with the indenterpoint
4 Further turn the wheel for three rotations forcing the test specimen against theindenter This will ensure the minor load has been applied5 Set the pointer on the scale dial at the appropriate position
7232019 MOFMOS LABpdf
httpslidepdfcomreaderfullmofmos-labpdf 3147
Department of ANE MOFMOS LAB MANUAL
983093
6 Push the lever to apply the major load A dash pot provided in the loading mechanismto ensure that the load is applied gradually
7 As soon as the pointer comes to rest pull the handle in the reverse direction slowlyThis releases the major but not the minor load The pointer will now rotate in the reversedirection
8 The Rockwell hardness can read off the scale dial on the appropriate scale after thepointer comes to rest
OBSERVATIONS
Material of the specimen =
Thickness of test specimen =
Hardness scale used =
Test Material Rockwell Scale of weights Rockwell number Average
no Rockwell
no
Scale weight indent 1 2 3
PRECAUTIONS
1 For testing cylindrical test specimens use V-type platform
2 Calibrate the machine occasionally by using standard test blocks
3 For thin metal prices place another sufficiently thick metal piece between the testspecimen and the platform to avoid any damage which may likely occur to the platform
4 After applying major load wait for some time to allow the needle to come to restThe waiting time may vary from 2 to 8 seconds
7232019 MOFMOS LABpdf
httpslidepdfcomreaderfullmofmos-labpdf 3247
Department of ANE MOFMOS LAB
MANUAL
983094
5 The surface of the test piece should be smooth and even and free from oxidescale and foreign matter6 Test specimen should not be subjected to any heating of cold working
7 The distance between the centers of two adjacent indentation should be at least 4
Times the diameter of the indentation and the distance from the center of any indentation tothe edge of the test piece should be at least 25 times the diameter of the indentation
RESULT
7232019 MOFMOS LABpdf
httpslidepdfcomreaderfullmofmos-labpdf 3347
Department of ANE MOFMOS LAB MANUAL
983095
Calculation Part
7232019 MOFMOS LABpdf
httpslidepdfcomreaderfullmofmos-labpdf 3447
Department of ANE MOFMOS LAB MANUAL
983096
BRINELLrsquoS HARDNESS TEST
AIM To determine the Brinell hardness of the given test specimen
APPARATUS Brinell hardness machine test specimen Brinells Microscope
THEORY
Indentation Hardness-A number related to the area or to the depth of
the impression made by an indenter or fixed geometry under a known fixed load
This method consists of indenting the surface of the metal by a hardened steel
ball of specified diameter D mm under a given load F kgf and measuring the average
diameter d mm of the impression with the help of Brinell microscope fitted with a scaleThe Brinell hardness HB is defined as the quotient of the applied force F divided by the
spherical area of the impression
HB= Test load in kgfsurface area of indentation
=2F πD (D- D2- d2) kgmm2
PROCEDURE
1 Select the proper size of the ball and load to suit the material under test2 Clean the test specimen to be free from any dirt and defects or blemishes
3 Mount the test piece surface at right angles to the axis of the ball indenter plunger
4 Turn the platform so that the ball is lifted up
5 By shifting the lever applies the load and waits for some time
6 Release the load by shifting the lever
7 Take out the specimen and measure the diameter of indentation by means of theBrinell microscope8 Repeat the experiments at other positions of the test piece
9 Calculate the value of HB
7232019 MOFMOS LABpdf
httpslidepdfcomreaderfullmofmos-labpdf 3547
Department of ANE MOFMOS LAB MANUAL
983097
OBSERVATIONS
Test piece material = Diameter of the ballrdquo D ldquo =
Load section FD2 = Test load =
Load application time =
Least count of Brinell Microscope =
Diameter Average
Impression F D HB
S No in kg in mm Kgmm2
(d1) (d2) (d1+d2)2
PRECAUTIONS
1 The surface of the test piece should be clean
2 The testing machine should be protected throughout the test from shock or vibration
3 The test should be carried out at room temperature
4 The distance of the center of indentation from the edge of test piece should be at
least 25 times the diameter of the indentation and the distance between the center ofthe two adjacent indentations should be at least 4 times the diameter of the indentation
5 The diameter of each indentation should be measured in two directions at rightangles and the mean value readings used the purpose of determining the hardnessnumber
7232019 MOFMOS LABpdf
httpslidepdfcomreaderfullmofmos-labpdf 3647
Department of ANE
MOFMOS LAB MANUAL
983089983088
RESULT
Calculation Part
7232019 MOFMOS LABpdf
httpslidepdfcomreaderfullmofmos-labpdf 3747
Department of ANE MOFMOS LAB MANUAL
983089983089
SPRING TEST
AIM To determine the rigidity modulus of the spring
APPARATUS Spring testing machine vernier calipers spring specimen
THEORY
Closed coiled helical springs are the springs in which helix angle is very small or inother words the pitch between two adjacent turns is small A closed coiled helical springcarrying an axial load is shown in fig
As helix angle in case of close coiled helical springs are small hence the bendingeffect on the spring is ignored and we assume that the coils of close coiled helical
springs are to stand purely tensional stresses Let d=diameter ofthe spring wire
P= pitch of the helical spring N= number ofcoils R= mean radius of the spring coil
W=axial load on spring C=modulus of rigidity
τ=maximum shear stress induced in the wire θ=angle of twist in the
spring wire and
x= deflection of spring due to axial load l= length of wire
Net twisting moment on the wire T=WR
But twisting moment is also given by T= (π 16) τd3
From 1 ad 2 WR = (π 16) τd3 τ=16WR πd
3
above equation which gives the maximum shear stress induced in the wire (1) Length of one coil=2πR
Total length of the wire=2πRn (2)
Strain energy stored by the spring due to torsion
U= (τ 4C) [(π 4)d 2πRn] (3)
Work done on the spring =average load x deflection
= (12) Wx (4)
Equating 3 and 4
(12) Wx = (32W2R3n)Cd4
7232019 MOFMOS LABpdf
httpslidepdfcomreaderfullmofmos-labpdf 3847
Department of ANE MOFMOS LAB MANUAL
983089983090
x=64WR3nCd
4
Rigidity modulus of the spring
C=64WR3nxd
4
PROCEDURE
1) Consider the spring and find out itsmean coil radius R with the help ofvernier calipers
2) Find the diameter of the spring andnumber of turns
3) Fix the spring between two hooks
4) Now load is gradually applied
5) Note the deflection from thedeflection scale for different loadsapplied
6) Calculate the rigidity modulus usingabove formula
PRECAUTIONS
1) Dimensions should be measureaccurately with the help of verniercalipers
2) Deflection from the scale should benoted carefully and accurately
OBSERVATION TABLE
Sno Load applied deflection Rigidity modulus
C
Average rigidity modulus C =
RESULT
7232019 MOFMOS LABpdf
httpslidepdfcomreaderfullmofmos-labpdf 3947
Department of ANE MOFMOS LAB MANUAL
983089983091
Calculation Part
7232019 MOFMOS LABpdf
httpslidepdfcomreaderfullmofmos-labpdf 4047
Department of ANE MOFMOS LAB MANUAL
983089983092
TORSION
AIM To conduct torsion test on mild steel or cast iron specimen to find modulus of rigidity or to find angle of twist of the materials which are subjected to torsion
APPARATUS 1 A torsion test machine along with angle of twist measuring attachment
2 Standard specimen of mild steel or cast iron
3 Steel rule
4 Vernnier caliper or a micrometer
THEORY
For transmitting power through a rotating shaft it is necessary to apply a turning
force The force is applied tangentially and in the plane of transverse cross section The
torque or twisting moment may be calculated by multiplying two opposite turningmoments It is said to be in pure torsion and it will exhibit the tendency of shearing off at
every cross section which is perpendicular to the longitudinal axis
Torsion equation
Torsion equation is given by below
T IP = CθL = TR
T= maximum twisting torque (Nmm) IP =
polar moment of inertia (mm4) τ =shear
stress (Nmm2) C=modulus of rigidity (Nmm2)
θ=angle of twist in radians L=length of shaft under torsion (mm)
Assumptions made for getting torsion equation
1 The material of the shaft is uniform through out
2 The shaft circular in section remain circular after loading
3 Plane sections of shaft normal to its axis before loading remain plane after thetorque have been applied
4 The twist along the length of the shaft is uniform throughout
5 The distance between any two normal-sections remains the same after theapplication of torque
6 Maximum shear stress induced in the shaft due to application of torque does notexceed its elastic limit
7232019 MOFMOS LABpdf
httpslidepdfcomreaderfullmofmos-labpdf 4147
Department of ANE MOFMOS LAB MANUAL
983089983093
PROCEDURE
1 Select the suitable grips to suit the size of the specimen and clamp it in themachine by adjusting sliding jaw
2 Measure the diameter at about the three places and take average value
3 Choose the appropriate loading range depending upon specimen
4 Set the maximum load pointer to zero
5 Carry out straining by rotating the hand wheel or by switching on the motor
6 Load the members in suitable increments observe and record strain reading
7 Continue till failure of the specimen
8 Calculate the modulus of rigidity C by using the torsion equation
9 Plot the torque ndashtwist graph (T Vs θ)
OBSERVATIONS
Gauge length L =
Polar moment of inertia IP =
Modulus of rigidity C =TL IP θ =
SNo Twisting Moment Angle of Twist Modulus Average
Kgf Nm Degrees Radians of rigidity CNmm2
C
RESULT
7232019 MOFMOS LABpdf
httpslidepdfcomreaderfullmofmos-labpdf 4247
Department of ANE MOFMOS LAB MANUAL
983089983094
TENSILE TEST
AIM
To conduct tensile test on a mild steel specimen and determine the following
1 Limit of proportionality 2 Elastic Limit
3 Upper yield point 4 Lower yield point
5 Ultimate strength 6 Fracture strength
7 Young`s Modulus 8 Percentage elongation
9 Percentage reduction in area 10 Ductility
11 Toughness 12 True stress amp true strain
13 Malleability
APPARATUS tensile testing machine specimen steel rule vernier caliper micrometer
THEORY
The tensile test is most applied one of all mechanical tests In this test a test specimen is fixed
into grips connected to a straining device and to a load-measuring device (One end in stationary
grips and the other in movable grips) If the applied load is small enough the deformation of any
solid body is entirely elastic An elastically deformed solid will return to its original form as soon
as load is removed However if the load is too large the material can be deformed permanently
The initial part of the tension curve which represents the manner in which solid undergoes
plastic deformation is termed as plastic The stress below which the deformation is essentially
entirely elastic is known as the elastic limit of the material In some materials like mild steel a
sudden drop in load indicating both an upper and lower yield point denotes the onset of plastic
deformation However some materials do not exhibit a sharp yield point During plastic
deformation at lager extensions strain hardening cannot compensate for the decrease in section
and thus the load passes through a maximum and then begins to decrease At this stage the
ultimate strength which is defined as the ration of the load on the specimen to the original cross-section area reaches a maximum value Until this point the deformation is uniform at all the
sections of the specimen Further loading will eventually cause bdquoneck ‟ formation and rupture
follows
7232019 MOFMOS LABpdf
httpslidepdfcomreaderfullmofmos-labpdf 4347
Department of ANE MOFMOS LAB
MANUAL
983089983095
Usually a tension test is conducted at room temperature the tensile load is applied
slowly During this test either round or flat specimens may be used The load on the specimen is
applied mechanically or hydraulically depending on the type of testing machine
1 NominalEngg stress and NominalEngg strain
Original CS area = A0 (mm2)
Original gauge length = L0 (mm) Increase in gauge length = δL0
Nominal stress = PA0 (N mm2)
Nominal strain = δL0 L0
2 Limit of Proportionality Stress is proportional to strain up to this pointNormal Stress = PA PO Normal Strain = (δ LO) ALO
3 Elastic limit When the load is removed at ldquoBrdquo the specimen will go back to originalDimensions ie LO and δ AO Nominal stress = PB AO Normal Strain = (δ LO) B LO
If the specimen is loaded beyond elastic limit it will undergo permanent strainie Plastic deformation
4 Upper yield point Nominal stress = PC AO Nominal strain = (δ LO) D LO
5 Lower yield point Nominal stress = PD AO
Nominal strain = (δ LO) D LO 6 Ultimate load or maximum load point
Nominal ultimate stress = PE AO Nominal strain = (δ LO) E LO
7 Fracture Load point F
Nominal fracture stress = PF AO
Nominal strain at fracture = (δ LO) F LO
8 Young`s modulus (E) Young`s modulus (E) = StressStrain
(In the elastic region limit of proportionality = Nominal stress at ANominal strain at A 9Modulus of resilience = (Nominal stress at elastic limit)
2 2E
Area under Engg Stress - Strain diagram up to elastic limit10 Resilience = Modulus of Resilience x Volume of specimen undergoing Tensile stress
7232019 MOFMOS LABpdf
httpslidepdfcomreaderfullmofmos-labpdf 4447
Department of ANE MOFMOS LAB MANUAL
983089983096
11 Yield point ElongationElongation taking place in the specimen from C to D this istaking place without increase in stress
12 Modulus of toughnessArea under engineering stress ndash strain diagram up to fracture13 Toughness = Modulus of toughness x Volume of specimenThis indicates theamount of energy absorbed by the specimen before fracture take place
14 Ductility= (Final length at fracture ndash original length 10) x 100
15 MalleabilityIt is the ability of the material to undergo plastic deformation prior fracture under compressive loading conditions In a tensile test it is approximatedas percentage reduction in cross sectional area of the specimen Malleability =
(AO - Af )AO) x 100
True stress ndash true strain diagram
Engineering stress is calculated based on original cross sectional area (AO) But not on the actual cross sectional area at load bdquoP‟
True stress = PA = PAO x AO A
Since volume remains constant during plastic deformation we have AO LO = AL True stress = PAO x L LO
= PAO x ((LO + δLO) LO)
= P (1+e)= Nominal stress (1+ nominal strain)
True strain = Є = 1n (1+e)
These relations are valid up to ultimate load ie up to which the strain isuniform all along the gauge length
1 True Stress at upper yield point = Nominal stress at upper yield point ( 1+e O)True strain at C = 1n (1+eo)
2 True stress at ultimate load (E1)= Nominal ultimate stress ( 1+eE)True strain at ultimate load = 1n (1+eE)
3 True stress at fracture (E1) = Pf Af
Where Af is the area of cross section at fracture can be measured True
strain at fracture = 1n (Ao Af )
Area relation is taken instead of lengths because the strains are localized in theregion between ultimate load point and fracture point
4 Strain Hardening
From lower yield point onwards increase in load is required for increase instrain Thus the stress required for further deformation is more Thisphenomenon is called strain hardening
5 True ndash stress ndash true strain curve in log ndash log co ndash ordinates
When the true ndash stress and true ndash strain are plotted on log ndash log co ndash ordinates thecurve is a straight line
7232019 MOFMOS LABpdf
httpslidepdfcomreaderfullmofmos-labpdf 4547
Department of ANE MOFMOS LAB MANUAL
983120983137983143983141 983089983097 983151983142 983090983089
6 Ductile and Brittle Materials
If a material fails without much plastic deformation it can be called brittle If the percentageelongation at fracture is less than 25 the material is classified as brittle
bull Usually the metals with FCC and CPH structures are highly ductile
PROCEDURE
1 Measure the original gauge length and diameter of the specimen
2 Insert the specimen into grips of the test machine
3 Begin the load application and record load vs elongation data
4 Take the readings more frequently as yield point is approached
5 Measure elongation values
6 Continue the test till fracture occurs
7 By joining the two broken halves of the specimen together measure the final length anddiameter of specimen at fracture
RESULTS AND DISCUSSIONS
1 Plot the Engg Stress strain curve and determine the following
bull Limit of proportionality = (Nmm2)
bull Yield strength = (Nmm2)
bull Ultimate strength = (Nmm2)
bull Young`s modulus = (Nmm2)
bull Percentage elongation = bull Percentage reduction in area =
bull Fracture strength = (Nominal Engg)
bull Toughness = Area under stress ndash strain curve up to
fracture
bull Malleability
2 Plot True Stress True strain curve after calculating true ndash stress and true strain values at various
points
Estimate1) Strength coefficient
2) Strain hardening coefficient
3) Determine whether the material is ductile or brittle4) Comment on the results
7232019 MOFMOS LABpdf
httpslidepdfcomreaderfullmofmos-labpdf 4647
Department of ANE MOFMOS LAB MANUAL
983120983137983143983141 983090983088 983151983142 983090983089
SNo Load Deformation Stress Strain E
Calculation part-
7232019 MOFMOS LABpdf
httpslidepdfcomreaderfullmofmos-labpdf 4747
Department of ANE MOFMOS LAB MANUAL
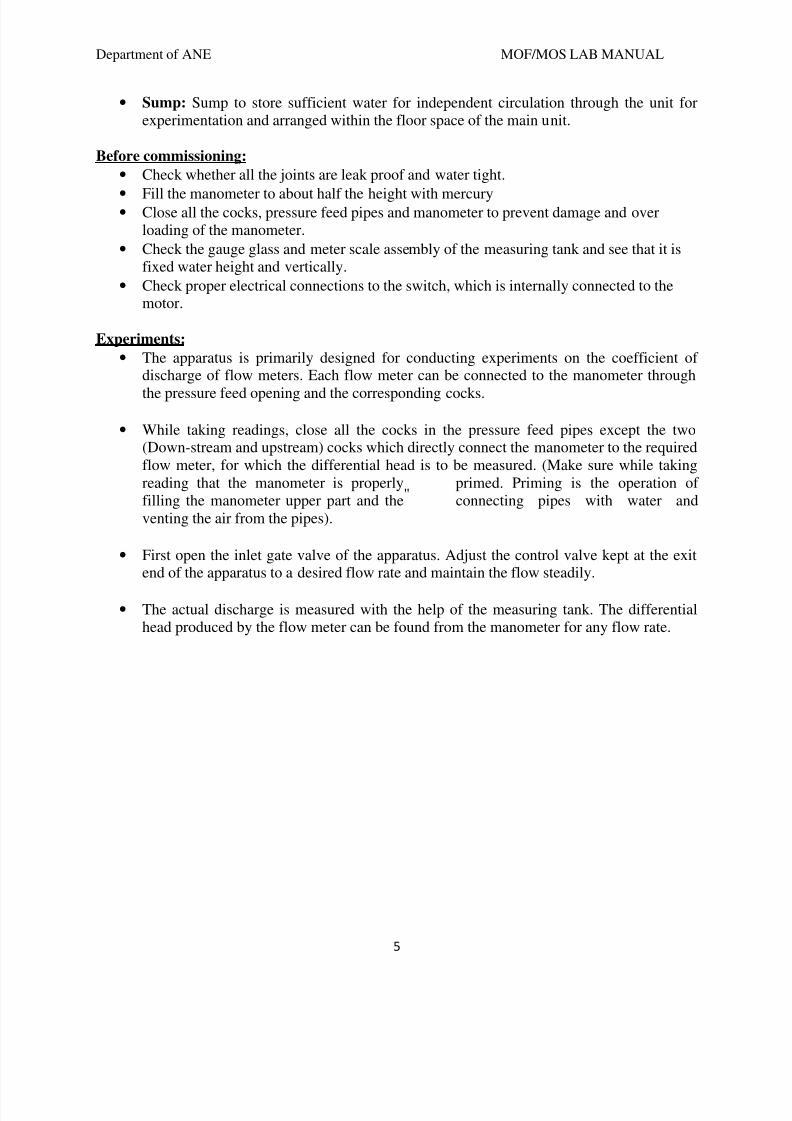
7232019 MOFMOS LABpdf
httpslidepdfcomreaderfullmofmos-labpdf 647
Department of ANE MOFMOS LAB MANUAL
5
bull Sump Sump to store sufficient water for independent circulation through the unit for
experimentation and arranged within the floor space of the main unit
Before commissioning
bull Check whether all the joints are leak proof and water tight
bull
Fill the manometer to about half the height with mercurybull Close all the cocks pressure feed pipes and manometer to prevent damage and over
loading of the manometer
bull
Check the gauge glass and meter scale assembly of the measuring tank and see that it isfixed water height and vertically
bull Check proper electrical connections to the switch which is internally connected to the
motor
Experiments
bull The apparatus is primarily designed for conducting experiments on the coefficient of
discharge of flow meters Each flow meter can be connected to the manometer through
the pressure feed opening and the corresponding cocks
bull While taking readings close all the cocks in the pressure feed pipes except the two
(Down-stream and upstream) cocks which directly connect the manometer to the requiredflow meter for which the differential head is to be measured (Make sure while takingreading that the manometer is properly primed Priming is the operation offilling the manometer upper part and the connecting pipes with water andventing the air from the pipes)
bull First open the inlet gate valve of the apparatus Adjust the control valve kept at the exit
end of the apparatus to a desired flow rate and maintain the flow steadily
bull The actual discharge is measured with the help of the measuring tank The differential
head produced by the flow meter can be found from the manometer for any flow rate
7232019 MOFMOS LABpdf
httpslidepdfcomreaderfullmofmos-labpdf 747
Department of ANE MOFMOS LAB MANUAL
6
CALIBRATION OF VENTURIMETER
Aim - To calibrate a given venture meter and to study the variation of coefficient of dischargeof it with discharge
Apparatus - Venturimeter manometer stop watch experimental set-up
Procedure-1
Start the motor keeping the delivery valve close2 The water is allowed to flow through the selected pipe by selecting the appropriate ball
valve3
By regulating the valve control the flow rate and select the corresponding pressuretapings (ie of orifice meter)
4 Make sure while taking readings that the manometer is properly primed Priming is theoperation of filling the manometerrsquos upper part and the connecting pipes with water by
venting the air from the pipes Note down the difference of head ldquohrdquo from the manometerscale
5 Note down the time required for the rise of 10cm (ie 001m) water in the collecting tankby using stop watch Calculate actual discharge using below formulaDischarge - The time taken to collect some lsquoRrsquo cm of water in the collecting tank inmsup3sec
act
A x RQ =
t
Where A = area of the collecting tank in msup2 (03m X 03m)R = rise of water level taken in meters (say 01m or 10cm)
t = time taken for rise of water level to rise lsquoRrsquo inlsquotrsquo seconds6
Using difference in mercury level ldquohrdquocalculate the theoretical discharge of venturimeterby using following expression
1 2th
2 2
1 2
a xa 2gHQ =
a -a
Where
H= difference of head in meters =m
1 2 1 2
w
S(h -h ) x ( -1) = (h -h ) x 126 m
S
a1 = area of venturi at inlet =
2
1
4
d π
a2 = area of venturi at throat =
2
2
4
d π
g =Acceleration due to gravityd1 =Inlet diameter in meters d2 =Throat diameter in meters
7232019 MOFMOS LABpdf
httpslidepdfcomreaderfullmofmos-labpdf 847
Department of ANE MOFMOS LAB MANUAL
7
7 Calculate the coefficient of discharge of orifice meter (Cd)
act
theo
QCd=
Q
8 Repeat the steps 3 to 7 for different sets of readings by regulating the discharge valve
S NoVenturi inlet diameter
d1 Throat Diameter
d2
1 25mm 135 mm
S No Time for (10 cm)raise of water
level in sec
Actualdischarge =
Qa
Differential headin mm of mercury Theoretical
discharge = Qt Cd = Qq Qt
h1 h2 H
1
2
3
4
5
6 +
78
9
10
Precautions
bull Do not run the pump dry
bull Clean the tanks regularly say for every 15days
bull Do not run the equipment if the voltage is below 180V
bull
Check all the electrical connections before runningbull
Before starting and after finishing the experiment the main Control valve should be inclose position
bull Do not attempt to alter the equipment as this may cause Damage to the whole system
Results and Conclusions
7232019 MOFMOS LABpdf
httpslidepdfcomreaderfullmofmos-labpdf 947
Department of ANE MOFMOS LAB MANUAL
8
EXPERIMENT 2
ORIFICE METER TEST RIG
IntroductionAn ORIFICE METER is a simple device used for measuring the discharge through pipesThe basic principle on which an Orifice meter works is that by reducing the cross ndash sectionalarea of the flow passage a pressure difference between the two sections before and after Orificeis developed and the measure of the pressure difference enables the determination of thedischarge through the pipe However an Orifice meter is a cheaper arrangement for dischargemeasurement through pipes and its installation requires a smaller length as compared withVenturi Meter As such where the space is limited the Orifice meter may be used for themeasurement of discharge through pipes
General Description
The apparatus consists of (1) Orifice meter (2) Piping system (3) supply pump set (4) Measuringtank (5) Differential manometer (6) Sump
Constructional Specification
bull Flow Meters Consists of Orifice meter of size 25 mm provided for experiments The
meter has the adequate cocks also with them
bull Piping System Consists of a set of GI piping of size 25 mm with sufficient upstream
and downstream lengths provided with separate control valves and mounted on a suitablestand Separate upstream and downstream pressure feed pipes are provided for themeasurement of pressure heads with control valves situated on a common plate for easy
operation
bull Supply Pump Set Is rigidly fixed on sump The mono block pump with motor
Operating on single phase 220240 volts 50 Hz AC supply
bull Measuring Tank Measuring tank with gauge glass and scale arrangement for quick and
easy measurement
bull Differential Manometer Differential manometer with 1 mm scale graduations to
measure the differential head produced by the flow meter
bull
Sump Sump to store sufficient water for independent circulation through the unit forexperimentation and arranged within the floor space of the main unit
Before Commissioning
bull Check whether all the joints are leak proof and water tight
bull Fill the manometer to about half the height with mercury
bull Close all the cocks pressure feed pipes and manometer to prevent damage and over
loading of the manometer
7232019 MOFMOS LABpdf
httpslidepdfcomreaderfullmofmos-labpdf 1047
Department of ANE MOFMOS LAB MANUAL
983097
bull Check the gauge glass and meter scale assembly of the measuring tank and see that it is
fixed water tight and vertically
bull
Check proper electrical connections to the switch which is internally connected to themotor
Experiments
bull
The apparatus is primarily designed for conducting experiments on the coefficient ofdischarge of flow meters Each flow meter can be connected to the manometer throughthe pressure feed opening and the corresponding cocks
bull
While taking readings close all the cocks in the pressure feed pipes except the two(Down-stream and upstream) cocks which directly connect the manometer to the requiredflow meter for which the differential head is to be measured (Make sure while takingreading that the manometer is properly primed Priming is the operation of filling themanometer upper part and the connecting pipes with water and venting the air from the
pipes)
bull
First open the inlet gate valve of the apparatus Adjust the control valve kept at the exitend of the apparatus to a desired flow rate and maintain the flow steadily
bull
The actual discharge is measured with the help of the measuring tank The differentialhead produced by the flow meter can be found from the manometer for any flow rate
7232019 MOFMOS LABpdf
httpslidepdfcomreaderfullmofmos-labpdf 1147
Department of ANE MOFMOS LAB MANUAL
10
CALIBRATION OF ORIFICE METER
Aim - To calibrate a given Orifice meter and to study the variation of coefficient of discharge ofit with discharge
Apparatus -Orifice meter manometer stop watch experimental set-up
Procedure-1
Start the motor keeping the delivery valve close2
The water is allowed to flow through the selected pipe by selecting the appropriate ballvalve
3 By regulating the valve control the flow rate and select the corresponding pressuretapings (ie of orifice meter)
4 Make sure while taking readings that the manometer is properly primed Priming is theoperation of filling the manometerrsquos upper part and the connecting pipes with water byventing the air from the pipes Note down the difference of head ldquohrdquo from the manometer
scale5 Note down the time required for the rise of 10cm (ie 001m) water in the collecting tank
by using stop watch Calculate actual discharge using below formula
Discharge - The time taken to collect some lsquoRrsquo cm of water in the collecting tank in msup3sec
act
A x RQ =
t
Where A = area of the collecting tank in msup2 (03m X 03m)R = rise of water level taken in meters (say 01m or 10cm)t = time taken for rise of water level to rise lsquoRrsquo in lsquotrsquo seconds
6
Using difference in mercury level ldquohrdquo calculate the theoretical discharge of venturimeterby using following expression
1 2th
2 2
1 2
a xa 2gHQ =
a -a
Where
H= difference of head in meters =m
1 2 1 2
w
S(h -h ) x ( -1) = (h -h ) x 126 m
S
a1 = area of orifice at inlet =
2
1
4
d π
a2 = area of orifice at inlet =
2
2
4
d π
g =Acceleration due to gravityd1 =Inlet diameter in meters d2 =Throat diameter in meters
7 Calculate the coefficient of discharge of orifice meter (Cd)
7232019 MOFMOS LABpdf
httpslidepdfcomreaderfullmofmos-labpdf 1247
Department of ANE MOFMOS LAB MANUAL
11
act
theo
QCd=
Q
8
Repeat the steps 3 to 7 for different sets of readings by regulating the discharge valve
S No Orifice inlet diameterd1
Orifice diameterd2
1 25mm 130
S NoTime for (10 cm)
raise of water
level in sec
Actualdischarge =
Qa
Differential head inmm of mercury Theoretical
discharge = Qt
Cd = Qa Qt
h1 h2 H
1
2
3
4
5
6
7
8
9
10
Calculation-
Precautions-
bull Do not run the pump dry
bull Clean the tanks regularly say for every 15days
bull Do not run the equipment if the voltage is below 180V
bull
Check all the electrical connections before running
bull
Before starting and after finishing the experiment the main
7232019 MOFMOS LABpdf
httpslidepdfcomreaderfullmofmos-labpdf 1347
Department of ANE MOFMOS LAB MANUAL
12
bull Control valve should be in close position
bull Do not attempt to alter the equipment as this may cause
bull Damage to the whole system
Results and Conclusions-
EXPERIMENT 3
PIPE FRICTION APPARATUS
Introduction
A pipe may be of various diameters and may have bends valves etc When a liquid isflowing through such pipes the velocity of the liquid layer adjacent to the pipe wall is zero Thevelocity of the liquid goes on increasing from the wall and hence shear stresses are produced inthe liquid due to viscosity This viscous action causes loss of energy which is usually known asFrictional loss
Here we are going to consider two important losses that occur during flow
bull
Major Losses
bull
Minor Losses
7232019 MOFMOS LABpdf
httpslidepdfcomreaderfullmofmos-labpdf 1447
Department of ANE MOFMOS LAB MANUAL
13
bull Major losses occur due to friction This friction may be due to viscosity or roughness in
the pipe
bull
Minor losses can be due to various reasons such as Inlet and Outlet of the pipe bendsgates sudden expansions and contractions The apparatus is designed to study the friction
losses that appear in long pipes and the obstructions that are encountered in the way offlow by various types of fittings
General DescriptionThe unit consists mainly of 1) Piping System 2) Measuring Tank 3) Differential Manometer 4)Supply pump set 5) Sump
bull Constructional Specification
bull Piping System Piping System of size 127 mm 20 mm and 20 mm (SS) dia With
tapings at 1 meter distance and a flow control valve
bull
Measuring Tank Measuring tank is provided to measure the discharge of water fromthe unit
bull Differential Manometer Differential manometer with 1 mm scale graduations to
measure the loss of head in the pipe line
bull Supply Pump Set Supply pump set is rigidly fixed on the sump The pump set is mono
block pump with 05 HP motor operating on single phase 220 volts 50 Hz AC supply
bull Sump Sump is provided to store sufficient waters for independent circulation through
the unit for experimentation and arranged within the floor space of the main unit
Before Commissioning
bull
Check whether all the joints are leak proof and watertight
bull
Close all the cocks on the pressure feed pipes and Manometer to prevent damage andoverloading of the manometer
bull Check the gauge glass and meter scale assembly of the measuring tank and see that it is
fixed water tight and vertical
bull
Check proper electrical connections to the switch which is internally connected to themotor
Experiments
bull
The apparatus is primarily designed for conducting experiments on the frictional losses inpipes of different sizes Three different sizes of pipes are provided for wide range ofexperiments Each individual pipe can be connected to the Manometer through thepressure feed pipes having individual quick operating cocks
bull
While taking reading close all the cocks in the pressure feed pipe except the two (upstream and downstream) cocks which directly connect the manometer to the requiredpipe for which the loss in head has to be determined (Make sure while taking readings
7232019 MOFMOS LABpdf
httpslidepdfcomreaderfullmofmos-labpdf 1547
Department of ANE MOFMOS LAB MANUAL
14
that the manometer is properly primed Priming is the operating of filling the Manometerupper part and the connecting pipes with water venting the air from the pipes)
bull First open the inlet gate valve of the apparatus Adjust the control valve kept at the exit
end of the apparatus to a desired flow rate and maintain the flow steadily
bull
The actual discharge is measured with the help of the measuring tank For each size ofthe pipe the area of cross section of flow can be calculated from the known diameter ofthe pipes From these two valves and the average velocity of stream through the pipe canbe calculated
bull The actual loss of head is determined from the Manometer readings The frictional loss of
head in pipes is given by the Darcys formulaThe friction coefficient indicates f
7232019 MOFMOS LABpdf
httpslidepdfcomreaderfullmofmos-labpdf 1647
Department of ANE MOFMOS LAB MANUAL
15
FRICTION FACTOR FOR A GIVEN PIPE LINE
Aim - To calculate the friction factor for a given pipe line
Apparatus - experimental set-up stop watch
Procedure-
1 Start the motor keeping the delivery valve close2
The water is allowed to flow through the selected pipe by selecting the appropriateball valve
3 By regulating the valve control the flow rate and select the corresponding pressuretapings
4
Make sure while taking readings that the manometer is properly primed Priming isthe operating of filling the Manometer upper part and the connecting pipes with waterventing the air from the pipes Note down the loss of head ldquohfrdquo from the manometerscale
5
Note down the time required for the rise of 10cm (ie 01m) water in the collectingtank by using stop watch Calculate discharge using below formula
Discharge - The time taken to collect some lsquoxrsquo cm of water in the collecting tank in msup3sec
A x RQ =
t
A = area of the collecting tank in msup2 (03m X 03m)R = rise of water level taken in meters (say 01m or 10cm)t = time taken for rise of water level to rise lsquorrsquo in lsquotrsquo seconds
6 Calculate the velocity of the jet by following formula
V = Discharge = Q A msecArea of the pipe
A = cross sectional area of the pipe=Πdsup2 4d = pipe diameter
7 Calculate the coefficient of friction for the given pipe by fLvsup2
hf = ---------ρgd
Wherehf - Loss of head of water = (h1-h2)(Sn So ndash 1) = (h1-h2) 1261000 m
f - Co-efficient of friction for the pipeL - Discharge between sections for which loss of head is measured (1 meter)v - Average velocity of flow in msecg - Acceleration due to gravity 981msecd - Pipe diameter in meters
8 Repeat the steps 2 to 7 for different sets of readings by regulating the discharge valve
7232019 MOFMOS LABpdf
httpslidepdfcomreaderfullmofmos-labpdf 1747
Department of ANE MOFMOS LAB MANUAL
16
Tabular Form
S No Oslash of pipeArea(a)
Time forrise of 10cm water
Discharge VelocityLoss ofHead
hf
Co-efficientof friction
f
Calculation-
bull Total Head H
H = (h1 + h2) x 126 m of waterWhere
126 = conversion factor from mercury to water head
bull
Discharge Q
WhereA = Area of collecting tank = 0125 msup2R = Rise in water level of the collecting tank cm
t = time for lsquoRrsquo cm rise of water sec100 = Conversion from cm to m
bull
Velocity V
msWhere Arsquo = area of the pipefitting in use
7232019 MOFMOS LABpdf
httpslidepdfcomreaderfullmofmos-labpdf 1847
Department of ANE MOFMOS LAB MANUAL
17
bull
Friction Factor(Major Losses) F
Where H = total head m of waterV = velocity mg = acceleration due to gravity 981mssup2L = Distance bw tapping = 15m
bull
Head Loss Due To Fittings (Minor Losses) K
Where H = total head m of waterV = velocity mg = acceleration due to gravity 981mssup2
Precautions
1) Do not run the pump dry2)
Clean the tanks regularly say for every 15days3)
Do not run the equipment if the voltage is below 180V4) Check all the electrical connections before running5) Before starting and after finishing the experiment the main control valve should be in
close position6) Do not attempt to alter the equipment as this may cause damage to the whole system
Results and Conclusions
7232019 MOFMOS LABpdf
httpslidepdfcomreaderfullmofmos-labpdf 1947
Department of ANE MOFMOS LAB MANUAL
18
EXPERIMENT 4
BERNOULLIrsquoS EXPERIMENTIntroduction
Bernoullirsquos Theorem gives the relationship between pressure head velocity head and thedatum Here the attempt has been made to study the relationship of the above said parametersusing venturimeter
General Description
bull The apparatus consists of a specially fabricated clear ACRYLIC Venturimeter
with necessary tappings connected to a Multibank Piezometer also made of clearACRYLIC
bull
The apparatus consists of two overhead tanks interconnected with the venturimeterwhich is placed in between the tanks
bull The overhead tanks are provided with the Head variation mechanism for conducting
the experiments at various heads
bull
Water in the sump tank is pumped using a Monobloc Centrifugal pump (Kirloskarmake) which passes through the control valve to the overhead tank
bull The height of the water in the collecting tank is measured using the acrylic
Piezometer to find the flowrate
bull The whole arrangement is mounted on an aesthetically designed sturdy frame
made of MS tubes and NOVAPAN Board with all the provisions for holding thetanks and accessories
Aim
o
The experiment is conducted too
Study of Pressure Gradient at different zoneso
Verification of Bernoullis Equationo
Comparative analysis under different flow rates
Apparatus
1) Venturimeter 2)Piezometer 3) Overhead Tank 4)Sump Tank 5) Centrifugal Pump
Procedure
1) Fill in the sump tank with clean water2)
Keep the delivery valve closed3)
Check and give necessary electrical connections to the system4) Switch on the pump amp Slowly open the delivery valve5)
Adjust the flow through the control valve of the pump6)
Allow the system to attain the steady state ie let the water pass from the secondoverhead tank to the collecting tank
7) Note down the Pressure head at different points of the venture meter on the multi-tubepiezometer (Expel if any air is the by inserting the thin pin into the piezometer openings)
8) Close the ball valve of the collecting tank and measure the time for the known rise ofwater
7232019 MOFMOS LABpdf
httpslidepdfcomreaderfullmofmos-labpdf 2047
Department of ANE MOFMOS LAB MANUAL
1983097
9) Change the flow rate and repeat the experiment
Observation
SlNo
Static Head Loss h Time for lsquoRrsquo
cm rise in waterlsquoTrsquo sec1 2 3 4 5 6 7 8 9 10
1
2
3
4
5
Calculations1
Discharge QA2
Where
A = Area of collecting tank = 0045 msup2R = Rise in water level of the collecting tank cmt = time for lsquoRrsquo cm rise of water sec100 = Conversion from cm to m
3 Pressure Head
Where
ρ = density of waterg = gravitational constanth = head measured m of water column
3 Velocity Head
WhereV = Q a a = Area at the particular section of the venturimeter msup2
4 Verification of BERNOULLIrsquoS EQUATIONBernoullirsquos Equation is given as
After findinga Pressure Head hb
Velocity headat different cross-section of the Venturimeter
7232019 MOFMOS LABpdf
httpslidepdfcomreaderfullmofmos-labpdf 2147
Department of ANE MOFMOS LAB MANUAL
20
Put the same in the above equation for different points and verify whether all the values obtainedare sameNote Consider the datum z to be constant
Precautions
bull
Do not run the pump drybull
Clean the tanks regularly say for every 15days
bull
Do not run the equipment if the voltage is below 180V
bull
Check all the electrical connections before running
bull Before starting and after finishing the experiment the main
bull Control valve should be in close position
bull Do not attempt to alter the equipment as this may cause
bull
Damage to the whole system
Result and Conclusion
7232019 MOFMOS LABpdf
httpslidepdfcomreaderfullmofmos-labpdf 2247
Department of ANE MOFMOS LAB MANUAL
21
EXPERIMENT 5
CALIBRATION OF A TRIANGULAR NOTCH
AIM -To find the coefficient of discharge of given triangular notch
THEORY-A notch is a device used for measuring the rate of flow of liquid through a smallchannel or a tank It may be defined as an opening in the side of a tank or small channel in suchthat a way that the liquid surfaces in the tank or channel is below the top edge of the opening
NOTCHES ARE CLASSIFIED AS-1 Rectangular notch2 Triangular notch3 Trapezoidal notch
4 Stepped notch
A triangular notch is preferred to a rectangular notch due to the following reasonsThe expression for discharge of triangular notch is compared to rectangular notch is simple Formeasuring low discharge a triangular notch gives more accurate results than a rectangular notchIn the case of triangular notch only H is required for the computation of dischargeA trapezoidal notch is a combination of rectangular and triangular notch and thus the dischargethrough trapezoidal notch is the sum of above notchesA stepped notch is a combination of rectangular notch and triangular notch The dischargethrough the stepped notch is equal to sum of discharges through the different rectangularnotches
DESCRIPTION- The apparatus consists of1) Measuring tank 2) Sump tank3) Supply pump set 4) Inlet and out let valve
Measuring tank Stainless steel tank of size 030305mm height with the gage glass a scalearrangement for quick and easy measurements A ball valve is provided to empty the tank and adrain is provided at the bottom of the tank to drain the waste water when the unit is not in useWater for independent circulation through the unit for experimentation and arranged within thefloor space of the main unitSump tank The sump tank is a size of 020303m stainless steel tank to store sufficient waterfor independent circulation through the unit for experimentation and arranged within the floorspace of the main unit about 060305m with a gauge glass and scale arrangement A ballvalve is provided to empty the tankSupply Pump set The pump is 2525mm size mono block with frac12 HP 2880 RPM singlephase 220volts AC supply Inlet and out let valve- These valves are used to control the flow ofwater at inlet and out let
PROCEDURE1 Allow the water to drain up to triangular notch
7232019 MOFMOS LABpdf
httpslidepdfcomreaderfullmofmos-labpdf 2347
Department of ANE MOFMOS LAB MANUAL
22
2 Note down the depth of the water when the water is coinciding with the v notch point
3 Collect water in collecting tank and close the drain valve and find the time taken for the rise ofwater up to 20cm
4 Calculate the discharge by using the above results
5 Now substituting the values in the formula for calculation of discharge for v- notch gives therequired result
Precautionsbull Do not run the pump dry
bull Clean the tanks regularly say for every 15days
bull Do not run the equipment if the voltage is below 180V
bull Check all the electrical connections before running
bull
Before starting and after finishing the experiment the main
bull
Control valve should be in close position
bull
Do not attempt to alter the equipment as this may cause
7232019 MOFMOS LABpdf
httpslidepdfcomreaderfullmofmos-labpdf 2447
Department of ANE MOFMOS LAB MANUAL
23
bull Damage to the whole system
Result and Conclusion
7232019 MOFMOS LABpdf
httpslidepdfcomreaderfullmofmos-labpdf 2547
Department of ANE MOFMOS LAB MANUAL
24
MECHANICSOF SOLIDS
LAB
7232019 MOFMOS LABpdf
httpslidepdfcomreaderfullmofmos-labpdf 2647
Department of ANE MOFMOS LAB MANUAL
25
7232019 MOFMOS LABpdf
httpslidepdfcomreaderfullmofmos-labpdf 2747
Department of ANE MOFMOS LAB MANUAL
983089
IZOD IMPACT TEST
AIM To perform the izod impact test on materials
APPARATUS Izod impact test machine test specimen vernier calipers steel rule
IMPACT STRENGTH The resistance of a material to fracture under sudden load application
MATERIALS Two types of test pieces are used for this test as given
1) Square cross-section
2) Round cross-section
THEORY The type of test specimen used for this test is a Square Cross-section
The specimen may have single two or three notches The testing machine shouldhave the following specifications The angle between top face of grips and face holding the specimen Vertical=900 the angle of tip of hammer =750plusmn10
The angle between normal to the specimen and underside face of the hammer at Striking point=100plusmn10
Speed of hammer at impact=399msecStriking energy=168N-m or Joules Angle
Of drop of pendulum =900 Effective
weight of pendulum=2179kg
Minimum value of scale graduation=2 Joules
Permissible total friction loss of corresponding energy=050
Distance from the axis of rotation of distance between the base of specimen notch andthe point of specimen hit by the hammer=22mmplusmn05mm
The longitudinal axes of the test piece shall lie in the plane of swing of the center ofgravity of the hammer The notch shall be positioned so that its in the plane of thehammer the notch shall be positioned its plane of symmetry coincides with the top faceof the grips for setting the specimen the notch impact strength I is calculated accordingto the following relation
Where I= impact strength in joulesm2
7232019 MOFMOS LABpdf
httpslidepdfcomreaderfullmofmos-labpdf 2847
Department of ANE MOFMOS LAB MANUAL
983090
PROCEDURE
1 For conducting Izod test a proper striker is to be fitted firmly to the bottom of thehammer with the help of the clamming piece
2 The latching take for izod test is to be firmly fitted to the bearing housing at the side of
the columns3 The frictional loss of the machine can be determined by free fall test raise the
hammer by hands and latch in release the hammer by operating lever the pointer will
then indicate the energy loss due to friction From this reading confirm that the friction
loss is not exceeding 05 of the initial potential energy Otherwise frictional loss has to
be added to the final reading
4 The specimen for izod test is firmly fitted in the specimen support with the help ofclamping screw and eacutelan key Care should be taken that the notch on the specimenshould face to pendulum striker
5 After ascertaining that there is no person in the range of swinging pendulum release the
pendulum to smash the specimen6 Carefully operate the pendulum brake when returning after one swing to stop the oscillations
7 Read-off position of reading pointer on dial and note indicated value
8 Remove the broken specimen by loosening the clamping screw
The notch impact strength depends largely on the shape of the specimen and the notch the
values determined with other specimens therefore may not be compared with each other
OBSERVATION TABLE
S No A(Area of cross K Impact energy I Impact Strength
section of observed
specimen)
RESULT
7232019 MOFMOS LABpdf
httpslidepdfcomreaderfullmofmos-labpdf 2947
Department of ANE MOFMOS LAB MANUAL
983091
Calculation Part
7232019 MOFMOS LABpdf
httpslidepdfcomreaderfullmofmos-labpdf 3047
Department of ANE MOFMOS LAB MANUAL
983092
ROCKWELL HARDNESS TEST
AIM To determine the Rockwell hardness of the given test specimen
APPARATUS Rockwell hardness testing machine test specimen
THEORY
Hardness-the resistance of a metal to plastic deformationagainst indentation scratching abrasion or cutting
The depth of penetration of the indenter measures the hardness of a material by this Rockwell ‟s hardness test method the depth of penetration is inversely
proportional to the hardness Both ball or diamond cone types of indenters are used inthis testThere are three scales on the machine for taking hardness readings
Scale bdquoA‟ with load 60kgf or 5888N and diamond indenter is used for performing tests on steel and shallow case hardened steel
Scale bdquoB‟ with load 100kgf or 9807 N and 1588mm dia ball indenter is used forperforming tests on soft steel malleable iron copper and aluminum alloys
Scale bdquoC‟ with load 150kgf or 1471 N and diamond indenter is used for performing testson steel hard cost steel deep case hardened steel other metals which harder
First minor load is applied to overcome the film thickness on the metal surfaceMinor load also eliminates errors in the depth of measurement due to spring of themachine frame or setting down of the specimen and table attachments
The Rockwell hardness is derived from the measurement of the depth of theimpression This method of test is suitable for finished or machined parts of simpleshapes
PROCEDURE
1 Select the load by rotating the nob and fix the suitable indenter
2 Clean the test piece and place on the special anvil or worktable of the machine
3 Turn the capstan wheel to evaluate the test specimen into contact with the indenterpoint
4 Further turn the wheel for three rotations forcing the test specimen against theindenter This will ensure the minor load has been applied5 Set the pointer on the scale dial at the appropriate position
7232019 MOFMOS LABpdf
httpslidepdfcomreaderfullmofmos-labpdf 3147
Department of ANE MOFMOS LAB MANUAL
983093
6 Push the lever to apply the major load A dash pot provided in the loading mechanismto ensure that the load is applied gradually
7 As soon as the pointer comes to rest pull the handle in the reverse direction slowlyThis releases the major but not the minor load The pointer will now rotate in the reversedirection
8 The Rockwell hardness can read off the scale dial on the appropriate scale after thepointer comes to rest
OBSERVATIONS
Material of the specimen =
Thickness of test specimen =
Hardness scale used =
Test Material Rockwell Scale of weights Rockwell number Average
no Rockwell
no
Scale weight indent 1 2 3
PRECAUTIONS
1 For testing cylindrical test specimens use V-type platform
2 Calibrate the machine occasionally by using standard test blocks
3 For thin metal prices place another sufficiently thick metal piece between the testspecimen and the platform to avoid any damage which may likely occur to the platform
4 After applying major load wait for some time to allow the needle to come to restThe waiting time may vary from 2 to 8 seconds
7232019 MOFMOS LABpdf
httpslidepdfcomreaderfullmofmos-labpdf 3247
Department of ANE MOFMOS LAB
MANUAL
983094
5 The surface of the test piece should be smooth and even and free from oxidescale and foreign matter6 Test specimen should not be subjected to any heating of cold working
7 The distance between the centers of two adjacent indentation should be at least 4
Times the diameter of the indentation and the distance from the center of any indentation tothe edge of the test piece should be at least 25 times the diameter of the indentation
RESULT
7232019 MOFMOS LABpdf
httpslidepdfcomreaderfullmofmos-labpdf 3347
Department of ANE MOFMOS LAB MANUAL
983095
Calculation Part
7232019 MOFMOS LABpdf
httpslidepdfcomreaderfullmofmos-labpdf 3447
Department of ANE MOFMOS LAB MANUAL
983096
BRINELLrsquoS HARDNESS TEST
AIM To determine the Brinell hardness of the given test specimen
APPARATUS Brinell hardness machine test specimen Brinells Microscope
THEORY
Indentation Hardness-A number related to the area or to the depth of
the impression made by an indenter or fixed geometry under a known fixed load
This method consists of indenting the surface of the metal by a hardened steel
ball of specified diameter D mm under a given load F kgf and measuring the average
diameter d mm of the impression with the help of Brinell microscope fitted with a scaleThe Brinell hardness HB is defined as the quotient of the applied force F divided by the
spherical area of the impression
HB= Test load in kgfsurface area of indentation
=2F πD (D- D2- d2) kgmm2
PROCEDURE
1 Select the proper size of the ball and load to suit the material under test2 Clean the test specimen to be free from any dirt and defects or blemishes
3 Mount the test piece surface at right angles to the axis of the ball indenter plunger
4 Turn the platform so that the ball is lifted up
5 By shifting the lever applies the load and waits for some time
6 Release the load by shifting the lever
7 Take out the specimen and measure the diameter of indentation by means of theBrinell microscope8 Repeat the experiments at other positions of the test piece
9 Calculate the value of HB
7232019 MOFMOS LABpdf
httpslidepdfcomreaderfullmofmos-labpdf 3547
Department of ANE MOFMOS LAB MANUAL
983097
OBSERVATIONS
Test piece material = Diameter of the ballrdquo D ldquo =
Load section FD2 = Test load =
Load application time =
Least count of Brinell Microscope =
Diameter Average
Impression F D HB
S No in kg in mm Kgmm2
(d1) (d2) (d1+d2)2
PRECAUTIONS
1 The surface of the test piece should be clean
2 The testing machine should be protected throughout the test from shock or vibration
3 The test should be carried out at room temperature
4 The distance of the center of indentation from the edge of test piece should be at
least 25 times the diameter of the indentation and the distance between the center ofthe two adjacent indentations should be at least 4 times the diameter of the indentation
5 The diameter of each indentation should be measured in two directions at rightangles and the mean value readings used the purpose of determining the hardnessnumber
7232019 MOFMOS LABpdf
httpslidepdfcomreaderfullmofmos-labpdf 3647
Department of ANE
MOFMOS LAB MANUAL
983089983088
RESULT
Calculation Part
7232019 MOFMOS LABpdf
httpslidepdfcomreaderfullmofmos-labpdf 3747
Department of ANE MOFMOS LAB MANUAL
983089983089
SPRING TEST
AIM To determine the rigidity modulus of the spring
APPARATUS Spring testing machine vernier calipers spring specimen
THEORY
Closed coiled helical springs are the springs in which helix angle is very small or inother words the pitch between two adjacent turns is small A closed coiled helical springcarrying an axial load is shown in fig
As helix angle in case of close coiled helical springs are small hence the bendingeffect on the spring is ignored and we assume that the coils of close coiled helical
springs are to stand purely tensional stresses Let d=diameter ofthe spring wire
P= pitch of the helical spring N= number ofcoils R= mean radius of the spring coil
W=axial load on spring C=modulus of rigidity
τ=maximum shear stress induced in the wire θ=angle of twist in the
spring wire and
x= deflection of spring due to axial load l= length of wire
Net twisting moment on the wire T=WR
But twisting moment is also given by T= (π 16) τd3
From 1 ad 2 WR = (π 16) τd3 τ=16WR πd
3
above equation which gives the maximum shear stress induced in the wire (1) Length of one coil=2πR
Total length of the wire=2πRn (2)
Strain energy stored by the spring due to torsion
U= (τ 4C) [(π 4)d 2πRn] (3)
Work done on the spring =average load x deflection
= (12) Wx (4)
Equating 3 and 4
(12) Wx = (32W2R3n)Cd4
7232019 MOFMOS LABpdf
httpslidepdfcomreaderfullmofmos-labpdf 3847
Department of ANE MOFMOS LAB MANUAL
983089983090
x=64WR3nCd
4
Rigidity modulus of the spring
C=64WR3nxd
4
PROCEDURE
1) Consider the spring and find out itsmean coil radius R with the help ofvernier calipers
2) Find the diameter of the spring andnumber of turns
3) Fix the spring between two hooks
4) Now load is gradually applied
5) Note the deflection from thedeflection scale for different loadsapplied
6) Calculate the rigidity modulus usingabove formula
PRECAUTIONS
1) Dimensions should be measureaccurately with the help of verniercalipers
2) Deflection from the scale should benoted carefully and accurately
OBSERVATION TABLE
Sno Load applied deflection Rigidity modulus
C
Average rigidity modulus C =
RESULT
7232019 MOFMOS LABpdf
httpslidepdfcomreaderfullmofmos-labpdf 3947
Department of ANE MOFMOS LAB MANUAL
983089983091
Calculation Part
7232019 MOFMOS LABpdf
httpslidepdfcomreaderfullmofmos-labpdf 4047
Department of ANE MOFMOS LAB MANUAL
983089983092
TORSION
AIM To conduct torsion test on mild steel or cast iron specimen to find modulus of rigidity or to find angle of twist of the materials which are subjected to torsion
APPARATUS 1 A torsion test machine along with angle of twist measuring attachment
2 Standard specimen of mild steel or cast iron
3 Steel rule
4 Vernnier caliper or a micrometer
THEORY
For transmitting power through a rotating shaft it is necessary to apply a turning
force The force is applied tangentially and in the plane of transverse cross section The
torque or twisting moment may be calculated by multiplying two opposite turningmoments It is said to be in pure torsion and it will exhibit the tendency of shearing off at
every cross section which is perpendicular to the longitudinal axis
Torsion equation
Torsion equation is given by below
T IP = CθL = TR
T= maximum twisting torque (Nmm) IP =
polar moment of inertia (mm4) τ =shear
stress (Nmm2) C=modulus of rigidity (Nmm2)
θ=angle of twist in radians L=length of shaft under torsion (mm)
Assumptions made for getting torsion equation
1 The material of the shaft is uniform through out
2 The shaft circular in section remain circular after loading
3 Plane sections of shaft normal to its axis before loading remain plane after thetorque have been applied
4 The twist along the length of the shaft is uniform throughout
5 The distance between any two normal-sections remains the same after theapplication of torque
6 Maximum shear stress induced in the shaft due to application of torque does notexceed its elastic limit
7232019 MOFMOS LABpdf
httpslidepdfcomreaderfullmofmos-labpdf 4147
Department of ANE MOFMOS LAB MANUAL
983089983093
PROCEDURE
1 Select the suitable grips to suit the size of the specimen and clamp it in themachine by adjusting sliding jaw
2 Measure the diameter at about the three places and take average value
3 Choose the appropriate loading range depending upon specimen
4 Set the maximum load pointer to zero
5 Carry out straining by rotating the hand wheel or by switching on the motor
6 Load the members in suitable increments observe and record strain reading
7 Continue till failure of the specimen
8 Calculate the modulus of rigidity C by using the torsion equation
9 Plot the torque ndashtwist graph (T Vs θ)
OBSERVATIONS
Gauge length L =
Polar moment of inertia IP =
Modulus of rigidity C =TL IP θ =
SNo Twisting Moment Angle of Twist Modulus Average
Kgf Nm Degrees Radians of rigidity CNmm2
C
RESULT
7232019 MOFMOS LABpdf
httpslidepdfcomreaderfullmofmos-labpdf 4247
Department of ANE MOFMOS LAB MANUAL
983089983094
TENSILE TEST
AIM
To conduct tensile test on a mild steel specimen and determine the following
1 Limit of proportionality 2 Elastic Limit
3 Upper yield point 4 Lower yield point
5 Ultimate strength 6 Fracture strength
7 Young`s Modulus 8 Percentage elongation
9 Percentage reduction in area 10 Ductility
11 Toughness 12 True stress amp true strain
13 Malleability
APPARATUS tensile testing machine specimen steel rule vernier caliper micrometer
THEORY
The tensile test is most applied one of all mechanical tests In this test a test specimen is fixed
into grips connected to a straining device and to a load-measuring device (One end in stationary
grips and the other in movable grips) If the applied load is small enough the deformation of any
solid body is entirely elastic An elastically deformed solid will return to its original form as soon
as load is removed However if the load is too large the material can be deformed permanently
The initial part of the tension curve which represents the manner in which solid undergoes
plastic deformation is termed as plastic The stress below which the deformation is essentially
entirely elastic is known as the elastic limit of the material In some materials like mild steel a
sudden drop in load indicating both an upper and lower yield point denotes the onset of plastic
deformation However some materials do not exhibit a sharp yield point During plastic
deformation at lager extensions strain hardening cannot compensate for the decrease in section
and thus the load passes through a maximum and then begins to decrease At this stage the
ultimate strength which is defined as the ration of the load on the specimen to the original cross-section area reaches a maximum value Until this point the deformation is uniform at all the
sections of the specimen Further loading will eventually cause bdquoneck ‟ formation and rupture
follows
7232019 MOFMOS LABpdf
httpslidepdfcomreaderfullmofmos-labpdf 4347
Department of ANE MOFMOS LAB
MANUAL
983089983095
Usually a tension test is conducted at room temperature the tensile load is applied
slowly During this test either round or flat specimens may be used The load on the specimen is
applied mechanically or hydraulically depending on the type of testing machine
1 NominalEngg stress and NominalEngg strain
Original CS area = A0 (mm2)
Original gauge length = L0 (mm) Increase in gauge length = δL0
Nominal stress = PA0 (N mm2)
Nominal strain = δL0 L0
2 Limit of Proportionality Stress is proportional to strain up to this pointNormal Stress = PA PO Normal Strain = (δ LO) ALO
3 Elastic limit When the load is removed at ldquoBrdquo the specimen will go back to originalDimensions ie LO and δ AO Nominal stress = PB AO Normal Strain = (δ LO) B LO
If the specimen is loaded beyond elastic limit it will undergo permanent strainie Plastic deformation
4 Upper yield point Nominal stress = PC AO Nominal strain = (δ LO) D LO
5 Lower yield point Nominal stress = PD AO
Nominal strain = (δ LO) D LO 6 Ultimate load or maximum load point
Nominal ultimate stress = PE AO Nominal strain = (δ LO) E LO
7 Fracture Load point F
Nominal fracture stress = PF AO
Nominal strain at fracture = (δ LO) F LO
8 Young`s modulus (E) Young`s modulus (E) = StressStrain
(In the elastic region limit of proportionality = Nominal stress at ANominal strain at A 9Modulus of resilience = (Nominal stress at elastic limit)
2 2E
Area under Engg Stress - Strain diagram up to elastic limit10 Resilience = Modulus of Resilience x Volume of specimen undergoing Tensile stress
7232019 MOFMOS LABpdf
httpslidepdfcomreaderfullmofmos-labpdf 4447
Department of ANE MOFMOS LAB MANUAL
983089983096
11 Yield point ElongationElongation taking place in the specimen from C to D this istaking place without increase in stress
12 Modulus of toughnessArea under engineering stress ndash strain diagram up to fracture13 Toughness = Modulus of toughness x Volume of specimenThis indicates theamount of energy absorbed by the specimen before fracture take place
14 Ductility= (Final length at fracture ndash original length 10) x 100
15 MalleabilityIt is the ability of the material to undergo plastic deformation prior fracture under compressive loading conditions In a tensile test it is approximatedas percentage reduction in cross sectional area of the specimen Malleability =
(AO - Af )AO) x 100
True stress ndash true strain diagram
Engineering stress is calculated based on original cross sectional area (AO) But not on the actual cross sectional area at load bdquoP‟
True stress = PA = PAO x AO A
Since volume remains constant during plastic deformation we have AO LO = AL True stress = PAO x L LO
= PAO x ((LO + δLO) LO)
= P (1+e)= Nominal stress (1+ nominal strain)
True strain = Є = 1n (1+e)
These relations are valid up to ultimate load ie up to which the strain isuniform all along the gauge length
1 True Stress at upper yield point = Nominal stress at upper yield point ( 1+e O)True strain at C = 1n (1+eo)
2 True stress at ultimate load (E1)= Nominal ultimate stress ( 1+eE)True strain at ultimate load = 1n (1+eE)
3 True stress at fracture (E1) = Pf Af
Where Af is the area of cross section at fracture can be measured True
strain at fracture = 1n (Ao Af )
Area relation is taken instead of lengths because the strains are localized in theregion between ultimate load point and fracture point
4 Strain Hardening
From lower yield point onwards increase in load is required for increase instrain Thus the stress required for further deformation is more Thisphenomenon is called strain hardening
5 True ndash stress ndash true strain curve in log ndash log co ndash ordinates
When the true ndash stress and true ndash strain are plotted on log ndash log co ndash ordinates thecurve is a straight line
7232019 MOFMOS LABpdf
httpslidepdfcomreaderfullmofmos-labpdf 4547
Department of ANE MOFMOS LAB MANUAL
983120983137983143983141 983089983097 983151983142 983090983089
6 Ductile and Brittle Materials
If a material fails without much plastic deformation it can be called brittle If the percentageelongation at fracture is less than 25 the material is classified as brittle
bull Usually the metals with FCC and CPH structures are highly ductile
PROCEDURE
1 Measure the original gauge length and diameter of the specimen
2 Insert the specimen into grips of the test machine
3 Begin the load application and record load vs elongation data
4 Take the readings more frequently as yield point is approached
5 Measure elongation values
6 Continue the test till fracture occurs
7 By joining the two broken halves of the specimen together measure the final length anddiameter of specimen at fracture
RESULTS AND DISCUSSIONS
1 Plot the Engg Stress strain curve and determine the following
bull Limit of proportionality = (Nmm2)
bull Yield strength = (Nmm2)
bull Ultimate strength = (Nmm2)
bull Young`s modulus = (Nmm2)
bull Percentage elongation = bull Percentage reduction in area =
bull Fracture strength = (Nominal Engg)
bull Toughness = Area under stress ndash strain curve up to
fracture
bull Malleability
2 Plot True Stress True strain curve after calculating true ndash stress and true strain values at various
points
Estimate1) Strength coefficient
2) Strain hardening coefficient
3) Determine whether the material is ductile or brittle4) Comment on the results
7232019 MOFMOS LABpdf
httpslidepdfcomreaderfullmofmos-labpdf 4647
Department of ANE MOFMOS LAB MANUAL
983120983137983143983141 983090983088 983151983142 983090983089
SNo Load Deformation Stress Strain E
Calculation part-
7232019 MOFMOS LABpdf
httpslidepdfcomreaderfullmofmos-labpdf 4747
Department of ANE MOFMOS LAB MANUAL
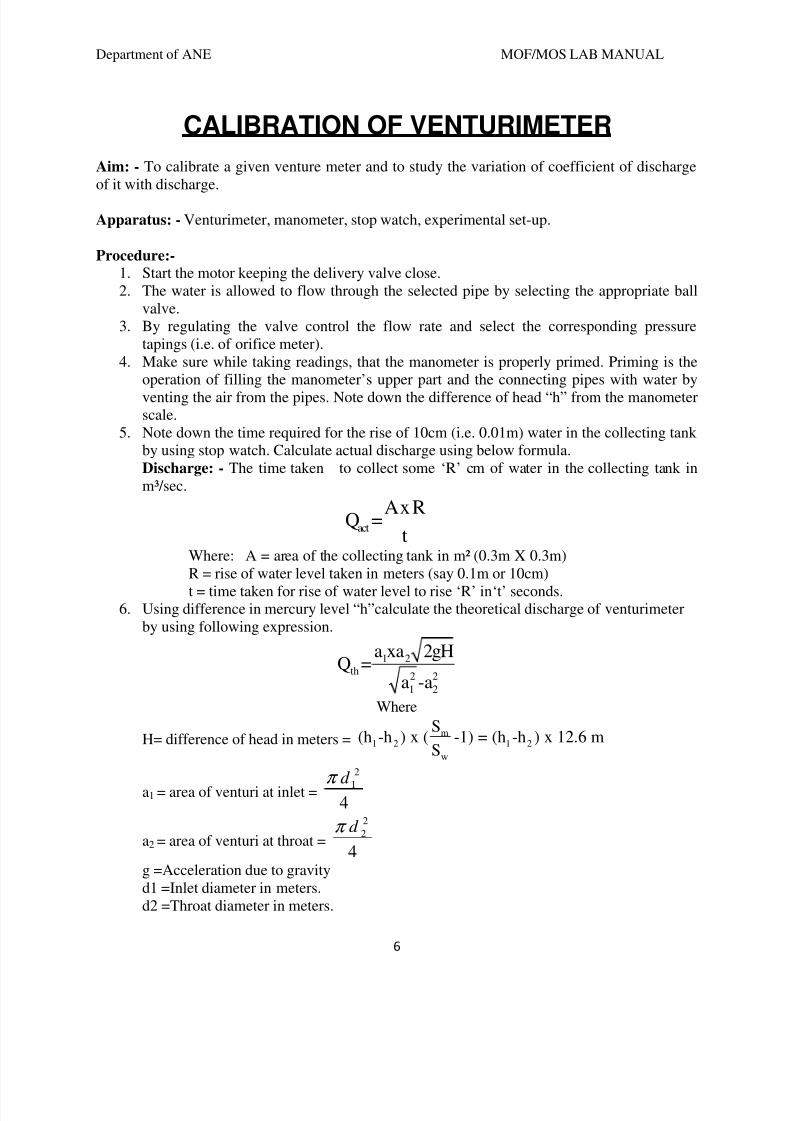
7232019 MOFMOS LABpdf
httpslidepdfcomreaderfullmofmos-labpdf 747
Department of ANE MOFMOS LAB MANUAL
6
CALIBRATION OF VENTURIMETER
Aim - To calibrate a given venture meter and to study the variation of coefficient of dischargeof it with discharge
Apparatus - Venturimeter manometer stop watch experimental set-up
Procedure-1
Start the motor keeping the delivery valve close2 The water is allowed to flow through the selected pipe by selecting the appropriate ball
valve3
By regulating the valve control the flow rate and select the corresponding pressuretapings (ie of orifice meter)
4 Make sure while taking readings that the manometer is properly primed Priming is theoperation of filling the manometerrsquos upper part and the connecting pipes with water by
venting the air from the pipes Note down the difference of head ldquohrdquo from the manometerscale
5 Note down the time required for the rise of 10cm (ie 001m) water in the collecting tankby using stop watch Calculate actual discharge using below formulaDischarge - The time taken to collect some lsquoRrsquo cm of water in the collecting tank inmsup3sec
act
A x RQ =
t
Where A = area of the collecting tank in msup2 (03m X 03m)R = rise of water level taken in meters (say 01m or 10cm)
t = time taken for rise of water level to rise lsquoRrsquo inlsquotrsquo seconds6
Using difference in mercury level ldquohrdquocalculate the theoretical discharge of venturimeterby using following expression
1 2th
2 2
1 2
a xa 2gHQ =
a -a
Where
H= difference of head in meters =m
1 2 1 2
w
S(h -h ) x ( -1) = (h -h ) x 126 m
S
a1 = area of venturi at inlet =
2
1
4
d π
a2 = area of venturi at throat =
2
2
4
d π
g =Acceleration due to gravityd1 =Inlet diameter in meters d2 =Throat diameter in meters
7232019 MOFMOS LABpdf
httpslidepdfcomreaderfullmofmos-labpdf 847
Department of ANE MOFMOS LAB MANUAL
7
7 Calculate the coefficient of discharge of orifice meter (Cd)
act
theo
QCd=
Q
8 Repeat the steps 3 to 7 for different sets of readings by regulating the discharge valve
S NoVenturi inlet diameter
d1 Throat Diameter
d2
1 25mm 135 mm
S No Time for (10 cm)raise of water
level in sec
Actualdischarge =
Qa
Differential headin mm of mercury Theoretical
discharge = Qt Cd = Qq Qt
h1 h2 H
1
2
3
4
5
6 +
78
9
10
Precautions
bull Do not run the pump dry
bull Clean the tanks regularly say for every 15days
bull Do not run the equipment if the voltage is below 180V
bull
Check all the electrical connections before runningbull
Before starting and after finishing the experiment the main Control valve should be inclose position
bull Do not attempt to alter the equipment as this may cause Damage to the whole system
Results and Conclusions
7232019 MOFMOS LABpdf
httpslidepdfcomreaderfullmofmos-labpdf 947
Department of ANE MOFMOS LAB MANUAL
8
EXPERIMENT 2
ORIFICE METER TEST RIG
IntroductionAn ORIFICE METER is a simple device used for measuring the discharge through pipesThe basic principle on which an Orifice meter works is that by reducing the cross ndash sectionalarea of the flow passage a pressure difference between the two sections before and after Orificeis developed and the measure of the pressure difference enables the determination of thedischarge through the pipe However an Orifice meter is a cheaper arrangement for dischargemeasurement through pipes and its installation requires a smaller length as compared withVenturi Meter As such where the space is limited the Orifice meter may be used for themeasurement of discharge through pipes
General Description
The apparatus consists of (1) Orifice meter (2) Piping system (3) supply pump set (4) Measuringtank (5) Differential manometer (6) Sump
Constructional Specification
bull Flow Meters Consists of Orifice meter of size 25 mm provided for experiments The
meter has the adequate cocks also with them
bull Piping System Consists of a set of GI piping of size 25 mm with sufficient upstream
and downstream lengths provided with separate control valves and mounted on a suitablestand Separate upstream and downstream pressure feed pipes are provided for themeasurement of pressure heads with control valves situated on a common plate for easy
operation
bull Supply Pump Set Is rigidly fixed on sump The mono block pump with motor
Operating on single phase 220240 volts 50 Hz AC supply
bull Measuring Tank Measuring tank with gauge glass and scale arrangement for quick and
easy measurement
bull Differential Manometer Differential manometer with 1 mm scale graduations to
measure the differential head produced by the flow meter
bull
Sump Sump to store sufficient water for independent circulation through the unit forexperimentation and arranged within the floor space of the main unit
Before Commissioning
bull Check whether all the joints are leak proof and water tight
bull Fill the manometer to about half the height with mercury
bull Close all the cocks pressure feed pipes and manometer to prevent damage and over
loading of the manometer
7232019 MOFMOS LABpdf
httpslidepdfcomreaderfullmofmos-labpdf 1047
Department of ANE MOFMOS LAB MANUAL
983097
bull Check the gauge glass and meter scale assembly of the measuring tank and see that it is
fixed water tight and vertically
bull
Check proper electrical connections to the switch which is internally connected to themotor
Experiments
bull
The apparatus is primarily designed for conducting experiments on the coefficient ofdischarge of flow meters Each flow meter can be connected to the manometer throughthe pressure feed opening and the corresponding cocks
bull
While taking readings close all the cocks in the pressure feed pipes except the two(Down-stream and upstream) cocks which directly connect the manometer to the requiredflow meter for which the differential head is to be measured (Make sure while takingreading that the manometer is properly primed Priming is the operation of filling themanometer upper part and the connecting pipes with water and venting the air from the
pipes)
bull
First open the inlet gate valve of the apparatus Adjust the control valve kept at the exitend of the apparatus to a desired flow rate and maintain the flow steadily
bull
The actual discharge is measured with the help of the measuring tank The differentialhead produced by the flow meter can be found from the manometer for any flow rate
7232019 MOFMOS LABpdf
httpslidepdfcomreaderfullmofmos-labpdf 1147
Department of ANE MOFMOS LAB MANUAL
10
CALIBRATION OF ORIFICE METER
Aim - To calibrate a given Orifice meter and to study the variation of coefficient of discharge ofit with discharge
Apparatus -Orifice meter manometer stop watch experimental set-up
Procedure-1
Start the motor keeping the delivery valve close2
The water is allowed to flow through the selected pipe by selecting the appropriate ballvalve
3 By regulating the valve control the flow rate and select the corresponding pressuretapings (ie of orifice meter)
4 Make sure while taking readings that the manometer is properly primed Priming is theoperation of filling the manometerrsquos upper part and the connecting pipes with water byventing the air from the pipes Note down the difference of head ldquohrdquo from the manometer
scale5 Note down the time required for the rise of 10cm (ie 001m) water in the collecting tank
by using stop watch Calculate actual discharge using below formula
Discharge - The time taken to collect some lsquoRrsquo cm of water in the collecting tank in msup3sec
act
A x RQ =
t
Where A = area of the collecting tank in msup2 (03m X 03m)R = rise of water level taken in meters (say 01m or 10cm)t = time taken for rise of water level to rise lsquoRrsquo in lsquotrsquo seconds
6
Using difference in mercury level ldquohrdquo calculate the theoretical discharge of venturimeterby using following expression
1 2th
2 2
1 2
a xa 2gHQ =
a -a
Where
H= difference of head in meters =m
1 2 1 2
w
S(h -h ) x ( -1) = (h -h ) x 126 m
S
a1 = area of orifice at inlet =
2
1
4
d π
a2 = area of orifice at inlet =
2
2
4
d π
g =Acceleration due to gravityd1 =Inlet diameter in meters d2 =Throat diameter in meters
7 Calculate the coefficient of discharge of orifice meter (Cd)
7232019 MOFMOS LABpdf
httpslidepdfcomreaderfullmofmos-labpdf 1247
Department of ANE MOFMOS LAB MANUAL
11
act
theo
QCd=
Q
8
Repeat the steps 3 to 7 for different sets of readings by regulating the discharge valve
S No Orifice inlet diameterd1
Orifice diameterd2
1 25mm 130
S NoTime for (10 cm)
raise of water
level in sec
Actualdischarge =
Qa
Differential head inmm of mercury Theoretical
discharge = Qt
Cd = Qa Qt
h1 h2 H
1
2
3
4
5
6
7
8
9
10
Calculation-
Precautions-
bull Do not run the pump dry
bull Clean the tanks regularly say for every 15days
bull Do not run the equipment if the voltage is below 180V
bull
Check all the electrical connections before running
bull
Before starting and after finishing the experiment the main
7232019 MOFMOS LABpdf
httpslidepdfcomreaderfullmofmos-labpdf 1347
Department of ANE MOFMOS LAB MANUAL
12
bull Control valve should be in close position
bull Do not attempt to alter the equipment as this may cause
bull Damage to the whole system
Results and Conclusions-
EXPERIMENT 3
PIPE FRICTION APPARATUS
Introduction
A pipe may be of various diameters and may have bends valves etc When a liquid isflowing through such pipes the velocity of the liquid layer adjacent to the pipe wall is zero Thevelocity of the liquid goes on increasing from the wall and hence shear stresses are produced inthe liquid due to viscosity This viscous action causes loss of energy which is usually known asFrictional loss
Here we are going to consider two important losses that occur during flow
bull
Major Losses
bull
Minor Losses
7232019 MOFMOS LABpdf
httpslidepdfcomreaderfullmofmos-labpdf 1447
Department of ANE MOFMOS LAB MANUAL
13
bull Major losses occur due to friction This friction may be due to viscosity or roughness in
the pipe
bull
Minor losses can be due to various reasons such as Inlet and Outlet of the pipe bendsgates sudden expansions and contractions The apparatus is designed to study the friction
losses that appear in long pipes and the obstructions that are encountered in the way offlow by various types of fittings
General DescriptionThe unit consists mainly of 1) Piping System 2) Measuring Tank 3) Differential Manometer 4)Supply pump set 5) Sump
bull Constructional Specification
bull Piping System Piping System of size 127 mm 20 mm and 20 mm (SS) dia With
tapings at 1 meter distance and a flow control valve
bull
Measuring Tank Measuring tank is provided to measure the discharge of water fromthe unit
bull Differential Manometer Differential manometer with 1 mm scale graduations to
measure the loss of head in the pipe line
bull Supply Pump Set Supply pump set is rigidly fixed on the sump The pump set is mono
block pump with 05 HP motor operating on single phase 220 volts 50 Hz AC supply
bull Sump Sump is provided to store sufficient waters for independent circulation through
the unit for experimentation and arranged within the floor space of the main unit
Before Commissioning
bull
Check whether all the joints are leak proof and watertight
bull
Close all the cocks on the pressure feed pipes and Manometer to prevent damage andoverloading of the manometer
bull Check the gauge glass and meter scale assembly of the measuring tank and see that it is
fixed water tight and vertical
bull
Check proper electrical connections to the switch which is internally connected to themotor
Experiments
bull
The apparatus is primarily designed for conducting experiments on the frictional losses inpipes of different sizes Three different sizes of pipes are provided for wide range ofexperiments Each individual pipe can be connected to the Manometer through thepressure feed pipes having individual quick operating cocks
bull
While taking reading close all the cocks in the pressure feed pipe except the two (upstream and downstream) cocks which directly connect the manometer to the requiredpipe for which the loss in head has to be determined (Make sure while taking readings
7232019 MOFMOS LABpdf
httpslidepdfcomreaderfullmofmos-labpdf 1547
Department of ANE MOFMOS LAB MANUAL
14
that the manometer is properly primed Priming is the operating of filling the Manometerupper part and the connecting pipes with water venting the air from the pipes)
bull First open the inlet gate valve of the apparatus Adjust the control valve kept at the exit
end of the apparatus to a desired flow rate and maintain the flow steadily
bull
The actual discharge is measured with the help of the measuring tank For each size ofthe pipe the area of cross section of flow can be calculated from the known diameter ofthe pipes From these two valves and the average velocity of stream through the pipe canbe calculated
bull The actual loss of head is determined from the Manometer readings The frictional loss of
head in pipes is given by the Darcys formulaThe friction coefficient indicates f
7232019 MOFMOS LABpdf
httpslidepdfcomreaderfullmofmos-labpdf 1647
Department of ANE MOFMOS LAB MANUAL
15
FRICTION FACTOR FOR A GIVEN PIPE LINE
Aim - To calculate the friction factor for a given pipe line
Apparatus - experimental set-up stop watch
Procedure-
1 Start the motor keeping the delivery valve close2
The water is allowed to flow through the selected pipe by selecting the appropriateball valve
3 By regulating the valve control the flow rate and select the corresponding pressuretapings
4
Make sure while taking readings that the manometer is properly primed Priming isthe operating of filling the Manometer upper part and the connecting pipes with waterventing the air from the pipes Note down the loss of head ldquohfrdquo from the manometerscale
5
Note down the time required for the rise of 10cm (ie 01m) water in the collectingtank by using stop watch Calculate discharge using below formula
Discharge - The time taken to collect some lsquoxrsquo cm of water in the collecting tank in msup3sec
A x RQ =
t
A = area of the collecting tank in msup2 (03m X 03m)R = rise of water level taken in meters (say 01m or 10cm)t = time taken for rise of water level to rise lsquorrsquo in lsquotrsquo seconds
6 Calculate the velocity of the jet by following formula
V = Discharge = Q A msecArea of the pipe
A = cross sectional area of the pipe=Πdsup2 4d = pipe diameter
7 Calculate the coefficient of friction for the given pipe by fLvsup2
hf = ---------ρgd
Wherehf - Loss of head of water = (h1-h2)(Sn So ndash 1) = (h1-h2) 1261000 m
f - Co-efficient of friction for the pipeL - Discharge between sections for which loss of head is measured (1 meter)v - Average velocity of flow in msecg - Acceleration due to gravity 981msecd - Pipe diameter in meters
8 Repeat the steps 2 to 7 for different sets of readings by regulating the discharge valve
7232019 MOFMOS LABpdf
httpslidepdfcomreaderfullmofmos-labpdf 1747
Department of ANE MOFMOS LAB MANUAL
16
Tabular Form
S No Oslash of pipeArea(a)
Time forrise of 10cm water
Discharge VelocityLoss ofHead
hf
Co-efficientof friction
f
Calculation-
bull Total Head H
H = (h1 + h2) x 126 m of waterWhere
126 = conversion factor from mercury to water head
bull
Discharge Q
WhereA = Area of collecting tank = 0125 msup2R = Rise in water level of the collecting tank cm
t = time for lsquoRrsquo cm rise of water sec100 = Conversion from cm to m
bull
Velocity V
msWhere Arsquo = area of the pipefitting in use
7232019 MOFMOS LABpdf
httpslidepdfcomreaderfullmofmos-labpdf 1847
Department of ANE MOFMOS LAB MANUAL
17
bull
Friction Factor(Major Losses) F
Where H = total head m of waterV = velocity mg = acceleration due to gravity 981mssup2L = Distance bw tapping = 15m
bull
Head Loss Due To Fittings (Minor Losses) K
Where H = total head m of waterV = velocity mg = acceleration due to gravity 981mssup2
Precautions
1) Do not run the pump dry2)
Clean the tanks regularly say for every 15days3)
Do not run the equipment if the voltage is below 180V4) Check all the electrical connections before running5) Before starting and after finishing the experiment the main control valve should be in
close position6) Do not attempt to alter the equipment as this may cause damage to the whole system
Results and Conclusions
7232019 MOFMOS LABpdf
httpslidepdfcomreaderfullmofmos-labpdf 1947
Department of ANE MOFMOS LAB MANUAL
18
EXPERIMENT 4
BERNOULLIrsquoS EXPERIMENTIntroduction
Bernoullirsquos Theorem gives the relationship between pressure head velocity head and thedatum Here the attempt has been made to study the relationship of the above said parametersusing venturimeter
General Description
bull The apparatus consists of a specially fabricated clear ACRYLIC Venturimeter
with necessary tappings connected to a Multibank Piezometer also made of clearACRYLIC
bull
The apparatus consists of two overhead tanks interconnected with the venturimeterwhich is placed in between the tanks
bull The overhead tanks are provided with the Head variation mechanism for conducting
the experiments at various heads
bull
Water in the sump tank is pumped using a Monobloc Centrifugal pump (Kirloskarmake) which passes through the control valve to the overhead tank
bull The height of the water in the collecting tank is measured using the acrylic
Piezometer to find the flowrate
bull The whole arrangement is mounted on an aesthetically designed sturdy frame
made of MS tubes and NOVAPAN Board with all the provisions for holding thetanks and accessories
Aim
o
The experiment is conducted too
Study of Pressure Gradient at different zoneso
Verification of Bernoullis Equationo
Comparative analysis under different flow rates
Apparatus
1) Venturimeter 2)Piezometer 3) Overhead Tank 4)Sump Tank 5) Centrifugal Pump
Procedure
1) Fill in the sump tank with clean water2)
Keep the delivery valve closed3)
Check and give necessary electrical connections to the system4) Switch on the pump amp Slowly open the delivery valve5)
Adjust the flow through the control valve of the pump6)
Allow the system to attain the steady state ie let the water pass from the secondoverhead tank to the collecting tank
7) Note down the Pressure head at different points of the venture meter on the multi-tubepiezometer (Expel if any air is the by inserting the thin pin into the piezometer openings)
8) Close the ball valve of the collecting tank and measure the time for the known rise ofwater
7232019 MOFMOS LABpdf
httpslidepdfcomreaderfullmofmos-labpdf 2047
Department of ANE MOFMOS LAB MANUAL
1983097
9) Change the flow rate and repeat the experiment
Observation
SlNo
Static Head Loss h Time for lsquoRrsquo
cm rise in waterlsquoTrsquo sec1 2 3 4 5 6 7 8 9 10
1
2
3
4
5
Calculations1
Discharge QA2
Where
A = Area of collecting tank = 0045 msup2R = Rise in water level of the collecting tank cmt = time for lsquoRrsquo cm rise of water sec100 = Conversion from cm to m
3 Pressure Head
Where
ρ = density of waterg = gravitational constanth = head measured m of water column
3 Velocity Head
WhereV = Q a a = Area at the particular section of the venturimeter msup2
4 Verification of BERNOULLIrsquoS EQUATIONBernoullirsquos Equation is given as
After findinga Pressure Head hb
Velocity headat different cross-section of the Venturimeter
7232019 MOFMOS LABpdf
httpslidepdfcomreaderfullmofmos-labpdf 2147
Department of ANE MOFMOS LAB MANUAL
20
Put the same in the above equation for different points and verify whether all the values obtainedare sameNote Consider the datum z to be constant
Precautions
bull
Do not run the pump drybull
Clean the tanks regularly say for every 15days
bull
Do not run the equipment if the voltage is below 180V
bull
Check all the electrical connections before running
bull Before starting and after finishing the experiment the main
bull Control valve should be in close position
bull Do not attempt to alter the equipment as this may cause
bull
Damage to the whole system
Result and Conclusion
7232019 MOFMOS LABpdf
httpslidepdfcomreaderfullmofmos-labpdf 2247
Department of ANE MOFMOS LAB MANUAL
21
EXPERIMENT 5
CALIBRATION OF A TRIANGULAR NOTCH
AIM -To find the coefficient of discharge of given triangular notch
THEORY-A notch is a device used for measuring the rate of flow of liquid through a smallchannel or a tank It may be defined as an opening in the side of a tank or small channel in suchthat a way that the liquid surfaces in the tank or channel is below the top edge of the opening
NOTCHES ARE CLASSIFIED AS-1 Rectangular notch2 Triangular notch3 Trapezoidal notch
4 Stepped notch
A triangular notch is preferred to a rectangular notch due to the following reasonsThe expression for discharge of triangular notch is compared to rectangular notch is simple Formeasuring low discharge a triangular notch gives more accurate results than a rectangular notchIn the case of triangular notch only H is required for the computation of dischargeA trapezoidal notch is a combination of rectangular and triangular notch and thus the dischargethrough trapezoidal notch is the sum of above notchesA stepped notch is a combination of rectangular notch and triangular notch The dischargethrough the stepped notch is equal to sum of discharges through the different rectangularnotches
DESCRIPTION- The apparatus consists of1) Measuring tank 2) Sump tank3) Supply pump set 4) Inlet and out let valve
Measuring tank Stainless steel tank of size 030305mm height with the gage glass a scalearrangement for quick and easy measurements A ball valve is provided to empty the tank and adrain is provided at the bottom of the tank to drain the waste water when the unit is not in useWater for independent circulation through the unit for experimentation and arranged within thefloor space of the main unitSump tank The sump tank is a size of 020303m stainless steel tank to store sufficient waterfor independent circulation through the unit for experimentation and arranged within the floorspace of the main unit about 060305m with a gauge glass and scale arrangement A ballvalve is provided to empty the tankSupply Pump set The pump is 2525mm size mono block with frac12 HP 2880 RPM singlephase 220volts AC supply Inlet and out let valve- These valves are used to control the flow ofwater at inlet and out let
PROCEDURE1 Allow the water to drain up to triangular notch
7232019 MOFMOS LABpdf
httpslidepdfcomreaderfullmofmos-labpdf 2347
Department of ANE MOFMOS LAB MANUAL
22
2 Note down the depth of the water when the water is coinciding with the v notch point
3 Collect water in collecting tank and close the drain valve and find the time taken for the rise ofwater up to 20cm
4 Calculate the discharge by using the above results
5 Now substituting the values in the formula for calculation of discharge for v- notch gives therequired result
Precautionsbull Do not run the pump dry
bull Clean the tanks regularly say for every 15days
bull Do not run the equipment if the voltage is below 180V
bull Check all the electrical connections before running
bull
Before starting and after finishing the experiment the main
bull
Control valve should be in close position
bull
Do not attempt to alter the equipment as this may cause
7232019 MOFMOS LABpdf
httpslidepdfcomreaderfullmofmos-labpdf 2447
Department of ANE MOFMOS LAB MANUAL
23
bull Damage to the whole system
Result and Conclusion
7232019 MOFMOS LABpdf
httpslidepdfcomreaderfullmofmos-labpdf 2547
Department of ANE MOFMOS LAB MANUAL
24
MECHANICSOF SOLIDS
LAB
7232019 MOFMOS LABpdf
httpslidepdfcomreaderfullmofmos-labpdf 2647
Department of ANE MOFMOS LAB MANUAL
25
7232019 MOFMOS LABpdf
httpslidepdfcomreaderfullmofmos-labpdf 2747
Department of ANE MOFMOS LAB MANUAL
983089
IZOD IMPACT TEST
AIM To perform the izod impact test on materials
APPARATUS Izod impact test machine test specimen vernier calipers steel rule
IMPACT STRENGTH The resistance of a material to fracture under sudden load application
MATERIALS Two types of test pieces are used for this test as given
1) Square cross-section
2) Round cross-section
THEORY The type of test specimen used for this test is a Square Cross-section
The specimen may have single two or three notches The testing machine shouldhave the following specifications The angle between top face of grips and face holding the specimen Vertical=900 the angle of tip of hammer =750plusmn10
The angle between normal to the specimen and underside face of the hammer at Striking point=100plusmn10
Speed of hammer at impact=399msecStriking energy=168N-m or Joules Angle
Of drop of pendulum =900 Effective
weight of pendulum=2179kg
Minimum value of scale graduation=2 Joules
Permissible total friction loss of corresponding energy=050
Distance from the axis of rotation of distance between the base of specimen notch andthe point of specimen hit by the hammer=22mmplusmn05mm
The longitudinal axes of the test piece shall lie in the plane of swing of the center ofgravity of the hammer The notch shall be positioned so that its in the plane of thehammer the notch shall be positioned its plane of symmetry coincides with the top faceof the grips for setting the specimen the notch impact strength I is calculated accordingto the following relation
Where I= impact strength in joulesm2
7232019 MOFMOS LABpdf
httpslidepdfcomreaderfullmofmos-labpdf 2847
Department of ANE MOFMOS LAB MANUAL
983090
PROCEDURE
1 For conducting Izod test a proper striker is to be fitted firmly to the bottom of thehammer with the help of the clamming piece
2 The latching take for izod test is to be firmly fitted to the bearing housing at the side of
the columns3 The frictional loss of the machine can be determined by free fall test raise the
hammer by hands and latch in release the hammer by operating lever the pointer will
then indicate the energy loss due to friction From this reading confirm that the friction
loss is not exceeding 05 of the initial potential energy Otherwise frictional loss has to
be added to the final reading
4 The specimen for izod test is firmly fitted in the specimen support with the help ofclamping screw and eacutelan key Care should be taken that the notch on the specimenshould face to pendulum striker
5 After ascertaining that there is no person in the range of swinging pendulum release the
pendulum to smash the specimen6 Carefully operate the pendulum brake when returning after one swing to stop the oscillations
7 Read-off position of reading pointer on dial and note indicated value
8 Remove the broken specimen by loosening the clamping screw
The notch impact strength depends largely on the shape of the specimen and the notch the
values determined with other specimens therefore may not be compared with each other
OBSERVATION TABLE
S No A(Area of cross K Impact energy I Impact Strength
section of observed
specimen)
RESULT
7232019 MOFMOS LABpdf
httpslidepdfcomreaderfullmofmos-labpdf 2947
Department of ANE MOFMOS LAB MANUAL
983091
Calculation Part
7232019 MOFMOS LABpdf
httpslidepdfcomreaderfullmofmos-labpdf 3047
Department of ANE MOFMOS LAB MANUAL
983092
ROCKWELL HARDNESS TEST
AIM To determine the Rockwell hardness of the given test specimen
APPARATUS Rockwell hardness testing machine test specimen
THEORY
Hardness-the resistance of a metal to plastic deformationagainst indentation scratching abrasion or cutting
The depth of penetration of the indenter measures the hardness of a material by this Rockwell ‟s hardness test method the depth of penetration is inversely
proportional to the hardness Both ball or diamond cone types of indenters are used inthis testThere are three scales on the machine for taking hardness readings
Scale bdquoA‟ with load 60kgf or 5888N and diamond indenter is used for performing tests on steel and shallow case hardened steel
Scale bdquoB‟ with load 100kgf or 9807 N and 1588mm dia ball indenter is used forperforming tests on soft steel malleable iron copper and aluminum alloys
Scale bdquoC‟ with load 150kgf or 1471 N and diamond indenter is used for performing testson steel hard cost steel deep case hardened steel other metals which harder
First minor load is applied to overcome the film thickness on the metal surfaceMinor load also eliminates errors in the depth of measurement due to spring of themachine frame or setting down of the specimen and table attachments
The Rockwell hardness is derived from the measurement of the depth of theimpression This method of test is suitable for finished or machined parts of simpleshapes
PROCEDURE
1 Select the load by rotating the nob and fix the suitable indenter
2 Clean the test piece and place on the special anvil or worktable of the machine
3 Turn the capstan wheel to evaluate the test specimen into contact with the indenterpoint
4 Further turn the wheel for three rotations forcing the test specimen against theindenter This will ensure the minor load has been applied5 Set the pointer on the scale dial at the appropriate position
7232019 MOFMOS LABpdf
httpslidepdfcomreaderfullmofmos-labpdf 3147
Department of ANE MOFMOS LAB MANUAL
983093
6 Push the lever to apply the major load A dash pot provided in the loading mechanismto ensure that the load is applied gradually
7 As soon as the pointer comes to rest pull the handle in the reverse direction slowlyThis releases the major but not the minor load The pointer will now rotate in the reversedirection
8 The Rockwell hardness can read off the scale dial on the appropriate scale after thepointer comes to rest
OBSERVATIONS
Material of the specimen =
Thickness of test specimen =
Hardness scale used =
Test Material Rockwell Scale of weights Rockwell number Average
no Rockwell
no
Scale weight indent 1 2 3
PRECAUTIONS
1 For testing cylindrical test specimens use V-type platform
2 Calibrate the machine occasionally by using standard test blocks
3 For thin metal prices place another sufficiently thick metal piece between the testspecimen and the platform to avoid any damage which may likely occur to the platform
4 After applying major load wait for some time to allow the needle to come to restThe waiting time may vary from 2 to 8 seconds
7232019 MOFMOS LABpdf
httpslidepdfcomreaderfullmofmos-labpdf 3247
Department of ANE MOFMOS LAB
MANUAL
983094
5 The surface of the test piece should be smooth and even and free from oxidescale and foreign matter6 Test specimen should not be subjected to any heating of cold working
7 The distance between the centers of two adjacent indentation should be at least 4
Times the diameter of the indentation and the distance from the center of any indentation tothe edge of the test piece should be at least 25 times the diameter of the indentation
RESULT
7232019 MOFMOS LABpdf
httpslidepdfcomreaderfullmofmos-labpdf 3347
Department of ANE MOFMOS LAB MANUAL
983095
Calculation Part
7232019 MOFMOS LABpdf
httpslidepdfcomreaderfullmofmos-labpdf 3447
Department of ANE MOFMOS LAB MANUAL
983096
BRINELLrsquoS HARDNESS TEST
AIM To determine the Brinell hardness of the given test specimen
APPARATUS Brinell hardness machine test specimen Brinells Microscope
THEORY
Indentation Hardness-A number related to the area or to the depth of
the impression made by an indenter or fixed geometry under a known fixed load
This method consists of indenting the surface of the metal by a hardened steel
ball of specified diameter D mm under a given load F kgf and measuring the average
diameter d mm of the impression with the help of Brinell microscope fitted with a scaleThe Brinell hardness HB is defined as the quotient of the applied force F divided by the
spherical area of the impression
HB= Test load in kgfsurface area of indentation
=2F πD (D- D2- d2) kgmm2
PROCEDURE
1 Select the proper size of the ball and load to suit the material under test2 Clean the test specimen to be free from any dirt and defects or blemishes
3 Mount the test piece surface at right angles to the axis of the ball indenter plunger
4 Turn the platform so that the ball is lifted up
5 By shifting the lever applies the load and waits for some time
6 Release the load by shifting the lever
7 Take out the specimen and measure the diameter of indentation by means of theBrinell microscope8 Repeat the experiments at other positions of the test piece
9 Calculate the value of HB
7232019 MOFMOS LABpdf
httpslidepdfcomreaderfullmofmos-labpdf 3547
Department of ANE MOFMOS LAB MANUAL
983097
OBSERVATIONS
Test piece material = Diameter of the ballrdquo D ldquo =
Load section FD2 = Test load =
Load application time =
Least count of Brinell Microscope =
Diameter Average
Impression F D HB
S No in kg in mm Kgmm2
(d1) (d2) (d1+d2)2
PRECAUTIONS
1 The surface of the test piece should be clean
2 The testing machine should be protected throughout the test from shock or vibration
3 The test should be carried out at room temperature
4 The distance of the center of indentation from the edge of test piece should be at
least 25 times the diameter of the indentation and the distance between the center ofthe two adjacent indentations should be at least 4 times the diameter of the indentation
5 The diameter of each indentation should be measured in two directions at rightangles and the mean value readings used the purpose of determining the hardnessnumber
7232019 MOFMOS LABpdf
httpslidepdfcomreaderfullmofmos-labpdf 3647
Department of ANE
MOFMOS LAB MANUAL
983089983088
RESULT
Calculation Part
7232019 MOFMOS LABpdf
httpslidepdfcomreaderfullmofmos-labpdf 3747
Department of ANE MOFMOS LAB MANUAL
983089983089
SPRING TEST
AIM To determine the rigidity modulus of the spring
APPARATUS Spring testing machine vernier calipers spring specimen
THEORY
Closed coiled helical springs are the springs in which helix angle is very small or inother words the pitch between two adjacent turns is small A closed coiled helical springcarrying an axial load is shown in fig
As helix angle in case of close coiled helical springs are small hence the bendingeffect on the spring is ignored and we assume that the coils of close coiled helical
springs are to stand purely tensional stresses Let d=diameter ofthe spring wire
P= pitch of the helical spring N= number ofcoils R= mean radius of the spring coil
W=axial load on spring C=modulus of rigidity
τ=maximum shear stress induced in the wire θ=angle of twist in the
spring wire and
x= deflection of spring due to axial load l= length of wire
Net twisting moment on the wire T=WR
But twisting moment is also given by T= (π 16) τd3
From 1 ad 2 WR = (π 16) τd3 τ=16WR πd
3
above equation which gives the maximum shear stress induced in the wire (1) Length of one coil=2πR
Total length of the wire=2πRn (2)
Strain energy stored by the spring due to torsion
U= (τ 4C) [(π 4)d 2πRn] (3)
Work done on the spring =average load x deflection
= (12) Wx (4)
Equating 3 and 4
(12) Wx = (32W2R3n)Cd4
7232019 MOFMOS LABpdf
httpslidepdfcomreaderfullmofmos-labpdf 3847
Department of ANE MOFMOS LAB MANUAL
983089983090
x=64WR3nCd
4
Rigidity modulus of the spring
C=64WR3nxd
4
PROCEDURE
1) Consider the spring and find out itsmean coil radius R with the help ofvernier calipers
2) Find the diameter of the spring andnumber of turns
3) Fix the spring between two hooks
4) Now load is gradually applied
5) Note the deflection from thedeflection scale for different loadsapplied
6) Calculate the rigidity modulus usingabove formula
PRECAUTIONS
1) Dimensions should be measureaccurately with the help of verniercalipers
2) Deflection from the scale should benoted carefully and accurately
OBSERVATION TABLE
Sno Load applied deflection Rigidity modulus
C
Average rigidity modulus C =
RESULT
7232019 MOFMOS LABpdf
httpslidepdfcomreaderfullmofmos-labpdf 3947
Department of ANE MOFMOS LAB MANUAL
983089983091
Calculation Part
7232019 MOFMOS LABpdf
httpslidepdfcomreaderfullmofmos-labpdf 4047
Department of ANE MOFMOS LAB MANUAL
983089983092
TORSION
AIM To conduct torsion test on mild steel or cast iron specimen to find modulus of rigidity or to find angle of twist of the materials which are subjected to torsion
APPARATUS 1 A torsion test machine along with angle of twist measuring attachment
2 Standard specimen of mild steel or cast iron
3 Steel rule
4 Vernnier caliper or a micrometer
THEORY
For transmitting power through a rotating shaft it is necessary to apply a turning
force The force is applied tangentially and in the plane of transverse cross section The
torque or twisting moment may be calculated by multiplying two opposite turningmoments It is said to be in pure torsion and it will exhibit the tendency of shearing off at
every cross section which is perpendicular to the longitudinal axis
Torsion equation
Torsion equation is given by below
T IP = CθL = TR
T= maximum twisting torque (Nmm) IP =
polar moment of inertia (mm4) τ =shear
stress (Nmm2) C=modulus of rigidity (Nmm2)
θ=angle of twist in radians L=length of shaft under torsion (mm)
Assumptions made for getting torsion equation
1 The material of the shaft is uniform through out
2 The shaft circular in section remain circular after loading
3 Plane sections of shaft normal to its axis before loading remain plane after thetorque have been applied
4 The twist along the length of the shaft is uniform throughout
5 The distance between any two normal-sections remains the same after theapplication of torque
6 Maximum shear stress induced in the shaft due to application of torque does notexceed its elastic limit
7232019 MOFMOS LABpdf
httpslidepdfcomreaderfullmofmos-labpdf 4147
Department of ANE MOFMOS LAB MANUAL
983089983093
PROCEDURE
1 Select the suitable grips to suit the size of the specimen and clamp it in themachine by adjusting sliding jaw
2 Measure the diameter at about the three places and take average value
3 Choose the appropriate loading range depending upon specimen
4 Set the maximum load pointer to zero
5 Carry out straining by rotating the hand wheel or by switching on the motor
6 Load the members in suitable increments observe and record strain reading
7 Continue till failure of the specimen
8 Calculate the modulus of rigidity C by using the torsion equation
9 Plot the torque ndashtwist graph (T Vs θ)
OBSERVATIONS
Gauge length L =
Polar moment of inertia IP =
Modulus of rigidity C =TL IP θ =
SNo Twisting Moment Angle of Twist Modulus Average
Kgf Nm Degrees Radians of rigidity CNmm2
C
RESULT
7232019 MOFMOS LABpdf
httpslidepdfcomreaderfullmofmos-labpdf 4247
Department of ANE MOFMOS LAB MANUAL
983089983094
TENSILE TEST
AIM
To conduct tensile test on a mild steel specimen and determine the following
1 Limit of proportionality 2 Elastic Limit
3 Upper yield point 4 Lower yield point
5 Ultimate strength 6 Fracture strength
7 Young`s Modulus 8 Percentage elongation
9 Percentage reduction in area 10 Ductility
11 Toughness 12 True stress amp true strain
13 Malleability
APPARATUS tensile testing machine specimen steel rule vernier caliper micrometer
THEORY
The tensile test is most applied one of all mechanical tests In this test a test specimen is fixed
into grips connected to a straining device and to a load-measuring device (One end in stationary
grips and the other in movable grips) If the applied load is small enough the deformation of any
solid body is entirely elastic An elastically deformed solid will return to its original form as soon
as load is removed However if the load is too large the material can be deformed permanently
The initial part of the tension curve which represents the manner in which solid undergoes
plastic deformation is termed as plastic The stress below which the deformation is essentially
entirely elastic is known as the elastic limit of the material In some materials like mild steel a
sudden drop in load indicating both an upper and lower yield point denotes the onset of plastic
deformation However some materials do not exhibit a sharp yield point During plastic
deformation at lager extensions strain hardening cannot compensate for the decrease in section
and thus the load passes through a maximum and then begins to decrease At this stage the
ultimate strength which is defined as the ration of the load on the specimen to the original cross-section area reaches a maximum value Until this point the deformation is uniform at all the
sections of the specimen Further loading will eventually cause bdquoneck ‟ formation and rupture
follows
7232019 MOFMOS LABpdf
httpslidepdfcomreaderfullmofmos-labpdf 4347
Department of ANE MOFMOS LAB
MANUAL
983089983095
Usually a tension test is conducted at room temperature the tensile load is applied
slowly During this test either round or flat specimens may be used The load on the specimen is
applied mechanically or hydraulically depending on the type of testing machine
1 NominalEngg stress and NominalEngg strain
Original CS area = A0 (mm2)
Original gauge length = L0 (mm) Increase in gauge length = δL0
Nominal stress = PA0 (N mm2)
Nominal strain = δL0 L0
2 Limit of Proportionality Stress is proportional to strain up to this pointNormal Stress = PA PO Normal Strain = (δ LO) ALO
3 Elastic limit When the load is removed at ldquoBrdquo the specimen will go back to originalDimensions ie LO and δ AO Nominal stress = PB AO Normal Strain = (δ LO) B LO
If the specimen is loaded beyond elastic limit it will undergo permanent strainie Plastic deformation
4 Upper yield point Nominal stress = PC AO Nominal strain = (δ LO) D LO
5 Lower yield point Nominal stress = PD AO
Nominal strain = (δ LO) D LO 6 Ultimate load or maximum load point
Nominal ultimate stress = PE AO Nominal strain = (δ LO) E LO
7 Fracture Load point F
Nominal fracture stress = PF AO
Nominal strain at fracture = (δ LO) F LO
8 Young`s modulus (E) Young`s modulus (E) = StressStrain
(In the elastic region limit of proportionality = Nominal stress at ANominal strain at A 9Modulus of resilience = (Nominal stress at elastic limit)
2 2E
Area under Engg Stress - Strain diagram up to elastic limit10 Resilience = Modulus of Resilience x Volume of specimen undergoing Tensile stress
7232019 MOFMOS LABpdf
httpslidepdfcomreaderfullmofmos-labpdf 4447
Department of ANE MOFMOS LAB MANUAL
983089983096
11 Yield point ElongationElongation taking place in the specimen from C to D this istaking place without increase in stress
12 Modulus of toughnessArea under engineering stress ndash strain diagram up to fracture13 Toughness = Modulus of toughness x Volume of specimenThis indicates theamount of energy absorbed by the specimen before fracture take place
14 Ductility= (Final length at fracture ndash original length 10) x 100
15 MalleabilityIt is the ability of the material to undergo plastic deformation prior fracture under compressive loading conditions In a tensile test it is approximatedas percentage reduction in cross sectional area of the specimen Malleability =
(AO - Af )AO) x 100
True stress ndash true strain diagram
Engineering stress is calculated based on original cross sectional area (AO) But not on the actual cross sectional area at load bdquoP‟
True stress = PA = PAO x AO A
Since volume remains constant during plastic deformation we have AO LO = AL True stress = PAO x L LO
= PAO x ((LO + δLO) LO)
= P (1+e)= Nominal stress (1+ nominal strain)
True strain = Є = 1n (1+e)
These relations are valid up to ultimate load ie up to which the strain isuniform all along the gauge length
1 True Stress at upper yield point = Nominal stress at upper yield point ( 1+e O)True strain at C = 1n (1+eo)
2 True stress at ultimate load (E1)= Nominal ultimate stress ( 1+eE)True strain at ultimate load = 1n (1+eE)
3 True stress at fracture (E1) = Pf Af
Where Af is the area of cross section at fracture can be measured True
strain at fracture = 1n (Ao Af )
Area relation is taken instead of lengths because the strains are localized in theregion between ultimate load point and fracture point
4 Strain Hardening
From lower yield point onwards increase in load is required for increase instrain Thus the stress required for further deformation is more Thisphenomenon is called strain hardening
5 True ndash stress ndash true strain curve in log ndash log co ndash ordinates
When the true ndash stress and true ndash strain are plotted on log ndash log co ndash ordinates thecurve is a straight line
7232019 MOFMOS LABpdf
httpslidepdfcomreaderfullmofmos-labpdf 4547
Department of ANE MOFMOS LAB MANUAL
983120983137983143983141 983089983097 983151983142 983090983089
6 Ductile and Brittle Materials
If a material fails without much plastic deformation it can be called brittle If the percentageelongation at fracture is less than 25 the material is classified as brittle
bull Usually the metals with FCC and CPH structures are highly ductile
PROCEDURE
1 Measure the original gauge length and diameter of the specimen
2 Insert the specimen into grips of the test machine
3 Begin the load application and record load vs elongation data
4 Take the readings more frequently as yield point is approached
5 Measure elongation values
6 Continue the test till fracture occurs
7 By joining the two broken halves of the specimen together measure the final length anddiameter of specimen at fracture
RESULTS AND DISCUSSIONS
1 Plot the Engg Stress strain curve and determine the following
bull Limit of proportionality = (Nmm2)
bull Yield strength = (Nmm2)
bull Ultimate strength = (Nmm2)
bull Young`s modulus = (Nmm2)
bull Percentage elongation = bull Percentage reduction in area =
bull Fracture strength = (Nominal Engg)
bull Toughness = Area under stress ndash strain curve up to
fracture
bull Malleability
2 Plot True Stress True strain curve after calculating true ndash stress and true strain values at various
points
Estimate1) Strength coefficient
2) Strain hardening coefficient
3) Determine whether the material is ductile or brittle4) Comment on the results
7232019 MOFMOS LABpdf
httpslidepdfcomreaderfullmofmos-labpdf 4647
Department of ANE MOFMOS LAB MANUAL
983120983137983143983141 983090983088 983151983142 983090983089
SNo Load Deformation Stress Strain E
Calculation part-
7232019 MOFMOS LABpdf
httpslidepdfcomreaderfullmofmos-labpdf 4747
Department of ANE MOFMOS LAB MANUAL
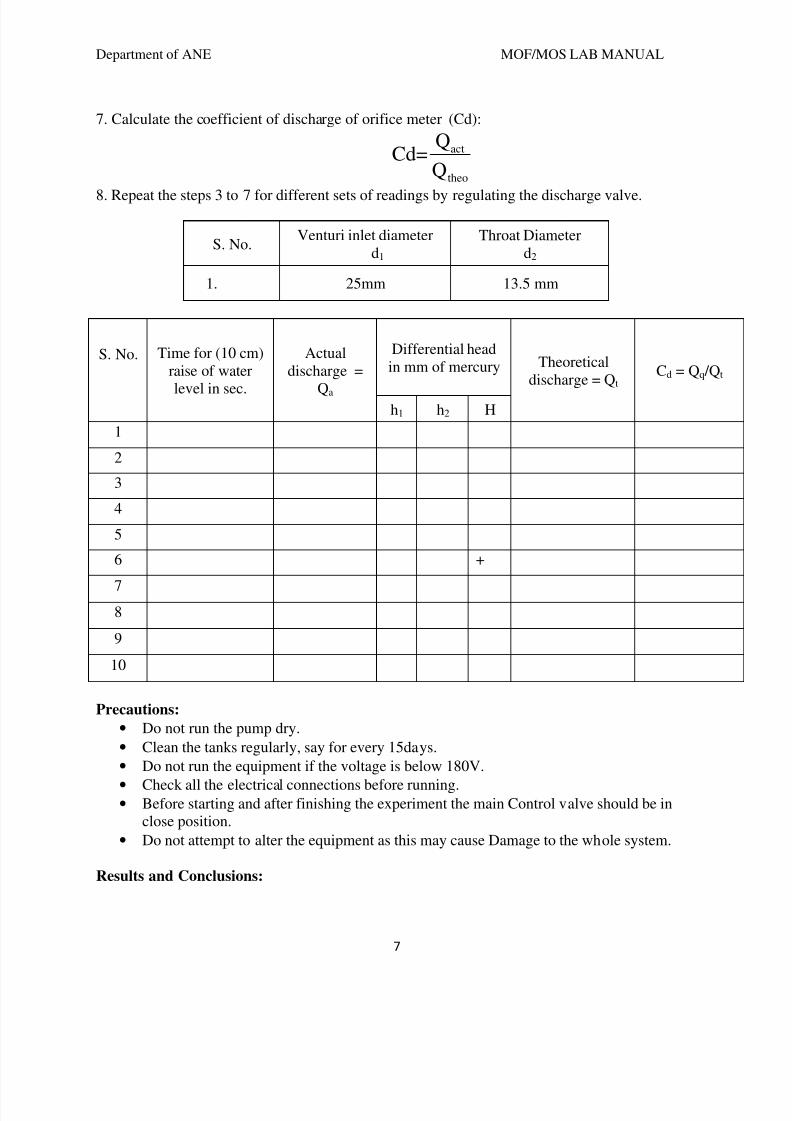
7232019 MOFMOS LABpdf
httpslidepdfcomreaderfullmofmos-labpdf 847
Department of ANE MOFMOS LAB MANUAL
7
7 Calculate the coefficient of discharge of orifice meter (Cd)
act
theo
QCd=
Q
8 Repeat the steps 3 to 7 for different sets of readings by regulating the discharge valve
S NoVenturi inlet diameter
d1 Throat Diameter
d2
1 25mm 135 mm
S No Time for (10 cm)raise of water
level in sec
Actualdischarge =
Qa
Differential headin mm of mercury Theoretical
discharge = Qt Cd = Qq Qt
h1 h2 H
1
2
3
4
5
6 +
78
9
10
Precautions
bull Do not run the pump dry
bull Clean the tanks regularly say for every 15days
bull Do not run the equipment if the voltage is below 180V
bull
Check all the electrical connections before runningbull
Before starting and after finishing the experiment the main Control valve should be inclose position
bull Do not attempt to alter the equipment as this may cause Damage to the whole system
Results and Conclusions
7232019 MOFMOS LABpdf
httpslidepdfcomreaderfullmofmos-labpdf 947
Department of ANE MOFMOS LAB MANUAL
8
EXPERIMENT 2
ORIFICE METER TEST RIG
IntroductionAn ORIFICE METER is a simple device used for measuring the discharge through pipesThe basic principle on which an Orifice meter works is that by reducing the cross ndash sectionalarea of the flow passage a pressure difference between the two sections before and after Orificeis developed and the measure of the pressure difference enables the determination of thedischarge through the pipe However an Orifice meter is a cheaper arrangement for dischargemeasurement through pipes and its installation requires a smaller length as compared withVenturi Meter As such where the space is limited the Orifice meter may be used for themeasurement of discharge through pipes
General Description
The apparatus consists of (1) Orifice meter (2) Piping system (3) supply pump set (4) Measuringtank (5) Differential manometer (6) Sump
Constructional Specification
bull Flow Meters Consists of Orifice meter of size 25 mm provided for experiments The
meter has the adequate cocks also with them
bull Piping System Consists of a set of GI piping of size 25 mm with sufficient upstream
and downstream lengths provided with separate control valves and mounted on a suitablestand Separate upstream and downstream pressure feed pipes are provided for themeasurement of pressure heads with control valves situated on a common plate for easy
operation
bull Supply Pump Set Is rigidly fixed on sump The mono block pump with motor
Operating on single phase 220240 volts 50 Hz AC supply
bull Measuring Tank Measuring tank with gauge glass and scale arrangement for quick and
easy measurement
bull Differential Manometer Differential manometer with 1 mm scale graduations to
measure the differential head produced by the flow meter
bull
Sump Sump to store sufficient water for independent circulation through the unit forexperimentation and arranged within the floor space of the main unit
Before Commissioning
bull Check whether all the joints are leak proof and water tight
bull Fill the manometer to about half the height with mercury
bull Close all the cocks pressure feed pipes and manometer to prevent damage and over
loading of the manometer
7232019 MOFMOS LABpdf
httpslidepdfcomreaderfullmofmos-labpdf 1047
Department of ANE MOFMOS LAB MANUAL
983097
bull Check the gauge glass and meter scale assembly of the measuring tank and see that it is
fixed water tight and vertically
bull
Check proper electrical connections to the switch which is internally connected to themotor
Experiments
bull
The apparatus is primarily designed for conducting experiments on the coefficient ofdischarge of flow meters Each flow meter can be connected to the manometer throughthe pressure feed opening and the corresponding cocks
bull
While taking readings close all the cocks in the pressure feed pipes except the two(Down-stream and upstream) cocks which directly connect the manometer to the requiredflow meter for which the differential head is to be measured (Make sure while takingreading that the manometer is properly primed Priming is the operation of filling themanometer upper part and the connecting pipes with water and venting the air from the
pipes)
bull
First open the inlet gate valve of the apparatus Adjust the control valve kept at the exitend of the apparatus to a desired flow rate and maintain the flow steadily
bull
The actual discharge is measured with the help of the measuring tank The differentialhead produced by the flow meter can be found from the manometer for any flow rate
7232019 MOFMOS LABpdf
httpslidepdfcomreaderfullmofmos-labpdf 1147
Department of ANE MOFMOS LAB MANUAL
10
CALIBRATION OF ORIFICE METER
Aim - To calibrate a given Orifice meter and to study the variation of coefficient of discharge ofit with discharge
Apparatus -Orifice meter manometer stop watch experimental set-up
Procedure-1
Start the motor keeping the delivery valve close2
The water is allowed to flow through the selected pipe by selecting the appropriate ballvalve
3 By regulating the valve control the flow rate and select the corresponding pressuretapings (ie of orifice meter)
4 Make sure while taking readings that the manometer is properly primed Priming is theoperation of filling the manometerrsquos upper part and the connecting pipes with water byventing the air from the pipes Note down the difference of head ldquohrdquo from the manometer
scale5 Note down the time required for the rise of 10cm (ie 001m) water in the collecting tank
by using stop watch Calculate actual discharge using below formula
Discharge - The time taken to collect some lsquoRrsquo cm of water in the collecting tank in msup3sec
act
A x RQ =
t
Where A = area of the collecting tank in msup2 (03m X 03m)R = rise of water level taken in meters (say 01m or 10cm)t = time taken for rise of water level to rise lsquoRrsquo in lsquotrsquo seconds
6
Using difference in mercury level ldquohrdquo calculate the theoretical discharge of venturimeterby using following expression
1 2th
2 2
1 2
a xa 2gHQ =
a -a
Where
H= difference of head in meters =m
1 2 1 2
w
S(h -h ) x ( -1) = (h -h ) x 126 m
S
a1 = area of orifice at inlet =
2
1
4
d π
a2 = area of orifice at inlet =
2
2
4
d π
g =Acceleration due to gravityd1 =Inlet diameter in meters d2 =Throat diameter in meters
7 Calculate the coefficient of discharge of orifice meter (Cd)
7232019 MOFMOS LABpdf
httpslidepdfcomreaderfullmofmos-labpdf 1247
Department of ANE MOFMOS LAB MANUAL
11
act
theo
QCd=
Q
8
Repeat the steps 3 to 7 for different sets of readings by regulating the discharge valve
S No Orifice inlet diameterd1
Orifice diameterd2
1 25mm 130
S NoTime for (10 cm)
raise of water
level in sec
Actualdischarge =
Qa
Differential head inmm of mercury Theoretical
discharge = Qt
Cd = Qa Qt
h1 h2 H
1
2
3
4
5
6
7
8
9
10
Calculation-
Precautions-
bull Do not run the pump dry
bull Clean the tanks regularly say for every 15days
bull Do not run the equipment if the voltage is below 180V
bull
Check all the electrical connections before running
bull
Before starting and after finishing the experiment the main
7232019 MOFMOS LABpdf
httpslidepdfcomreaderfullmofmos-labpdf 1347
Department of ANE MOFMOS LAB MANUAL
12
bull Control valve should be in close position
bull Do not attempt to alter the equipment as this may cause
bull Damage to the whole system
Results and Conclusions-
EXPERIMENT 3
PIPE FRICTION APPARATUS
Introduction
A pipe may be of various diameters and may have bends valves etc When a liquid isflowing through such pipes the velocity of the liquid layer adjacent to the pipe wall is zero Thevelocity of the liquid goes on increasing from the wall and hence shear stresses are produced inthe liquid due to viscosity This viscous action causes loss of energy which is usually known asFrictional loss
Here we are going to consider two important losses that occur during flow
bull
Major Losses
bull
Minor Losses
7232019 MOFMOS LABpdf
httpslidepdfcomreaderfullmofmos-labpdf 1447
Department of ANE MOFMOS LAB MANUAL
13
bull Major losses occur due to friction This friction may be due to viscosity or roughness in
the pipe
bull
Minor losses can be due to various reasons such as Inlet and Outlet of the pipe bendsgates sudden expansions and contractions The apparatus is designed to study the friction
losses that appear in long pipes and the obstructions that are encountered in the way offlow by various types of fittings
General DescriptionThe unit consists mainly of 1) Piping System 2) Measuring Tank 3) Differential Manometer 4)Supply pump set 5) Sump
bull Constructional Specification
bull Piping System Piping System of size 127 mm 20 mm and 20 mm (SS) dia With
tapings at 1 meter distance and a flow control valve
bull
Measuring Tank Measuring tank is provided to measure the discharge of water fromthe unit
bull Differential Manometer Differential manometer with 1 mm scale graduations to
measure the loss of head in the pipe line
bull Supply Pump Set Supply pump set is rigidly fixed on the sump The pump set is mono
block pump with 05 HP motor operating on single phase 220 volts 50 Hz AC supply
bull Sump Sump is provided to store sufficient waters for independent circulation through
the unit for experimentation and arranged within the floor space of the main unit
Before Commissioning
bull
Check whether all the joints are leak proof and watertight
bull
Close all the cocks on the pressure feed pipes and Manometer to prevent damage andoverloading of the manometer
bull Check the gauge glass and meter scale assembly of the measuring tank and see that it is
fixed water tight and vertical
bull
Check proper electrical connections to the switch which is internally connected to themotor
Experiments
bull
The apparatus is primarily designed for conducting experiments on the frictional losses inpipes of different sizes Three different sizes of pipes are provided for wide range ofexperiments Each individual pipe can be connected to the Manometer through thepressure feed pipes having individual quick operating cocks
bull
While taking reading close all the cocks in the pressure feed pipe except the two (upstream and downstream) cocks which directly connect the manometer to the requiredpipe for which the loss in head has to be determined (Make sure while taking readings
7232019 MOFMOS LABpdf
httpslidepdfcomreaderfullmofmos-labpdf 1547
Department of ANE MOFMOS LAB MANUAL
14
that the manometer is properly primed Priming is the operating of filling the Manometerupper part and the connecting pipes with water venting the air from the pipes)
bull First open the inlet gate valve of the apparatus Adjust the control valve kept at the exit
end of the apparatus to a desired flow rate and maintain the flow steadily
bull
The actual discharge is measured with the help of the measuring tank For each size ofthe pipe the area of cross section of flow can be calculated from the known diameter ofthe pipes From these two valves and the average velocity of stream through the pipe canbe calculated
bull The actual loss of head is determined from the Manometer readings The frictional loss of
head in pipes is given by the Darcys formulaThe friction coefficient indicates f
7232019 MOFMOS LABpdf
httpslidepdfcomreaderfullmofmos-labpdf 1647
Department of ANE MOFMOS LAB MANUAL
15
FRICTION FACTOR FOR A GIVEN PIPE LINE
Aim - To calculate the friction factor for a given pipe line
Apparatus - experimental set-up stop watch
Procedure-
1 Start the motor keeping the delivery valve close2
The water is allowed to flow through the selected pipe by selecting the appropriateball valve
3 By regulating the valve control the flow rate and select the corresponding pressuretapings
4
Make sure while taking readings that the manometer is properly primed Priming isthe operating of filling the Manometer upper part and the connecting pipes with waterventing the air from the pipes Note down the loss of head ldquohfrdquo from the manometerscale
5
Note down the time required for the rise of 10cm (ie 01m) water in the collectingtank by using stop watch Calculate discharge using below formula
Discharge - The time taken to collect some lsquoxrsquo cm of water in the collecting tank in msup3sec
A x RQ =
t
A = area of the collecting tank in msup2 (03m X 03m)R = rise of water level taken in meters (say 01m or 10cm)t = time taken for rise of water level to rise lsquorrsquo in lsquotrsquo seconds
6 Calculate the velocity of the jet by following formula
V = Discharge = Q A msecArea of the pipe
A = cross sectional area of the pipe=Πdsup2 4d = pipe diameter
7 Calculate the coefficient of friction for the given pipe by fLvsup2
hf = ---------ρgd
Wherehf - Loss of head of water = (h1-h2)(Sn So ndash 1) = (h1-h2) 1261000 m
f - Co-efficient of friction for the pipeL - Discharge between sections for which loss of head is measured (1 meter)v - Average velocity of flow in msecg - Acceleration due to gravity 981msecd - Pipe diameter in meters
8 Repeat the steps 2 to 7 for different sets of readings by regulating the discharge valve
7232019 MOFMOS LABpdf
httpslidepdfcomreaderfullmofmos-labpdf 1747
Department of ANE MOFMOS LAB MANUAL
16
Tabular Form
S No Oslash of pipeArea(a)
Time forrise of 10cm water
Discharge VelocityLoss ofHead
hf
Co-efficientof friction
f
Calculation-
bull Total Head H
H = (h1 + h2) x 126 m of waterWhere
126 = conversion factor from mercury to water head
bull
Discharge Q
WhereA = Area of collecting tank = 0125 msup2R = Rise in water level of the collecting tank cm
t = time for lsquoRrsquo cm rise of water sec100 = Conversion from cm to m
bull
Velocity V
msWhere Arsquo = area of the pipefitting in use
7232019 MOFMOS LABpdf
httpslidepdfcomreaderfullmofmos-labpdf 1847
Department of ANE MOFMOS LAB MANUAL
17
bull
Friction Factor(Major Losses) F
Where H = total head m of waterV = velocity mg = acceleration due to gravity 981mssup2L = Distance bw tapping = 15m
bull
Head Loss Due To Fittings (Minor Losses) K
Where H = total head m of waterV = velocity mg = acceleration due to gravity 981mssup2
Precautions
1) Do not run the pump dry2)
Clean the tanks regularly say for every 15days3)
Do not run the equipment if the voltage is below 180V4) Check all the electrical connections before running5) Before starting and after finishing the experiment the main control valve should be in
close position6) Do not attempt to alter the equipment as this may cause damage to the whole system
Results and Conclusions
7232019 MOFMOS LABpdf
httpslidepdfcomreaderfullmofmos-labpdf 1947
Department of ANE MOFMOS LAB MANUAL
18
EXPERIMENT 4
BERNOULLIrsquoS EXPERIMENTIntroduction
Bernoullirsquos Theorem gives the relationship between pressure head velocity head and thedatum Here the attempt has been made to study the relationship of the above said parametersusing venturimeter
General Description
bull The apparatus consists of a specially fabricated clear ACRYLIC Venturimeter
with necessary tappings connected to a Multibank Piezometer also made of clearACRYLIC
bull
The apparatus consists of two overhead tanks interconnected with the venturimeterwhich is placed in between the tanks
bull The overhead tanks are provided with the Head variation mechanism for conducting
the experiments at various heads
bull
Water in the sump tank is pumped using a Monobloc Centrifugal pump (Kirloskarmake) which passes through the control valve to the overhead tank
bull The height of the water in the collecting tank is measured using the acrylic
Piezometer to find the flowrate
bull The whole arrangement is mounted on an aesthetically designed sturdy frame
made of MS tubes and NOVAPAN Board with all the provisions for holding thetanks and accessories
Aim
o
The experiment is conducted too
Study of Pressure Gradient at different zoneso
Verification of Bernoullis Equationo
Comparative analysis under different flow rates
Apparatus
1) Venturimeter 2)Piezometer 3) Overhead Tank 4)Sump Tank 5) Centrifugal Pump
Procedure
1) Fill in the sump tank with clean water2)
Keep the delivery valve closed3)
Check and give necessary electrical connections to the system4) Switch on the pump amp Slowly open the delivery valve5)
Adjust the flow through the control valve of the pump6)
Allow the system to attain the steady state ie let the water pass from the secondoverhead tank to the collecting tank
7) Note down the Pressure head at different points of the venture meter on the multi-tubepiezometer (Expel if any air is the by inserting the thin pin into the piezometer openings)
8) Close the ball valve of the collecting tank and measure the time for the known rise ofwater
7232019 MOFMOS LABpdf
httpslidepdfcomreaderfullmofmos-labpdf 2047
Department of ANE MOFMOS LAB MANUAL
1983097
9) Change the flow rate and repeat the experiment
Observation
SlNo
Static Head Loss h Time for lsquoRrsquo
cm rise in waterlsquoTrsquo sec1 2 3 4 5 6 7 8 9 10
1
2
3
4
5
Calculations1
Discharge QA2
Where
A = Area of collecting tank = 0045 msup2R = Rise in water level of the collecting tank cmt = time for lsquoRrsquo cm rise of water sec100 = Conversion from cm to m
3 Pressure Head
Where
ρ = density of waterg = gravitational constanth = head measured m of water column
3 Velocity Head
WhereV = Q a a = Area at the particular section of the venturimeter msup2
4 Verification of BERNOULLIrsquoS EQUATIONBernoullirsquos Equation is given as
After findinga Pressure Head hb
Velocity headat different cross-section of the Venturimeter
7232019 MOFMOS LABpdf
httpslidepdfcomreaderfullmofmos-labpdf 2147
Department of ANE MOFMOS LAB MANUAL
20
Put the same in the above equation for different points and verify whether all the values obtainedare sameNote Consider the datum z to be constant
Precautions
bull
Do not run the pump drybull
Clean the tanks regularly say for every 15days
bull
Do not run the equipment if the voltage is below 180V
bull
Check all the electrical connections before running
bull Before starting and after finishing the experiment the main
bull Control valve should be in close position
bull Do not attempt to alter the equipment as this may cause
bull
Damage to the whole system
Result and Conclusion
7232019 MOFMOS LABpdf
httpslidepdfcomreaderfullmofmos-labpdf 2247
Department of ANE MOFMOS LAB MANUAL
21
EXPERIMENT 5
CALIBRATION OF A TRIANGULAR NOTCH
AIM -To find the coefficient of discharge of given triangular notch
THEORY-A notch is a device used for measuring the rate of flow of liquid through a smallchannel or a tank It may be defined as an opening in the side of a tank or small channel in suchthat a way that the liquid surfaces in the tank or channel is below the top edge of the opening
NOTCHES ARE CLASSIFIED AS-1 Rectangular notch2 Triangular notch3 Trapezoidal notch
4 Stepped notch
A triangular notch is preferred to a rectangular notch due to the following reasonsThe expression for discharge of triangular notch is compared to rectangular notch is simple Formeasuring low discharge a triangular notch gives more accurate results than a rectangular notchIn the case of triangular notch only H is required for the computation of dischargeA trapezoidal notch is a combination of rectangular and triangular notch and thus the dischargethrough trapezoidal notch is the sum of above notchesA stepped notch is a combination of rectangular notch and triangular notch The dischargethrough the stepped notch is equal to sum of discharges through the different rectangularnotches
DESCRIPTION- The apparatus consists of1) Measuring tank 2) Sump tank3) Supply pump set 4) Inlet and out let valve
Measuring tank Stainless steel tank of size 030305mm height with the gage glass a scalearrangement for quick and easy measurements A ball valve is provided to empty the tank and adrain is provided at the bottom of the tank to drain the waste water when the unit is not in useWater for independent circulation through the unit for experimentation and arranged within thefloor space of the main unitSump tank The sump tank is a size of 020303m stainless steel tank to store sufficient waterfor independent circulation through the unit for experimentation and arranged within the floorspace of the main unit about 060305m with a gauge glass and scale arrangement A ballvalve is provided to empty the tankSupply Pump set The pump is 2525mm size mono block with frac12 HP 2880 RPM singlephase 220volts AC supply Inlet and out let valve- These valves are used to control the flow ofwater at inlet and out let
PROCEDURE1 Allow the water to drain up to triangular notch
7232019 MOFMOS LABpdf
httpslidepdfcomreaderfullmofmos-labpdf 2347
Department of ANE MOFMOS LAB MANUAL
22
2 Note down the depth of the water when the water is coinciding with the v notch point
3 Collect water in collecting tank and close the drain valve and find the time taken for the rise ofwater up to 20cm
4 Calculate the discharge by using the above results
5 Now substituting the values in the formula for calculation of discharge for v- notch gives therequired result
Precautionsbull Do not run the pump dry
bull Clean the tanks regularly say for every 15days
bull Do not run the equipment if the voltage is below 180V
bull Check all the electrical connections before running
bull
Before starting and after finishing the experiment the main
bull
Control valve should be in close position
bull
Do not attempt to alter the equipment as this may cause
7232019 MOFMOS LABpdf
httpslidepdfcomreaderfullmofmos-labpdf 2447
Department of ANE MOFMOS LAB MANUAL
23
bull Damage to the whole system
Result and Conclusion
7232019 MOFMOS LABpdf
httpslidepdfcomreaderfullmofmos-labpdf 2547
Department of ANE MOFMOS LAB MANUAL
24
MECHANICSOF SOLIDS
LAB
7232019 MOFMOS LABpdf
httpslidepdfcomreaderfullmofmos-labpdf 2647
Department of ANE MOFMOS LAB MANUAL
25
7232019 MOFMOS LABpdf
httpslidepdfcomreaderfullmofmos-labpdf 2747
Department of ANE MOFMOS LAB MANUAL
983089
IZOD IMPACT TEST
AIM To perform the izod impact test on materials
APPARATUS Izod impact test machine test specimen vernier calipers steel rule
IMPACT STRENGTH The resistance of a material to fracture under sudden load application
MATERIALS Two types of test pieces are used for this test as given
1) Square cross-section
2) Round cross-section
THEORY The type of test specimen used for this test is a Square Cross-section
The specimen may have single two or three notches The testing machine shouldhave the following specifications The angle between top face of grips and face holding the specimen Vertical=900 the angle of tip of hammer =750plusmn10
The angle between normal to the specimen and underside face of the hammer at Striking point=100plusmn10
Speed of hammer at impact=399msecStriking energy=168N-m or Joules Angle
Of drop of pendulum =900 Effective
weight of pendulum=2179kg
Minimum value of scale graduation=2 Joules
Permissible total friction loss of corresponding energy=050
Distance from the axis of rotation of distance between the base of specimen notch andthe point of specimen hit by the hammer=22mmplusmn05mm
The longitudinal axes of the test piece shall lie in the plane of swing of the center ofgravity of the hammer The notch shall be positioned so that its in the plane of thehammer the notch shall be positioned its plane of symmetry coincides with the top faceof the grips for setting the specimen the notch impact strength I is calculated accordingto the following relation
Where I= impact strength in joulesm2
7232019 MOFMOS LABpdf
httpslidepdfcomreaderfullmofmos-labpdf 2847
Department of ANE MOFMOS LAB MANUAL
983090
PROCEDURE
1 For conducting Izod test a proper striker is to be fitted firmly to the bottom of thehammer with the help of the clamming piece
2 The latching take for izod test is to be firmly fitted to the bearing housing at the side of
the columns3 The frictional loss of the machine can be determined by free fall test raise the
hammer by hands and latch in release the hammer by operating lever the pointer will
then indicate the energy loss due to friction From this reading confirm that the friction
loss is not exceeding 05 of the initial potential energy Otherwise frictional loss has to
be added to the final reading
4 The specimen for izod test is firmly fitted in the specimen support with the help ofclamping screw and eacutelan key Care should be taken that the notch on the specimenshould face to pendulum striker
5 After ascertaining that there is no person in the range of swinging pendulum release the
pendulum to smash the specimen6 Carefully operate the pendulum brake when returning after one swing to stop the oscillations
7 Read-off position of reading pointer on dial and note indicated value
8 Remove the broken specimen by loosening the clamping screw
The notch impact strength depends largely on the shape of the specimen and the notch the
values determined with other specimens therefore may not be compared with each other
OBSERVATION TABLE
S No A(Area of cross K Impact energy I Impact Strength
section of observed
specimen)
RESULT
7232019 MOFMOS LABpdf
httpslidepdfcomreaderfullmofmos-labpdf 2947
Department of ANE MOFMOS LAB MANUAL
983091
Calculation Part
7232019 MOFMOS LABpdf
httpslidepdfcomreaderfullmofmos-labpdf 3047
Department of ANE MOFMOS LAB MANUAL
983092
ROCKWELL HARDNESS TEST
AIM To determine the Rockwell hardness of the given test specimen
APPARATUS Rockwell hardness testing machine test specimen
THEORY
Hardness-the resistance of a metal to plastic deformationagainst indentation scratching abrasion or cutting
The depth of penetration of the indenter measures the hardness of a material by this Rockwell ‟s hardness test method the depth of penetration is inversely
proportional to the hardness Both ball or diamond cone types of indenters are used inthis testThere are three scales on the machine for taking hardness readings
Scale bdquoA‟ with load 60kgf or 5888N and diamond indenter is used for performing tests on steel and shallow case hardened steel
Scale bdquoB‟ with load 100kgf or 9807 N and 1588mm dia ball indenter is used forperforming tests on soft steel malleable iron copper and aluminum alloys
Scale bdquoC‟ with load 150kgf or 1471 N and diamond indenter is used for performing testson steel hard cost steel deep case hardened steel other metals which harder
First minor load is applied to overcome the film thickness on the metal surfaceMinor load also eliminates errors in the depth of measurement due to spring of themachine frame or setting down of the specimen and table attachments
The Rockwell hardness is derived from the measurement of the depth of theimpression This method of test is suitable for finished or machined parts of simpleshapes
PROCEDURE
1 Select the load by rotating the nob and fix the suitable indenter
2 Clean the test piece and place on the special anvil or worktable of the machine
3 Turn the capstan wheel to evaluate the test specimen into contact with the indenterpoint
4 Further turn the wheel for three rotations forcing the test specimen against theindenter This will ensure the minor load has been applied5 Set the pointer on the scale dial at the appropriate position
7232019 MOFMOS LABpdf
httpslidepdfcomreaderfullmofmos-labpdf 3147
Department of ANE MOFMOS LAB MANUAL
983093
6 Push the lever to apply the major load A dash pot provided in the loading mechanismto ensure that the load is applied gradually
7 As soon as the pointer comes to rest pull the handle in the reverse direction slowlyThis releases the major but not the minor load The pointer will now rotate in the reversedirection
8 The Rockwell hardness can read off the scale dial on the appropriate scale after thepointer comes to rest
OBSERVATIONS
Material of the specimen =
Thickness of test specimen =
Hardness scale used =
Test Material Rockwell Scale of weights Rockwell number Average
no Rockwell
no
Scale weight indent 1 2 3
PRECAUTIONS
1 For testing cylindrical test specimens use V-type platform
2 Calibrate the machine occasionally by using standard test blocks
3 For thin metal prices place another sufficiently thick metal piece between the testspecimen and the platform to avoid any damage which may likely occur to the platform
4 After applying major load wait for some time to allow the needle to come to restThe waiting time may vary from 2 to 8 seconds
7232019 MOFMOS LABpdf
httpslidepdfcomreaderfullmofmos-labpdf 3247
Department of ANE MOFMOS LAB
MANUAL
983094
5 The surface of the test piece should be smooth and even and free from oxidescale and foreign matter6 Test specimen should not be subjected to any heating of cold working
7 The distance between the centers of two adjacent indentation should be at least 4
Times the diameter of the indentation and the distance from the center of any indentation tothe edge of the test piece should be at least 25 times the diameter of the indentation
RESULT
7232019 MOFMOS LABpdf
httpslidepdfcomreaderfullmofmos-labpdf 3347
Department of ANE MOFMOS LAB MANUAL
983095
Calculation Part
7232019 MOFMOS LABpdf
httpslidepdfcomreaderfullmofmos-labpdf 3447
Department of ANE MOFMOS LAB MANUAL
983096
BRINELLrsquoS HARDNESS TEST
AIM To determine the Brinell hardness of the given test specimen
APPARATUS Brinell hardness machine test specimen Brinells Microscope
THEORY
Indentation Hardness-A number related to the area or to the depth of
the impression made by an indenter or fixed geometry under a known fixed load
This method consists of indenting the surface of the metal by a hardened steel
ball of specified diameter D mm under a given load F kgf and measuring the average
diameter d mm of the impression with the help of Brinell microscope fitted with a scaleThe Brinell hardness HB is defined as the quotient of the applied force F divided by the
spherical area of the impression
HB= Test load in kgfsurface area of indentation
=2F πD (D- D2- d2) kgmm2
PROCEDURE
1 Select the proper size of the ball and load to suit the material under test2 Clean the test specimen to be free from any dirt and defects or blemishes
3 Mount the test piece surface at right angles to the axis of the ball indenter plunger
4 Turn the platform so that the ball is lifted up
5 By shifting the lever applies the load and waits for some time
6 Release the load by shifting the lever
7 Take out the specimen and measure the diameter of indentation by means of theBrinell microscope8 Repeat the experiments at other positions of the test piece
9 Calculate the value of HB
7232019 MOFMOS LABpdf
httpslidepdfcomreaderfullmofmos-labpdf 3547
Department of ANE MOFMOS LAB MANUAL
983097
OBSERVATIONS
Test piece material = Diameter of the ballrdquo D ldquo =
Load section FD2 = Test load =
Load application time =
Least count of Brinell Microscope =
Diameter Average
Impression F D HB
S No in kg in mm Kgmm2
(d1) (d2) (d1+d2)2
PRECAUTIONS
1 The surface of the test piece should be clean
2 The testing machine should be protected throughout the test from shock or vibration
3 The test should be carried out at room temperature
4 The distance of the center of indentation from the edge of test piece should be at
least 25 times the diameter of the indentation and the distance between the center ofthe two adjacent indentations should be at least 4 times the diameter of the indentation
5 The diameter of each indentation should be measured in two directions at rightangles and the mean value readings used the purpose of determining the hardnessnumber
7232019 MOFMOS LABpdf
httpslidepdfcomreaderfullmofmos-labpdf 3647
Department of ANE
MOFMOS LAB MANUAL
983089983088
RESULT
Calculation Part
7232019 MOFMOS LABpdf
httpslidepdfcomreaderfullmofmos-labpdf 3747
Department of ANE MOFMOS LAB MANUAL
983089983089
SPRING TEST
AIM To determine the rigidity modulus of the spring
APPARATUS Spring testing machine vernier calipers spring specimen
THEORY
Closed coiled helical springs are the springs in which helix angle is very small or inother words the pitch between two adjacent turns is small A closed coiled helical springcarrying an axial load is shown in fig
As helix angle in case of close coiled helical springs are small hence the bendingeffect on the spring is ignored and we assume that the coils of close coiled helical
springs are to stand purely tensional stresses Let d=diameter ofthe spring wire
P= pitch of the helical spring N= number ofcoils R= mean radius of the spring coil
W=axial load on spring C=modulus of rigidity
τ=maximum shear stress induced in the wire θ=angle of twist in the
spring wire and
x= deflection of spring due to axial load l= length of wire
Net twisting moment on the wire T=WR
But twisting moment is also given by T= (π 16) τd3
From 1 ad 2 WR = (π 16) τd3 τ=16WR πd
3
above equation which gives the maximum shear stress induced in the wire (1) Length of one coil=2πR
Total length of the wire=2πRn (2)
Strain energy stored by the spring due to torsion
U= (τ 4C) [(π 4)d 2πRn] (3)
Work done on the spring =average load x deflection
= (12) Wx (4)
Equating 3 and 4
(12) Wx = (32W2R3n)Cd4
7232019 MOFMOS LABpdf
httpslidepdfcomreaderfullmofmos-labpdf 3847
Department of ANE MOFMOS LAB MANUAL
983089983090
x=64WR3nCd
4
Rigidity modulus of the spring
C=64WR3nxd
4
PROCEDURE
1) Consider the spring and find out itsmean coil radius R with the help ofvernier calipers
2) Find the diameter of the spring andnumber of turns
3) Fix the spring between two hooks
4) Now load is gradually applied
5) Note the deflection from thedeflection scale for different loadsapplied
6) Calculate the rigidity modulus usingabove formula
PRECAUTIONS
1) Dimensions should be measureaccurately with the help of verniercalipers
2) Deflection from the scale should benoted carefully and accurately
OBSERVATION TABLE
Sno Load applied deflection Rigidity modulus
C
Average rigidity modulus C =
RESULT
7232019 MOFMOS LABpdf
httpslidepdfcomreaderfullmofmos-labpdf 3947
Department of ANE MOFMOS LAB MANUAL
983089983091
Calculation Part
7232019 MOFMOS LABpdf
httpslidepdfcomreaderfullmofmos-labpdf 4047
Department of ANE MOFMOS LAB MANUAL
983089983092
TORSION
AIM To conduct torsion test on mild steel or cast iron specimen to find modulus of rigidity or to find angle of twist of the materials which are subjected to torsion
APPARATUS 1 A torsion test machine along with angle of twist measuring attachment
2 Standard specimen of mild steel or cast iron
3 Steel rule
4 Vernnier caliper or a micrometer
THEORY
For transmitting power through a rotating shaft it is necessary to apply a turning
force The force is applied tangentially and in the plane of transverse cross section The
torque or twisting moment may be calculated by multiplying two opposite turningmoments It is said to be in pure torsion and it will exhibit the tendency of shearing off at
every cross section which is perpendicular to the longitudinal axis
Torsion equation
Torsion equation is given by below
T IP = CθL = TR
T= maximum twisting torque (Nmm) IP =
polar moment of inertia (mm4) τ =shear
stress (Nmm2) C=modulus of rigidity (Nmm2)
θ=angle of twist in radians L=length of shaft under torsion (mm)
Assumptions made for getting torsion equation
1 The material of the shaft is uniform through out
2 The shaft circular in section remain circular after loading
3 Plane sections of shaft normal to its axis before loading remain plane after thetorque have been applied
4 The twist along the length of the shaft is uniform throughout
5 The distance between any two normal-sections remains the same after theapplication of torque
6 Maximum shear stress induced in the shaft due to application of torque does notexceed its elastic limit
7232019 MOFMOS LABpdf
httpslidepdfcomreaderfullmofmos-labpdf 4147
Department of ANE MOFMOS LAB MANUAL
983089983093
PROCEDURE
1 Select the suitable grips to suit the size of the specimen and clamp it in themachine by adjusting sliding jaw
2 Measure the diameter at about the three places and take average value
3 Choose the appropriate loading range depending upon specimen
4 Set the maximum load pointer to zero
5 Carry out straining by rotating the hand wheel or by switching on the motor
6 Load the members in suitable increments observe and record strain reading
7 Continue till failure of the specimen
8 Calculate the modulus of rigidity C by using the torsion equation
9 Plot the torque ndashtwist graph (T Vs θ)
OBSERVATIONS
Gauge length L =
Polar moment of inertia IP =
Modulus of rigidity C =TL IP θ =
SNo Twisting Moment Angle of Twist Modulus Average
Kgf Nm Degrees Radians of rigidity CNmm2
C
RESULT
7232019 MOFMOS LABpdf
httpslidepdfcomreaderfullmofmos-labpdf 4247
Department of ANE MOFMOS LAB MANUAL
983089983094
TENSILE TEST
AIM
To conduct tensile test on a mild steel specimen and determine the following
1 Limit of proportionality 2 Elastic Limit
3 Upper yield point 4 Lower yield point
5 Ultimate strength 6 Fracture strength
7 Young`s Modulus 8 Percentage elongation
9 Percentage reduction in area 10 Ductility
11 Toughness 12 True stress amp true strain
13 Malleability
APPARATUS tensile testing machine specimen steel rule vernier caliper micrometer
THEORY
The tensile test is most applied one of all mechanical tests In this test a test specimen is fixed
into grips connected to a straining device and to a load-measuring device (One end in stationary
grips and the other in movable grips) If the applied load is small enough the deformation of any
solid body is entirely elastic An elastically deformed solid will return to its original form as soon
as load is removed However if the load is too large the material can be deformed permanently
The initial part of the tension curve which represents the manner in which solid undergoes
plastic deformation is termed as plastic The stress below which the deformation is essentially
entirely elastic is known as the elastic limit of the material In some materials like mild steel a
sudden drop in load indicating both an upper and lower yield point denotes the onset of plastic
deformation However some materials do not exhibit a sharp yield point During plastic
deformation at lager extensions strain hardening cannot compensate for the decrease in section
and thus the load passes through a maximum and then begins to decrease At this stage the
ultimate strength which is defined as the ration of the load on the specimen to the original cross-section area reaches a maximum value Until this point the deformation is uniform at all the
sections of the specimen Further loading will eventually cause bdquoneck ‟ formation and rupture
follows
7232019 MOFMOS LABpdf
httpslidepdfcomreaderfullmofmos-labpdf 4347
Department of ANE MOFMOS LAB
MANUAL
983089983095
Usually a tension test is conducted at room temperature the tensile load is applied
slowly During this test either round or flat specimens may be used The load on the specimen is
applied mechanically or hydraulically depending on the type of testing machine
1 NominalEngg stress and NominalEngg strain
Original CS area = A0 (mm2)
Original gauge length = L0 (mm) Increase in gauge length = δL0
Nominal stress = PA0 (N mm2)
Nominal strain = δL0 L0
2 Limit of Proportionality Stress is proportional to strain up to this pointNormal Stress = PA PO Normal Strain = (δ LO) ALO
3 Elastic limit When the load is removed at ldquoBrdquo the specimen will go back to originalDimensions ie LO and δ AO Nominal stress = PB AO Normal Strain = (δ LO) B LO
If the specimen is loaded beyond elastic limit it will undergo permanent strainie Plastic deformation
4 Upper yield point Nominal stress = PC AO Nominal strain = (δ LO) D LO
5 Lower yield point Nominal stress = PD AO
Nominal strain = (δ LO) D LO 6 Ultimate load or maximum load point
Nominal ultimate stress = PE AO Nominal strain = (δ LO) E LO
7 Fracture Load point F
Nominal fracture stress = PF AO
Nominal strain at fracture = (δ LO) F LO
8 Young`s modulus (E) Young`s modulus (E) = StressStrain
(In the elastic region limit of proportionality = Nominal stress at ANominal strain at A 9Modulus of resilience = (Nominal stress at elastic limit)
2 2E
Area under Engg Stress - Strain diagram up to elastic limit10 Resilience = Modulus of Resilience x Volume of specimen undergoing Tensile stress
7232019 MOFMOS LABpdf
httpslidepdfcomreaderfullmofmos-labpdf 4447
Department of ANE MOFMOS LAB MANUAL
983089983096
11 Yield point ElongationElongation taking place in the specimen from C to D this istaking place without increase in stress
12 Modulus of toughnessArea under engineering stress ndash strain diagram up to fracture13 Toughness = Modulus of toughness x Volume of specimenThis indicates theamount of energy absorbed by the specimen before fracture take place
14 Ductility= (Final length at fracture ndash original length 10) x 100
15 MalleabilityIt is the ability of the material to undergo plastic deformation prior fracture under compressive loading conditions In a tensile test it is approximatedas percentage reduction in cross sectional area of the specimen Malleability =
(AO - Af )AO) x 100
True stress ndash true strain diagram
Engineering stress is calculated based on original cross sectional area (AO) But not on the actual cross sectional area at load bdquoP‟
True stress = PA = PAO x AO A
Since volume remains constant during plastic deformation we have AO LO = AL True stress = PAO x L LO
= PAO x ((LO + δLO) LO)
= P (1+e)= Nominal stress (1+ nominal strain)
True strain = Є = 1n (1+e)
These relations are valid up to ultimate load ie up to which the strain isuniform all along the gauge length
1 True Stress at upper yield point = Nominal stress at upper yield point ( 1+e O)True strain at C = 1n (1+eo)
2 True stress at ultimate load (E1)= Nominal ultimate stress ( 1+eE)True strain at ultimate load = 1n (1+eE)
3 True stress at fracture (E1) = Pf Af
Where Af is the area of cross section at fracture can be measured True
strain at fracture = 1n (Ao Af )
Area relation is taken instead of lengths because the strains are localized in theregion between ultimate load point and fracture point
4 Strain Hardening
From lower yield point onwards increase in load is required for increase instrain Thus the stress required for further deformation is more Thisphenomenon is called strain hardening
5 True ndash stress ndash true strain curve in log ndash log co ndash ordinates
When the true ndash stress and true ndash strain are plotted on log ndash log co ndash ordinates thecurve is a straight line
7232019 MOFMOS LABpdf
httpslidepdfcomreaderfullmofmos-labpdf 4547
Department of ANE MOFMOS LAB MANUAL
983120983137983143983141 983089983097 983151983142 983090983089
6 Ductile and Brittle Materials
If a material fails without much plastic deformation it can be called brittle If the percentageelongation at fracture is less than 25 the material is classified as brittle
bull Usually the metals with FCC and CPH structures are highly ductile
PROCEDURE
1 Measure the original gauge length and diameter of the specimen
2 Insert the specimen into grips of the test machine
3 Begin the load application and record load vs elongation data
4 Take the readings more frequently as yield point is approached
5 Measure elongation values
6 Continue the test till fracture occurs
7 By joining the two broken halves of the specimen together measure the final length anddiameter of specimen at fracture
RESULTS AND DISCUSSIONS
1 Plot the Engg Stress strain curve and determine the following
bull Limit of proportionality = (Nmm2)
bull Yield strength = (Nmm2)
bull Ultimate strength = (Nmm2)
bull Young`s modulus = (Nmm2)
bull Percentage elongation = bull Percentage reduction in area =
bull Fracture strength = (Nominal Engg)
bull Toughness = Area under stress ndash strain curve up to
fracture
bull Malleability
2 Plot True Stress True strain curve after calculating true ndash stress and true strain values at various
points
Estimate1) Strength coefficient
2) Strain hardening coefficient
3) Determine whether the material is ductile or brittle4) Comment on the results
7232019 MOFMOS LABpdf
httpslidepdfcomreaderfullmofmos-labpdf 4647
Department of ANE MOFMOS LAB MANUAL
983120983137983143983141 983090983088 983151983142 983090983089
SNo Load Deformation Stress Strain E
Calculation part-
7232019 MOFMOS LABpdf
httpslidepdfcomreaderfullmofmos-labpdf 4747
Department of ANE MOFMOS LAB MANUAL
7232019 MOFMOS LABpdf
httpslidepdfcomreaderfullmofmos-labpdf 1047
Department of ANE MOFMOS LAB MANUAL
983097
bull Check the gauge glass and meter scale assembly of the measuring tank and see that it is
fixed water tight and vertically
bull
Check proper electrical connections to the switch which is internally connected to themotor
Experiments
bull
The apparatus is primarily designed for conducting experiments on the coefficient ofdischarge of flow meters Each flow meter can be connected to the manometer throughthe pressure feed opening and the corresponding cocks
bull
While taking readings close all the cocks in the pressure feed pipes except the two(Down-stream and upstream) cocks which directly connect the manometer to the requiredflow meter for which the differential head is to be measured (Make sure while takingreading that the manometer is properly primed Priming is the operation of filling themanometer upper part and the connecting pipes with water and venting the air from the
pipes)
bull
First open the inlet gate valve of the apparatus Adjust the control valve kept at the exitend of the apparatus to a desired flow rate and maintain the flow steadily
bull
The actual discharge is measured with the help of the measuring tank The differentialhead produced by the flow meter can be found from the manometer for any flow rate
7232019 MOFMOS LABpdf
httpslidepdfcomreaderfullmofmos-labpdf 1147
Department of ANE MOFMOS LAB MANUAL
10
CALIBRATION OF ORIFICE METER
Aim - To calibrate a given Orifice meter and to study the variation of coefficient of discharge ofit with discharge
Apparatus -Orifice meter manometer stop watch experimental set-up
Procedure-1
Start the motor keeping the delivery valve close2
The water is allowed to flow through the selected pipe by selecting the appropriate ballvalve
3 By regulating the valve control the flow rate and select the corresponding pressuretapings (ie of orifice meter)
4 Make sure while taking readings that the manometer is properly primed Priming is theoperation of filling the manometerrsquos upper part and the connecting pipes with water byventing the air from the pipes Note down the difference of head ldquohrdquo from the manometer
scale5 Note down the time required for the rise of 10cm (ie 001m) water in the collecting tank
by using stop watch Calculate actual discharge using below formula
Discharge - The time taken to collect some lsquoRrsquo cm of water in the collecting tank in msup3sec
act
A x RQ =
t
Where A = area of the collecting tank in msup2 (03m X 03m)R = rise of water level taken in meters (say 01m or 10cm)t = time taken for rise of water level to rise lsquoRrsquo in lsquotrsquo seconds
6
Using difference in mercury level ldquohrdquo calculate the theoretical discharge of venturimeterby using following expression
1 2th
2 2
1 2
a xa 2gHQ =
a -a
Where
H= difference of head in meters =m
1 2 1 2
w
S(h -h ) x ( -1) = (h -h ) x 126 m
S
a1 = area of orifice at inlet =
2
1
4
d π
a2 = area of orifice at inlet =
2
2
4
d π
g =Acceleration due to gravityd1 =Inlet diameter in meters d2 =Throat diameter in meters
7 Calculate the coefficient of discharge of orifice meter (Cd)
7232019 MOFMOS LABpdf
httpslidepdfcomreaderfullmofmos-labpdf 1247
Department of ANE MOFMOS LAB MANUAL
11
act
theo
QCd=
Q
8
Repeat the steps 3 to 7 for different sets of readings by regulating the discharge valve
S No Orifice inlet diameterd1
Orifice diameterd2
1 25mm 130
S NoTime for (10 cm)
raise of water
level in sec
Actualdischarge =
Qa
Differential head inmm of mercury Theoretical
discharge = Qt
Cd = Qa Qt
h1 h2 H
1
2
3
4
5
6
7
8
9
10
Calculation-
Precautions-
bull Do not run the pump dry
bull Clean the tanks regularly say for every 15days
bull Do not run the equipment if the voltage is below 180V
bull
Check all the electrical connections before running
bull
Before starting and after finishing the experiment the main
7232019 MOFMOS LABpdf
httpslidepdfcomreaderfullmofmos-labpdf 1347
Department of ANE MOFMOS LAB MANUAL
12
bull Control valve should be in close position
bull Do not attempt to alter the equipment as this may cause
bull Damage to the whole system
Results and Conclusions-
EXPERIMENT 3
PIPE FRICTION APPARATUS
Introduction
A pipe may be of various diameters and may have bends valves etc When a liquid isflowing through such pipes the velocity of the liquid layer adjacent to the pipe wall is zero Thevelocity of the liquid goes on increasing from the wall and hence shear stresses are produced inthe liquid due to viscosity This viscous action causes loss of energy which is usually known asFrictional loss
Here we are going to consider two important losses that occur during flow
bull
Major Losses
bull
Minor Losses
7232019 MOFMOS LABpdf
httpslidepdfcomreaderfullmofmos-labpdf 1447
Department of ANE MOFMOS LAB MANUAL
13
bull Major losses occur due to friction This friction may be due to viscosity or roughness in
the pipe
bull
Minor losses can be due to various reasons such as Inlet and Outlet of the pipe bendsgates sudden expansions and contractions The apparatus is designed to study the friction
losses that appear in long pipes and the obstructions that are encountered in the way offlow by various types of fittings
General DescriptionThe unit consists mainly of 1) Piping System 2) Measuring Tank 3) Differential Manometer 4)Supply pump set 5) Sump
bull Constructional Specification
bull Piping System Piping System of size 127 mm 20 mm and 20 mm (SS) dia With
tapings at 1 meter distance and a flow control valve
bull
Measuring Tank Measuring tank is provided to measure the discharge of water fromthe unit
bull Differential Manometer Differential manometer with 1 mm scale graduations to
measure the loss of head in the pipe line
bull Supply Pump Set Supply pump set is rigidly fixed on the sump The pump set is mono
block pump with 05 HP motor operating on single phase 220 volts 50 Hz AC supply
bull Sump Sump is provided to store sufficient waters for independent circulation through
the unit for experimentation and arranged within the floor space of the main unit
Before Commissioning
bull
Check whether all the joints are leak proof and watertight
bull
Close all the cocks on the pressure feed pipes and Manometer to prevent damage andoverloading of the manometer
bull Check the gauge glass and meter scale assembly of the measuring tank and see that it is
fixed water tight and vertical
bull
Check proper electrical connections to the switch which is internally connected to themotor
Experiments
bull
The apparatus is primarily designed for conducting experiments on the frictional losses inpipes of different sizes Three different sizes of pipes are provided for wide range ofexperiments Each individual pipe can be connected to the Manometer through thepressure feed pipes having individual quick operating cocks
bull
While taking reading close all the cocks in the pressure feed pipe except the two (upstream and downstream) cocks which directly connect the manometer to the requiredpipe for which the loss in head has to be determined (Make sure while taking readings
7232019 MOFMOS LABpdf
httpslidepdfcomreaderfullmofmos-labpdf 1547
Department of ANE MOFMOS LAB MANUAL
14
that the manometer is properly primed Priming is the operating of filling the Manometerupper part and the connecting pipes with water venting the air from the pipes)
bull First open the inlet gate valve of the apparatus Adjust the control valve kept at the exit
end of the apparatus to a desired flow rate and maintain the flow steadily
bull
The actual discharge is measured with the help of the measuring tank For each size ofthe pipe the area of cross section of flow can be calculated from the known diameter ofthe pipes From these two valves and the average velocity of stream through the pipe canbe calculated
bull The actual loss of head is determined from the Manometer readings The frictional loss of
head in pipes is given by the Darcys formulaThe friction coefficient indicates f
7232019 MOFMOS LABpdf
httpslidepdfcomreaderfullmofmos-labpdf 1647
Department of ANE MOFMOS LAB MANUAL
15
FRICTION FACTOR FOR A GIVEN PIPE LINE
Aim - To calculate the friction factor for a given pipe line
Apparatus - experimental set-up stop watch
Procedure-
1 Start the motor keeping the delivery valve close2
The water is allowed to flow through the selected pipe by selecting the appropriateball valve
3 By regulating the valve control the flow rate and select the corresponding pressuretapings
4
Make sure while taking readings that the manometer is properly primed Priming isthe operating of filling the Manometer upper part and the connecting pipes with waterventing the air from the pipes Note down the loss of head ldquohfrdquo from the manometerscale
5
Note down the time required for the rise of 10cm (ie 01m) water in the collectingtank by using stop watch Calculate discharge using below formula
Discharge - The time taken to collect some lsquoxrsquo cm of water in the collecting tank in msup3sec
A x RQ =
t
A = area of the collecting tank in msup2 (03m X 03m)R = rise of water level taken in meters (say 01m or 10cm)t = time taken for rise of water level to rise lsquorrsquo in lsquotrsquo seconds
6 Calculate the velocity of the jet by following formula
V = Discharge = Q A msecArea of the pipe
A = cross sectional area of the pipe=Πdsup2 4d = pipe diameter
7 Calculate the coefficient of friction for the given pipe by fLvsup2
hf = ---------ρgd
Wherehf - Loss of head of water = (h1-h2)(Sn So ndash 1) = (h1-h2) 1261000 m
f - Co-efficient of friction for the pipeL - Discharge between sections for which loss of head is measured (1 meter)v - Average velocity of flow in msecg - Acceleration due to gravity 981msecd - Pipe diameter in meters
8 Repeat the steps 2 to 7 for different sets of readings by regulating the discharge valve
7232019 MOFMOS LABpdf
httpslidepdfcomreaderfullmofmos-labpdf 1747
Department of ANE MOFMOS LAB MANUAL
16
Tabular Form
S No Oslash of pipeArea(a)
Time forrise of 10cm water
Discharge VelocityLoss ofHead
hf
Co-efficientof friction
f
Calculation-
bull Total Head H
H = (h1 + h2) x 126 m of waterWhere
126 = conversion factor from mercury to water head
bull
Discharge Q
WhereA = Area of collecting tank = 0125 msup2R = Rise in water level of the collecting tank cm
t = time for lsquoRrsquo cm rise of water sec100 = Conversion from cm to m
bull
Velocity V
msWhere Arsquo = area of the pipefitting in use
7232019 MOFMOS LABpdf
httpslidepdfcomreaderfullmofmos-labpdf 1847
Department of ANE MOFMOS LAB MANUAL
17
bull
Friction Factor(Major Losses) F
Where H = total head m of waterV = velocity mg = acceleration due to gravity 981mssup2L = Distance bw tapping = 15m
bull
Head Loss Due To Fittings (Minor Losses) K
Where H = total head m of waterV = velocity mg = acceleration due to gravity 981mssup2
Precautions
1) Do not run the pump dry2)
Clean the tanks regularly say for every 15days3)
Do not run the equipment if the voltage is below 180V4) Check all the electrical connections before running5) Before starting and after finishing the experiment the main control valve should be in
close position6) Do not attempt to alter the equipment as this may cause damage to the whole system
Results and Conclusions
7232019 MOFMOS LABpdf
httpslidepdfcomreaderfullmofmos-labpdf 1947
Department of ANE MOFMOS LAB MANUAL
18
EXPERIMENT 4
BERNOULLIrsquoS EXPERIMENTIntroduction
Bernoullirsquos Theorem gives the relationship between pressure head velocity head and thedatum Here the attempt has been made to study the relationship of the above said parametersusing venturimeter
General Description
bull The apparatus consists of a specially fabricated clear ACRYLIC Venturimeter
with necessary tappings connected to a Multibank Piezometer also made of clearACRYLIC
bull
The apparatus consists of two overhead tanks interconnected with the venturimeterwhich is placed in between the tanks
bull The overhead tanks are provided with the Head variation mechanism for conducting
the experiments at various heads
bull
Water in the sump tank is pumped using a Monobloc Centrifugal pump (Kirloskarmake) which passes through the control valve to the overhead tank
bull The height of the water in the collecting tank is measured using the acrylic
Piezometer to find the flowrate
bull The whole arrangement is mounted on an aesthetically designed sturdy frame
made of MS tubes and NOVAPAN Board with all the provisions for holding thetanks and accessories
Aim
o
The experiment is conducted too
Study of Pressure Gradient at different zoneso
Verification of Bernoullis Equationo
Comparative analysis under different flow rates
Apparatus
1) Venturimeter 2)Piezometer 3) Overhead Tank 4)Sump Tank 5) Centrifugal Pump
Procedure
1) Fill in the sump tank with clean water2)
Keep the delivery valve closed3)
Check and give necessary electrical connections to the system4) Switch on the pump amp Slowly open the delivery valve5)
Adjust the flow through the control valve of the pump6)
Allow the system to attain the steady state ie let the water pass from the secondoverhead tank to the collecting tank
7) Note down the Pressure head at different points of the venture meter on the multi-tubepiezometer (Expel if any air is the by inserting the thin pin into the piezometer openings)
8) Close the ball valve of the collecting tank and measure the time for the known rise ofwater
7232019 MOFMOS LABpdf
httpslidepdfcomreaderfullmofmos-labpdf 2047
Department of ANE MOFMOS LAB MANUAL
1983097
9) Change the flow rate and repeat the experiment
Observation
SlNo
Static Head Loss h Time for lsquoRrsquo
cm rise in waterlsquoTrsquo sec1 2 3 4 5 6 7 8 9 10
1
2
3
4
5
Calculations1
Discharge QA2
Where
A = Area of collecting tank = 0045 msup2R = Rise in water level of the collecting tank cmt = time for lsquoRrsquo cm rise of water sec100 = Conversion from cm to m
3 Pressure Head
Where
ρ = density of waterg = gravitational constanth = head measured m of water column
3 Velocity Head
WhereV = Q a a = Area at the particular section of the venturimeter msup2
4 Verification of BERNOULLIrsquoS EQUATIONBernoullirsquos Equation is given as
After findinga Pressure Head hb
Velocity headat different cross-section of the Venturimeter
7232019 MOFMOS LABpdf
httpslidepdfcomreaderfullmofmos-labpdf 2147
Department of ANE MOFMOS LAB MANUAL
20
Put the same in the above equation for different points and verify whether all the values obtainedare sameNote Consider the datum z to be constant
Precautions
bull
Do not run the pump drybull
Clean the tanks regularly say for every 15days
bull
Do not run the equipment if the voltage is below 180V
bull
Check all the electrical connections before running
bull Before starting and after finishing the experiment the main
bull Control valve should be in close position
bull Do not attempt to alter the equipment as this may cause
bull
Damage to the whole system
Result and Conclusion
7232019 MOFMOS LABpdf
httpslidepdfcomreaderfullmofmos-labpdf 2247
Department of ANE MOFMOS LAB MANUAL
21
EXPERIMENT 5
CALIBRATION OF A TRIANGULAR NOTCH
AIM -To find the coefficient of discharge of given triangular notch
THEORY-A notch is a device used for measuring the rate of flow of liquid through a smallchannel or a tank It may be defined as an opening in the side of a tank or small channel in suchthat a way that the liquid surfaces in the tank or channel is below the top edge of the opening
NOTCHES ARE CLASSIFIED AS-1 Rectangular notch2 Triangular notch3 Trapezoidal notch
4 Stepped notch
A triangular notch is preferred to a rectangular notch due to the following reasonsThe expression for discharge of triangular notch is compared to rectangular notch is simple Formeasuring low discharge a triangular notch gives more accurate results than a rectangular notchIn the case of triangular notch only H is required for the computation of dischargeA trapezoidal notch is a combination of rectangular and triangular notch and thus the dischargethrough trapezoidal notch is the sum of above notchesA stepped notch is a combination of rectangular notch and triangular notch The dischargethrough the stepped notch is equal to sum of discharges through the different rectangularnotches
DESCRIPTION- The apparatus consists of1) Measuring tank 2) Sump tank3) Supply pump set 4) Inlet and out let valve
Measuring tank Stainless steel tank of size 030305mm height with the gage glass a scalearrangement for quick and easy measurements A ball valve is provided to empty the tank and adrain is provided at the bottom of the tank to drain the waste water when the unit is not in useWater for independent circulation through the unit for experimentation and arranged within thefloor space of the main unitSump tank The sump tank is a size of 020303m stainless steel tank to store sufficient waterfor independent circulation through the unit for experimentation and arranged within the floorspace of the main unit about 060305m with a gauge glass and scale arrangement A ballvalve is provided to empty the tankSupply Pump set The pump is 2525mm size mono block with frac12 HP 2880 RPM singlephase 220volts AC supply Inlet and out let valve- These valves are used to control the flow ofwater at inlet and out let
PROCEDURE1 Allow the water to drain up to triangular notch
7232019 MOFMOS LABpdf
httpslidepdfcomreaderfullmofmos-labpdf 2347
Department of ANE MOFMOS LAB MANUAL
22
2 Note down the depth of the water when the water is coinciding with the v notch point
3 Collect water in collecting tank and close the drain valve and find the time taken for the rise ofwater up to 20cm
4 Calculate the discharge by using the above results
5 Now substituting the values in the formula for calculation of discharge for v- notch gives therequired result
Precautionsbull Do not run the pump dry
bull Clean the tanks regularly say for every 15days
bull Do not run the equipment if the voltage is below 180V
bull Check all the electrical connections before running
bull
Before starting and after finishing the experiment the main
bull
Control valve should be in close position
bull
Do not attempt to alter the equipment as this may cause
7232019 MOFMOS LABpdf
httpslidepdfcomreaderfullmofmos-labpdf 2447
Department of ANE MOFMOS LAB MANUAL
23
bull Damage to the whole system
Result and Conclusion
7232019 MOFMOS LABpdf
httpslidepdfcomreaderfullmofmos-labpdf 2547
Department of ANE MOFMOS LAB MANUAL
24
MECHANICSOF SOLIDS
LAB
7232019 MOFMOS LABpdf
httpslidepdfcomreaderfullmofmos-labpdf 2647
Department of ANE MOFMOS LAB MANUAL
25
7232019 MOFMOS LABpdf
httpslidepdfcomreaderfullmofmos-labpdf 2747
Department of ANE MOFMOS LAB MANUAL
983089
IZOD IMPACT TEST
AIM To perform the izod impact test on materials
APPARATUS Izod impact test machine test specimen vernier calipers steel rule
IMPACT STRENGTH The resistance of a material to fracture under sudden load application
MATERIALS Two types of test pieces are used for this test as given
1) Square cross-section
2) Round cross-section
THEORY The type of test specimen used for this test is a Square Cross-section
The specimen may have single two or three notches The testing machine shouldhave the following specifications The angle between top face of grips and face holding the specimen Vertical=900 the angle of tip of hammer =750plusmn10
The angle between normal to the specimen and underside face of the hammer at Striking point=100plusmn10
Speed of hammer at impact=399msecStriking energy=168N-m or Joules Angle
Of drop of pendulum =900 Effective
weight of pendulum=2179kg
Minimum value of scale graduation=2 Joules
Permissible total friction loss of corresponding energy=050
Distance from the axis of rotation of distance between the base of specimen notch andthe point of specimen hit by the hammer=22mmplusmn05mm
The longitudinal axes of the test piece shall lie in the plane of swing of the center ofgravity of the hammer The notch shall be positioned so that its in the plane of thehammer the notch shall be positioned its plane of symmetry coincides with the top faceof the grips for setting the specimen the notch impact strength I is calculated accordingto the following relation
Where I= impact strength in joulesm2
7232019 MOFMOS LABpdf
httpslidepdfcomreaderfullmofmos-labpdf 2847
Department of ANE MOFMOS LAB MANUAL
983090
PROCEDURE
1 For conducting Izod test a proper striker is to be fitted firmly to the bottom of thehammer with the help of the clamming piece
2 The latching take for izod test is to be firmly fitted to the bearing housing at the side of
the columns3 The frictional loss of the machine can be determined by free fall test raise the
hammer by hands and latch in release the hammer by operating lever the pointer will
then indicate the energy loss due to friction From this reading confirm that the friction
loss is not exceeding 05 of the initial potential energy Otherwise frictional loss has to
be added to the final reading
4 The specimen for izod test is firmly fitted in the specimen support with the help ofclamping screw and eacutelan key Care should be taken that the notch on the specimenshould face to pendulum striker
5 After ascertaining that there is no person in the range of swinging pendulum release the
pendulum to smash the specimen6 Carefully operate the pendulum brake when returning after one swing to stop the oscillations
7 Read-off position of reading pointer on dial and note indicated value
8 Remove the broken specimen by loosening the clamping screw
The notch impact strength depends largely on the shape of the specimen and the notch the
values determined with other specimens therefore may not be compared with each other
OBSERVATION TABLE
S No A(Area of cross K Impact energy I Impact Strength
section of observed
specimen)
RESULT
7232019 MOFMOS LABpdf
httpslidepdfcomreaderfullmofmos-labpdf 2947
Department of ANE MOFMOS LAB MANUAL
983091
Calculation Part
7232019 MOFMOS LABpdf
httpslidepdfcomreaderfullmofmos-labpdf 3047
Department of ANE MOFMOS LAB MANUAL
983092
ROCKWELL HARDNESS TEST
AIM To determine the Rockwell hardness of the given test specimen
APPARATUS Rockwell hardness testing machine test specimen
THEORY
Hardness-the resistance of a metal to plastic deformationagainst indentation scratching abrasion or cutting
The depth of penetration of the indenter measures the hardness of a material by this Rockwell ‟s hardness test method the depth of penetration is inversely
proportional to the hardness Both ball or diamond cone types of indenters are used inthis testThere are three scales on the machine for taking hardness readings
Scale bdquoA‟ with load 60kgf or 5888N and diamond indenter is used for performing tests on steel and shallow case hardened steel
Scale bdquoB‟ with load 100kgf or 9807 N and 1588mm dia ball indenter is used forperforming tests on soft steel malleable iron copper and aluminum alloys
Scale bdquoC‟ with load 150kgf or 1471 N and diamond indenter is used for performing testson steel hard cost steel deep case hardened steel other metals which harder
First minor load is applied to overcome the film thickness on the metal surfaceMinor load also eliminates errors in the depth of measurement due to spring of themachine frame or setting down of the specimen and table attachments
The Rockwell hardness is derived from the measurement of the depth of theimpression This method of test is suitable for finished or machined parts of simpleshapes
PROCEDURE
1 Select the load by rotating the nob and fix the suitable indenter
2 Clean the test piece and place on the special anvil or worktable of the machine
3 Turn the capstan wheel to evaluate the test specimen into contact with the indenterpoint
4 Further turn the wheel for three rotations forcing the test specimen against theindenter This will ensure the minor load has been applied5 Set the pointer on the scale dial at the appropriate position
7232019 MOFMOS LABpdf
httpslidepdfcomreaderfullmofmos-labpdf 3147
Department of ANE MOFMOS LAB MANUAL
983093
6 Push the lever to apply the major load A dash pot provided in the loading mechanismto ensure that the load is applied gradually
7 As soon as the pointer comes to rest pull the handle in the reverse direction slowlyThis releases the major but not the minor load The pointer will now rotate in the reversedirection
8 The Rockwell hardness can read off the scale dial on the appropriate scale after thepointer comes to rest
OBSERVATIONS
Material of the specimen =
Thickness of test specimen =
Hardness scale used =
Test Material Rockwell Scale of weights Rockwell number Average
no Rockwell
no
Scale weight indent 1 2 3
PRECAUTIONS
1 For testing cylindrical test specimens use V-type platform
2 Calibrate the machine occasionally by using standard test blocks
3 For thin metal prices place another sufficiently thick metal piece between the testspecimen and the platform to avoid any damage which may likely occur to the platform
4 After applying major load wait for some time to allow the needle to come to restThe waiting time may vary from 2 to 8 seconds
7232019 MOFMOS LABpdf
httpslidepdfcomreaderfullmofmos-labpdf 3247
Department of ANE MOFMOS LAB
MANUAL
983094
5 The surface of the test piece should be smooth and even and free from oxidescale and foreign matter6 Test specimen should not be subjected to any heating of cold working
7 The distance between the centers of two adjacent indentation should be at least 4
Times the diameter of the indentation and the distance from the center of any indentation tothe edge of the test piece should be at least 25 times the diameter of the indentation
RESULT
7232019 MOFMOS LABpdf
httpslidepdfcomreaderfullmofmos-labpdf 3347
Department of ANE MOFMOS LAB MANUAL
983095
Calculation Part
7232019 MOFMOS LABpdf
httpslidepdfcomreaderfullmofmos-labpdf 3447
Department of ANE MOFMOS LAB MANUAL
983096
BRINELLrsquoS HARDNESS TEST
AIM To determine the Brinell hardness of the given test specimen
APPARATUS Brinell hardness machine test specimen Brinells Microscope
THEORY
Indentation Hardness-A number related to the area or to the depth of
the impression made by an indenter or fixed geometry under a known fixed load
This method consists of indenting the surface of the metal by a hardened steel
ball of specified diameter D mm under a given load F kgf and measuring the average
diameter d mm of the impression with the help of Brinell microscope fitted with a scaleThe Brinell hardness HB is defined as the quotient of the applied force F divided by the
spherical area of the impression
HB= Test load in kgfsurface area of indentation
=2F πD (D- D2- d2) kgmm2
PROCEDURE
1 Select the proper size of the ball and load to suit the material under test2 Clean the test specimen to be free from any dirt and defects or blemishes
3 Mount the test piece surface at right angles to the axis of the ball indenter plunger
4 Turn the platform so that the ball is lifted up
5 By shifting the lever applies the load and waits for some time
6 Release the load by shifting the lever
7 Take out the specimen and measure the diameter of indentation by means of theBrinell microscope8 Repeat the experiments at other positions of the test piece
9 Calculate the value of HB
7232019 MOFMOS LABpdf
httpslidepdfcomreaderfullmofmos-labpdf 3547
Department of ANE MOFMOS LAB MANUAL
983097
OBSERVATIONS
Test piece material = Diameter of the ballrdquo D ldquo =
Load section FD2 = Test load =
Load application time =
Least count of Brinell Microscope =
Diameter Average
Impression F D HB
S No in kg in mm Kgmm2
(d1) (d2) (d1+d2)2
PRECAUTIONS
1 The surface of the test piece should be clean
2 The testing machine should be protected throughout the test from shock or vibration
3 The test should be carried out at room temperature
4 The distance of the center of indentation from the edge of test piece should be at
least 25 times the diameter of the indentation and the distance between the center ofthe two adjacent indentations should be at least 4 times the diameter of the indentation
5 The diameter of each indentation should be measured in two directions at rightangles and the mean value readings used the purpose of determining the hardnessnumber
7232019 MOFMOS LABpdf
httpslidepdfcomreaderfullmofmos-labpdf 3647
Department of ANE
MOFMOS LAB MANUAL
983089983088
RESULT
Calculation Part
7232019 MOFMOS LABpdf
httpslidepdfcomreaderfullmofmos-labpdf 3747
Department of ANE MOFMOS LAB MANUAL
983089983089
SPRING TEST
AIM To determine the rigidity modulus of the spring
APPARATUS Spring testing machine vernier calipers spring specimen
THEORY
Closed coiled helical springs are the springs in which helix angle is very small or inother words the pitch between two adjacent turns is small A closed coiled helical springcarrying an axial load is shown in fig
As helix angle in case of close coiled helical springs are small hence the bendingeffect on the spring is ignored and we assume that the coils of close coiled helical
springs are to stand purely tensional stresses Let d=diameter ofthe spring wire
P= pitch of the helical spring N= number ofcoils R= mean radius of the spring coil
W=axial load on spring C=modulus of rigidity
τ=maximum shear stress induced in the wire θ=angle of twist in the
spring wire and
x= deflection of spring due to axial load l= length of wire
Net twisting moment on the wire T=WR
But twisting moment is also given by T= (π 16) τd3
From 1 ad 2 WR = (π 16) τd3 τ=16WR πd
3
above equation which gives the maximum shear stress induced in the wire (1) Length of one coil=2πR
Total length of the wire=2πRn (2)
Strain energy stored by the spring due to torsion
U= (τ 4C) [(π 4)d 2πRn] (3)
Work done on the spring =average load x deflection
= (12) Wx (4)
Equating 3 and 4
(12) Wx = (32W2R3n)Cd4
7232019 MOFMOS LABpdf
httpslidepdfcomreaderfullmofmos-labpdf 3847
Department of ANE MOFMOS LAB MANUAL
983089983090
x=64WR3nCd
4
Rigidity modulus of the spring
C=64WR3nxd
4
PROCEDURE
1) Consider the spring and find out itsmean coil radius R with the help ofvernier calipers
2) Find the diameter of the spring andnumber of turns
3) Fix the spring between two hooks
4) Now load is gradually applied
5) Note the deflection from thedeflection scale for different loadsapplied
6) Calculate the rigidity modulus usingabove formula
PRECAUTIONS
1) Dimensions should be measureaccurately with the help of verniercalipers
2) Deflection from the scale should benoted carefully and accurately
OBSERVATION TABLE
Sno Load applied deflection Rigidity modulus
C
Average rigidity modulus C =
RESULT
7232019 MOFMOS LABpdf
httpslidepdfcomreaderfullmofmos-labpdf 3947
Department of ANE MOFMOS LAB MANUAL
983089983091
Calculation Part
7232019 MOFMOS LABpdf
httpslidepdfcomreaderfullmofmos-labpdf 4047
Department of ANE MOFMOS LAB MANUAL
983089983092
TORSION
AIM To conduct torsion test on mild steel or cast iron specimen to find modulus of rigidity or to find angle of twist of the materials which are subjected to torsion
APPARATUS 1 A torsion test machine along with angle of twist measuring attachment
2 Standard specimen of mild steel or cast iron
3 Steel rule
4 Vernnier caliper or a micrometer
THEORY
For transmitting power through a rotating shaft it is necessary to apply a turning
force The force is applied tangentially and in the plane of transverse cross section The
torque or twisting moment may be calculated by multiplying two opposite turningmoments It is said to be in pure torsion and it will exhibit the tendency of shearing off at
every cross section which is perpendicular to the longitudinal axis
Torsion equation
Torsion equation is given by below
T IP = CθL = TR
T= maximum twisting torque (Nmm) IP =
polar moment of inertia (mm4) τ =shear
stress (Nmm2) C=modulus of rigidity (Nmm2)
θ=angle of twist in radians L=length of shaft under torsion (mm)
Assumptions made for getting torsion equation
1 The material of the shaft is uniform through out
2 The shaft circular in section remain circular after loading
3 Plane sections of shaft normal to its axis before loading remain plane after thetorque have been applied
4 The twist along the length of the shaft is uniform throughout
5 The distance between any two normal-sections remains the same after theapplication of torque
6 Maximum shear stress induced in the shaft due to application of torque does notexceed its elastic limit
7232019 MOFMOS LABpdf
httpslidepdfcomreaderfullmofmos-labpdf 4147
Department of ANE MOFMOS LAB MANUAL
983089983093
PROCEDURE
1 Select the suitable grips to suit the size of the specimen and clamp it in themachine by adjusting sliding jaw
2 Measure the diameter at about the three places and take average value
3 Choose the appropriate loading range depending upon specimen
4 Set the maximum load pointer to zero
5 Carry out straining by rotating the hand wheel or by switching on the motor
6 Load the members in suitable increments observe and record strain reading
7 Continue till failure of the specimen
8 Calculate the modulus of rigidity C by using the torsion equation
9 Plot the torque ndashtwist graph (T Vs θ)
OBSERVATIONS
Gauge length L =
Polar moment of inertia IP =
Modulus of rigidity C =TL IP θ =
SNo Twisting Moment Angle of Twist Modulus Average
Kgf Nm Degrees Radians of rigidity CNmm2
C
RESULT
7232019 MOFMOS LABpdf
httpslidepdfcomreaderfullmofmos-labpdf 4247
Department of ANE MOFMOS LAB MANUAL
983089983094
TENSILE TEST
AIM
To conduct tensile test on a mild steel specimen and determine the following
1 Limit of proportionality 2 Elastic Limit
3 Upper yield point 4 Lower yield point
5 Ultimate strength 6 Fracture strength
7 Young`s Modulus 8 Percentage elongation
9 Percentage reduction in area 10 Ductility
11 Toughness 12 True stress amp true strain
13 Malleability
APPARATUS tensile testing machine specimen steel rule vernier caliper micrometer
THEORY
The tensile test is most applied one of all mechanical tests In this test a test specimen is fixed
into grips connected to a straining device and to a load-measuring device (One end in stationary
grips and the other in movable grips) If the applied load is small enough the deformation of any
solid body is entirely elastic An elastically deformed solid will return to its original form as soon
as load is removed However if the load is too large the material can be deformed permanently
The initial part of the tension curve which represents the manner in which solid undergoes
plastic deformation is termed as plastic The stress below which the deformation is essentially
entirely elastic is known as the elastic limit of the material In some materials like mild steel a
sudden drop in load indicating both an upper and lower yield point denotes the onset of plastic
deformation However some materials do not exhibit a sharp yield point During plastic
deformation at lager extensions strain hardening cannot compensate for the decrease in section
and thus the load passes through a maximum and then begins to decrease At this stage the
ultimate strength which is defined as the ration of the load on the specimen to the original cross-section area reaches a maximum value Until this point the deformation is uniform at all the
sections of the specimen Further loading will eventually cause bdquoneck ‟ formation and rupture
follows
7232019 MOFMOS LABpdf
httpslidepdfcomreaderfullmofmos-labpdf 4347
Department of ANE MOFMOS LAB
MANUAL
983089983095
Usually a tension test is conducted at room temperature the tensile load is applied
slowly During this test either round or flat specimens may be used The load on the specimen is
applied mechanically or hydraulically depending on the type of testing machine
1 NominalEngg stress and NominalEngg strain
Original CS area = A0 (mm2)
Original gauge length = L0 (mm) Increase in gauge length = δL0
Nominal stress = PA0 (N mm2)
Nominal strain = δL0 L0
2 Limit of Proportionality Stress is proportional to strain up to this pointNormal Stress = PA PO Normal Strain = (δ LO) ALO
3 Elastic limit When the load is removed at ldquoBrdquo the specimen will go back to originalDimensions ie LO and δ AO Nominal stress = PB AO Normal Strain = (δ LO) B LO
If the specimen is loaded beyond elastic limit it will undergo permanent strainie Plastic deformation
4 Upper yield point Nominal stress = PC AO Nominal strain = (δ LO) D LO
5 Lower yield point Nominal stress = PD AO
Nominal strain = (δ LO) D LO 6 Ultimate load or maximum load point
Nominal ultimate stress = PE AO Nominal strain = (δ LO) E LO
7 Fracture Load point F
Nominal fracture stress = PF AO
Nominal strain at fracture = (δ LO) F LO
8 Young`s modulus (E) Young`s modulus (E) = StressStrain
(In the elastic region limit of proportionality = Nominal stress at ANominal strain at A 9Modulus of resilience = (Nominal stress at elastic limit)
2 2E
Area under Engg Stress - Strain diagram up to elastic limit10 Resilience = Modulus of Resilience x Volume of specimen undergoing Tensile stress
7232019 MOFMOS LABpdf
httpslidepdfcomreaderfullmofmos-labpdf 4447
Department of ANE MOFMOS LAB MANUAL
983089983096
11 Yield point ElongationElongation taking place in the specimen from C to D this istaking place without increase in stress
12 Modulus of toughnessArea under engineering stress ndash strain diagram up to fracture13 Toughness = Modulus of toughness x Volume of specimenThis indicates theamount of energy absorbed by the specimen before fracture take place
14 Ductility= (Final length at fracture ndash original length 10) x 100
15 MalleabilityIt is the ability of the material to undergo plastic deformation prior fracture under compressive loading conditions In a tensile test it is approximatedas percentage reduction in cross sectional area of the specimen Malleability =
(AO - Af )AO) x 100
True stress ndash true strain diagram
Engineering stress is calculated based on original cross sectional area (AO) But not on the actual cross sectional area at load bdquoP‟
True stress = PA = PAO x AO A
Since volume remains constant during plastic deformation we have AO LO = AL True stress = PAO x L LO
= PAO x ((LO + δLO) LO)
= P (1+e)= Nominal stress (1+ nominal strain)
True strain = Є = 1n (1+e)
These relations are valid up to ultimate load ie up to which the strain isuniform all along the gauge length
1 True Stress at upper yield point = Nominal stress at upper yield point ( 1+e O)True strain at C = 1n (1+eo)
2 True stress at ultimate load (E1)= Nominal ultimate stress ( 1+eE)True strain at ultimate load = 1n (1+eE)
3 True stress at fracture (E1) = Pf Af
Where Af is the area of cross section at fracture can be measured True
strain at fracture = 1n (Ao Af )
Area relation is taken instead of lengths because the strains are localized in theregion between ultimate load point and fracture point
4 Strain Hardening
From lower yield point onwards increase in load is required for increase instrain Thus the stress required for further deformation is more Thisphenomenon is called strain hardening
5 True ndash stress ndash true strain curve in log ndash log co ndash ordinates
When the true ndash stress and true ndash strain are plotted on log ndash log co ndash ordinates thecurve is a straight line
7232019 MOFMOS LABpdf
httpslidepdfcomreaderfullmofmos-labpdf 4547
Department of ANE MOFMOS LAB MANUAL
983120983137983143983141 983089983097 983151983142 983090983089
6 Ductile and Brittle Materials
If a material fails without much plastic deformation it can be called brittle If the percentageelongation at fracture is less than 25 the material is classified as brittle
bull Usually the metals with FCC and CPH structures are highly ductile
PROCEDURE
1 Measure the original gauge length and diameter of the specimen
2 Insert the specimen into grips of the test machine
3 Begin the load application and record load vs elongation data
4 Take the readings more frequently as yield point is approached
5 Measure elongation values
6 Continue the test till fracture occurs
7 By joining the two broken halves of the specimen together measure the final length anddiameter of specimen at fracture
RESULTS AND DISCUSSIONS
1 Plot the Engg Stress strain curve and determine the following
bull Limit of proportionality = (Nmm2)
bull Yield strength = (Nmm2)
bull Ultimate strength = (Nmm2)
bull Young`s modulus = (Nmm2)
bull Percentage elongation = bull Percentage reduction in area =
bull Fracture strength = (Nominal Engg)
bull Toughness = Area under stress ndash strain curve up to
fracture
bull Malleability
2 Plot True Stress True strain curve after calculating true ndash stress and true strain values at various
points
Estimate1) Strength coefficient
2) Strain hardening coefficient
3) Determine whether the material is ductile or brittle4) Comment on the results
7232019 MOFMOS LABpdf
httpslidepdfcomreaderfullmofmos-labpdf 4647
Department of ANE MOFMOS LAB MANUAL
983120983137983143983141 983090983088 983151983142 983090983089
SNo Load Deformation Stress Strain E
Calculation part-
7232019 MOFMOS LABpdf
httpslidepdfcomreaderfullmofmos-labpdf 4747
Department of ANE MOFMOS LAB MANUAL

7232019 MOFMOS LABpdf
httpslidepdfcomreaderfullmofmos-labpdf 1147
Department of ANE MOFMOS LAB MANUAL
10
CALIBRATION OF ORIFICE METER
Aim - To calibrate a given Orifice meter and to study the variation of coefficient of discharge ofit with discharge
Apparatus -Orifice meter manometer stop watch experimental set-up
Procedure-1
Start the motor keeping the delivery valve close2
The water is allowed to flow through the selected pipe by selecting the appropriate ballvalve
3 By regulating the valve control the flow rate and select the corresponding pressuretapings (ie of orifice meter)
4 Make sure while taking readings that the manometer is properly primed Priming is theoperation of filling the manometerrsquos upper part and the connecting pipes with water byventing the air from the pipes Note down the difference of head ldquohrdquo from the manometer
scale5 Note down the time required for the rise of 10cm (ie 001m) water in the collecting tank
by using stop watch Calculate actual discharge using below formula
Discharge - The time taken to collect some lsquoRrsquo cm of water in the collecting tank in msup3sec
act
A x RQ =
t
Where A = area of the collecting tank in msup2 (03m X 03m)R = rise of water level taken in meters (say 01m or 10cm)t = time taken for rise of water level to rise lsquoRrsquo in lsquotrsquo seconds
6
Using difference in mercury level ldquohrdquo calculate the theoretical discharge of venturimeterby using following expression
1 2th
2 2
1 2
a xa 2gHQ =
a -a
Where
H= difference of head in meters =m
1 2 1 2
w
S(h -h ) x ( -1) = (h -h ) x 126 m
S
a1 = area of orifice at inlet =
2
1
4
d π
a2 = area of orifice at inlet =
2
2
4
d π
g =Acceleration due to gravityd1 =Inlet diameter in meters d2 =Throat diameter in meters
7 Calculate the coefficient of discharge of orifice meter (Cd)
7232019 MOFMOS LABpdf
httpslidepdfcomreaderfullmofmos-labpdf 1247
Department of ANE MOFMOS LAB MANUAL
11
act
theo
QCd=
Q
8
Repeat the steps 3 to 7 for different sets of readings by regulating the discharge valve
S No Orifice inlet diameterd1
Orifice diameterd2
1 25mm 130
S NoTime for (10 cm)
raise of water
level in sec
Actualdischarge =
Qa
Differential head inmm of mercury Theoretical
discharge = Qt
Cd = Qa Qt
h1 h2 H
1
2
3
4
5
6
7
8
9
10
Calculation-
Precautions-
bull Do not run the pump dry
bull Clean the tanks regularly say for every 15days
bull Do not run the equipment if the voltage is below 180V
bull
Check all the electrical connections before running
bull
Before starting and after finishing the experiment the main
7232019 MOFMOS LABpdf
httpslidepdfcomreaderfullmofmos-labpdf 1347
Department of ANE MOFMOS LAB MANUAL
12
bull Control valve should be in close position
bull Do not attempt to alter the equipment as this may cause
bull Damage to the whole system
Results and Conclusions-
EXPERIMENT 3
PIPE FRICTION APPARATUS
Introduction
A pipe may be of various diameters and may have bends valves etc When a liquid isflowing through such pipes the velocity of the liquid layer adjacent to the pipe wall is zero Thevelocity of the liquid goes on increasing from the wall and hence shear stresses are produced inthe liquid due to viscosity This viscous action causes loss of energy which is usually known asFrictional loss
Here we are going to consider two important losses that occur during flow
bull
Major Losses
bull
Minor Losses
7232019 MOFMOS LABpdf
httpslidepdfcomreaderfullmofmos-labpdf 1447
Department of ANE MOFMOS LAB MANUAL
13
bull Major losses occur due to friction This friction may be due to viscosity or roughness in
the pipe
bull
Minor losses can be due to various reasons such as Inlet and Outlet of the pipe bendsgates sudden expansions and contractions The apparatus is designed to study the friction
losses that appear in long pipes and the obstructions that are encountered in the way offlow by various types of fittings
General DescriptionThe unit consists mainly of 1) Piping System 2) Measuring Tank 3) Differential Manometer 4)Supply pump set 5) Sump
bull Constructional Specification
bull Piping System Piping System of size 127 mm 20 mm and 20 mm (SS) dia With
tapings at 1 meter distance and a flow control valve
bull
Measuring Tank Measuring tank is provided to measure the discharge of water fromthe unit
bull Differential Manometer Differential manometer with 1 mm scale graduations to
measure the loss of head in the pipe line
bull Supply Pump Set Supply pump set is rigidly fixed on the sump The pump set is mono
block pump with 05 HP motor operating on single phase 220 volts 50 Hz AC supply
bull Sump Sump is provided to store sufficient waters for independent circulation through
the unit for experimentation and arranged within the floor space of the main unit
Before Commissioning
bull
Check whether all the joints are leak proof and watertight
bull
Close all the cocks on the pressure feed pipes and Manometer to prevent damage andoverloading of the manometer
bull Check the gauge glass and meter scale assembly of the measuring tank and see that it is
fixed water tight and vertical
bull
Check proper electrical connections to the switch which is internally connected to themotor
Experiments
bull
The apparatus is primarily designed for conducting experiments on the frictional losses inpipes of different sizes Three different sizes of pipes are provided for wide range ofexperiments Each individual pipe can be connected to the Manometer through thepressure feed pipes having individual quick operating cocks
bull
While taking reading close all the cocks in the pressure feed pipe except the two (upstream and downstream) cocks which directly connect the manometer to the requiredpipe for which the loss in head has to be determined (Make sure while taking readings
7232019 MOFMOS LABpdf
httpslidepdfcomreaderfullmofmos-labpdf 1547
Department of ANE MOFMOS LAB MANUAL
14
that the manometer is properly primed Priming is the operating of filling the Manometerupper part and the connecting pipes with water venting the air from the pipes)
bull First open the inlet gate valve of the apparatus Adjust the control valve kept at the exit
end of the apparatus to a desired flow rate and maintain the flow steadily
bull
The actual discharge is measured with the help of the measuring tank For each size ofthe pipe the area of cross section of flow can be calculated from the known diameter ofthe pipes From these two valves and the average velocity of stream through the pipe canbe calculated
bull The actual loss of head is determined from the Manometer readings The frictional loss of
head in pipes is given by the Darcys formulaThe friction coefficient indicates f
7232019 MOFMOS LABpdf
httpslidepdfcomreaderfullmofmos-labpdf 1647
Department of ANE MOFMOS LAB MANUAL
15
FRICTION FACTOR FOR A GIVEN PIPE LINE
Aim - To calculate the friction factor for a given pipe line
Apparatus - experimental set-up stop watch
Procedure-
1 Start the motor keeping the delivery valve close2
The water is allowed to flow through the selected pipe by selecting the appropriateball valve
3 By regulating the valve control the flow rate and select the corresponding pressuretapings
4
Make sure while taking readings that the manometer is properly primed Priming isthe operating of filling the Manometer upper part and the connecting pipes with waterventing the air from the pipes Note down the loss of head ldquohfrdquo from the manometerscale
5
Note down the time required for the rise of 10cm (ie 01m) water in the collectingtank by using stop watch Calculate discharge using below formula
Discharge - The time taken to collect some lsquoxrsquo cm of water in the collecting tank in msup3sec
A x RQ =
t
A = area of the collecting tank in msup2 (03m X 03m)R = rise of water level taken in meters (say 01m or 10cm)t = time taken for rise of water level to rise lsquorrsquo in lsquotrsquo seconds
6 Calculate the velocity of the jet by following formula
V = Discharge = Q A msecArea of the pipe
A = cross sectional area of the pipe=Πdsup2 4d = pipe diameter
7 Calculate the coefficient of friction for the given pipe by fLvsup2
hf = ---------ρgd
Wherehf - Loss of head of water = (h1-h2)(Sn So ndash 1) = (h1-h2) 1261000 m
f - Co-efficient of friction for the pipeL - Discharge between sections for which loss of head is measured (1 meter)v - Average velocity of flow in msecg - Acceleration due to gravity 981msecd - Pipe diameter in meters
8 Repeat the steps 2 to 7 for different sets of readings by regulating the discharge valve
7232019 MOFMOS LABpdf
httpslidepdfcomreaderfullmofmos-labpdf 1747
Department of ANE MOFMOS LAB MANUAL
16
Tabular Form
S No Oslash of pipeArea(a)
Time forrise of 10cm water
Discharge VelocityLoss ofHead
hf
Co-efficientof friction
f
Calculation-
bull Total Head H
H = (h1 + h2) x 126 m of waterWhere
126 = conversion factor from mercury to water head
bull
Discharge Q
WhereA = Area of collecting tank = 0125 msup2R = Rise in water level of the collecting tank cm
t = time for lsquoRrsquo cm rise of water sec100 = Conversion from cm to m
bull
Velocity V
msWhere Arsquo = area of the pipefitting in use
7232019 MOFMOS LABpdf
httpslidepdfcomreaderfullmofmos-labpdf 1847
Department of ANE MOFMOS LAB MANUAL
17
bull
Friction Factor(Major Losses) F
Where H = total head m of waterV = velocity mg = acceleration due to gravity 981mssup2L = Distance bw tapping = 15m
bull
Head Loss Due To Fittings (Minor Losses) K
Where H = total head m of waterV = velocity mg = acceleration due to gravity 981mssup2
Precautions
1) Do not run the pump dry2)
Clean the tanks regularly say for every 15days3)
Do not run the equipment if the voltage is below 180V4) Check all the electrical connections before running5) Before starting and after finishing the experiment the main control valve should be in
close position6) Do not attempt to alter the equipment as this may cause damage to the whole system
Results and Conclusions
7232019 MOFMOS LABpdf
httpslidepdfcomreaderfullmofmos-labpdf 1947
Department of ANE MOFMOS LAB MANUAL
18
EXPERIMENT 4
BERNOULLIrsquoS EXPERIMENTIntroduction
Bernoullirsquos Theorem gives the relationship between pressure head velocity head and thedatum Here the attempt has been made to study the relationship of the above said parametersusing venturimeter
General Description
bull The apparatus consists of a specially fabricated clear ACRYLIC Venturimeter
with necessary tappings connected to a Multibank Piezometer also made of clearACRYLIC
bull
The apparatus consists of two overhead tanks interconnected with the venturimeterwhich is placed in between the tanks
bull The overhead tanks are provided with the Head variation mechanism for conducting
the experiments at various heads
bull
Water in the sump tank is pumped using a Monobloc Centrifugal pump (Kirloskarmake) which passes through the control valve to the overhead tank
bull The height of the water in the collecting tank is measured using the acrylic
Piezometer to find the flowrate
bull The whole arrangement is mounted on an aesthetically designed sturdy frame
made of MS tubes and NOVAPAN Board with all the provisions for holding thetanks and accessories
Aim
o
The experiment is conducted too
Study of Pressure Gradient at different zoneso
Verification of Bernoullis Equationo
Comparative analysis under different flow rates
Apparatus
1) Venturimeter 2)Piezometer 3) Overhead Tank 4)Sump Tank 5) Centrifugal Pump
Procedure
1) Fill in the sump tank with clean water2)
Keep the delivery valve closed3)
Check and give necessary electrical connections to the system4) Switch on the pump amp Slowly open the delivery valve5)
Adjust the flow through the control valve of the pump6)
Allow the system to attain the steady state ie let the water pass from the secondoverhead tank to the collecting tank
7) Note down the Pressure head at different points of the venture meter on the multi-tubepiezometer (Expel if any air is the by inserting the thin pin into the piezometer openings)
8) Close the ball valve of the collecting tank and measure the time for the known rise ofwater
7232019 MOFMOS LABpdf
httpslidepdfcomreaderfullmofmos-labpdf 2047
Department of ANE MOFMOS LAB MANUAL
1983097
9) Change the flow rate and repeat the experiment
Observation
SlNo
Static Head Loss h Time for lsquoRrsquo
cm rise in waterlsquoTrsquo sec1 2 3 4 5 6 7 8 9 10
1
2
3
4
5
Calculations1
Discharge QA2
Where
A = Area of collecting tank = 0045 msup2R = Rise in water level of the collecting tank cmt = time for lsquoRrsquo cm rise of water sec100 = Conversion from cm to m
3 Pressure Head
Where
ρ = density of waterg = gravitational constanth = head measured m of water column
3 Velocity Head
WhereV = Q a a = Area at the particular section of the venturimeter msup2
4 Verification of BERNOULLIrsquoS EQUATIONBernoullirsquos Equation is given as
After findinga Pressure Head hb
Velocity headat different cross-section of the Venturimeter
7232019 MOFMOS LABpdf
httpslidepdfcomreaderfullmofmos-labpdf 2147
Department of ANE MOFMOS LAB MANUAL
20
Put the same in the above equation for different points and verify whether all the values obtainedare sameNote Consider the datum z to be constant
Precautions
bull
Do not run the pump drybull
Clean the tanks regularly say for every 15days
bull
Do not run the equipment if the voltage is below 180V
bull
Check all the electrical connections before running
bull Before starting and after finishing the experiment the main
bull Control valve should be in close position
bull Do not attempt to alter the equipment as this may cause
bull
Damage to the whole system
Result and Conclusion
7232019 MOFMOS LABpdf
httpslidepdfcomreaderfullmofmos-labpdf 2247
Department of ANE MOFMOS LAB MANUAL
21
EXPERIMENT 5
CALIBRATION OF A TRIANGULAR NOTCH
AIM -To find the coefficient of discharge of given triangular notch
THEORY-A notch is a device used for measuring the rate of flow of liquid through a smallchannel or a tank It may be defined as an opening in the side of a tank or small channel in suchthat a way that the liquid surfaces in the tank or channel is below the top edge of the opening
NOTCHES ARE CLASSIFIED AS-1 Rectangular notch2 Triangular notch3 Trapezoidal notch
4 Stepped notch
A triangular notch is preferred to a rectangular notch due to the following reasonsThe expression for discharge of triangular notch is compared to rectangular notch is simple Formeasuring low discharge a triangular notch gives more accurate results than a rectangular notchIn the case of triangular notch only H is required for the computation of dischargeA trapezoidal notch is a combination of rectangular and triangular notch and thus the dischargethrough trapezoidal notch is the sum of above notchesA stepped notch is a combination of rectangular notch and triangular notch The dischargethrough the stepped notch is equal to sum of discharges through the different rectangularnotches
DESCRIPTION- The apparatus consists of1) Measuring tank 2) Sump tank3) Supply pump set 4) Inlet and out let valve
Measuring tank Stainless steel tank of size 030305mm height with the gage glass a scalearrangement for quick and easy measurements A ball valve is provided to empty the tank and adrain is provided at the bottom of the tank to drain the waste water when the unit is not in useWater for independent circulation through the unit for experimentation and arranged within thefloor space of the main unitSump tank The sump tank is a size of 020303m stainless steel tank to store sufficient waterfor independent circulation through the unit for experimentation and arranged within the floorspace of the main unit about 060305m with a gauge glass and scale arrangement A ballvalve is provided to empty the tankSupply Pump set The pump is 2525mm size mono block with frac12 HP 2880 RPM singlephase 220volts AC supply Inlet and out let valve- These valves are used to control the flow ofwater at inlet and out let
PROCEDURE1 Allow the water to drain up to triangular notch
7232019 MOFMOS LABpdf
httpslidepdfcomreaderfullmofmos-labpdf 2347
Department of ANE MOFMOS LAB MANUAL
22
2 Note down the depth of the water when the water is coinciding with the v notch point
3 Collect water in collecting tank and close the drain valve and find the time taken for the rise ofwater up to 20cm
4 Calculate the discharge by using the above results
5 Now substituting the values in the formula for calculation of discharge for v- notch gives therequired result
Precautionsbull Do not run the pump dry
bull Clean the tanks regularly say for every 15days
bull Do not run the equipment if the voltage is below 180V
bull Check all the electrical connections before running
bull
Before starting and after finishing the experiment the main
bull
Control valve should be in close position
bull
Do not attempt to alter the equipment as this may cause
7232019 MOFMOS LABpdf
httpslidepdfcomreaderfullmofmos-labpdf 2447
Department of ANE MOFMOS LAB MANUAL
23
bull Damage to the whole system
Result and Conclusion
7232019 MOFMOS LABpdf
httpslidepdfcomreaderfullmofmos-labpdf 2547
Department of ANE MOFMOS LAB MANUAL
24
MECHANICSOF SOLIDS
LAB
7232019 MOFMOS LABpdf
httpslidepdfcomreaderfullmofmos-labpdf 2647
Department of ANE MOFMOS LAB MANUAL
25
7232019 MOFMOS LABpdf
httpslidepdfcomreaderfullmofmos-labpdf 2747
Department of ANE MOFMOS LAB MANUAL
983089
IZOD IMPACT TEST
AIM To perform the izod impact test on materials
APPARATUS Izod impact test machine test specimen vernier calipers steel rule
IMPACT STRENGTH The resistance of a material to fracture under sudden load application
MATERIALS Two types of test pieces are used for this test as given
1) Square cross-section
2) Round cross-section
THEORY The type of test specimen used for this test is a Square Cross-section
The specimen may have single two or three notches The testing machine shouldhave the following specifications The angle between top face of grips and face holding the specimen Vertical=900 the angle of tip of hammer =750plusmn10
The angle between normal to the specimen and underside face of the hammer at Striking point=100plusmn10
Speed of hammer at impact=399msecStriking energy=168N-m or Joules Angle
Of drop of pendulum =900 Effective
weight of pendulum=2179kg
Minimum value of scale graduation=2 Joules
Permissible total friction loss of corresponding energy=050
Distance from the axis of rotation of distance between the base of specimen notch andthe point of specimen hit by the hammer=22mmplusmn05mm
The longitudinal axes of the test piece shall lie in the plane of swing of the center ofgravity of the hammer The notch shall be positioned so that its in the plane of thehammer the notch shall be positioned its plane of symmetry coincides with the top faceof the grips for setting the specimen the notch impact strength I is calculated accordingto the following relation
Where I= impact strength in joulesm2
7232019 MOFMOS LABpdf
httpslidepdfcomreaderfullmofmos-labpdf 2847
Department of ANE MOFMOS LAB MANUAL
983090
PROCEDURE
1 For conducting Izod test a proper striker is to be fitted firmly to the bottom of thehammer with the help of the clamming piece
2 The latching take for izod test is to be firmly fitted to the bearing housing at the side of
the columns3 The frictional loss of the machine can be determined by free fall test raise the
hammer by hands and latch in release the hammer by operating lever the pointer will
then indicate the energy loss due to friction From this reading confirm that the friction
loss is not exceeding 05 of the initial potential energy Otherwise frictional loss has to
be added to the final reading
4 The specimen for izod test is firmly fitted in the specimen support with the help ofclamping screw and eacutelan key Care should be taken that the notch on the specimenshould face to pendulum striker
5 After ascertaining that there is no person in the range of swinging pendulum release the
pendulum to smash the specimen6 Carefully operate the pendulum brake when returning after one swing to stop the oscillations
7 Read-off position of reading pointer on dial and note indicated value
8 Remove the broken specimen by loosening the clamping screw
The notch impact strength depends largely on the shape of the specimen and the notch the
values determined with other specimens therefore may not be compared with each other
OBSERVATION TABLE
S No A(Area of cross K Impact energy I Impact Strength
section of observed
specimen)
RESULT
7232019 MOFMOS LABpdf
httpslidepdfcomreaderfullmofmos-labpdf 2947
Department of ANE MOFMOS LAB MANUAL
983091
Calculation Part
7232019 MOFMOS LABpdf
httpslidepdfcomreaderfullmofmos-labpdf 3047
Department of ANE MOFMOS LAB MANUAL
983092
ROCKWELL HARDNESS TEST
AIM To determine the Rockwell hardness of the given test specimen
APPARATUS Rockwell hardness testing machine test specimen
THEORY
Hardness-the resistance of a metal to plastic deformationagainst indentation scratching abrasion or cutting
The depth of penetration of the indenter measures the hardness of a material by this Rockwell ‟s hardness test method the depth of penetration is inversely
proportional to the hardness Both ball or diamond cone types of indenters are used inthis testThere are three scales on the machine for taking hardness readings
Scale bdquoA‟ with load 60kgf or 5888N and diamond indenter is used for performing tests on steel and shallow case hardened steel
Scale bdquoB‟ with load 100kgf or 9807 N and 1588mm dia ball indenter is used forperforming tests on soft steel malleable iron copper and aluminum alloys
Scale bdquoC‟ with load 150kgf or 1471 N and diamond indenter is used for performing testson steel hard cost steel deep case hardened steel other metals which harder
First minor load is applied to overcome the film thickness on the metal surfaceMinor load also eliminates errors in the depth of measurement due to spring of themachine frame or setting down of the specimen and table attachments
The Rockwell hardness is derived from the measurement of the depth of theimpression This method of test is suitable for finished or machined parts of simpleshapes
PROCEDURE
1 Select the load by rotating the nob and fix the suitable indenter
2 Clean the test piece and place on the special anvil or worktable of the machine
3 Turn the capstan wheel to evaluate the test specimen into contact with the indenterpoint
4 Further turn the wheel for three rotations forcing the test specimen against theindenter This will ensure the minor load has been applied5 Set the pointer on the scale dial at the appropriate position
7232019 MOFMOS LABpdf
httpslidepdfcomreaderfullmofmos-labpdf 3147
Department of ANE MOFMOS LAB MANUAL
983093
6 Push the lever to apply the major load A dash pot provided in the loading mechanismto ensure that the load is applied gradually
7 As soon as the pointer comes to rest pull the handle in the reverse direction slowlyThis releases the major but not the minor load The pointer will now rotate in the reversedirection
8 The Rockwell hardness can read off the scale dial on the appropriate scale after thepointer comes to rest
OBSERVATIONS
Material of the specimen =
Thickness of test specimen =
Hardness scale used =
Test Material Rockwell Scale of weights Rockwell number Average
no Rockwell
no
Scale weight indent 1 2 3
PRECAUTIONS
1 For testing cylindrical test specimens use V-type platform
2 Calibrate the machine occasionally by using standard test blocks
3 For thin metal prices place another sufficiently thick metal piece between the testspecimen and the platform to avoid any damage which may likely occur to the platform
4 After applying major load wait for some time to allow the needle to come to restThe waiting time may vary from 2 to 8 seconds
7232019 MOFMOS LABpdf
httpslidepdfcomreaderfullmofmos-labpdf 3247
Department of ANE MOFMOS LAB
MANUAL
983094
5 The surface of the test piece should be smooth and even and free from oxidescale and foreign matter6 Test specimen should not be subjected to any heating of cold working
7 The distance between the centers of two adjacent indentation should be at least 4
Times the diameter of the indentation and the distance from the center of any indentation tothe edge of the test piece should be at least 25 times the diameter of the indentation
RESULT
7232019 MOFMOS LABpdf
httpslidepdfcomreaderfullmofmos-labpdf 3347
Department of ANE MOFMOS LAB MANUAL
983095
Calculation Part
7232019 MOFMOS LABpdf
httpslidepdfcomreaderfullmofmos-labpdf 3447
Department of ANE MOFMOS LAB MANUAL
983096
BRINELLrsquoS HARDNESS TEST
AIM To determine the Brinell hardness of the given test specimen
APPARATUS Brinell hardness machine test specimen Brinells Microscope
THEORY
Indentation Hardness-A number related to the area or to the depth of
the impression made by an indenter or fixed geometry under a known fixed load
This method consists of indenting the surface of the metal by a hardened steel
ball of specified diameter D mm under a given load F kgf and measuring the average
diameter d mm of the impression with the help of Brinell microscope fitted with a scaleThe Brinell hardness HB is defined as the quotient of the applied force F divided by the
spherical area of the impression
HB= Test load in kgfsurface area of indentation
=2F πD (D- D2- d2) kgmm2
PROCEDURE
1 Select the proper size of the ball and load to suit the material under test2 Clean the test specimen to be free from any dirt and defects or blemishes
3 Mount the test piece surface at right angles to the axis of the ball indenter plunger
4 Turn the platform so that the ball is lifted up
5 By shifting the lever applies the load and waits for some time
6 Release the load by shifting the lever
7 Take out the specimen and measure the diameter of indentation by means of theBrinell microscope8 Repeat the experiments at other positions of the test piece
9 Calculate the value of HB
7232019 MOFMOS LABpdf
httpslidepdfcomreaderfullmofmos-labpdf 3547
Department of ANE MOFMOS LAB MANUAL
983097
OBSERVATIONS
Test piece material = Diameter of the ballrdquo D ldquo =
Load section FD2 = Test load =
Load application time =
Least count of Brinell Microscope =
Diameter Average
Impression F D HB
S No in kg in mm Kgmm2
(d1) (d2) (d1+d2)2
PRECAUTIONS
1 The surface of the test piece should be clean
2 The testing machine should be protected throughout the test from shock or vibration
3 The test should be carried out at room temperature
4 The distance of the center of indentation from the edge of test piece should be at
least 25 times the diameter of the indentation and the distance between the center ofthe two adjacent indentations should be at least 4 times the diameter of the indentation
5 The diameter of each indentation should be measured in two directions at rightangles and the mean value readings used the purpose of determining the hardnessnumber
7232019 MOFMOS LABpdf
httpslidepdfcomreaderfullmofmos-labpdf 3647
Department of ANE
MOFMOS LAB MANUAL
983089983088
RESULT
Calculation Part
7232019 MOFMOS LABpdf
httpslidepdfcomreaderfullmofmos-labpdf 3747
Department of ANE MOFMOS LAB MANUAL
983089983089
SPRING TEST
AIM To determine the rigidity modulus of the spring
APPARATUS Spring testing machine vernier calipers spring specimen
THEORY
Closed coiled helical springs are the springs in which helix angle is very small or inother words the pitch between two adjacent turns is small A closed coiled helical springcarrying an axial load is shown in fig
As helix angle in case of close coiled helical springs are small hence the bendingeffect on the spring is ignored and we assume that the coils of close coiled helical
springs are to stand purely tensional stresses Let d=diameter ofthe spring wire
P= pitch of the helical spring N= number ofcoils R= mean radius of the spring coil
W=axial load on spring C=modulus of rigidity
τ=maximum shear stress induced in the wire θ=angle of twist in the
spring wire and
x= deflection of spring due to axial load l= length of wire
Net twisting moment on the wire T=WR
But twisting moment is also given by T= (π 16) τd3
From 1 ad 2 WR = (π 16) τd3 τ=16WR πd
3
above equation which gives the maximum shear stress induced in the wire (1) Length of one coil=2πR
Total length of the wire=2πRn (2)
Strain energy stored by the spring due to torsion
U= (τ 4C) [(π 4)d 2πRn] (3)
Work done on the spring =average load x deflection
= (12) Wx (4)
Equating 3 and 4
(12) Wx = (32W2R3n)Cd4
7232019 MOFMOS LABpdf
httpslidepdfcomreaderfullmofmos-labpdf 3847
Department of ANE MOFMOS LAB MANUAL
983089983090
x=64WR3nCd
4
Rigidity modulus of the spring
C=64WR3nxd
4
PROCEDURE
1) Consider the spring and find out itsmean coil radius R with the help ofvernier calipers
2) Find the diameter of the spring andnumber of turns
3) Fix the spring between two hooks
4) Now load is gradually applied
5) Note the deflection from thedeflection scale for different loadsapplied
6) Calculate the rigidity modulus usingabove formula
PRECAUTIONS
1) Dimensions should be measureaccurately with the help of verniercalipers
2) Deflection from the scale should benoted carefully and accurately
OBSERVATION TABLE
Sno Load applied deflection Rigidity modulus
C
Average rigidity modulus C =
RESULT
7232019 MOFMOS LABpdf
httpslidepdfcomreaderfullmofmos-labpdf 3947
Department of ANE MOFMOS LAB MANUAL
983089983091
Calculation Part
7232019 MOFMOS LABpdf
httpslidepdfcomreaderfullmofmos-labpdf 4047
Department of ANE MOFMOS LAB MANUAL
983089983092
TORSION
AIM To conduct torsion test on mild steel or cast iron specimen to find modulus of rigidity or to find angle of twist of the materials which are subjected to torsion
APPARATUS 1 A torsion test machine along with angle of twist measuring attachment
2 Standard specimen of mild steel or cast iron
3 Steel rule
4 Vernnier caliper or a micrometer
THEORY
For transmitting power through a rotating shaft it is necessary to apply a turning
force The force is applied tangentially and in the plane of transverse cross section The
torque or twisting moment may be calculated by multiplying two opposite turningmoments It is said to be in pure torsion and it will exhibit the tendency of shearing off at
every cross section which is perpendicular to the longitudinal axis
Torsion equation
Torsion equation is given by below
T IP = CθL = TR
T= maximum twisting torque (Nmm) IP =
polar moment of inertia (mm4) τ =shear
stress (Nmm2) C=modulus of rigidity (Nmm2)
θ=angle of twist in radians L=length of shaft under torsion (mm)
Assumptions made for getting torsion equation
1 The material of the shaft is uniform through out
2 The shaft circular in section remain circular after loading
3 Plane sections of shaft normal to its axis before loading remain plane after thetorque have been applied
4 The twist along the length of the shaft is uniform throughout
5 The distance between any two normal-sections remains the same after theapplication of torque
6 Maximum shear stress induced in the shaft due to application of torque does notexceed its elastic limit
7232019 MOFMOS LABpdf
httpslidepdfcomreaderfullmofmos-labpdf 4147
Department of ANE MOFMOS LAB MANUAL
983089983093
PROCEDURE
1 Select the suitable grips to suit the size of the specimen and clamp it in themachine by adjusting sliding jaw
2 Measure the diameter at about the three places and take average value
3 Choose the appropriate loading range depending upon specimen
4 Set the maximum load pointer to zero
5 Carry out straining by rotating the hand wheel or by switching on the motor
6 Load the members in suitable increments observe and record strain reading
7 Continue till failure of the specimen
8 Calculate the modulus of rigidity C by using the torsion equation
9 Plot the torque ndashtwist graph (T Vs θ)
OBSERVATIONS
Gauge length L =
Polar moment of inertia IP =
Modulus of rigidity C =TL IP θ =
SNo Twisting Moment Angle of Twist Modulus Average
Kgf Nm Degrees Radians of rigidity CNmm2
C
RESULT
7232019 MOFMOS LABpdf
httpslidepdfcomreaderfullmofmos-labpdf 4247
Department of ANE MOFMOS LAB MANUAL
983089983094
TENSILE TEST
AIM
To conduct tensile test on a mild steel specimen and determine the following
1 Limit of proportionality 2 Elastic Limit
3 Upper yield point 4 Lower yield point
5 Ultimate strength 6 Fracture strength
7 Young`s Modulus 8 Percentage elongation
9 Percentage reduction in area 10 Ductility
11 Toughness 12 True stress amp true strain
13 Malleability
APPARATUS tensile testing machine specimen steel rule vernier caliper micrometer
THEORY
The tensile test is most applied one of all mechanical tests In this test a test specimen is fixed
into grips connected to a straining device and to a load-measuring device (One end in stationary
grips and the other in movable grips) If the applied load is small enough the deformation of any
solid body is entirely elastic An elastically deformed solid will return to its original form as soon
as load is removed However if the load is too large the material can be deformed permanently
The initial part of the tension curve which represents the manner in which solid undergoes
plastic deformation is termed as plastic The stress below which the deformation is essentially
entirely elastic is known as the elastic limit of the material In some materials like mild steel a
sudden drop in load indicating both an upper and lower yield point denotes the onset of plastic
deformation However some materials do not exhibit a sharp yield point During plastic
deformation at lager extensions strain hardening cannot compensate for the decrease in section
and thus the load passes through a maximum and then begins to decrease At this stage the
ultimate strength which is defined as the ration of the load on the specimen to the original cross-section area reaches a maximum value Until this point the deformation is uniform at all the
sections of the specimen Further loading will eventually cause bdquoneck ‟ formation and rupture
follows
7232019 MOFMOS LABpdf
httpslidepdfcomreaderfullmofmos-labpdf 4347
Department of ANE MOFMOS LAB
MANUAL
983089983095
Usually a tension test is conducted at room temperature the tensile load is applied
slowly During this test either round or flat specimens may be used The load on the specimen is
applied mechanically or hydraulically depending on the type of testing machine
1 NominalEngg stress and NominalEngg strain
Original CS area = A0 (mm2)
Original gauge length = L0 (mm) Increase in gauge length = δL0
Nominal stress = PA0 (N mm2)
Nominal strain = δL0 L0
2 Limit of Proportionality Stress is proportional to strain up to this pointNormal Stress = PA PO Normal Strain = (δ LO) ALO
3 Elastic limit When the load is removed at ldquoBrdquo the specimen will go back to originalDimensions ie LO and δ AO Nominal stress = PB AO Normal Strain = (δ LO) B LO
If the specimen is loaded beyond elastic limit it will undergo permanent strainie Plastic deformation
4 Upper yield point Nominal stress = PC AO Nominal strain = (δ LO) D LO
5 Lower yield point Nominal stress = PD AO
Nominal strain = (δ LO) D LO 6 Ultimate load or maximum load point
Nominal ultimate stress = PE AO Nominal strain = (δ LO) E LO
7 Fracture Load point F
Nominal fracture stress = PF AO
Nominal strain at fracture = (δ LO) F LO
8 Young`s modulus (E) Young`s modulus (E) = StressStrain
(In the elastic region limit of proportionality = Nominal stress at ANominal strain at A 9Modulus of resilience = (Nominal stress at elastic limit)
2 2E
Area under Engg Stress - Strain diagram up to elastic limit10 Resilience = Modulus of Resilience x Volume of specimen undergoing Tensile stress
7232019 MOFMOS LABpdf
httpslidepdfcomreaderfullmofmos-labpdf 4447
Department of ANE MOFMOS LAB MANUAL
983089983096
11 Yield point ElongationElongation taking place in the specimen from C to D this istaking place without increase in stress
12 Modulus of toughnessArea under engineering stress ndash strain diagram up to fracture13 Toughness = Modulus of toughness x Volume of specimenThis indicates theamount of energy absorbed by the specimen before fracture take place
14 Ductility= (Final length at fracture ndash original length 10) x 100
15 MalleabilityIt is the ability of the material to undergo plastic deformation prior fracture under compressive loading conditions In a tensile test it is approximatedas percentage reduction in cross sectional area of the specimen Malleability =
(AO - Af )AO) x 100
True stress ndash true strain diagram
Engineering stress is calculated based on original cross sectional area (AO) But not on the actual cross sectional area at load bdquoP‟
True stress = PA = PAO x AO A
Since volume remains constant during plastic deformation we have AO LO = AL True stress = PAO x L LO
= PAO x ((LO + δLO) LO)
= P (1+e)= Nominal stress (1+ nominal strain)
True strain = Є = 1n (1+e)
These relations are valid up to ultimate load ie up to which the strain isuniform all along the gauge length
1 True Stress at upper yield point = Nominal stress at upper yield point ( 1+e O)True strain at C = 1n (1+eo)
2 True stress at ultimate load (E1)= Nominal ultimate stress ( 1+eE)True strain at ultimate load = 1n (1+eE)
3 True stress at fracture (E1) = Pf Af
Where Af is the area of cross section at fracture can be measured True
strain at fracture = 1n (Ao Af )
Area relation is taken instead of lengths because the strains are localized in theregion between ultimate load point and fracture point
4 Strain Hardening
From lower yield point onwards increase in load is required for increase instrain Thus the stress required for further deformation is more Thisphenomenon is called strain hardening
5 True ndash stress ndash true strain curve in log ndash log co ndash ordinates
When the true ndash stress and true ndash strain are plotted on log ndash log co ndash ordinates thecurve is a straight line
7232019 MOFMOS LABpdf
httpslidepdfcomreaderfullmofmos-labpdf 4547
Department of ANE MOFMOS LAB MANUAL
983120983137983143983141 983089983097 983151983142 983090983089
6 Ductile and Brittle Materials
If a material fails without much plastic deformation it can be called brittle If the percentageelongation at fracture is less than 25 the material is classified as brittle
bull Usually the metals with FCC and CPH structures are highly ductile
PROCEDURE
1 Measure the original gauge length and diameter of the specimen
2 Insert the specimen into grips of the test machine
3 Begin the load application and record load vs elongation data
4 Take the readings more frequently as yield point is approached
5 Measure elongation values
6 Continue the test till fracture occurs
7 By joining the two broken halves of the specimen together measure the final length anddiameter of specimen at fracture
RESULTS AND DISCUSSIONS
1 Plot the Engg Stress strain curve and determine the following
bull Limit of proportionality = (Nmm2)
bull Yield strength = (Nmm2)
bull Ultimate strength = (Nmm2)
bull Young`s modulus = (Nmm2)
bull Percentage elongation = bull Percentage reduction in area =
bull Fracture strength = (Nominal Engg)
bull Toughness = Area under stress ndash strain curve up to
fracture
bull Malleability
2 Plot True Stress True strain curve after calculating true ndash stress and true strain values at various
points
Estimate1) Strength coefficient
2) Strain hardening coefficient
3) Determine whether the material is ductile or brittle4) Comment on the results
7232019 MOFMOS LABpdf
httpslidepdfcomreaderfullmofmos-labpdf 4647
Department of ANE MOFMOS LAB MANUAL
983120983137983143983141 983090983088 983151983142 983090983089
SNo Load Deformation Stress Strain E
Calculation part-
7232019 MOFMOS LABpdf
httpslidepdfcomreaderfullmofmos-labpdf 4747
Department of ANE MOFMOS LAB MANUAL
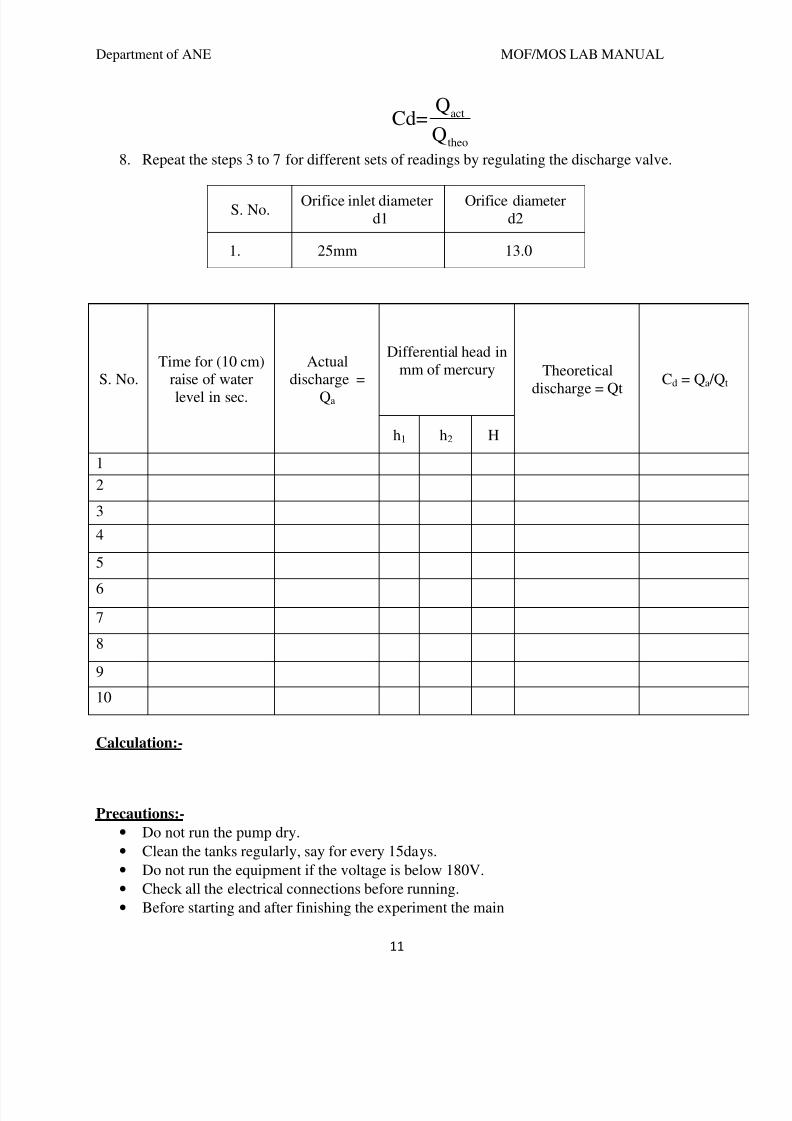
7232019 MOFMOS LABpdf
httpslidepdfcomreaderfullmofmos-labpdf 1247
Department of ANE MOFMOS LAB MANUAL
11
act
theo
QCd=
Q
8
Repeat the steps 3 to 7 for different sets of readings by regulating the discharge valve
S No Orifice inlet diameterd1
Orifice diameterd2
1 25mm 130
S NoTime for (10 cm)
raise of water
level in sec
Actualdischarge =
Qa
Differential head inmm of mercury Theoretical
discharge = Qt
Cd = Qa Qt
h1 h2 H
1
2
3
4
5
6
7
8
9
10
Calculation-
Precautions-
bull Do not run the pump dry
bull Clean the tanks regularly say for every 15days
bull Do not run the equipment if the voltage is below 180V
bull
Check all the electrical connections before running
bull
Before starting and after finishing the experiment the main
7232019 MOFMOS LABpdf
httpslidepdfcomreaderfullmofmos-labpdf 1347
Department of ANE MOFMOS LAB MANUAL
12
bull Control valve should be in close position
bull Do not attempt to alter the equipment as this may cause
bull Damage to the whole system
Results and Conclusions-
EXPERIMENT 3
PIPE FRICTION APPARATUS
Introduction
A pipe may be of various diameters and may have bends valves etc When a liquid isflowing through such pipes the velocity of the liquid layer adjacent to the pipe wall is zero Thevelocity of the liquid goes on increasing from the wall and hence shear stresses are produced inthe liquid due to viscosity This viscous action causes loss of energy which is usually known asFrictional loss
Here we are going to consider two important losses that occur during flow
bull
Major Losses
bull
Minor Losses
7232019 MOFMOS LABpdf
httpslidepdfcomreaderfullmofmos-labpdf 1447
Department of ANE MOFMOS LAB MANUAL
13
bull Major losses occur due to friction This friction may be due to viscosity or roughness in
the pipe
bull
Minor losses can be due to various reasons such as Inlet and Outlet of the pipe bendsgates sudden expansions and contractions The apparatus is designed to study the friction
losses that appear in long pipes and the obstructions that are encountered in the way offlow by various types of fittings
General DescriptionThe unit consists mainly of 1) Piping System 2) Measuring Tank 3) Differential Manometer 4)Supply pump set 5) Sump
bull Constructional Specification
bull Piping System Piping System of size 127 mm 20 mm and 20 mm (SS) dia With
tapings at 1 meter distance and a flow control valve
bull
Measuring Tank Measuring tank is provided to measure the discharge of water fromthe unit
bull Differential Manometer Differential manometer with 1 mm scale graduations to
measure the loss of head in the pipe line
bull Supply Pump Set Supply pump set is rigidly fixed on the sump The pump set is mono
block pump with 05 HP motor operating on single phase 220 volts 50 Hz AC supply
bull Sump Sump is provided to store sufficient waters for independent circulation through
the unit for experimentation and arranged within the floor space of the main unit
Before Commissioning
bull
Check whether all the joints are leak proof and watertight
bull
Close all the cocks on the pressure feed pipes and Manometer to prevent damage andoverloading of the manometer
bull Check the gauge glass and meter scale assembly of the measuring tank and see that it is
fixed water tight and vertical
bull
Check proper electrical connections to the switch which is internally connected to themotor
Experiments
bull
The apparatus is primarily designed for conducting experiments on the frictional losses inpipes of different sizes Three different sizes of pipes are provided for wide range ofexperiments Each individual pipe can be connected to the Manometer through thepressure feed pipes having individual quick operating cocks
bull
While taking reading close all the cocks in the pressure feed pipe except the two (upstream and downstream) cocks which directly connect the manometer to the requiredpipe for which the loss in head has to be determined (Make sure while taking readings
7232019 MOFMOS LABpdf
httpslidepdfcomreaderfullmofmos-labpdf 1547
Department of ANE MOFMOS LAB MANUAL
14
that the manometer is properly primed Priming is the operating of filling the Manometerupper part and the connecting pipes with water venting the air from the pipes)
bull First open the inlet gate valve of the apparatus Adjust the control valve kept at the exit
end of the apparatus to a desired flow rate and maintain the flow steadily
bull
The actual discharge is measured with the help of the measuring tank For each size ofthe pipe the area of cross section of flow can be calculated from the known diameter ofthe pipes From these two valves and the average velocity of stream through the pipe canbe calculated
bull The actual loss of head is determined from the Manometer readings The frictional loss of
head in pipes is given by the Darcys formulaThe friction coefficient indicates f
7232019 MOFMOS LABpdf
httpslidepdfcomreaderfullmofmos-labpdf 1647
Department of ANE MOFMOS LAB MANUAL
15
FRICTION FACTOR FOR A GIVEN PIPE LINE
Aim - To calculate the friction factor for a given pipe line
Apparatus - experimental set-up stop watch
Procedure-
1 Start the motor keeping the delivery valve close2
The water is allowed to flow through the selected pipe by selecting the appropriateball valve
3 By regulating the valve control the flow rate and select the corresponding pressuretapings
4
Make sure while taking readings that the manometer is properly primed Priming isthe operating of filling the Manometer upper part and the connecting pipes with waterventing the air from the pipes Note down the loss of head ldquohfrdquo from the manometerscale
5
Note down the time required for the rise of 10cm (ie 01m) water in the collectingtank by using stop watch Calculate discharge using below formula
Discharge - The time taken to collect some lsquoxrsquo cm of water in the collecting tank in msup3sec
A x RQ =
t
A = area of the collecting tank in msup2 (03m X 03m)R = rise of water level taken in meters (say 01m or 10cm)t = time taken for rise of water level to rise lsquorrsquo in lsquotrsquo seconds
6 Calculate the velocity of the jet by following formula
V = Discharge = Q A msecArea of the pipe
A = cross sectional area of the pipe=Πdsup2 4d = pipe diameter
7 Calculate the coefficient of friction for the given pipe by fLvsup2
hf = ---------ρgd
Wherehf - Loss of head of water = (h1-h2)(Sn So ndash 1) = (h1-h2) 1261000 m
f - Co-efficient of friction for the pipeL - Discharge between sections for which loss of head is measured (1 meter)v - Average velocity of flow in msecg - Acceleration due to gravity 981msecd - Pipe diameter in meters
8 Repeat the steps 2 to 7 for different sets of readings by regulating the discharge valve
7232019 MOFMOS LABpdf
httpslidepdfcomreaderfullmofmos-labpdf 1747
Department of ANE MOFMOS LAB MANUAL
16
Tabular Form
S No Oslash of pipeArea(a)
Time forrise of 10cm water
Discharge VelocityLoss ofHead
hf
Co-efficientof friction
f
Calculation-
bull Total Head H
H = (h1 + h2) x 126 m of waterWhere
126 = conversion factor from mercury to water head
bull
Discharge Q
WhereA = Area of collecting tank = 0125 msup2R = Rise in water level of the collecting tank cm
t = time for lsquoRrsquo cm rise of water sec100 = Conversion from cm to m
bull
Velocity V
msWhere Arsquo = area of the pipefitting in use
7232019 MOFMOS LABpdf
httpslidepdfcomreaderfullmofmos-labpdf 1847
Department of ANE MOFMOS LAB MANUAL
17
bull
Friction Factor(Major Losses) F
Where H = total head m of waterV = velocity mg = acceleration due to gravity 981mssup2L = Distance bw tapping = 15m
bull
Head Loss Due To Fittings (Minor Losses) K
Where H = total head m of waterV = velocity mg = acceleration due to gravity 981mssup2
Precautions
1) Do not run the pump dry2)
Clean the tanks regularly say for every 15days3)
Do not run the equipment if the voltage is below 180V4) Check all the electrical connections before running5) Before starting and after finishing the experiment the main control valve should be in
close position6) Do not attempt to alter the equipment as this may cause damage to the whole system
Results and Conclusions
7232019 MOFMOS LABpdf
httpslidepdfcomreaderfullmofmos-labpdf 1947
Department of ANE MOFMOS LAB MANUAL
18
EXPERIMENT 4
BERNOULLIrsquoS EXPERIMENTIntroduction
Bernoullirsquos Theorem gives the relationship between pressure head velocity head and thedatum Here the attempt has been made to study the relationship of the above said parametersusing venturimeter
General Description
bull The apparatus consists of a specially fabricated clear ACRYLIC Venturimeter
with necessary tappings connected to a Multibank Piezometer also made of clearACRYLIC
bull
The apparatus consists of two overhead tanks interconnected with the venturimeterwhich is placed in between the tanks
bull The overhead tanks are provided with the Head variation mechanism for conducting
the experiments at various heads
bull
Water in the sump tank is pumped using a Monobloc Centrifugal pump (Kirloskarmake) which passes through the control valve to the overhead tank
bull The height of the water in the collecting tank is measured using the acrylic
Piezometer to find the flowrate
bull The whole arrangement is mounted on an aesthetically designed sturdy frame
made of MS tubes and NOVAPAN Board with all the provisions for holding thetanks and accessories
Aim
o
The experiment is conducted too
Study of Pressure Gradient at different zoneso
Verification of Bernoullis Equationo
Comparative analysis under different flow rates
Apparatus
1) Venturimeter 2)Piezometer 3) Overhead Tank 4)Sump Tank 5) Centrifugal Pump
Procedure
1) Fill in the sump tank with clean water2)
Keep the delivery valve closed3)
Check and give necessary electrical connections to the system4) Switch on the pump amp Slowly open the delivery valve5)
Adjust the flow through the control valve of the pump6)
Allow the system to attain the steady state ie let the water pass from the secondoverhead tank to the collecting tank
7) Note down the Pressure head at different points of the venture meter on the multi-tubepiezometer (Expel if any air is the by inserting the thin pin into the piezometer openings)
8) Close the ball valve of the collecting tank and measure the time for the known rise ofwater
7232019 MOFMOS LABpdf
httpslidepdfcomreaderfullmofmos-labpdf 2047
Department of ANE MOFMOS LAB MANUAL
1983097
9) Change the flow rate and repeat the experiment
Observation
SlNo
Static Head Loss h Time for lsquoRrsquo
cm rise in waterlsquoTrsquo sec1 2 3 4 5 6 7 8 9 10
1
2
3
4
5
Calculations1
Discharge QA2
Where
A = Area of collecting tank = 0045 msup2R = Rise in water level of the collecting tank cmt = time for lsquoRrsquo cm rise of water sec100 = Conversion from cm to m
3 Pressure Head
Where
ρ = density of waterg = gravitational constanth = head measured m of water column
3 Velocity Head
WhereV = Q a a = Area at the particular section of the venturimeter msup2
4 Verification of BERNOULLIrsquoS EQUATIONBernoullirsquos Equation is given as
After findinga Pressure Head hb
Velocity headat different cross-section of the Venturimeter
7232019 MOFMOS LABpdf
httpslidepdfcomreaderfullmofmos-labpdf 2147
Department of ANE MOFMOS LAB MANUAL
20
Put the same in the above equation for different points and verify whether all the values obtainedare sameNote Consider the datum z to be constant
Precautions
bull
Do not run the pump drybull
Clean the tanks regularly say for every 15days
bull
Do not run the equipment if the voltage is below 180V
bull
Check all the electrical connections before running
bull Before starting and after finishing the experiment the main
bull Control valve should be in close position
bull Do not attempt to alter the equipment as this may cause
bull
Damage to the whole system
Result and Conclusion
7232019 MOFMOS LABpdf
httpslidepdfcomreaderfullmofmos-labpdf 2247
Department of ANE MOFMOS LAB MANUAL
21
EXPERIMENT 5
CALIBRATION OF A TRIANGULAR NOTCH
AIM -To find the coefficient of discharge of given triangular notch
THEORY-A notch is a device used for measuring the rate of flow of liquid through a smallchannel or a tank It may be defined as an opening in the side of a tank or small channel in suchthat a way that the liquid surfaces in the tank or channel is below the top edge of the opening
NOTCHES ARE CLASSIFIED AS-1 Rectangular notch2 Triangular notch3 Trapezoidal notch
4 Stepped notch
A triangular notch is preferred to a rectangular notch due to the following reasonsThe expression for discharge of triangular notch is compared to rectangular notch is simple Formeasuring low discharge a triangular notch gives more accurate results than a rectangular notchIn the case of triangular notch only H is required for the computation of dischargeA trapezoidal notch is a combination of rectangular and triangular notch and thus the dischargethrough trapezoidal notch is the sum of above notchesA stepped notch is a combination of rectangular notch and triangular notch The dischargethrough the stepped notch is equal to sum of discharges through the different rectangularnotches
DESCRIPTION- The apparatus consists of1) Measuring tank 2) Sump tank3) Supply pump set 4) Inlet and out let valve
Measuring tank Stainless steel tank of size 030305mm height with the gage glass a scalearrangement for quick and easy measurements A ball valve is provided to empty the tank and adrain is provided at the bottom of the tank to drain the waste water when the unit is not in useWater for independent circulation through the unit for experimentation and arranged within thefloor space of the main unitSump tank The sump tank is a size of 020303m stainless steel tank to store sufficient waterfor independent circulation through the unit for experimentation and arranged within the floorspace of the main unit about 060305m with a gauge glass and scale arrangement A ballvalve is provided to empty the tankSupply Pump set The pump is 2525mm size mono block with frac12 HP 2880 RPM singlephase 220volts AC supply Inlet and out let valve- These valves are used to control the flow ofwater at inlet and out let
PROCEDURE1 Allow the water to drain up to triangular notch
7232019 MOFMOS LABpdf
httpslidepdfcomreaderfullmofmos-labpdf 2347
Department of ANE MOFMOS LAB MANUAL
22
2 Note down the depth of the water when the water is coinciding with the v notch point
3 Collect water in collecting tank and close the drain valve and find the time taken for the rise ofwater up to 20cm
4 Calculate the discharge by using the above results
5 Now substituting the values in the formula for calculation of discharge for v- notch gives therequired result
Precautionsbull Do not run the pump dry
bull Clean the tanks regularly say for every 15days
bull Do not run the equipment if the voltage is below 180V
bull Check all the electrical connections before running
bull
Before starting and after finishing the experiment the main
bull
Control valve should be in close position
bull
Do not attempt to alter the equipment as this may cause
7232019 MOFMOS LABpdf
httpslidepdfcomreaderfullmofmos-labpdf 2447
Department of ANE MOFMOS LAB MANUAL
23
bull Damage to the whole system
Result and Conclusion
7232019 MOFMOS LABpdf
httpslidepdfcomreaderfullmofmos-labpdf 2547
Department of ANE MOFMOS LAB MANUAL
24
MECHANICSOF SOLIDS
LAB
7232019 MOFMOS LABpdf
httpslidepdfcomreaderfullmofmos-labpdf 2647
Department of ANE MOFMOS LAB MANUAL
25
7232019 MOFMOS LABpdf
httpslidepdfcomreaderfullmofmos-labpdf 2747
Department of ANE MOFMOS LAB MANUAL
983089
IZOD IMPACT TEST
AIM To perform the izod impact test on materials
APPARATUS Izod impact test machine test specimen vernier calipers steel rule
IMPACT STRENGTH The resistance of a material to fracture under sudden load application
MATERIALS Two types of test pieces are used for this test as given
1) Square cross-section
2) Round cross-section
THEORY The type of test specimen used for this test is a Square Cross-section
The specimen may have single two or three notches The testing machine shouldhave the following specifications The angle between top face of grips and face holding the specimen Vertical=900 the angle of tip of hammer =750plusmn10
The angle between normal to the specimen and underside face of the hammer at Striking point=100plusmn10
Speed of hammer at impact=399msecStriking energy=168N-m or Joules Angle
Of drop of pendulum =900 Effective
weight of pendulum=2179kg
Minimum value of scale graduation=2 Joules
Permissible total friction loss of corresponding energy=050
Distance from the axis of rotation of distance between the base of specimen notch andthe point of specimen hit by the hammer=22mmplusmn05mm
The longitudinal axes of the test piece shall lie in the plane of swing of the center ofgravity of the hammer The notch shall be positioned so that its in the plane of thehammer the notch shall be positioned its plane of symmetry coincides with the top faceof the grips for setting the specimen the notch impact strength I is calculated accordingto the following relation
Where I= impact strength in joulesm2
7232019 MOFMOS LABpdf
httpslidepdfcomreaderfullmofmos-labpdf 2847
Department of ANE MOFMOS LAB MANUAL
983090
PROCEDURE
1 For conducting Izod test a proper striker is to be fitted firmly to the bottom of thehammer with the help of the clamming piece
2 The latching take for izod test is to be firmly fitted to the bearing housing at the side of
the columns3 The frictional loss of the machine can be determined by free fall test raise the
hammer by hands and latch in release the hammer by operating lever the pointer will
then indicate the energy loss due to friction From this reading confirm that the friction
loss is not exceeding 05 of the initial potential energy Otherwise frictional loss has to
be added to the final reading
4 The specimen for izod test is firmly fitted in the specimen support with the help ofclamping screw and eacutelan key Care should be taken that the notch on the specimenshould face to pendulum striker
5 After ascertaining that there is no person in the range of swinging pendulum release the
pendulum to smash the specimen6 Carefully operate the pendulum brake when returning after one swing to stop the oscillations
7 Read-off position of reading pointer on dial and note indicated value
8 Remove the broken specimen by loosening the clamping screw
The notch impact strength depends largely on the shape of the specimen and the notch the
values determined with other specimens therefore may not be compared with each other
OBSERVATION TABLE
S No A(Area of cross K Impact energy I Impact Strength
section of observed
specimen)
RESULT
7232019 MOFMOS LABpdf
httpslidepdfcomreaderfullmofmos-labpdf 2947
Department of ANE MOFMOS LAB MANUAL
983091
Calculation Part
7232019 MOFMOS LABpdf
httpslidepdfcomreaderfullmofmos-labpdf 3047
Department of ANE MOFMOS LAB MANUAL
983092
ROCKWELL HARDNESS TEST
AIM To determine the Rockwell hardness of the given test specimen
APPARATUS Rockwell hardness testing machine test specimen
THEORY
Hardness-the resistance of a metal to plastic deformationagainst indentation scratching abrasion or cutting
The depth of penetration of the indenter measures the hardness of a material by this Rockwell ‟s hardness test method the depth of penetration is inversely
proportional to the hardness Both ball or diamond cone types of indenters are used inthis testThere are three scales on the machine for taking hardness readings
Scale bdquoA‟ with load 60kgf or 5888N and diamond indenter is used for performing tests on steel and shallow case hardened steel
Scale bdquoB‟ with load 100kgf or 9807 N and 1588mm dia ball indenter is used forperforming tests on soft steel malleable iron copper and aluminum alloys
Scale bdquoC‟ with load 150kgf or 1471 N and diamond indenter is used for performing testson steel hard cost steel deep case hardened steel other metals which harder
First minor load is applied to overcome the film thickness on the metal surfaceMinor load also eliminates errors in the depth of measurement due to spring of themachine frame or setting down of the specimen and table attachments
The Rockwell hardness is derived from the measurement of the depth of theimpression This method of test is suitable for finished or machined parts of simpleshapes
PROCEDURE
1 Select the load by rotating the nob and fix the suitable indenter
2 Clean the test piece and place on the special anvil or worktable of the machine
3 Turn the capstan wheel to evaluate the test specimen into contact with the indenterpoint
4 Further turn the wheel for three rotations forcing the test specimen against theindenter This will ensure the minor load has been applied5 Set the pointer on the scale dial at the appropriate position
7232019 MOFMOS LABpdf
httpslidepdfcomreaderfullmofmos-labpdf 3147
Department of ANE MOFMOS LAB MANUAL
983093
6 Push the lever to apply the major load A dash pot provided in the loading mechanismto ensure that the load is applied gradually
7 As soon as the pointer comes to rest pull the handle in the reverse direction slowlyThis releases the major but not the minor load The pointer will now rotate in the reversedirection
8 The Rockwell hardness can read off the scale dial on the appropriate scale after thepointer comes to rest
OBSERVATIONS
Material of the specimen =
Thickness of test specimen =
Hardness scale used =
Test Material Rockwell Scale of weights Rockwell number Average
no Rockwell
no
Scale weight indent 1 2 3
PRECAUTIONS
1 For testing cylindrical test specimens use V-type platform
2 Calibrate the machine occasionally by using standard test blocks
3 For thin metal prices place another sufficiently thick metal piece between the testspecimen and the platform to avoid any damage which may likely occur to the platform
4 After applying major load wait for some time to allow the needle to come to restThe waiting time may vary from 2 to 8 seconds
7232019 MOFMOS LABpdf
httpslidepdfcomreaderfullmofmos-labpdf 3247
Department of ANE MOFMOS LAB
MANUAL
983094
5 The surface of the test piece should be smooth and even and free from oxidescale and foreign matter6 Test specimen should not be subjected to any heating of cold working
7 The distance between the centers of two adjacent indentation should be at least 4
Times the diameter of the indentation and the distance from the center of any indentation tothe edge of the test piece should be at least 25 times the diameter of the indentation
RESULT
7232019 MOFMOS LABpdf
httpslidepdfcomreaderfullmofmos-labpdf 3347
Department of ANE MOFMOS LAB MANUAL
983095
Calculation Part
7232019 MOFMOS LABpdf
httpslidepdfcomreaderfullmofmos-labpdf 3447
Department of ANE MOFMOS LAB MANUAL
983096
BRINELLrsquoS HARDNESS TEST
AIM To determine the Brinell hardness of the given test specimen
APPARATUS Brinell hardness machine test specimen Brinells Microscope
THEORY
Indentation Hardness-A number related to the area or to the depth of
the impression made by an indenter or fixed geometry under a known fixed load
This method consists of indenting the surface of the metal by a hardened steel
ball of specified diameter D mm under a given load F kgf and measuring the average
diameter d mm of the impression with the help of Brinell microscope fitted with a scaleThe Brinell hardness HB is defined as the quotient of the applied force F divided by the
spherical area of the impression
HB= Test load in kgfsurface area of indentation
=2F πD (D- D2- d2) kgmm2
PROCEDURE
1 Select the proper size of the ball and load to suit the material under test2 Clean the test specimen to be free from any dirt and defects or blemishes
3 Mount the test piece surface at right angles to the axis of the ball indenter plunger
4 Turn the platform so that the ball is lifted up
5 By shifting the lever applies the load and waits for some time
6 Release the load by shifting the lever
7 Take out the specimen and measure the diameter of indentation by means of theBrinell microscope8 Repeat the experiments at other positions of the test piece
9 Calculate the value of HB
7232019 MOFMOS LABpdf
httpslidepdfcomreaderfullmofmos-labpdf 3547
Department of ANE MOFMOS LAB MANUAL
983097
OBSERVATIONS
Test piece material = Diameter of the ballrdquo D ldquo =
Load section FD2 = Test load =
Load application time =
Least count of Brinell Microscope =
Diameter Average
Impression F D HB
S No in kg in mm Kgmm2
(d1) (d2) (d1+d2)2
PRECAUTIONS
1 The surface of the test piece should be clean
2 The testing machine should be protected throughout the test from shock or vibration
3 The test should be carried out at room temperature
4 The distance of the center of indentation from the edge of test piece should be at
least 25 times the diameter of the indentation and the distance between the center ofthe two adjacent indentations should be at least 4 times the diameter of the indentation
5 The diameter of each indentation should be measured in two directions at rightangles and the mean value readings used the purpose of determining the hardnessnumber
7232019 MOFMOS LABpdf
httpslidepdfcomreaderfullmofmos-labpdf 3647
Department of ANE
MOFMOS LAB MANUAL
983089983088
RESULT
Calculation Part
7232019 MOFMOS LABpdf
httpslidepdfcomreaderfullmofmos-labpdf 3747
Department of ANE MOFMOS LAB MANUAL
983089983089
SPRING TEST
AIM To determine the rigidity modulus of the spring
APPARATUS Spring testing machine vernier calipers spring specimen
THEORY
Closed coiled helical springs are the springs in which helix angle is very small or inother words the pitch between two adjacent turns is small A closed coiled helical springcarrying an axial load is shown in fig
As helix angle in case of close coiled helical springs are small hence the bendingeffect on the spring is ignored and we assume that the coils of close coiled helical
springs are to stand purely tensional stresses Let d=diameter ofthe spring wire
P= pitch of the helical spring N= number ofcoils R= mean radius of the spring coil
W=axial load on spring C=modulus of rigidity
τ=maximum shear stress induced in the wire θ=angle of twist in the
spring wire and
x= deflection of spring due to axial load l= length of wire
Net twisting moment on the wire T=WR
But twisting moment is also given by T= (π 16) τd3
From 1 ad 2 WR = (π 16) τd3 τ=16WR πd
3
above equation which gives the maximum shear stress induced in the wire (1) Length of one coil=2πR
Total length of the wire=2πRn (2)
Strain energy stored by the spring due to torsion
U= (τ 4C) [(π 4)d 2πRn] (3)
Work done on the spring =average load x deflection
= (12) Wx (4)
Equating 3 and 4
(12) Wx = (32W2R3n)Cd4
7232019 MOFMOS LABpdf
httpslidepdfcomreaderfullmofmos-labpdf 3847
Department of ANE MOFMOS LAB MANUAL
983089983090
x=64WR3nCd
4
Rigidity modulus of the spring
C=64WR3nxd
4
PROCEDURE
1) Consider the spring and find out itsmean coil radius R with the help ofvernier calipers
2) Find the diameter of the spring andnumber of turns
3) Fix the spring between two hooks
4) Now load is gradually applied
5) Note the deflection from thedeflection scale for different loadsapplied
6) Calculate the rigidity modulus usingabove formula
PRECAUTIONS
1) Dimensions should be measureaccurately with the help of verniercalipers
2) Deflection from the scale should benoted carefully and accurately
OBSERVATION TABLE
Sno Load applied deflection Rigidity modulus
C
Average rigidity modulus C =
RESULT
7232019 MOFMOS LABpdf
httpslidepdfcomreaderfullmofmos-labpdf 3947
Department of ANE MOFMOS LAB MANUAL
983089983091
Calculation Part
7232019 MOFMOS LABpdf
httpslidepdfcomreaderfullmofmos-labpdf 4047
Department of ANE MOFMOS LAB MANUAL
983089983092
TORSION
AIM To conduct torsion test on mild steel or cast iron specimen to find modulus of rigidity or to find angle of twist of the materials which are subjected to torsion
APPARATUS 1 A torsion test machine along with angle of twist measuring attachment
2 Standard specimen of mild steel or cast iron
3 Steel rule
4 Vernnier caliper or a micrometer
THEORY
For transmitting power through a rotating shaft it is necessary to apply a turning
force The force is applied tangentially and in the plane of transverse cross section The
torque or twisting moment may be calculated by multiplying two opposite turningmoments It is said to be in pure torsion and it will exhibit the tendency of shearing off at
every cross section which is perpendicular to the longitudinal axis
Torsion equation
Torsion equation is given by below
T IP = CθL = TR
T= maximum twisting torque (Nmm) IP =
polar moment of inertia (mm4) τ =shear
stress (Nmm2) C=modulus of rigidity (Nmm2)
θ=angle of twist in radians L=length of shaft under torsion (mm)
Assumptions made for getting torsion equation
1 The material of the shaft is uniform through out
2 The shaft circular in section remain circular after loading
3 Plane sections of shaft normal to its axis before loading remain plane after thetorque have been applied
4 The twist along the length of the shaft is uniform throughout
5 The distance between any two normal-sections remains the same after theapplication of torque
6 Maximum shear stress induced in the shaft due to application of torque does notexceed its elastic limit
7232019 MOFMOS LABpdf
httpslidepdfcomreaderfullmofmos-labpdf 4147
Department of ANE MOFMOS LAB MANUAL
983089983093
PROCEDURE
1 Select the suitable grips to suit the size of the specimen and clamp it in themachine by adjusting sliding jaw
2 Measure the diameter at about the three places and take average value
3 Choose the appropriate loading range depending upon specimen
4 Set the maximum load pointer to zero
5 Carry out straining by rotating the hand wheel or by switching on the motor
6 Load the members in suitable increments observe and record strain reading
7 Continue till failure of the specimen
8 Calculate the modulus of rigidity C by using the torsion equation
9 Plot the torque ndashtwist graph (T Vs θ)
OBSERVATIONS
Gauge length L =
Polar moment of inertia IP =
Modulus of rigidity C =TL IP θ =
SNo Twisting Moment Angle of Twist Modulus Average
Kgf Nm Degrees Radians of rigidity CNmm2
C
RESULT
7232019 MOFMOS LABpdf
httpslidepdfcomreaderfullmofmos-labpdf 4247
Department of ANE MOFMOS LAB MANUAL
983089983094
TENSILE TEST
AIM
To conduct tensile test on a mild steel specimen and determine the following
1 Limit of proportionality 2 Elastic Limit
3 Upper yield point 4 Lower yield point
5 Ultimate strength 6 Fracture strength
7 Young`s Modulus 8 Percentage elongation
9 Percentage reduction in area 10 Ductility
11 Toughness 12 True stress amp true strain
13 Malleability
APPARATUS tensile testing machine specimen steel rule vernier caliper micrometer
THEORY
The tensile test is most applied one of all mechanical tests In this test a test specimen is fixed
into grips connected to a straining device and to a load-measuring device (One end in stationary
grips and the other in movable grips) If the applied load is small enough the deformation of any
solid body is entirely elastic An elastically deformed solid will return to its original form as soon
as load is removed However if the load is too large the material can be deformed permanently
The initial part of the tension curve which represents the manner in which solid undergoes
plastic deformation is termed as plastic The stress below which the deformation is essentially
entirely elastic is known as the elastic limit of the material In some materials like mild steel a
sudden drop in load indicating both an upper and lower yield point denotes the onset of plastic
deformation However some materials do not exhibit a sharp yield point During plastic
deformation at lager extensions strain hardening cannot compensate for the decrease in section
and thus the load passes through a maximum and then begins to decrease At this stage the
ultimate strength which is defined as the ration of the load on the specimen to the original cross-section area reaches a maximum value Until this point the deformation is uniform at all the
sections of the specimen Further loading will eventually cause bdquoneck ‟ formation and rupture
follows
7232019 MOFMOS LABpdf
httpslidepdfcomreaderfullmofmos-labpdf 4347
Department of ANE MOFMOS LAB
MANUAL
983089983095
Usually a tension test is conducted at room temperature the tensile load is applied
slowly During this test either round or flat specimens may be used The load on the specimen is
applied mechanically or hydraulically depending on the type of testing machine
1 NominalEngg stress and NominalEngg strain
Original CS area = A0 (mm2)
Original gauge length = L0 (mm) Increase in gauge length = δL0
Nominal stress = PA0 (N mm2)
Nominal strain = δL0 L0
2 Limit of Proportionality Stress is proportional to strain up to this pointNormal Stress = PA PO Normal Strain = (δ LO) ALO
3 Elastic limit When the load is removed at ldquoBrdquo the specimen will go back to originalDimensions ie LO and δ AO Nominal stress = PB AO Normal Strain = (δ LO) B LO
If the specimen is loaded beyond elastic limit it will undergo permanent strainie Plastic deformation
4 Upper yield point Nominal stress = PC AO Nominal strain = (δ LO) D LO
5 Lower yield point Nominal stress = PD AO
Nominal strain = (δ LO) D LO 6 Ultimate load or maximum load point
Nominal ultimate stress = PE AO Nominal strain = (δ LO) E LO
7 Fracture Load point F
Nominal fracture stress = PF AO
Nominal strain at fracture = (δ LO) F LO
8 Young`s modulus (E) Young`s modulus (E) = StressStrain
(In the elastic region limit of proportionality = Nominal stress at ANominal strain at A 9Modulus of resilience = (Nominal stress at elastic limit)
2 2E
Area under Engg Stress - Strain diagram up to elastic limit10 Resilience = Modulus of Resilience x Volume of specimen undergoing Tensile stress
7232019 MOFMOS LABpdf
httpslidepdfcomreaderfullmofmos-labpdf 4447
Department of ANE MOFMOS LAB MANUAL
983089983096
11 Yield point ElongationElongation taking place in the specimen from C to D this istaking place without increase in stress
12 Modulus of toughnessArea under engineering stress ndash strain diagram up to fracture13 Toughness = Modulus of toughness x Volume of specimenThis indicates theamount of energy absorbed by the specimen before fracture take place
14 Ductility= (Final length at fracture ndash original length 10) x 100
15 MalleabilityIt is the ability of the material to undergo plastic deformation prior fracture under compressive loading conditions In a tensile test it is approximatedas percentage reduction in cross sectional area of the specimen Malleability =
(AO - Af )AO) x 100
True stress ndash true strain diagram
Engineering stress is calculated based on original cross sectional area (AO) But not on the actual cross sectional area at load bdquoP‟
True stress = PA = PAO x AO A
Since volume remains constant during plastic deformation we have AO LO = AL True stress = PAO x L LO
= PAO x ((LO + δLO) LO)
= P (1+e)= Nominal stress (1+ nominal strain)
True strain = Є = 1n (1+e)
These relations are valid up to ultimate load ie up to which the strain isuniform all along the gauge length
1 True Stress at upper yield point = Nominal stress at upper yield point ( 1+e O)True strain at C = 1n (1+eo)
2 True stress at ultimate load (E1)= Nominal ultimate stress ( 1+eE)True strain at ultimate load = 1n (1+eE)
3 True stress at fracture (E1) = Pf Af
Where Af is the area of cross section at fracture can be measured True
strain at fracture = 1n (Ao Af )
Area relation is taken instead of lengths because the strains are localized in theregion between ultimate load point and fracture point
4 Strain Hardening
From lower yield point onwards increase in load is required for increase instrain Thus the stress required for further deformation is more Thisphenomenon is called strain hardening
5 True ndash stress ndash true strain curve in log ndash log co ndash ordinates
When the true ndash stress and true ndash strain are plotted on log ndash log co ndash ordinates thecurve is a straight line
7232019 MOFMOS LABpdf
httpslidepdfcomreaderfullmofmos-labpdf 4547
Department of ANE MOFMOS LAB MANUAL
983120983137983143983141 983089983097 983151983142 983090983089
6 Ductile and Brittle Materials
If a material fails without much plastic deformation it can be called brittle If the percentageelongation at fracture is less than 25 the material is classified as brittle
bull Usually the metals with FCC and CPH structures are highly ductile
PROCEDURE
1 Measure the original gauge length and diameter of the specimen
2 Insert the specimen into grips of the test machine
3 Begin the load application and record load vs elongation data
4 Take the readings more frequently as yield point is approached
5 Measure elongation values
6 Continue the test till fracture occurs
7 By joining the two broken halves of the specimen together measure the final length anddiameter of specimen at fracture
RESULTS AND DISCUSSIONS
1 Plot the Engg Stress strain curve and determine the following
bull Limit of proportionality = (Nmm2)
bull Yield strength = (Nmm2)
bull Ultimate strength = (Nmm2)
bull Young`s modulus = (Nmm2)
bull Percentage elongation = bull Percentage reduction in area =
bull Fracture strength = (Nominal Engg)
bull Toughness = Area under stress ndash strain curve up to
fracture
bull Malleability
2 Plot True Stress True strain curve after calculating true ndash stress and true strain values at various
points
Estimate1) Strength coefficient
2) Strain hardening coefficient
3) Determine whether the material is ductile or brittle4) Comment on the results
7232019 MOFMOS LABpdf
httpslidepdfcomreaderfullmofmos-labpdf 4647
Department of ANE MOFMOS LAB MANUAL
983120983137983143983141 983090983088 983151983142 983090983089
SNo Load Deformation Stress Strain E
Calculation part-
7232019 MOFMOS LABpdf
httpslidepdfcomreaderfullmofmos-labpdf 4747
Department of ANE MOFMOS LAB MANUAL
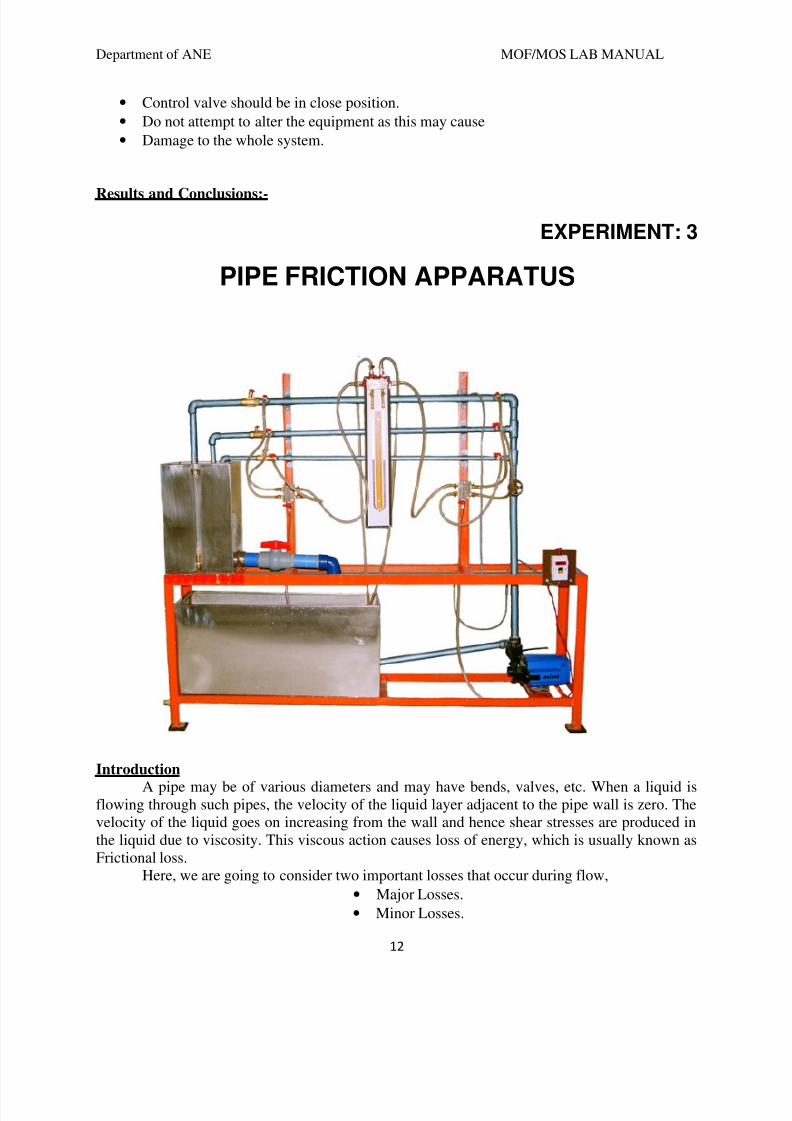
7232019 MOFMOS LABpdf
httpslidepdfcomreaderfullmofmos-labpdf 1347
Department of ANE MOFMOS LAB MANUAL
12
bull Control valve should be in close position
bull Do not attempt to alter the equipment as this may cause
bull Damage to the whole system
Results and Conclusions-
EXPERIMENT 3
PIPE FRICTION APPARATUS
Introduction
A pipe may be of various diameters and may have bends valves etc When a liquid isflowing through such pipes the velocity of the liquid layer adjacent to the pipe wall is zero Thevelocity of the liquid goes on increasing from the wall and hence shear stresses are produced inthe liquid due to viscosity This viscous action causes loss of energy which is usually known asFrictional loss
Here we are going to consider two important losses that occur during flow
bull
Major Losses
bull
Minor Losses
7232019 MOFMOS LABpdf
httpslidepdfcomreaderfullmofmos-labpdf 1447
Department of ANE MOFMOS LAB MANUAL
13
bull Major losses occur due to friction This friction may be due to viscosity or roughness in
the pipe
bull
Minor losses can be due to various reasons such as Inlet and Outlet of the pipe bendsgates sudden expansions and contractions The apparatus is designed to study the friction
losses that appear in long pipes and the obstructions that are encountered in the way offlow by various types of fittings
General DescriptionThe unit consists mainly of 1) Piping System 2) Measuring Tank 3) Differential Manometer 4)Supply pump set 5) Sump
bull Constructional Specification
bull Piping System Piping System of size 127 mm 20 mm and 20 mm (SS) dia With
tapings at 1 meter distance and a flow control valve
bull
Measuring Tank Measuring tank is provided to measure the discharge of water fromthe unit
bull Differential Manometer Differential manometer with 1 mm scale graduations to
measure the loss of head in the pipe line
bull Supply Pump Set Supply pump set is rigidly fixed on the sump The pump set is mono
block pump with 05 HP motor operating on single phase 220 volts 50 Hz AC supply
bull Sump Sump is provided to store sufficient waters for independent circulation through
the unit for experimentation and arranged within the floor space of the main unit
Before Commissioning
bull
Check whether all the joints are leak proof and watertight
bull
Close all the cocks on the pressure feed pipes and Manometer to prevent damage andoverloading of the manometer
bull Check the gauge glass and meter scale assembly of the measuring tank and see that it is
fixed water tight and vertical
bull
Check proper electrical connections to the switch which is internally connected to themotor
Experiments
bull
The apparatus is primarily designed for conducting experiments on the frictional losses inpipes of different sizes Three different sizes of pipes are provided for wide range ofexperiments Each individual pipe can be connected to the Manometer through thepressure feed pipes having individual quick operating cocks
bull
While taking reading close all the cocks in the pressure feed pipe except the two (upstream and downstream) cocks which directly connect the manometer to the requiredpipe for which the loss in head has to be determined (Make sure while taking readings
7232019 MOFMOS LABpdf
httpslidepdfcomreaderfullmofmos-labpdf 1547
Department of ANE MOFMOS LAB MANUAL
14
that the manometer is properly primed Priming is the operating of filling the Manometerupper part and the connecting pipes with water venting the air from the pipes)
bull First open the inlet gate valve of the apparatus Adjust the control valve kept at the exit
end of the apparatus to a desired flow rate and maintain the flow steadily
bull
The actual discharge is measured with the help of the measuring tank For each size ofthe pipe the area of cross section of flow can be calculated from the known diameter ofthe pipes From these two valves and the average velocity of stream through the pipe canbe calculated
bull The actual loss of head is determined from the Manometer readings The frictional loss of
head in pipes is given by the Darcys formulaThe friction coefficient indicates f
7232019 MOFMOS LABpdf
httpslidepdfcomreaderfullmofmos-labpdf 1647
Department of ANE MOFMOS LAB MANUAL
15
FRICTION FACTOR FOR A GIVEN PIPE LINE
Aim - To calculate the friction factor for a given pipe line
Apparatus - experimental set-up stop watch
Procedure-
1 Start the motor keeping the delivery valve close2
The water is allowed to flow through the selected pipe by selecting the appropriateball valve
3 By regulating the valve control the flow rate and select the corresponding pressuretapings
4
Make sure while taking readings that the manometer is properly primed Priming isthe operating of filling the Manometer upper part and the connecting pipes with waterventing the air from the pipes Note down the loss of head ldquohfrdquo from the manometerscale
5
Note down the time required for the rise of 10cm (ie 01m) water in the collectingtank by using stop watch Calculate discharge using below formula
Discharge - The time taken to collect some lsquoxrsquo cm of water in the collecting tank in msup3sec
A x RQ =
t
A = area of the collecting tank in msup2 (03m X 03m)R = rise of water level taken in meters (say 01m or 10cm)t = time taken for rise of water level to rise lsquorrsquo in lsquotrsquo seconds
6 Calculate the velocity of the jet by following formula
V = Discharge = Q A msecArea of the pipe
A = cross sectional area of the pipe=Πdsup2 4d = pipe diameter
7 Calculate the coefficient of friction for the given pipe by fLvsup2
hf = ---------ρgd
Wherehf - Loss of head of water = (h1-h2)(Sn So ndash 1) = (h1-h2) 1261000 m
f - Co-efficient of friction for the pipeL - Discharge between sections for which loss of head is measured (1 meter)v - Average velocity of flow in msecg - Acceleration due to gravity 981msecd - Pipe diameter in meters
8 Repeat the steps 2 to 7 for different sets of readings by regulating the discharge valve
7232019 MOFMOS LABpdf
httpslidepdfcomreaderfullmofmos-labpdf 1747
Department of ANE MOFMOS LAB MANUAL
16
Tabular Form
S No Oslash of pipeArea(a)
Time forrise of 10cm water
Discharge VelocityLoss ofHead
hf
Co-efficientof friction
f
Calculation-
bull Total Head H
H = (h1 + h2) x 126 m of waterWhere
126 = conversion factor from mercury to water head
bull
Discharge Q
WhereA = Area of collecting tank = 0125 msup2R = Rise in water level of the collecting tank cm
t = time for lsquoRrsquo cm rise of water sec100 = Conversion from cm to m
bull
Velocity V
msWhere Arsquo = area of the pipefitting in use
7232019 MOFMOS LABpdf
httpslidepdfcomreaderfullmofmos-labpdf 1847
Department of ANE MOFMOS LAB MANUAL
17
bull
Friction Factor(Major Losses) F
Where H = total head m of waterV = velocity mg = acceleration due to gravity 981mssup2L = Distance bw tapping = 15m
bull
Head Loss Due To Fittings (Minor Losses) K
Where H = total head m of waterV = velocity mg = acceleration due to gravity 981mssup2
Precautions
1) Do not run the pump dry2)
Clean the tanks regularly say for every 15days3)
Do not run the equipment if the voltage is below 180V4) Check all the electrical connections before running5) Before starting and after finishing the experiment the main control valve should be in
close position6) Do not attempt to alter the equipment as this may cause damage to the whole system
Results and Conclusions
7232019 MOFMOS LABpdf
httpslidepdfcomreaderfullmofmos-labpdf 1947
Department of ANE MOFMOS LAB MANUAL
18
EXPERIMENT 4
BERNOULLIrsquoS EXPERIMENTIntroduction
Bernoullirsquos Theorem gives the relationship between pressure head velocity head and thedatum Here the attempt has been made to study the relationship of the above said parametersusing venturimeter
General Description
bull The apparatus consists of a specially fabricated clear ACRYLIC Venturimeter
with necessary tappings connected to a Multibank Piezometer also made of clearACRYLIC
bull
The apparatus consists of two overhead tanks interconnected with the venturimeterwhich is placed in between the tanks
bull The overhead tanks are provided with the Head variation mechanism for conducting
the experiments at various heads
bull
Water in the sump tank is pumped using a Monobloc Centrifugal pump (Kirloskarmake) which passes through the control valve to the overhead tank
bull The height of the water in the collecting tank is measured using the acrylic
Piezometer to find the flowrate
bull The whole arrangement is mounted on an aesthetically designed sturdy frame
made of MS tubes and NOVAPAN Board with all the provisions for holding thetanks and accessories
Aim
o
The experiment is conducted too
Study of Pressure Gradient at different zoneso
Verification of Bernoullis Equationo
Comparative analysis under different flow rates
Apparatus
1) Venturimeter 2)Piezometer 3) Overhead Tank 4)Sump Tank 5) Centrifugal Pump
Procedure
1) Fill in the sump tank with clean water2)
Keep the delivery valve closed3)
Check and give necessary electrical connections to the system4) Switch on the pump amp Slowly open the delivery valve5)
Adjust the flow through the control valve of the pump6)
Allow the system to attain the steady state ie let the water pass from the secondoverhead tank to the collecting tank
7) Note down the Pressure head at different points of the venture meter on the multi-tubepiezometer (Expel if any air is the by inserting the thin pin into the piezometer openings)
8) Close the ball valve of the collecting tank and measure the time for the known rise ofwater
7232019 MOFMOS LABpdf
httpslidepdfcomreaderfullmofmos-labpdf 2047
Department of ANE MOFMOS LAB MANUAL
1983097
9) Change the flow rate and repeat the experiment
Observation
SlNo
Static Head Loss h Time for lsquoRrsquo
cm rise in waterlsquoTrsquo sec1 2 3 4 5 6 7 8 9 10
1
2
3
4
5
Calculations1
Discharge QA2
Where
A = Area of collecting tank = 0045 msup2R = Rise in water level of the collecting tank cmt = time for lsquoRrsquo cm rise of water sec100 = Conversion from cm to m
3 Pressure Head
Where
ρ = density of waterg = gravitational constanth = head measured m of water column
3 Velocity Head
WhereV = Q a a = Area at the particular section of the venturimeter msup2
4 Verification of BERNOULLIrsquoS EQUATIONBernoullirsquos Equation is given as
After findinga Pressure Head hb
Velocity headat different cross-section of the Venturimeter
7232019 MOFMOS LABpdf
httpslidepdfcomreaderfullmofmos-labpdf 2147
Department of ANE MOFMOS LAB MANUAL
20
Put the same in the above equation for different points and verify whether all the values obtainedare sameNote Consider the datum z to be constant
Precautions
bull
Do not run the pump drybull
Clean the tanks regularly say for every 15days
bull
Do not run the equipment if the voltage is below 180V
bull
Check all the electrical connections before running
bull Before starting and after finishing the experiment the main
bull Control valve should be in close position
bull Do not attempt to alter the equipment as this may cause
bull
Damage to the whole system
Result and Conclusion
7232019 MOFMOS LABpdf
httpslidepdfcomreaderfullmofmos-labpdf 2247
Department of ANE MOFMOS LAB MANUAL
21
EXPERIMENT 5
CALIBRATION OF A TRIANGULAR NOTCH
AIM -To find the coefficient of discharge of given triangular notch
THEORY-A notch is a device used for measuring the rate of flow of liquid through a smallchannel or a tank It may be defined as an opening in the side of a tank or small channel in suchthat a way that the liquid surfaces in the tank or channel is below the top edge of the opening
NOTCHES ARE CLASSIFIED AS-1 Rectangular notch2 Triangular notch3 Trapezoidal notch
4 Stepped notch
A triangular notch is preferred to a rectangular notch due to the following reasonsThe expression for discharge of triangular notch is compared to rectangular notch is simple Formeasuring low discharge a triangular notch gives more accurate results than a rectangular notchIn the case of triangular notch only H is required for the computation of dischargeA trapezoidal notch is a combination of rectangular and triangular notch and thus the dischargethrough trapezoidal notch is the sum of above notchesA stepped notch is a combination of rectangular notch and triangular notch The dischargethrough the stepped notch is equal to sum of discharges through the different rectangularnotches
DESCRIPTION- The apparatus consists of1) Measuring tank 2) Sump tank3) Supply pump set 4) Inlet and out let valve
Measuring tank Stainless steel tank of size 030305mm height with the gage glass a scalearrangement for quick and easy measurements A ball valve is provided to empty the tank and adrain is provided at the bottom of the tank to drain the waste water when the unit is not in useWater for independent circulation through the unit for experimentation and arranged within thefloor space of the main unitSump tank The sump tank is a size of 020303m stainless steel tank to store sufficient waterfor independent circulation through the unit for experimentation and arranged within the floorspace of the main unit about 060305m with a gauge glass and scale arrangement A ballvalve is provided to empty the tankSupply Pump set The pump is 2525mm size mono block with frac12 HP 2880 RPM singlephase 220volts AC supply Inlet and out let valve- These valves are used to control the flow ofwater at inlet and out let
PROCEDURE1 Allow the water to drain up to triangular notch
7232019 MOFMOS LABpdf
httpslidepdfcomreaderfullmofmos-labpdf 2347
Department of ANE MOFMOS LAB MANUAL
22
2 Note down the depth of the water when the water is coinciding with the v notch point
3 Collect water in collecting tank and close the drain valve and find the time taken for the rise ofwater up to 20cm
4 Calculate the discharge by using the above results
5 Now substituting the values in the formula for calculation of discharge for v- notch gives therequired result
Precautionsbull Do not run the pump dry
bull Clean the tanks regularly say for every 15days
bull Do not run the equipment if the voltage is below 180V
bull Check all the electrical connections before running
bull
Before starting and after finishing the experiment the main
bull
Control valve should be in close position
bull
Do not attempt to alter the equipment as this may cause
7232019 MOFMOS LABpdf
httpslidepdfcomreaderfullmofmos-labpdf 2447
Department of ANE MOFMOS LAB MANUAL
23
bull Damage to the whole system
Result and Conclusion
7232019 MOFMOS LABpdf
httpslidepdfcomreaderfullmofmos-labpdf 2547
Department of ANE MOFMOS LAB MANUAL
24
MECHANICSOF SOLIDS
LAB
7232019 MOFMOS LABpdf
httpslidepdfcomreaderfullmofmos-labpdf 2647
Department of ANE MOFMOS LAB MANUAL
25
7232019 MOFMOS LABpdf
httpslidepdfcomreaderfullmofmos-labpdf 2747
Department of ANE MOFMOS LAB MANUAL
983089
IZOD IMPACT TEST
AIM To perform the izod impact test on materials
APPARATUS Izod impact test machine test specimen vernier calipers steel rule
IMPACT STRENGTH The resistance of a material to fracture under sudden load application
MATERIALS Two types of test pieces are used for this test as given
1) Square cross-section
2) Round cross-section
THEORY The type of test specimen used for this test is a Square Cross-section
The specimen may have single two or three notches The testing machine shouldhave the following specifications The angle between top face of grips and face holding the specimen Vertical=900 the angle of tip of hammer =750plusmn10
The angle between normal to the specimen and underside face of the hammer at Striking point=100plusmn10
Speed of hammer at impact=399msecStriking energy=168N-m or Joules Angle
Of drop of pendulum =900 Effective
weight of pendulum=2179kg
Minimum value of scale graduation=2 Joules
Permissible total friction loss of corresponding energy=050
Distance from the axis of rotation of distance between the base of specimen notch andthe point of specimen hit by the hammer=22mmplusmn05mm
The longitudinal axes of the test piece shall lie in the plane of swing of the center ofgravity of the hammer The notch shall be positioned so that its in the plane of thehammer the notch shall be positioned its plane of symmetry coincides with the top faceof the grips for setting the specimen the notch impact strength I is calculated accordingto the following relation
Where I= impact strength in joulesm2
7232019 MOFMOS LABpdf
httpslidepdfcomreaderfullmofmos-labpdf 2847
Department of ANE MOFMOS LAB MANUAL
983090
PROCEDURE
1 For conducting Izod test a proper striker is to be fitted firmly to the bottom of thehammer with the help of the clamming piece
2 The latching take for izod test is to be firmly fitted to the bearing housing at the side of
the columns3 The frictional loss of the machine can be determined by free fall test raise the
hammer by hands and latch in release the hammer by operating lever the pointer will
then indicate the energy loss due to friction From this reading confirm that the friction
loss is not exceeding 05 of the initial potential energy Otherwise frictional loss has to
be added to the final reading
4 The specimen for izod test is firmly fitted in the specimen support with the help ofclamping screw and eacutelan key Care should be taken that the notch on the specimenshould face to pendulum striker
5 After ascertaining that there is no person in the range of swinging pendulum release the
pendulum to smash the specimen6 Carefully operate the pendulum brake when returning after one swing to stop the oscillations
7 Read-off position of reading pointer on dial and note indicated value
8 Remove the broken specimen by loosening the clamping screw
The notch impact strength depends largely on the shape of the specimen and the notch the
values determined with other specimens therefore may not be compared with each other
OBSERVATION TABLE
S No A(Area of cross K Impact energy I Impact Strength
section of observed
specimen)
RESULT
7232019 MOFMOS LABpdf
httpslidepdfcomreaderfullmofmos-labpdf 2947
Department of ANE MOFMOS LAB MANUAL
983091
Calculation Part
7232019 MOFMOS LABpdf
httpslidepdfcomreaderfullmofmos-labpdf 3047
Department of ANE MOFMOS LAB MANUAL
983092
ROCKWELL HARDNESS TEST
AIM To determine the Rockwell hardness of the given test specimen
APPARATUS Rockwell hardness testing machine test specimen
THEORY
Hardness-the resistance of a metal to plastic deformationagainst indentation scratching abrasion or cutting
The depth of penetration of the indenter measures the hardness of a material by this Rockwell ‟s hardness test method the depth of penetration is inversely
proportional to the hardness Both ball or diamond cone types of indenters are used inthis testThere are three scales on the machine for taking hardness readings
Scale bdquoA‟ with load 60kgf or 5888N and diamond indenter is used for performing tests on steel and shallow case hardened steel
Scale bdquoB‟ with load 100kgf or 9807 N and 1588mm dia ball indenter is used forperforming tests on soft steel malleable iron copper and aluminum alloys
Scale bdquoC‟ with load 150kgf or 1471 N and diamond indenter is used for performing testson steel hard cost steel deep case hardened steel other metals which harder
First minor load is applied to overcome the film thickness on the metal surfaceMinor load also eliminates errors in the depth of measurement due to spring of themachine frame or setting down of the specimen and table attachments
The Rockwell hardness is derived from the measurement of the depth of theimpression This method of test is suitable for finished or machined parts of simpleshapes
PROCEDURE
1 Select the load by rotating the nob and fix the suitable indenter
2 Clean the test piece and place on the special anvil or worktable of the machine
3 Turn the capstan wheel to evaluate the test specimen into contact with the indenterpoint
4 Further turn the wheel for three rotations forcing the test specimen against theindenter This will ensure the minor load has been applied5 Set the pointer on the scale dial at the appropriate position
7232019 MOFMOS LABpdf
httpslidepdfcomreaderfullmofmos-labpdf 3147
Department of ANE MOFMOS LAB MANUAL
983093
6 Push the lever to apply the major load A dash pot provided in the loading mechanismto ensure that the load is applied gradually
7 As soon as the pointer comes to rest pull the handle in the reverse direction slowlyThis releases the major but not the minor load The pointer will now rotate in the reversedirection
8 The Rockwell hardness can read off the scale dial on the appropriate scale after thepointer comes to rest
OBSERVATIONS
Material of the specimen =
Thickness of test specimen =
Hardness scale used =
Test Material Rockwell Scale of weights Rockwell number Average
no Rockwell
no
Scale weight indent 1 2 3
PRECAUTIONS
1 For testing cylindrical test specimens use V-type platform
2 Calibrate the machine occasionally by using standard test blocks
3 For thin metal prices place another sufficiently thick metal piece between the testspecimen and the platform to avoid any damage which may likely occur to the platform
4 After applying major load wait for some time to allow the needle to come to restThe waiting time may vary from 2 to 8 seconds
7232019 MOFMOS LABpdf
httpslidepdfcomreaderfullmofmos-labpdf 3247
Department of ANE MOFMOS LAB
MANUAL
983094
5 The surface of the test piece should be smooth and even and free from oxidescale and foreign matter6 Test specimen should not be subjected to any heating of cold working
7 The distance between the centers of two adjacent indentation should be at least 4
Times the diameter of the indentation and the distance from the center of any indentation tothe edge of the test piece should be at least 25 times the diameter of the indentation
RESULT
7232019 MOFMOS LABpdf
httpslidepdfcomreaderfullmofmos-labpdf 3347
Department of ANE MOFMOS LAB MANUAL
983095
Calculation Part
7232019 MOFMOS LABpdf
httpslidepdfcomreaderfullmofmos-labpdf 3447
Department of ANE MOFMOS LAB MANUAL
983096
BRINELLrsquoS HARDNESS TEST
AIM To determine the Brinell hardness of the given test specimen
APPARATUS Brinell hardness machine test specimen Brinells Microscope
THEORY
Indentation Hardness-A number related to the area or to the depth of
the impression made by an indenter or fixed geometry under a known fixed load
This method consists of indenting the surface of the metal by a hardened steel
ball of specified diameter D mm under a given load F kgf and measuring the average
diameter d mm of the impression with the help of Brinell microscope fitted with a scaleThe Brinell hardness HB is defined as the quotient of the applied force F divided by the
spherical area of the impression
HB= Test load in kgfsurface area of indentation
=2F πD (D- D2- d2) kgmm2
PROCEDURE
1 Select the proper size of the ball and load to suit the material under test2 Clean the test specimen to be free from any dirt and defects or blemishes
3 Mount the test piece surface at right angles to the axis of the ball indenter plunger
4 Turn the platform so that the ball is lifted up
5 By shifting the lever applies the load and waits for some time
6 Release the load by shifting the lever
7 Take out the specimen and measure the diameter of indentation by means of theBrinell microscope8 Repeat the experiments at other positions of the test piece
9 Calculate the value of HB
7232019 MOFMOS LABpdf
httpslidepdfcomreaderfullmofmos-labpdf 3547
Department of ANE MOFMOS LAB MANUAL
983097
OBSERVATIONS
Test piece material = Diameter of the ballrdquo D ldquo =
Load section FD2 = Test load =
Load application time =
Least count of Brinell Microscope =
Diameter Average
Impression F D HB
S No in kg in mm Kgmm2
(d1) (d2) (d1+d2)2
PRECAUTIONS
1 The surface of the test piece should be clean
2 The testing machine should be protected throughout the test from shock or vibration
3 The test should be carried out at room temperature
4 The distance of the center of indentation from the edge of test piece should be at
least 25 times the diameter of the indentation and the distance between the center ofthe two adjacent indentations should be at least 4 times the diameter of the indentation
5 The diameter of each indentation should be measured in two directions at rightangles and the mean value readings used the purpose of determining the hardnessnumber
7232019 MOFMOS LABpdf
httpslidepdfcomreaderfullmofmos-labpdf 3647
Department of ANE
MOFMOS LAB MANUAL
983089983088
RESULT
Calculation Part
7232019 MOFMOS LABpdf
httpslidepdfcomreaderfullmofmos-labpdf 3747
Department of ANE MOFMOS LAB MANUAL
983089983089
SPRING TEST
AIM To determine the rigidity modulus of the spring
APPARATUS Spring testing machine vernier calipers spring specimen
THEORY
Closed coiled helical springs are the springs in which helix angle is very small or inother words the pitch between two adjacent turns is small A closed coiled helical springcarrying an axial load is shown in fig
As helix angle in case of close coiled helical springs are small hence the bendingeffect on the spring is ignored and we assume that the coils of close coiled helical
springs are to stand purely tensional stresses Let d=diameter ofthe spring wire
P= pitch of the helical spring N= number ofcoils R= mean radius of the spring coil
W=axial load on spring C=modulus of rigidity
τ=maximum shear stress induced in the wire θ=angle of twist in the
spring wire and
x= deflection of spring due to axial load l= length of wire
Net twisting moment on the wire T=WR
But twisting moment is also given by T= (π 16) τd3
From 1 ad 2 WR = (π 16) τd3 τ=16WR πd
3
above equation which gives the maximum shear stress induced in the wire (1) Length of one coil=2πR
Total length of the wire=2πRn (2)
Strain energy stored by the spring due to torsion
U= (τ 4C) [(π 4)d 2πRn] (3)
Work done on the spring =average load x deflection
= (12) Wx (4)
Equating 3 and 4
(12) Wx = (32W2R3n)Cd4
7232019 MOFMOS LABpdf
httpslidepdfcomreaderfullmofmos-labpdf 3847
Department of ANE MOFMOS LAB MANUAL
983089983090
x=64WR3nCd
4
Rigidity modulus of the spring
C=64WR3nxd
4
PROCEDURE
1) Consider the spring and find out itsmean coil radius R with the help ofvernier calipers
2) Find the diameter of the spring andnumber of turns
3) Fix the spring between two hooks
4) Now load is gradually applied
5) Note the deflection from thedeflection scale for different loadsapplied
6) Calculate the rigidity modulus usingabove formula
PRECAUTIONS
1) Dimensions should be measureaccurately with the help of verniercalipers
2) Deflection from the scale should benoted carefully and accurately
OBSERVATION TABLE
Sno Load applied deflection Rigidity modulus
C
Average rigidity modulus C =
RESULT
7232019 MOFMOS LABpdf
httpslidepdfcomreaderfullmofmos-labpdf 3947
Department of ANE MOFMOS LAB MANUAL
983089983091
Calculation Part
7232019 MOFMOS LABpdf
httpslidepdfcomreaderfullmofmos-labpdf 4047
Department of ANE MOFMOS LAB MANUAL
983089983092
TORSION
AIM To conduct torsion test on mild steel or cast iron specimen to find modulus of rigidity or to find angle of twist of the materials which are subjected to torsion
APPARATUS 1 A torsion test machine along with angle of twist measuring attachment
2 Standard specimen of mild steel or cast iron
3 Steel rule
4 Vernnier caliper or a micrometer
THEORY
For transmitting power through a rotating shaft it is necessary to apply a turning
force The force is applied tangentially and in the plane of transverse cross section The
torque or twisting moment may be calculated by multiplying two opposite turningmoments It is said to be in pure torsion and it will exhibit the tendency of shearing off at
every cross section which is perpendicular to the longitudinal axis
Torsion equation
Torsion equation is given by below
T IP = CθL = TR
T= maximum twisting torque (Nmm) IP =
polar moment of inertia (mm4) τ =shear
stress (Nmm2) C=modulus of rigidity (Nmm2)
θ=angle of twist in radians L=length of shaft under torsion (mm)
Assumptions made for getting torsion equation
1 The material of the shaft is uniform through out
2 The shaft circular in section remain circular after loading
3 Plane sections of shaft normal to its axis before loading remain plane after thetorque have been applied
4 The twist along the length of the shaft is uniform throughout
5 The distance between any two normal-sections remains the same after theapplication of torque
6 Maximum shear stress induced in the shaft due to application of torque does notexceed its elastic limit
7232019 MOFMOS LABpdf
httpslidepdfcomreaderfullmofmos-labpdf 4147
Department of ANE MOFMOS LAB MANUAL
983089983093
PROCEDURE
1 Select the suitable grips to suit the size of the specimen and clamp it in themachine by adjusting sliding jaw
2 Measure the diameter at about the three places and take average value
3 Choose the appropriate loading range depending upon specimen
4 Set the maximum load pointer to zero
5 Carry out straining by rotating the hand wheel or by switching on the motor
6 Load the members in suitable increments observe and record strain reading
7 Continue till failure of the specimen
8 Calculate the modulus of rigidity C by using the torsion equation
9 Plot the torque ndashtwist graph (T Vs θ)
OBSERVATIONS
Gauge length L =
Polar moment of inertia IP =
Modulus of rigidity C =TL IP θ =
SNo Twisting Moment Angle of Twist Modulus Average
Kgf Nm Degrees Radians of rigidity CNmm2
C
RESULT
7232019 MOFMOS LABpdf
httpslidepdfcomreaderfullmofmos-labpdf 4247
Department of ANE MOFMOS LAB MANUAL
983089983094
TENSILE TEST
AIM
To conduct tensile test on a mild steel specimen and determine the following
1 Limit of proportionality 2 Elastic Limit
3 Upper yield point 4 Lower yield point
5 Ultimate strength 6 Fracture strength
7 Young`s Modulus 8 Percentage elongation
9 Percentage reduction in area 10 Ductility
11 Toughness 12 True stress amp true strain
13 Malleability
APPARATUS tensile testing machine specimen steel rule vernier caliper micrometer
THEORY
The tensile test is most applied one of all mechanical tests In this test a test specimen is fixed
into grips connected to a straining device and to a load-measuring device (One end in stationary
grips and the other in movable grips) If the applied load is small enough the deformation of any
solid body is entirely elastic An elastically deformed solid will return to its original form as soon
as load is removed However if the load is too large the material can be deformed permanently
The initial part of the tension curve which represents the manner in which solid undergoes
plastic deformation is termed as plastic The stress below which the deformation is essentially
entirely elastic is known as the elastic limit of the material In some materials like mild steel a
sudden drop in load indicating both an upper and lower yield point denotes the onset of plastic
deformation However some materials do not exhibit a sharp yield point During plastic
deformation at lager extensions strain hardening cannot compensate for the decrease in section
and thus the load passes through a maximum and then begins to decrease At this stage the
ultimate strength which is defined as the ration of the load on the specimen to the original cross-section area reaches a maximum value Until this point the deformation is uniform at all the
sections of the specimen Further loading will eventually cause bdquoneck ‟ formation and rupture
follows
7232019 MOFMOS LABpdf
httpslidepdfcomreaderfullmofmos-labpdf 4347
Department of ANE MOFMOS LAB
MANUAL
983089983095
Usually a tension test is conducted at room temperature the tensile load is applied
slowly During this test either round or flat specimens may be used The load on the specimen is
applied mechanically or hydraulically depending on the type of testing machine
1 NominalEngg stress and NominalEngg strain
Original CS area = A0 (mm2)
Original gauge length = L0 (mm) Increase in gauge length = δL0
Nominal stress = PA0 (N mm2)
Nominal strain = δL0 L0
2 Limit of Proportionality Stress is proportional to strain up to this pointNormal Stress = PA PO Normal Strain = (δ LO) ALO
3 Elastic limit When the load is removed at ldquoBrdquo the specimen will go back to originalDimensions ie LO and δ AO Nominal stress = PB AO Normal Strain = (δ LO) B LO
If the specimen is loaded beyond elastic limit it will undergo permanent strainie Plastic deformation
4 Upper yield point Nominal stress = PC AO Nominal strain = (δ LO) D LO
5 Lower yield point Nominal stress = PD AO
Nominal strain = (δ LO) D LO 6 Ultimate load or maximum load point
Nominal ultimate stress = PE AO Nominal strain = (δ LO) E LO
7 Fracture Load point F
Nominal fracture stress = PF AO
Nominal strain at fracture = (δ LO) F LO
8 Young`s modulus (E) Young`s modulus (E) = StressStrain
(In the elastic region limit of proportionality = Nominal stress at ANominal strain at A 9Modulus of resilience = (Nominal stress at elastic limit)
2 2E
Area under Engg Stress - Strain diagram up to elastic limit10 Resilience = Modulus of Resilience x Volume of specimen undergoing Tensile stress
7232019 MOFMOS LABpdf
httpslidepdfcomreaderfullmofmos-labpdf 4447
Department of ANE MOFMOS LAB MANUAL
983089983096
11 Yield point ElongationElongation taking place in the specimen from C to D this istaking place without increase in stress
12 Modulus of toughnessArea under engineering stress ndash strain diagram up to fracture13 Toughness = Modulus of toughness x Volume of specimenThis indicates theamount of energy absorbed by the specimen before fracture take place
14 Ductility= (Final length at fracture ndash original length 10) x 100
15 MalleabilityIt is the ability of the material to undergo plastic deformation prior fracture under compressive loading conditions In a tensile test it is approximatedas percentage reduction in cross sectional area of the specimen Malleability =
(AO - Af )AO) x 100
True stress ndash true strain diagram
Engineering stress is calculated based on original cross sectional area (AO) But not on the actual cross sectional area at load bdquoP‟
True stress = PA = PAO x AO A
Since volume remains constant during plastic deformation we have AO LO = AL True stress = PAO x L LO
= PAO x ((LO + δLO) LO)
= P (1+e)= Nominal stress (1+ nominal strain)
True strain = Є = 1n (1+e)
These relations are valid up to ultimate load ie up to which the strain isuniform all along the gauge length
1 True Stress at upper yield point = Nominal stress at upper yield point ( 1+e O)True strain at C = 1n (1+eo)
2 True stress at ultimate load (E1)= Nominal ultimate stress ( 1+eE)True strain at ultimate load = 1n (1+eE)
3 True stress at fracture (E1) = Pf Af
Where Af is the area of cross section at fracture can be measured True
strain at fracture = 1n (Ao Af )
Area relation is taken instead of lengths because the strains are localized in theregion between ultimate load point and fracture point
4 Strain Hardening
From lower yield point onwards increase in load is required for increase instrain Thus the stress required for further deformation is more Thisphenomenon is called strain hardening
5 True ndash stress ndash true strain curve in log ndash log co ndash ordinates
When the true ndash stress and true ndash strain are plotted on log ndash log co ndash ordinates thecurve is a straight line
7232019 MOFMOS LABpdf
httpslidepdfcomreaderfullmofmos-labpdf 4547
Department of ANE MOFMOS LAB MANUAL
983120983137983143983141 983089983097 983151983142 983090983089
6 Ductile and Brittle Materials
If a material fails without much plastic deformation it can be called brittle If the percentageelongation at fracture is less than 25 the material is classified as brittle
bull Usually the metals with FCC and CPH structures are highly ductile
PROCEDURE
1 Measure the original gauge length and diameter of the specimen
2 Insert the specimen into grips of the test machine
3 Begin the load application and record load vs elongation data
4 Take the readings more frequently as yield point is approached
5 Measure elongation values
6 Continue the test till fracture occurs
7 By joining the two broken halves of the specimen together measure the final length anddiameter of specimen at fracture
RESULTS AND DISCUSSIONS
1 Plot the Engg Stress strain curve and determine the following
bull Limit of proportionality = (Nmm2)
bull Yield strength = (Nmm2)
bull Ultimate strength = (Nmm2)
bull Young`s modulus = (Nmm2)
bull Percentage elongation = bull Percentage reduction in area =
bull Fracture strength = (Nominal Engg)
bull Toughness = Area under stress ndash strain curve up to
fracture
bull Malleability
2 Plot True Stress True strain curve after calculating true ndash stress and true strain values at various
points
Estimate1) Strength coefficient
2) Strain hardening coefficient
3) Determine whether the material is ductile or brittle4) Comment on the results
7232019 MOFMOS LABpdf
httpslidepdfcomreaderfullmofmos-labpdf 4647
Department of ANE MOFMOS LAB MANUAL
983120983137983143983141 983090983088 983151983142 983090983089
SNo Load Deformation Stress Strain E
Calculation part-
7232019 MOFMOS LABpdf
httpslidepdfcomreaderfullmofmos-labpdf 4747
Department of ANE MOFMOS LAB MANUAL
7232019 MOFMOS LABpdf
httpslidepdfcomreaderfullmofmos-labpdf 1447
Department of ANE MOFMOS LAB MANUAL
13
bull Major losses occur due to friction This friction may be due to viscosity or roughness in
the pipe
bull
Minor losses can be due to various reasons such as Inlet and Outlet of the pipe bendsgates sudden expansions and contractions The apparatus is designed to study the friction
losses that appear in long pipes and the obstructions that are encountered in the way offlow by various types of fittings
General DescriptionThe unit consists mainly of 1) Piping System 2) Measuring Tank 3) Differential Manometer 4)Supply pump set 5) Sump
bull Constructional Specification
bull Piping System Piping System of size 127 mm 20 mm and 20 mm (SS) dia With
tapings at 1 meter distance and a flow control valve
bull
Measuring Tank Measuring tank is provided to measure the discharge of water fromthe unit
bull Differential Manometer Differential manometer with 1 mm scale graduations to
measure the loss of head in the pipe line
bull Supply Pump Set Supply pump set is rigidly fixed on the sump The pump set is mono
block pump with 05 HP motor operating on single phase 220 volts 50 Hz AC supply
bull Sump Sump is provided to store sufficient waters for independent circulation through
the unit for experimentation and arranged within the floor space of the main unit
Before Commissioning
bull
Check whether all the joints are leak proof and watertight
bull
Close all the cocks on the pressure feed pipes and Manometer to prevent damage andoverloading of the manometer
bull Check the gauge glass and meter scale assembly of the measuring tank and see that it is
fixed water tight and vertical
bull
Check proper electrical connections to the switch which is internally connected to themotor
Experiments
bull
The apparatus is primarily designed for conducting experiments on the frictional losses inpipes of different sizes Three different sizes of pipes are provided for wide range ofexperiments Each individual pipe can be connected to the Manometer through thepressure feed pipes having individual quick operating cocks
bull
While taking reading close all the cocks in the pressure feed pipe except the two (upstream and downstream) cocks which directly connect the manometer to the requiredpipe for which the loss in head has to be determined (Make sure while taking readings
7232019 MOFMOS LABpdf
httpslidepdfcomreaderfullmofmos-labpdf 1547
Department of ANE MOFMOS LAB MANUAL
14
that the manometer is properly primed Priming is the operating of filling the Manometerupper part and the connecting pipes with water venting the air from the pipes)
bull First open the inlet gate valve of the apparatus Adjust the control valve kept at the exit
end of the apparatus to a desired flow rate and maintain the flow steadily
bull
The actual discharge is measured with the help of the measuring tank For each size ofthe pipe the area of cross section of flow can be calculated from the known diameter ofthe pipes From these two valves and the average velocity of stream through the pipe canbe calculated
bull The actual loss of head is determined from the Manometer readings The frictional loss of
head in pipes is given by the Darcys formulaThe friction coefficient indicates f
7232019 MOFMOS LABpdf
httpslidepdfcomreaderfullmofmos-labpdf 1647
Department of ANE MOFMOS LAB MANUAL
15
FRICTION FACTOR FOR A GIVEN PIPE LINE
Aim - To calculate the friction factor for a given pipe line
Apparatus - experimental set-up stop watch
Procedure-
1 Start the motor keeping the delivery valve close2
The water is allowed to flow through the selected pipe by selecting the appropriateball valve
3 By regulating the valve control the flow rate and select the corresponding pressuretapings
4
Make sure while taking readings that the manometer is properly primed Priming isthe operating of filling the Manometer upper part and the connecting pipes with waterventing the air from the pipes Note down the loss of head ldquohfrdquo from the manometerscale
5
Note down the time required for the rise of 10cm (ie 01m) water in the collectingtank by using stop watch Calculate discharge using below formula
Discharge - The time taken to collect some lsquoxrsquo cm of water in the collecting tank in msup3sec
A x RQ =
t
A = area of the collecting tank in msup2 (03m X 03m)R = rise of water level taken in meters (say 01m or 10cm)t = time taken for rise of water level to rise lsquorrsquo in lsquotrsquo seconds
6 Calculate the velocity of the jet by following formula
V = Discharge = Q A msecArea of the pipe
A = cross sectional area of the pipe=Πdsup2 4d = pipe diameter
7 Calculate the coefficient of friction for the given pipe by fLvsup2
hf = ---------ρgd
Wherehf - Loss of head of water = (h1-h2)(Sn So ndash 1) = (h1-h2) 1261000 m
f - Co-efficient of friction for the pipeL - Discharge between sections for which loss of head is measured (1 meter)v - Average velocity of flow in msecg - Acceleration due to gravity 981msecd - Pipe diameter in meters
8 Repeat the steps 2 to 7 for different sets of readings by regulating the discharge valve
7232019 MOFMOS LABpdf
httpslidepdfcomreaderfullmofmos-labpdf 1747
Department of ANE MOFMOS LAB MANUAL
16
Tabular Form
S No Oslash of pipeArea(a)
Time forrise of 10cm water
Discharge VelocityLoss ofHead
hf
Co-efficientof friction
f
Calculation-
bull Total Head H
H = (h1 + h2) x 126 m of waterWhere
126 = conversion factor from mercury to water head
bull
Discharge Q
WhereA = Area of collecting tank = 0125 msup2R = Rise in water level of the collecting tank cm
t = time for lsquoRrsquo cm rise of water sec100 = Conversion from cm to m
bull
Velocity V
msWhere Arsquo = area of the pipefitting in use
7232019 MOFMOS LABpdf
httpslidepdfcomreaderfullmofmos-labpdf 1847
Department of ANE MOFMOS LAB MANUAL
17
bull
Friction Factor(Major Losses) F
Where H = total head m of waterV = velocity mg = acceleration due to gravity 981mssup2L = Distance bw tapping = 15m
bull
Head Loss Due To Fittings (Minor Losses) K
Where H = total head m of waterV = velocity mg = acceleration due to gravity 981mssup2
Precautions
1) Do not run the pump dry2)
Clean the tanks regularly say for every 15days3)
Do not run the equipment if the voltage is below 180V4) Check all the electrical connections before running5) Before starting and after finishing the experiment the main control valve should be in
close position6) Do not attempt to alter the equipment as this may cause damage to the whole system
Results and Conclusions
7232019 MOFMOS LABpdf
httpslidepdfcomreaderfullmofmos-labpdf 1947
Department of ANE MOFMOS LAB MANUAL
18
EXPERIMENT 4
BERNOULLIrsquoS EXPERIMENTIntroduction
Bernoullirsquos Theorem gives the relationship between pressure head velocity head and thedatum Here the attempt has been made to study the relationship of the above said parametersusing venturimeter
General Description
bull The apparatus consists of a specially fabricated clear ACRYLIC Venturimeter
with necessary tappings connected to a Multibank Piezometer also made of clearACRYLIC
bull
The apparatus consists of two overhead tanks interconnected with the venturimeterwhich is placed in between the tanks
bull The overhead tanks are provided with the Head variation mechanism for conducting
the experiments at various heads
bull
Water in the sump tank is pumped using a Monobloc Centrifugal pump (Kirloskarmake) which passes through the control valve to the overhead tank
bull The height of the water in the collecting tank is measured using the acrylic
Piezometer to find the flowrate
bull The whole arrangement is mounted on an aesthetically designed sturdy frame
made of MS tubes and NOVAPAN Board with all the provisions for holding thetanks and accessories
Aim
o
The experiment is conducted too
Study of Pressure Gradient at different zoneso
Verification of Bernoullis Equationo
Comparative analysis under different flow rates
Apparatus
1) Venturimeter 2)Piezometer 3) Overhead Tank 4)Sump Tank 5) Centrifugal Pump
Procedure
1) Fill in the sump tank with clean water2)
Keep the delivery valve closed3)
Check and give necessary electrical connections to the system4) Switch on the pump amp Slowly open the delivery valve5)
Adjust the flow through the control valve of the pump6)
Allow the system to attain the steady state ie let the water pass from the secondoverhead tank to the collecting tank
7) Note down the Pressure head at different points of the venture meter on the multi-tubepiezometer (Expel if any air is the by inserting the thin pin into the piezometer openings)
8) Close the ball valve of the collecting tank and measure the time for the known rise ofwater
7232019 MOFMOS LABpdf
httpslidepdfcomreaderfullmofmos-labpdf 2047
Department of ANE MOFMOS LAB MANUAL
1983097
9) Change the flow rate and repeat the experiment
Observation
SlNo
Static Head Loss h Time for lsquoRrsquo
cm rise in waterlsquoTrsquo sec1 2 3 4 5 6 7 8 9 10
1
2
3
4
5
Calculations1
Discharge QA2
Where
A = Area of collecting tank = 0045 msup2R = Rise in water level of the collecting tank cmt = time for lsquoRrsquo cm rise of water sec100 = Conversion from cm to m
3 Pressure Head
Where
ρ = density of waterg = gravitational constanth = head measured m of water column
3 Velocity Head
WhereV = Q a a = Area at the particular section of the venturimeter msup2
4 Verification of BERNOULLIrsquoS EQUATIONBernoullirsquos Equation is given as
After findinga Pressure Head hb
Velocity headat different cross-section of the Venturimeter
7232019 MOFMOS LABpdf
httpslidepdfcomreaderfullmofmos-labpdf 2147
Department of ANE MOFMOS LAB MANUAL
20
Put the same in the above equation for different points and verify whether all the values obtainedare sameNote Consider the datum z to be constant
Precautions
bull
Do not run the pump drybull
Clean the tanks regularly say for every 15days
bull
Do not run the equipment if the voltage is below 180V
bull
Check all the electrical connections before running
bull Before starting and after finishing the experiment the main
bull Control valve should be in close position
bull Do not attempt to alter the equipment as this may cause
bull
Damage to the whole system
Result and Conclusion
7232019 MOFMOS LABpdf
httpslidepdfcomreaderfullmofmos-labpdf 2247
Department of ANE MOFMOS LAB MANUAL
21
EXPERIMENT 5
CALIBRATION OF A TRIANGULAR NOTCH
AIM -To find the coefficient of discharge of given triangular notch
THEORY-A notch is a device used for measuring the rate of flow of liquid through a smallchannel or a tank It may be defined as an opening in the side of a tank or small channel in suchthat a way that the liquid surfaces in the tank or channel is below the top edge of the opening
NOTCHES ARE CLASSIFIED AS-1 Rectangular notch2 Triangular notch3 Trapezoidal notch
4 Stepped notch
A triangular notch is preferred to a rectangular notch due to the following reasonsThe expression for discharge of triangular notch is compared to rectangular notch is simple Formeasuring low discharge a triangular notch gives more accurate results than a rectangular notchIn the case of triangular notch only H is required for the computation of dischargeA trapezoidal notch is a combination of rectangular and triangular notch and thus the dischargethrough trapezoidal notch is the sum of above notchesA stepped notch is a combination of rectangular notch and triangular notch The dischargethrough the stepped notch is equal to sum of discharges through the different rectangularnotches
DESCRIPTION- The apparatus consists of1) Measuring tank 2) Sump tank3) Supply pump set 4) Inlet and out let valve
Measuring tank Stainless steel tank of size 030305mm height with the gage glass a scalearrangement for quick and easy measurements A ball valve is provided to empty the tank and adrain is provided at the bottom of the tank to drain the waste water when the unit is not in useWater for independent circulation through the unit for experimentation and arranged within thefloor space of the main unitSump tank The sump tank is a size of 020303m stainless steel tank to store sufficient waterfor independent circulation through the unit for experimentation and arranged within the floorspace of the main unit about 060305m with a gauge glass and scale arrangement A ballvalve is provided to empty the tankSupply Pump set The pump is 2525mm size mono block with frac12 HP 2880 RPM singlephase 220volts AC supply Inlet and out let valve- These valves are used to control the flow ofwater at inlet and out let
PROCEDURE1 Allow the water to drain up to triangular notch
7232019 MOFMOS LABpdf
httpslidepdfcomreaderfullmofmos-labpdf 2347
Department of ANE MOFMOS LAB MANUAL
22
2 Note down the depth of the water when the water is coinciding with the v notch point
3 Collect water in collecting tank and close the drain valve and find the time taken for the rise ofwater up to 20cm
4 Calculate the discharge by using the above results
5 Now substituting the values in the formula for calculation of discharge for v- notch gives therequired result
Precautionsbull Do not run the pump dry
bull Clean the tanks regularly say for every 15days
bull Do not run the equipment if the voltage is below 180V
bull Check all the electrical connections before running
bull
Before starting and after finishing the experiment the main
bull
Control valve should be in close position
bull
Do not attempt to alter the equipment as this may cause
7232019 MOFMOS LABpdf
httpslidepdfcomreaderfullmofmos-labpdf 2447
Department of ANE MOFMOS LAB MANUAL
23
bull Damage to the whole system
Result and Conclusion
7232019 MOFMOS LABpdf
httpslidepdfcomreaderfullmofmos-labpdf 2547
Department of ANE MOFMOS LAB MANUAL
24
MECHANICSOF SOLIDS
LAB
7232019 MOFMOS LABpdf
httpslidepdfcomreaderfullmofmos-labpdf 2647
Department of ANE MOFMOS LAB MANUAL
25
7232019 MOFMOS LABpdf
httpslidepdfcomreaderfullmofmos-labpdf 2747
Department of ANE MOFMOS LAB MANUAL
983089
IZOD IMPACT TEST
AIM To perform the izod impact test on materials
APPARATUS Izod impact test machine test specimen vernier calipers steel rule
IMPACT STRENGTH The resistance of a material to fracture under sudden load application
MATERIALS Two types of test pieces are used for this test as given
1) Square cross-section
2) Round cross-section
THEORY The type of test specimen used for this test is a Square Cross-section
The specimen may have single two or three notches The testing machine shouldhave the following specifications The angle between top face of grips and face holding the specimen Vertical=900 the angle of tip of hammer =750plusmn10
The angle between normal to the specimen and underside face of the hammer at Striking point=100plusmn10
Speed of hammer at impact=399msecStriking energy=168N-m or Joules Angle
Of drop of pendulum =900 Effective
weight of pendulum=2179kg
Minimum value of scale graduation=2 Joules
Permissible total friction loss of corresponding energy=050
Distance from the axis of rotation of distance between the base of specimen notch andthe point of specimen hit by the hammer=22mmplusmn05mm
The longitudinal axes of the test piece shall lie in the plane of swing of the center ofgravity of the hammer The notch shall be positioned so that its in the plane of thehammer the notch shall be positioned its plane of symmetry coincides with the top faceof the grips for setting the specimen the notch impact strength I is calculated accordingto the following relation
Where I= impact strength in joulesm2
7232019 MOFMOS LABpdf
httpslidepdfcomreaderfullmofmos-labpdf 2847
Department of ANE MOFMOS LAB MANUAL
983090
PROCEDURE
1 For conducting Izod test a proper striker is to be fitted firmly to the bottom of thehammer with the help of the clamming piece
2 The latching take for izod test is to be firmly fitted to the bearing housing at the side of
the columns3 The frictional loss of the machine can be determined by free fall test raise the
hammer by hands and latch in release the hammer by operating lever the pointer will
then indicate the energy loss due to friction From this reading confirm that the friction
loss is not exceeding 05 of the initial potential energy Otherwise frictional loss has to
be added to the final reading
4 The specimen for izod test is firmly fitted in the specimen support with the help ofclamping screw and eacutelan key Care should be taken that the notch on the specimenshould face to pendulum striker
5 After ascertaining that there is no person in the range of swinging pendulum release the
pendulum to smash the specimen6 Carefully operate the pendulum brake when returning after one swing to stop the oscillations
7 Read-off position of reading pointer on dial and note indicated value
8 Remove the broken specimen by loosening the clamping screw
The notch impact strength depends largely on the shape of the specimen and the notch the
values determined with other specimens therefore may not be compared with each other
OBSERVATION TABLE
S No A(Area of cross K Impact energy I Impact Strength
section of observed
specimen)
RESULT
7232019 MOFMOS LABpdf
httpslidepdfcomreaderfullmofmos-labpdf 2947
Department of ANE MOFMOS LAB MANUAL
983091
Calculation Part
7232019 MOFMOS LABpdf
httpslidepdfcomreaderfullmofmos-labpdf 3047
Department of ANE MOFMOS LAB MANUAL
983092
ROCKWELL HARDNESS TEST
AIM To determine the Rockwell hardness of the given test specimen
APPARATUS Rockwell hardness testing machine test specimen
THEORY
Hardness-the resistance of a metal to plastic deformationagainst indentation scratching abrasion or cutting
The depth of penetration of the indenter measures the hardness of a material by this Rockwell ‟s hardness test method the depth of penetration is inversely
proportional to the hardness Both ball or diamond cone types of indenters are used inthis testThere are three scales on the machine for taking hardness readings
Scale bdquoA‟ with load 60kgf or 5888N and diamond indenter is used for performing tests on steel and shallow case hardened steel
Scale bdquoB‟ with load 100kgf or 9807 N and 1588mm dia ball indenter is used forperforming tests on soft steel malleable iron copper and aluminum alloys
Scale bdquoC‟ with load 150kgf or 1471 N and diamond indenter is used for performing testson steel hard cost steel deep case hardened steel other metals which harder
First minor load is applied to overcome the film thickness on the metal surfaceMinor load also eliminates errors in the depth of measurement due to spring of themachine frame or setting down of the specimen and table attachments
The Rockwell hardness is derived from the measurement of the depth of theimpression This method of test is suitable for finished or machined parts of simpleshapes
PROCEDURE
1 Select the load by rotating the nob and fix the suitable indenter
2 Clean the test piece and place on the special anvil or worktable of the machine
3 Turn the capstan wheel to evaluate the test specimen into contact with the indenterpoint
4 Further turn the wheel for three rotations forcing the test specimen against theindenter This will ensure the minor load has been applied5 Set the pointer on the scale dial at the appropriate position
7232019 MOFMOS LABpdf
httpslidepdfcomreaderfullmofmos-labpdf 3147
Department of ANE MOFMOS LAB MANUAL
983093
6 Push the lever to apply the major load A dash pot provided in the loading mechanismto ensure that the load is applied gradually
7 As soon as the pointer comes to rest pull the handle in the reverse direction slowlyThis releases the major but not the minor load The pointer will now rotate in the reversedirection
8 The Rockwell hardness can read off the scale dial on the appropriate scale after thepointer comes to rest
OBSERVATIONS
Material of the specimen =
Thickness of test specimen =
Hardness scale used =
Test Material Rockwell Scale of weights Rockwell number Average
no Rockwell
no
Scale weight indent 1 2 3
PRECAUTIONS
1 For testing cylindrical test specimens use V-type platform
2 Calibrate the machine occasionally by using standard test blocks
3 For thin metal prices place another sufficiently thick metal piece between the testspecimen and the platform to avoid any damage which may likely occur to the platform
4 After applying major load wait for some time to allow the needle to come to restThe waiting time may vary from 2 to 8 seconds
7232019 MOFMOS LABpdf
httpslidepdfcomreaderfullmofmos-labpdf 3247
Department of ANE MOFMOS LAB
MANUAL
983094
5 The surface of the test piece should be smooth and even and free from oxidescale and foreign matter6 Test specimen should not be subjected to any heating of cold working
7 The distance between the centers of two adjacent indentation should be at least 4
Times the diameter of the indentation and the distance from the center of any indentation tothe edge of the test piece should be at least 25 times the diameter of the indentation
RESULT
7232019 MOFMOS LABpdf
httpslidepdfcomreaderfullmofmos-labpdf 3347
Department of ANE MOFMOS LAB MANUAL
983095
Calculation Part
7232019 MOFMOS LABpdf
httpslidepdfcomreaderfullmofmos-labpdf 3447
Department of ANE MOFMOS LAB MANUAL
983096
BRINELLrsquoS HARDNESS TEST
AIM To determine the Brinell hardness of the given test specimen
APPARATUS Brinell hardness machine test specimen Brinells Microscope
THEORY
Indentation Hardness-A number related to the area or to the depth of
the impression made by an indenter or fixed geometry under a known fixed load
This method consists of indenting the surface of the metal by a hardened steel
ball of specified diameter D mm under a given load F kgf and measuring the average
diameter d mm of the impression with the help of Brinell microscope fitted with a scaleThe Brinell hardness HB is defined as the quotient of the applied force F divided by the
spherical area of the impression
HB= Test load in kgfsurface area of indentation
=2F πD (D- D2- d2) kgmm2
PROCEDURE
1 Select the proper size of the ball and load to suit the material under test2 Clean the test specimen to be free from any dirt and defects or blemishes
3 Mount the test piece surface at right angles to the axis of the ball indenter plunger
4 Turn the platform so that the ball is lifted up
5 By shifting the lever applies the load and waits for some time
6 Release the load by shifting the lever
7 Take out the specimen and measure the diameter of indentation by means of theBrinell microscope8 Repeat the experiments at other positions of the test piece
9 Calculate the value of HB
7232019 MOFMOS LABpdf
httpslidepdfcomreaderfullmofmos-labpdf 3547
Department of ANE MOFMOS LAB MANUAL
983097
OBSERVATIONS
Test piece material = Diameter of the ballrdquo D ldquo =
Load section FD2 = Test load =
Load application time =
Least count of Brinell Microscope =
Diameter Average
Impression F D HB
S No in kg in mm Kgmm2
(d1) (d2) (d1+d2)2
PRECAUTIONS
1 The surface of the test piece should be clean
2 The testing machine should be protected throughout the test from shock or vibration
3 The test should be carried out at room temperature
4 The distance of the center of indentation from the edge of test piece should be at
least 25 times the diameter of the indentation and the distance between the center ofthe two adjacent indentations should be at least 4 times the diameter of the indentation
5 The diameter of each indentation should be measured in two directions at rightangles and the mean value readings used the purpose of determining the hardnessnumber
7232019 MOFMOS LABpdf
httpslidepdfcomreaderfullmofmos-labpdf 3647
Department of ANE
MOFMOS LAB MANUAL
983089983088
RESULT
Calculation Part
7232019 MOFMOS LABpdf
httpslidepdfcomreaderfullmofmos-labpdf 3747
Department of ANE MOFMOS LAB MANUAL
983089983089
SPRING TEST
AIM To determine the rigidity modulus of the spring
APPARATUS Spring testing machine vernier calipers spring specimen
THEORY
Closed coiled helical springs are the springs in which helix angle is very small or inother words the pitch between two adjacent turns is small A closed coiled helical springcarrying an axial load is shown in fig
As helix angle in case of close coiled helical springs are small hence the bendingeffect on the spring is ignored and we assume that the coils of close coiled helical
springs are to stand purely tensional stresses Let d=diameter ofthe spring wire
P= pitch of the helical spring N= number ofcoils R= mean radius of the spring coil
W=axial load on spring C=modulus of rigidity
τ=maximum shear stress induced in the wire θ=angle of twist in the
spring wire and
x= deflection of spring due to axial load l= length of wire
Net twisting moment on the wire T=WR
But twisting moment is also given by T= (π 16) τd3
From 1 ad 2 WR = (π 16) τd3 τ=16WR πd
3
above equation which gives the maximum shear stress induced in the wire (1) Length of one coil=2πR
Total length of the wire=2πRn (2)
Strain energy stored by the spring due to torsion
U= (τ 4C) [(π 4)d 2πRn] (3)
Work done on the spring =average load x deflection
= (12) Wx (4)
Equating 3 and 4
(12) Wx = (32W2R3n)Cd4
7232019 MOFMOS LABpdf
httpslidepdfcomreaderfullmofmos-labpdf 3847
Department of ANE MOFMOS LAB MANUAL
983089983090
x=64WR3nCd
4
Rigidity modulus of the spring
C=64WR3nxd
4
PROCEDURE
1) Consider the spring and find out itsmean coil radius R with the help ofvernier calipers
2) Find the diameter of the spring andnumber of turns
3) Fix the spring between two hooks
4) Now load is gradually applied
5) Note the deflection from thedeflection scale for different loadsapplied
6) Calculate the rigidity modulus usingabove formula
PRECAUTIONS
1) Dimensions should be measureaccurately with the help of verniercalipers
2) Deflection from the scale should benoted carefully and accurately
OBSERVATION TABLE
Sno Load applied deflection Rigidity modulus
C
Average rigidity modulus C =
RESULT
7232019 MOFMOS LABpdf
httpslidepdfcomreaderfullmofmos-labpdf 3947
Department of ANE MOFMOS LAB MANUAL
983089983091
Calculation Part
7232019 MOFMOS LABpdf
httpslidepdfcomreaderfullmofmos-labpdf 4047
Department of ANE MOFMOS LAB MANUAL
983089983092
TORSION
AIM To conduct torsion test on mild steel or cast iron specimen to find modulus of rigidity or to find angle of twist of the materials which are subjected to torsion
APPARATUS 1 A torsion test machine along with angle of twist measuring attachment
2 Standard specimen of mild steel or cast iron
3 Steel rule
4 Vernnier caliper or a micrometer
THEORY
For transmitting power through a rotating shaft it is necessary to apply a turning
force The force is applied tangentially and in the plane of transverse cross section The
torque or twisting moment may be calculated by multiplying two opposite turningmoments It is said to be in pure torsion and it will exhibit the tendency of shearing off at
every cross section which is perpendicular to the longitudinal axis
Torsion equation
Torsion equation is given by below
T IP = CθL = TR
T= maximum twisting torque (Nmm) IP =
polar moment of inertia (mm4) τ =shear
stress (Nmm2) C=modulus of rigidity (Nmm2)
θ=angle of twist in radians L=length of shaft under torsion (mm)
Assumptions made for getting torsion equation
1 The material of the shaft is uniform through out
2 The shaft circular in section remain circular after loading
3 Plane sections of shaft normal to its axis before loading remain plane after thetorque have been applied
4 The twist along the length of the shaft is uniform throughout
5 The distance between any two normal-sections remains the same after theapplication of torque
6 Maximum shear stress induced in the shaft due to application of torque does notexceed its elastic limit
7232019 MOFMOS LABpdf
httpslidepdfcomreaderfullmofmos-labpdf 4147
Department of ANE MOFMOS LAB MANUAL
983089983093
PROCEDURE
1 Select the suitable grips to suit the size of the specimen and clamp it in themachine by adjusting sliding jaw
2 Measure the diameter at about the three places and take average value
3 Choose the appropriate loading range depending upon specimen
4 Set the maximum load pointer to zero
5 Carry out straining by rotating the hand wheel or by switching on the motor
6 Load the members in suitable increments observe and record strain reading
7 Continue till failure of the specimen
8 Calculate the modulus of rigidity C by using the torsion equation
9 Plot the torque ndashtwist graph (T Vs θ)
OBSERVATIONS
Gauge length L =
Polar moment of inertia IP =
Modulus of rigidity C =TL IP θ =
SNo Twisting Moment Angle of Twist Modulus Average
Kgf Nm Degrees Radians of rigidity CNmm2
C
RESULT
7232019 MOFMOS LABpdf
httpslidepdfcomreaderfullmofmos-labpdf 4247
Department of ANE MOFMOS LAB MANUAL
983089983094
TENSILE TEST
AIM
To conduct tensile test on a mild steel specimen and determine the following
1 Limit of proportionality 2 Elastic Limit
3 Upper yield point 4 Lower yield point
5 Ultimate strength 6 Fracture strength
7 Young`s Modulus 8 Percentage elongation
9 Percentage reduction in area 10 Ductility
11 Toughness 12 True stress amp true strain
13 Malleability
APPARATUS tensile testing machine specimen steel rule vernier caliper micrometer
THEORY
The tensile test is most applied one of all mechanical tests In this test a test specimen is fixed
into grips connected to a straining device and to a load-measuring device (One end in stationary
grips and the other in movable grips) If the applied load is small enough the deformation of any
solid body is entirely elastic An elastically deformed solid will return to its original form as soon
as load is removed However if the load is too large the material can be deformed permanently
The initial part of the tension curve which represents the manner in which solid undergoes
plastic deformation is termed as plastic The stress below which the deformation is essentially
entirely elastic is known as the elastic limit of the material In some materials like mild steel a
sudden drop in load indicating both an upper and lower yield point denotes the onset of plastic
deformation However some materials do not exhibit a sharp yield point During plastic
deformation at lager extensions strain hardening cannot compensate for the decrease in section
and thus the load passes through a maximum and then begins to decrease At this stage the
ultimate strength which is defined as the ration of the load on the specimen to the original cross-section area reaches a maximum value Until this point the deformation is uniform at all the
sections of the specimen Further loading will eventually cause bdquoneck ‟ formation and rupture
follows
7232019 MOFMOS LABpdf
httpslidepdfcomreaderfullmofmos-labpdf 4347
Department of ANE MOFMOS LAB
MANUAL
983089983095
Usually a tension test is conducted at room temperature the tensile load is applied
slowly During this test either round or flat specimens may be used The load on the specimen is
applied mechanically or hydraulically depending on the type of testing machine
1 NominalEngg stress and NominalEngg strain
Original CS area = A0 (mm2)
Original gauge length = L0 (mm) Increase in gauge length = δL0
Nominal stress = PA0 (N mm2)
Nominal strain = δL0 L0
2 Limit of Proportionality Stress is proportional to strain up to this pointNormal Stress = PA PO Normal Strain = (δ LO) ALO
3 Elastic limit When the load is removed at ldquoBrdquo the specimen will go back to originalDimensions ie LO and δ AO Nominal stress = PB AO Normal Strain = (δ LO) B LO
If the specimen is loaded beyond elastic limit it will undergo permanent strainie Plastic deformation
4 Upper yield point Nominal stress = PC AO Nominal strain = (δ LO) D LO
5 Lower yield point Nominal stress = PD AO
Nominal strain = (δ LO) D LO 6 Ultimate load or maximum load point
Nominal ultimate stress = PE AO Nominal strain = (δ LO) E LO
7 Fracture Load point F
Nominal fracture stress = PF AO
Nominal strain at fracture = (δ LO) F LO
8 Young`s modulus (E) Young`s modulus (E) = StressStrain
(In the elastic region limit of proportionality = Nominal stress at ANominal strain at A 9Modulus of resilience = (Nominal stress at elastic limit)
2 2E
Area under Engg Stress - Strain diagram up to elastic limit10 Resilience = Modulus of Resilience x Volume of specimen undergoing Tensile stress
7232019 MOFMOS LABpdf
httpslidepdfcomreaderfullmofmos-labpdf 4447
Department of ANE MOFMOS LAB MANUAL
983089983096
11 Yield point ElongationElongation taking place in the specimen from C to D this istaking place without increase in stress
12 Modulus of toughnessArea under engineering stress ndash strain diagram up to fracture13 Toughness = Modulus of toughness x Volume of specimenThis indicates theamount of energy absorbed by the specimen before fracture take place
14 Ductility= (Final length at fracture ndash original length 10) x 100
15 MalleabilityIt is the ability of the material to undergo plastic deformation prior fracture under compressive loading conditions In a tensile test it is approximatedas percentage reduction in cross sectional area of the specimen Malleability =
(AO - Af )AO) x 100
True stress ndash true strain diagram
Engineering stress is calculated based on original cross sectional area (AO) But not on the actual cross sectional area at load bdquoP‟
True stress = PA = PAO x AO A
Since volume remains constant during plastic deformation we have AO LO = AL True stress = PAO x L LO
= PAO x ((LO + δLO) LO)
= P (1+e)= Nominal stress (1+ nominal strain)
True strain = Є = 1n (1+e)
These relations are valid up to ultimate load ie up to which the strain isuniform all along the gauge length
1 True Stress at upper yield point = Nominal stress at upper yield point ( 1+e O)True strain at C = 1n (1+eo)
2 True stress at ultimate load (E1)= Nominal ultimate stress ( 1+eE)True strain at ultimate load = 1n (1+eE)
3 True stress at fracture (E1) = Pf Af
Where Af is the area of cross section at fracture can be measured True
strain at fracture = 1n (Ao Af )
Area relation is taken instead of lengths because the strains are localized in theregion between ultimate load point and fracture point
4 Strain Hardening
From lower yield point onwards increase in load is required for increase instrain Thus the stress required for further deformation is more Thisphenomenon is called strain hardening
5 True ndash stress ndash true strain curve in log ndash log co ndash ordinates
When the true ndash stress and true ndash strain are plotted on log ndash log co ndash ordinates thecurve is a straight line
7232019 MOFMOS LABpdf
httpslidepdfcomreaderfullmofmos-labpdf 4547
Department of ANE MOFMOS LAB MANUAL
983120983137983143983141 983089983097 983151983142 983090983089
6 Ductile and Brittle Materials
If a material fails without much plastic deformation it can be called brittle If the percentageelongation at fracture is less than 25 the material is classified as brittle
bull Usually the metals with FCC and CPH structures are highly ductile
PROCEDURE
1 Measure the original gauge length and diameter of the specimen
2 Insert the specimen into grips of the test machine
3 Begin the load application and record load vs elongation data
4 Take the readings more frequently as yield point is approached
5 Measure elongation values
6 Continue the test till fracture occurs
7 By joining the two broken halves of the specimen together measure the final length anddiameter of specimen at fracture
RESULTS AND DISCUSSIONS
1 Plot the Engg Stress strain curve and determine the following
bull Limit of proportionality = (Nmm2)
bull Yield strength = (Nmm2)
bull Ultimate strength = (Nmm2)
bull Young`s modulus = (Nmm2)
bull Percentage elongation = bull Percentage reduction in area =
bull Fracture strength = (Nominal Engg)
bull Toughness = Area under stress ndash strain curve up to
fracture
bull Malleability
2 Plot True Stress True strain curve after calculating true ndash stress and true strain values at various
points
Estimate1) Strength coefficient
2) Strain hardening coefficient
3) Determine whether the material is ductile or brittle4) Comment on the results
7232019 MOFMOS LABpdf
httpslidepdfcomreaderfullmofmos-labpdf 4647
Department of ANE MOFMOS LAB MANUAL
983120983137983143983141 983090983088 983151983142 983090983089
SNo Load Deformation Stress Strain E
Calculation part-
7232019 MOFMOS LABpdf
httpslidepdfcomreaderfullmofmos-labpdf 4747
Department of ANE MOFMOS LAB MANUAL

7232019 MOFMOS LABpdf
httpslidepdfcomreaderfullmofmos-labpdf 1547
Department of ANE MOFMOS LAB MANUAL
14
that the manometer is properly primed Priming is the operating of filling the Manometerupper part and the connecting pipes with water venting the air from the pipes)
bull First open the inlet gate valve of the apparatus Adjust the control valve kept at the exit
end of the apparatus to a desired flow rate and maintain the flow steadily
bull
The actual discharge is measured with the help of the measuring tank For each size ofthe pipe the area of cross section of flow can be calculated from the known diameter ofthe pipes From these two valves and the average velocity of stream through the pipe canbe calculated
bull The actual loss of head is determined from the Manometer readings The frictional loss of
head in pipes is given by the Darcys formulaThe friction coefficient indicates f
7232019 MOFMOS LABpdf
httpslidepdfcomreaderfullmofmos-labpdf 1647
Department of ANE MOFMOS LAB MANUAL
15
FRICTION FACTOR FOR A GIVEN PIPE LINE
Aim - To calculate the friction factor for a given pipe line
Apparatus - experimental set-up stop watch
Procedure-
1 Start the motor keeping the delivery valve close2
The water is allowed to flow through the selected pipe by selecting the appropriateball valve
3 By regulating the valve control the flow rate and select the corresponding pressuretapings
4
Make sure while taking readings that the manometer is properly primed Priming isthe operating of filling the Manometer upper part and the connecting pipes with waterventing the air from the pipes Note down the loss of head ldquohfrdquo from the manometerscale
5
Note down the time required for the rise of 10cm (ie 01m) water in the collectingtank by using stop watch Calculate discharge using below formula
Discharge - The time taken to collect some lsquoxrsquo cm of water in the collecting tank in msup3sec
A x RQ =
t
A = area of the collecting tank in msup2 (03m X 03m)R = rise of water level taken in meters (say 01m or 10cm)t = time taken for rise of water level to rise lsquorrsquo in lsquotrsquo seconds
6 Calculate the velocity of the jet by following formula
V = Discharge = Q A msecArea of the pipe
A = cross sectional area of the pipe=Πdsup2 4d = pipe diameter
7 Calculate the coefficient of friction for the given pipe by fLvsup2
hf = ---------ρgd
Wherehf - Loss of head of water = (h1-h2)(Sn So ndash 1) = (h1-h2) 1261000 m
f - Co-efficient of friction for the pipeL - Discharge between sections for which loss of head is measured (1 meter)v - Average velocity of flow in msecg - Acceleration due to gravity 981msecd - Pipe diameter in meters
8 Repeat the steps 2 to 7 for different sets of readings by regulating the discharge valve
7232019 MOFMOS LABpdf
httpslidepdfcomreaderfullmofmos-labpdf 1747
Department of ANE MOFMOS LAB MANUAL
16
Tabular Form
S No Oslash of pipeArea(a)
Time forrise of 10cm water
Discharge VelocityLoss ofHead
hf
Co-efficientof friction
f
Calculation-
bull Total Head H
H = (h1 + h2) x 126 m of waterWhere
126 = conversion factor from mercury to water head
bull
Discharge Q
WhereA = Area of collecting tank = 0125 msup2R = Rise in water level of the collecting tank cm
t = time for lsquoRrsquo cm rise of water sec100 = Conversion from cm to m
bull
Velocity V
msWhere Arsquo = area of the pipefitting in use
7232019 MOFMOS LABpdf
httpslidepdfcomreaderfullmofmos-labpdf 1847
Department of ANE MOFMOS LAB MANUAL
17
bull
Friction Factor(Major Losses) F
Where H = total head m of waterV = velocity mg = acceleration due to gravity 981mssup2L = Distance bw tapping = 15m
bull
Head Loss Due To Fittings (Minor Losses) K
Where H = total head m of waterV = velocity mg = acceleration due to gravity 981mssup2
Precautions
1) Do not run the pump dry2)
Clean the tanks regularly say for every 15days3)
Do not run the equipment if the voltage is below 180V4) Check all the electrical connections before running5) Before starting and after finishing the experiment the main control valve should be in
close position6) Do not attempt to alter the equipment as this may cause damage to the whole system
Results and Conclusions
7232019 MOFMOS LABpdf
httpslidepdfcomreaderfullmofmos-labpdf 1947
Department of ANE MOFMOS LAB MANUAL
18
EXPERIMENT 4
BERNOULLIrsquoS EXPERIMENTIntroduction
Bernoullirsquos Theorem gives the relationship between pressure head velocity head and thedatum Here the attempt has been made to study the relationship of the above said parametersusing venturimeter
General Description
bull The apparatus consists of a specially fabricated clear ACRYLIC Venturimeter
with necessary tappings connected to a Multibank Piezometer also made of clearACRYLIC
bull
The apparatus consists of two overhead tanks interconnected with the venturimeterwhich is placed in between the tanks
bull The overhead tanks are provided with the Head variation mechanism for conducting
the experiments at various heads
bull
Water in the sump tank is pumped using a Monobloc Centrifugal pump (Kirloskarmake) which passes through the control valve to the overhead tank
bull The height of the water in the collecting tank is measured using the acrylic
Piezometer to find the flowrate
bull The whole arrangement is mounted on an aesthetically designed sturdy frame
made of MS tubes and NOVAPAN Board with all the provisions for holding thetanks and accessories
Aim
o
The experiment is conducted too
Study of Pressure Gradient at different zoneso
Verification of Bernoullis Equationo
Comparative analysis under different flow rates
Apparatus
1) Venturimeter 2)Piezometer 3) Overhead Tank 4)Sump Tank 5) Centrifugal Pump
Procedure
1) Fill in the sump tank with clean water2)
Keep the delivery valve closed3)
Check and give necessary electrical connections to the system4) Switch on the pump amp Slowly open the delivery valve5)
Adjust the flow through the control valve of the pump6)
Allow the system to attain the steady state ie let the water pass from the secondoverhead tank to the collecting tank
7) Note down the Pressure head at different points of the venture meter on the multi-tubepiezometer (Expel if any air is the by inserting the thin pin into the piezometer openings)
8) Close the ball valve of the collecting tank and measure the time for the known rise ofwater
7232019 MOFMOS LABpdf
httpslidepdfcomreaderfullmofmos-labpdf 2047
Department of ANE MOFMOS LAB MANUAL
1983097
9) Change the flow rate and repeat the experiment
Observation
SlNo
Static Head Loss h Time for lsquoRrsquo
cm rise in waterlsquoTrsquo sec1 2 3 4 5 6 7 8 9 10
1
2
3
4
5
Calculations1
Discharge QA2
Where
A = Area of collecting tank = 0045 msup2R = Rise in water level of the collecting tank cmt = time for lsquoRrsquo cm rise of water sec100 = Conversion from cm to m
3 Pressure Head
Where
ρ = density of waterg = gravitational constanth = head measured m of water column
3 Velocity Head
WhereV = Q a a = Area at the particular section of the venturimeter msup2
4 Verification of BERNOULLIrsquoS EQUATIONBernoullirsquos Equation is given as
After findinga Pressure Head hb
Velocity headat different cross-section of the Venturimeter
7232019 MOFMOS LABpdf
httpslidepdfcomreaderfullmofmos-labpdf 2147
Department of ANE MOFMOS LAB MANUAL
20
Put the same in the above equation for different points and verify whether all the values obtainedare sameNote Consider the datum z to be constant
Precautions
bull
Do not run the pump drybull
Clean the tanks regularly say for every 15days
bull
Do not run the equipment if the voltage is below 180V
bull
Check all the electrical connections before running
bull Before starting and after finishing the experiment the main
bull Control valve should be in close position
bull Do not attempt to alter the equipment as this may cause
bull
Damage to the whole system
Result and Conclusion
7232019 MOFMOS LABpdf
httpslidepdfcomreaderfullmofmos-labpdf 2247
Department of ANE MOFMOS LAB MANUAL
21
EXPERIMENT 5
CALIBRATION OF A TRIANGULAR NOTCH
AIM -To find the coefficient of discharge of given triangular notch
THEORY-A notch is a device used for measuring the rate of flow of liquid through a smallchannel or a tank It may be defined as an opening in the side of a tank or small channel in suchthat a way that the liquid surfaces in the tank or channel is below the top edge of the opening
NOTCHES ARE CLASSIFIED AS-1 Rectangular notch2 Triangular notch3 Trapezoidal notch
4 Stepped notch
A triangular notch is preferred to a rectangular notch due to the following reasonsThe expression for discharge of triangular notch is compared to rectangular notch is simple Formeasuring low discharge a triangular notch gives more accurate results than a rectangular notchIn the case of triangular notch only H is required for the computation of dischargeA trapezoidal notch is a combination of rectangular and triangular notch and thus the dischargethrough trapezoidal notch is the sum of above notchesA stepped notch is a combination of rectangular notch and triangular notch The dischargethrough the stepped notch is equal to sum of discharges through the different rectangularnotches
DESCRIPTION- The apparatus consists of1) Measuring tank 2) Sump tank3) Supply pump set 4) Inlet and out let valve
Measuring tank Stainless steel tank of size 030305mm height with the gage glass a scalearrangement for quick and easy measurements A ball valve is provided to empty the tank and adrain is provided at the bottom of the tank to drain the waste water when the unit is not in useWater for independent circulation through the unit for experimentation and arranged within thefloor space of the main unitSump tank The sump tank is a size of 020303m stainless steel tank to store sufficient waterfor independent circulation through the unit for experimentation and arranged within the floorspace of the main unit about 060305m with a gauge glass and scale arrangement A ballvalve is provided to empty the tankSupply Pump set The pump is 2525mm size mono block with frac12 HP 2880 RPM singlephase 220volts AC supply Inlet and out let valve- These valves are used to control the flow ofwater at inlet and out let
PROCEDURE1 Allow the water to drain up to triangular notch
7232019 MOFMOS LABpdf
httpslidepdfcomreaderfullmofmos-labpdf 2347
Department of ANE MOFMOS LAB MANUAL
22
2 Note down the depth of the water when the water is coinciding with the v notch point
3 Collect water in collecting tank and close the drain valve and find the time taken for the rise ofwater up to 20cm
4 Calculate the discharge by using the above results
5 Now substituting the values in the formula for calculation of discharge for v- notch gives therequired result
Precautionsbull Do not run the pump dry
bull Clean the tanks regularly say for every 15days
bull Do not run the equipment if the voltage is below 180V
bull Check all the electrical connections before running
bull
Before starting and after finishing the experiment the main
bull
Control valve should be in close position
bull
Do not attempt to alter the equipment as this may cause
7232019 MOFMOS LABpdf
httpslidepdfcomreaderfullmofmos-labpdf 2447
Department of ANE MOFMOS LAB MANUAL
23
bull Damage to the whole system
Result and Conclusion
7232019 MOFMOS LABpdf
httpslidepdfcomreaderfullmofmos-labpdf 2547
Department of ANE MOFMOS LAB MANUAL
24
MECHANICSOF SOLIDS
LAB
7232019 MOFMOS LABpdf
httpslidepdfcomreaderfullmofmos-labpdf 2647
Department of ANE MOFMOS LAB MANUAL
25
7232019 MOFMOS LABpdf
httpslidepdfcomreaderfullmofmos-labpdf 2747
Department of ANE MOFMOS LAB MANUAL
983089
IZOD IMPACT TEST
AIM To perform the izod impact test on materials
APPARATUS Izod impact test machine test specimen vernier calipers steel rule
IMPACT STRENGTH The resistance of a material to fracture under sudden load application
MATERIALS Two types of test pieces are used for this test as given
1) Square cross-section
2) Round cross-section
THEORY The type of test specimen used for this test is a Square Cross-section
The specimen may have single two or three notches The testing machine shouldhave the following specifications The angle between top face of grips and face holding the specimen Vertical=900 the angle of tip of hammer =750plusmn10
The angle between normal to the specimen and underside face of the hammer at Striking point=100plusmn10
Speed of hammer at impact=399msecStriking energy=168N-m or Joules Angle
Of drop of pendulum =900 Effective
weight of pendulum=2179kg
Minimum value of scale graduation=2 Joules
Permissible total friction loss of corresponding energy=050
Distance from the axis of rotation of distance between the base of specimen notch andthe point of specimen hit by the hammer=22mmplusmn05mm
The longitudinal axes of the test piece shall lie in the plane of swing of the center ofgravity of the hammer The notch shall be positioned so that its in the plane of thehammer the notch shall be positioned its plane of symmetry coincides with the top faceof the grips for setting the specimen the notch impact strength I is calculated accordingto the following relation
Where I= impact strength in joulesm2
7232019 MOFMOS LABpdf
httpslidepdfcomreaderfullmofmos-labpdf 2847
Department of ANE MOFMOS LAB MANUAL
983090
PROCEDURE
1 For conducting Izod test a proper striker is to be fitted firmly to the bottom of thehammer with the help of the clamming piece
2 The latching take for izod test is to be firmly fitted to the bearing housing at the side of
the columns3 The frictional loss of the machine can be determined by free fall test raise the
hammer by hands and latch in release the hammer by operating lever the pointer will
then indicate the energy loss due to friction From this reading confirm that the friction
loss is not exceeding 05 of the initial potential energy Otherwise frictional loss has to
be added to the final reading
4 The specimen for izod test is firmly fitted in the specimen support with the help ofclamping screw and eacutelan key Care should be taken that the notch on the specimenshould face to pendulum striker
5 After ascertaining that there is no person in the range of swinging pendulum release the
pendulum to smash the specimen6 Carefully operate the pendulum brake when returning after one swing to stop the oscillations
7 Read-off position of reading pointer on dial and note indicated value
8 Remove the broken specimen by loosening the clamping screw
The notch impact strength depends largely on the shape of the specimen and the notch the
values determined with other specimens therefore may not be compared with each other
OBSERVATION TABLE
S No A(Area of cross K Impact energy I Impact Strength
section of observed
specimen)
RESULT
7232019 MOFMOS LABpdf
httpslidepdfcomreaderfullmofmos-labpdf 2947
Department of ANE MOFMOS LAB MANUAL
983091
Calculation Part
7232019 MOFMOS LABpdf
httpslidepdfcomreaderfullmofmos-labpdf 3047
Department of ANE MOFMOS LAB MANUAL
983092
ROCKWELL HARDNESS TEST
AIM To determine the Rockwell hardness of the given test specimen
APPARATUS Rockwell hardness testing machine test specimen
THEORY
Hardness-the resistance of a metal to plastic deformationagainst indentation scratching abrasion or cutting
The depth of penetration of the indenter measures the hardness of a material by this Rockwell ‟s hardness test method the depth of penetration is inversely
proportional to the hardness Both ball or diamond cone types of indenters are used inthis testThere are three scales on the machine for taking hardness readings
Scale bdquoA‟ with load 60kgf or 5888N and diamond indenter is used for performing tests on steel and shallow case hardened steel
Scale bdquoB‟ with load 100kgf or 9807 N and 1588mm dia ball indenter is used forperforming tests on soft steel malleable iron copper and aluminum alloys
Scale bdquoC‟ with load 150kgf or 1471 N and diamond indenter is used for performing testson steel hard cost steel deep case hardened steel other metals which harder
First minor load is applied to overcome the film thickness on the metal surfaceMinor load also eliminates errors in the depth of measurement due to spring of themachine frame or setting down of the specimen and table attachments
The Rockwell hardness is derived from the measurement of the depth of theimpression This method of test is suitable for finished or machined parts of simpleshapes
PROCEDURE
1 Select the load by rotating the nob and fix the suitable indenter
2 Clean the test piece and place on the special anvil or worktable of the machine
3 Turn the capstan wheel to evaluate the test specimen into contact with the indenterpoint
4 Further turn the wheel for three rotations forcing the test specimen against theindenter This will ensure the minor load has been applied5 Set the pointer on the scale dial at the appropriate position
7232019 MOFMOS LABpdf
httpslidepdfcomreaderfullmofmos-labpdf 3147
Department of ANE MOFMOS LAB MANUAL
983093
6 Push the lever to apply the major load A dash pot provided in the loading mechanismto ensure that the load is applied gradually
7 As soon as the pointer comes to rest pull the handle in the reverse direction slowlyThis releases the major but not the minor load The pointer will now rotate in the reversedirection
8 The Rockwell hardness can read off the scale dial on the appropriate scale after thepointer comes to rest
OBSERVATIONS
Material of the specimen =
Thickness of test specimen =
Hardness scale used =
Test Material Rockwell Scale of weights Rockwell number Average
no Rockwell
no
Scale weight indent 1 2 3
PRECAUTIONS
1 For testing cylindrical test specimens use V-type platform
2 Calibrate the machine occasionally by using standard test blocks
3 For thin metal prices place another sufficiently thick metal piece between the testspecimen and the platform to avoid any damage which may likely occur to the platform
4 After applying major load wait for some time to allow the needle to come to restThe waiting time may vary from 2 to 8 seconds
7232019 MOFMOS LABpdf
httpslidepdfcomreaderfullmofmos-labpdf 3247
Department of ANE MOFMOS LAB
MANUAL
983094
5 The surface of the test piece should be smooth and even and free from oxidescale and foreign matter6 Test specimen should not be subjected to any heating of cold working
7 The distance between the centers of two adjacent indentation should be at least 4
Times the diameter of the indentation and the distance from the center of any indentation tothe edge of the test piece should be at least 25 times the diameter of the indentation
RESULT
7232019 MOFMOS LABpdf
httpslidepdfcomreaderfullmofmos-labpdf 3347
Department of ANE MOFMOS LAB MANUAL
983095
Calculation Part
7232019 MOFMOS LABpdf
httpslidepdfcomreaderfullmofmos-labpdf 3447
Department of ANE MOFMOS LAB MANUAL
983096
BRINELLrsquoS HARDNESS TEST
AIM To determine the Brinell hardness of the given test specimen
APPARATUS Brinell hardness machine test specimen Brinells Microscope
THEORY
Indentation Hardness-A number related to the area or to the depth of
the impression made by an indenter or fixed geometry under a known fixed load
This method consists of indenting the surface of the metal by a hardened steel
ball of specified diameter D mm under a given load F kgf and measuring the average
diameter d mm of the impression with the help of Brinell microscope fitted with a scaleThe Brinell hardness HB is defined as the quotient of the applied force F divided by the
spherical area of the impression
HB= Test load in kgfsurface area of indentation
=2F πD (D- D2- d2) kgmm2
PROCEDURE
1 Select the proper size of the ball and load to suit the material under test2 Clean the test specimen to be free from any dirt and defects or blemishes
3 Mount the test piece surface at right angles to the axis of the ball indenter plunger
4 Turn the platform so that the ball is lifted up
5 By shifting the lever applies the load and waits for some time
6 Release the load by shifting the lever
7 Take out the specimen and measure the diameter of indentation by means of theBrinell microscope8 Repeat the experiments at other positions of the test piece
9 Calculate the value of HB
7232019 MOFMOS LABpdf
httpslidepdfcomreaderfullmofmos-labpdf 3547
Department of ANE MOFMOS LAB MANUAL
983097
OBSERVATIONS
Test piece material = Diameter of the ballrdquo D ldquo =
Load section FD2 = Test load =
Load application time =
Least count of Brinell Microscope =
Diameter Average
Impression F D HB
S No in kg in mm Kgmm2
(d1) (d2) (d1+d2)2
PRECAUTIONS
1 The surface of the test piece should be clean
2 The testing machine should be protected throughout the test from shock or vibration
3 The test should be carried out at room temperature
4 The distance of the center of indentation from the edge of test piece should be at
least 25 times the diameter of the indentation and the distance between the center ofthe two adjacent indentations should be at least 4 times the diameter of the indentation
5 The diameter of each indentation should be measured in two directions at rightangles and the mean value readings used the purpose of determining the hardnessnumber
7232019 MOFMOS LABpdf
httpslidepdfcomreaderfullmofmos-labpdf 3647
Department of ANE
MOFMOS LAB MANUAL
983089983088
RESULT
Calculation Part
7232019 MOFMOS LABpdf
httpslidepdfcomreaderfullmofmos-labpdf 3747
Department of ANE MOFMOS LAB MANUAL
983089983089
SPRING TEST
AIM To determine the rigidity modulus of the spring
APPARATUS Spring testing machine vernier calipers spring specimen
THEORY
Closed coiled helical springs are the springs in which helix angle is very small or inother words the pitch between two adjacent turns is small A closed coiled helical springcarrying an axial load is shown in fig
As helix angle in case of close coiled helical springs are small hence the bendingeffect on the spring is ignored and we assume that the coils of close coiled helical
springs are to stand purely tensional stresses Let d=diameter ofthe spring wire
P= pitch of the helical spring N= number ofcoils R= mean radius of the spring coil
W=axial load on spring C=modulus of rigidity
τ=maximum shear stress induced in the wire θ=angle of twist in the
spring wire and
x= deflection of spring due to axial load l= length of wire
Net twisting moment on the wire T=WR
But twisting moment is also given by T= (π 16) τd3
From 1 ad 2 WR = (π 16) τd3 τ=16WR πd
3
above equation which gives the maximum shear stress induced in the wire (1) Length of one coil=2πR
Total length of the wire=2πRn (2)
Strain energy stored by the spring due to torsion
U= (τ 4C) [(π 4)d 2πRn] (3)
Work done on the spring =average load x deflection
= (12) Wx (4)
Equating 3 and 4
(12) Wx = (32W2R3n)Cd4
7232019 MOFMOS LABpdf
httpslidepdfcomreaderfullmofmos-labpdf 3847
Department of ANE MOFMOS LAB MANUAL
983089983090
x=64WR3nCd
4
Rigidity modulus of the spring
C=64WR3nxd
4
PROCEDURE
1) Consider the spring and find out itsmean coil radius R with the help ofvernier calipers
2) Find the diameter of the spring andnumber of turns
3) Fix the spring between two hooks
4) Now load is gradually applied
5) Note the deflection from thedeflection scale for different loadsapplied
6) Calculate the rigidity modulus usingabove formula
PRECAUTIONS
1) Dimensions should be measureaccurately with the help of verniercalipers
2) Deflection from the scale should benoted carefully and accurately
OBSERVATION TABLE
Sno Load applied deflection Rigidity modulus
C
Average rigidity modulus C =
RESULT
7232019 MOFMOS LABpdf
httpslidepdfcomreaderfullmofmos-labpdf 3947
Department of ANE MOFMOS LAB MANUAL
983089983091
Calculation Part
7232019 MOFMOS LABpdf
httpslidepdfcomreaderfullmofmos-labpdf 4047
Department of ANE MOFMOS LAB MANUAL
983089983092
TORSION
AIM To conduct torsion test on mild steel or cast iron specimen to find modulus of rigidity or to find angle of twist of the materials which are subjected to torsion
APPARATUS 1 A torsion test machine along with angle of twist measuring attachment
2 Standard specimen of mild steel or cast iron
3 Steel rule
4 Vernnier caliper or a micrometer
THEORY
For transmitting power through a rotating shaft it is necessary to apply a turning
force The force is applied tangentially and in the plane of transverse cross section The
torque or twisting moment may be calculated by multiplying two opposite turningmoments It is said to be in pure torsion and it will exhibit the tendency of shearing off at
every cross section which is perpendicular to the longitudinal axis
Torsion equation
Torsion equation is given by below
T IP = CθL = TR
T= maximum twisting torque (Nmm) IP =
polar moment of inertia (mm4) τ =shear
stress (Nmm2) C=modulus of rigidity (Nmm2)
θ=angle of twist in radians L=length of shaft under torsion (mm)
Assumptions made for getting torsion equation
1 The material of the shaft is uniform through out
2 The shaft circular in section remain circular after loading
3 Plane sections of shaft normal to its axis before loading remain plane after thetorque have been applied
4 The twist along the length of the shaft is uniform throughout
5 The distance between any two normal-sections remains the same after theapplication of torque
6 Maximum shear stress induced in the shaft due to application of torque does notexceed its elastic limit
7232019 MOFMOS LABpdf
httpslidepdfcomreaderfullmofmos-labpdf 4147
Department of ANE MOFMOS LAB MANUAL
983089983093
PROCEDURE
1 Select the suitable grips to suit the size of the specimen and clamp it in themachine by adjusting sliding jaw
2 Measure the diameter at about the three places and take average value
3 Choose the appropriate loading range depending upon specimen
4 Set the maximum load pointer to zero
5 Carry out straining by rotating the hand wheel or by switching on the motor
6 Load the members in suitable increments observe and record strain reading
7 Continue till failure of the specimen
8 Calculate the modulus of rigidity C by using the torsion equation
9 Plot the torque ndashtwist graph (T Vs θ)
OBSERVATIONS
Gauge length L =
Polar moment of inertia IP =
Modulus of rigidity C =TL IP θ =
SNo Twisting Moment Angle of Twist Modulus Average
Kgf Nm Degrees Radians of rigidity CNmm2
C
RESULT
7232019 MOFMOS LABpdf
httpslidepdfcomreaderfullmofmos-labpdf 4247
Department of ANE MOFMOS LAB MANUAL
983089983094
TENSILE TEST
AIM
To conduct tensile test on a mild steel specimen and determine the following
1 Limit of proportionality 2 Elastic Limit
3 Upper yield point 4 Lower yield point
5 Ultimate strength 6 Fracture strength
7 Young`s Modulus 8 Percentage elongation
9 Percentage reduction in area 10 Ductility
11 Toughness 12 True stress amp true strain
13 Malleability
APPARATUS tensile testing machine specimen steel rule vernier caliper micrometer
THEORY
The tensile test is most applied one of all mechanical tests In this test a test specimen is fixed
into grips connected to a straining device and to a load-measuring device (One end in stationary
grips and the other in movable grips) If the applied load is small enough the deformation of any
solid body is entirely elastic An elastically deformed solid will return to its original form as soon
as load is removed However if the load is too large the material can be deformed permanently
The initial part of the tension curve which represents the manner in which solid undergoes
plastic deformation is termed as plastic The stress below which the deformation is essentially
entirely elastic is known as the elastic limit of the material In some materials like mild steel a
sudden drop in load indicating both an upper and lower yield point denotes the onset of plastic
deformation However some materials do not exhibit a sharp yield point During plastic
deformation at lager extensions strain hardening cannot compensate for the decrease in section
and thus the load passes through a maximum and then begins to decrease At this stage the
ultimate strength which is defined as the ration of the load on the specimen to the original cross-section area reaches a maximum value Until this point the deformation is uniform at all the
sections of the specimen Further loading will eventually cause bdquoneck ‟ formation and rupture
follows
7232019 MOFMOS LABpdf
httpslidepdfcomreaderfullmofmos-labpdf 4347
Department of ANE MOFMOS LAB
MANUAL
983089983095
Usually a tension test is conducted at room temperature the tensile load is applied
slowly During this test either round or flat specimens may be used The load on the specimen is
applied mechanically or hydraulically depending on the type of testing machine
1 NominalEngg stress and NominalEngg strain
Original CS area = A0 (mm2)
Original gauge length = L0 (mm) Increase in gauge length = δL0
Nominal stress = PA0 (N mm2)
Nominal strain = δL0 L0
2 Limit of Proportionality Stress is proportional to strain up to this pointNormal Stress = PA PO Normal Strain = (δ LO) ALO
3 Elastic limit When the load is removed at ldquoBrdquo the specimen will go back to originalDimensions ie LO and δ AO Nominal stress = PB AO Normal Strain = (δ LO) B LO
If the specimen is loaded beyond elastic limit it will undergo permanent strainie Plastic deformation
4 Upper yield point Nominal stress = PC AO Nominal strain = (δ LO) D LO
5 Lower yield point Nominal stress = PD AO
Nominal strain = (δ LO) D LO 6 Ultimate load or maximum load point
Nominal ultimate stress = PE AO Nominal strain = (δ LO) E LO
7 Fracture Load point F
Nominal fracture stress = PF AO
Nominal strain at fracture = (δ LO) F LO
8 Young`s modulus (E) Young`s modulus (E) = StressStrain
(In the elastic region limit of proportionality = Nominal stress at ANominal strain at A 9Modulus of resilience = (Nominal stress at elastic limit)
2 2E
Area under Engg Stress - Strain diagram up to elastic limit10 Resilience = Modulus of Resilience x Volume of specimen undergoing Tensile stress
7232019 MOFMOS LABpdf
httpslidepdfcomreaderfullmofmos-labpdf 4447
Department of ANE MOFMOS LAB MANUAL
983089983096
11 Yield point ElongationElongation taking place in the specimen from C to D this istaking place without increase in stress
12 Modulus of toughnessArea under engineering stress ndash strain diagram up to fracture13 Toughness = Modulus of toughness x Volume of specimenThis indicates theamount of energy absorbed by the specimen before fracture take place
14 Ductility= (Final length at fracture ndash original length 10) x 100
15 MalleabilityIt is the ability of the material to undergo plastic deformation prior fracture under compressive loading conditions In a tensile test it is approximatedas percentage reduction in cross sectional area of the specimen Malleability =
(AO - Af )AO) x 100
True stress ndash true strain diagram
Engineering stress is calculated based on original cross sectional area (AO) But not on the actual cross sectional area at load bdquoP‟
True stress = PA = PAO x AO A
Since volume remains constant during plastic deformation we have AO LO = AL True stress = PAO x L LO
= PAO x ((LO + δLO) LO)
= P (1+e)= Nominal stress (1+ nominal strain)
True strain = Є = 1n (1+e)
These relations are valid up to ultimate load ie up to which the strain isuniform all along the gauge length
1 True Stress at upper yield point = Nominal stress at upper yield point ( 1+e O)True strain at C = 1n (1+eo)
2 True stress at ultimate load (E1)= Nominal ultimate stress ( 1+eE)True strain at ultimate load = 1n (1+eE)
3 True stress at fracture (E1) = Pf Af
Where Af is the area of cross section at fracture can be measured True
strain at fracture = 1n (Ao Af )
Area relation is taken instead of lengths because the strains are localized in theregion between ultimate load point and fracture point
4 Strain Hardening
From lower yield point onwards increase in load is required for increase instrain Thus the stress required for further deformation is more Thisphenomenon is called strain hardening
5 True ndash stress ndash true strain curve in log ndash log co ndash ordinates
When the true ndash stress and true ndash strain are plotted on log ndash log co ndash ordinates thecurve is a straight line
7232019 MOFMOS LABpdf
httpslidepdfcomreaderfullmofmos-labpdf 4547
Department of ANE MOFMOS LAB MANUAL
983120983137983143983141 983089983097 983151983142 983090983089
6 Ductile and Brittle Materials
If a material fails without much plastic deformation it can be called brittle If the percentageelongation at fracture is less than 25 the material is classified as brittle
bull Usually the metals with FCC and CPH structures are highly ductile
PROCEDURE
1 Measure the original gauge length and diameter of the specimen
2 Insert the specimen into grips of the test machine
3 Begin the load application and record load vs elongation data
4 Take the readings more frequently as yield point is approached
5 Measure elongation values
6 Continue the test till fracture occurs
7 By joining the two broken halves of the specimen together measure the final length anddiameter of specimen at fracture
RESULTS AND DISCUSSIONS
1 Plot the Engg Stress strain curve and determine the following
bull Limit of proportionality = (Nmm2)
bull Yield strength = (Nmm2)
bull Ultimate strength = (Nmm2)
bull Young`s modulus = (Nmm2)
bull Percentage elongation = bull Percentage reduction in area =
bull Fracture strength = (Nominal Engg)
bull Toughness = Area under stress ndash strain curve up to
fracture
bull Malleability
2 Plot True Stress True strain curve after calculating true ndash stress and true strain values at various
points
Estimate1) Strength coefficient
2) Strain hardening coefficient
3) Determine whether the material is ductile or brittle4) Comment on the results
7232019 MOFMOS LABpdf
httpslidepdfcomreaderfullmofmos-labpdf 4647
Department of ANE MOFMOS LAB MANUAL
983120983137983143983141 983090983088 983151983142 983090983089
SNo Load Deformation Stress Strain E
Calculation part-
7232019 MOFMOS LABpdf
httpslidepdfcomreaderfullmofmos-labpdf 4747
Department of ANE MOFMOS LAB MANUAL
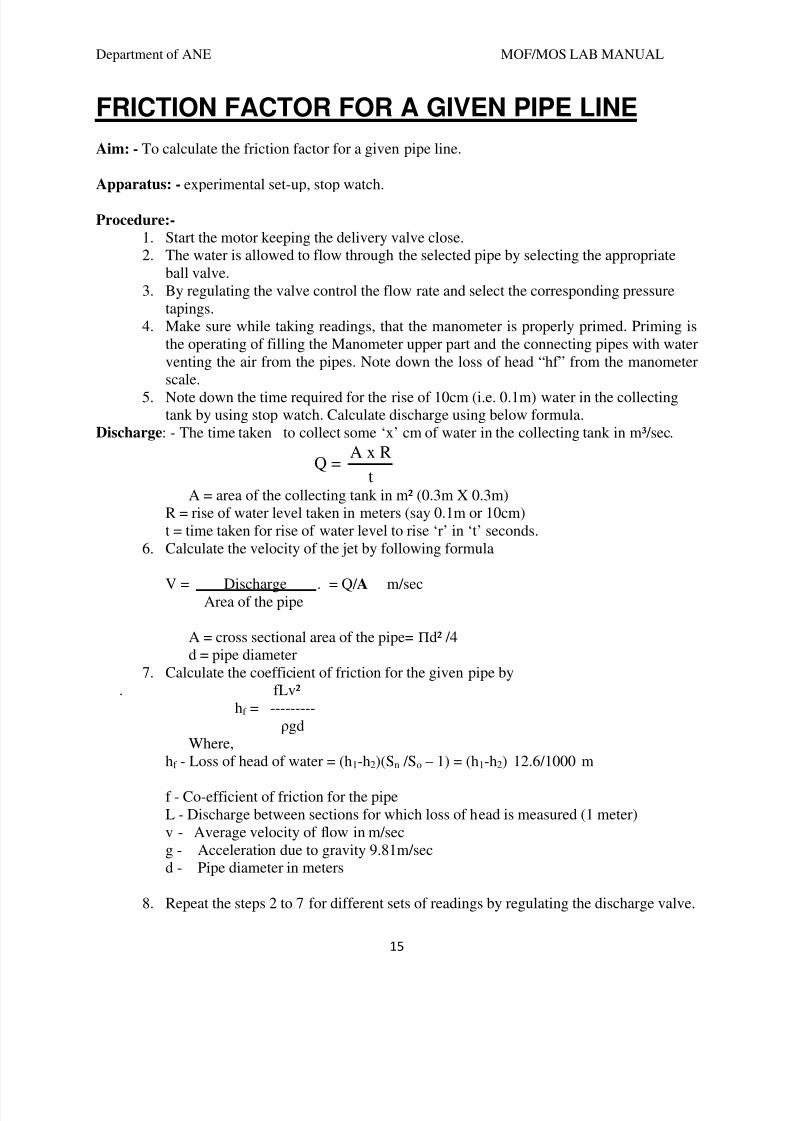
7232019 MOFMOS LABpdf
httpslidepdfcomreaderfullmofmos-labpdf 1647
Department of ANE MOFMOS LAB MANUAL
15
FRICTION FACTOR FOR A GIVEN PIPE LINE
Aim - To calculate the friction factor for a given pipe line
Apparatus - experimental set-up stop watch
Procedure-
1 Start the motor keeping the delivery valve close2
The water is allowed to flow through the selected pipe by selecting the appropriateball valve
3 By regulating the valve control the flow rate and select the corresponding pressuretapings
4
Make sure while taking readings that the manometer is properly primed Priming isthe operating of filling the Manometer upper part and the connecting pipes with waterventing the air from the pipes Note down the loss of head ldquohfrdquo from the manometerscale
5
Note down the time required for the rise of 10cm (ie 01m) water in the collectingtank by using stop watch Calculate discharge using below formula
Discharge - The time taken to collect some lsquoxrsquo cm of water in the collecting tank in msup3sec
A x RQ =
t
A = area of the collecting tank in msup2 (03m X 03m)R = rise of water level taken in meters (say 01m or 10cm)t = time taken for rise of water level to rise lsquorrsquo in lsquotrsquo seconds
6 Calculate the velocity of the jet by following formula
V = Discharge = Q A msecArea of the pipe
A = cross sectional area of the pipe=Πdsup2 4d = pipe diameter
7 Calculate the coefficient of friction for the given pipe by fLvsup2
hf = ---------ρgd
Wherehf - Loss of head of water = (h1-h2)(Sn So ndash 1) = (h1-h2) 1261000 m
f - Co-efficient of friction for the pipeL - Discharge between sections for which loss of head is measured (1 meter)v - Average velocity of flow in msecg - Acceleration due to gravity 981msecd - Pipe diameter in meters
8 Repeat the steps 2 to 7 for different sets of readings by regulating the discharge valve
7232019 MOFMOS LABpdf
httpslidepdfcomreaderfullmofmos-labpdf 1747
Department of ANE MOFMOS LAB MANUAL
16
Tabular Form
S No Oslash of pipeArea(a)
Time forrise of 10cm water
Discharge VelocityLoss ofHead
hf
Co-efficientof friction
f
Calculation-
bull Total Head H
H = (h1 + h2) x 126 m of waterWhere
126 = conversion factor from mercury to water head
bull
Discharge Q
WhereA = Area of collecting tank = 0125 msup2R = Rise in water level of the collecting tank cm
t = time for lsquoRrsquo cm rise of water sec100 = Conversion from cm to m
bull
Velocity V
msWhere Arsquo = area of the pipefitting in use
7232019 MOFMOS LABpdf
httpslidepdfcomreaderfullmofmos-labpdf 1847
Department of ANE MOFMOS LAB MANUAL
17
bull
Friction Factor(Major Losses) F
Where H = total head m of waterV = velocity mg = acceleration due to gravity 981mssup2L = Distance bw tapping = 15m
bull
Head Loss Due To Fittings (Minor Losses) K
Where H = total head m of waterV = velocity mg = acceleration due to gravity 981mssup2
Precautions
1) Do not run the pump dry2)
Clean the tanks regularly say for every 15days3)
Do not run the equipment if the voltage is below 180V4) Check all the electrical connections before running5) Before starting and after finishing the experiment the main control valve should be in
close position6) Do not attempt to alter the equipment as this may cause damage to the whole system
Results and Conclusions
7232019 MOFMOS LABpdf
httpslidepdfcomreaderfullmofmos-labpdf 1947
Department of ANE MOFMOS LAB MANUAL
18
EXPERIMENT 4
BERNOULLIrsquoS EXPERIMENTIntroduction
Bernoullirsquos Theorem gives the relationship between pressure head velocity head and thedatum Here the attempt has been made to study the relationship of the above said parametersusing venturimeter
General Description
bull The apparatus consists of a specially fabricated clear ACRYLIC Venturimeter
with necessary tappings connected to a Multibank Piezometer also made of clearACRYLIC
bull
The apparatus consists of two overhead tanks interconnected with the venturimeterwhich is placed in between the tanks
bull The overhead tanks are provided with the Head variation mechanism for conducting
the experiments at various heads
bull
Water in the sump tank is pumped using a Monobloc Centrifugal pump (Kirloskarmake) which passes through the control valve to the overhead tank
bull The height of the water in the collecting tank is measured using the acrylic
Piezometer to find the flowrate
bull The whole arrangement is mounted on an aesthetically designed sturdy frame
made of MS tubes and NOVAPAN Board with all the provisions for holding thetanks and accessories
Aim
o
The experiment is conducted too
Study of Pressure Gradient at different zoneso
Verification of Bernoullis Equationo
Comparative analysis under different flow rates
Apparatus
1) Venturimeter 2)Piezometer 3) Overhead Tank 4)Sump Tank 5) Centrifugal Pump
Procedure
1) Fill in the sump tank with clean water2)
Keep the delivery valve closed3)
Check and give necessary electrical connections to the system4) Switch on the pump amp Slowly open the delivery valve5)
Adjust the flow through the control valve of the pump6)
Allow the system to attain the steady state ie let the water pass from the secondoverhead tank to the collecting tank
7) Note down the Pressure head at different points of the venture meter on the multi-tubepiezometer (Expel if any air is the by inserting the thin pin into the piezometer openings)
8) Close the ball valve of the collecting tank and measure the time for the known rise ofwater
7232019 MOFMOS LABpdf
httpslidepdfcomreaderfullmofmos-labpdf 2047
Department of ANE MOFMOS LAB MANUAL
1983097
9) Change the flow rate and repeat the experiment
Observation
SlNo
Static Head Loss h Time for lsquoRrsquo
cm rise in waterlsquoTrsquo sec1 2 3 4 5 6 7 8 9 10
1
2
3
4
5
Calculations1
Discharge QA2
Where
A = Area of collecting tank = 0045 msup2R = Rise in water level of the collecting tank cmt = time for lsquoRrsquo cm rise of water sec100 = Conversion from cm to m
3 Pressure Head
Where
ρ = density of waterg = gravitational constanth = head measured m of water column
3 Velocity Head
WhereV = Q a a = Area at the particular section of the venturimeter msup2
4 Verification of BERNOULLIrsquoS EQUATIONBernoullirsquos Equation is given as
After findinga Pressure Head hb
Velocity headat different cross-section of the Venturimeter
7232019 MOFMOS LABpdf
httpslidepdfcomreaderfullmofmos-labpdf 2147
Department of ANE MOFMOS LAB MANUAL
20
Put the same in the above equation for different points and verify whether all the values obtainedare sameNote Consider the datum z to be constant
Precautions
bull
Do not run the pump drybull
Clean the tanks regularly say for every 15days
bull
Do not run the equipment if the voltage is below 180V
bull
Check all the electrical connections before running
bull Before starting and after finishing the experiment the main
bull Control valve should be in close position
bull Do not attempt to alter the equipment as this may cause
bull
Damage to the whole system
Result and Conclusion
7232019 MOFMOS LABpdf
httpslidepdfcomreaderfullmofmos-labpdf 2247
Department of ANE MOFMOS LAB MANUAL
21
EXPERIMENT 5
CALIBRATION OF A TRIANGULAR NOTCH
AIM -To find the coefficient of discharge of given triangular notch
THEORY-A notch is a device used for measuring the rate of flow of liquid through a smallchannel or a tank It may be defined as an opening in the side of a tank or small channel in suchthat a way that the liquid surfaces in the tank or channel is below the top edge of the opening
NOTCHES ARE CLASSIFIED AS-1 Rectangular notch2 Triangular notch3 Trapezoidal notch
4 Stepped notch
A triangular notch is preferred to a rectangular notch due to the following reasonsThe expression for discharge of triangular notch is compared to rectangular notch is simple Formeasuring low discharge a triangular notch gives more accurate results than a rectangular notchIn the case of triangular notch only H is required for the computation of dischargeA trapezoidal notch is a combination of rectangular and triangular notch and thus the dischargethrough trapezoidal notch is the sum of above notchesA stepped notch is a combination of rectangular notch and triangular notch The dischargethrough the stepped notch is equal to sum of discharges through the different rectangularnotches
DESCRIPTION- The apparatus consists of1) Measuring tank 2) Sump tank3) Supply pump set 4) Inlet and out let valve
Measuring tank Stainless steel tank of size 030305mm height with the gage glass a scalearrangement for quick and easy measurements A ball valve is provided to empty the tank and adrain is provided at the bottom of the tank to drain the waste water when the unit is not in useWater for independent circulation through the unit for experimentation and arranged within thefloor space of the main unitSump tank The sump tank is a size of 020303m stainless steel tank to store sufficient waterfor independent circulation through the unit for experimentation and arranged within the floorspace of the main unit about 060305m with a gauge glass and scale arrangement A ballvalve is provided to empty the tankSupply Pump set The pump is 2525mm size mono block with frac12 HP 2880 RPM singlephase 220volts AC supply Inlet and out let valve- These valves are used to control the flow ofwater at inlet and out let
PROCEDURE1 Allow the water to drain up to triangular notch
7232019 MOFMOS LABpdf
httpslidepdfcomreaderfullmofmos-labpdf 2347
Department of ANE MOFMOS LAB MANUAL
22
2 Note down the depth of the water when the water is coinciding with the v notch point
3 Collect water in collecting tank and close the drain valve and find the time taken for the rise ofwater up to 20cm
4 Calculate the discharge by using the above results
5 Now substituting the values in the formula for calculation of discharge for v- notch gives therequired result
Precautionsbull Do not run the pump dry
bull Clean the tanks regularly say for every 15days
bull Do not run the equipment if the voltage is below 180V
bull Check all the electrical connections before running
bull
Before starting and after finishing the experiment the main
bull
Control valve should be in close position
bull
Do not attempt to alter the equipment as this may cause
7232019 MOFMOS LABpdf
httpslidepdfcomreaderfullmofmos-labpdf 2447
Department of ANE MOFMOS LAB MANUAL
23
bull Damage to the whole system
Result and Conclusion
7232019 MOFMOS LABpdf
httpslidepdfcomreaderfullmofmos-labpdf 2547
Department of ANE MOFMOS LAB MANUAL
24
MECHANICSOF SOLIDS
LAB
7232019 MOFMOS LABpdf
httpslidepdfcomreaderfullmofmos-labpdf 2647
Department of ANE MOFMOS LAB MANUAL
25
7232019 MOFMOS LABpdf
httpslidepdfcomreaderfullmofmos-labpdf 2747
Department of ANE MOFMOS LAB MANUAL
983089
IZOD IMPACT TEST
AIM To perform the izod impact test on materials
APPARATUS Izod impact test machine test specimen vernier calipers steel rule
IMPACT STRENGTH The resistance of a material to fracture under sudden load application
MATERIALS Two types of test pieces are used for this test as given
1) Square cross-section
2) Round cross-section
THEORY The type of test specimen used for this test is a Square Cross-section
The specimen may have single two or three notches The testing machine shouldhave the following specifications The angle between top face of grips and face holding the specimen Vertical=900 the angle of tip of hammer =750plusmn10
The angle between normal to the specimen and underside face of the hammer at Striking point=100plusmn10
Speed of hammer at impact=399msecStriking energy=168N-m or Joules Angle
Of drop of pendulum =900 Effective
weight of pendulum=2179kg
Minimum value of scale graduation=2 Joules
Permissible total friction loss of corresponding energy=050
Distance from the axis of rotation of distance between the base of specimen notch andthe point of specimen hit by the hammer=22mmplusmn05mm
The longitudinal axes of the test piece shall lie in the plane of swing of the center ofgravity of the hammer The notch shall be positioned so that its in the plane of thehammer the notch shall be positioned its plane of symmetry coincides with the top faceof the grips for setting the specimen the notch impact strength I is calculated accordingto the following relation
Where I= impact strength in joulesm2
7232019 MOFMOS LABpdf
httpslidepdfcomreaderfullmofmos-labpdf 2847
Department of ANE MOFMOS LAB MANUAL
983090
PROCEDURE
1 For conducting Izod test a proper striker is to be fitted firmly to the bottom of thehammer with the help of the clamming piece
2 The latching take for izod test is to be firmly fitted to the bearing housing at the side of
the columns3 The frictional loss of the machine can be determined by free fall test raise the
hammer by hands and latch in release the hammer by operating lever the pointer will
then indicate the energy loss due to friction From this reading confirm that the friction
loss is not exceeding 05 of the initial potential energy Otherwise frictional loss has to
be added to the final reading
4 The specimen for izod test is firmly fitted in the specimen support with the help ofclamping screw and eacutelan key Care should be taken that the notch on the specimenshould face to pendulum striker
5 After ascertaining that there is no person in the range of swinging pendulum release the
pendulum to smash the specimen6 Carefully operate the pendulum brake when returning after one swing to stop the oscillations
7 Read-off position of reading pointer on dial and note indicated value
8 Remove the broken specimen by loosening the clamping screw
The notch impact strength depends largely on the shape of the specimen and the notch the
values determined with other specimens therefore may not be compared with each other
OBSERVATION TABLE
S No A(Area of cross K Impact energy I Impact Strength
section of observed
specimen)
RESULT
7232019 MOFMOS LABpdf
httpslidepdfcomreaderfullmofmos-labpdf 2947
Department of ANE MOFMOS LAB MANUAL
983091
Calculation Part
7232019 MOFMOS LABpdf
httpslidepdfcomreaderfullmofmos-labpdf 3047
Department of ANE MOFMOS LAB MANUAL
983092
ROCKWELL HARDNESS TEST
AIM To determine the Rockwell hardness of the given test specimen
APPARATUS Rockwell hardness testing machine test specimen
THEORY
Hardness-the resistance of a metal to plastic deformationagainst indentation scratching abrasion or cutting
The depth of penetration of the indenter measures the hardness of a material by this Rockwell ‟s hardness test method the depth of penetration is inversely
proportional to the hardness Both ball or diamond cone types of indenters are used inthis testThere are three scales on the machine for taking hardness readings
Scale bdquoA‟ with load 60kgf or 5888N and diamond indenter is used for performing tests on steel and shallow case hardened steel
Scale bdquoB‟ with load 100kgf or 9807 N and 1588mm dia ball indenter is used forperforming tests on soft steel malleable iron copper and aluminum alloys
Scale bdquoC‟ with load 150kgf or 1471 N and diamond indenter is used for performing testson steel hard cost steel deep case hardened steel other metals which harder
First minor load is applied to overcome the film thickness on the metal surfaceMinor load also eliminates errors in the depth of measurement due to spring of themachine frame or setting down of the specimen and table attachments
The Rockwell hardness is derived from the measurement of the depth of theimpression This method of test is suitable for finished or machined parts of simpleshapes
PROCEDURE
1 Select the load by rotating the nob and fix the suitable indenter
2 Clean the test piece and place on the special anvil or worktable of the machine
3 Turn the capstan wheel to evaluate the test specimen into contact with the indenterpoint
4 Further turn the wheel for three rotations forcing the test specimen against theindenter This will ensure the minor load has been applied5 Set the pointer on the scale dial at the appropriate position
7232019 MOFMOS LABpdf
httpslidepdfcomreaderfullmofmos-labpdf 3147
Department of ANE MOFMOS LAB MANUAL
983093
6 Push the lever to apply the major load A dash pot provided in the loading mechanismto ensure that the load is applied gradually
7 As soon as the pointer comes to rest pull the handle in the reverse direction slowlyThis releases the major but not the minor load The pointer will now rotate in the reversedirection
8 The Rockwell hardness can read off the scale dial on the appropriate scale after thepointer comes to rest
OBSERVATIONS
Material of the specimen =
Thickness of test specimen =
Hardness scale used =
Test Material Rockwell Scale of weights Rockwell number Average
no Rockwell
no
Scale weight indent 1 2 3
PRECAUTIONS
1 For testing cylindrical test specimens use V-type platform
2 Calibrate the machine occasionally by using standard test blocks
3 For thin metal prices place another sufficiently thick metal piece between the testspecimen and the platform to avoid any damage which may likely occur to the platform
4 After applying major load wait for some time to allow the needle to come to restThe waiting time may vary from 2 to 8 seconds
7232019 MOFMOS LABpdf
httpslidepdfcomreaderfullmofmos-labpdf 3247
Department of ANE MOFMOS LAB
MANUAL
983094
5 The surface of the test piece should be smooth and even and free from oxidescale and foreign matter6 Test specimen should not be subjected to any heating of cold working
7 The distance between the centers of two adjacent indentation should be at least 4
Times the diameter of the indentation and the distance from the center of any indentation tothe edge of the test piece should be at least 25 times the diameter of the indentation
RESULT
7232019 MOFMOS LABpdf
httpslidepdfcomreaderfullmofmos-labpdf 3347
Department of ANE MOFMOS LAB MANUAL
983095
Calculation Part
7232019 MOFMOS LABpdf
httpslidepdfcomreaderfullmofmos-labpdf 3447
Department of ANE MOFMOS LAB MANUAL
983096
BRINELLrsquoS HARDNESS TEST
AIM To determine the Brinell hardness of the given test specimen
APPARATUS Brinell hardness machine test specimen Brinells Microscope
THEORY
Indentation Hardness-A number related to the area or to the depth of
the impression made by an indenter or fixed geometry under a known fixed load
This method consists of indenting the surface of the metal by a hardened steel
ball of specified diameter D mm under a given load F kgf and measuring the average
diameter d mm of the impression with the help of Brinell microscope fitted with a scaleThe Brinell hardness HB is defined as the quotient of the applied force F divided by the
spherical area of the impression
HB= Test load in kgfsurface area of indentation
=2F πD (D- D2- d2) kgmm2
PROCEDURE
1 Select the proper size of the ball and load to suit the material under test2 Clean the test specimen to be free from any dirt and defects or blemishes
3 Mount the test piece surface at right angles to the axis of the ball indenter plunger
4 Turn the platform so that the ball is lifted up
5 By shifting the lever applies the load and waits for some time
6 Release the load by shifting the lever
7 Take out the specimen and measure the diameter of indentation by means of theBrinell microscope8 Repeat the experiments at other positions of the test piece
9 Calculate the value of HB
7232019 MOFMOS LABpdf
httpslidepdfcomreaderfullmofmos-labpdf 3547
Department of ANE MOFMOS LAB MANUAL
983097
OBSERVATIONS
Test piece material = Diameter of the ballrdquo D ldquo =
Load section FD2 = Test load =
Load application time =
Least count of Brinell Microscope =
Diameter Average
Impression F D HB
S No in kg in mm Kgmm2
(d1) (d2) (d1+d2)2
PRECAUTIONS
1 The surface of the test piece should be clean
2 The testing machine should be protected throughout the test from shock or vibration
3 The test should be carried out at room temperature
4 The distance of the center of indentation from the edge of test piece should be at
least 25 times the diameter of the indentation and the distance between the center ofthe two adjacent indentations should be at least 4 times the diameter of the indentation
5 The diameter of each indentation should be measured in two directions at rightangles and the mean value readings used the purpose of determining the hardnessnumber
7232019 MOFMOS LABpdf
httpslidepdfcomreaderfullmofmos-labpdf 3647
Department of ANE
MOFMOS LAB MANUAL
983089983088
RESULT
Calculation Part
7232019 MOFMOS LABpdf
httpslidepdfcomreaderfullmofmos-labpdf 3747
Department of ANE MOFMOS LAB MANUAL
983089983089
SPRING TEST
AIM To determine the rigidity modulus of the spring
APPARATUS Spring testing machine vernier calipers spring specimen
THEORY
Closed coiled helical springs are the springs in which helix angle is very small or inother words the pitch between two adjacent turns is small A closed coiled helical springcarrying an axial load is shown in fig
As helix angle in case of close coiled helical springs are small hence the bendingeffect on the spring is ignored and we assume that the coils of close coiled helical
springs are to stand purely tensional stresses Let d=diameter ofthe spring wire
P= pitch of the helical spring N= number ofcoils R= mean radius of the spring coil
W=axial load on spring C=modulus of rigidity
τ=maximum shear stress induced in the wire θ=angle of twist in the
spring wire and
x= deflection of spring due to axial load l= length of wire
Net twisting moment on the wire T=WR
But twisting moment is also given by T= (π 16) τd3
From 1 ad 2 WR = (π 16) τd3 τ=16WR πd
3
above equation which gives the maximum shear stress induced in the wire (1) Length of one coil=2πR
Total length of the wire=2πRn (2)
Strain energy stored by the spring due to torsion
U= (τ 4C) [(π 4)d 2πRn] (3)
Work done on the spring =average load x deflection
= (12) Wx (4)
Equating 3 and 4
(12) Wx = (32W2R3n)Cd4
7232019 MOFMOS LABpdf
httpslidepdfcomreaderfullmofmos-labpdf 3847
Department of ANE MOFMOS LAB MANUAL
983089983090
x=64WR3nCd
4
Rigidity modulus of the spring
C=64WR3nxd
4
PROCEDURE
1) Consider the spring and find out itsmean coil radius R with the help ofvernier calipers
2) Find the diameter of the spring andnumber of turns
3) Fix the spring between two hooks
4) Now load is gradually applied
5) Note the deflection from thedeflection scale for different loadsapplied
6) Calculate the rigidity modulus usingabove formula
PRECAUTIONS
1) Dimensions should be measureaccurately with the help of verniercalipers
2) Deflection from the scale should benoted carefully and accurately
OBSERVATION TABLE
Sno Load applied deflection Rigidity modulus
C
Average rigidity modulus C =
RESULT
7232019 MOFMOS LABpdf
httpslidepdfcomreaderfullmofmos-labpdf 3947
Department of ANE MOFMOS LAB MANUAL
983089983091
Calculation Part
7232019 MOFMOS LABpdf
httpslidepdfcomreaderfullmofmos-labpdf 4047
Department of ANE MOFMOS LAB MANUAL
983089983092
TORSION
AIM To conduct torsion test on mild steel or cast iron specimen to find modulus of rigidity or to find angle of twist of the materials which are subjected to torsion
APPARATUS 1 A torsion test machine along with angle of twist measuring attachment
2 Standard specimen of mild steel or cast iron
3 Steel rule
4 Vernnier caliper or a micrometer
THEORY
For transmitting power through a rotating shaft it is necessary to apply a turning
force The force is applied tangentially and in the plane of transverse cross section The
torque or twisting moment may be calculated by multiplying two opposite turningmoments It is said to be in pure torsion and it will exhibit the tendency of shearing off at
every cross section which is perpendicular to the longitudinal axis
Torsion equation
Torsion equation is given by below
T IP = CθL = TR
T= maximum twisting torque (Nmm) IP =
polar moment of inertia (mm4) τ =shear
stress (Nmm2) C=modulus of rigidity (Nmm2)
θ=angle of twist in radians L=length of shaft under torsion (mm)
Assumptions made for getting torsion equation
1 The material of the shaft is uniform through out
2 The shaft circular in section remain circular after loading
3 Plane sections of shaft normal to its axis before loading remain plane after thetorque have been applied
4 The twist along the length of the shaft is uniform throughout
5 The distance between any two normal-sections remains the same after theapplication of torque
6 Maximum shear stress induced in the shaft due to application of torque does notexceed its elastic limit
7232019 MOFMOS LABpdf
httpslidepdfcomreaderfullmofmos-labpdf 4147
Department of ANE MOFMOS LAB MANUAL
983089983093
PROCEDURE
1 Select the suitable grips to suit the size of the specimen and clamp it in themachine by adjusting sliding jaw
2 Measure the diameter at about the three places and take average value
3 Choose the appropriate loading range depending upon specimen
4 Set the maximum load pointer to zero
5 Carry out straining by rotating the hand wheel or by switching on the motor
6 Load the members in suitable increments observe and record strain reading
7 Continue till failure of the specimen
8 Calculate the modulus of rigidity C by using the torsion equation
9 Plot the torque ndashtwist graph (T Vs θ)
OBSERVATIONS
Gauge length L =
Polar moment of inertia IP =
Modulus of rigidity C =TL IP θ =
SNo Twisting Moment Angle of Twist Modulus Average
Kgf Nm Degrees Radians of rigidity CNmm2
C
RESULT
7232019 MOFMOS LABpdf
httpslidepdfcomreaderfullmofmos-labpdf 4247
Department of ANE MOFMOS LAB MANUAL
983089983094
TENSILE TEST
AIM
To conduct tensile test on a mild steel specimen and determine the following
1 Limit of proportionality 2 Elastic Limit
3 Upper yield point 4 Lower yield point
5 Ultimate strength 6 Fracture strength
7 Young`s Modulus 8 Percentage elongation
9 Percentage reduction in area 10 Ductility
11 Toughness 12 True stress amp true strain
13 Malleability
APPARATUS tensile testing machine specimen steel rule vernier caliper micrometer
THEORY
The tensile test is most applied one of all mechanical tests In this test a test specimen is fixed
into grips connected to a straining device and to a load-measuring device (One end in stationary
grips and the other in movable grips) If the applied load is small enough the deformation of any
solid body is entirely elastic An elastically deformed solid will return to its original form as soon
as load is removed However if the load is too large the material can be deformed permanently
The initial part of the tension curve which represents the manner in which solid undergoes
plastic deformation is termed as plastic The stress below which the deformation is essentially
entirely elastic is known as the elastic limit of the material In some materials like mild steel a
sudden drop in load indicating both an upper and lower yield point denotes the onset of plastic
deformation However some materials do not exhibit a sharp yield point During plastic
deformation at lager extensions strain hardening cannot compensate for the decrease in section
and thus the load passes through a maximum and then begins to decrease At this stage the
ultimate strength which is defined as the ration of the load on the specimen to the original cross-section area reaches a maximum value Until this point the deformation is uniform at all the
sections of the specimen Further loading will eventually cause bdquoneck ‟ formation and rupture
follows
7232019 MOFMOS LABpdf
httpslidepdfcomreaderfullmofmos-labpdf 4347
Department of ANE MOFMOS LAB
MANUAL
983089983095
Usually a tension test is conducted at room temperature the tensile load is applied
slowly During this test either round or flat specimens may be used The load on the specimen is
applied mechanically or hydraulically depending on the type of testing machine
1 NominalEngg stress and NominalEngg strain
Original CS area = A0 (mm2)
Original gauge length = L0 (mm) Increase in gauge length = δL0
Nominal stress = PA0 (N mm2)
Nominal strain = δL0 L0
2 Limit of Proportionality Stress is proportional to strain up to this pointNormal Stress = PA PO Normal Strain = (δ LO) ALO
3 Elastic limit When the load is removed at ldquoBrdquo the specimen will go back to originalDimensions ie LO and δ AO Nominal stress = PB AO Normal Strain = (δ LO) B LO
If the specimen is loaded beyond elastic limit it will undergo permanent strainie Plastic deformation
4 Upper yield point Nominal stress = PC AO Nominal strain = (δ LO) D LO
5 Lower yield point Nominal stress = PD AO
Nominal strain = (δ LO) D LO 6 Ultimate load or maximum load point
Nominal ultimate stress = PE AO Nominal strain = (δ LO) E LO
7 Fracture Load point F
Nominal fracture stress = PF AO
Nominal strain at fracture = (δ LO) F LO
8 Young`s modulus (E) Young`s modulus (E) = StressStrain
(In the elastic region limit of proportionality = Nominal stress at ANominal strain at A 9Modulus of resilience = (Nominal stress at elastic limit)
2 2E
Area under Engg Stress - Strain diagram up to elastic limit10 Resilience = Modulus of Resilience x Volume of specimen undergoing Tensile stress
7232019 MOFMOS LABpdf
httpslidepdfcomreaderfullmofmos-labpdf 4447
Department of ANE MOFMOS LAB MANUAL
983089983096
11 Yield point ElongationElongation taking place in the specimen from C to D this istaking place without increase in stress
12 Modulus of toughnessArea under engineering stress ndash strain diagram up to fracture13 Toughness = Modulus of toughness x Volume of specimenThis indicates theamount of energy absorbed by the specimen before fracture take place
14 Ductility= (Final length at fracture ndash original length 10) x 100
15 MalleabilityIt is the ability of the material to undergo plastic deformation prior fracture under compressive loading conditions In a tensile test it is approximatedas percentage reduction in cross sectional area of the specimen Malleability =
(AO - Af )AO) x 100
True stress ndash true strain diagram
Engineering stress is calculated based on original cross sectional area (AO) But not on the actual cross sectional area at load bdquoP‟
True stress = PA = PAO x AO A
Since volume remains constant during plastic deformation we have AO LO = AL True stress = PAO x L LO
= PAO x ((LO + δLO) LO)
= P (1+e)= Nominal stress (1+ nominal strain)
True strain = Є = 1n (1+e)
These relations are valid up to ultimate load ie up to which the strain isuniform all along the gauge length
1 True Stress at upper yield point = Nominal stress at upper yield point ( 1+e O)True strain at C = 1n (1+eo)
2 True stress at ultimate load (E1)= Nominal ultimate stress ( 1+eE)True strain at ultimate load = 1n (1+eE)
3 True stress at fracture (E1) = Pf Af
Where Af is the area of cross section at fracture can be measured True
strain at fracture = 1n (Ao Af )
Area relation is taken instead of lengths because the strains are localized in theregion between ultimate load point and fracture point
4 Strain Hardening
From lower yield point onwards increase in load is required for increase instrain Thus the stress required for further deformation is more Thisphenomenon is called strain hardening
5 True ndash stress ndash true strain curve in log ndash log co ndash ordinates
When the true ndash stress and true ndash strain are plotted on log ndash log co ndash ordinates thecurve is a straight line
7232019 MOFMOS LABpdf
httpslidepdfcomreaderfullmofmos-labpdf 4547
Department of ANE MOFMOS LAB MANUAL
983120983137983143983141 983089983097 983151983142 983090983089
6 Ductile and Brittle Materials
If a material fails without much plastic deformation it can be called brittle If the percentageelongation at fracture is less than 25 the material is classified as brittle
bull Usually the metals with FCC and CPH structures are highly ductile
PROCEDURE
1 Measure the original gauge length and diameter of the specimen
2 Insert the specimen into grips of the test machine
3 Begin the load application and record load vs elongation data
4 Take the readings more frequently as yield point is approached
5 Measure elongation values
6 Continue the test till fracture occurs
7 By joining the two broken halves of the specimen together measure the final length anddiameter of specimen at fracture
RESULTS AND DISCUSSIONS
1 Plot the Engg Stress strain curve and determine the following
bull Limit of proportionality = (Nmm2)
bull Yield strength = (Nmm2)
bull Ultimate strength = (Nmm2)
bull Young`s modulus = (Nmm2)
bull Percentage elongation = bull Percentage reduction in area =
bull Fracture strength = (Nominal Engg)
bull Toughness = Area under stress ndash strain curve up to
fracture
bull Malleability
2 Plot True Stress True strain curve after calculating true ndash stress and true strain values at various
points
Estimate1) Strength coefficient
2) Strain hardening coefficient
3) Determine whether the material is ductile or brittle4) Comment on the results
7232019 MOFMOS LABpdf
httpslidepdfcomreaderfullmofmos-labpdf 4647
Department of ANE MOFMOS LAB MANUAL
983120983137983143983141 983090983088 983151983142 983090983089
SNo Load Deformation Stress Strain E
Calculation part-
7232019 MOFMOS LABpdf
httpslidepdfcomreaderfullmofmos-labpdf 4747
Department of ANE MOFMOS LAB MANUAL
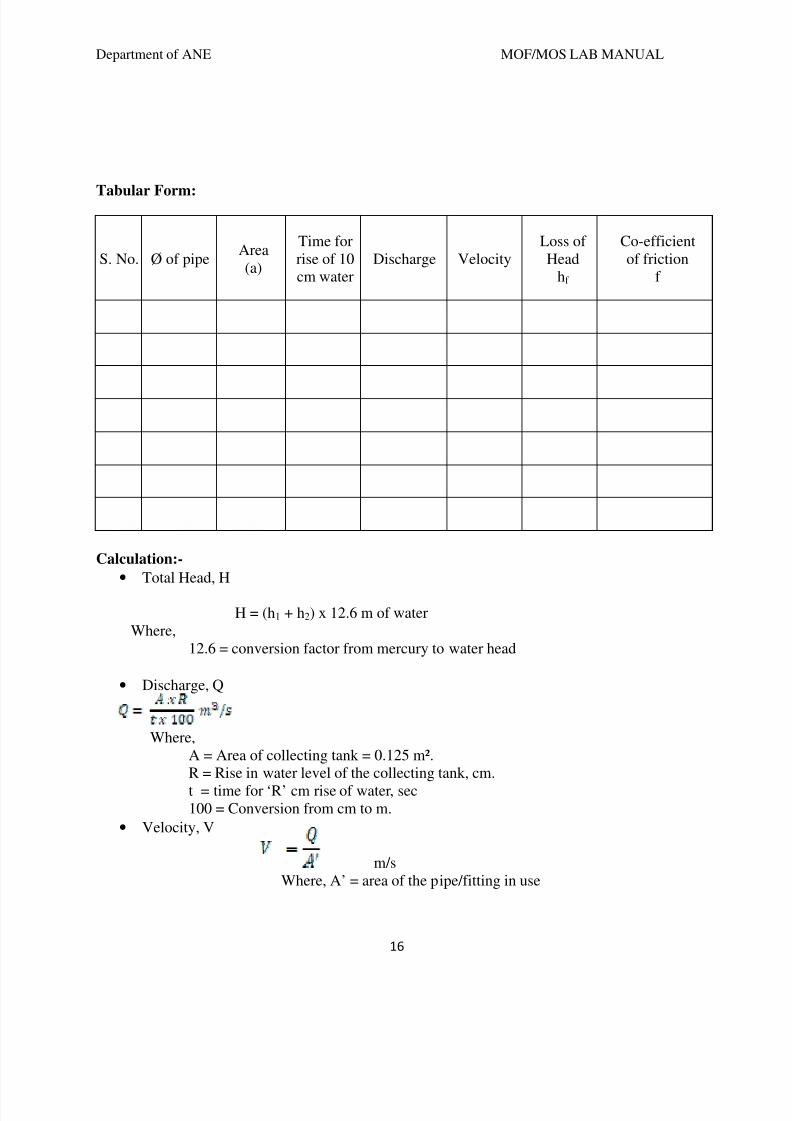
7232019 MOFMOS LABpdf
httpslidepdfcomreaderfullmofmos-labpdf 1747
Department of ANE MOFMOS LAB MANUAL
16
Tabular Form
S No Oslash of pipeArea(a)
Time forrise of 10cm water
Discharge VelocityLoss ofHead
hf
Co-efficientof friction
f
Calculation-
bull Total Head H
H = (h1 + h2) x 126 m of waterWhere
126 = conversion factor from mercury to water head
bull
Discharge Q
WhereA = Area of collecting tank = 0125 msup2R = Rise in water level of the collecting tank cm
t = time for lsquoRrsquo cm rise of water sec100 = Conversion from cm to m
bull
Velocity V
msWhere Arsquo = area of the pipefitting in use
7232019 MOFMOS LABpdf
httpslidepdfcomreaderfullmofmos-labpdf 1847
Department of ANE MOFMOS LAB MANUAL
17
bull
Friction Factor(Major Losses) F
Where H = total head m of waterV = velocity mg = acceleration due to gravity 981mssup2L = Distance bw tapping = 15m
bull
Head Loss Due To Fittings (Minor Losses) K
Where H = total head m of waterV = velocity mg = acceleration due to gravity 981mssup2
Precautions
1) Do not run the pump dry2)
Clean the tanks regularly say for every 15days3)
Do not run the equipment if the voltage is below 180V4) Check all the electrical connections before running5) Before starting and after finishing the experiment the main control valve should be in
close position6) Do not attempt to alter the equipment as this may cause damage to the whole system
Results and Conclusions
7232019 MOFMOS LABpdf
httpslidepdfcomreaderfullmofmos-labpdf 1947
Department of ANE MOFMOS LAB MANUAL
18
EXPERIMENT 4
BERNOULLIrsquoS EXPERIMENTIntroduction
Bernoullirsquos Theorem gives the relationship between pressure head velocity head and thedatum Here the attempt has been made to study the relationship of the above said parametersusing venturimeter
General Description
bull The apparatus consists of a specially fabricated clear ACRYLIC Venturimeter
with necessary tappings connected to a Multibank Piezometer also made of clearACRYLIC
bull
The apparatus consists of two overhead tanks interconnected with the venturimeterwhich is placed in between the tanks
bull The overhead tanks are provided with the Head variation mechanism for conducting
the experiments at various heads
bull
Water in the sump tank is pumped using a Monobloc Centrifugal pump (Kirloskarmake) which passes through the control valve to the overhead tank
bull The height of the water in the collecting tank is measured using the acrylic
Piezometer to find the flowrate
bull The whole arrangement is mounted on an aesthetically designed sturdy frame
made of MS tubes and NOVAPAN Board with all the provisions for holding thetanks and accessories
Aim
o
The experiment is conducted too
Study of Pressure Gradient at different zoneso
Verification of Bernoullis Equationo
Comparative analysis under different flow rates
Apparatus
1) Venturimeter 2)Piezometer 3) Overhead Tank 4)Sump Tank 5) Centrifugal Pump
Procedure
1) Fill in the sump tank with clean water2)
Keep the delivery valve closed3)
Check and give necessary electrical connections to the system4) Switch on the pump amp Slowly open the delivery valve5)
Adjust the flow through the control valve of the pump6)
Allow the system to attain the steady state ie let the water pass from the secondoverhead tank to the collecting tank
7) Note down the Pressure head at different points of the venture meter on the multi-tubepiezometer (Expel if any air is the by inserting the thin pin into the piezometer openings)
8) Close the ball valve of the collecting tank and measure the time for the known rise ofwater
7232019 MOFMOS LABpdf
httpslidepdfcomreaderfullmofmos-labpdf 2047
Department of ANE MOFMOS LAB MANUAL
1983097
9) Change the flow rate and repeat the experiment
Observation
SlNo
Static Head Loss h Time for lsquoRrsquo
cm rise in waterlsquoTrsquo sec1 2 3 4 5 6 7 8 9 10
1
2
3
4
5
Calculations1
Discharge QA2
Where
A = Area of collecting tank = 0045 msup2R = Rise in water level of the collecting tank cmt = time for lsquoRrsquo cm rise of water sec100 = Conversion from cm to m
3 Pressure Head
Where
ρ = density of waterg = gravitational constanth = head measured m of water column
3 Velocity Head
WhereV = Q a a = Area at the particular section of the venturimeter msup2
4 Verification of BERNOULLIrsquoS EQUATIONBernoullirsquos Equation is given as
After findinga Pressure Head hb
Velocity headat different cross-section of the Venturimeter
7232019 MOFMOS LABpdf
httpslidepdfcomreaderfullmofmos-labpdf 2147
Department of ANE MOFMOS LAB MANUAL
20
Put the same in the above equation for different points and verify whether all the values obtainedare sameNote Consider the datum z to be constant
Precautions
bull
Do not run the pump drybull
Clean the tanks regularly say for every 15days
bull
Do not run the equipment if the voltage is below 180V
bull
Check all the electrical connections before running
bull Before starting and after finishing the experiment the main
bull Control valve should be in close position
bull Do not attempt to alter the equipment as this may cause
bull
Damage to the whole system
Result and Conclusion
7232019 MOFMOS LABpdf
httpslidepdfcomreaderfullmofmos-labpdf 2247
Department of ANE MOFMOS LAB MANUAL
21
EXPERIMENT 5
CALIBRATION OF A TRIANGULAR NOTCH
AIM -To find the coefficient of discharge of given triangular notch
THEORY-A notch is a device used for measuring the rate of flow of liquid through a smallchannel or a tank It may be defined as an opening in the side of a tank or small channel in suchthat a way that the liquid surfaces in the tank or channel is below the top edge of the opening
NOTCHES ARE CLASSIFIED AS-1 Rectangular notch2 Triangular notch3 Trapezoidal notch
4 Stepped notch
A triangular notch is preferred to a rectangular notch due to the following reasonsThe expression for discharge of triangular notch is compared to rectangular notch is simple Formeasuring low discharge a triangular notch gives more accurate results than a rectangular notchIn the case of triangular notch only H is required for the computation of dischargeA trapezoidal notch is a combination of rectangular and triangular notch and thus the dischargethrough trapezoidal notch is the sum of above notchesA stepped notch is a combination of rectangular notch and triangular notch The dischargethrough the stepped notch is equal to sum of discharges through the different rectangularnotches
DESCRIPTION- The apparatus consists of1) Measuring tank 2) Sump tank3) Supply pump set 4) Inlet and out let valve
Measuring tank Stainless steel tank of size 030305mm height with the gage glass a scalearrangement for quick and easy measurements A ball valve is provided to empty the tank and adrain is provided at the bottom of the tank to drain the waste water when the unit is not in useWater for independent circulation through the unit for experimentation and arranged within thefloor space of the main unitSump tank The sump tank is a size of 020303m stainless steel tank to store sufficient waterfor independent circulation through the unit for experimentation and arranged within the floorspace of the main unit about 060305m with a gauge glass and scale arrangement A ballvalve is provided to empty the tankSupply Pump set The pump is 2525mm size mono block with frac12 HP 2880 RPM singlephase 220volts AC supply Inlet and out let valve- These valves are used to control the flow ofwater at inlet and out let
PROCEDURE1 Allow the water to drain up to triangular notch
7232019 MOFMOS LABpdf
httpslidepdfcomreaderfullmofmos-labpdf 2347
Department of ANE MOFMOS LAB MANUAL
22
2 Note down the depth of the water when the water is coinciding with the v notch point
3 Collect water in collecting tank and close the drain valve and find the time taken for the rise ofwater up to 20cm
4 Calculate the discharge by using the above results
5 Now substituting the values in the formula for calculation of discharge for v- notch gives therequired result
Precautionsbull Do not run the pump dry
bull Clean the tanks regularly say for every 15days
bull Do not run the equipment if the voltage is below 180V
bull Check all the electrical connections before running
bull
Before starting and after finishing the experiment the main
bull
Control valve should be in close position
bull
Do not attempt to alter the equipment as this may cause
7232019 MOFMOS LABpdf
httpslidepdfcomreaderfullmofmos-labpdf 2447
Department of ANE MOFMOS LAB MANUAL
23
bull Damage to the whole system
Result and Conclusion
7232019 MOFMOS LABpdf
httpslidepdfcomreaderfullmofmos-labpdf 2547
Department of ANE MOFMOS LAB MANUAL
24
MECHANICSOF SOLIDS
LAB
7232019 MOFMOS LABpdf
httpslidepdfcomreaderfullmofmos-labpdf 2647
Department of ANE MOFMOS LAB MANUAL
25
7232019 MOFMOS LABpdf
httpslidepdfcomreaderfullmofmos-labpdf 2747
Department of ANE MOFMOS LAB MANUAL
983089
IZOD IMPACT TEST
AIM To perform the izod impact test on materials
APPARATUS Izod impact test machine test specimen vernier calipers steel rule
IMPACT STRENGTH The resistance of a material to fracture under sudden load application
MATERIALS Two types of test pieces are used for this test as given
1) Square cross-section
2) Round cross-section
THEORY The type of test specimen used for this test is a Square Cross-section
The specimen may have single two or three notches The testing machine shouldhave the following specifications The angle between top face of grips and face holding the specimen Vertical=900 the angle of tip of hammer =750plusmn10
The angle between normal to the specimen and underside face of the hammer at Striking point=100plusmn10
Speed of hammer at impact=399msecStriking energy=168N-m or Joules Angle
Of drop of pendulum =900 Effective
weight of pendulum=2179kg
Minimum value of scale graduation=2 Joules
Permissible total friction loss of corresponding energy=050
Distance from the axis of rotation of distance between the base of specimen notch andthe point of specimen hit by the hammer=22mmplusmn05mm
The longitudinal axes of the test piece shall lie in the plane of swing of the center ofgravity of the hammer The notch shall be positioned so that its in the plane of thehammer the notch shall be positioned its plane of symmetry coincides with the top faceof the grips for setting the specimen the notch impact strength I is calculated accordingto the following relation
Where I= impact strength in joulesm2
7232019 MOFMOS LABpdf
httpslidepdfcomreaderfullmofmos-labpdf 2847
Department of ANE MOFMOS LAB MANUAL
983090
PROCEDURE
1 For conducting Izod test a proper striker is to be fitted firmly to the bottom of thehammer with the help of the clamming piece
2 The latching take for izod test is to be firmly fitted to the bearing housing at the side of
the columns3 The frictional loss of the machine can be determined by free fall test raise the
hammer by hands and latch in release the hammer by operating lever the pointer will
then indicate the energy loss due to friction From this reading confirm that the friction
loss is not exceeding 05 of the initial potential energy Otherwise frictional loss has to
be added to the final reading
4 The specimen for izod test is firmly fitted in the specimen support with the help ofclamping screw and eacutelan key Care should be taken that the notch on the specimenshould face to pendulum striker
5 After ascertaining that there is no person in the range of swinging pendulum release the
pendulum to smash the specimen6 Carefully operate the pendulum brake when returning after one swing to stop the oscillations
7 Read-off position of reading pointer on dial and note indicated value
8 Remove the broken specimen by loosening the clamping screw
The notch impact strength depends largely on the shape of the specimen and the notch the
values determined with other specimens therefore may not be compared with each other
OBSERVATION TABLE
S No A(Area of cross K Impact energy I Impact Strength
section of observed
specimen)
RESULT
7232019 MOFMOS LABpdf
httpslidepdfcomreaderfullmofmos-labpdf 2947
Department of ANE MOFMOS LAB MANUAL
983091
Calculation Part
7232019 MOFMOS LABpdf
httpslidepdfcomreaderfullmofmos-labpdf 3047
Department of ANE MOFMOS LAB MANUAL
983092
ROCKWELL HARDNESS TEST
AIM To determine the Rockwell hardness of the given test specimen
APPARATUS Rockwell hardness testing machine test specimen
THEORY
Hardness-the resistance of a metal to plastic deformationagainst indentation scratching abrasion or cutting
The depth of penetration of the indenter measures the hardness of a material by this Rockwell ‟s hardness test method the depth of penetration is inversely
proportional to the hardness Both ball or diamond cone types of indenters are used inthis testThere are three scales on the machine for taking hardness readings
Scale bdquoA‟ with load 60kgf or 5888N and diamond indenter is used for performing tests on steel and shallow case hardened steel
Scale bdquoB‟ with load 100kgf or 9807 N and 1588mm dia ball indenter is used forperforming tests on soft steel malleable iron copper and aluminum alloys
Scale bdquoC‟ with load 150kgf or 1471 N and diamond indenter is used for performing testson steel hard cost steel deep case hardened steel other metals which harder
First minor load is applied to overcome the film thickness on the metal surfaceMinor load also eliminates errors in the depth of measurement due to spring of themachine frame or setting down of the specimen and table attachments
The Rockwell hardness is derived from the measurement of the depth of theimpression This method of test is suitable for finished or machined parts of simpleshapes
PROCEDURE
1 Select the load by rotating the nob and fix the suitable indenter
2 Clean the test piece and place on the special anvil or worktable of the machine
3 Turn the capstan wheel to evaluate the test specimen into contact with the indenterpoint
4 Further turn the wheel for three rotations forcing the test specimen against theindenter This will ensure the minor load has been applied5 Set the pointer on the scale dial at the appropriate position
7232019 MOFMOS LABpdf
httpslidepdfcomreaderfullmofmos-labpdf 3147
Department of ANE MOFMOS LAB MANUAL
983093
6 Push the lever to apply the major load A dash pot provided in the loading mechanismto ensure that the load is applied gradually
7 As soon as the pointer comes to rest pull the handle in the reverse direction slowlyThis releases the major but not the minor load The pointer will now rotate in the reversedirection
8 The Rockwell hardness can read off the scale dial on the appropriate scale after thepointer comes to rest
OBSERVATIONS
Material of the specimen =
Thickness of test specimen =
Hardness scale used =
Test Material Rockwell Scale of weights Rockwell number Average
no Rockwell
no
Scale weight indent 1 2 3
PRECAUTIONS
1 For testing cylindrical test specimens use V-type platform
2 Calibrate the machine occasionally by using standard test blocks
3 For thin metal prices place another sufficiently thick metal piece between the testspecimen and the platform to avoid any damage which may likely occur to the platform
4 After applying major load wait for some time to allow the needle to come to restThe waiting time may vary from 2 to 8 seconds
7232019 MOFMOS LABpdf
httpslidepdfcomreaderfullmofmos-labpdf 3247
Department of ANE MOFMOS LAB
MANUAL
983094
5 The surface of the test piece should be smooth and even and free from oxidescale and foreign matter6 Test specimen should not be subjected to any heating of cold working
7 The distance between the centers of two adjacent indentation should be at least 4
Times the diameter of the indentation and the distance from the center of any indentation tothe edge of the test piece should be at least 25 times the diameter of the indentation
RESULT
7232019 MOFMOS LABpdf
httpslidepdfcomreaderfullmofmos-labpdf 3347
Department of ANE MOFMOS LAB MANUAL
983095
Calculation Part
7232019 MOFMOS LABpdf
httpslidepdfcomreaderfullmofmos-labpdf 3447
Department of ANE MOFMOS LAB MANUAL
983096
BRINELLrsquoS HARDNESS TEST
AIM To determine the Brinell hardness of the given test specimen
APPARATUS Brinell hardness machine test specimen Brinells Microscope
THEORY
Indentation Hardness-A number related to the area or to the depth of
the impression made by an indenter or fixed geometry under a known fixed load
This method consists of indenting the surface of the metal by a hardened steel
ball of specified diameter D mm under a given load F kgf and measuring the average
diameter d mm of the impression with the help of Brinell microscope fitted with a scaleThe Brinell hardness HB is defined as the quotient of the applied force F divided by the
spherical area of the impression
HB= Test load in kgfsurface area of indentation
=2F πD (D- D2- d2) kgmm2
PROCEDURE
1 Select the proper size of the ball and load to suit the material under test2 Clean the test specimen to be free from any dirt and defects or blemishes
3 Mount the test piece surface at right angles to the axis of the ball indenter plunger
4 Turn the platform so that the ball is lifted up
5 By shifting the lever applies the load and waits for some time
6 Release the load by shifting the lever
7 Take out the specimen and measure the diameter of indentation by means of theBrinell microscope8 Repeat the experiments at other positions of the test piece
9 Calculate the value of HB
7232019 MOFMOS LABpdf
httpslidepdfcomreaderfullmofmos-labpdf 3547
Department of ANE MOFMOS LAB MANUAL
983097
OBSERVATIONS
Test piece material = Diameter of the ballrdquo D ldquo =
Load section FD2 = Test load =
Load application time =
Least count of Brinell Microscope =
Diameter Average
Impression F D HB
S No in kg in mm Kgmm2
(d1) (d2) (d1+d2)2
PRECAUTIONS
1 The surface of the test piece should be clean
2 The testing machine should be protected throughout the test from shock or vibration
3 The test should be carried out at room temperature
4 The distance of the center of indentation from the edge of test piece should be at
least 25 times the diameter of the indentation and the distance between the center ofthe two adjacent indentations should be at least 4 times the diameter of the indentation
5 The diameter of each indentation should be measured in two directions at rightangles and the mean value readings used the purpose of determining the hardnessnumber
7232019 MOFMOS LABpdf
httpslidepdfcomreaderfullmofmos-labpdf 3647
Department of ANE
MOFMOS LAB MANUAL
983089983088
RESULT
Calculation Part
7232019 MOFMOS LABpdf
httpslidepdfcomreaderfullmofmos-labpdf 3747
Department of ANE MOFMOS LAB MANUAL
983089983089
SPRING TEST
AIM To determine the rigidity modulus of the spring
APPARATUS Spring testing machine vernier calipers spring specimen
THEORY
Closed coiled helical springs are the springs in which helix angle is very small or inother words the pitch between two adjacent turns is small A closed coiled helical springcarrying an axial load is shown in fig
As helix angle in case of close coiled helical springs are small hence the bendingeffect on the spring is ignored and we assume that the coils of close coiled helical
springs are to stand purely tensional stresses Let d=diameter ofthe spring wire
P= pitch of the helical spring N= number ofcoils R= mean radius of the spring coil
W=axial load on spring C=modulus of rigidity
τ=maximum shear stress induced in the wire θ=angle of twist in the
spring wire and
x= deflection of spring due to axial load l= length of wire
Net twisting moment on the wire T=WR
But twisting moment is also given by T= (π 16) τd3
From 1 ad 2 WR = (π 16) τd3 τ=16WR πd
3
above equation which gives the maximum shear stress induced in the wire (1) Length of one coil=2πR
Total length of the wire=2πRn (2)
Strain energy stored by the spring due to torsion
U= (τ 4C) [(π 4)d 2πRn] (3)
Work done on the spring =average load x deflection
= (12) Wx (4)
Equating 3 and 4
(12) Wx = (32W2R3n)Cd4
7232019 MOFMOS LABpdf
httpslidepdfcomreaderfullmofmos-labpdf 3847
Department of ANE MOFMOS LAB MANUAL
983089983090
x=64WR3nCd
4
Rigidity modulus of the spring
C=64WR3nxd
4
PROCEDURE
1) Consider the spring and find out itsmean coil radius R with the help ofvernier calipers
2) Find the diameter of the spring andnumber of turns
3) Fix the spring between two hooks
4) Now load is gradually applied
5) Note the deflection from thedeflection scale for different loadsapplied
6) Calculate the rigidity modulus usingabove formula
PRECAUTIONS
1) Dimensions should be measureaccurately with the help of verniercalipers
2) Deflection from the scale should benoted carefully and accurately
OBSERVATION TABLE
Sno Load applied deflection Rigidity modulus
C
Average rigidity modulus C =
RESULT
7232019 MOFMOS LABpdf
httpslidepdfcomreaderfullmofmos-labpdf 3947
Department of ANE MOFMOS LAB MANUAL
983089983091
Calculation Part
7232019 MOFMOS LABpdf
httpslidepdfcomreaderfullmofmos-labpdf 4047
Department of ANE MOFMOS LAB MANUAL
983089983092
TORSION
AIM To conduct torsion test on mild steel or cast iron specimen to find modulus of rigidity or to find angle of twist of the materials which are subjected to torsion
APPARATUS 1 A torsion test machine along with angle of twist measuring attachment
2 Standard specimen of mild steel or cast iron
3 Steel rule
4 Vernnier caliper or a micrometer
THEORY
For transmitting power through a rotating shaft it is necessary to apply a turning
force The force is applied tangentially and in the plane of transverse cross section The
torque or twisting moment may be calculated by multiplying two opposite turningmoments It is said to be in pure torsion and it will exhibit the tendency of shearing off at
every cross section which is perpendicular to the longitudinal axis
Torsion equation
Torsion equation is given by below
T IP = CθL = TR
T= maximum twisting torque (Nmm) IP =
polar moment of inertia (mm4) τ =shear
stress (Nmm2) C=modulus of rigidity (Nmm2)
θ=angle of twist in radians L=length of shaft under torsion (mm)
Assumptions made for getting torsion equation
1 The material of the shaft is uniform through out
2 The shaft circular in section remain circular after loading
3 Plane sections of shaft normal to its axis before loading remain plane after thetorque have been applied
4 The twist along the length of the shaft is uniform throughout
5 The distance between any two normal-sections remains the same after theapplication of torque
6 Maximum shear stress induced in the shaft due to application of torque does notexceed its elastic limit
7232019 MOFMOS LABpdf
httpslidepdfcomreaderfullmofmos-labpdf 4147
Department of ANE MOFMOS LAB MANUAL
983089983093
PROCEDURE
1 Select the suitable grips to suit the size of the specimen and clamp it in themachine by adjusting sliding jaw
2 Measure the diameter at about the three places and take average value
3 Choose the appropriate loading range depending upon specimen
4 Set the maximum load pointer to zero
5 Carry out straining by rotating the hand wheel or by switching on the motor
6 Load the members in suitable increments observe and record strain reading
7 Continue till failure of the specimen
8 Calculate the modulus of rigidity C by using the torsion equation
9 Plot the torque ndashtwist graph (T Vs θ)
OBSERVATIONS
Gauge length L =
Polar moment of inertia IP =
Modulus of rigidity C =TL IP θ =
SNo Twisting Moment Angle of Twist Modulus Average
Kgf Nm Degrees Radians of rigidity CNmm2
C
RESULT
7232019 MOFMOS LABpdf
httpslidepdfcomreaderfullmofmos-labpdf 4247
Department of ANE MOFMOS LAB MANUAL
983089983094
TENSILE TEST
AIM
To conduct tensile test on a mild steel specimen and determine the following
1 Limit of proportionality 2 Elastic Limit
3 Upper yield point 4 Lower yield point
5 Ultimate strength 6 Fracture strength
7 Young`s Modulus 8 Percentage elongation
9 Percentage reduction in area 10 Ductility
11 Toughness 12 True stress amp true strain
13 Malleability
APPARATUS tensile testing machine specimen steel rule vernier caliper micrometer
THEORY
The tensile test is most applied one of all mechanical tests In this test a test specimen is fixed
into grips connected to a straining device and to a load-measuring device (One end in stationary
grips and the other in movable grips) If the applied load is small enough the deformation of any
solid body is entirely elastic An elastically deformed solid will return to its original form as soon
as load is removed However if the load is too large the material can be deformed permanently
The initial part of the tension curve which represents the manner in which solid undergoes
plastic deformation is termed as plastic The stress below which the deformation is essentially
entirely elastic is known as the elastic limit of the material In some materials like mild steel a
sudden drop in load indicating both an upper and lower yield point denotes the onset of plastic
deformation However some materials do not exhibit a sharp yield point During plastic
deformation at lager extensions strain hardening cannot compensate for the decrease in section
and thus the load passes through a maximum and then begins to decrease At this stage the
ultimate strength which is defined as the ration of the load on the specimen to the original cross-section area reaches a maximum value Until this point the deformation is uniform at all the
sections of the specimen Further loading will eventually cause bdquoneck ‟ formation and rupture
follows
7232019 MOFMOS LABpdf
httpslidepdfcomreaderfullmofmos-labpdf 4347
Department of ANE MOFMOS LAB
MANUAL
983089983095
Usually a tension test is conducted at room temperature the tensile load is applied
slowly During this test either round or flat specimens may be used The load on the specimen is
applied mechanically or hydraulically depending on the type of testing machine
1 NominalEngg stress and NominalEngg strain
Original CS area = A0 (mm2)
Original gauge length = L0 (mm) Increase in gauge length = δL0
Nominal stress = PA0 (N mm2)
Nominal strain = δL0 L0
2 Limit of Proportionality Stress is proportional to strain up to this pointNormal Stress = PA PO Normal Strain = (δ LO) ALO
3 Elastic limit When the load is removed at ldquoBrdquo the specimen will go back to originalDimensions ie LO and δ AO Nominal stress = PB AO Normal Strain = (δ LO) B LO
If the specimen is loaded beyond elastic limit it will undergo permanent strainie Plastic deformation
4 Upper yield point Nominal stress = PC AO Nominal strain = (δ LO) D LO
5 Lower yield point Nominal stress = PD AO
Nominal strain = (δ LO) D LO 6 Ultimate load or maximum load point
Nominal ultimate stress = PE AO Nominal strain = (δ LO) E LO
7 Fracture Load point F
Nominal fracture stress = PF AO
Nominal strain at fracture = (δ LO) F LO
8 Young`s modulus (E) Young`s modulus (E) = StressStrain
(In the elastic region limit of proportionality = Nominal stress at ANominal strain at A 9Modulus of resilience = (Nominal stress at elastic limit)
2 2E
Area under Engg Stress - Strain diagram up to elastic limit10 Resilience = Modulus of Resilience x Volume of specimen undergoing Tensile stress
7232019 MOFMOS LABpdf
httpslidepdfcomreaderfullmofmos-labpdf 4447
Department of ANE MOFMOS LAB MANUAL
983089983096
11 Yield point ElongationElongation taking place in the specimen from C to D this istaking place without increase in stress
12 Modulus of toughnessArea under engineering stress ndash strain diagram up to fracture13 Toughness = Modulus of toughness x Volume of specimenThis indicates theamount of energy absorbed by the specimen before fracture take place
14 Ductility= (Final length at fracture ndash original length 10) x 100
15 MalleabilityIt is the ability of the material to undergo plastic deformation prior fracture under compressive loading conditions In a tensile test it is approximatedas percentage reduction in cross sectional area of the specimen Malleability =
(AO - Af )AO) x 100
True stress ndash true strain diagram
Engineering stress is calculated based on original cross sectional area (AO) But not on the actual cross sectional area at load bdquoP‟
True stress = PA = PAO x AO A
Since volume remains constant during plastic deformation we have AO LO = AL True stress = PAO x L LO
= PAO x ((LO + δLO) LO)
= P (1+e)= Nominal stress (1+ nominal strain)
True strain = Є = 1n (1+e)
These relations are valid up to ultimate load ie up to which the strain isuniform all along the gauge length
1 True Stress at upper yield point = Nominal stress at upper yield point ( 1+e O)True strain at C = 1n (1+eo)
2 True stress at ultimate load (E1)= Nominal ultimate stress ( 1+eE)True strain at ultimate load = 1n (1+eE)
3 True stress at fracture (E1) = Pf Af
Where Af is the area of cross section at fracture can be measured True
strain at fracture = 1n (Ao Af )
Area relation is taken instead of lengths because the strains are localized in theregion between ultimate load point and fracture point
4 Strain Hardening
From lower yield point onwards increase in load is required for increase instrain Thus the stress required for further deformation is more Thisphenomenon is called strain hardening
5 True ndash stress ndash true strain curve in log ndash log co ndash ordinates
When the true ndash stress and true ndash strain are plotted on log ndash log co ndash ordinates thecurve is a straight line
7232019 MOFMOS LABpdf
httpslidepdfcomreaderfullmofmos-labpdf 4547
Department of ANE MOFMOS LAB MANUAL
983120983137983143983141 983089983097 983151983142 983090983089
6 Ductile and Brittle Materials
If a material fails without much plastic deformation it can be called brittle If the percentageelongation at fracture is less than 25 the material is classified as brittle
bull Usually the metals with FCC and CPH structures are highly ductile
PROCEDURE
1 Measure the original gauge length and diameter of the specimen
2 Insert the specimen into grips of the test machine
3 Begin the load application and record load vs elongation data
4 Take the readings more frequently as yield point is approached
5 Measure elongation values
6 Continue the test till fracture occurs
7 By joining the two broken halves of the specimen together measure the final length anddiameter of specimen at fracture
RESULTS AND DISCUSSIONS
1 Plot the Engg Stress strain curve and determine the following
bull Limit of proportionality = (Nmm2)
bull Yield strength = (Nmm2)
bull Ultimate strength = (Nmm2)
bull Young`s modulus = (Nmm2)
bull Percentage elongation = bull Percentage reduction in area =
bull Fracture strength = (Nominal Engg)
bull Toughness = Area under stress ndash strain curve up to
fracture
bull Malleability
2 Plot True Stress True strain curve after calculating true ndash stress and true strain values at various
points
Estimate1) Strength coefficient
2) Strain hardening coefficient
3) Determine whether the material is ductile or brittle4) Comment on the results
7232019 MOFMOS LABpdf
httpslidepdfcomreaderfullmofmos-labpdf 4647
Department of ANE MOFMOS LAB MANUAL
983120983137983143983141 983090983088 983151983142 983090983089
SNo Load Deformation Stress Strain E
Calculation part-
7232019 MOFMOS LABpdf
httpslidepdfcomreaderfullmofmos-labpdf 4747
Department of ANE MOFMOS LAB MANUAL
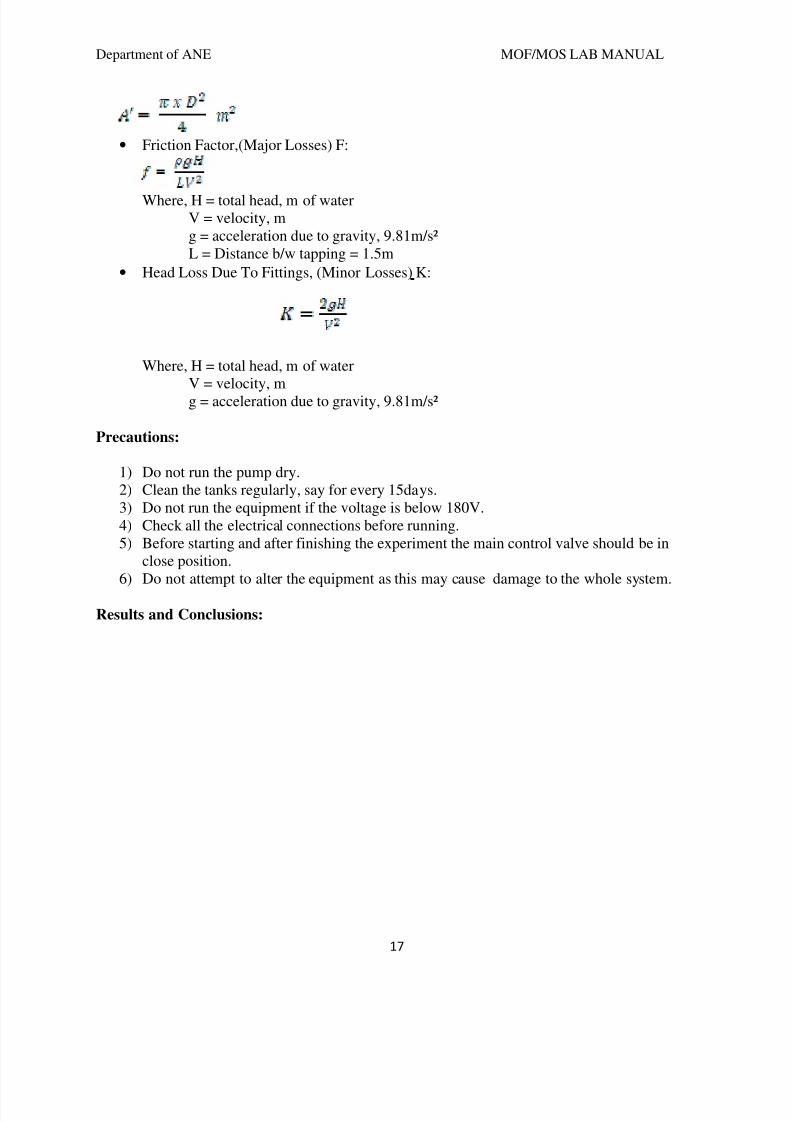
7232019 MOFMOS LABpdf
httpslidepdfcomreaderfullmofmos-labpdf 1847
Department of ANE MOFMOS LAB MANUAL
17
bull
Friction Factor(Major Losses) F
Where H = total head m of waterV = velocity mg = acceleration due to gravity 981mssup2L = Distance bw tapping = 15m
bull
Head Loss Due To Fittings (Minor Losses) K
Where H = total head m of waterV = velocity mg = acceleration due to gravity 981mssup2
Precautions
1) Do not run the pump dry2)
Clean the tanks regularly say for every 15days3)
Do not run the equipment if the voltage is below 180V4) Check all the electrical connections before running5) Before starting and after finishing the experiment the main control valve should be in
close position6) Do not attempt to alter the equipment as this may cause damage to the whole system
Results and Conclusions
7232019 MOFMOS LABpdf
httpslidepdfcomreaderfullmofmos-labpdf 1947
Department of ANE MOFMOS LAB MANUAL
18
EXPERIMENT 4
BERNOULLIrsquoS EXPERIMENTIntroduction
Bernoullirsquos Theorem gives the relationship between pressure head velocity head and thedatum Here the attempt has been made to study the relationship of the above said parametersusing venturimeter
General Description
bull The apparatus consists of a specially fabricated clear ACRYLIC Venturimeter
with necessary tappings connected to a Multibank Piezometer also made of clearACRYLIC
bull
The apparatus consists of two overhead tanks interconnected with the venturimeterwhich is placed in between the tanks
bull The overhead tanks are provided with the Head variation mechanism for conducting
the experiments at various heads
bull
Water in the sump tank is pumped using a Monobloc Centrifugal pump (Kirloskarmake) which passes through the control valve to the overhead tank
bull The height of the water in the collecting tank is measured using the acrylic
Piezometer to find the flowrate
bull The whole arrangement is mounted on an aesthetically designed sturdy frame
made of MS tubes and NOVAPAN Board with all the provisions for holding thetanks and accessories
Aim
o
The experiment is conducted too
Study of Pressure Gradient at different zoneso
Verification of Bernoullis Equationo
Comparative analysis under different flow rates
Apparatus
1) Venturimeter 2)Piezometer 3) Overhead Tank 4)Sump Tank 5) Centrifugal Pump
Procedure
1) Fill in the sump tank with clean water2)
Keep the delivery valve closed3)
Check and give necessary electrical connections to the system4) Switch on the pump amp Slowly open the delivery valve5)
Adjust the flow through the control valve of the pump6)
Allow the system to attain the steady state ie let the water pass from the secondoverhead tank to the collecting tank
7) Note down the Pressure head at different points of the venture meter on the multi-tubepiezometer (Expel if any air is the by inserting the thin pin into the piezometer openings)
8) Close the ball valve of the collecting tank and measure the time for the known rise ofwater
7232019 MOFMOS LABpdf
httpslidepdfcomreaderfullmofmos-labpdf 2047
Department of ANE MOFMOS LAB MANUAL
1983097
9) Change the flow rate and repeat the experiment
Observation
SlNo
Static Head Loss h Time for lsquoRrsquo
cm rise in waterlsquoTrsquo sec1 2 3 4 5 6 7 8 9 10
1
2
3
4
5
Calculations1
Discharge QA2
Where
A = Area of collecting tank = 0045 msup2R = Rise in water level of the collecting tank cmt = time for lsquoRrsquo cm rise of water sec100 = Conversion from cm to m
3 Pressure Head
Where
ρ = density of waterg = gravitational constanth = head measured m of water column
3 Velocity Head
WhereV = Q a a = Area at the particular section of the venturimeter msup2
4 Verification of BERNOULLIrsquoS EQUATIONBernoullirsquos Equation is given as
After findinga Pressure Head hb
Velocity headat different cross-section of the Venturimeter
7232019 MOFMOS LABpdf
httpslidepdfcomreaderfullmofmos-labpdf 2147
Department of ANE MOFMOS LAB MANUAL
20
Put the same in the above equation for different points and verify whether all the values obtainedare sameNote Consider the datum z to be constant
Precautions
bull
Do not run the pump drybull
Clean the tanks regularly say for every 15days
bull
Do not run the equipment if the voltage is below 180V
bull
Check all the electrical connections before running
bull Before starting and after finishing the experiment the main
bull Control valve should be in close position
bull Do not attempt to alter the equipment as this may cause
bull
Damage to the whole system
Result and Conclusion
7232019 MOFMOS LABpdf
httpslidepdfcomreaderfullmofmos-labpdf 2247
Department of ANE MOFMOS LAB MANUAL
21
EXPERIMENT 5
CALIBRATION OF A TRIANGULAR NOTCH
AIM -To find the coefficient of discharge of given triangular notch
THEORY-A notch is a device used for measuring the rate of flow of liquid through a smallchannel or a tank It may be defined as an opening in the side of a tank or small channel in suchthat a way that the liquid surfaces in the tank or channel is below the top edge of the opening
NOTCHES ARE CLASSIFIED AS-1 Rectangular notch2 Triangular notch3 Trapezoidal notch
4 Stepped notch
A triangular notch is preferred to a rectangular notch due to the following reasonsThe expression for discharge of triangular notch is compared to rectangular notch is simple Formeasuring low discharge a triangular notch gives more accurate results than a rectangular notchIn the case of triangular notch only H is required for the computation of dischargeA trapezoidal notch is a combination of rectangular and triangular notch and thus the dischargethrough trapezoidal notch is the sum of above notchesA stepped notch is a combination of rectangular notch and triangular notch The dischargethrough the stepped notch is equal to sum of discharges through the different rectangularnotches
DESCRIPTION- The apparatus consists of1) Measuring tank 2) Sump tank3) Supply pump set 4) Inlet and out let valve
Measuring tank Stainless steel tank of size 030305mm height with the gage glass a scalearrangement for quick and easy measurements A ball valve is provided to empty the tank and adrain is provided at the bottom of the tank to drain the waste water when the unit is not in useWater for independent circulation through the unit for experimentation and arranged within thefloor space of the main unitSump tank The sump tank is a size of 020303m stainless steel tank to store sufficient waterfor independent circulation through the unit for experimentation and arranged within the floorspace of the main unit about 060305m with a gauge glass and scale arrangement A ballvalve is provided to empty the tankSupply Pump set The pump is 2525mm size mono block with frac12 HP 2880 RPM singlephase 220volts AC supply Inlet and out let valve- These valves are used to control the flow ofwater at inlet and out let
PROCEDURE1 Allow the water to drain up to triangular notch
7232019 MOFMOS LABpdf
httpslidepdfcomreaderfullmofmos-labpdf 2347
Department of ANE MOFMOS LAB MANUAL
22
2 Note down the depth of the water when the water is coinciding with the v notch point
3 Collect water in collecting tank and close the drain valve and find the time taken for the rise ofwater up to 20cm
4 Calculate the discharge by using the above results
5 Now substituting the values in the formula for calculation of discharge for v- notch gives therequired result
Precautionsbull Do not run the pump dry
bull Clean the tanks regularly say for every 15days
bull Do not run the equipment if the voltage is below 180V
bull Check all the electrical connections before running
bull
Before starting and after finishing the experiment the main
bull
Control valve should be in close position
bull
Do not attempt to alter the equipment as this may cause
7232019 MOFMOS LABpdf
httpslidepdfcomreaderfullmofmos-labpdf 2447
Department of ANE MOFMOS LAB MANUAL
23
bull Damage to the whole system
Result and Conclusion
7232019 MOFMOS LABpdf
httpslidepdfcomreaderfullmofmos-labpdf 2547
Department of ANE MOFMOS LAB MANUAL
24
MECHANICSOF SOLIDS
LAB
7232019 MOFMOS LABpdf
httpslidepdfcomreaderfullmofmos-labpdf 2647
Department of ANE MOFMOS LAB MANUAL
25
7232019 MOFMOS LABpdf
httpslidepdfcomreaderfullmofmos-labpdf 2747
Department of ANE MOFMOS LAB MANUAL
983089
IZOD IMPACT TEST
AIM To perform the izod impact test on materials
APPARATUS Izod impact test machine test specimen vernier calipers steel rule
IMPACT STRENGTH The resistance of a material to fracture under sudden load application
MATERIALS Two types of test pieces are used for this test as given
1) Square cross-section
2) Round cross-section
THEORY The type of test specimen used for this test is a Square Cross-section
The specimen may have single two or three notches The testing machine shouldhave the following specifications The angle between top face of grips and face holding the specimen Vertical=900 the angle of tip of hammer =750plusmn10
The angle between normal to the specimen and underside face of the hammer at Striking point=100plusmn10
Speed of hammer at impact=399msecStriking energy=168N-m or Joules Angle
Of drop of pendulum =900 Effective
weight of pendulum=2179kg
Minimum value of scale graduation=2 Joules
Permissible total friction loss of corresponding energy=050
Distance from the axis of rotation of distance between the base of specimen notch andthe point of specimen hit by the hammer=22mmplusmn05mm
The longitudinal axes of the test piece shall lie in the plane of swing of the center ofgravity of the hammer The notch shall be positioned so that its in the plane of thehammer the notch shall be positioned its plane of symmetry coincides with the top faceof the grips for setting the specimen the notch impact strength I is calculated accordingto the following relation
Where I= impact strength in joulesm2
7232019 MOFMOS LABpdf
httpslidepdfcomreaderfullmofmos-labpdf 2847
Department of ANE MOFMOS LAB MANUAL
983090
PROCEDURE
1 For conducting Izod test a proper striker is to be fitted firmly to the bottom of thehammer with the help of the clamming piece
2 The latching take for izod test is to be firmly fitted to the bearing housing at the side of
the columns3 The frictional loss of the machine can be determined by free fall test raise the
hammer by hands and latch in release the hammer by operating lever the pointer will
then indicate the energy loss due to friction From this reading confirm that the friction
loss is not exceeding 05 of the initial potential energy Otherwise frictional loss has to
be added to the final reading
4 The specimen for izod test is firmly fitted in the specimen support with the help ofclamping screw and eacutelan key Care should be taken that the notch on the specimenshould face to pendulum striker
5 After ascertaining that there is no person in the range of swinging pendulum release the
pendulum to smash the specimen6 Carefully operate the pendulum brake when returning after one swing to stop the oscillations
7 Read-off position of reading pointer on dial and note indicated value
8 Remove the broken specimen by loosening the clamping screw
The notch impact strength depends largely on the shape of the specimen and the notch the
values determined with other specimens therefore may not be compared with each other
OBSERVATION TABLE
S No A(Area of cross K Impact energy I Impact Strength
section of observed
specimen)
RESULT
7232019 MOFMOS LABpdf
httpslidepdfcomreaderfullmofmos-labpdf 2947
Department of ANE MOFMOS LAB MANUAL
983091
Calculation Part
7232019 MOFMOS LABpdf
httpslidepdfcomreaderfullmofmos-labpdf 3047
Department of ANE MOFMOS LAB MANUAL
983092
ROCKWELL HARDNESS TEST
AIM To determine the Rockwell hardness of the given test specimen
APPARATUS Rockwell hardness testing machine test specimen
THEORY
Hardness-the resistance of a metal to plastic deformationagainst indentation scratching abrasion or cutting
The depth of penetration of the indenter measures the hardness of a material by this Rockwell ‟s hardness test method the depth of penetration is inversely
proportional to the hardness Both ball or diamond cone types of indenters are used inthis testThere are three scales on the machine for taking hardness readings
Scale bdquoA‟ with load 60kgf or 5888N and diamond indenter is used for performing tests on steel and shallow case hardened steel
Scale bdquoB‟ with load 100kgf or 9807 N and 1588mm dia ball indenter is used forperforming tests on soft steel malleable iron copper and aluminum alloys
Scale bdquoC‟ with load 150kgf or 1471 N and diamond indenter is used for performing testson steel hard cost steel deep case hardened steel other metals which harder
First minor load is applied to overcome the film thickness on the metal surfaceMinor load also eliminates errors in the depth of measurement due to spring of themachine frame or setting down of the specimen and table attachments
The Rockwell hardness is derived from the measurement of the depth of theimpression This method of test is suitable for finished or machined parts of simpleshapes
PROCEDURE
1 Select the load by rotating the nob and fix the suitable indenter
2 Clean the test piece and place on the special anvil or worktable of the machine
3 Turn the capstan wheel to evaluate the test specimen into contact with the indenterpoint
4 Further turn the wheel for three rotations forcing the test specimen against theindenter This will ensure the minor load has been applied5 Set the pointer on the scale dial at the appropriate position
7232019 MOFMOS LABpdf
httpslidepdfcomreaderfullmofmos-labpdf 3147
Department of ANE MOFMOS LAB MANUAL
983093
6 Push the lever to apply the major load A dash pot provided in the loading mechanismto ensure that the load is applied gradually
7 As soon as the pointer comes to rest pull the handle in the reverse direction slowlyThis releases the major but not the minor load The pointer will now rotate in the reversedirection
8 The Rockwell hardness can read off the scale dial on the appropriate scale after thepointer comes to rest
OBSERVATIONS
Material of the specimen =
Thickness of test specimen =
Hardness scale used =
Test Material Rockwell Scale of weights Rockwell number Average
no Rockwell
no
Scale weight indent 1 2 3
PRECAUTIONS
1 For testing cylindrical test specimens use V-type platform
2 Calibrate the machine occasionally by using standard test blocks
3 For thin metal prices place another sufficiently thick metal piece between the testspecimen and the platform to avoid any damage which may likely occur to the platform
4 After applying major load wait for some time to allow the needle to come to restThe waiting time may vary from 2 to 8 seconds
7232019 MOFMOS LABpdf
httpslidepdfcomreaderfullmofmos-labpdf 3247
Department of ANE MOFMOS LAB
MANUAL
983094
5 The surface of the test piece should be smooth and even and free from oxidescale and foreign matter6 Test specimen should not be subjected to any heating of cold working
7 The distance between the centers of two adjacent indentation should be at least 4
Times the diameter of the indentation and the distance from the center of any indentation tothe edge of the test piece should be at least 25 times the diameter of the indentation
RESULT
7232019 MOFMOS LABpdf
httpslidepdfcomreaderfullmofmos-labpdf 3347
Department of ANE MOFMOS LAB MANUAL
983095
Calculation Part
7232019 MOFMOS LABpdf
httpslidepdfcomreaderfullmofmos-labpdf 3447
Department of ANE MOFMOS LAB MANUAL
983096
BRINELLrsquoS HARDNESS TEST
AIM To determine the Brinell hardness of the given test specimen
APPARATUS Brinell hardness machine test specimen Brinells Microscope
THEORY
Indentation Hardness-A number related to the area or to the depth of
the impression made by an indenter or fixed geometry under a known fixed load
This method consists of indenting the surface of the metal by a hardened steel
ball of specified diameter D mm under a given load F kgf and measuring the average
diameter d mm of the impression with the help of Brinell microscope fitted with a scaleThe Brinell hardness HB is defined as the quotient of the applied force F divided by the
spherical area of the impression
HB= Test load in kgfsurface area of indentation
=2F πD (D- D2- d2) kgmm2
PROCEDURE
1 Select the proper size of the ball and load to suit the material under test2 Clean the test specimen to be free from any dirt and defects or blemishes
3 Mount the test piece surface at right angles to the axis of the ball indenter plunger
4 Turn the platform so that the ball is lifted up
5 By shifting the lever applies the load and waits for some time
6 Release the load by shifting the lever
7 Take out the specimen and measure the diameter of indentation by means of theBrinell microscope8 Repeat the experiments at other positions of the test piece
9 Calculate the value of HB
7232019 MOFMOS LABpdf
httpslidepdfcomreaderfullmofmos-labpdf 3547
Department of ANE MOFMOS LAB MANUAL
983097
OBSERVATIONS
Test piece material = Diameter of the ballrdquo D ldquo =
Load section FD2 = Test load =
Load application time =
Least count of Brinell Microscope =
Diameter Average
Impression F D HB
S No in kg in mm Kgmm2
(d1) (d2) (d1+d2)2
PRECAUTIONS
1 The surface of the test piece should be clean
2 The testing machine should be protected throughout the test from shock or vibration
3 The test should be carried out at room temperature
4 The distance of the center of indentation from the edge of test piece should be at
least 25 times the diameter of the indentation and the distance between the center ofthe two adjacent indentations should be at least 4 times the diameter of the indentation
5 The diameter of each indentation should be measured in two directions at rightangles and the mean value readings used the purpose of determining the hardnessnumber
7232019 MOFMOS LABpdf
httpslidepdfcomreaderfullmofmos-labpdf 3647
Department of ANE
MOFMOS LAB MANUAL
983089983088
RESULT
Calculation Part
7232019 MOFMOS LABpdf
httpslidepdfcomreaderfullmofmos-labpdf 3747
Department of ANE MOFMOS LAB MANUAL
983089983089
SPRING TEST
AIM To determine the rigidity modulus of the spring
APPARATUS Spring testing machine vernier calipers spring specimen
THEORY
Closed coiled helical springs are the springs in which helix angle is very small or inother words the pitch between two adjacent turns is small A closed coiled helical springcarrying an axial load is shown in fig
As helix angle in case of close coiled helical springs are small hence the bendingeffect on the spring is ignored and we assume that the coils of close coiled helical
springs are to stand purely tensional stresses Let d=diameter ofthe spring wire
P= pitch of the helical spring N= number ofcoils R= mean radius of the spring coil
W=axial load on spring C=modulus of rigidity
τ=maximum shear stress induced in the wire θ=angle of twist in the
spring wire and
x= deflection of spring due to axial load l= length of wire
Net twisting moment on the wire T=WR
But twisting moment is also given by T= (π 16) τd3
From 1 ad 2 WR = (π 16) τd3 τ=16WR πd
3
above equation which gives the maximum shear stress induced in the wire (1) Length of one coil=2πR
Total length of the wire=2πRn (2)
Strain energy stored by the spring due to torsion
U= (τ 4C) [(π 4)d 2πRn] (3)
Work done on the spring =average load x deflection
= (12) Wx (4)
Equating 3 and 4
(12) Wx = (32W2R3n)Cd4
7232019 MOFMOS LABpdf
httpslidepdfcomreaderfullmofmos-labpdf 3847
Department of ANE MOFMOS LAB MANUAL
983089983090
x=64WR3nCd
4
Rigidity modulus of the spring
C=64WR3nxd
4
PROCEDURE
1) Consider the spring and find out itsmean coil radius R with the help ofvernier calipers
2) Find the diameter of the spring andnumber of turns
3) Fix the spring between two hooks
4) Now load is gradually applied
5) Note the deflection from thedeflection scale for different loadsapplied
6) Calculate the rigidity modulus usingabove formula
PRECAUTIONS
1) Dimensions should be measureaccurately with the help of verniercalipers
2) Deflection from the scale should benoted carefully and accurately
OBSERVATION TABLE
Sno Load applied deflection Rigidity modulus
C
Average rigidity modulus C =
RESULT
7232019 MOFMOS LABpdf
httpslidepdfcomreaderfullmofmos-labpdf 3947
Department of ANE MOFMOS LAB MANUAL
983089983091
Calculation Part
7232019 MOFMOS LABpdf
httpslidepdfcomreaderfullmofmos-labpdf 4047
Department of ANE MOFMOS LAB MANUAL
983089983092
TORSION
AIM To conduct torsion test on mild steel or cast iron specimen to find modulus of rigidity or to find angle of twist of the materials which are subjected to torsion
APPARATUS 1 A torsion test machine along with angle of twist measuring attachment
2 Standard specimen of mild steel or cast iron
3 Steel rule
4 Vernnier caliper or a micrometer
THEORY
For transmitting power through a rotating shaft it is necessary to apply a turning
force The force is applied tangentially and in the plane of transverse cross section The
torque or twisting moment may be calculated by multiplying two opposite turningmoments It is said to be in pure torsion and it will exhibit the tendency of shearing off at
every cross section which is perpendicular to the longitudinal axis
Torsion equation
Torsion equation is given by below
T IP = CθL = TR
T= maximum twisting torque (Nmm) IP =
polar moment of inertia (mm4) τ =shear
stress (Nmm2) C=modulus of rigidity (Nmm2)
θ=angle of twist in radians L=length of shaft under torsion (mm)
Assumptions made for getting torsion equation
1 The material of the shaft is uniform through out
2 The shaft circular in section remain circular after loading
3 Plane sections of shaft normal to its axis before loading remain plane after thetorque have been applied
4 The twist along the length of the shaft is uniform throughout
5 The distance between any two normal-sections remains the same after theapplication of torque
6 Maximum shear stress induced in the shaft due to application of torque does notexceed its elastic limit
7232019 MOFMOS LABpdf
httpslidepdfcomreaderfullmofmos-labpdf 4147
Department of ANE MOFMOS LAB MANUAL
983089983093
PROCEDURE
1 Select the suitable grips to suit the size of the specimen and clamp it in themachine by adjusting sliding jaw
2 Measure the diameter at about the three places and take average value
3 Choose the appropriate loading range depending upon specimen
4 Set the maximum load pointer to zero
5 Carry out straining by rotating the hand wheel or by switching on the motor
6 Load the members in suitable increments observe and record strain reading
7 Continue till failure of the specimen
8 Calculate the modulus of rigidity C by using the torsion equation
9 Plot the torque ndashtwist graph (T Vs θ)
OBSERVATIONS
Gauge length L =
Polar moment of inertia IP =
Modulus of rigidity C =TL IP θ =
SNo Twisting Moment Angle of Twist Modulus Average
Kgf Nm Degrees Radians of rigidity CNmm2
C
RESULT
7232019 MOFMOS LABpdf
httpslidepdfcomreaderfullmofmos-labpdf 4247
Department of ANE MOFMOS LAB MANUAL
983089983094
TENSILE TEST
AIM
To conduct tensile test on a mild steel specimen and determine the following
1 Limit of proportionality 2 Elastic Limit
3 Upper yield point 4 Lower yield point
5 Ultimate strength 6 Fracture strength
7 Young`s Modulus 8 Percentage elongation
9 Percentage reduction in area 10 Ductility
11 Toughness 12 True stress amp true strain
13 Malleability
APPARATUS tensile testing machine specimen steel rule vernier caliper micrometer
THEORY
The tensile test is most applied one of all mechanical tests In this test a test specimen is fixed
into grips connected to a straining device and to a load-measuring device (One end in stationary
grips and the other in movable grips) If the applied load is small enough the deformation of any
solid body is entirely elastic An elastically deformed solid will return to its original form as soon
as load is removed However if the load is too large the material can be deformed permanently
The initial part of the tension curve which represents the manner in which solid undergoes
plastic deformation is termed as plastic The stress below which the deformation is essentially
entirely elastic is known as the elastic limit of the material In some materials like mild steel a
sudden drop in load indicating both an upper and lower yield point denotes the onset of plastic
deformation However some materials do not exhibit a sharp yield point During plastic
deformation at lager extensions strain hardening cannot compensate for the decrease in section
and thus the load passes through a maximum and then begins to decrease At this stage the
ultimate strength which is defined as the ration of the load on the specimen to the original cross-section area reaches a maximum value Until this point the deformation is uniform at all the
sections of the specimen Further loading will eventually cause bdquoneck ‟ formation and rupture
follows
7232019 MOFMOS LABpdf
httpslidepdfcomreaderfullmofmos-labpdf 4347
Department of ANE MOFMOS LAB
MANUAL
983089983095
Usually a tension test is conducted at room temperature the tensile load is applied
slowly During this test either round or flat specimens may be used The load on the specimen is
applied mechanically or hydraulically depending on the type of testing machine
1 NominalEngg stress and NominalEngg strain
Original CS area = A0 (mm2)
Original gauge length = L0 (mm) Increase in gauge length = δL0
Nominal stress = PA0 (N mm2)
Nominal strain = δL0 L0
2 Limit of Proportionality Stress is proportional to strain up to this pointNormal Stress = PA PO Normal Strain = (δ LO) ALO
3 Elastic limit When the load is removed at ldquoBrdquo the specimen will go back to originalDimensions ie LO and δ AO Nominal stress = PB AO Normal Strain = (δ LO) B LO
If the specimen is loaded beyond elastic limit it will undergo permanent strainie Plastic deformation
4 Upper yield point Nominal stress = PC AO Nominal strain = (δ LO) D LO
5 Lower yield point Nominal stress = PD AO
Nominal strain = (δ LO) D LO 6 Ultimate load or maximum load point
Nominal ultimate stress = PE AO Nominal strain = (δ LO) E LO
7 Fracture Load point F
Nominal fracture stress = PF AO
Nominal strain at fracture = (δ LO) F LO
8 Young`s modulus (E) Young`s modulus (E) = StressStrain
(In the elastic region limit of proportionality = Nominal stress at ANominal strain at A 9Modulus of resilience = (Nominal stress at elastic limit)
2 2E
Area under Engg Stress - Strain diagram up to elastic limit10 Resilience = Modulus of Resilience x Volume of specimen undergoing Tensile stress
7232019 MOFMOS LABpdf
httpslidepdfcomreaderfullmofmos-labpdf 4447
Department of ANE MOFMOS LAB MANUAL
983089983096
11 Yield point ElongationElongation taking place in the specimen from C to D this istaking place without increase in stress
12 Modulus of toughnessArea under engineering stress ndash strain diagram up to fracture13 Toughness = Modulus of toughness x Volume of specimenThis indicates theamount of energy absorbed by the specimen before fracture take place
14 Ductility= (Final length at fracture ndash original length 10) x 100
15 MalleabilityIt is the ability of the material to undergo plastic deformation prior fracture under compressive loading conditions In a tensile test it is approximatedas percentage reduction in cross sectional area of the specimen Malleability =
(AO - Af )AO) x 100
True stress ndash true strain diagram
Engineering stress is calculated based on original cross sectional area (AO) But not on the actual cross sectional area at load bdquoP‟
True stress = PA = PAO x AO A
Since volume remains constant during plastic deformation we have AO LO = AL True stress = PAO x L LO
= PAO x ((LO + δLO) LO)
= P (1+e)= Nominal stress (1+ nominal strain)
True strain = Є = 1n (1+e)
These relations are valid up to ultimate load ie up to which the strain isuniform all along the gauge length
1 True Stress at upper yield point = Nominal stress at upper yield point ( 1+e O)True strain at C = 1n (1+eo)
2 True stress at ultimate load (E1)= Nominal ultimate stress ( 1+eE)True strain at ultimate load = 1n (1+eE)
3 True stress at fracture (E1) = Pf Af
Where Af is the area of cross section at fracture can be measured True
strain at fracture = 1n (Ao Af )
Area relation is taken instead of lengths because the strains are localized in theregion between ultimate load point and fracture point
4 Strain Hardening
From lower yield point onwards increase in load is required for increase instrain Thus the stress required for further deformation is more Thisphenomenon is called strain hardening
5 True ndash stress ndash true strain curve in log ndash log co ndash ordinates
When the true ndash stress and true ndash strain are plotted on log ndash log co ndash ordinates thecurve is a straight line
7232019 MOFMOS LABpdf
httpslidepdfcomreaderfullmofmos-labpdf 4547
Department of ANE MOFMOS LAB MANUAL
983120983137983143983141 983089983097 983151983142 983090983089
6 Ductile and Brittle Materials
If a material fails without much plastic deformation it can be called brittle If the percentageelongation at fracture is less than 25 the material is classified as brittle
bull Usually the metals with FCC and CPH structures are highly ductile
PROCEDURE
1 Measure the original gauge length and diameter of the specimen
2 Insert the specimen into grips of the test machine
3 Begin the load application and record load vs elongation data
4 Take the readings more frequently as yield point is approached
5 Measure elongation values
6 Continue the test till fracture occurs
7 By joining the two broken halves of the specimen together measure the final length anddiameter of specimen at fracture
RESULTS AND DISCUSSIONS
1 Plot the Engg Stress strain curve and determine the following
bull Limit of proportionality = (Nmm2)
bull Yield strength = (Nmm2)
bull Ultimate strength = (Nmm2)
bull Young`s modulus = (Nmm2)
bull Percentage elongation = bull Percentage reduction in area =
bull Fracture strength = (Nominal Engg)
bull Toughness = Area under stress ndash strain curve up to
fracture
bull Malleability
2 Plot True Stress True strain curve after calculating true ndash stress and true strain values at various
points
Estimate1) Strength coefficient
2) Strain hardening coefficient
3) Determine whether the material is ductile or brittle4) Comment on the results
7232019 MOFMOS LABpdf
httpslidepdfcomreaderfullmofmos-labpdf 4647
Department of ANE MOFMOS LAB MANUAL
983120983137983143983141 983090983088 983151983142 983090983089
SNo Load Deformation Stress Strain E
Calculation part-
7232019 MOFMOS LABpdf
httpslidepdfcomreaderfullmofmos-labpdf 4747
Department of ANE MOFMOS LAB MANUAL
7232019 MOFMOS LABpdf
httpslidepdfcomreaderfullmofmos-labpdf 1947
Department of ANE MOFMOS LAB MANUAL
18
EXPERIMENT 4
BERNOULLIrsquoS EXPERIMENTIntroduction
Bernoullirsquos Theorem gives the relationship between pressure head velocity head and thedatum Here the attempt has been made to study the relationship of the above said parametersusing venturimeter
General Description
bull The apparatus consists of a specially fabricated clear ACRYLIC Venturimeter
with necessary tappings connected to a Multibank Piezometer also made of clearACRYLIC
bull
The apparatus consists of two overhead tanks interconnected with the venturimeterwhich is placed in between the tanks
bull The overhead tanks are provided with the Head variation mechanism for conducting
the experiments at various heads
bull
Water in the sump tank is pumped using a Monobloc Centrifugal pump (Kirloskarmake) which passes through the control valve to the overhead tank
bull The height of the water in the collecting tank is measured using the acrylic
Piezometer to find the flowrate
bull The whole arrangement is mounted on an aesthetically designed sturdy frame
made of MS tubes and NOVAPAN Board with all the provisions for holding thetanks and accessories
Aim
o
The experiment is conducted too
Study of Pressure Gradient at different zoneso
Verification of Bernoullis Equationo
Comparative analysis under different flow rates
Apparatus
1) Venturimeter 2)Piezometer 3) Overhead Tank 4)Sump Tank 5) Centrifugal Pump
Procedure
1) Fill in the sump tank with clean water2)
Keep the delivery valve closed3)
Check and give necessary electrical connections to the system4) Switch on the pump amp Slowly open the delivery valve5)
Adjust the flow through the control valve of the pump6)
Allow the system to attain the steady state ie let the water pass from the secondoverhead tank to the collecting tank
7) Note down the Pressure head at different points of the venture meter on the multi-tubepiezometer (Expel if any air is the by inserting the thin pin into the piezometer openings)
8) Close the ball valve of the collecting tank and measure the time for the known rise ofwater
7232019 MOFMOS LABpdf
httpslidepdfcomreaderfullmofmos-labpdf 2047
Department of ANE MOFMOS LAB MANUAL
1983097
9) Change the flow rate and repeat the experiment
Observation
SlNo
Static Head Loss h Time for lsquoRrsquo
cm rise in waterlsquoTrsquo sec1 2 3 4 5 6 7 8 9 10
1
2
3
4
5
Calculations1
Discharge QA2
Where
A = Area of collecting tank = 0045 msup2R = Rise in water level of the collecting tank cmt = time for lsquoRrsquo cm rise of water sec100 = Conversion from cm to m
3 Pressure Head
Where
ρ = density of waterg = gravitational constanth = head measured m of water column
3 Velocity Head
WhereV = Q a a = Area at the particular section of the venturimeter msup2
4 Verification of BERNOULLIrsquoS EQUATIONBernoullirsquos Equation is given as
After findinga Pressure Head hb
Velocity headat different cross-section of the Venturimeter
7232019 MOFMOS LABpdf
httpslidepdfcomreaderfullmofmos-labpdf 2147
Department of ANE MOFMOS LAB MANUAL
20
Put the same in the above equation for different points and verify whether all the values obtainedare sameNote Consider the datum z to be constant
Precautions
bull
Do not run the pump drybull
Clean the tanks regularly say for every 15days
bull
Do not run the equipment if the voltage is below 180V
bull
Check all the electrical connections before running
bull Before starting and after finishing the experiment the main
bull Control valve should be in close position
bull Do not attempt to alter the equipment as this may cause
bull
Damage to the whole system
Result and Conclusion
7232019 MOFMOS LABpdf
httpslidepdfcomreaderfullmofmos-labpdf 2247
Department of ANE MOFMOS LAB MANUAL
21
EXPERIMENT 5
CALIBRATION OF A TRIANGULAR NOTCH
AIM -To find the coefficient of discharge of given triangular notch
THEORY-A notch is a device used for measuring the rate of flow of liquid through a smallchannel or a tank It may be defined as an opening in the side of a tank or small channel in suchthat a way that the liquid surfaces in the tank or channel is below the top edge of the opening
NOTCHES ARE CLASSIFIED AS-1 Rectangular notch2 Triangular notch3 Trapezoidal notch
4 Stepped notch
A triangular notch is preferred to a rectangular notch due to the following reasonsThe expression for discharge of triangular notch is compared to rectangular notch is simple Formeasuring low discharge a triangular notch gives more accurate results than a rectangular notchIn the case of triangular notch only H is required for the computation of dischargeA trapezoidal notch is a combination of rectangular and triangular notch and thus the dischargethrough trapezoidal notch is the sum of above notchesA stepped notch is a combination of rectangular notch and triangular notch The dischargethrough the stepped notch is equal to sum of discharges through the different rectangularnotches
DESCRIPTION- The apparatus consists of1) Measuring tank 2) Sump tank3) Supply pump set 4) Inlet and out let valve
Measuring tank Stainless steel tank of size 030305mm height with the gage glass a scalearrangement for quick and easy measurements A ball valve is provided to empty the tank and adrain is provided at the bottom of the tank to drain the waste water when the unit is not in useWater for independent circulation through the unit for experimentation and arranged within thefloor space of the main unitSump tank The sump tank is a size of 020303m stainless steel tank to store sufficient waterfor independent circulation through the unit for experimentation and arranged within the floorspace of the main unit about 060305m with a gauge glass and scale arrangement A ballvalve is provided to empty the tankSupply Pump set The pump is 2525mm size mono block with frac12 HP 2880 RPM singlephase 220volts AC supply Inlet and out let valve- These valves are used to control the flow ofwater at inlet and out let
PROCEDURE1 Allow the water to drain up to triangular notch
7232019 MOFMOS LABpdf
httpslidepdfcomreaderfullmofmos-labpdf 2347
Department of ANE MOFMOS LAB MANUAL
22
2 Note down the depth of the water when the water is coinciding with the v notch point
3 Collect water in collecting tank and close the drain valve and find the time taken for the rise ofwater up to 20cm
4 Calculate the discharge by using the above results
5 Now substituting the values in the formula for calculation of discharge for v- notch gives therequired result
Precautionsbull Do not run the pump dry
bull Clean the tanks regularly say for every 15days
bull Do not run the equipment if the voltage is below 180V
bull Check all the electrical connections before running
bull
Before starting and after finishing the experiment the main
bull
Control valve should be in close position
bull
Do not attempt to alter the equipment as this may cause
7232019 MOFMOS LABpdf
httpslidepdfcomreaderfullmofmos-labpdf 2447
Department of ANE MOFMOS LAB MANUAL
23
bull Damage to the whole system
Result and Conclusion
7232019 MOFMOS LABpdf
httpslidepdfcomreaderfullmofmos-labpdf 2547
Department of ANE MOFMOS LAB MANUAL
24
MECHANICSOF SOLIDS
LAB
7232019 MOFMOS LABpdf
httpslidepdfcomreaderfullmofmos-labpdf 2647
Department of ANE MOFMOS LAB MANUAL
25
7232019 MOFMOS LABpdf
httpslidepdfcomreaderfullmofmos-labpdf 2747
Department of ANE MOFMOS LAB MANUAL
983089
IZOD IMPACT TEST
AIM To perform the izod impact test on materials
APPARATUS Izod impact test machine test specimen vernier calipers steel rule
IMPACT STRENGTH The resistance of a material to fracture under sudden load application
MATERIALS Two types of test pieces are used for this test as given
1) Square cross-section
2) Round cross-section
THEORY The type of test specimen used for this test is a Square Cross-section
The specimen may have single two or three notches The testing machine shouldhave the following specifications The angle between top face of grips and face holding the specimen Vertical=900 the angle of tip of hammer =750plusmn10
The angle between normal to the specimen and underside face of the hammer at Striking point=100plusmn10
Speed of hammer at impact=399msecStriking energy=168N-m or Joules Angle
Of drop of pendulum =900 Effective
weight of pendulum=2179kg
Minimum value of scale graduation=2 Joules
Permissible total friction loss of corresponding energy=050
Distance from the axis of rotation of distance between the base of specimen notch andthe point of specimen hit by the hammer=22mmplusmn05mm
The longitudinal axes of the test piece shall lie in the plane of swing of the center ofgravity of the hammer The notch shall be positioned so that its in the plane of thehammer the notch shall be positioned its plane of symmetry coincides with the top faceof the grips for setting the specimen the notch impact strength I is calculated accordingto the following relation
Where I= impact strength in joulesm2
7232019 MOFMOS LABpdf
httpslidepdfcomreaderfullmofmos-labpdf 2847
Department of ANE MOFMOS LAB MANUAL
983090
PROCEDURE
1 For conducting Izod test a proper striker is to be fitted firmly to the bottom of thehammer with the help of the clamming piece
2 The latching take for izod test is to be firmly fitted to the bearing housing at the side of
the columns3 The frictional loss of the machine can be determined by free fall test raise the
hammer by hands and latch in release the hammer by operating lever the pointer will
then indicate the energy loss due to friction From this reading confirm that the friction
loss is not exceeding 05 of the initial potential energy Otherwise frictional loss has to
be added to the final reading
4 The specimen for izod test is firmly fitted in the specimen support with the help ofclamping screw and eacutelan key Care should be taken that the notch on the specimenshould face to pendulum striker
5 After ascertaining that there is no person in the range of swinging pendulum release the
pendulum to smash the specimen6 Carefully operate the pendulum brake when returning after one swing to stop the oscillations
7 Read-off position of reading pointer on dial and note indicated value
8 Remove the broken specimen by loosening the clamping screw
The notch impact strength depends largely on the shape of the specimen and the notch the
values determined with other specimens therefore may not be compared with each other
OBSERVATION TABLE
S No A(Area of cross K Impact energy I Impact Strength
section of observed
specimen)
RESULT
7232019 MOFMOS LABpdf
httpslidepdfcomreaderfullmofmos-labpdf 2947
Department of ANE MOFMOS LAB MANUAL
983091
Calculation Part
7232019 MOFMOS LABpdf
httpslidepdfcomreaderfullmofmos-labpdf 3047
Department of ANE MOFMOS LAB MANUAL
983092
ROCKWELL HARDNESS TEST
AIM To determine the Rockwell hardness of the given test specimen
APPARATUS Rockwell hardness testing machine test specimen
THEORY
Hardness-the resistance of a metal to plastic deformationagainst indentation scratching abrasion or cutting
The depth of penetration of the indenter measures the hardness of a material by this Rockwell ‟s hardness test method the depth of penetration is inversely
proportional to the hardness Both ball or diamond cone types of indenters are used inthis testThere are three scales on the machine for taking hardness readings
Scale bdquoA‟ with load 60kgf or 5888N and diamond indenter is used for performing tests on steel and shallow case hardened steel
Scale bdquoB‟ with load 100kgf or 9807 N and 1588mm dia ball indenter is used forperforming tests on soft steel malleable iron copper and aluminum alloys
Scale bdquoC‟ with load 150kgf or 1471 N and diamond indenter is used for performing testson steel hard cost steel deep case hardened steel other metals which harder
First minor load is applied to overcome the film thickness on the metal surfaceMinor load also eliminates errors in the depth of measurement due to spring of themachine frame or setting down of the specimen and table attachments
The Rockwell hardness is derived from the measurement of the depth of theimpression This method of test is suitable for finished or machined parts of simpleshapes
PROCEDURE
1 Select the load by rotating the nob and fix the suitable indenter
2 Clean the test piece and place on the special anvil or worktable of the machine
3 Turn the capstan wheel to evaluate the test specimen into contact with the indenterpoint
4 Further turn the wheel for three rotations forcing the test specimen against theindenter This will ensure the minor load has been applied5 Set the pointer on the scale dial at the appropriate position
7232019 MOFMOS LABpdf
httpslidepdfcomreaderfullmofmos-labpdf 3147
Department of ANE MOFMOS LAB MANUAL
983093
6 Push the lever to apply the major load A dash pot provided in the loading mechanismto ensure that the load is applied gradually
7 As soon as the pointer comes to rest pull the handle in the reverse direction slowlyThis releases the major but not the minor load The pointer will now rotate in the reversedirection
8 The Rockwell hardness can read off the scale dial on the appropriate scale after thepointer comes to rest
OBSERVATIONS
Material of the specimen =
Thickness of test specimen =
Hardness scale used =
Test Material Rockwell Scale of weights Rockwell number Average
no Rockwell
no
Scale weight indent 1 2 3
PRECAUTIONS
1 For testing cylindrical test specimens use V-type platform
2 Calibrate the machine occasionally by using standard test blocks
3 For thin metal prices place another sufficiently thick metal piece between the testspecimen and the platform to avoid any damage which may likely occur to the platform
4 After applying major load wait for some time to allow the needle to come to restThe waiting time may vary from 2 to 8 seconds
7232019 MOFMOS LABpdf
httpslidepdfcomreaderfullmofmos-labpdf 3247
Department of ANE MOFMOS LAB
MANUAL
983094
5 The surface of the test piece should be smooth and even and free from oxidescale and foreign matter6 Test specimen should not be subjected to any heating of cold working
7 The distance between the centers of two adjacent indentation should be at least 4
Times the diameter of the indentation and the distance from the center of any indentation tothe edge of the test piece should be at least 25 times the diameter of the indentation
RESULT
7232019 MOFMOS LABpdf
httpslidepdfcomreaderfullmofmos-labpdf 3347
Department of ANE MOFMOS LAB MANUAL
983095
Calculation Part
7232019 MOFMOS LABpdf
httpslidepdfcomreaderfullmofmos-labpdf 3447
Department of ANE MOFMOS LAB MANUAL
983096
BRINELLrsquoS HARDNESS TEST
AIM To determine the Brinell hardness of the given test specimen
APPARATUS Brinell hardness machine test specimen Brinells Microscope
THEORY
Indentation Hardness-A number related to the area or to the depth of
the impression made by an indenter or fixed geometry under a known fixed load
This method consists of indenting the surface of the metal by a hardened steel
ball of specified diameter D mm under a given load F kgf and measuring the average
diameter d mm of the impression with the help of Brinell microscope fitted with a scaleThe Brinell hardness HB is defined as the quotient of the applied force F divided by the
spherical area of the impression
HB= Test load in kgfsurface area of indentation
=2F πD (D- D2- d2) kgmm2
PROCEDURE
1 Select the proper size of the ball and load to suit the material under test2 Clean the test specimen to be free from any dirt and defects or blemishes
3 Mount the test piece surface at right angles to the axis of the ball indenter plunger
4 Turn the platform so that the ball is lifted up
5 By shifting the lever applies the load and waits for some time
6 Release the load by shifting the lever
7 Take out the specimen and measure the diameter of indentation by means of theBrinell microscope8 Repeat the experiments at other positions of the test piece
9 Calculate the value of HB
7232019 MOFMOS LABpdf
httpslidepdfcomreaderfullmofmos-labpdf 3547
Department of ANE MOFMOS LAB MANUAL
983097
OBSERVATIONS
Test piece material = Diameter of the ballrdquo D ldquo =
Load section FD2 = Test load =
Load application time =
Least count of Brinell Microscope =
Diameter Average
Impression F D HB
S No in kg in mm Kgmm2
(d1) (d2) (d1+d2)2
PRECAUTIONS
1 The surface of the test piece should be clean
2 The testing machine should be protected throughout the test from shock or vibration
3 The test should be carried out at room temperature
4 The distance of the center of indentation from the edge of test piece should be at
least 25 times the diameter of the indentation and the distance between the center ofthe two adjacent indentations should be at least 4 times the diameter of the indentation
5 The diameter of each indentation should be measured in two directions at rightangles and the mean value readings used the purpose of determining the hardnessnumber
7232019 MOFMOS LABpdf
httpslidepdfcomreaderfullmofmos-labpdf 3647
Department of ANE
MOFMOS LAB MANUAL
983089983088
RESULT
Calculation Part
7232019 MOFMOS LABpdf
httpslidepdfcomreaderfullmofmos-labpdf 3747
Department of ANE MOFMOS LAB MANUAL
983089983089
SPRING TEST
AIM To determine the rigidity modulus of the spring
APPARATUS Spring testing machine vernier calipers spring specimen
THEORY
Closed coiled helical springs are the springs in which helix angle is very small or inother words the pitch between two adjacent turns is small A closed coiled helical springcarrying an axial load is shown in fig
As helix angle in case of close coiled helical springs are small hence the bendingeffect on the spring is ignored and we assume that the coils of close coiled helical
springs are to stand purely tensional stresses Let d=diameter ofthe spring wire
P= pitch of the helical spring N= number ofcoils R= mean radius of the spring coil
W=axial load on spring C=modulus of rigidity
τ=maximum shear stress induced in the wire θ=angle of twist in the
spring wire and
x= deflection of spring due to axial load l= length of wire
Net twisting moment on the wire T=WR
But twisting moment is also given by T= (π 16) τd3
From 1 ad 2 WR = (π 16) τd3 τ=16WR πd
3
above equation which gives the maximum shear stress induced in the wire (1) Length of one coil=2πR
Total length of the wire=2πRn (2)
Strain energy stored by the spring due to torsion
U= (τ 4C) [(π 4)d 2πRn] (3)
Work done on the spring =average load x deflection
= (12) Wx (4)
Equating 3 and 4
(12) Wx = (32W2R3n)Cd4
7232019 MOFMOS LABpdf
httpslidepdfcomreaderfullmofmos-labpdf 3847
Department of ANE MOFMOS LAB MANUAL
983089983090
x=64WR3nCd
4
Rigidity modulus of the spring
C=64WR3nxd
4
PROCEDURE
1) Consider the spring and find out itsmean coil radius R with the help ofvernier calipers
2) Find the diameter of the spring andnumber of turns
3) Fix the spring between two hooks
4) Now load is gradually applied
5) Note the deflection from thedeflection scale for different loadsapplied
6) Calculate the rigidity modulus usingabove formula
PRECAUTIONS
1) Dimensions should be measureaccurately with the help of verniercalipers
2) Deflection from the scale should benoted carefully and accurately
OBSERVATION TABLE
Sno Load applied deflection Rigidity modulus
C
Average rigidity modulus C =
RESULT
7232019 MOFMOS LABpdf
httpslidepdfcomreaderfullmofmos-labpdf 3947
Department of ANE MOFMOS LAB MANUAL
983089983091
Calculation Part
7232019 MOFMOS LABpdf
httpslidepdfcomreaderfullmofmos-labpdf 4047
Department of ANE MOFMOS LAB MANUAL
983089983092
TORSION
AIM To conduct torsion test on mild steel or cast iron specimen to find modulus of rigidity or to find angle of twist of the materials which are subjected to torsion
APPARATUS 1 A torsion test machine along with angle of twist measuring attachment
2 Standard specimen of mild steel or cast iron
3 Steel rule
4 Vernnier caliper or a micrometer
THEORY
For transmitting power through a rotating shaft it is necessary to apply a turning
force The force is applied tangentially and in the plane of transverse cross section The
torque or twisting moment may be calculated by multiplying two opposite turningmoments It is said to be in pure torsion and it will exhibit the tendency of shearing off at
every cross section which is perpendicular to the longitudinal axis
Torsion equation
Torsion equation is given by below
T IP = CθL = TR
T= maximum twisting torque (Nmm) IP =
polar moment of inertia (mm4) τ =shear
stress (Nmm2) C=modulus of rigidity (Nmm2)
θ=angle of twist in radians L=length of shaft under torsion (mm)
Assumptions made for getting torsion equation
1 The material of the shaft is uniform through out
2 The shaft circular in section remain circular after loading
3 Plane sections of shaft normal to its axis before loading remain plane after thetorque have been applied
4 The twist along the length of the shaft is uniform throughout
5 The distance between any two normal-sections remains the same after theapplication of torque
6 Maximum shear stress induced in the shaft due to application of torque does notexceed its elastic limit
7232019 MOFMOS LABpdf
httpslidepdfcomreaderfullmofmos-labpdf 4147
Department of ANE MOFMOS LAB MANUAL
983089983093
PROCEDURE
1 Select the suitable grips to suit the size of the specimen and clamp it in themachine by adjusting sliding jaw
2 Measure the diameter at about the three places and take average value
3 Choose the appropriate loading range depending upon specimen
4 Set the maximum load pointer to zero
5 Carry out straining by rotating the hand wheel or by switching on the motor
6 Load the members in suitable increments observe and record strain reading
7 Continue till failure of the specimen
8 Calculate the modulus of rigidity C by using the torsion equation
9 Plot the torque ndashtwist graph (T Vs θ)
OBSERVATIONS
Gauge length L =
Polar moment of inertia IP =
Modulus of rigidity C =TL IP θ =
SNo Twisting Moment Angle of Twist Modulus Average
Kgf Nm Degrees Radians of rigidity CNmm2
C
RESULT
7232019 MOFMOS LABpdf
httpslidepdfcomreaderfullmofmos-labpdf 4247
Department of ANE MOFMOS LAB MANUAL
983089983094
TENSILE TEST
AIM
To conduct tensile test on a mild steel specimen and determine the following
1 Limit of proportionality 2 Elastic Limit
3 Upper yield point 4 Lower yield point
5 Ultimate strength 6 Fracture strength
7 Young`s Modulus 8 Percentage elongation
9 Percentage reduction in area 10 Ductility
11 Toughness 12 True stress amp true strain
13 Malleability
APPARATUS tensile testing machine specimen steel rule vernier caliper micrometer
THEORY
The tensile test is most applied one of all mechanical tests In this test a test specimen is fixed
into grips connected to a straining device and to a load-measuring device (One end in stationary
grips and the other in movable grips) If the applied load is small enough the deformation of any
solid body is entirely elastic An elastically deformed solid will return to its original form as soon
as load is removed However if the load is too large the material can be deformed permanently
The initial part of the tension curve which represents the manner in which solid undergoes
plastic deformation is termed as plastic The stress below which the deformation is essentially
entirely elastic is known as the elastic limit of the material In some materials like mild steel a
sudden drop in load indicating both an upper and lower yield point denotes the onset of plastic
deformation However some materials do not exhibit a sharp yield point During plastic
deformation at lager extensions strain hardening cannot compensate for the decrease in section
and thus the load passes through a maximum and then begins to decrease At this stage the
ultimate strength which is defined as the ration of the load on the specimen to the original cross-section area reaches a maximum value Until this point the deformation is uniform at all the
sections of the specimen Further loading will eventually cause bdquoneck ‟ formation and rupture
follows
7232019 MOFMOS LABpdf
httpslidepdfcomreaderfullmofmos-labpdf 4347
Department of ANE MOFMOS LAB
MANUAL
983089983095
Usually a tension test is conducted at room temperature the tensile load is applied
slowly During this test either round or flat specimens may be used The load on the specimen is
applied mechanically or hydraulically depending on the type of testing machine
1 NominalEngg stress and NominalEngg strain
Original CS area = A0 (mm2)
Original gauge length = L0 (mm) Increase in gauge length = δL0
Nominal stress = PA0 (N mm2)
Nominal strain = δL0 L0
2 Limit of Proportionality Stress is proportional to strain up to this pointNormal Stress = PA PO Normal Strain = (δ LO) ALO
3 Elastic limit When the load is removed at ldquoBrdquo the specimen will go back to originalDimensions ie LO and δ AO Nominal stress = PB AO Normal Strain = (δ LO) B LO
If the specimen is loaded beyond elastic limit it will undergo permanent strainie Plastic deformation
4 Upper yield point Nominal stress = PC AO Nominal strain = (δ LO) D LO
5 Lower yield point Nominal stress = PD AO
Nominal strain = (δ LO) D LO 6 Ultimate load or maximum load point
Nominal ultimate stress = PE AO Nominal strain = (δ LO) E LO
7 Fracture Load point F
Nominal fracture stress = PF AO
Nominal strain at fracture = (δ LO) F LO
8 Young`s modulus (E) Young`s modulus (E) = StressStrain
(In the elastic region limit of proportionality = Nominal stress at ANominal strain at A 9Modulus of resilience = (Nominal stress at elastic limit)
2 2E
Area under Engg Stress - Strain diagram up to elastic limit10 Resilience = Modulus of Resilience x Volume of specimen undergoing Tensile stress
7232019 MOFMOS LABpdf
httpslidepdfcomreaderfullmofmos-labpdf 4447
Department of ANE MOFMOS LAB MANUAL
983089983096
11 Yield point ElongationElongation taking place in the specimen from C to D this istaking place without increase in stress
12 Modulus of toughnessArea under engineering stress ndash strain diagram up to fracture13 Toughness = Modulus of toughness x Volume of specimenThis indicates theamount of energy absorbed by the specimen before fracture take place
14 Ductility= (Final length at fracture ndash original length 10) x 100
15 MalleabilityIt is the ability of the material to undergo plastic deformation prior fracture under compressive loading conditions In a tensile test it is approximatedas percentage reduction in cross sectional area of the specimen Malleability =
(AO - Af )AO) x 100
True stress ndash true strain diagram
Engineering stress is calculated based on original cross sectional area (AO) But not on the actual cross sectional area at load bdquoP‟
True stress = PA = PAO x AO A
Since volume remains constant during plastic deformation we have AO LO = AL True stress = PAO x L LO
= PAO x ((LO + δLO) LO)
= P (1+e)= Nominal stress (1+ nominal strain)
True strain = Є = 1n (1+e)
These relations are valid up to ultimate load ie up to which the strain isuniform all along the gauge length
1 True Stress at upper yield point = Nominal stress at upper yield point ( 1+e O)True strain at C = 1n (1+eo)
2 True stress at ultimate load (E1)= Nominal ultimate stress ( 1+eE)True strain at ultimate load = 1n (1+eE)
3 True stress at fracture (E1) = Pf Af
Where Af is the area of cross section at fracture can be measured True
strain at fracture = 1n (Ao Af )
Area relation is taken instead of lengths because the strains are localized in theregion between ultimate load point and fracture point
4 Strain Hardening
From lower yield point onwards increase in load is required for increase instrain Thus the stress required for further deformation is more Thisphenomenon is called strain hardening
5 True ndash stress ndash true strain curve in log ndash log co ndash ordinates
When the true ndash stress and true ndash strain are plotted on log ndash log co ndash ordinates thecurve is a straight line
7232019 MOFMOS LABpdf
httpslidepdfcomreaderfullmofmos-labpdf 4547
Department of ANE MOFMOS LAB MANUAL
983120983137983143983141 983089983097 983151983142 983090983089
6 Ductile and Brittle Materials
If a material fails without much plastic deformation it can be called brittle If the percentageelongation at fracture is less than 25 the material is classified as brittle
bull Usually the metals with FCC and CPH structures are highly ductile
PROCEDURE
1 Measure the original gauge length and diameter of the specimen
2 Insert the specimen into grips of the test machine
3 Begin the load application and record load vs elongation data
4 Take the readings more frequently as yield point is approached
5 Measure elongation values
6 Continue the test till fracture occurs
7 By joining the two broken halves of the specimen together measure the final length anddiameter of specimen at fracture
RESULTS AND DISCUSSIONS
1 Plot the Engg Stress strain curve and determine the following
bull Limit of proportionality = (Nmm2)
bull Yield strength = (Nmm2)
bull Ultimate strength = (Nmm2)
bull Young`s modulus = (Nmm2)
bull Percentage elongation = bull Percentage reduction in area =
bull Fracture strength = (Nominal Engg)
bull Toughness = Area under stress ndash strain curve up to
fracture
bull Malleability
2 Plot True Stress True strain curve after calculating true ndash stress and true strain values at various
points
Estimate1) Strength coefficient
2) Strain hardening coefficient
3) Determine whether the material is ductile or brittle4) Comment on the results
7232019 MOFMOS LABpdf
httpslidepdfcomreaderfullmofmos-labpdf 4647
Department of ANE MOFMOS LAB MANUAL
983120983137983143983141 983090983088 983151983142 983090983089
SNo Load Deformation Stress Strain E
Calculation part-
7232019 MOFMOS LABpdf
httpslidepdfcomreaderfullmofmos-labpdf 4747
Department of ANE MOFMOS LAB MANUAL
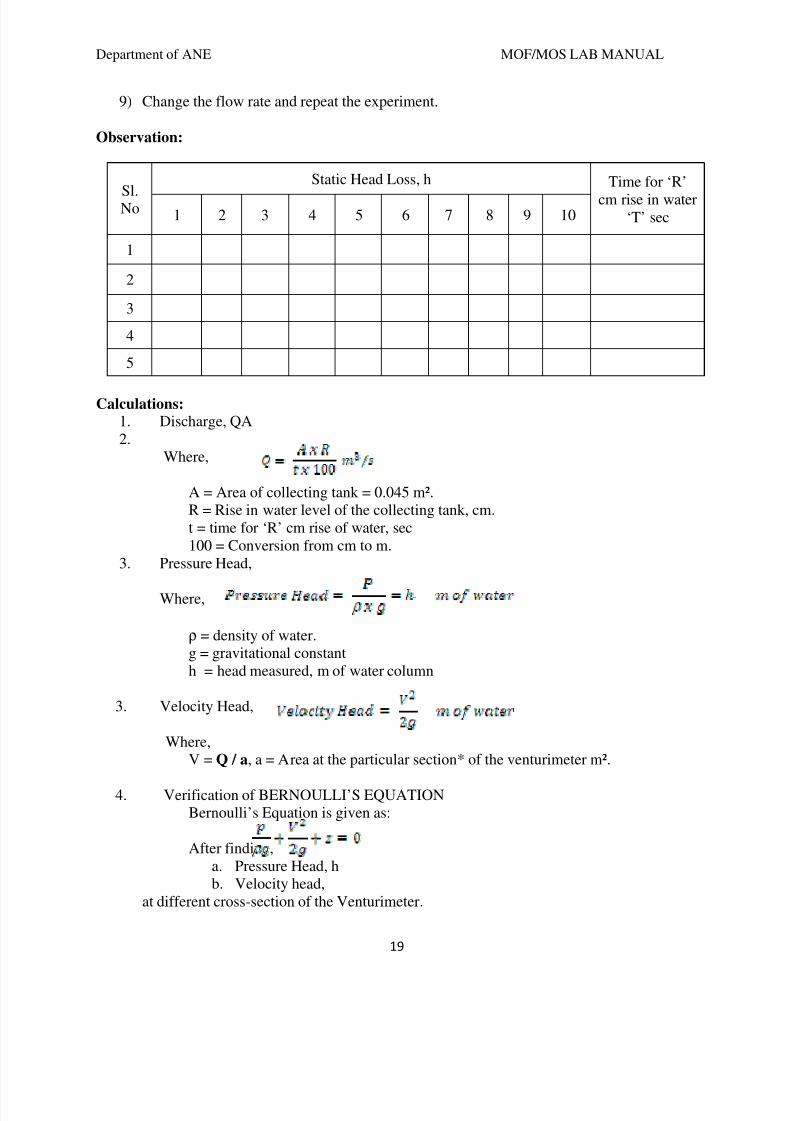
7232019 MOFMOS LABpdf
httpslidepdfcomreaderfullmofmos-labpdf 2247
Department of ANE MOFMOS LAB MANUAL
21
EXPERIMENT 5
CALIBRATION OF A TRIANGULAR NOTCH
AIM -To find the coefficient of discharge of given triangular notch
THEORY-A notch is a device used for measuring the rate of flow of liquid through a smallchannel or a tank It may be defined as an opening in the side of a tank or small channel in suchthat a way that the liquid surfaces in the tank or channel is below the top edge of the opening
NOTCHES ARE CLASSIFIED AS-1 Rectangular notch2 Triangular notch3 Trapezoidal notch
4 Stepped notch
A triangular notch is preferred to a rectangular notch due to the following reasonsThe expression for discharge of triangular notch is compared to rectangular notch is simple Formeasuring low discharge a triangular notch gives more accurate results than a rectangular notchIn the case of triangular notch only H is required for the computation of dischargeA trapezoidal notch is a combination of rectangular and triangular notch and thus the dischargethrough trapezoidal notch is the sum of above notchesA stepped notch is a combination of rectangular notch and triangular notch The dischargethrough the stepped notch is equal to sum of discharges through the different rectangularnotches
DESCRIPTION- The apparatus consists of1) Measuring tank 2) Sump tank3) Supply pump set 4) Inlet and out let valve
Measuring tank Stainless steel tank of size 030305mm height with the gage glass a scalearrangement for quick and easy measurements A ball valve is provided to empty the tank and adrain is provided at the bottom of the tank to drain the waste water when the unit is not in useWater for independent circulation through the unit for experimentation and arranged within thefloor space of the main unitSump tank The sump tank is a size of 020303m stainless steel tank to store sufficient waterfor independent circulation through the unit for experimentation and arranged within the floorspace of the main unit about 060305m with a gauge glass and scale arrangement A ballvalve is provided to empty the tankSupply Pump set The pump is 2525mm size mono block with frac12 HP 2880 RPM singlephase 220volts AC supply Inlet and out let valve- These valves are used to control the flow ofwater at inlet and out let
PROCEDURE1 Allow the water to drain up to triangular notch
7232019 MOFMOS LABpdf
httpslidepdfcomreaderfullmofmos-labpdf 2347
Department of ANE MOFMOS LAB MANUAL
22
2 Note down the depth of the water when the water is coinciding with the v notch point
3 Collect water in collecting tank and close the drain valve and find the time taken for the rise ofwater up to 20cm
4 Calculate the discharge by using the above results
5 Now substituting the values in the formula for calculation of discharge for v- notch gives therequired result
Precautionsbull Do not run the pump dry
bull Clean the tanks regularly say for every 15days
bull Do not run the equipment if the voltage is below 180V
bull Check all the electrical connections before running
bull
Before starting and after finishing the experiment the main
bull
Control valve should be in close position
bull
Do not attempt to alter the equipment as this may cause
7232019 MOFMOS LABpdf
httpslidepdfcomreaderfullmofmos-labpdf 2447
Department of ANE MOFMOS LAB MANUAL
23
bull Damage to the whole system
Result and Conclusion
7232019 MOFMOS LABpdf
httpslidepdfcomreaderfullmofmos-labpdf 2547
Department of ANE MOFMOS LAB MANUAL
24
MECHANICSOF SOLIDS
LAB
7232019 MOFMOS LABpdf
httpslidepdfcomreaderfullmofmos-labpdf 2647
Department of ANE MOFMOS LAB MANUAL
25
7232019 MOFMOS LABpdf
httpslidepdfcomreaderfullmofmos-labpdf 2747
Department of ANE MOFMOS LAB MANUAL
983089
IZOD IMPACT TEST
AIM To perform the izod impact test on materials
APPARATUS Izod impact test machine test specimen vernier calipers steel rule
IMPACT STRENGTH The resistance of a material to fracture under sudden load application
MATERIALS Two types of test pieces are used for this test as given
1) Square cross-section
2) Round cross-section
THEORY The type of test specimen used for this test is a Square Cross-section
The specimen may have single two or three notches The testing machine shouldhave the following specifications The angle between top face of grips and face holding the specimen Vertical=900 the angle of tip of hammer =750plusmn10
The angle between normal to the specimen and underside face of the hammer at Striking point=100plusmn10
Speed of hammer at impact=399msecStriking energy=168N-m or Joules Angle
Of drop of pendulum =900 Effective
weight of pendulum=2179kg
Minimum value of scale graduation=2 Joules
Permissible total friction loss of corresponding energy=050
Distance from the axis of rotation of distance between the base of specimen notch andthe point of specimen hit by the hammer=22mmplusmn05mm
The longitudinal axes of the test piece shall lie in the plane of swing of the center ofgravity of the hammer The notch shall be positioned so that its in the plane of thehammer the notch shall be positioned its plane of symmetry coincides with the top faceof the grips for setting the specimen the notch impact strength I is calculated accordingto the following relation
Where I= impact strength in joulesm2
7232019 MOFMOS LABpdf
httpslidepdfcomreaderfullmofmos-labpdf 2847
Department of ANE MOFMOS LAB MANUAL
983090
PROCEDURE
1 For conducting Izod test a proper striker is to be fitted firmly to the bottom of thehammer with the help of the clamming piece
2 The latching take for izod test is to be firmly fitted to the bearing housing at the side of
the columns3 The frictional loss of the machine can be determined by free fall test raise the
hammer by hands and latch in release the hammer by operating lever the pointer will
then indicate the energy loss due to friction From this reading confirm that the friction
loss is not exceeding 05 of the initial potential energy Otherwise frictional loss has to
be added to the final reading
4 The specimen for izod test is firmly fitted in the specimen support with the help ofclamping screw and eacutelan key Care should be taken that the notch on the specimenshould face to pendulum striker
5 After ascertaining that there is no person in the range of swinging pendulum release the
pendulum to smash the specimen6 Carefully operate the pendulum brake when returning after one swing to stop the oscillations
7 Read-off position of reading pointer on dial and note indicated value
8 Remove the broken specimen by loosening the clamping screw
The notch impact strength depends largely on the shape of the specimen and the notch the
values determined with other specimens therefore may not be compared with each other
OBSERVATION TABLE
S No A(Area of cross K Impact energy I Impact Strength
section of observed
specimen)
RESULT
7232019 MOFMOS LABpdf
httpslidepdfcomreaderfullmofmos-labpdf 2947
Department of ANE MOFMOS LAB MANUAL
983091
Calculation Part
7232019 MOFMOS LABpdf
httpslidepdfcomreaderfullmofmos-labpdf 3047
Department of ANE MOFMOS LAB MANUAL
983092
ROCKWELL HARDNESS TEST
AIM To determine the Rockwell hardness of the given test specimen
APPARATUS Rockwell hardness testing machine test specimen
THEORY
Hardness-the resistance of a metal to plastic deformationagainst indentation scratching abrasion or cutting
The depth of penetration of the indenter measures the hardness of a material by this Rockwell ‟s hardness test method the depth of penetration is inversely
proportional to the hardness Both ball or diamond cone types of indenters are used inthis testThere are three scales on the machine for taking hardness readings
Scale bdquoA‟ with load 60kgf or 5888N and diamond indenter is used for performing tests on steel and shallow case hardened steel
Scale bdquoB‟ with load 100kgf or 9807 N and 1588mm dia ball indenter is used forperforming tests on soft steel malleable iron copper and aluminum alloys
Scale bdquoC‟ with load 150kgf or 1471 N and diamond indenter is used for performing testson steel hard cost steel deep case hardened steel other metals which harder
First minor load is applied to overcome the film thickness on the metal surfaceMinor load also eliminates errors in the depth of measurement due to spring of themachine frame or setting down of the specimen and table attachments
The Rockwell hardness is derived from the measurement of the depth of theimpression This method of test is suitable for finished or machined parts of simpleshapes
PROCEDURE
1 Select the load by rotating the nob and fix the suitable indenter
2 Clean the test piece and place on the special anvil or worktable of the machine
3 Turn the capstan wheel to evaluate the test specimen into contact with the indenterpoint
4 Further turn the wheel for three rotations forcing the test specimen against theindenter This will ensure the minor load has been applied5 Set the pointer on the scale dial at the appropriate position
7232019 MOFMOS LABpdf
httpslidepdfcomreaderfullmofmos-labpdf 3147
Department of ANE MOFMOS LAB MANUAL
983093
6 Push the lever to apply the major load A dash pot provided in the loading mechanismto ensure that the load is applied gradually
7 As soon as the pointer comes to rest pull the handle in the reverse direction slowlyThis releases the major but not the minor load The pointer will now rotate in the reversedirection
8 The Rockwell hardness can read off the scale dial on the appropriate scale after thepointer comes to rest
OBSERVATIONS
Material of the specimen =
Thickness of test specimen =
Hardness scale used =
Test Material Rockwell Scale of weights Rockwell number Average
no Rockwell
no
Scale weight indent 1 2 3
PRECAUTIONS
1 For testing cylindrical test specimens use V-type platform
2 Calibrate the machine occasionally by using standard test blocks
3 For thin metal prices place another sufficiently thick metal piece between the testspecimen and the platform to avoid any damage which may likely occur to the platform
4 After applying major load wait for some time to allow the needle to come to restThe waiting time may vary from 2 to 8 seconds
7232019 MOFMOS LABpdf
httpslidepdfcomreaderfullmofmos-labpdf 3247
Department of ANE MOFMOS LAB
MANUAL
983094
5 The surface of the test piece should be smooth and even and free from oxidescale and foreign matter6 Test specimen should not be subjected to any heating of cold working
7 The distance between the centers of two adjacent indentation should be at least 4
Times the diameter of the indentation and the distance from the center of any indentation tothe edge of the test piece should be at least 25 times the diameter of the indentation
RESULT
7232019 MOFMOS LABpdf
httpslidepdfcomreaderfullmofmos-labpdf 3347
Department of ANE MOFMOS LAB MANUAL
983095
Calculation Part
7232019 MOFMOS LABpdf
httpslidepdfcomreaderfullmofmos-labpdf 3447
Department of ANE MOFMOS LAB MANUAL
983096
BRINELLrsquoS HARDNESS TEST
AIM To determine the Brinell hardness of the given test specimen
APPARATUS Brinell hardness machine test specimen Brinells Microscope
THEORY
Indentation Hardness-A number related to the area or to the depth of
the impression made by an indenter or fixed geometry under a known fixed load
This method consists of indenting the surface of the metal by a hardened steel
ball of specified diameter D mm under a given load F kgf and measuring the average
diameter d mm of the impression with the help of Brinell microscope fitted with a scaleThe Brinell hardness HB is defined as the quotient of the applied force F divided by the
spherical area of the impression
HB= Test load in kgfsurface area of indentation
=2F πD (D- D2- d2) kgmm2
PROCEDURE
1 Select the proper size of the ball and load to suit the material under test2 Clean the test specimen to be free from any dirt and defects or blemishes
3 Mount the test piece surface at right angles to the axis of the ball indenter plunger
4 Turn the platform so that the ball is lifted up
5 By shifting the lever applies the load and waits for some time
6 Release the load by shifting the lever
7 Take out the specimen and measure the diameter of indentation by means of theBrinell microscope8 Repeat the experiments at other positions of the test piece
9 Calculate the value of HB
7232019 MOFMOS LABpdf
httpslidepdfcomreaderfullmofmos-labpdf 3547
Department of ANE MOFMOS LAB MANUAL
983097
OBSERVATIONS
Test piece material = Diameter of the ballrdquo D ldquo =
Load section FD2 = Test load =
Load application time =
Least count of Brinell Microscope =
Diameter Average
Impression F D HB
S No in kg in mm Kgmm2
(d1) (d2) (d1+d2)2
PRECAUTIONS
1 The surface of the test piece should be clean
2 The testing machine should be protected throughout the test from shock or vibration
3 The test should be carried out at room temperature
4 The distance of the center of indentation from the edge of test piece should be at
least 25 times the diameter of the indentation and the distance between the center ofthe two adjacent indentations should be at least 4 times the diameter of the indentation
5 The diameter of each indentation should be measured in two directions at rightangles and the mean value readings used the purpose of determining the hardnessnumber
7232019 MOFMOS LABpdf
httpslidepdfcomreaderfullmofmos-labpdf 3647
Department of ANE
MOFMOS LAB MANUAL
983089983088
RESULT
Calculation Part
7232019 MOFMOS LABpdf
httpslidepdfcomreaderfullmofmos-labpdf 3747
Department of ANE MOFMOS LAB MANUAL
983089983089
SPRING TEST
AIM To determine the rigidity modulus of the spring
APPARATUS Spring testing machine vernier calipers spring specimen
THEORY
Closed coiled helical springs are the springs in which helix angle is very small or inother words the pitch between two adjacent turns is small A closed coiled helical springcarrying an axial load is shown in fig
As helix angle in case of close coiled helical springs are small hence the bendingeffect on the spring is ignored and we assume that the coils of close coiled helical
springs are to stand purely tensional stresses Let d=diameter ofthe spring wire
P= pitch of the helical spring N= number ofcoils R= mean radius of the spring coil
W=axial load on spring C=modulus of rigidity
τ=maximum shear stress induced in the wire θ=angle of twist in the
spring wire and
x= deflection of spring due to axial load l= length of wire
Net twisting moment on the wire T=WR
But twisting moment is also given by T= (π 16) τd3
From 1 ad 2 WR = (π 16) τd3 τ=16WR πd
3
above equation which gives the maximum shear stress induced in the wire (1) Length of one coil=2πR
Total length of the wire=2πRn (2)
Strain energy stored by the spring due to torsion
U= (τ 4C) [(π 4)d 2πRn] (3)
Work done on the spring =average load x deflection
= (12) Wx (4)
Equating 3 and 4
(12) Wx = (32W2R3n)Cd4
7232019 MOFMOS LABpdf
httpslidepdfcomreaderfullmofmos-labpdf 3847
Department of ANE MOFMOS LAB MANUAL
983089983090
x=64WR3nCd
4
Rigidity modulus of the spring
C=64WR3nxd
4
PROCEDURE
1) Consider the spring and find out itsmean coil radius R with the help ofvernier calipers
2) Find the diameter of the spring andnumber of turns
3) Fix the spring between two hooks
4) Now load is gradually applied
5) Note the deflection from thedeflection scale for different loadsapplied
6) Calculate the rigidity modulus usingabove formula
PRECAUTIONS
1) Dimensions should be measureaccurately with the help of verniercalipers
2) Deflection from the scale should benoted carefully and accurately
OBSERVATION TABLE
Sno Load applied deflection Rigidity modulus
C
Average rigidity modulus C =
RESULT
7232019 MOFMOS LABpdf
httpslidepdfcomreaderfullmofmos-labpdf 3947
Department of ANE MOFMOS LAB MANUAL
983089983091
Calculation Part
7232019 MOFMOS LABpdf
httpslidepdfcomreaderfullmofmos-labpdf 4047
Department of ANE MOFMOS LAB MANUAL
983089983092
TORSION
AIM To conduct torsion test on mild steel or cast iron specimen to find modulus of rigidity or to find angle of twist of the materials which are subjected to torsion
APPARATUS 1 A torsion test machine along with angle of twist measuring attachment
2 Standard specimen of mild steel or cast iron
3 Steel rule
4 Vernnier caliper or a micrometer
THEORY
For transmitting power through a rotating shaft it is necessary to apply a turning
force The force is applied tangentially and in the plane of transverse cross section The
torque or twisting moment may be calculated by multiplying two opposite turningmoments It is said to be in pure torsion and it will exhibit the tendency of shearing off at
every cross section which is perpendicular to the longitudinal axis
Torsion equation
Torsion equation is given by below
T IP = CθL = TR
T= maximum twisting torque (Nmm) IP =
polar moment of inertia (mm4) τ =shear
stress (Nmm2) C=modulus of rigidity (Nmm2)
θ=angle of twist in radians L=length of shaft under torsion (mm)
Assumptions made for getting torsion equation
1 The material of the shaft is uniform through out
2 The shaft circular in section remain circular after loading
3 Plane sections of shaft normal to its axis before loading remain plane after thetorque have been applied
4 The twist along the length of the shaft is uniform throughout
5 The distance between any two normal-sections remains the same after theapplication of torque
6 Maximum shear stress induced in the shaft due to application of torque does notexceed its elastic limit
7232019 MOFMOS LABpdf
httpslidepdfcomreaderfullmofmos-labpdf 4147
Department of ANE MOFMOS LAB MANUAL
983089983093
PROCEDURE
1 Select the suitable grips to suit the size of the specimen and clamp it in themachine by adjusting sliding jaw
2 Measure the diameter at about the three places and take average value
3 Choose the appropriate loading range depending upon specimen
4 Set the maximum load pointer to zero
5 Carry out straining by rotating the hand wheel or by switching on the motor
6 Load the members in suitable increments observe and record strain reading
7 Continue till failure of the specimen
8 Calculate the modulus of rigidity C by using the torsion equation
9 Plot the torque ndashtwist graph (T Vs θ)
OBSERVATIONS
Gauge length L =
Polar moment of inertia IP =
Modulus of rigidity C =TL IP θ =
SNo Twisting Moment Angle of Twist Modulus Average
Kgf Nm Degrees Radians of rigidity CNmm2
C
RESULT
7232019 MOFMOS LABpdf
httpslidepdfcomreaderfullmofmos-labpdf 4247
Department of ANE MOFMOS LAB MANUAL
983089983094
TENSILE TEST
AIM
To conduct tensile test on a mild steel specimen and determine the following
1 Limit of proportionality 2 Elastic Limit
3 Upper yield point 4 Lower yield point
5 Ultimate strength 6 Fracture strength
7 Young`s Modulus 8 Percentage elongation
9 Percentage reduction in area 10 Ductility
11 Toughness 12 True stress amp true strain
13 Malleability
APPARATUS tensile testing machine specimen steel rule vernier caliper micrometer
THEORY
The tensile test is most applied one of all mechanical tests In this test a test specimen is fixed
into grips connected to a straining device and to a load-measuring device (One end in stationary
grips and the other in movable grips) If the applied load is small enough the deformation of any
solid body is entirely elastic An elastically deformed solid will return to its original form as soon
as load is removed However if the load is too large the material can be deformed permanently
The initial part of the tension curve which represents the manner in which solid undergoes
plastic deformation is termed as plastic The stress below which the deformation is essentially
entirely elastic is known as the elastic limit of the material In some materials like mild steel a
sudden drop in load indicating both an upper and lower yield point denotes the onset of plastic
deformation However some materials do not exhibit a sharp yield point During plastic
deformation at lager extensions strain hardening cannot compensate for the decrease in section
and thus the load passes through a maximum and then begins to decrease At this stage the
ultimate strength which is defined as the ration of the load on the specimen to the original cross-section area reaches a maximum value Until this point the deformation is uniform at all the
sections of the specimen Further loading will eventually cause bdquoneck ‟ formation and rupture
follows
7232019 MOFMOS LABpdf
httpslidepdfcomreaderfullmofmos-labpdf 4347
Department of ANE MOFMOS LAB
MANUAL
983089983095
Usually a tension test is conducted at room temperature the tensile load is applied
slowly During this test either round or flat specimens may be used The load on the specimen is
applied mechanically or hydraulically depending on the type of testing machine
1 NominalEngg stress and NominalEngg strain
Original CS area = A0 (mm2)
Original gauge length = L0 (mm) Increase in gauge length = δL0
Nominal stress = PA0 (N mm2)
Nominal strain = δL0 L0
2 Limit of Proportionality Stress is proportional to strain up to this pointNormal Stress = PA PO Normal Strain = (δ LO) ALO
3 Elastic limit When the load is removed at ldquoBrdquo the specimen will go back to originalDimensions ie LO and δ AO Nominal stress = PB AO Normal Strain = (δ LO) B LO
If the specimen is loaded beyond elastic limit it will undergo permanent strainie Plastic deformation
4 Upper yield point Nominal stress = PC AO Nominal strain = (δ LO) D LO
5 Lower yield point Nominal stress = PD AO
Nominal strain = (δ LO) D LO 6 Ultimate load or maximum load point
Nominal ultimate stress = PE AO Nominal strain = (δ LO) E LO
7 Fracture Load point F
Nominal fracture stress = PF AO
Nominal strain at fracture = (δ LO) F LO
8 Young`s modulus (E) Young`s modulus (E) = StressStrain
(In the elastic region limit of proportionality = Nominal stress at ANominal strain at A 9Modulus of resilience = (Nominal stress at elastic limit)
2 2E
Area under Engg Stress - Strain diagram up to elastic limit10 Resilience = Modulus of Resilience x Volume of specimen undergoing Tensile stress
7232019 MOFMOS LABpdf
httpslidepdfcomreaderfullmofmos-labpdf 4447
Department of ANE MOFMOS LAB MANUAL
983089983096
11 Yield point ElongationElongation taking place in the specimen from C to D this istaking place without increase in stress
12 Modulus of toughnessArea under engineering stress ndash strain diagram up to fracture13 Toughness = Modulus of toughness x Volume of specimenThis indicates theamount of energy absorbed by the specimen before fracture take place
14 Ductility= (Final length at fracture ndash original length 10) x 100
15 MalleabilityIt is the ability of the material to undergo plastic deformation prior fracture under compressive loading conditions In a tensile test it is approximatedas percentage reduction in cross sectional area of the specimen Malleability =
(AO - Af )AO) x 100
True stress ndash true strain diagram
Engineering stress is calculated based on original cross sectional area (AO) But not on the actual cross sectional area at load bdquoP‟
True stress = PA = PAO x AO A
Since volume remains constant during plastic deformation we have AO LO = AL True stress = PAO x L LO
= PAO x ((LO + δLO) LO)
= P (1+e)= Nominal stress (1+ nominal strain)
True strain = Є = 1n (1+e)
These relations are valid up to ultimate load ie up to which the strain isuniform all along the gauge length
1 True Stress at upper yield point = Nominal stress at upper yield point ( 1+e O)True strain at C = 1n (1+eo)
2 True stress at ultimate load (E1)= Nominal ultimate stress ( 1+eE)True strain at ultimate load = 1n (1+eE)
3 True stress at fracture (E1) = Pf Af
Where Af is the area of cross section at fracture can be measured True
strain at fracture = 1n (Ao Af )
Area relation is taken instead of lengths because the strains are localized in theregion between ultimate load point and fracture point
4 Strain Hardening
From lower yield point onwards increase in load is required for increase instrain Thus the stress required for further deformation is more Thisphenomenon is called strain hardening
5 True ndash stress ndash true strain curve in log ndash log co ndash ordinates
When the true ndash stress and true ndash strain are plotted on log ndash log co ndash ordinates thecurve is a straight line
7232019 MOFMOS LABpdf
httpslidepdfcomreaderfullmofmos-labpdf 4547
Department of ANE MOFMOS LAB MANUAL
983120983137983143983141 983089983097 983151983142 983090983089
6 Ductile and Brittle Materials
If a material fails without much plastic deformation it can be called brittle If the percentageelongation at fracture is less than 25 the material is classified as brittle
bull Usually the metals with FCC and CPH structures are highly ductile
PROCEDURE
1 Measure the original gauge length and diameter of the specimen
2 Insert the specimen into grips of the test machine
3 Begin the load application and record load vs elongation data
4 Take the readings more frequently as yield point is approached
5 Measure elongation values
6 Continue the test till fracture occurs
7 By joining the two broken halves of the specimen together measure the final length anddiameter of specimen at fracture
RESULTS AND DISCUSSIONS
1 Plot the Engg Stress strain curve and determine the following
bull Limit of proportionality = (Nmm2)
bull Yield strength = (Nmm2)
bull Ultimate strength = (Nmm2)
bull Young`s modulus = (Nmm2)
bull Percentage elongation = bull Percentage reduction in area =
bull Fracture strength = (Nominal Engg)
bull Toughness = Area under stress ndash strain curve up to
fracture
bull Malleability
2 Plot True Stress True strain curve after calculating true ndash stress and true strain values at various
points
Estimate1) Strength coefficient
2) Strain hardening coefficient
3) Determine whether the material is ductile or brittle4) Comment on the results
7232019 MOFMOS LABpdf
httpslidepdfcomreaderfullmofmos-labpdf 4647
Department of ANE MOFMOS LAB MANUAL
983120983137983143983141 983090983088 983151983142 983090983089
SNo Load Deformation Stress Strain E
Calculation part-
7232019 MOFMOS LABpdf
httpslidepdfcomreaderfullmofmos-labpdf 4747
Department of ANE MOFMOS LAB MANUAL
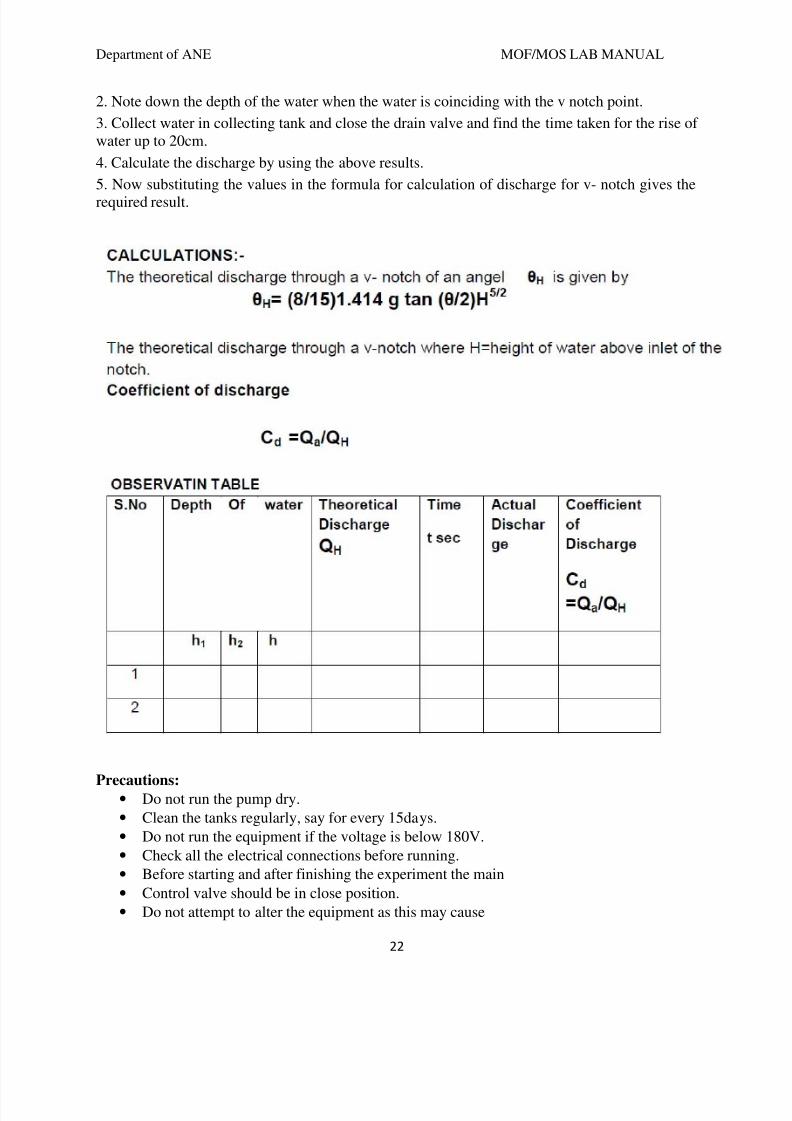
7232019 MOFMOS LABpdf
httpslidepdfcomreaderfullmofmos-labpdf 2747
Department of ANE MOFMOS LAB MANUAL
983089
IZOD IMPACT TEST
AIM To perform the izod impact test on materials
APPARATUS Izod impact test machine test specimen vernier calipers steel rule
IMPACT STRENGTH The resistance of a material to fracture under sudden load application
MATERIALS Two types of test pieces are used for this test as given
1) Square cross-section
2) Round cross-section
THEORY The type of test specimen used for this test is a Square Cross-section
The specimen may have single two or three notches The testing machine shouldhave the following specifications The angle between top face of grips and face holding the specimen Vertical=900 the angle of tip of hammer =750plusmn10
The angle between normal to the specimen and underside face of the hammer at Striking point=100plusmn10
Speed of hammer at impact=399msecStriking energy=168N-m or Joules Angle
Of drop of pendulum =900 Effective
weight of pendulum=2179kg
Minimum value of scale graduation=2 Joules
Permissible total friction loss of corresponding energy=050
Distance from the axis of rotation of distance between the base of specimen notch andthe point of specimen hit by the hammer=22mmplusmn05mm
The longitudinal axes of the test piece shall lie in the plane of swing of the center ofgravity of the hammer The notch shall be positioned so that its in the plane of thehammer the notch shall be positioned its plane of symmetry coincides with the top faceof the grips for setting the specimen the notch impact strength I is calculated accordingto the following relation
Where I= impact strength in joulesm2
7232019 MOFMOS LABpdf
httpslidepdfcomreaderfullmofmos-labpdf 2847
Department of ANE MOFMOS LAB MANUAL
983090
PROCEDURE
1 For conducting Izod test a proper striker is to be fitted firmly to the bottom of thehammer with the help of the clamming piece
2 The latching take for izod test is to be firmly fitted to the bearing housing at the side of
the columns3 The frictional loss of the machine can be determined by free fall test raise the
hammer by hands and latch in release the hammer by operating lever the pointer will
then indicate the energy loss due to friction From this reading confirm that the friction
loss is not exceeding 05 of the initial potential energy Otherwise frictional loss has to
be added to the final reading
4 The specimen for izod test is firmly fitted in the specimen support with the help ofclamping screw and eacutelan key Care should be taken that the notch on the specimenshould face to pendulum striker
5 After ascertaining that there is no person in the range of swinging pendulum release the
pendulum to smash the specimen6 Carefully operate the pendulum brake when returning after one swing to stop the oscillations
7 Read-off position of reading pointer on dial and note indicated value
8 Remove the broken specimen by loosening the clamping screw
The notch impact strength depends largely on the shape of the specimen and the notch the
values determined with other specimens therefore may not be compared with each other
OBSERVATION TABLE
S No A(Area of cross K Impact energy I Impact Strength
section of observed
specimen)
RESULT
7232019 MOFMOS LABpdf
httpslidepdfcomreaderfullmofmos-labpdf 2947
Department of ANE MOFMOS LAB MANUAL
983091
Calculation Part
7232019 MOFMOS LABpdf
httpslidepdfcomreaderfullmofmos-labpdf 3047
Department of ANE MOFMOS LAB MANUAL
983092
ROCKWELL HARDNESS TEST
AIM To determine the Rockwell hardness of the given test specimen
APPARATUS Rockwell hardness testing machine test specimen
THEORY
Hardness-the resistance of a metal to plastic deformationagainst indentation scratching abrasion or cutting
The depth of penetration of the indenter measures the hardness of a material by this Rockwell ‟s hardness test method the depth of penetration is inversely
proportional to the hardness Both ball or diamond cone types of indenters are used inthis testThere are three scales on the machine for taking hardness readings
Scale bdquoA‟ with load 60kgf or 5888N and diamond indenter is used for performing tests on steel and shallow case hardened steel
Scale bdquoB‟ with load 100kgf or 9807 N and 1588mm dia ball indenter is used forperforming tests on soft steel malleable iron copper and aluminum alloys
Scale bdquoC‟ with load 150kgf or 1471 N and diamond indenter is used for performing testson steel hard cost steel deep case hardened steel other metals which harder
First minor load is applied to overcome the film thickness on the metal surfaceMinor load also eliminates errors in the depth of measurement due to spring of themachine frame or setting down of the specimen and table attachments
The Rockwell hardness is derived from the measurement of the depth of theimpression This method of test is suitable for finished or machined parts of simpleshapes
PROCEDURE
1 Select the load by rotating the nob and fix the suitable indenter
2 Clean the test piece and place on the special anvil or worktable of the machine
3 Turn the capstan wheel to evaluate the test specimen into contact with the indenterpoint
4 Further turn the wheel for three rotations forcing the test specimen against theindenter This will ensure the minor load has been applied5 Set the pointer on the scale dial at the appropriate position
7232019 MOFMOS LABpdf
httpslidepdfcomreaderfullmofmos-labpdf 3147
Department of ANE MOFMOS LAB MANUAL
983093
6 Push the lever to apply the major load A dash pot provided in the loading mechanismto ensure that the load is applied gradually
7 As soon as the pointer comes to rest pull the handle in the reverse direction slowlyThis releases the major but not the minor load The pointer will now rotate in the reversedirection
8 The Rockwell hardness can read off the scale dial on the appropriate scale after thepointer comes to rest
OBSERVATIONS
Material of the specimen =
Thickness of test specimen =
Hardness scale used =
Test Material Rockwell Scale of weights Rockwell number Average
no Rockwell
no
Scale weight indent 1 2 3
PRECAUTIONS
1 For testing cylindrical test specimens use V-type platform
2 Calibrate the machine occasionally by using standard test blocks
3 For thin metal prices place another sufficiently thick metal piece between the testspecimen and the platform to avoid any damage which may likely occur to the platform
4 After applying major load wait for some time to allow the needle to come to restThe waiting time may vary from 2 to 8 seconds
7232019 MOFMOS LABpdf
httpslidepdfcomreaderfullmofmos-labpdf 3247
Department of ANE MOFMOS LAB
MANUAL
983094
5 The surface of the test piece should be smooth and even and free from oxidescale and foreign matter6 Test specimen should not be subjected to any heating of cold working
7 The distance between the centers of two adjacent indentation should be at least 4
Times the diameter of the indentation and the distance from the center of any indentation tothe edge of the test piece should be at least 25 times the diameter of the indentation
RESULT
7232019 MOFMOS LABpdf
httpslidepdfcomreaderfullmofmos-labpdf 3347
Department of ANE MOFMOS LAB MANUAL
983095
Calculation Part
7232019 MOFMOS LABpdf
httpslidepdfcomreaderfullmofmos-labpdf 3447
Department of ANE MOFMOS LAB MANUAL
983096
BRINELLrsquoS HARDNESS TEST
AIM To determine the Brinell hardness of the given test specimen
APPARATUS Brinell hardness machine test specimen Brinells Microscope
THEORY
Indentation Hardness-A number related to the area or to the depth of
the impression made by an indenter or fixed geometry under a known fixed load
This method consists of indenting the surface of the metal by a hardened steel
ball of specified diameter D mm under a given load F kgf and measuring the average
diameter d mm of the impression with the help of Brinell microscope fitted with a scaleThe Brinell hardness HB is defined as the quotient of the applied force F divided by the
spherical area of the impression
HB= Test load in kgfsurface area of indentation
=2F πD (D- D2- d2) kgmm2
PROCEDURE
1 Select the proper size of the ball and load to suit the material under test2 Clean the test specimen to be free from any dirt and defects or blemishes
3 Mount the test piece surface at right angles to the axis of the ball indenter plunger
4 Turn the platform so that the ball is lifted up
5 By shifting the lever applies the load and waits for some time
6 Release the load by shifting the lever
7 Take out the specimen and measure the diameter of indentation by means of theBrinell microscope8 Repeat the experiments at other positions of the test piece
9 Calculate the value of HB
7232019 MOFMOS LABpdf
httpslidepdfcomreaderfullmofmos-labpdf 3547
Department of ANE MOFMOS LAB MANUAL
983097
OBSERVATIONS
Test piece material = Diameter of the ballrdquo D ldquo =
Load section FD2 = Test load =
Load application time =
Least count of Brinell Microscope =
Diameter Average
Impression F D HB
S No in kg in mm Kgmm2
(d1) (d2) (d1+d2)2
PRECAUTIONS
1 The surface of the test piece should be clean
2 The testing machine should be protected throughout the test from shock or vibration
3 The test should be carried out at room temperature
4 The distance of the center of indentation from the edge of test piece should be at
least 25 times the diameter of the indentation and the distance between the center ofthe two adjacent indentations should be at least 4 times the diameter of the indentation
5 The diameter of each indentation should be measured in two directions at rightangles and the mean value readings used the purpose of determining the hardnessnumber
7232019 MOFMOS LABpdf
httpslidepdfcomreaderfullmofmos-labpdf 3647
Department of ANE
MOFMOS LAB MANUAL
983089983088
RESULT
Calculation Part
7232019 MOFMOS LABpdf
httpslidepdfcomreaderfullmofmos-labpdf 3747
Department of ANE MOFMOS LAB MANUAL
983089983089
SPRING TEST
AIM To determine the rigidity modulus of the spring
APPARATUS Spring testing machine vernier calipers spring specimen
THEORY
Closed coiled helical springs are the springs in which helix angle is very small or inother words the pitch between two adjacent turns is small A closed coiled helical springcarrying an axial load is shown in fig
As helix angle in case of close coiled helical springs are small hence the bendingeffect on the spring is ignored and we assume that the coils of close coiled helical
springs are to stand purely tensional stresses Let d=diameter ofthe spring wire
P= pitch of the helical spring N= number ofcoils R= mean radius of the spring coil
W=axial load on spring C=modulus of rigidity
τ=maximum shear stress induced in the wire θ=angle of twist in the
spring wire and
x= deflection of spring due to axial load l= length of wire
Net twisting moment on the wire T=WR
But twisting moment is also given by T= (π 16) τd3
From 1 ad 2 WR = (π 16) τd3 τ=16WR πd
3
above equation which gives the maximum shear stress induced in the wire (1) Length of one coil=2πR
Total length of the wire=2πRn (2)
Strain energy stored by the spring due to torsion
U= (τ 4C) [(π 4)d 2πRn] (3)
Work done on the spring =average load x deflection
= (12) Wx (4)
Equating 3 and 4
(12) Wx = (32W2R3n)Cd4
7232019 MOFMOS LABpdf
httpslidepdfcomreaderfullmofmos-labpdf 3847
Department of ANE MOFMOS LAB MANUAL
983089983090
x=64WR3nCd
4
Rigidity modulus of the spring
C=64WR3nxd
4
PROCEDURE
1) Consider the spring and find out itsmean coil radius R with the help ofvernier calipers
2) Find the diameter of the spring andnumber of turns
3) Fix the spring between two hooks
4) Now load is gradually applied
5) Note the deflection from thedeflection scale for different loadsapplied
6) Calculate the rigidity modulus usingabove formula
PRECAUTIONS
1) Dimensions should be measureaccurately with the help of verniercalipers
2) Deflection from the scale should benoted carefully and accurately
OBSERVATION TABLE
Sno Load applied deflection Rigidity modulus
C
Average rigidity modulus C =
RESULT
7232019 MOFMOS LABpdf
httpslidepdfcomreaderfullmofmos-labpdf 3947
Department of ANE MOFMOS LAB MANUAL
983089983091
Calculation Part
7232019 MOFMOS LABpdf
httpslidepdfcomreaderfullmofmos-labpdf 4047
Department of ANE MOFMOS LAB MANUAL
983089983092
TORSION
AIM To conduct torsion test on mild steel or cast iron specimen to find modulus of rigidity or to find angle of twist of the materials which are subjected to torsion
APPARATUS 1 A torsion test machine along with angle of twist measuring attachment
2 Standard specimen of mild steel or cast iron
3 Steel rule
4 Vernnier caliper or a micrometer
THEORY
For transmitting power through a rotating shaft it is necessary to apply a turning
force The force is applied tangentially and in the plane of transverse cross section The
torque or twisting moment may be calculated by multiplying two opposite turningmoments It is said to be in pure torsion and it will exhibit the tendency of shearing off at
every cross section which is perpendicular to the longitudinal axis
Torsion equation
Torsion equation is given by below
T IP = CθL = TR
T= maximum twisting torque (Nmm) IP =
polar moment of inertia (mm4) τ =shear
stress (Nmm2) C=modulus of rigidity (Nmm2)
θ=angle of twist in radians L=length of shaft under torsion (mm)
Assumptions made for getting torsion equation
1 The material of the shaft is uniform through out
2 The shaft circular in section remain circular after loading
3 Plane sections of shaft normal to its axis before loading remain plane after thetorque have been applied
4 The twist along the length of the shaft is uniform throughout
5 The distance between any two normal-sections remains the same after theapplication of torque
6 Maximum shear stress induced in the shaft due to application of torque does notexceed its elastic limit
7232019 MOFMOS LABpdf
httpslidepdfcomreaderfullmofmos-labpdf 4147
Department of ANE MOFMOS LAB MANUAL
983089983093
PROCEDURE
1 Select the suitable grips to suit the size of the specimen and clamp it in themachine by adjusting sliding jaw
2 Measure the diameter at about the three places and take average value
3 Choose the appropriate loading range depending upon specimen
4 Set the maximum load pointer to zero
5 Carry out straining by rotating the hand wheel or by switching on the motor
6 Load the members in suitable increments observe and record strain reading
7 Continue till failure of the specimen
8 Calculate the modulus of rigidity C by using the torsion equation
9 Plot the torque ndashtwist graph (T Vs θ)
OBSERVATIONS
Gauge length L =
Polar moment of inertia IP =
Modulus of rigidity C =TL IP θ =
SNo Twisting Moment Angle of Twist Modulus Average
Kgf Nm Degrees Radians of rigidity CNmm2
C
RESULT
7232019 MOFMOS LABpdf
httpslidepdfcomreaderfullmofmos-labpdf 4247
Department of ANE MOFMOS LAB MANUAL
983089983094
TENSILE TEST
AIM
To conduct tensile test on a mild steel specimen and determine the following
1 Limit of proportionality 2 Elastic Limit
3 Upper yield point 4 Lower yield point
5 Ultimate strength 6 Fracture strength
7 Young`s Modulus 8 Percentage elongation
9 Percentage reduction in area 10 Ductility
11 Toughness 12 True stress amp true strain
13 Malleability
APPARATUS tensile testing machine specimen steel rule vernier caliper micrometer
THEORY
The tensile test is most applied one of all mechanical tests In this test a test specimen is fixed
into grips connected to a straining device and to a load-measuring device (One end in stationary
grips and the other in movable grips) If the applied load is small enough the deformation of any
solid body is entirely elastic An elastically deformed solid will return to its original form as soon
as load is removed However if the load is too large the material can be deformed permanently
The initial part of the tension curve which represents the manner in which solid undergoes
plastic deformation is termed as plastic The stress below which the deformation is essentially
entirely elastic is known as the elastic limit of the material In some materials like mild steel a
sudden drop in load indicating both an upper and lower yield point denotes the onset of plastic
deformation However some materials do not exhibit a sharp yield point During plastic
deformation at lager extensions strain hardening cannot compensate for the decrease in section
and thus the load passes through a maximum and then begins to decrease At this stage the
ultimate strength which is defined as the ration of the load on the specimen to the original cross-section area reaches a maximum value Until this point the deformation is uniform at all the
sections of the specimen Further loading will eventually cause bdquoneck ‟ formation and rupture
follows
7232019 MOFMOS LABpdf
httpslidepdfcomreaderfullmofmos-labpdf 4347
Department of ANE MOFMOS LAB
MANUAL
983089983095
Usually a tension test is conducted at room temperature the tensile load is applied
slowly During this test either round or flat specimens may be used The load on the specimen is
applied mechanically or hydraulically depending on the type of testing machine
1 NominalEngg stress and NominalEngg strain
Original CS area = A0 (mm2)
Original gauge length = L0 (mm) Increase in gauge length = δL0
Nominal stress = PA0 (N mm2)
Nominal strain = δL0 L0
2 Limit of Proportionality Stress is proportional to strain up to this pointNormal Stress = PA PO Normal Strain = (δ LO) ALO
3 Elastic limit When the load is removed at ldquoBrdquo the specimen will go back to originalDimensions ie LO and δ AO Nominal stress = PB AO Normal Strain = (δ LO) B LO
If the specimen is loaded beyond elastic limit it will undergo permanent strainie Plastic deformation
4 Upper yield point Nominal stress = PC AO Nominal strain = (δ LO) D LO
5 Lower yield point Nominal stress = PD AO
Nominal strain = (δ LO) D LO 6 Ultimate load or maximum load point
Nominal ultimate stress = PE AO Nominal strain = (δ LO) E LO
7 Fracture Load point F
Nominal fracture stress = PF AO
Nominal strain at fracture = (δ LO) F LO
8 Young`s modulus (E) Young`s modulus (E) = StressStrain
(In the elastic region limit of proportionality = Nominal stress at ANominal strain at A 9Modulus of resilience = (Nominal stress at elastic limit)
2 2E
Area under Engg Stress - Strain diagram up to elastic limit10 Resilience = Modulus of Resilience x Volume of specimen undergoing Tensile stress
7232019 MOFMOS LABpdf
httpslidepdfcomreaderfullmofmos-labpdf 4447
Department of ANE MOFMOS LAB MANUAL
983089983096
11 Yield point ElongationElongation taking place in the specimen from C to D this istaking place without increase in stress
12 Modulus of toughnessArea under engineering stress ndash strain diagram up to fracture13 Toughness = Modulus of toughness x Volume of specimenThis indicates theamount of energy absorbed by the specimen before fracture take place
14 Ductility= (Final length at fracture ndash original length 10) x 100
15 MalleabilityIt is the ability of the material to undergo plastic deformation prior fracture under compressive loading conditions In a tensile test it is approximatedas percentage reduction in cross sectional area of the specimen Malleability =
(AO - Af )AO) x 100
True stress ndash true strain diagram
Engineering stress is calculated based on original cross sectional area (AO) But not on the actual cross sectional area at load bdquoP‟
True stress = PA = PAO x AO A
Since volume remains constant during plastic deformation we have AO LO = AL True stress = PAO x L LO
= PAO x ((LO + δLO) LO)
= P (1+e)= Nominal stress (1+ nominal strain)
True strain = Є = 1n (1+e)
These relations are valid up to ultimate load ie up to which the strain isuniform all along the gauge length
1 True Stress at upper yield point = Nominal stress at upper yield point ( 1+e O)True strain at C = 1n (1+eo)
2 True stress at ultimate load (E1)= Nominal ultimate stress ( 1+eE)True strain at ultimate load = 1n (1+eE)
3 True stress at fracture (E1) = Pf Af
Where Af is the area of cross section at fracture can be measured True
strain at fracture = 1n (Ao Af )
Area relation is taken instead of lengths because the strains are localized in theregion between ultimate load point and fracture point
4 Strain Hardening
From lower yield point onwards increase in load is required for increase instrain Thus the stress required for further deformation is more Thisphenomenon is called strain hardening
5 True ndash stress ndash true strain curve in log ndash log co ndash ordinates
When the true ndash stress and true ndash strain are plotted on log ndash log co ndash ordinates thecurve is a straight line
7232019 MOFMOS LABpdf
httpslidepdfcomreaderfullmofmos-labpdf 4547
Department of ANE MOFMOS LAB MANUAL
983120983137983143983141 983089983097 983151983142 983090983089
6 Ductile and Brittle Materials
If a material fails without much plastic deformation it can be called brittle If the percentageelongation at fracture is less than 25 the material is classified as brittle
bull Usually the metals with FCC and CPH structures are highly ductile
PROCEDURE
1 Measure the original gauge length and diameter of the specimen
2 Insert the specimen into grips of the test machine
3 Begin the load application and record load vs elongation data
4 Take the readings more frequently as yield point is approached
5 Measure elongation values
6 Continue the test till fracture occurs
7 By joining the two broken halves of the specimen together measure the final length anddiameter of specimen at fracture
RESULTS AND DISCUSSIONS
1 Plot the Engg Stress strain curve and determine the following
bull Limit of proportionality = (Nmm2)
bull Yield strength = (Nmm2)
bull Ultimate strength = (Nmm2)
bull Young`s modulus = (Nmm2)
bull Percentage elongation = bull Percentage reduction in area =
bull Fracture strength = (Nominal Engg)
bull Toughness = Area under stress ndash strain curve up to
fracture
bull Malleability
2 Plot True Stress True strain curve after calculating true ndash stress and true strain values at various
points
Estimate1) Strength coefficient
2) Strain hardening coefficient
3) Determine whether the material is ductile or brittle4) Comment on the results
7232019 MOFMOS LABpdf
httpslidepdfcomreaderfullmofmos-labpdf 4647
Department of ANE MOFMOS LAB MANUAL
983120983137983143983141 983090983088 983151983142 983090983089
SNo Load Deformation Stress Strain E
Calculation part-
7232019 MOFMOS LABpdf
httpslidepdfcomreaderfullmofmos-labpdf 4747
Department of ANE MOFMOS LAB MANUAL
7232019 MOFMOS LABpdf
httpslidepdfcomreaderfullmofmos-labpdf 2847
Department of ANE MOFMOS LAB MANUAL
983090
PROCEDURE
1 For conducting Izod test a proper striker is to be fitted firmly to the bottom of thehammer with the help of the clamming piece
2 The latching take for izod test is to be firmly fitted to the bearing housing at the side of
the columns3 The frictional loss of the machine can be determined by free fall test raise the
hammer by hands and latch in release the hammer by operating lever the pointer will
then indicate the energy loss due to friction From this reading confirm that the friction
loss is not exceeding 05 of the initial potential energy Otherwise frictional loss has to
be added to the final reading
4 The specimen for izod test is firmly fitted in the specimen support with the help ofclamping screw and eacutelan key Care should be taken that the notch on the specimenshould face to pendulum striker
5 After ascertaining that there is no person in the range of swinging pendulum release the
pendulum to smash the specimen6 Carefully operate the pendulum brake when returning after one swing to stop the oscillations
7 Read-off position of reading pointer on dial and note indicated value
8 Remove the broken specimen by loosening the clamping screw
The notch impact strength depends largely on the shape of the specimen and the notch the
values determined with other specimens therefore may not be compared with each other
OBSERVATION TABLE
S No A(Area of cross K Impact energy I Impact Strength
section of observed
specimen)
RESULT
7232019 MOFMOS LABpdf
httpslidepdfcomreaderfullmofmos-labpdf 2947
Department of ANE MOFMOS LAB MANUAL
983091
Calculation Part
7232019 MOFMOS LABpdf
httpslidepdfcomreaderfullmofmos-labpdf 3047
Department of ANE MOFMOS LAB MANUAL
983092
ROCKWELL HARDNESS TEST
AIM To determine the Rockwell hardness of the given test specimen
APPARATUS Rockwell hardness testing machine test specimen
THEORY
Hardness-the resistance of a metal to plastic deformationagainst indentation scratching abrasion or cutting
The depth of penetration of the indenter measures the hardness of a material by this Rockwell ‟s hardness test method the depth of penetration is inversely
proportional to the hardness Both ball or diamond cone types of indenters are used inthis testThere are three scales on the machine for taking hardness readings
Scale bdquoA‟ with load 60kgf or 5888N and diamond indenter is used for performing tests on steel and shallow case hardened steel
Scale bdquoB‟ with load 100kgf or 9807 N and 1588mm dia ball indenter is used forperforming tests on soft steel malleable iron copper and aluminum alloys
Scale bdquoC‟ with load 150kgf or 1471 N and diamond indenter is used for performing testson steel hard cost steel deep case hardened steel other metals which harder
First minor load is applied to overcome the film thickness on the metal surfaceMinor load also eliminates errors in the depth of measurement due to spring of themachine frame or setting down of the specimen and table attachments
The Rockwell hardness is derived from the measurement of the depth of theimpression This method of test is suitable for finished or machined parts of simpleshapes
PROCEDURE
1 Select the load by rotating the nob and fix the suitable indenter
2 Clean the test piece and place on the special anvil or worktable of the machine
3 Turn the capstan wheel to evaluate the test specimen into contact with the indenterpoint
4 Further turn the wheel for three rotations forcing the test specimen against theindenter This will ensure the minor load has been applied5 Set the pointer on the scale dial at the appropriate position
7232019 MOFMOS LABpdf
httpslidepdfcomreaderfullmofmos-labpdf 3147
Department of ANE MOFMOS LAB MANUAL
983093
6 Push the lever to apply the major load A dash pot provided in the loading mechanismto ensure that the load is applied gradually
7 As soon as the pointer comes to rest pull the handle in the reverse direction slowlyThis releases the major but not the minor load The pointer will now rotate in the reversedirection
8 The Rockwell hardness can read off the scale dial on the appropriate scale after thepointer comes to rest
OBSERVATIONS
Material of the specimen =
Thickness of test specimen =
Hardness scale used =
Test Material Rockwell Scale of weights Rockwell number Average
no Rockwell
no
Scale weight indent 1 2 3
PRECAUTIONS
1 For testing cylindrical test specimens use V-type platform
2 Calibrate the machine occasionally by using standard test blocks
3 For thin metal prices place another sufficiently thick metal piece between the testspecimen and the platform to avoid any damage which may likely occur to the platform
4 After applying major load wait for some time to allow the needle to come to restThe waiting time may vary from 2 to 8 seconds
7232019 MOFMOS LABpdf
httpslidepdfcomreaderfullmofmos-labpdf 3247
Department of ANE MOFMOS LAB
MANUAL
983094
5 The surface of the test piece should be smooth and even and free from oxidescale and foreign matter6 Test specimen should not be subjected to any heating of cold working
7 The distance between the centers of two adjacent indentation should be at least 4
Times the diameter of the indentation and the distance from the center of any indentation tothe edge of the test piece should be at least 25 times the diameter of the indentation
RESULT
7232019 MOFMOS LABpdf
httpslidepdfcomreaderfullmofmos-labpdf 3347
Department of ANE MOFMOS LAB MANUAL
983095
Calculation Part
7232019 MOFMOS LABpdf
httpslidepdfcomreaderfullmofmos-labpdf 3447
Department of ANE MOFMOS LAB MANUAL
983096
BRINELLrsquoS HARDNESS TEST
AIM To determine the Brinell hardness of the given test specimen
APPARATUS Brinell hardness machine test specimen Brinells Microscope
THEORY
Indentation Hardness-A number related to the area or to the depth of
the impression made by an indenter or fixed geometry under a known fixed load
This method consists of indenting the surface of the metal by a hardened steel
ball of specified diameter D mm under a given load F kgf and measuring the average
diameter d mm of the impression with the help of Brinell microscope fitted with a scaleThe Brinell hardness HB is defined as the quotient of the applied force F divided by the
spherical area of the impression
HB= Test load in kgfsurface area of indentation
=2F πD (D- D2- d2) kgmm2
PROCEDURE
1 Select the proper size of the ball and load to suit the material under test2 Clean the test specimen to be free from any dirt and defects or blemishes
3 Mount the test piece surface at right angles to the axis of the ball indenter plunger
4 Turn the platform so that the ball is lifted up
5 By shifting the lever applies the load and waits for some time
6 Release the load by shifting the lever
7 Take out the specimen and measure the diameter of indentation by means of theBrinell microscope8 Repeat the experiments at other positions of the test piece
9 Calculate the value of HB
7232019 MOFMOS LABpdf
httpslidepdfcomreaderfullmofmos-labpdf 3547
Department of ANE MOFMOS LAB MANUAL
983097
OBSERVATIONS
Test piece material = Diameter of the ballrdquo D ldquo =
Load section FD2 = Test load =
Load application time =
Least count of Brinell Microscope =
Diameter Average
Impression F D HB
S No in kg in mm Kgmm2
(d1) (d2) (d1+d2)2
PRECAUTIONS
1 The surface of the test piece should be clean
2 The testing machine should be protected throughout the test from shock or vibration
3 The test should be carried out at room temperature
4 The distance of the center of indentation from the edge of test piece should be at
least 25 times the diameter of the indentation and the distance between the center ofthe two adjacent indentations should be at least 4 times the diameter of the indentation
5 The diameter of each indentation should be measured in two directions at rightangles and the mean value readings used the purpose of determining the hardnessnumber
7232019 MOFMOS LABpdf
httpslidepdfcomreaderfullmofmos-labpdf 3647
Department of ANE
MOFMOS LAB MANUAL
983089983088
RESULT
Calculation Part
7232019 MOFMOS LABpdf
httpslidepdfcomreaderfullmofmos-labpdf 3747
Department of ANE MOFMOS LAB MANUAL
983089983089
SPRING TEST
AIM To determine the rigidity modulus of the spring
APPARATUS Spring testing machine vernier calipers spring specimen
THEORY
Closed coiled helical springs are the springs in which helix angle is very small or inother words the pitch between two adjacent turns is small A closed coiled helical springcarrying an axial load is shown in fig
As helix angle in case of close coiled helical springs are small hence the bendingeffect on the spring is ignored and we assume that the coils of close coiled helical
springs are to stand purely tensional stresses Let d=diameter ofthe spring wire
P= pitch of the helical spring N= number ofcoils R= mean radius of the spring coil
W=axial load on spring C=modulus of rigidity
τ=maximum shear stress induced in the wire θ=angle of twist in the
spring wire and
x= deflection of spring due to axial load l= length of wire
Net twisting moment on the wire T=WR
But twisting moment is also given by T= (π 16) τd3
From 1 ad 2 WR = (π 16) τd3 τ=16WR πd
3
above equation which gives the maximum shear stress induced in the wire (1) Length of one coil=2πR
Total length of the wire=2πRn (2)
Strain energy stored by the spring due to torsion
U= (τ 4C) [(π 4)d 2πRn] (3)
Work done on the spring =average load x deflection
= (12) Wx (4)
Equating 3 and 4
(12) Wx = (32W2R3n)Cd4
7232019 MOFMOS LABpdf
httpslidepdfcomreaderfullmofmos-labpdf 3847
Department of ANE MOFMOS LAB MANUAL
983089983090
x=64WR3nCd
4
Rigidity modulus of the spring
C=64WR3nxd
4
PROCEDURE
1) Consider the spring and find out itsmean coil radius R with the help ofvernier calipers
2) Find the diameter of the spring andnumber of turns
3) Fix the spring between two hooks
4) Now load is gradually applied
5) Note the deflection from thedeflection scale for different loadsapplied
6) Calculate the rigidity modulus usingabove formula
PRECAUTIONS
1) Dimensions should be measureaccurately with the help of verniercalipers
2) Deflection from the scale should benoted carefully and accurately
OBSERVATION TABLE
Sno Load applied deflection Rigidity modulus
C
Average rigidity modulus C =
RESULT
7232019 MOFMOS LABpdf
httpslidepdfcomreaderfullmofmos-labpdf 3947
Department of ANE MOFMOS LAB MANUAL
983089983091
Calculation Part
7232019 MOFMOS LABpdf
httpslidepdfcomreaderfullmofmos-labpdf 4047
Department of ANE MOFMOS LAB MANUAL
983089983092
TORSION
AIM To conduct torsion test on mild steel or cast iron specimen to find modulus of rigidity or to find angle of twist of the materials which are subjected to torsion
APPARATUS 1 A torsion test machine along with angle of twist measuring attachment
2 Standard specimen of mild steel or cast iron
3 Steel rule
4 Vernnier caliper or a micrometer
THEORY
For transmitting power through a rotating shaft it is necessary to apply a turning
force The force is applied tangentially and in the plane of transverse cross section The
torque or twisting moment may be calculated by multiplying two opposite turningmoments It is said to be in pure torsion and it will exhibit the tendency of shearing off at
every cross section which is perpendicular to the longitudinal axis
Torsion equation
Torsion equation is given by below
T IP = CθL = TR
T= maximum twisting torque (Nmm) IP =
polar moment of inertia (mm4) τ =shear
stress (Nmm2) C=modulus of rigidity (Nmm2)
θ=angle of twist in radians L=length of shaft under torsion (mm)
Assumptions made for getting torsion equation
1 The material of the shaft is uniform through out
2 The shaft circular in section remain circular after loading
3 Plane sections of shaft normal to its axis before loading remain plane after thetorque have been applied
4 The twist along the length of the shaft is uniform throughout
5 The distance between any two normal-sections remains the same after theapplication of torque
6 Maximum shear stress induced in the shaft due to application of torque does notexceed its elastic limit
7232019 MOFMOS LABpdf
httpslidepdfcomreaderfullmofmos-labpdf 4147
Department of ANE MOFMOS LAB MANUAL
983089983093
PROCEDURE
1 Select the suitable grips to suit the size of the specimen and clamp it in themachine by adjusting sliding jaw
2 Measure the diameter at about the three places and take average value
3 Choose the appropriate loading range depending upon specimen
4 Set the maximum load pointer to zero
5 Carry out straining by rotating the hand wheel or by switching on the motor
6 Load the members in suitable increments observe and record strain reading
7 Continue till failure of the specimen
8 Calculate the modulus of rigidity C by using the torsion equation
9 Plot the torque ndashtwist graph (T Vs θ)
OBSERVATIONS
Gauge length L =
Polar moment of inertia IP =
Modulus of rigidity C =TL IP θ =
SNo Twisting Moment Angle of Twist Modulus Average
Kgf Nm Degrees Radians of rigidity CNmm2
C
RESULT
7232019 MOFMOS LABpdf
httpslidepdfcomreaderfullmofmos-labpdf 4247
Department of ANE MOFMOS LAB MANUAL
983089983094
TENSILE TEST
AIM
To conduct tensile test on a mild steel specimen and determine the following
1 Limit of proportionality 2 Elastic Limit
3 Upper yield point 4 Lower yield point
5 Ultimate strength 6 Fracture strength
7 Young`s Modulus 8 Percentage elongation
9 Percentage reduction in area 10 Ductility
11 Toughness 12 True stress amp true strain
13 Malleability
APPARATUS tensile testing machine specimen steel rule vernier caliper micrometer
THEORY
The tensile test is most applied one of all mechanical tests In this test a test specimen is fixed
into grips connected to a straining device and to a load-measuring device (One end in stationary
grips and the other in movable grips) If the applied load is small enough the deformation of any
solid body is entirely elastic An elastically deformed solid will return to its original form as soon
as load is removed However if the load is too large the material can be deformed permanently
The initial part of the tension curve which represents the manner in which solid undergoes
plastic deformation is termed as plastic The stress below which the deformation is essentially
entirely elastic is known as the elastic limit of the material In some materials like mild steel a
sudden drop in load indicating both an upper and lower yield point denotes the onset of plastic
deformation However some materials do not exhibit a sharp yield point During plastic
deformation at lager extensions strain hardening cannot compensate for the decrease in section
and thus the load passes through a maximum and then begins to decrease At this stage the
ultimate strength which is defined as the ration of the load on the specimen to the original cross-section area reaches a maximum value Until this point the deformation is uniform at all the
sections of the specimen Further loading will eventually cause bdquoneck ‟ formation and rupture
follows
7232019 MOFMOS LABpdf
httpslidepdfcomreaderfullmofmos-labpdf 4347
Department of ANE MOFMOS LAB
MANUAL
983089983095
Usually a tension test is conducted at room temperature the tensile load is applied
slowly During this test either round or flat specimens may be used The load on the specimen is
applied mechanically or hydraulically depending on the type of testing machine
1 NominalEngg stress and NominalEngg strain
Original CS area = A0 (mm2)
Original gauge length = L0 (mm) Increase in gauge length = δL0
Nominal stress = PA0 (N mm2)
Nominal strain = δL0 L0
2 Limit of Proportionality Stress is proportional to strain up to this pointNormal Stress = PA PO Normal Strain = (δ LO) ALO
3 Elastic limit When the load is removed at ldquoBrdquo the specimen will go back to originalDimensions ie LO and δ AO Nominal stress = PB AO Normal Strain = (δ LO) B LO
If the specimen is loaded beyond elastic limit it will undergo permanent strainie Plastic deformation
4 Upper yield point Nominal stress = PC AO Nominal strain = (δ LO) D LO
5 Lower yield point Nominal stress = PD AO
Nominal strain = (δ LO) D LO 6 Ultimate load or maximum load point
Nominal ultimate stress = PE AO Nominal strain = (δ LO) E LO
7 Fracture Load point F
Nominal fracture stress = PF AO
Nominal strain at fracture = (δ LO) F LO
8 Young`s modulus (E) Young`s modulus (E) = StressStrain
(In the elastic region limit of proportionality = Nominal stress at ANominal strain at A 9Modulus of resilience = (Nominal stress at elastic limit)
2 2E
Area under Engg Stress - Strain diagram up to elastic limit10 Resilience = Modulus of Resilience x Volume of specimen undergoing Tensile stress
7232019 MOFMOS LABpdf
httpslidepdfcomreaderfullmofmos-labpdf 4447
Department of ANE MOFMOS LAB MANUAL
983089983096
11 Yield point ElongationElongation taking place in the specimen from C to D this istaking place without increase in stress
12 Modulus of toughnessArea under engineering stress ndash strain diagram up to fracture13 Toughness = Modulus of toughness x Volume of specimenThis indicates theamount of energy absorbed by the specimen before fracture take place
14 Ductility= (Final length at fracture ndash original length 10) x 100
15 MalleabilityIt is the ability of the material to undergo plastic deformation prior fracture under compressive loading conditions In a tensile test it is approximatedas percentage reduction in cross sectional area of the specimen Malleability =
(AO - Af )AO) x 100
True stress ndash true strain diagram
Engineering stress is calculated based on original cross sectional area (AO) But not on the actual cross sectional area at load bdquoP‟
True stress = PA = PAO x AO A
Since volume remains constant during plastic deformation we have AO LO = AL True stress = PAO x L LO
= PAO x ((LO + δLO) LO)
= P (1+e)= Nominal stress (1+ nominal strain)
True strain = Є = 1n (1+e)
These relations are valid up to ultimate load ie up to which the strain isuniform all along the gauge length
1 True Stress at upper yield point = Nominal stress at upper yield point ( 1+e O)True strain at C = 1n (1+eo)
2 True stress at ultimate load (E1)= Nominal ultimate stress ( 1+eE)True strain at ultimate load = 1n (1+eE)
3 True stress at fracture (E1) = Pf Af
Where Af is the area of cross section at fracture can be measured True
strain at fracture = 1n (Ao Af )
Area relation is taken instead of lengths because the strains are localized in theregion between ultimate load point and fracture point
4 Strain Hardening
From lower yield point onwards increase in load is required for increase instrain Thus the stress required for further deformation is more Thisphenomenon is called strain hardening
5 True ndash stress ndash true strain curve in log ndash log co ndash ordinates
When the true ndash stress and true ndash strain are plotted on log ndash log co ndash ordinates thecurve is a straight line
7232019 MOFMOS LABpdf
httpslidepdfcomreaderfullmofmos-labpdf 4547
Department of ANE MOFMOS LAB MANUAL
983120983137983143983141 983089983097 983151983142 983090983089
6 Ductile and Brittle Materials
If a material fails without much plastic deformation it can be called brittle If the percentageelongation at fracture is less than 25 the material is classified as brittle
bull Usually the metals with FCC and CPH structures are highly ductile
PROCEDURE
1 Measure the original gauge length and diameter of the specimen
2 Insert the specimen into grips of the test machine
3 Begin the load application and record load vs elongation data
4 Take the readings more frequently as yield point is approached
5 Measure elongation values
6 Continue the test till fracture occurs
7 By joining the two broken halves of the specimen together measure the final length anddiameter of specimen at fracture
RESULTS AND DISCUSSIONS
1 Plot the Engg Stress strain curve and determine the following
bull Limit of proportionality = (Nmm2)
bull Yield strength = (Nmm2)
bull Ultimate strength = (Nmm2)
bull Young`s modulus = (Nmm2)
bull Percentage elongation = bull Percentage reduction in area =
bull Fracture strength = (Nominal Engg)
bull Toughness = Area under stress ndash strain curve up to
fracture
bull Malleability
2 Plot True Stress True strain curve after calculating true ndash stress and true strain values at various
points
Estimate1) Strength coefficient
2) Strain hardening coefficient
3) Determine whether the material is ductile or brittle4) Comment on the results
7232019 MOFMOS LABpdf
httpslidepdfcomreaderfullmofmos-labpdf 4647
Department of ANE MOFMOS LAB MANUAL
983120983137983143983141 983090983088 983151983142 983090983089
SNo Load Deformation Stress Strain E
Calculation part-
7232019 MOFMOS LABpdf
httpslidepdfcomreaderfullmofmos-labpdf 4747
Department of ANE MOFMOS LAB MANUAL

7232019 MOFMOS LABpdf
httpslidepdfcomreaderfullmofmos-labpdf 2947
Department of ANE MOFMOS LAB MANUAL
983091
Calculation Part
7232019 MOFMOS LABpdf
httpslidepdfcomreaderfullmofmos-labpdf 3047
Department of ANE MOFMOS LAB MANUAL
983092
ROCKWELL HARDNESS TEST
AIM To determine the Rockwell hardness of the given test specimen
APPARATUS Rockwell hardness testing machine test specimen
THEORY
Hardness-the resistance of a metal to plastic deformationagainst indentation scratching abrasion or cutting
The depth of penetration of the indenter measures the hardness of a material by this Rockwell ‟s hardness test method the depth of penetration is inversely
proportional to the hardness Both ball or diamond cone types of indenters are used inthis testThere are three scales on the machine for taking hardness readings
Scale bdquoA‟ with load 60kgf or 5888N and diamond indenter is used for performing tests on steel and shallow case hardened steel
Scale bdquoB‟ with load 100kgf or 9807 N and 1588mm dia ball indenter is used forperforming tests on soft steel malleable iron copper and aluminum alloys
Scale bdquoC‟ with load 150kgf or 1471 N and diamond indenter is used for performing testson steel hard cost steel deep case hardened steel other metals which harder
First minor load is applied to overcome the film thickness on the metal surfaceMinor load also eliminates errors in the depth of measurement due to spring of themachine frame or setting down of the specimen and table attachments
The Rockwell hardness is derived from the measurement of the depth of theimpression This method of test is suitable for finished or machined parts of simpleshapes
PROCEDURE
1 Select the load by rotating the nob and fix the suitable indenter
2 Clean the test piece and place on the special anvil or worktable of the machine
3 Turn the capstan wheel to evaluate the test specimen into contact with the indenterpoint
4 Further turn the wheel for three rotations forcing the test specimen against theindenter This will ensure the minor load has been applied5 Set the pointer on the scale dial at the appropriate position
7232019 MOFMOS LABpdf
httpslidepdfcomreaderfullmofmos-labpdf 3147
Department of ANE MOFMOS LAB MANUAL
983093
6 Push the lever to apply the major load A dash pot provided in the loading mechanismto ensure that the load is applied gradually
7 As soon as the pointer comes to rest pull the handle in the reverse direction slowlyThis releases the major but not the minor load The pointer will now rotate in the reversedirection
8 The Rockwell hardness can read off the scale dial on the appropriate scale after thepointer comes to rest
OBSERVATIONS
Material of the specimen =
Thickness of test specimen =
Hardness scale used =
Test Material Rockwell Scale of weights Rockwell number Average
no Rockwell
no
Scale weight indent 1 2 3
PRECAUTIONS
1 For testing cylindrical test specimens use V-type platform
2 Calibrate the machine occasionally by using standard test blocks
3 For thin metal prices place another sufficiently thick metal piece between the testspecimen and the platform to avoid any damage which may likely occur to the platform
4 After applying major load wait for some time to allow the needle to come to restThe waiting time may vary from 2 to 8 seconds
7232019 MOFMOS LABpdf
httpslidepdfcomreaderfullmofmos-labpdf 3247
Department of ANE MOFMOS LAB
MANUAL
983094
5 The surface of the test piece should be smooth and even and free from oxidescale and foreign matter6 Test specimen should not be subjected to any heating of cold working
7 The distance between the centers of two adjacent indentation should be at least 4
Times the diameter of the indentation and the distance from the center of any indentation tothe edge of the test piece should be at least 25 times the diameter of the indentation
RESULT
7232019 MOFMOS LABpdf
httpslidepdfcomreaderfullmofmos-labpdf 3347
Department of ANE MOFMOS LAB MANUAL
983095
Calculation Part
7232019 MOFMOS LABpdf
httpslidepdfcomreaderfullmofmos-labpdf 3447
Department of ANE MOFMOS LAB MANUAL
983096
BRINELLrsquoS HARDNESS TEST
AIM To determine the Brinell hardness of the given test specimen
APPARATUS Brinell hardness machine test specimen Brinells Microscope
THEORY
Indentation Hardness-A number related to the area or to the depth of
the impression made by an indenter or fixed geometry under a known fixed load
This method consists of indenting the surface of the metal by a hardened steel
ball of specified diameter D mm under a given load F kgf and measuring the average
diameter d mm of the impression with the help of Brinell microscope fitted with a scaleThe Brinell hardness HB is defined as the quotient of the applied force F divided by the
spherical area of the impression
HB= Test load in kgfsurface area of indentation
=2F πD (D- D2- d2) kgmm2
PROCEDURE
1 Select the proper size of the ball and load to suit the material under test2 Clean the test specimen to be free from any dirt and defects or blemishes
3 Mount the test piece surface at right angles to the axis of the ball indenter plunger
4 Turn the platform so that the ball is lifted up
5 By shifting the lever applies the load and waits for some time
6 Release the load by shifting the lever
7 Take out the specimen and measure the diameter of indentation by means of theBrinell microscope8 Repeat the experiments at other positions of the test piece
9 Calculate the value of HB
7232019 MOFMOS LABpdf
httpslidepdfcomreaderfullmofmos-labpdf 3547
Department of ANE MOFMOS LAB MANUAL
983097
OBSERVATIONS
Test piece material = Diameter of the ballrdquo D ldquo =
Load section FD2 = Test load =
Load application time =
Least count of Brinell Microscope =
Diameter Average
Impression F D HB
S No in kg in mm Kgmm2
(d1) (d2) (d1+d2)2
PRECAUTIONS
1 The surface of the test piece should be clean
2 The testing machine should be protected throughout the test from shock or vibration
3 The test should be carried out at room temperature
4 The distance of the center of indentation from the edge of test piece should be at
least 25 times the diameter of the indentation and the distance between the center ofthe two adjacent indentations should be at least 4 times the diameter of the indentation
5 The diameter of each indentation should be measured in two directions at rightangles and the mean value readings used the purpose of determining the hardnessnumber
7232019 MOFMOS LABpdf
httpslidepdfcomreaderfullmofmos-labpdf 3647
Department of ANE
MOFMOS LAB MANUAL
983089983088
RESULT
Calculation Part
7232019 MOFMOS LABpdf
httpslidepdfcomreaderfullmofmos-labpdf 3747
Department of ANE MOFMOS LAB MANUAL
983089983089
SPRING TEST
AIM To determine the rigidity modulus of the spring
APPARATUS Spring testing machine vernier calipers spring specimen
THEORY
Closed coiled helical springs are the springs in which helix angle is very small or inother words the pitch between two adjacent turns is small A closed coiled helical springcarrying an axial load is shown in fig
As helix angle in case of close coiled helical springs are small hence the bendingeffect on the spring is ignored and we assume that the coils of close coiled helical
springs are to stand purely tensional stresses Let d=diameter ofthe spring wire
P= pitch of the helical spring N= number ofcoils R= mean radius of the spring coil
W=axial load on spring C=modulus of rigidity
τ=maximum shear stress induced in the wire θ=angle of twist in the
spring wire and
x= deflection of spring due to axial load l= length of wire
Net twisting moment on the wire T=WR
But twisting moment is also given by T= (π 16) τd3
From 1 ad 2 WR = (π 16) τd3 τ=16WR πd
3
above equation which gives the maximum shear stress induced in the wire (1) Length of one coil=2πR
Total length of the wire=2πRn (2)
Strain energy stored by the spring due to torsion
U= (τ 4C) [(π 4)d 2πRn] (3)
Work done on the spring =average load x deflection
= (12) Wx (4)
Equating 3 and 4
(12) Wx = (32W2R3n)Cd4
7232019 MOFMOS LABpdf
httpslidepdfcomreaderfullmofmos-labpdf 3847
Department of ANE MOFMOS LAB MANUAL
983089983090
x=64WR3nCd
4
Rigidity modulus of the spring
C=64WR3nxd
4
PROCEDURE
1) Consider the spring and find out itsmean coil radius R with the help ofvernier calipers
2) Find the diameter of the spring andnumber of turns
3) Fix the spring between two hooks
4) Now load is gradually applied
5) Note the deflection from thedeflection scale for different loadsapplied
6) Calculate the rigidity modulus usingabove formula
PRECAUTIONS
1) Dimensions should be measureaccurately with the help of verniercalipers
2) Deflection from the scale should benoted carefully and accurately
OBSERVATION TABLE
Sno Load applied deflection Rigidity modulus
C
Average rigidity modulus C =
RESULT
7232019 MOFMOS LABpdf
httpslidepdfcomreaderfullmofmos-labpdf 3947
Department of ANE MOFMOS LAB MANUAL
983089983091
Calculation Part
7232019 MOFMOS LABpdf
httpslidepdfcomreaderfullmofmos-labpdf 4047
Department of ANE MOFMOS LAB MANUAL
983089983092
TORSION
AIM To conduct torsion test on mild steel or cast iron specimen to find modulus of rigidity or to find angle of twist of the materials which are subjected to torsion
APPARATUS 1 A torsion test machine along with angle of twist measuring attachment
2 Standard specimen of mild steel or cast iron
3 Steel rule
4 Vernnier caliper or a micrometer
THEORY
For transmitting power through a rotating shaft it is necessary to apply a turning
force The force is applied tangentially and in the plane of transverse cross section The
torque or twisting moment may be calculated by multiplying two opposite turningmoments It is said to be in pure torsion and it will exhibit the tendency of shearing off at
every cross section which is perpendicular to the longitudinal axis
Torsion equation
Torsion equation is given by below
T IP = CθL = TR
T= maximum twisting torque (Nmm) IP =
polar moment of inertia (mm4) τ =shear
stress (Nmm2) C=modulus of rigidity (Nmm2)
θ=angle of twist in radians L=length of shaft under torsion (mm)
Assumptions made for getting torsion equation
1 The material of the shaft is uniform through out
2 The shaft circular in section remain circular after loading
3 Plane sections of shaft normal to its axis before loading remain plane after thetorque have been applied
4 The twist along the length of the shaft is uniform throughout
5 The distance between any two normal-sections remains the same after theapplication of torque
6 Maximum shear stress induced in the shaft due to application of torque does notexceed its elastic limit
7232019 MOFMOS LABpdf
httpslidepdfcomreaderfullmofmos-labpdf 4147
Department of ANE MOFMOS LAB MANUAL
983089983093
PROCEDURE
1 Select the suitable grips to suit the size of the specimen and clamp it in themachine by adjusting sliding jaw
2 Measure the diameter at about the three places and take average value
3 Choose the appropriate loading range depending upon specimen
4 Set the maximum load pointer to zero
5 Carry out straining by rotating the hand wheel or by switching on the motor
6 Load the members in suitable increments observe and record strain reading
7 Continue till failure of the specimen
8 Calculate the modulus of rigidity C by using the torsion equation
9 Plot the torque ndashtwist graph (T Vs θ)
OBSERVATIONS
Gauge length L =
Polar moment of inertia IP =
Modulus of rigidity C =TL IP θ =
SNo Twisting Moment Angle of Twist Modulus Average
Kgf Nm Degrees Radians of rigidity CNmm2
C
RESULT
7232019 MOFMOS LABpdf
httpslidepdfcomreaderfullmofmos-labpdf 4247
Department of ANE MOFMOS LAB MANUAL
983089983094
TENSILE TEST
AIM
To conduct tensile test on a mild steel specimen and determine the following
1 Limit of proportionality 2 Elastic Limit
3 Upper yield point 4 Lower yield point
5 Ultimate strength 6 Fracture strength
7 Young`s Modulus 8 Percentage elongation
9 Percentage reduction in area 10 Ductility
11 Toughness 12 True stress amp true strain
13 Malleability
APPARATUS tensile testing machine specimen steel rule vernier caliper micrometer
THEORY
The tensile test is most applied one of all mechanical tests In this test a test specimen is fixed
into grips connected to a straining device and to a load-measuring device (One end in stationary
grips and the other in movable grips) If the applied load is small enough the deformation of any
solid body is entirely elastic An elastically deformed solid will return to its original form as soon
as load is removed However if the load is too large the material can be deformed permanently
The initial part of the tension curve which represents the manner in which solid undergoes
plastic deformation is termed as plastic The stress below which the deformation is essentially
entirely elastic is known as the elastic limit of the material In some materials like mild steel a
sudden drop in load indicating both an upper and lower yield point denotes the onset of plastic
deformation However some materials do not exhibit a sharp yield point During plastic
deformation at lager extensions strain hardening cannot compensate for the decrease in section
and thus the load passes through a maximum and then begins to decrease At this stage the
ultimate strength which is defined as the ration of the load on the specimen to the original cross-section area reaches a maximum value Until this point the deformation is uniform at all the
sections of the specimen Further loading will eventually cause bdquoneck ‟ formation and rupture
follows
7232019 MOFMOS LABpdf
httpslidepdfcomreaderfullmofmos-labpdf 4347
Department of ANE MOFMOS LAB
MANUAL
983089983095
Usually a tension test is conducted at room temperature the tensile load is applied
slowly During this test either round or flat specimens may be used The load on the specimen is
applied mechanically or hydraulically depending on the type of testing machine
1 NominalEngg stress and NominalEngg strain
Original CS area = A0 (mm2)
Original gauge length = L0 (mm) Increase in gauge length = δL0
Nominal stress = PA0 (N mm2)
Nominal strain = δL0 L0
2 Limit of Proportionality Stress is proportional to strain up to this pointNormal Stress = PA PO Normal Strain = (δ LO) ALO
3 Elastic limit When the load is removed at ldquoBrdquo the specimen will go back to originalDimensions ie LO and δ AO Nominal stress = PB AO Normal Strain = (δ LO) B LO
If the specimen is loaded beyond elastic limit it will undergo permanent strainie Plastic deformation
4 Upper yield point Nominal stress = PC AO Nominal strain = (δ LO) D LO
5 Lower yield point Nominal stress = PD AO
Nominal strain = (δ LO) D LO 6 Ultimate load or maximum load point
Nominal ultimate stress = PE AO Nominal strain = (δ LO) E LO
7 Fracture Load point F
Nominal fracture stress = PF AO
Nominal strain at fracture = (δ LO) F LO
8 Young`s modulus (E) Young`s modulus (E) = StressStrain
(In the elastic region limit of proportionality = Nominal stress at ANominal strain at A 9Modulus of resilience = (Nominal stress at elastic limit)
2 2E
Area under Engg Stress - Strain diagram up to elastic limit10 Resilience = Modulus of Resilience x Volume of specimen undergoing Tensile stress
7232019 MOFMOS LABpdf
httpslidepdfcomreaderfullmofmos-labpdf 4447
Department of ANE MOFMOS LAB MANUAL
983089983096
11 Yield point ElongationElongation taking place in the specimen from C to D this istaking place without increase in stress
12 Modulus of toughnessArea under engineering stress ndash strain diagram up to fracture13 Toughness = Modulus of toughness x Volume of specimenThis indicates theamount of energy absorbed by the specimen before fracture take place
14 Ductility= (Final length at fracture ndash original length 10) x 100
15 MalleabilityIt is the ability of the material to undergo plastic deformation prior fracture under compressive loading conditions In a tensile test it is approximatedas percentage reduction in cross sectional area of the specimen Malleability =
(AO - Af )AO) x 100
True stress ndash true strain diagram
Engineering stress is calculated based on original cross sectional area (AO) But not on the actual cross sectional area at load bdquoP‟
True stress = PA = PAO x AO A
Since volume remains constant during plastic deformation we have AO LO = AL True stress = PAO x L LO
= PAO x ((LO + δLO) LO)
= P (1+e)= Nominal stress (1+ nominal strain)
True strain = Є = 1n (1+e)
These relations are valid up to ultimate load ie up to which the strain isuniform all along the gauge length
1 True Stress at upper yield point = Nominal stress at upper yield point ( 1+e O)True strain at C = 1n (1+eo)
2 True stress at ultimate load (E1)= Nominal ultimate stress ( 1+eE)True strain at ultimate load = 1n (1+eE)
3 True stress at fracture (E1) = Pf Af
Where Af is the area of cross section at fracture can be measured True
strain at fracture = 1n (Ao Af )
Area relation is taken instead of lengths because the strains are localized in theregion between ultimate load point and fracture point
4 Strain Hardening
From lower yield point onwards increase in load is required for increase instrain Thus the stress required for further deformation is more Thisphenomenon is called strain hardening
5 True ndash stress ndash true strain curve in log ndash log co ndash ordinates
When the true ndash stress and true ndash strain are plotted on log ndash log co ndash ordinates thecurve is a straight line
7232019 MOFMOS LABpdf
httpslidepdfcomreaderfullmofmos-labpdf 4547
Department of ANE MOFMOS LAB MANUAL
983120983137983143983141 983089983097 983151983142 983090983089
6 Ductile and Brittle Materials
If a material fails without much plastic deformation it can be called brittle If the percentageelongation at fracture is less than 25 the material is classified as brittle
bull Usually the metals with FCC and CPH structures are highly ductile
PROCEDURE
1 Measure the original gauge length and diameter of the specimen
2 Insert the specimen into grips of the test machine
3 Begin the load application and record load vs elongation data
4 Take the readings more frequently as yield point is approached
5 Measure elongation values
6 Continue the test till fracture occurs
7 By joining the two broken halves of the specimen together measure the final length anddiameter of specimen at fracture
RESULTS AND DISCUSSIONS
1 Plot the Engg Stress strain curve and determine the following
bull Limit of proportionality = (Nmm2)
bull Yield strength = (Nmm2)
bull Ultimate strength = (Nmm2)
bull Young`s modulus = (Nmm2)
bull Percentage elongation = bull Percentage reduction in area =
bull Fracture strength = (Nominal Engg)
bull Toughness = Area under stress ndash strain curve up to
fracture
bull Malleability
2 Plot True Stress True strain curve after calculating true ndash stress and true strain values at various
points
Estimate1) Strength coefficient
2) Strain hardening coefficient
3) Determine whether the material is ductile or brittle4) Comment on the results
7232019 MOFMOS LABpdf
httpslidepdfcomreaderfullmofmos-labpdf 4647
Department of ANE MOFMOS LAB MANUAL
983120983137983143983141 983090983088 983151983142 983090983089
SNo Load Deformation Stress Strain E
Calculation part-
7232019 MOFMOS LABpdf
httpslidepdfcomreaderfullmofmos-labpdf 4747
Department of ANE MOFMOS LAB MANUAL
7232019 MOFMOS LABpdf
httpslidepdfcomreaderfullmofmos-labpdf 3147
Department of ANE MOFMOS LAB MANUAL
983093
6 Push the lever to apply the major load A dash pot provided in the loading mechanismto ensure that the load is applied gradually
7 As soon as the pointer comes to rest pull the handle in the reverse direction slowlyThis releases the major but not the minor load The pointer will now rotate in the reversedirection
8 The Rockwell hardness can read off the scale dial on the appropriate scale after thepointer comes to rest
OBSERVATIONS
Material of the specimen =
Thickness of test specimen =
Hardness scale used =
Test Material Rockwell Scale of weights Rockwell number Average
no Rockwell
no
Scale weight indent 1 2 3
PRECAUTIONS
1 For testing cylindrical test specimens use V-type platform
2 Calibrate the machine occasionally by using standard test blocks
3 For thin metal prices place another sufficiently thick metal piece between the testspecimen and the platform to avoid any damage which may likely occur to the platform
4 After applying major load wait for some time to allow the needle to come to restThe waiting time may vary from 2 to 8 seconds
7232019 MOFMOS LABpdf
httpslidepdfcomreaderfullmofmos-labpdf 3247
Department of ANE MOFMOS LAB
MANUAL
983094
5 The surface of the test piece should be smooth and even and free from oxidescale and foreign matter6 Test specimen should not be subjected to any heating of cold working
7 The distance between the centers of two adjacent indentation should be at least 4
Times the diameter of the indentation and the distance from the center of any indentation tothe edge of the test piece should be at least 25 times the diameter of the indentation
RESULT
7232019 MOFMOS LABpdf
httpslidepdfcomreaderfullmofmos-labpdf 3347
Department of ANE MOFMOS LAB MANUAL
983095
Calculation Part
7232019 MOFMOS LABpdf
httpslidepdfcomreaderfullmofmos-labpdf 3447
Department of ANE MOFMOS LAB MANUAL
983096
BRINELLrsquoS HARDNESS TEST
AIM To determine the Brinell hardness of the given test specimen
APPARATUS Brinell hardness machine test specimen Brinells Microscope
THEORY
Indentation Hardness-A number related to the area or to the depth of
the impression made by an indenter or fixed geometry under a known fixed load
This method consists of indenting the surface of the metal by a hardened steel
ball of specified diameter D mm under a given load F kgf and measuring the average
diameter d mm of the impression with the help of Brinell microscope fitted with a scaleThe Brinell hardness HB is defined as the quotient of the applied force F divided by the
spherical area of the impression
HB= Test load in kgfsurface area of indentation
=2F πD (D- D2- d2) kgmm2
PROCEDURE
1 Select the proper size of the ball and load to suit the material under test2 Clean the test specimen to be free from any dirt and defects or blemishes
3 Mount the test piece surface at right angles to the axis of the ball indenter plunger
4 Turn the platform so that the ball is lifted up
5 By shifting the lever applies the load and waits for some time
6 Release the load by shifting the lever
7 Take out the specimen and measure the diameter of indentation by means of theBrinell microscope8 Repeat the experiments at other positions of the test piece
9 Calculate the value of HB
7232019 MOFMOS LABpdf
httpslidepdfcomreaderfullmofmos-labpdf 3547
Department of ANE MOFMOS LAB MANUAL
983097
OBSERVATIONS
Test piece material = Diameter of the ballrdquo D ldquo =
Load section FD2 = Test load =
Load application time =
Least count of Brinell Microscope =
Diameter Average
Impression F D HB
S No in kg in mm Kgmm2
(d1) (d2) (d1+d2)2
PRECAUTIONS
1 The surface of the test piece should be clean
2 The testing machine should be protected throughout the test from shock or vibration
3 The test should be carried out at room temperature
4 The distance of the center of indentation from the edge of test piece should be at
least 25 times the diameter of the indentation and the distance between the center ofthe two adjacent indentations should be at least 4 times the diameter of the indentation
5 The diameter of each indentation should be measured in two directions at rightangles and the mean value readings used the purpose of determining the hardnessnumber
7232019 MOFMOS LABpdf
httpslidepdfcomreaderfullmofmos-labpdf 3647
Department of ANE
MOFMOS LAB MANUAL
983089983088
RESULT
Calculation Part
7232019 MOFMOS LABpdf
httpslidepdfcomreaderfullmofmos-labpdf 3747
Department of ANE MOFMOS LAB MANUAL
983089983089
SPRING TEST
AIM To determine the rigidity modulus of the spring
APPARATUS Spring testing machine vernier calipers spring specimen
THEORY
Closed coiled helical springs are the springs in which helix angle is very small or inother words the pitch between two adjacent turns is small A closed coiled helical springcarrying an axial load is shown in fig
As helix angle in case of close coiled helical springs are small hence the bendingeffect on the spring is ignored and we assume that the coils of close coiled helical
springs are to stand purely tensional stresses Let d=diameter ofthe spring wire
P= pitch of the helical spring N= number ofcoils R= mean radius of the spring coil
W=axial load on spring C=modulus of rigidity
τ=maximum shear stress induced in the wire θ=angle of twist in the
spring wire and
x= deflection of spring due to axial load l= length of wire
Net twisting moment on the wire T=WR
But twisting moment is also given by T= (π 16) τd3
From 1 ad 2 WR = (π 16) τd3 τ=16WR πd
3
above equation which gives the maximum shear stress induced in the wire (1) Length of one coil=2πR
Total length of the wire=2πRn (2)
Strain energy stored by the spring due to torsion
U= (τ 4C) [(π 4)d 2πRn] (3)
Work done on the spring =average load x deflection
= (12) Wx (4)
Equating 3 and 4
(12) Wx = (32W2R3n)Cd4
7232019 MOFMOS LABpdf
httpslidepdfcomreaderfullmofmos-labpdf 3847
Department of ANE MOFMOS LAB MANUAL
983089983090
x=64WR3nCd
4
Rigidity modulus of the spring
C=64WR3nxd
4
PROCEDURE
1) Consider the spring and find out itsmean coil radius R with the help ofvernier calipers
2) Find the diameter of the spring andnumber of turns
3) Fix the spring between two hooks
4) Now load is gradually applied
5) Note the deflection from thedeflection scale for different loadsapplied
6) Calculate the rigidity modulus usingabove formula
PRECAUTIONS
1) Dimensions should be measureaccurately with the help of verniercalipers
2) Deflection from the scale should benoted carefully and accurately
OBSERVATION TABLE
Sno Load applied deflection Rigidity modulus
C
Average rigidity modulus C =
RESULT
7232019 MOFMOS LABpdf
httpslidepdfcomreaderfullmofmos-labpdf 3947
Department of ANE MOFMOS LAB MANUAL
983089983091
Calculation Part
7232019 MOFMOS LABpdf
httpslidepdfcomreaderfullmofmos-labpdf 4047
Department of ANE MOFMOS LAB MANUAL
983089983092
TORSION
AIM To conduct torsion test on mild steel or cast iron specimen to find modulus of rigidity or to find angle of twist of the materials which are subjected to torsion
APPARATUS 1 A torsion test machine along with angle of twist measuring attachment
2 Standard specimen of mild steel or cast iron
3 Steel rule
4 Vernnier caliper or a micrometer
THEORY
For transmitting power through a rotating shaft it is necessary to apply a turning
force The force is applied tangentially and in the plane of transverse cross section The
torque or twisting moment may be calculated by multiplying two opposite turningmoments It is said to be in pure torsion and it will exhibit the tendency of shearing off at
every cross section which is perpendicular to the longitudinal axis
Torsion equation
Torsion equation is given by below
T IP = CθL = TR
T= maximum twisting torque (Nmm) IP =
polar moment of inertia (mm4) τ =shear
stress (Nmm2) C=modulus of rigidity (Nmm2)
θ=angle of twist in radians L=length of shaft under torsion (mm)
Assumptions made for getting torsion equation
1 The material of the shaft is uniform through out
2 The shaft circular in section remain circular after loading
3 Plane sections of shaft normal to its axis before loading remain plane after thetorque have been applied
4 The twist along the length of the shaft is uniform throughout
5 The distance between any two normal-sections remains the same after theapplication of torque
6 Maximum shear stress induced in the shaft due to application of torque does notexceed its elastic limit
7232019 MOFMOS LABpdf
httpslidepdfcomreaderfullmofmos-labpdf 4147
Department of ANE MOFMOS LAB MANUAL
983089983093
PROCEDURE
1 Select the suitable grips to suit the size of the specimen and clamp it in themachine by adjusting sliding jaw
2 Measure the diameter at about the three places and take average value
3 Choose the appropriate loading range depending upon specimen
4 Set the maximum load pointer to zero
5 Carry out straining by rotating the hand wheel or by switching on the motor
6 Load the members in suitable increments observe and record strain reading
7 Continue till failure of the specimen
8 Calculate the modulus of rigidity C by using the torsion equation
9 Plot the torque ndashtwist graph (T Vs θ)
OBSERVATIONS
Gauge length L =
Polar moment of inertia IP =
Modulus of rigidity C =TL IP θ =
SNo Twisting Moment Angle of Twist Modulus Average
Kgf Nm Degrees Radians of rigidity CNmm2
C
RESULT
7232019 MOFMOS LABpdf
httpslidepdfcomreaderfullmofmos-labpdf 4247
Department of ANE MOFMOS LAB MANUAL
983089983094
TENSILE TEST
AIM
To conduct tensile test on a mild steel specimen and determine the following
1 Limit of proportionality 2 Elastic Limit
3 Upper yield point 4 Lower yield point
5 Ultimate strength 6 Fracture strength
7 Young`s Modulus 8 Percentage elongation
9 Percentage reduction in area 10 Ductility
11 Toughness 12 True stress amp true strain
13 Malleability
APPARATUS tensile testing machine specimen steel rule vernier caliper micrometer
THEORY
The tensile test is most applied one of all mechanical tests In this test a test specimen is fixed
into grips connected to a straining device and to a load-measuring device (One end in stationary
grips and the other in movable grips) If the applied load is small enough the deformation of any
solid body is entirely elastic An elastically deformed solid will return to its original form as soon
as load is removed However if the load is too large the material can be deformed permanently
The initial part of the tension curve which represents the manner in which solid undergoes
plastic deformation is termed as plastic The stress below which the deformation is essentially
entirely elastic is known as the elastic limit of the material In some materials like mild steel a
sudden drop in load indicating both an upper and lower yield point denotes the onset of plastic
deformation However some materials do not exhibit a sharp yield point During plastic
deformation at lager extensions strain hardening cannot compensate for the decrease in section
and thus the load passes through a maximum and then begins to decrease At this stage the
ultimate strength which is defined as the ration of the load on the specimen to the original cross-section area reaches a maximum value Until this point the deformation is uniform at all the
sections of the specimen Further loading will eventually cause bdquoneck ‟ formation and rupture
follows
7232019 MOFMOS LABpdf
httpslidepdfcomreaderfullmofmos-labpdf 4347
Department of ANE MOFMOS LAB
MANUAL
983089983095
Usually a tension test is conducted at room temperature the tensile load is applied
slowly During this test either round or flat specimens may be used The load on the specimen is
applied mechanically or hydraulically depending on the type of testing machine
1 NominalEngg stress and NominalEngg strain
Original CS area = A0 (mm2)
Original gauge length = L0 (mm) Increase in gauge length = δL0
Nominal stress = PA0 (N mm2)
Nominal strain = δL0 L0
2 Limit of Proportionality Stress is proportional to strain up to this pointNormal Stress = PA PO Normal Strain = (δ LO) ALO
3 Elastic limit When the load is removed at ldquoBrdquo the specimen will go back to originalDimensions ie LO and δ AO Nominal stress = PB AO Normal Strain = (δ LO) B LO
If the specimen is loaded beyond elastic limit it will undergo permanent strainie Plastic deformation
4 Upper yield point Nominal stress = PC AO Nominal strain = (δ LO) D LO
5 Lower yield point Nominal stress = PD AO
Nominal strain = (δ LO) D LO 6 Ultimate load or maximum load point
Nominal ultimate stress = PE AO Nominal strain = (δ LO) E LO
7 Fracture Load point F
Nominal fracture stress = PF AO
Nominal strain at fracture = (δ LO) F LO
8 Young`s modulus (E) Young`s modulus (E) = StressStrain
(In the elastic region limit of proportionality = Nominal stress at ANominal strain at A 9Modulus of resilience = (Nominal stress at elastic limit)
2 2E
Area under Engg Stress - Strain diagram up to elastic limit10 Resilience = Modulus of Resilience x Volume of specimen undergoing Tensile stress
7232019 MOFMOS LABpdf
httpslidepdfcomreaderfullmofmos-labpdf 4447
Department of ANE MOFMOS LAB MANUAL
983089983096
11 Yield point ElongationElongation taking place in the specimen from C to D this istaking place without increase in stress
12 Modulus of toughnessArea under engineering stress ndash strain diagram up to fracture13 Toughness = Modulus of toughness x Volume of specimenThis indicates theamount of energy absorbed by the specimen before fracture take place
14 Ductility= (Final length at fracture ndash original length 10) x 100
15 MalleabilityIt is the ability of the material to undergo plastic deformation prior fracture under compressive loading conditions In a tensile test it is approximatedas percentage reduction in cross sectional area of the specimen Malleability =
(AO - Af )AO) x 100
True stress ndash true strain diagram
Engineering stress is calculated based on original cross sectional area (AO) But not on the actual cross sectional area at load bdquoP‟
True stress = PA = PAO x AO A
Since volume remains constant during plastic deformation we have AO LO = AL True stress = PAO x L LO
= PAO x ((LO + δLO) LO)
= P (1+e)= Nominal stress (1+ nominal strain)
True strain = Є = 1n (1+e)
These relations are valid up to ultimate load ie up to which the strain isuniform all along the gauge length
1 True Stress at upper yield point = Nominal stress at upper yield point ( 1+e O)True strain at C = 1n (1+eo)
2 True stress at ultimate load (E1)= Nominal ultimate stress ( 1+eE)True strain at ultimate load = 1n (1+eE)
3 True stress at fracture (E1) = Pf Af
Where Af is the area of cross section at fracture can be measured True
strain at fracture = 1n (Ao Af )
Area relation is taken instead of lengths because the strains are localized in theregion between ultimate load point and fracture point
4 Strain Hardening
From lower yield point onwards increase in load is required for increase instrain Thus the stress required for further deformation is more Thisphenomenon is called strain hardening
5 True ndash stress ndash true strain curve in log ndash log co ndash ordinates
When the true ndash stress and true ndash strain are plotted on log ndash log co ndash ordinates thecurve is a straight line
7232019 MOFMOS LABpdf
httpslidepdfcomreaderfullmofmos-labpdf 4547
Department of ANE MOFMOS LAB MANUAL
983120983137983143983141 983089983097 983151983142 983090983089
6 Ductile and Brittle Materials
If a material fails without much plastic deformation it can be called brittle If the percentageelongation at fracture is less than 25 the material is classified as brittle
bull Usually the metals with FCC and CPH structures are highly ductile
PROCEDURE
1 Measure the original gauge length and diameter of the specimen
2 Insert the specimen into grips of the test machine
3 Begin the load application and record load vs elongation data
4 Take the readings more frequently as yield point is approached
5 Measure elongation values
6 Continue the test till fracture occurs
7 By joining the two broken halves of the specimen together measure the final length anddiameter of specimen at fracture
RESULTS AND DISCUSSIONS
1 Plot the Engg Stress strain curve and determine the following
bull Limit of proportionality = (Nmm2)
bull Yield strength = (Nmm2)
bull Ultimate strength = (Nmm2)
bull Young`s modulus = (Nmm2)
bull Percentage elongation = bull Percentage reduction in area =
bull Fracture strength = (Nominal Engg)
bull Toughness = Area under stress ndash strain curve up to
fracture
bull Malleability
2 Plot True Stress True strain curve after calculating true ndash stress and true strain values at various
points
Estimate1) Strength coefficient
2) Strain hardening coefficient
3) Determine whether the material is ductile or brittle4) Comment on the results
7232019 MOFMOS LABpdf
httpslidepdfcomreaderfullmofmos-labpdf 4647
Department of ANE MOFMOS LAB MANUAL
983120983137983143983141 983090983088 983151983142 983090983089
SNo Load Deformation Stress Strain E
Calculation part-
7232019 MOFMOS LABpdf
httpslidepdfcomreaderfullmofmos-labpdf 4747
Department of ANE MOFMOS LAB MANUAL

7232019 MOFMOS LABpdf
httpslidepdfcomreaderfullmofmos-labpdf 3347
Department of ANE MOFMOS LAB MANUAL
983095
Calculation Part
7232019 MOFMOS LABpdf
httpslidepdfcomreaderfullmofmos-labpdf 3447
Department of ANE MOFMOS LAB MANUAL
983096
BRINELLrsquoS HARDNESS TEST
AIM To determine the Brinell hardness of the given test specimen
APPARATUS Brinell hardness machine test specimen Brinells Microscope
THEORY
Indentation Hardness-A number related to the area or to the depth of
the impression made by an indenter or fixed geometry under a known fixed load
This method consists of indenting the surface of the metal by a hardened steel
ball of specified diameter D mm under a given load F kgf and measuring the average
diameter d mm of the impression with the help of Brinell microscope fitted with a scaleThe Brinell hardness HB is defined as the quotient of the applied force F divided by the
spherical area of the impression
HB= Test load in kgfsurface area of indentation
=2F πD (D- D2- d2) kgmm2
PROCEDURE
1 Select the proper size of the ball and load to suit the material under test2 Clean the test specimen to be free from any dirt and defects or blemishes
3 Mount the test piece surface at right angles to the axis of the ball indenter plunger
4 Turn the platform so that the ball is lifted up
5 By shifting the lever applies the load and waits for some time
6 Release the load by shifting the lever
7 Take out the specimen and measure the diameter of indentation by means of theBrinell microscope8 Repeat the experiments at other positions of the test piece
9 Calculate the value of HB
7232019 MOFMOS LABpdf
httpslidepdfcomreaderfullmofmos-labpdf 3547
Department of ANE MOFMOS LAB MANUAL
983097
OBSERVATIONS
Test piece material = Diameter of the ballrdquo D ldquo =
Load section FD2 = Test load =
Load application time =
Least count of Brinell Microscope =
Diameter Average
Impression F D HB
S No in kg in mm Kgmm2
(d1) (d2) (d1+d2)2
PRECAUTIONS
1 The surface of the test piece should be clean
2 The testing machine should be protected throughout the test from shock or vibration
3 The test should be carried out at room temperature
4 The distance of the center of indentation from the edge of test piece should be at
least 25 times the diameter of the indentation and the distance between the center ofthe two adjacent indentations should be at least 4 times the diameter of the indentation
5 The diameter of each indentation should be measured in two directions at rightangles and the mean value readings used the purpose of determining the hardnessnumber
7232019 MOFMOS LABpdf
httpslidepdfcomreaderfullmofmos-labpdf 3647
Department of ANE
MOFMOS LAB MANUAL
983089983088
RESULT
Calculation Part
7232019 MOFMOS LABpdf
httpslidepdfcomreaderfullmofmos-labpdf 3747
Department of ANE MOFMOS LAB MANUAL
983089983089
SPRING TEST
AIM To determine the rigidity modulus of the spring
APPARATUS Spring testing machine vernier calipers spring specimen
THEORY
Closed coiled helical springs are the springs in which helix angle is very small or inother words the pitch between two adjacent turns is small A closed coiled helical springcarrying an axial load is shown in fig
As helix angle in case of close coiled helical springs are small hence the bendingeffect on the spring is ignored and we assume that the coils of close coiled helical
springs are to stand purely tensional stresses Let d=diameter ofthe spring wire
P= pitch of the helical spring N= number ofcoils R= mean radius of the spring coil
W=axial load on spring C=modulus of rigidity
τ=maximum shear stress induced in the wire θ=angle of twist in the
spring wire and
x= deflection of spring due to axial load l= length of wire
Net twisting moment on the wire T=WR
But twisting moment is also given by T= (π 16) τd3
From 1 ad 2 WR = (π 16) τd3 τ=16WR πd
3
above equation which gives the maximum shear stress induced in the wire (1) Length of one coil=2πR
Total length of the wire=2πRn (2)
Strain energy stored by the spring due to torsion
U= (τ 4C) [(π 4)d 2πRn] (3)
Work done on the spring =average load x deflection
= (12) Wx (4)
Equating 3 and 4
(12) Wx = (32W2R3n)Cd4
7232019 MOFMOS LABpdf
httpslidepdfcomreaderfullmofmos-labpdf 3847
Department of ANE MOFMOS LAB MANUAL
983089983090
x=64WR3nCd
4
Rigidity modulus of the spring
C=64WR3nxd
4
PROCEDURE
1) Consider the spring and find out itsmean coil radius R with the help ofvernier calipers
2) Find the diameter of the spring andnumber of turns
3) Fix the spring between two hooks
4) Now load is gradually applied
5) Note the deflection from thedeflection scale for different loadsapplied
6) Calculate the rigidity modulus usingabove formula
PRECAUTIONS
1) Dimensions should be measureaccurately with the help of verniercalipers
2) Deflection from the scale should benoted carefully and accurately
OBSERVATION TABLE
Sno Load applied deflection Rigidity modulus
C
Average rigidity modulus C =
RESULT
7232019 MOFMOS LABpdf
httpslidepdfcomreaderfullmofmos-labpdf 3947
Department of ANE MOFMOS LAB MANUAL
983089983091
Calculation Part
7232019 MOFMOS LABpdf
httpslidepdfcomreaderfullmofmos-labpdf 4047
Department of ANE MOFMOS LAB MANUAL
983089983092
TORSION
AIM To conduct torsion test on mild steel or cast iron specimen to find modulus of rigidity or to find angle of twist of the materials which are subjected to torsion
APPARATUS 1 A torsion test machine along with angle of twist measuring attachment
2 Standard specimen of mild steel or cast iron
3 Steel rule
4 Vernnier caliper or a micrometer
THEORY
For transmitting power through a rotating shaft it is necessary to apply a turning
force The force is applied tangentially and in the plane of transverse cross section The
torque or twisting moment may be calculated by multiplying two opposite turningmoments It is said to be in pure torsion and it will exhibit the tendency of shearing off at
every cross section which is perpendicular to the longitudinal axis
Torsion equation
Torsion equation is given by below
T IP = CθL = TR
T= maximum twisting torque (Nmm) IP =
polar moment of inertia (mm4) τ =shear
stress (Nmm2) C=modulus of rigidity (Nmm2)
θ=angle of twist in radians L=length of shaft under torsion (mm)
Assumptions made for getting torsion equation
1 The material of the shaft is uniform through out
2 The shaft circular in section remain circular after loading
3 Plane sections of shaft normal to its axis before loading remain plane after thetorque have been applied
4 The twist along the length of the shaft is uniform throughout
5 The distance between any two normal-sections remains the same after theapplication of torque
6 Maximum shear stress induced in the shaft due to application of torque does notexceed its elastic limit
7232019 MOFMOS LABpdf
httpslidepdfcomreaderfullmofmos-labpdf 4147
Department of ANE MOFMOS LAB MANUAL
983089983093
PROCEDURE
1 Select the suitable grips to suit the size of the specimen and clamp it in themachine by adjusting sliding jaw
2 Measure the diameter at about the three places and take average value
3 Choose the appropriate loading range depending upon specimen
4 Set the maximum load pointer to zero
5 Carry out straining by rotating the hand wheel or by switching on the motor
6 Load the members in suitable increments observe and record strain reading
7 Continue till failure of the specimen
8 Calculate the modulus of rigidity C by using the torsion equation
9 Plot the torque ndashtwist graph (T Vs θ)
OBSERVATIONS
Gauge length L =
Polar moment of inertia IP =
Modulus of rigidity C =TL IP θ =
SNo Twisting Moment Angle of Twist Modulus Average
Kgf Nm Degrees Radians of rigidity CNmm2
C
RESULT
7232019 MOFMOS LABpdf
httpslidepdfcomreaderfullmofmos-labpdf 4247
Department of ANE MOFMOS LAB MANUAL
983089983094
TENSILE TEST
AIM
To conduct tensile test on a mild steel specimen and determine the following
1 Limit of proportionality 2 Elastic Limit
3 Upper yield point 4 Lower yield point
5 Ultimate strength 6 Fracture strength
7 Young`s Modulus 8 Percentage elongation
9 Percentage reduction in area 10 Ductility
11 Toughness 12 True stress amp true strain
13 Malleability
APPARATUS tensile testing machine specimen steel rule vernier caliper micrometer
THEORY
The tensile test is most applied one of all mechanical tests In this test a test specimen is fixed
into grips connected to a straining device and to a load-measuring device (One end in stationary
grips and the other in movable grips) If the applied load is small enough the deformation of any
solid body is entirely elastic An elastically deformed solid will return to its original form as soon
as load is removed However if the load is too large the material can be deformed permanently
The initial part of the tension curve which represents the manner in which solid undergoes
plastic deformation is termed as plastic The stress below which the deformation is essentially
entirely elastic is known as the elastic limit of the material In some materials like mild steel a
sudden drop in load indicating both an upper and lower yield point denotes the onset of plastic
deformation However some materials do not exhibit a sharp yield point During plastic
deformation at lager extensions strain hardening cannot compensate for the decrease in section
and thus the load passes through a maximum and then begins to decrease At this stage the
ultimate strength which is defined as the ration of the load on the specimen to the original cross-section area reaches a maximum value Until this point the deformation is uniform at all the
sections of the specimen Further loading will eventually cause bdquoneck ‟ formation and rupture
follows
7232019 MOFMOS LABpdf
httpslidepdfcomreaderfullmofmos-labpdf 4347
Department of ANE MOFMOS LAB
MANUAL
983089983095
Usually a tension test is conducted at room temperature the tensile load is applied
slowly During this test either round or flat specimens may be used The load on the specimen is
applied mechanically or hydraulically depending on the type of testing machine
1 NominalEngg stress and NominalEngg strain
Original CS area = A0 (mm2)
Original gauge length = L0 (mm) Increase in gauge length = δL0
Nominal stress = PA0 (N mm2)
Nominal strain = δL0 L0
2 Limit of Proportionality Stress is proportional to strain up to this pointNormal Stress = PA PO Normal Strain = (δ LO) ALO
3 Elastic limit When the load is removed at ldquoBrdquo the specimen will go back to originalDimensions ie LO and δ AO Nominal stress = PB AO Normal Strain = (δ LO) B LO
If the specimen is loaded beyond elastic limit it will undergo permanent strainie Plastic deformation
4 Upper yield point Nominal stress = PC AO Nominal strain = (δ LO) D LO
5 Lower yield point Nominal stress = PD AO
Nominal strain = (δ LO) D LO 6 Ultimate load or maximum load point
Nominal ultimate stress = PE AO Nominal strain = (δ LO) E LO
7 Fracture Load point F
Nominal fracture stress = PF AO
Nominal strain at fracture = (δ LO) F LO
8 Young`s modulus (E) Young`s modulus (E) = StressStrain
(In the elastic region limit of proportionality = Nominal stress at ANominal strain at A 9Modulus of resilience = (Nominal stress at elastic limit)
2 2E
Area under Engg Stress - Strain diagram up to elastic limit10 Resilience = Modulus of Resilience x Volume of specimen undergoing Tensile stress
7232019 MOFMOS LABpdf
httpslidepdfcomreaderfullmofmos-labpdf 4447
Department of ANE MOFMOS LAB MANUAL
983089983096
11 Yield point ElongationElongation taking place in the specimen from C to D this istaking place without increase in stress
12 Modulus of toughnessArea under engineering stress ndash strain diagram up to fracture13 Toughness = Modulus of toughness x Volume of specimenThis indicates theamount of energy absorbed by the specimen before fracture take place
14 Ductility= (Final length at fracture ndash original length 10) x 100
15 MalleabilityIt is the ability of the material to undergo plastic deformation prior fracture under compressive loading conditions In a tensile test it is approximatedas percentage reduction in cross sectional area of the specimen Malleability =
(AO - Af )AO) x 100
True stress ndash true strain diagram
Engineering stress is calculated based on original cross sectional area (AO) But not on the actual cross sectional area at load bdquoP‟
True stress = PA = PAO x AO A
Since volume remains constant during plastic deformation we have AO LO = AL True stress = PAO x L LO
= PAO x ((LO + δLO) LO)
= P (1+e)= Nominal stress (1+ nominal strain)
True strain = Є = 1n (1+e)
These relations are valid up to ultimate load ie up to which the strain isuniform all along the gauge length
1 True Stress at upper yield point = Nominal stress at upper yield point ( 1+e O)True strain at C = 1n (1+eo)
2 True stress at ultimate load (E1)= Nominal ultimate stress ( 1+eE)True strain at ultimate load = 1n (1+eE)
3 True stress at fracture (E1) = Pf Af
Where Af is the area of cross section at fracture can be measured True
strain at fracture = 1n (Ao Af )
Area relation is taken instead of lengths because the strains are localized in theregion between ultimate load point and fracture point
4 Strain Hardening
From lower yield point onwards increase in load is required for increase instrain Thus the stress required for further deformation is more Thisphenomenon is called strain hardening
5 True ndash stress ndash true strain curve in log ndash log co ndash ordinates
When the true ndash stress and true ndash strain are plotted on log ndash log co ndash ordinates thecurve is a straight line
7232019 MOFMOS LABpdf
httpslidepdfcomreaderfullmofmos-labpdf 4547
Department of ANE MOFMOS LAB MANUAL
983120983137983143983141 983089983097 983151983142 983090983089
6 Ductile and Brittle Materials
If a material fails without much plastic deformation it can be called brittle If the percentageelongation at fracture is less than 25 the material is classified as brittle
bull Usually the metals with FCC and CPH structures are highly ductile
PROCEDURE
1 Measure the original gauge length and diameter of the specimen
2 Insert the specimen into grips of the test machine
3 Begin the load application and record load vs elongation data
4 Take the readings more frequently as yield point is approached
5 Measure elongation values
6 Continue the test till fracture occurs
7 By joining the two broken halves of the specimen together measure the final length anddiameter of specimen at fracture
RESULTS AND DISCUSSIONS
1 Plot the Engg Stress strain curve and determine the following
bull Limit of proportionality = (Nmm2)
bull Yield strength = (Nmm2)
bull Ultimate strength = (Nmm2)
bull Young`s modulus = (Nmm2)
bull Percentage elongation = bull Percentage reduction in area =
bull Fracture strength = (Nominal Engg)
bull Toughness = Area under stress ndash strain curve up to
fracture
bull Malleability
2 Plot True Stress True strain curve after calculating true ndash stress and true strain values at various
points
Estimate1) Strength coefficient
2) Strain hardening coefficient
3) Determine whether the material is ductile or brittle4) Comment on the results
7232019 MOFMOS LABpdf
httpslidepdfcomreaderfullmofmos-labpdf 4647
Department of ANE MOFMOS LAB MANUAL
983120983137983143983141 983090983088 983151983142 983090983089
SNo Load Deformation Stress Strain E
Calculation part-
7232019 MOFMOS LABpdf
httpslidepdfcomreaderfullmofmos-labpdf 4747
Department of ANE MOFMOS LAB MANUAL
7232019 MOFMOS LABpdf
httpslidepdfcomreaderfullmofmos-labpdf 3447
Department of ANE MOFMOS LAB MANUAL
983096
BRINELLrsquoS HARDNESS TEST
AIM To determine the Brinell hardness of the given test specimen
APPARATUS Brinell hardness machine test specimen Brinells Microscope
THEORY
Indentation Hardness-A number related to the area or to the depth of
the impression made by an indenter or fixed geometry under a known fixed load
This method consists of indenting the surface of the metal by a hardened steel
ball of specified diameter D mm under a given load F kgf and measuring the average
diameter d mm of the impression with the help of Brinell microscope fitted with a scaleThe Brinell hardness HB is defined as the quotient of the applied force F divided by the
spherical area of the impression
HB= Test load in kgfsurface area of indentation
=2F πD (D- D2- d2) kgmm2
PROCEDURE
1 Select the proper size of the ball and load to suit the material under test2 Clean the test specimen to be free from any dirt and defects or blemishes
3 Mount the test piece surface at right angles to the axis of the ball indenter plunger
4 Turn the platform so that the ball is lifted up
5 By shifting the lever applies the load and waits for some time
6 Release the load by shifting the lever
7 Take out the specimen and measure the diameter of indentation by means of theBrinell microscope8 Repeat the experiments at other positions of the test piece
9 Calculate the value of HB
7232019 MOFMOS LABpdf
httpslidepdfcomreaderfullmofmos-labpdf 3547
Department of ANE MOFMOS LAB MANUAL
983097
OBSERVATIONS
Test piece material = Diameter of the ballrdquo D ldquo =
Load section FD2 = Test load =
Load application time =
Least count of Brinell Microscope =
Diameter Average
Impression F D HB
S No in kg in mm Kgmm2
(d1) (d2) (d1+d2)2
PRECAUTIONS
1 The surface of the test piece should be clean
2 The testing machine should be protected throughout the test from shock or vibration
3 The test should be carried out at room temperature
4 The distance of the center of indentation from the edge of test piece should be at
least 25 times the diameter of the indentation and the distance between the center ofthe two adjacent indentations should be at least 4 times the diameter of the indentation
5 The diameter of each indentation should be measured in two directions at rightangles and the mean value readings used the purpose of determining the hardnessnumber
7232019 MOFMOS LABpdf
httpslidepdfcomreaderfullmofmos-labpdf 3647
Department of ANE
MOFMOS LAB MANUAL
983089983088
RESULT
Calculation Part
7232019 MOFMOS LABpdf
httpslidepdfcomreaderfullmofmos-labpdf 3747
Department of ANE MOFMOS LAB MANUAL
983089983089
SPRING TEST
AIM To determine the rigidity modulus of the spring
APPARATUS Spring testing machine vernier calipers spring specimen
THEORY
Closed coiled helical springs are the springs in which helix angle is very small or inother words the pitch between two adjacent turns is small A closed coiled helical springcarrying an axial load is shown in fig
As helix angle in case of close coiled helical springs are small hence the bendingeffect on the spring is ignored and we assume that the coils of close coiled helical
springs are to stand purely tensional stresses Let d=diameter ofthe spring wire
P= pitch of the helical spring N= number ofcoils R= mean radius of the spring coil
W=axial load on spring C=modulus of rigidity
τ=maximum shear stress induced in the wire θ=angle of twist in the
spring wire and
x= deflection of spring due to axial load l= length of wire
Net twisting moment on the wire T=WR
But twisting moment is also given by T= (π 16) τd3
From 1 ad 2 WR = (π 16) τd3 τ=16WR πd
3
above equation which gives the maximum shear stress induced in the wire (1) Length of one coil=2πR
Total length of the wire=2πRn (2)
Strain energy stored by the spring due to torsion
U= (τ 4C) [(π 4)d 2πRn] (3)
Work done on the spring =average load x deflection
= (12) Wx (4)
Equating 3 and 4
(12) Wx = (32W2R3n)Cd4
7232019 MOFMOS LABpdf
httpslidepdfcomreaderfullmofmos-labpdf 3847
Department of ANE MOFMOS LAB MANUAL
983089983090
x=64WR3nCd
4
Rigidity modulus of the spring
C=64WR3nxd
4
PROCEDURE
1) Consider the spring and find out itsmean coil radius R with the help ofvernier calipers
2) Find the diameter of the spring andnumber of turns
3) Fix the spring between two hooks
4) Now load is gradually applied
5) Note the deflection from thedeflection scale for different loadsapplied
6) Calculate the rigidity modulus usingabove formula
PRECAUTIONS
1) Dimensions should be measureaccurately with the help of verniercalipers
2) Deflection from the scale should benoted carefully and accurately
OBSERVATION TABLE
Sno Load applied deflection Rigidity modulus
C
Average rigidity modulus C =
RESULT
7232019 MOFMOS LABpdf
httpslidepdfcomreaderfullmofmos-labpdf 3947
Department of ANE MOFMOS LAB MANUAL
983089983091
Calculation Part
7232019 MOFMOS LABpdf
httpslidepdfcomreaderfullmofmos-labpdf 4047
Department of ANE MOFMOS LAB MANUAL
983089983092
TORSION
AIM To conduct torsion test on mild steel or cast iron specimen to find modulus of rigidity or to find angle of twist of the materials which are subjected to torsion
APPARATUS 1 A torsion test machine along with angle of twist measuring attachment
2 Standard specimen of mild steel or cast iron
3 Steel rule
4 Vernnier caliper or a micrometer
THEORY
For transmitting power through a rotating shaft it is necessary to apply a turning
force The force is applied tangentially and in the plane of transverse cross section The
torque or twisting moment may be calculated by multiplying two opposite turningmoments It is said to be in pure torsion and it will exhibit the tendency of shearing off at
every cross section which is perpendicular to the longitudinal axis
Torsion equation
Torsion equation is given by below
T IP = CθL = TR
T= maximum twisting torque (Nmm) IP =
polar moment of inertia (mm4) τ =shear
stress (Nmm2) C=modulus of rigidity (Nmm2)
θ=angle of twist in radians L=length of shaft under torsion (mm)
Assumptions made for getting torsion equation
1 The material of the shaft is uniform through out
2 The shaft circular in section remain circular after loading
3 Plane sections of shaft normal to its axis before loading remain plane after thetorque have been applied
4 The twist along the length of the shaft is uniform throughout
5 The distance between any two normal-sections remains the same after theapplication of torque
6 Maximum shear stress induced in the shaft due to application of torque does notexceed its elastic limit
7232019 MOFMOS LABpdf
httpslidepdfcomreaderfullmofmos-labpdf 4147
Department of ANE MOFMOS LAB MANUAL
983089983093
PROCEDURE
1 Select the suitable grips to suit the size of the specimen and clamp it in themachine by adjusting sliding jaw
2 Measure the diameter at about the three places and take average value
3 Choose the appropriate loading range depending upon specimen
4 Set the maximum load pointer to zero
5 Carry out straining by rotating the hand wheel or by switching on the motor
6 Load the members in suitable increments observe and record strain reading
7 Continue till failure of the specimen
8 Calculate the modulus of rigidity C by using the torsion equation
9 Plot the torque ndashtwist graph (T Vs θ)
OBSERVATIONS
Gauge length L =
Polar moment of inertia IP =
Modulus of rigidity C =TL IP θ =
SNo Twisting Moment Angle of Twist Modulus Average
Kgf Nm Degrees Radians of rigidity CNmm2
C
RESULT
7232019 MOFMOS LABpdf
httpslidepdfcomreaderfullmofmos-labpdf 4247
Department of ANE MOFMOS LAB MANUAL
983089983094
TENSILE TEST
AIM
To conduct tensile test on a mild steel specimen and determine the following
1 Limit of proportionality 2 Elastic Limit
3 Upper yield point 4 Lower yield point
5 Ultimate strength 6 Fracture strength
7 Young`s Modulus 8 Percentage elongation
9 Percentage reduction in area 10 Ductility
11 Toughness 12 True stress amp true strain
13 Malleability
APPARATUS tensile testing machine specimen steel rule vernier caliper micrometer
THEORY
The tensile test is most applied one of all mechanical tests In this test a test specimen is fixed
into grips connected to a straining device and to a load-measuring device (One end in stationary
grips and the other in movable grips) If the applied load is small enough the deformation of any
solid body is entirely elastic An elastically deformed solid will return to its original form as soon
as load is removed However if the load is too large the material can be deformed permanently
The initial part of the tension curve which represents the manner in which solid undergoes
plastic deformation is termed as plastic The stress below which the deformation is essentially
entirely elastic is known as the elastic limit of the material In some materials like mild steel a
sudden drop in load indicating both an upper and lower yield point denotes the onset of plastic
deformation However some materials do not exhibit a sharp yield point During plastic
deformation at lager extensions strain hardening cannot compensate for the decrease in section
and thus the load passes through a maximum and then begins to decrease At this stage the
ultimate strength which is defined as the ration of the load on the specimen to the original cross-section area reaches a maximum value Until this point the deformation is uniform at all the
sections of the specimen Further loading will eventually cause bdquoneck ‟ formation and rupture
follows
7232019 MOFMOS LABpdf
httpslidepdfcomreaderfullmofmos-labpdf 4347
Department of ANE MOFMOS LAB
MANUAL
983089983095
Usually a tension test is conducted at room temperature the tensile load is applied
slowly During this test either round or flat specimens may be used The load on the specimen is
applied mechanically or hydraulically depending on the type of testing machine
1 NominalEngg stress and NominalEngg strain
Original CS area = A0 (mm2)
Original gauge length = L0 (mm) Increase in gauge length = δL0
Nominal stress = PA0 (N mm2)
Nominal strain = δL0 L0
2 Limit of Proportionality Stress is proportional to strain up to this pointNormal Stress = PA PO Normal Strain = (δ LO) ALO
3 Elastic limit When the load is removed at ldquoBrdquo the specimen will go back to originalDimensions ie LO and δ AO Nominal stress = PB AO Normal Strain = (δ LO) B LO
If the specimen is loaded beyond elastic limit it will undergo permanent strainie Plastic deformation
4 Upper yield point Nominal stress = PC AO Nominal strain = (δ LO) D LO
5 Lower yield point Nominal stress = PD AO
Nominal strain = (δ LO) D LO 6 Ultimate load or maximum load point
Nominal ultimate stress = PE AO Nominal strain = (δ LO) E LO
7 Fracture Load point F
Nominal fracture stress = PF AO
Nominal strain at fracture = (δ LO) F LO
8 Young`s modulus (E) Young`s modulus (E) = StressStrain
(In the elastic region limit of proportionality = Nominal stress at ANominal strain at A 9Modulus of resilience = (Nominal stress at elastic limit)
2 2E
Area under Engg Stress - Strain diagram up to elastic limit10 Resilience = Modulus of Resilience x Volume of specimen undergoing Tensile stress
7232019 MOFMOS LABpdf
httpslidepdfcomreaderfullmofmos-labpdf 4447
Department of ANE MOFMOS LAB MANUAL
983089983096
11 Yield point ElongationElongation taking place in the specimen from C to D this istaking place without increase in stress
12 Modulus of toughnessArea under engineering stress ndash strain diagram up to fracture13 Toughness = Modulus of toughness x Volume of specimenThis indicates theamount of energy absorbed by the specimen before fracture take place
14 Ductility= (Final length at fracture ndash original length 10) x 100
15 MalleabilityIt is the ability of the material to undergo plastic deformation prior fracture under compressive loading conditions In a tensile test it is approximatedas percentage reduction in cross sectional area of the specimen Malleability =
(AO - Af )AO) x 100
True stress ndash true strain diagram
Engineering stress is calculated based on original cross sectional area (AO) But not on the actual cross sectional area at load bdquoP‟
True stress = PA = PAO x AO A
Since volume remains constant during plastic deformation we have AO LO = AL True stress = PAO x L LO
= PAO x ((LO + δLO) LO)
= P (1+e)= Nominal stress (1+ nominal strain)
True strain = Є = 1n (1+e)
These relations are valid up to ultimate load ie up to which the strain isuniform all along the gauge length
1 True Stress at upper yield point = Nominal stress at upper yield point ( 1+e O)True strain at C = 1n (1+eo)
2 True stress at ultimate load (E1)= Nominal ultimate stress ( 1+eE)True strain at ultimate load = 1n (1+eE)
3 True stress at fracture (E1) = Pf Af
Where Af is the area of cross section at fracture can be measured True
strain at fracture = 1n (Ao Af )
Area relation is taken instead of lengths because the strains are localized in theregion between ultimate load point and fracture point
4 Strain Hardening
From lower yield point onwards increase in load is required for increase instrain Thus the stress required for further deformation is more Thisphenomenon is called strain hardening
5 True ndash stress ndash true strain curve in log ndash log co ndash ordinates
When the true ndash stress and true ndash strain are plotted on log ndash log co ndash ordinates thecurve is a straight line
7232019 MOFMOS LABpdf
httpslidepdfcomreaderfullmofmos-labpdf 4547
Department of ANE MOFMOS LAB MANUAL
983120983137983143983141 983089983097 983151983142 983090983089
6 Ductile and Brittle Materials
If a material fails without much plastic deformation it can be called brittle If the percentageelongation at fracture is less than 25 the material is classified as brittle
bull Usually the metals with FCC and CPH structures are highly ductile
PROCEDURE
1 Measure the original gauge length and diameter of the specimen
2 Insert the specimen into grips of the test machine
3 Begin the load application and record load vs elongation data
4 Take the readings more frequently as yield point is approached
5 Measure elongation values
6 Continue the test till fracture occurs
7 By joining the two broken halves of the specimen together measure the final length anddiameter of specimen at fracture
RESULTS AND DISCUSSIONS
1 Plot the Engg Stress strain curve and determine the following
bull Limit of proportionality = (Nmm2)
bull Yield strength = (Nmm2)
bull Ultimate strength = (Nmm2)
bull Young`s modulus = (Nmm2)
bull Percentage elongation = bull Percentage reduction in area =
bull Fracture strength = (Nominal Engg)
bull Toughness = Area under stress ndash strain curve up to
fracture
bull Malleability
2 Plot True Stress True strain curve after calculating true ndash stress and true strain values at various
points
Estimate1) Strength coefficient
2) Strain hardening coefficient
3) Determine whether the material is ductile or brittle4) Comment on the results
7232019 MOFMOS LABpdf
httpslidepdfcomreaderfullmofmos-labpdf 4647
Department of ANE MOFMOS LAB MANUAL
983120983137983143983141 983090983088 983151983142 983090983089
SNo Load Deformation Stress Strain E
Calculation part-
7232019 MOFMOS LABpdf
httpslidepdfcomreaderfullmofmos-labpdf 4747
Department of ANE MOFMOS LAB MANUAL
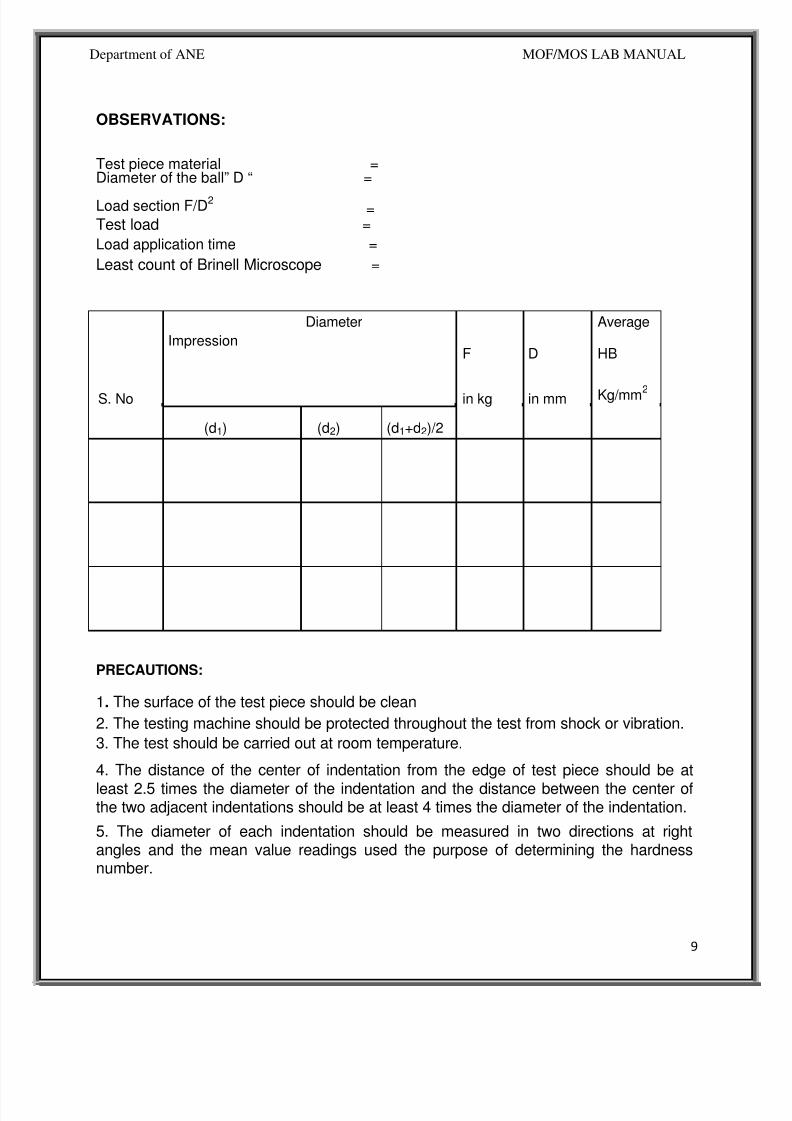
7232019 MOFMOS LABpdf
httpslidepdfcomreaderfullmofmos-labpdf 3647
Department of ANE
MOFMOS LAB MANUAL
983089983088
RESULT
Calculation Part
7232019 MOFMOS LABpdf
httpslidepdfcomreaderfullmofmos-labpdf 3747
Department of ANE MOFMOS LAB MANUAL
983089983089
SPRING TEST
AIM To determine the rigidity modulus of the spring
APPARATUS Spring testing machine vernier calipers spring specimen
THEORY
Closed coiled helical springs are the springs in which helix angle is very small or inother words the pitch between two adjacent turns is small A closed coiled helical springcarrying an axial load is shown in fig
As helix angle in case of close coiled helical springs are small hence the bendingeffect on the spring is ignored and we assume that the coils of close coiled helical
springs are to stand purely tensional stresses Let d=diameter ofthe spring wire
P= pitch of the helical spring N= number ofcoils R= mean radius of the spring coil
W=axial load on spring C=modulus of rigidity
τ=maximum shear stress induced in the wire θ=angle of twist in the
spring wire and
x= deflection of spring due to axial load l= length of wire
Net twisting moment on the wire T=WR
But twisting moment is also given by T= (π 16) τd3
From 1 ad 2 WR = (π 16) τd3 τ=16WR πd
3
above equation which gives the maximum shear stress induced in the wire (1) Length of one coil=2πR
Total length of the wire=2πRn (2)
Strain energy stored by the spring due to torsion
U= (τ 4C) [(π 4)d 2πRn] (3)
Work done on the spring =average load x deflection
= (12) Wx (4)
Equating 3 and 4
(12) Wx = (32W2R3n)Cd4
7232019 MOFMOS LABpdf
httpslidepdfcomreaderfullmofmos-labpdf 3847
Department of ANE MOFMOS LAB MANUAL
983089983090
x=64WR3nCd
4
Rigidity modulus of the spring
C=64WR3nxd
4
PROCEDURE
1) Consider the spring and find out itsmean coil radius R with the help ofvernier calipers
2) Find the diameter of the spring andnumber of turns
3) Fix the spring between two hooks
4) Now load is gradually applied
5) Note the deflection from thedeflection scale for different loadsapplied
6) Calculate the rigidity modulus usingabove formula
PRECAUTIONS
1) Dimensions should be measureaccurately with the help of verniercalipers
2) Deflection from the scale should benoted carefully and accurately
OBSERVATION TABLE
Sno Load applied deflection Rigidity modulus
C
Average rigidity modulus C =
RESULT
7232019 MOFMOS LABpdf
httpslidepdfcomreaderfullmofmos-labpdf 3947
Department of ANE MOFMOS LAB MANUAL
983089983091
Calculation Part
7232019 MOFMOS LABpdf
httpslidepdfcomreaderfullmofmos-labpdf 4047
Department of ANE MOFMOS LAB MANUAL
983089983092
TORSION
AIM To conduct torsion test on mild steel or cast iron specimen to find modulus of rigidity or to find angle of twist of the materials which are subjected to torsion
APPARATUS 1 A torsion test machine along with angle of twist measuring attachment
2 Standard specimen of mild steel or cast iron
3 Steel rule
4 Vernnier caliper or a micrometer
THEORY
For transmitting power through a rotating shaft it is necessary to apply a turning
force The force is applied tangentially and in the plane of transverse cross section The
torque or twisting moment may be calculated by multiplying two opposite turningmoments It is said to be in pure torsion and it will exhibit the tendency of shearing off at
every cross section which is perpendicular to the longitudinal axis
Torsion equation
Torsion equation is given by below
T IP = CθL = TR
T= maximum twisting torque (Nmm) IP =
polar moment of inertia (mm4) τ =shear
stress (Nmm2) C=modulus of rigidity (Nmm2)
θ=angle of twist in radians L=length of shaft under torsion (mm)
Assumptions made for getting torsion equation
1 The material of the shaft is uniform through out
2 The shaft circular in section remain circular after loading
3 Plane sections of shaft normal to its axis before loading remain plane after thetorque have been applied
4 The twist along the length of the shaft is uniform throughout
5 The distance between any two normal-sections remains the same after theapplication of torque
6 Maximum shear stress induced in the shaft due to application of torque does notexceed its elastic limit
7232019 MOFMOS LABpdf
httpslidepdfcomreaderfullmofmos-labpdf 4147
Department of ANE MOFMOS LAB MANUAL
983089983093
PROCEDURE
1 Select the suitable grips to suit the size of the specimen and clamp it in themachine by adjusting sliding jaw
2 Measure the diameter at about the three places and take average value
3 Choose the appropriate loading range depending upon specimen
4 Set the maximum load pointer to zero
5 Carry out straining by rotating the hand wheel or by switching on the motor
6 Load the members in suitable increments observe and record strain reading
7 Continue till failure of the specimen
8 Calculate the modulus of rigidity C by using the torsion equation
9 Plot the torque ndashtwist graph (T Vs θ)
OBSERVATIONS
Gauge length L =
Polar moment of inertia IP =
Modulus of rigidity C =TL IP θ =
SNo Twisting Moment Angle of Twist Modulus Average
Kgf Nm Degrees Radians of rigidity CNmm2
C
RESULT
7232019 MOFMOS LABpdf
httpslidepdfcomreaderfullmofmos-labpdf 4247
Department of ANE MOFMOS LAB MANUAL
983089983094
TENSILE TEST
AIM
To conduct tensile test on a mild steel specimen and determine the following
1 Limit of proportionality 2 Elastic Limit
3 Upper yield point 4 Lower yield point
5 Ultimate strength 6 Fracture strength
7 Young`s Modulus 8 Percentage elongation
9 Percentage reduction in area 10 Ductility
11 Toughness 12 True stress amp true strain
13 Malleability
APPARATUS tensile testing machine specimen steel rule vernier caliper micrometer
THEORY
The tensile test is most applied one of all mechanical tests In this test a test specimen is fixed
into grips connected to a straining device and to a load-measuring device (One end in stationary
grips and the other in movable grips) If the applied load is small enough the deformation of any
solid body is entirely elastic An elastically deformed solid will return to its original form as soon
as load is removed However if the load is too large the material can be deformed permanently
The initial part of the tension curve which represents the manner in which solid undergoes
plastic deformation is termed as plastic The stress below which the deformation is essentially
entirely elastic is known as the elastic limit of the material In some materials like mild steel a
sudden drop in load indicating both an upper and lower yield point denotes the onset of plastic
deformation However some materials do not exhibit a sharp yield point During plastic
deformation at lager extensions strain hardening cannot compensate for the decrease in section
and thus the load passes through a maximum and then begins to decrease At this stage the
ultimate strength which is defined as the ration of the load on the specimen to the original cross-section area reaches a maximum value Until this point the deformation is uniform at all the
sections of the specimen Further loading will eventually cause bdquoneck ‟ formation and rupture
follows
7232019 MOFMOS LABpdf
httpslidepdfcomreaderfullmofmos-labpdf 4347
Department of ANE MOFMOS LAB
MANUAL
983089983095
Usually a tension test is conducted at room temperature the tensile load is applied
slowly During this test either round or flat specimens may be used The load on the specimen is
applied mechanically or hydraulically depending on the type of testing machine
1 NominalEngg stress and NominalEngg strain
Original CS area = A0 (mm2)
Original gauge length = L0 (mm) Increase in gauge length = δL0
Nominal stress = PA0 (N mm2)
Nominal strain = δL0 L0
2 Limit of Proportionality Stress is proportional to strain up to this pointNormal Stress = PA PO Normal Strain = (δ LO) ALO
3 Elastic limit When the load is removed at ldquoBrdquo the specimen will go back to originalDimensions ie LO and δ AO Nominal stress = PB AO Normal Strain = (δ LO) B LO
If the specimen is loaded beyond elastic limit it will undergo permanent strainie Plastic deformation
4 Upper yield point Nominal stress = PC AO Nominal strain = (δ LO) D LO
5 Lower yield point Nominal stress = PD AO
Nominal strain = (δ LO) D LO 6 Ultimate load or maximum load point
Nominal ultimate stress = PE AO Nominal strain = (δ LO) E LO
7 Fracture Load point F
Nominal fracture stress = PF AO
Nominal strain at fracture = (δ LO) F LO
8 Young`s modulus (E) Young`s modulus (E) = StressStrain
(In the elastic region limit of proportionality = Nominal stress at ANominal strain at A 9Modulus of resilience = (Nominal stress at elastic limit)
2 2E
Area under Engg Stress - Strain diagram up to elastic limit10 Resilience = Modulus of Resilience x Volume of specimen undergoing Tensile stress
7232019 MOFMOS LABpdf
httpslidepdfcomreaderfullmofmos-labpdf 4447
Department of ANE MOFMOS LAB MANUAL
983089983096
11 Yield point ElongationElongation taking place in the specimen from C to D this istaking place without increase in stress
12 Modulus of toughnessArea under engineering stress ndash strain diagram up to fracture13 Toughness = Modulus of toughness x Volume of specimenThis indicates theamount of energy absorbed by the specimen before fracture take place
14 Ductility= (Final length at fracture ndash original length 10) x 100
15 MalleabilityIt is the ability of the material to undergo plastic deformation prior fracture under compressive loading conditions In a tensile test it is approximatedas percentage reduction in cross sectional area of the specimen Malleability =
(AO - Af )AO) x 100
True stress ndash true strain diagram
Engineering stress is calculated based on original cross sectional area (AO) But not on the actual cross sectional area at load bdquoP‟
True stress = PA = PAO x AO A
Since volume remains constant during plastic deformation we have AO LO = AL True stress = PAO x L LO
= PAO x ((LO + δLO) LO)
= P (1+e)= Nominal stress (1+ nominal strain)
True strain = Є = 1n (1+e)
These relations are valid up to ultimate load ie up to which the strain isuniform all along the gauge length
1 True Stress at upper yield point = Nominal stress at upper yield point ( 1+e O)True strain at C = 1n (1+eo)
2 True stress at ultimate load (E1)= Nominal ultimate stress ( 1+eE)True strain at ultimate load = 1n (1+eE)
3 True stress at fracture (E1) = Pf Af
Where Af is the area of cross section at fracture can be measured True
strain at fracture = 1n (Ao Af )
Area relation is taken instead of lengths because the strains are localized in theregion between ultimate load point and fracture point
4 Strain Hardening
From lower yield point onwards increase in load is required for increase instrain Thus the stress required for further deformation is more Thisphenomenon is called strain hardening
5 True ndash stress ndash true strain curve in log ndash log co ndash ordinates
When the true ndash stress and true ndash strain are plotted on log ndash log co ndash ordinates thecurve is a straight line
7232019 MOFMOS LABpdf
httpslidepdfcomreaderfullmofmos-labpdf 4547
Department of ANE MOFMOS LAB MANUAL
983120983137983143983141 983089983097 983151983142 983090983089
6 Ductile and Brittle Materials
If a material fails without much plastic deformation it can be called brittle If the percentageelongation at fracture is less than 25 the material is classified as brittle
bull Usually the metals with FCC and CPH structures are highly ductile
PROCEDURE
1 Measure the original gauge length and diameter of the specimen
2 Insert the specimen into grips of the test machine
3 Begin the load application and record load vs elongation data
4 Take the readings more frequently as yield point is approached
5 Measure elongation values
6 Continue the test till fracture occurs
7 By joining the two broken halves of the specimen together measure the final length anddiameter of specimen at fracture
RESULTS AND DISCUSSIONS
1 Plot the Engg Stress strain curve and determine the following
bull Limit of proportionality = (Nmm2)
bull Yield strength = (Nmm2)
bull Ultimate strength = (Nmm2)
bull Young`s modulus = (Nmm2)
bull Percentage elongation = bull Percentage reduction in area =
bull Fracture strength = (Nominal Engg)
bull Toughness = Area under stress ndash strain curve up to
fracture
bull Malleability
2 Plot True Stress True strain curve after calculating true ndash stress and true strain values at various
points
Estimate1) Strength coefficient
2) Strain hardening coefficient
3) Determine whether the material is ductile or brittle4) Comment on the results
7232019 MOFMOS LABpdf
httpslidepdfcomreaderfullmofmos-labpdf 4647
Department of ANE MOFMOS LAB MANUAL
983120983137983143983141 983090983088 983151983142 983090983089
SNo Load Deformation Stress Strain E
Calculation part-
7232019 MOFMOS LABpdf
httpslidepdfcomreaderfullmofmos-labpdf 4747
Department of ANE MOFMOS LAB MANUAL
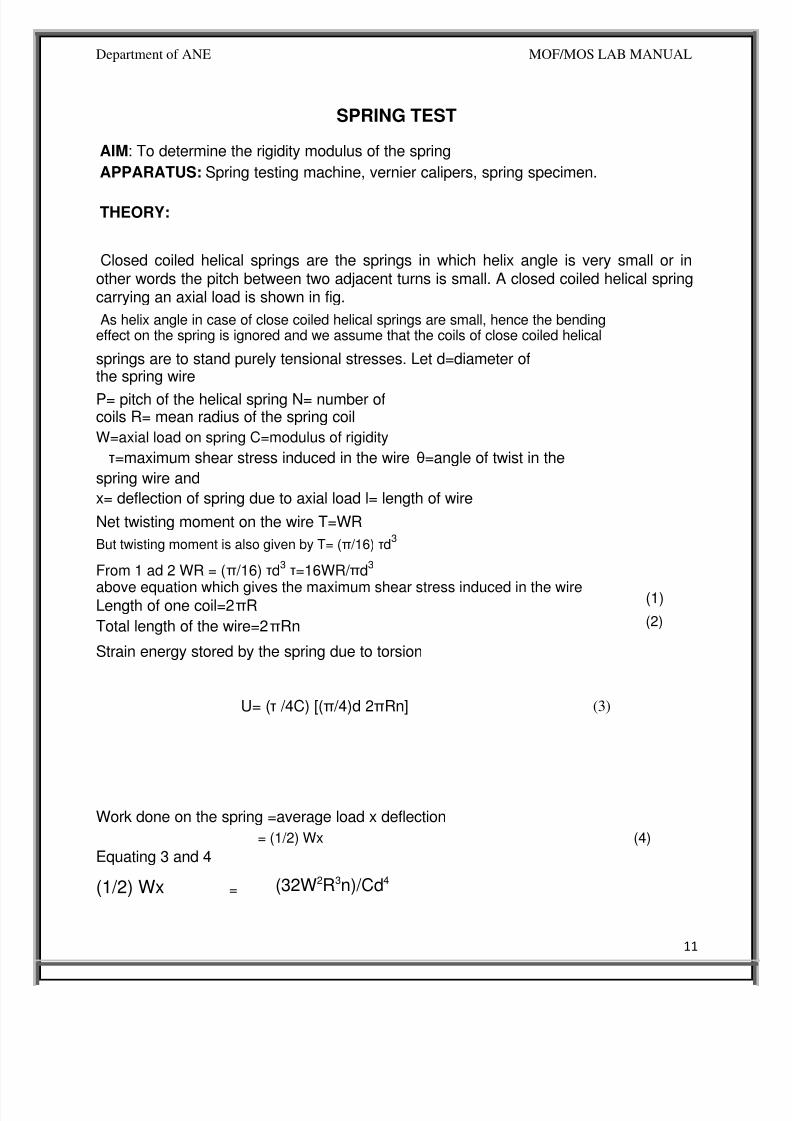
7232019 MOFMOS LABpdf
httpslidepdfcomreaderfullmofmos-labpdf 3747
Department of ANE MOFMOS LAB MANUAL
983089983089
SPRING TEST
AIM To determine the rigidity modulus of the spring
APPARATUS Spring testing machine vernier calipers spring specimen
THEORY
Closed coiled helical springs are the springs in which helix angle is very small or inother words the pitch between two adjacent turns is small A closed coiled helical springcarrying an axial load is shown in fig
As helix angle in case of close coiled helical springs are small hence the bendingeffect on the spring is ignored and we assume that the coils of close coiled helical
springs are to stand purely tensional stresses Let d=diameter ofthe spring wire
P= pitch of the helical spring N= number ofcoils R= mean radius of the spring coil
W=axial load on spring C=modulus of rigidity
τ=maximum shear stress induced in the wire θ=angle of twist in the
spring wire and
x= deflection of spring due to axial load l= length of wire
Net twisting moment on the wire T=WR
But twisting moment is also given by T= (π 16) τd3
From 1 ad 2 WR = (π 16) τd3 τ=16WR πd
3
above equation which gives the maximum shear stress induced in the wire (1) Length of one coil=2πR
Total length of the wire=2πRn (2)
Strain energy stored by the spring due to torsion
U= (τ 4C) [(π 4)d 2πRn] (3)
Work done on the spring =average load x deflection
= (12) Wx (4)
Equating 3 and 4
(12) Wx = (32W2R3n)Cd4
7232019 MOFMOS LABpdf
httpslidepdfcomreaderfullmofmos-labpdf 3847
Department of ANE MOFMOS LAB MANUAL
983089983090
x=64WR3nCd
4
Rigidity modulus of the spring
C=64WR3nxd
4
PROCEDURE
1) Consider the spring and find out itsmean coil radius R with the help ofvernier calipers
2) Find the diameter of the spring andnumber of turns
3) Fix the spring between two hooks
4) Now load is gradually applied
5) Note the deflection from thedeflection scale for different loadsapplied
6) Calculate the rigidity modulus usingabove formula
PRECAUTIONS
1) Dimensions should be measureaccurately with the help of verniercalipers
2) Deflection from the scale should benoted carefully and accurately
OBSERVATION TABLE
Sno Load applied deflection Rigidity modulus
C
Average rigidity modulus C =
RESULT
7232019 MOFMOS LABpdf
httpslidepdfcomreaderfullmofmos-labpdf 3947
Department of ANE MOFMOS LAB MANUAL
983089983091
Calculation Part
7232019 MOFMOS LABpdf
httpslidepdfcomreaderfullmofmos-labpdf 4047
Department of ANE MOFMOS LAB MANUAL
983089983092
TORSION
AIM To conduct torsion test on mild steel or cast iron specimen to find modulus of rigidity or to find angle of twist of the materials which are subjected to torsion
APPARATUS 1 A torsion test machine along with angle of twist measuring attachment
2 Standard specimen of mild steel or cast iron
3 Steel rule
4 Vernnier caliper or a micrometer
THEORY
For transmitting power through a rotating shaft it is necessary to apply a turning
force The force is applied tangentially and in the plane of transverse cross section The
torque or twisting moment may be calculated by multiplying two opposite turningmoments It is said to be in pure torsion and it will exhibit the tendency of shearing off at
every cross section which is perpendicular to the longitudinal axis
Torsion equation
Torsion equation is given by below
T IP = CθL = TR
T= maximum twisting torque (Nmm) IP =
polar moment of inertia (mm4) τ =shear
stress (Nmm2) C=modulus of rigidity (Nmm2)
θ=angle of twist in radians L=length of shaft under torsion (mm)
Assumptions made for getting torsion equation
1 The material of the shaft is uniform through out
2 The shaft circular in section remain circular after loading
3 Plane sections of shaft normal to its axis before loading remain plane after thetorque have been applied
4 The twist along the length of the shaft is uniform throughout
5 The distance between any two normal-sections remains the same after theapplication of torque
6 Maximum shear stress induced in the shaft due to application of torque does notexceed its elastic limit
7232019 MOFMOS LABpdf
httpslidepdfcomreaderfullmofmos-labpdf 4147
Department of ANE MOFMOS LAB MANUAL
983089983093
PROCEDURE
1 Select the suitable grips to suit the size of the specimen and clamp it in themachine by adjusting sliding jaw
2 Measure the diameter at about the three places and take average value
3 Choose the appropriate loading range depending upon specimen
4 Set the maximum load pointer to zero
5 Carry out straining by rotating the hand wheel or by switching on the motor
6 Load the members in suitable increments observe and record strain reading
7 Continue till failure of the specimen
8 Calculate the modulus of rigidity C by using the torsion equation
9 Plot the torque ndashtwist graph (T Vs θ)
OBSERVATIONS
Gauge length L =
Polar moment of inertia IP =
Modulus of rigidity C =TL IP θ =
SNo Twisting Moment Angle of Twist Modulus Average
Kgf Nm Degrees Radians of rigidity CNmm2
C
RESULT
7232019 MOFMOS LABpdf
httpslidepdfcomreaderfullmofmos-labpdf 4247
Department of ANE MOFMOS LAB MANUAL
983089983094
TENSILE TEST
AIM
To conduct tensile test on a mild steel specimen and determine the following
1 Limit of proportionality 2 Elastic Limit
3 Upper yield point 4 Lower yield point
5 Ultimate strength 6 Fracture strength
7 Young`s Modulus 8 Percentage elongation
9 Percentage reduction in area 10 Ductility
11 Toughness 12 True stress amp true strain
13 Malleability
APPARATUS tensile testing machine specimen steel rule vernier caliper micrometer
THEORY
The tensile test is most applied one of all mechanical tests In this test a test specimen is fixed
into grips connected to a straining device and to a load-measuring device (One end in stationary
grips and the other in movable grips) If the applied load is small enough the deformation of any
solid body is entirely elastic An elastically deformed solid will return to its original form as soon
as load is removed However if the load is too large the material can be deformed permanently
The initial part of the tension curve which represents the manner in which solid undergoes
plastic deformation is termed as plastic The stress below which the deformation is essentially
entirely elastic is known as the elastic limit of the material In some materials like mild steel a
sudden drop in load indicating both an upper and lower yield point denotes the onset of plastic
deformation However some materials do not exhibit a sharp yield point During plastic
deformation at lager extensions strain hardening cannot compensate for the decrease in section
and thus the load passes through a maximum and then begins to decrease At this stage the
ultimate strength which is defined as the ration of the load on the specimen to the original cross-section area reaches a maximum value Until this point the deformation is uniform at all the
sections of the specimen Further loading will eventually cause bdquoneck ‟ formation and rupture
follows
7232019 MOFMOS LABpdf
httpslidepdfcomreaderfullmofmos-labpdf 4347
Department of ANE MOFMOS LAB
MANUAL
983089983095
Usually a tension test is conducted at room temperature the tensile load is applied
slowly During this test either round or flat specimens may be used The load on the specimen is
applied mechanically or hydraulically depending on the type of testing machine
1 NominalEngg stress and NominalEngg strain
Original CS area = A0 (mm2)
Original gauge length = L0 (mm) Increase in gauge length = δL0
Nominal stress = PA0 (N mm2)
Nominal strain = δL0 L0
2 Limit of Proportionality Stress is proportional to strain up to this pointNormal Stress = PA PO Normal Strain = (δ LO) ALO
3 Elastic limit When the load is removed at ldquoBrdquo the specimen will go back to originalDimensions ie LO and δ AO Nominal stress = PB AO Normal Strain = (δ LO) B LO
If the specimen is loaded beyond elastic limit it will undergo permanent strainie Plastic deformation
4 Upper yield point Nominal stress = PC AO Nominal strain = (δ LO) D LO
5 Lower yield point Nominal stress = PD AO
Nominal strain = (δ LO) D LO 6 Ultimate load or maximum load point
Nominal ultimate stress = PE AO Nominal strain = (δ LO) E LO
7 Fracture Load point F
Nominal fracture stress = PF AO
Nominal strain at fracture = (δ LO) F LO
8 Young`s modulus (E) Young`s modulus (E) = StressStrain
(In the elastic region limit of proportionality = Nominal stress at ANominal strain at A 9Modulus of resilience = (Nominal stress at elastic limit)
2 2E
Area under Engg Stress - Strain diagram up to elastic limit10 Resilience = Modulus of Resilience x Volume of specimen undergoing Tensile stress
7232019 MOFMOS LABpdf
httpslidepdfcomreaderfullmofmos-labpdf 4447
Department of ANE MOFMOS LAB MANUAL
983089983096
11 Yield point ElongationElongation taking place in the specimen from C to D this istaking place without increase in stress
12 Modulus of toughnessArea under engineering stress ndash strain diagram up to fracture13 Toughness = Modulus of toughness x Volume of specimenThis indicates theamount of energy absorbed by the specimen before fracture take place
14 Ductility= (Final length at fracture ndash original length 10) x 100
15 MalleabilityIt is the ability of the material to undergo plastic deformation prior fracture under compressive loading conditions In a tensile test it is approximatedas percentage reduction in cross sectional area of the specimen Malleability =
(AO - Af )AO) x 100
True stress ndash true strain diagram
Engineering stress is calculated based on original cross sectional area (AO) But not on the actual cross sectional area at load bdquoP‟
True stress = PA = PAO x AO A
Since volume remains constant during plastic deformation we have AO LO = AL True stress = PAO x L LO
= PAO x ((LO + δLO) LO)
= P (1+e)= Nominal stress (1+ nominal strain)
True strain = Є = 1n (1+e)
These relations are valid up to ultimate load ie up to which the strain isuniform all along the gauge length
1 True Stress at upper yield point = Nominal stress at upper yield point ( 1+e O)True strain at C = 1n (1+eo)
2 True stress at ultimate load (E1)= Nominal ultimate stress ( 1+eE)True strain at ultimate load = 1n (1+eE)
3 True stress at fracture (E1) = Pf Af
Where Af is the area of cross section at fracture can be measured True
strain at fracture = 1n (Ao Af )
Area relation is taken instead of lengths because the strains are localized in theregion between ultimate load point and fracture point
4 Strain Hardening
From lower yield point onwards increase in load is required for increase instrain Thus the stress required for further deformation is more Thisphenomenon is called strain hardening
5 True ndash stress ndash true strain curve in log ndash log co ndash ordinates
When the true ndash stress and true ndash strain are plotted on log ndash log co ndash ordinates thecurve is a straight line
7232019 MOFMOS LABpdf
httpslidepdfcomreaderfullmofmos-labpdf 4547
Department of ANE MOFMOS LAB MANUAL
983120983137983143983141 983089983097 983151983142 983090983089
6 Ductile and Brittle Materials
If a material fails without much plastic deformation it can be called brittle If the percentageelongation at fracture is less than 25 the material is classified as brittle
bull Usually the metals with FCC and CPH structures are highly ductile
PROCEDURE
1 Measure the original gauge length and diameter of the specimen
2 Insert the specimen into grips of the test machine
3 Begin the load application and record load vs elongation data
4 Take the readings more frequently as yield point is approached
5 Measure elongation values
6 Continue the test till fracture occurs
7 By joining the two broken halves of the specimen together measure the final length anddiameter of specimen at fracture
RESULTS AND DISCUSSIONS
1 Plot the Engg Stress strain curve and determine the following
bull Limit of proportionality = (Nmm2)
bull Yield strength = (Nmm2)
bull Ultimate strength = (Nmm2)
bull Young`s modulus = (Nmm2)
bull Percentage elongation = bull Percentage reduction in area =
bull Fracture strength = (Nominal Engg)
bull Toughness = Area under stress ndash strain curve up to
fracture
bull Malleability
2 Plot True Stress True strain curve after calculating true ndash stress and true strain values at various
points
Estimate1) Strength coefficient
2) Strain hardening coefficient
3) Determine whether the material is ductile or brittle4) Comment on the results
7232019 MOFMOS LABpdf
httpslidepdfcomreaderfullmofmos-labpdf 4647
Department of ANE MOFMOS LAB MANUAL
983120983137983143983141 983090983088 983151983142 983090983089
SNo Load Deformation Stress Strain E
Calculation part-
7232019 MOFMOS LABpdf
httpslidepdfcomreaderfullmofmos-labpdf 4747
Department of ANE MOFMOS LAB MANUAL
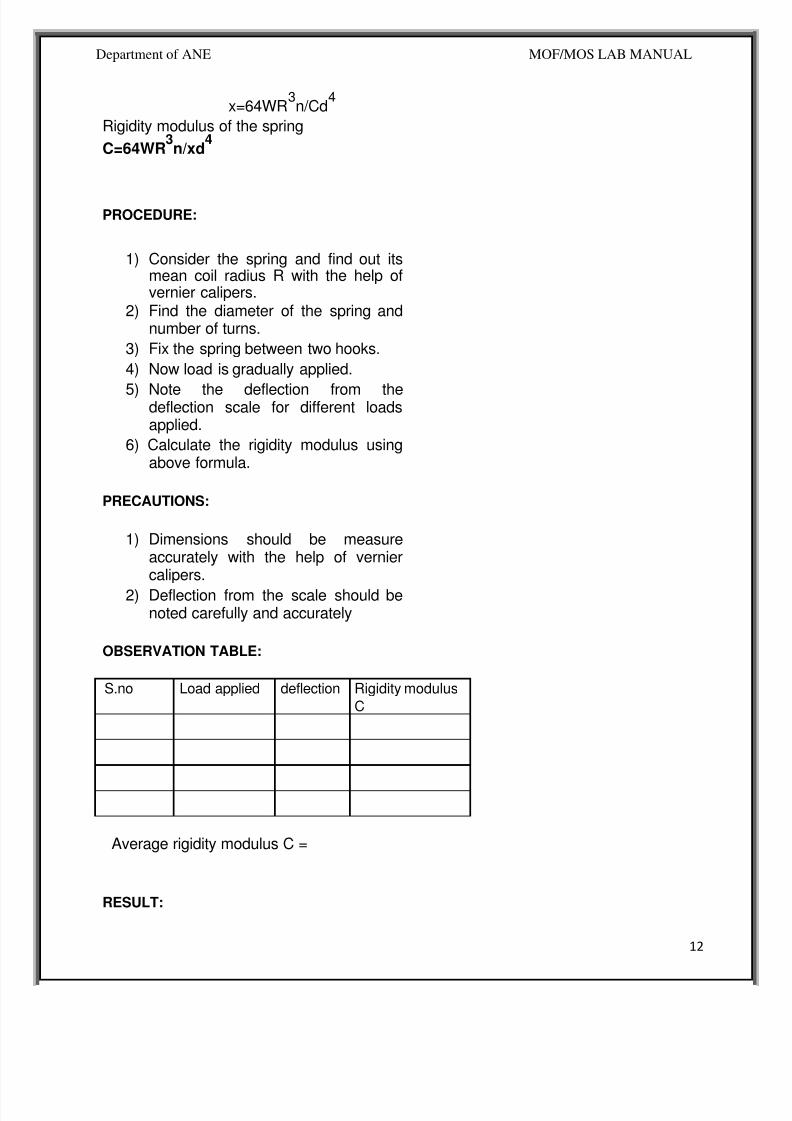
7232019 MOFMOS LABpdf
httpslidepdfcomreaderfullmofmos-labpdf 3947
Department of ANE MOFMOS LAB MANUAL
983089983091
Calculation Part
7232019 MOFMOS LABpdf
httpslidepdfcomreaderfullmofmos-labpdf 4047
Department of ANE MOFMOS LAB MANUAL
983089983092
TORSION
AIM To conduct torsion test on mild steel or cast iron specimen to find modulus of rigidity or to find angle of twist of the materials which are subjected to torsion
APPARATUS 1 A torsion test machine along with angle of twist measuring attachment
2 Standard specimen of mild steel or cast iron
3 Steel rule
4 Vernnier caliper or a micrometer
THEORY
For transmitting power through a rotating shaft it is necessary to apply a turning
force The force is applied tangentially and in the plane of transverse cross section The
torque or twisting moment may be calculated by multiplying two opposite turningmoments It is said to be in pure torsion and it will exhibit the tendency of shearing off at
every cross section which is perpendicular to the longitudinal axis
Torsion equation
Torsion equation is given by below
T IP = CθL = TR
T= maximum twisting torque (Nmm) IP =
polar moment of inertia (mm4) τ =shear
stress (Nmm2) C=modulus of rigidity (Nmm2)
θ=angle of twist in radians L=length of shaft under torsion (mm)
Assumptions made for getting torsion equation
1 The material of the shaft is uniform through out
2 The shaft circular in section remain circular after loading
3 Plane sections of shaft normal to its axis before loading remain plane after thetorque have been applied
4 The twist along the length of the shaft is uniform throughout
5 The distance between any two normal-sections remains the same after theapplication of torque
6 Maximum shear stress induced in the shaft due to application of torque does notexceed its elastic limit
7232019 MOFMOS LABpdf
httpslidepdfcomreaderfullmofmos-labpdf 4147
Department of ANE MOFMOS LAB MANUAL
983089983093
PROCEDURE
1 Select the suitable grips to suit the size of the specimen and clamp it in themachine by adjusting sliding jaw
2 Measure the diameter at about the three places and take average value
3 Choose the appropriate loading range depending upon specimen
4 Set the maximum load pointer to zero
5 Carry out straining by rotating the hand wheel or by switching on the motor
6 Load the members in suitable increments observe and record strain reading
7 Continue till failure of the specimen
8 Calculate the modulus of rigidity C by using the torsion equation
9 Plot the torque ndashtwist graph (T Vs θ)
OBSERVATIONS
Gauge length L =
Polar moment of inertia IP =
Modulus of rigidity C =TL IP θ =
SNo Twisting Moment Angle of Twist Modulus Average
Kgf Nm Degrees Radians of rigidity CNmm2
C
RESULT
7232019 MOFMOS LABpdf
httpslidepdfcomreaderfullmofmos-labpdf 4247
Department of ANE MOFMOS LAB MANUAL
983089983094
TENSILE TEST
AIM
To conduct tensile test on a mild steel specimen and determine the following
1 Limit of proportionality 2 Elastic Limit
3 Upper yield point 4 Lower yield point
5 Ultimate strength 6 Fracture strength
7 Young`s Modulus 8 Percentage elongation
9 Percentage reduction in area 10 Ductility
11 Toughness 12 True stress amp true strain
13 Malleability
APPARATUS tensile testing machine specimen steel rule vernier caliper micrometer
THEORY
The tensile test is most applied one of all mechanical tests In this test a test specimen is fixed
into grips connected to a straining device and to a load-measuring device (One end in stationary
grips and the other in movable grips) If the applied load is small enough the deformation of any
solid body is entirely elastic An elastically deformed solid will return to its original form as soon
as load is removed However if the load is too large the material can be deformed permanently
The initial part of the tension curve which represents the manner in which solid undergoes
plastic deformation is termed as plastic The stress below which the deformation is essentially
entirely elastic is known as the elastic limit of the material In some materials like mild steel a
sudden drop in load indicating both an upper and lower yield point denotes the onset of plastic
deformation However some materials do not exhibit a sharp yield point During plastic
deformation at lager extensions strain hardening cannot compensate for the decrease in section
and thus the load passes through a maximum and then begins to decrease At this stage the
ultimate strength which is defined as the ration of the load on the specimen to the original cross-section area reaches a maximum value Until this point the deformation is uniform at all the
sections of the specimen Further loading will eventually cause bdquoneck ‟ formation and rupture
follows
7232019 MOFMOS LABpdf
httpslidepdfcomreaderfullmofmos-labpdf 4347
Department of ANE MOFMOS LAB
MANUAL
983089983095
Usually a tension test is conducted at room temperature the tensile load is applied
slowly During this test either round or flat specimens may be used The load on the specimen is
applied mechanically or hydraulically depending on the type of testing machine
1 NominalEngg stress and NominalEngg strain
Original CS area = A0 (mm2)
Original gauge length = L0 (mm) Increase in gauge length = δL0
Nominal stress = PA0 (N mm2)
Nominal strain = δL0 L0
2 Limit of Proportionality Stress is proportional to strain up to this pointNormal Stress = PA PO Normal Strain = (δ LO) ALO
3 Elastic limit When the load is removed at ldquoBrdquo the specimen will go back to originalDimensions ie LO and δ AO Nominal stress = PB AO Normal Strain = (δ LO) B LO
If the specimen is loaded beyond elastic limit it will undergo permanent strainie Plastic deformation
4 Upper yield point Nominal stress = PC AO Nominal strain = (δ LO) D LO
5 Lower yield point Nominal stress = PD AO
Nominal strain = (δ LO) D LO 6 Ultimate load or maximum load point
Nominal ultimate stress = PE AO Nominal strain = (δ LO) E LO
7 Fracture Load point F
Nominal fracture stress = PF AO
Nominal strain at fracture = (δ LO) F LO
8 Young`s modulus (E) Young`s modulus (E) = StressStrain
(In the elastic region limit of proportionality = Nominal stress at ANominal strain at A 9Modulus of resilience = (Nominal stress at elastic limit)
2 2E
Area under Engg Stress - Strain diagram up to elastic limit10 Resilience = Modulus of Resilience x Volume of specimen undergoing Tensile stress
7232019 MOFMOS LABpdf
httpslidepdfcomreaderfullmofmos-labpdf 4447
Department of ANE MOFMOS LAB MANUAL
983089983096
11 Yield point ElongationElongation taking place in the specimen from C to D this istaking place without increase in stress
12 Modulus of toughnessArea under engineering stress ndash strain diagram up to fracture13 Toughness = Modulus of toughness x Volume of specimenThis indicates theamount of energy absorbed by the specimen before fracture take place
14 Ductility= (Final length at fracture ndash original length 10) x 100
15 MalleabilityIt is the ability of the material to undergo plastic deformation prior fracture under compressive loading conditions In a tensile test it is approximatedas percentage reduction in cross sectional area of the specimen Malleability =
(AO - Af )AO) x 100
True stress ndash true strain diagram
Engineering stress is calculated based on original cross sectional area (AO) But not on the actual cross sectional area at load bdquoP‟
True stress = PA = PAO x AO A
Since volume remains constant during plastic deformation we have AO LO = AL True stress = PAO x L LO
= PAO x ((LO + δLO) LO)
= P (1+e)= Nominal stress (1+ nominal strain)
True strain = Є = 1n (1+e)
These relations are valid up to ultimate load ie up to which the strain isuniform all along the gauge length
1 True Stress at upper yield point = Nominal stress at upper yield point ( 1+e O)True strain at C = 1n (1+eo)
2 True stress at ultimate load (E1)= Nominal ultimate stress ( 1+eE)True strain at ultimate load = 1n (1+eE)
3 True stress at fracture (E1) = Pf Af
Where Af is the area of cross section at fracture can be measured True
strain at fracture = 1n (Ao Af )
Area relation is taken instead of lengths because the strains are localized in theregion between ultimate load point and fracture point
4 Strain Hardening
From lower yield point onwards increase in load is required for increase instrain Thus the stress required for further deformation is more Thisphenomenon is called strain hardening
5 True ndash stress ndash true strain curve in log ndash log co ndash ordinates
When the true ndash stress and true ndash strain are plotted on log ndash log co ndash ordinates thecurve is a straight line
7232019 MOFMOS LABpdf
httpslidepdfcomreaderfullmofmos-labpdf 4547
Department of ANE MOFMOS LAB MANUAL
983120983137983143983141 983089983097 983151983142 983090983089
6 Ductile and Brittle Materials
If a material fails without much plastic deformation it can be called brittle If the percentageelongation at fracture is less than 25 the material is classified as brittle
bull Usually the metals with FCC and CPH structures are highly ductile
PROCEDURE
1 Measure the original gauge length and diameter of the specimen
2 Insert the specimen into grips of the test machine
3 Begin the load application and record load vs elongation data
4 Take the readings more frequently as yield point is approached
5 Measure elongation values
6 Continue the test till fracture occurs
7 By joining the two broken halves of the specimen together measure the final length anddiameter of specimen at fracture
RESULTS AND DISCUSSIONS
1 Plot the Engg Stress strain curve and determine the following
bull Limit of proportionality = (Nmm2)
bull Yield strength = (Nmm2)
bull Ultimate strength = (Nmm2)
bull Young`s modulus = (Nmm2)
bull Percentage elongation = bull Percentage reduction in area =
bull Fracture strength = (Nominal Engg)
bull Toughness = Area under stress ndash strain curve up to
fracture
bull Malleability
2 Plot True Stress True strain curve after calculating true ndash stress and true strain values at various
points
Estimate1) Strength coefficient
2) Strain hardening coefficient
3) Determine whether the material is ductile or brittle4) Comment on the results
7232019 MOFMOS LABpdf
httpslidepdfcomreaderfullmofmos-labpdf 4647
Department of ANE MOFMOS LAB MANUAL
983120983137983143983141 983090983088 983151983142 983090983089
SNo Load Deformation Stress Strain E
Calculation part-
7232019 MOFMOS LABpdf
httpslidepdfcomreaderfullmofmos-labpdf 4747
Department of ANE MOFMOS LAB MANUAL
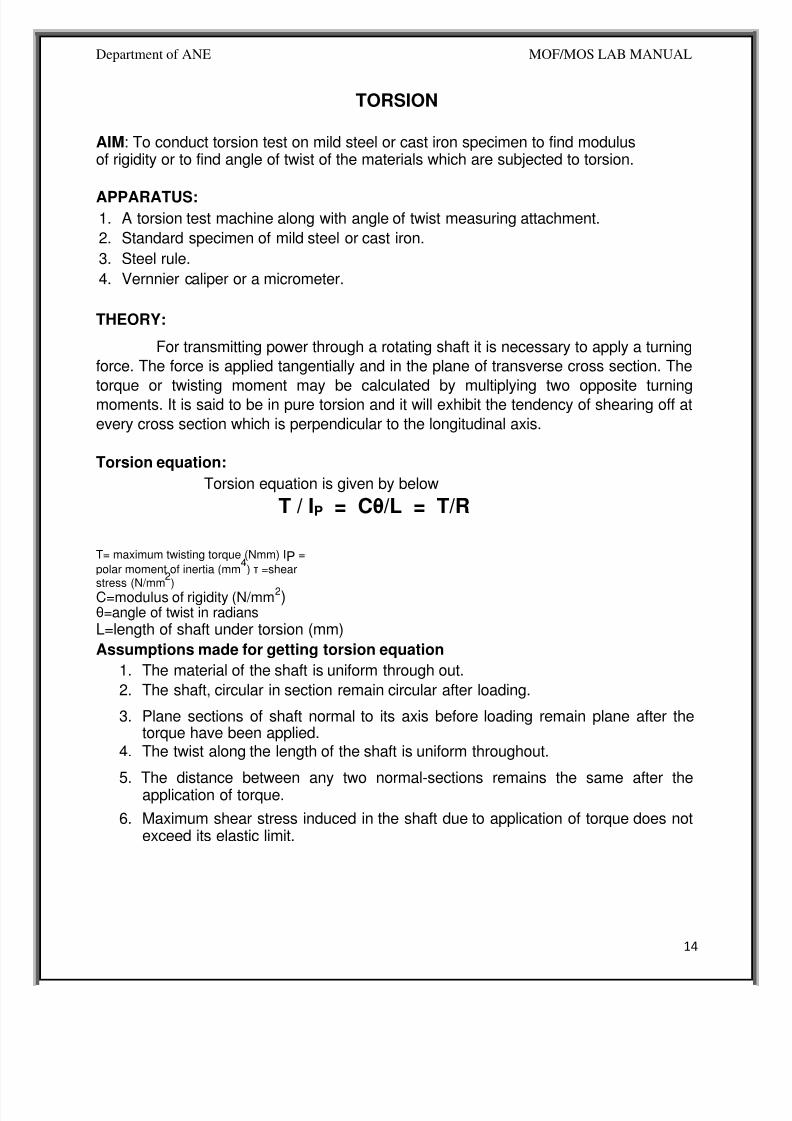
7232019 MOFMOS LABpdf
httpslidepdfcomreaderfullmofmos-labpdf 4147
Department of ANE MOFMOS LAB MANUAL
983089983093
PROCEDURE
1 Select the suitable grips to suit the size of the specimen and clamp it in themachine by adjusting sliding jaw
2 Measure the diameter at about the three places and take average value
3 Choose the appropriate loading range depending upon specimen
4 Set the maximum load pointer to zero
5 Carry out straining by rotating the hand wheel or by switching on the motor
6 Load the members in suitable increments observe and record strain reading
7 Continue till failure of the specimen
8 Calculate the modulus of rigidity C by using the torsion equation
9 Plot the torque ndashtwist graph (T Vs θ)
OBSERVATIONS
Gauge length L =
Polar moment of inertia IP =
Modulus of rigidity C =TL IP θ =
SNo Twisting Moment Angle of Twist Modulus Average
Kgf Nm Degrees Radians of rigidity CNmm2
C
RESULT
7232019 MOFMOS LABpdf
httpslidepdfcomreaderfullmofmos-labpdf 4247
Department of ANE MOFMOS LAB MANUAL
983089983094
TENSILE TEST
AIM
To conduct tensile test on a mild steel specimen and determine the following
1 Limit of proportionality 2 Elastic Limit
3 Upper yield point 4 Lower yield point
5 Ultimate strength 6 Fracture strength
7 Young`s Modulus 8 Percentage elongation
9 Percentage reduction in area 10 Ductility
11 Toughness 12 True stress amp true strain
13 Malleability
APPARATUS tensile testing machine specimen steel rule vernier caliper micrometer
THEORY
The tensile test is most applied one of all mechanical tests In this test a test specimen is fixed
into grips connected to a straining device and to a load-measuring device (One end in stationary
grips and the other in movable grips) If the applied load is small enough the deformation of any
solid body is entirely elastic An elastically deformed solid will return to its original form as soon
as load is removed However if the load is too large the material can be deformed permanently
The initial part of the tension curve which represents the manner in which solid undergoes
plastic deformation is termed as plastic The stress below which the deformation is essentially
entirely elastic is known as the elastic limit of the material In some materials like mild steel a
sudden drop in load indicating both an upper and lower yield point denotes the onset of plastic
deformation However some materials do not exhibit a sharp yield point During plastic
deformation at lager extensions strain hardening cannot compensate for the decrease in section
and thus the load passes through a maximum and then begins to decrease At this stage the
ultimate strength which is defined as the ration of the load on the specimen to the original cross-section area reaches a maximum value Until this point the deformation is uniform at all the
sections of the specimen Further loading will eventually cause bdquoneck ‟ formation and rupture
follows
7232019 MOFMOS LABpdf
httpslidepdfcomreaderfullmofmos-labpdf 4347
Department of ANE MOFMOS LAB
MANUAL
983089983095
Usually a tension test is conducted at room temperature the tensile load is applied
slowly During this test either round or flat specimens may be used The load on the specimen is
applied mechanically or hydraulically depending on the type of testing machine
1 NominalEngg stress and NominalEngg strain
Original CS area = A0 (mm2)
Original gauge length = L0 (mm) Increase in gauge length = δL0
Nominal stress = PA0 (N mm2)
Nominal strain = δL0 L0
2 Limit of Proportionality Stress is proportional to strain up to this pointNormal Stress = PA PO Normal Strain = (δ LO) ALO
3 Elastic limit When the load is removed at ldquoBrdquo the specimen will go back to originalDimensions ie LO and δ AO Nominal stress = PB AO Normal Strain = (δ LO) B LO
If the specimen is loaded beyond elastic limit it will undergo permanent strainie Plastic deformation
4 Upper yield point Nominal stress = PC AO Nominal strain = (δ LO) D LO
5 Lower yield point Nominal stress = PD AO
Nominal strain = (δ LO) D LO 6 Ultimate load or maximum load point
Nominal ultimate stress = PE AO Nominal strain = (δ LO) E LO
7 Fracture Load point F
Nominal fracture stress = PF AO
Nominal strain at fracture = (δ LO) F LO
8 Young`s modulus (E) Young`s modulus (E) = StressStrain
(In the elastic region limit of proportionality = Nominal stress at ANominal strain at A 9Modulus of resilience = (Nominal stress at elastic limit)
2 2E
Area under Engg Stress - Strain diagram up to elastic limit10 Resilience = Modulus of Resilience x Volume of specimen undergoing Tensile stress
7232019 MOFMOS LABpdf
httpslidepdfcomreaderfullmofmos-labpdf 4447
Department of ANE MOFMOS LAB MANUAL
983089983096
11 Yield point ElongationElongation taking place in the specimen from C to D this istaking place without increase in stress
12 Modulus of toughnessArea under engineering stress ndash strain diagram up to fracture13 Toughness = Modulus of toughness x Volume of specimenThis indicates theamount of energy absorbed by the specimen before fracture take place
14 Ductility= (Final length at fracture ndash original length 10) x 100
15 MalleabilityIt is the ability of the material to undergo plastic deformation prior fracture under compressive loading conditions In a tensile test it is approximatedas percentage reduction in cross sectional area of the specimen Malleability =
(AO - Af )AO) x 100
True stress ndash true strain diagram
Engineering stress is calculated based on original cross sectional area (AO) But not on the actual cross sectional area at load bdquoP‟
True stress = PA = PAO x AO A
Since volume remains constant during plastic deformation we have AO LO = AL True stress = PAO x L LO
= PAO x ((LO + δLO) LO)
= P (1+e)= Nominal stress (1+ nominal strain)
True strain = Є = 1n (1+e)
These relations are valid up to ultimate load ie up to which the strain isuniform all along the gauge length
1 True Stress at upper yield point = Nominal stress at upper yield point ( 1+e O)True strain at C = 1n (1+eo)
2 True stress at ultimate load (E1)= Nominal ultimate stress ( 1+eE)True strain at ultimate load = 1n (1+eE)
3 True stress at fracture (E1) = Pf Af
Where Af is the area of cross section at fracture can be measured True
strain at fracture = 1n (Ao Af )
Area relation is taken instead of lengths because the strains are localized in theregion between ultimate load point and fracture point
4 Strain Hardening
From lower yield point onwards increase in load is required for increase instrain Thus the stress required for further deformation is more Thisphenomenon is called strain hardening
5 True ndash stress ndash true strain curve in log ndash log co ndash ordinates
When the true ndash stress and true ndash strain are plotted on log ndash log co ndash ordinates thecurve is a straight line
7232019 MOFMOS LABpdf
httpslidepdfcomreaderfullmofmos-labpdf 4547
Department of ANE MOFMOS LAB MANUAL
983120983137983143983141 983089983097 983151983142 983090983089
6 Ductile and Brittle Materials
If a material fails without much plastic deformation it can be called brittle If the percentageelongation at fracture is less than 25 the material is classified as brittle
bull Usually the metals with FCC and CPH structures are highly ductile
PROCEDURE
1 Measure the original gauge length and diameter of the specimen
2 Insert the specimen into grips of the test machine
3 Begin the load application and record load vs elongation data
4 Take the readings more frequently as yield point is approached
5 Measure elongation values
6 Continue the test till fracture occurs
7 By joining the two broken halves of the specimen together measure the final length anddiameter of specimen at fracture
RESULTS AND DISCUSSIONS
1 Plot the Engg Stress strain curve and determine the following
bull Limit of proportionality = (Nmm2)
bull Yield strength = (Nmm2)
bull Ultimate strength = (Nmm2)
bull Young`s modulus = (Nmm2)
bull Percentage elongation = bull Percentage reduction in area =
bull Fracture strength = (Nominal Engg)
bull Toughness = Area under stress ndash strain curve up to
fracture
bull Malleability
2 Plot True Stress True strain curve after calculating true ndash stress and true strain values at various
points
Estimate1) Strength coefficient
2) Strain hardening coefficient
3) Determine whether the material is ductile or brittle4) Comment on the results
7232019 MOFMOS LABpdf
httpslidepdfcomreaderfullmofmos-labpdf 4647
Department of ANE MOFMOS LAB MANUAL
983120983137983143983141 983090983088 983151983142 983090983089
SNo Load Deformation Stress Strain E
Calculation part-
7232019 MOFMOS LABpdf
httpslidepdfcomreaderfullmofmos-labpdf 4747
Department of ANE MOFMOS LAB MANUAL
7232019 MOFMOS LABpdf
httpslidepdfcomreaderfullmofmos-labpdf 4247
Department of ANE MOFMOS LAB MANUAL
983089983094
TENSILE TEST
AIM
To conduct tensile test on a mild steel specimen and determine the following
1 Limit of proportionality 2 Elastic Limit
3 Upper yield point 4 Lower yield point
5 Ultimate strength 6 Fracture strength
7 Young`s Modulus 8 Percentage elongation
9 Percentage reduction in area 10 Ductility
11 Toughness 12 True stress amp true strain
13 Malleability
APPARATUS tensile testing machine specimen steel rule vernier caliper micrometer
THEORY
The tensile test is most applied one of all mechanical tests In this test a test specimen is fixed
into grips connected to a straining device and to a load-measuring device (One end in stationary
grips and the other in movable grips) If the applied load is small enough the deformation of any
solid body is entirely elastic An elastically deformed solid will return to its original form as soon
as load is removed However if the load is too large the material can be deformed permanently
The initial part of the tension curve which represents the manner in which solid undergoes
plastic deformation is termed as plastic The stress below which the deformation is essentially
entirely elastic is known as the elastic limit of the material In some materials like mild steel a
sudden drop in load indicating both an upper and lower yield point denotes the onset of plastic
deformation However some materials do not exhibit a sharp yield point During plastic
deformation at lager extensions strain hardening cannot compensate for the decrease in section
and thus the load passes through a maximum and then begins to decrease At this stage the
ultimate strength which is defined as the ration of the load on the specimen to the original cross-section area reaches a maximum value Until this point the deformation is uniform at all the
sections of the specimen Further loading will eventually cause bdquoneck ‟ formation and rupture
follows
7232019 MOFMOS LABpdf
httpslidepdfcomreaderfullmofmos-labpdf 4347
Department of ANE MOFMOS LAB
MANUAL
983089983095
Usually a tension test is conducted at room temperature the tensile load is applied
slowly During this test either round or flat specimens may be used The load on the specimen is
applied mechanically or hydraulically depending on the type of testing machine
1 NominalEngg stress and NominalEngg strain
Original CS area = A0 (mm2)
Original gauge length = L0 (mm) Increase in gauge length = δL0
Nominal stress = PA0 (N mm2)
Nominal strain = δL0 L0
2 Limit of Proportionality Stress is proportional to strain up to this pointNormal Stress = PA PO Normal Strain = (δ LO) ALO
3 Elastic limit When the load is removed at ldquoBrdquo the specimen will go back to originalDimensions ie LO and δ AO Nominal stress = PB AO Normal Strain = (δ LO) B LO
If the specimen is loaded beyond elastic limit it will undergo permanent strainie Plastic deformation
4 Upper yield point Nominal stress = PC AO Nominal strain = (δ LO) D LO
5 Lower yield point Nominal stress = PD AO
Nominal strain = (δ LO) D LO 6 Ultimate load or maximum load point
Nominal ultimate stress = PE AO Nominal strain = (δ LO) E LO
7 Fracture Load point F
Nominal fracture stress = PF AO
Nominal strain at fracture = (δ LO) F LO
8 Young`s modulus (E) Young`s modulus (E) = StressStrain
(In the elastic region limit of proportionality = Nominal stress at ANominal strain at A 9Modulus of resilience = (Nominal stress at elastic limit)
2 2E
Area under Engg Stress - Strain diagram up to elastic limit10 Resilience = Modulus of Resilience x Volume of specimen undergoing Tensile stress
7232019 MOFMOS LABpdf
httpslidepdfcomreaderfullmofmos-labpdf 4447
Department of ANE MOFMOS LAB MANUAL
983089983096
11 Yield point ElongationElongation taking place in the specimen from C to D this istaking place without increase in stress
12 Modulus of toughnessArea under engineering stress ndash strain diagram up to fracture13 Toughness = Modulus of toughness x Volume of specimenThis indicates theamount of energy absorbed by the specimen before fracture take place
14 Ductility= (Final length at fracture ndash original length 10) x 100
15 MalleabilityIt is the ability of the material to undergo plastic deformation prior fracture under compressive loading conditions In a tensile test it is approximatedas percentage reduction in cross sectional area of the specimen Malleability =
(AO - Af )AO) x 100
True stress ndash true strain diagram
Engineering stress is calculated based on original cross sectional area (AO) But not on the actual cross sectional area at load bdquoP‟
True stress = PA = PAO x AO A
Since volume remains constant during plastic deformation we have AO LO = AL True stress = PAO x L LO
= PAO x ((LO + δLO) LO)
= P (1+e)= Nominal stress (1+ nominal strain)
True strain = Є = 1n (1+e)
These relations are valid up to ultimate load ie up to which the strain isuniform all along the gauge length
1 True Stress at upper yield point = Nominal stress at upper yield point ( 1+e O)True strain at C = 1n (1+eo)
2 True stress at ultimate load (E1)= Nominal ultimate stress ( 1+eE)True strain at ultimate load = 1n (1+eE)
3 True stress at fracture (E1) = Pf Af
Where Af is the area of cross section at fracture can be measured True
strain at fracture = 1n (Ao Af )
Area relation is taken instead of lengths because the strains are localized in theregion between ultimate load point and fracture point
4 Strain Hardening
From lower yield point onwards increase in load is required for increase instrain Thus the stress required for further deformation is more Thisphenomenon is called strain hardening
5 True ndash stress ndash true strain curve in log ndash log co ndash ordinates
When the true ndash stress and true ndash strain are plotted on log ndash log co ndash ordinates thecurve is a straight line
7232019 MOFMOS LABpdf
httpslidepdfcomreaderfullmofmos-labpdf 4547
Department of ANE MOFMOS LAB MANUAL
983120983137983143983141 983089983097 983151983142 983090983089
6 Ductile and Brittle Materials
If a material fails without much plastic deformation it can be called brittle If the percentageelongation at fracture is less than 25 the material is classified as brittle
bull Usually the metals with FCC and CPH structures are highly ductile
PROCEDURE
1 Measure the original gauge length and diameter of the specimen
2 Insert the specimen into grips of the test machine
3 Begin the load application and record load vs elongation data
4 Take the readings more frequently as yield point is approached
5 Measure elongation values
6 Continue the test till fracture occurs
7 By joining the two broken halves of the specimen together measure the final length anddiameter of specimen at fracture
RESULTS AND DISCUSSIONS
1 Plot the Engg Stress strain curve and determine the following
bull Limit of proportionality = (Nmm2)
bull Yield strength = (Nmm2)
bull Ultimate strength = (Nmm2)
bull Young`s modulus = (Nmm2)
bull Percentage elongation = bull Percentage reduction in area =
bull Fracture strength = (Nominal Engg)
bull Toughness = Area under stress ndash strain curve up to
fracture
bull Malleability
2 Plot True Stress True strain curve after calculating true ndash stress and true strain values at various
points
Estimate1) Strength coefficient
2) Strain hardening coefficient
3) Determine whether the material is ductile or brittle4) Comment on the results
7232019 MOFMOS LABpdf
httpslidepdfcomreaderfullmofmos-labpdf 4647
Department of ANE MOFMOS LAB MANUAL
983120983137983143983141 983090983088 983151983142 983090983089
SNo Load Deformation Stress Strain E
Calculation part-
7232019 MOFMOS LABpdf
httpslidepdfcomreaderfullmofmos-labpdf 4747
Department of ANE MOFMOS LAB MANUAL
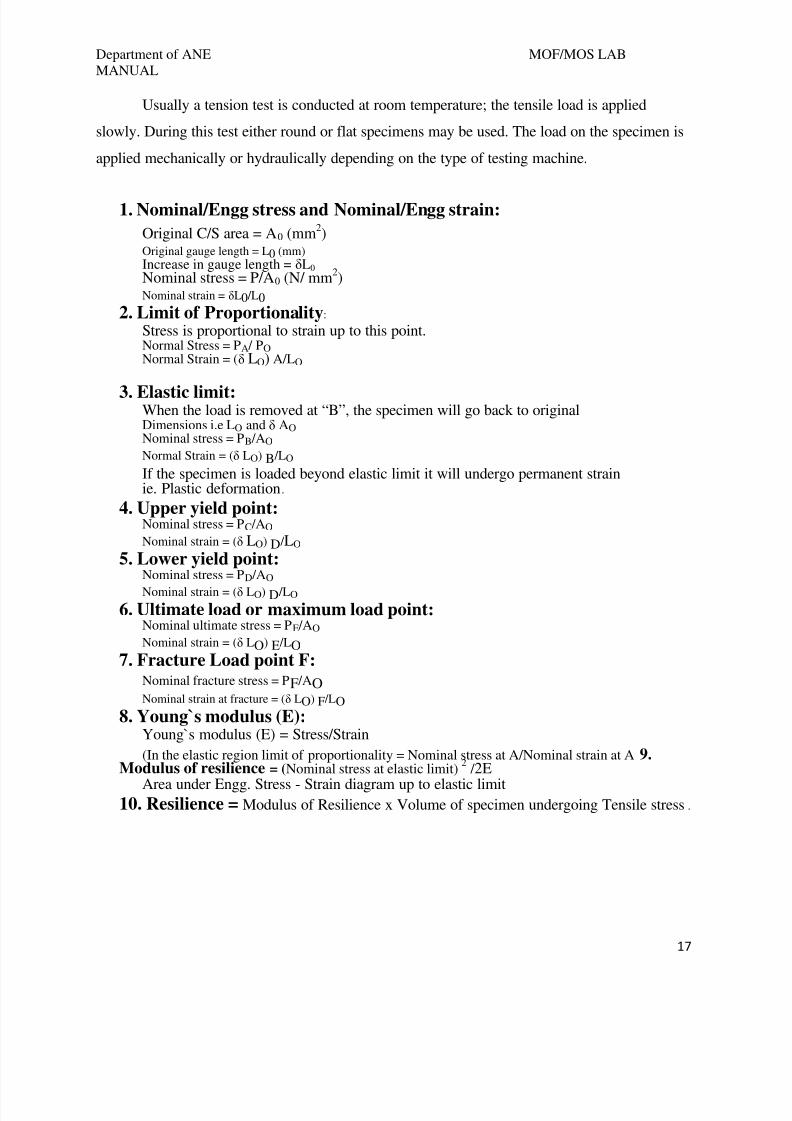
7232019 MOFMOS LABpdf
httpslidepdfcomreaderfullmofmos-labpdf 4447
Department of ANE MOFMOS LAB MANUAL
983089983096
11 Yield point ElongationElongation taking place in the specimen from C to D this istaking place without increase in stress
12 Modulus of toughnessArea under engineering stress ndash strain diagram up to fracture13 Toughness = Modulus of toughness x Volume of specimenThis indicates theamount of energy absorbed by the specimen before fracture take place
14 Ductility= (Final length at fracture ndash original length 10) x 100
15 MalleabilityIt is the ability of the material to undergo plastic deformation prior fracture under compressive loading conditions In a tensile test it is approximatedas percentage reduction in cross sectional area of the specimen Malleability =
(AO - Af )AO) x 100
True stress ndash true strain diagram
Engineering stress is calculated based on original cross sectional area (AO) But not on the actual cross sectional area at load bdquoP‟
True stress = PA = PAO x AO A
Since volume remains constant during plastic deformation we have AO LO = AL True stress = PAO x L LO
= PAO x ((LO + δLO) LO)
= P (1+e)= Nominal stress (1+ nominal strain)
True strain = Є = 1n (1+e)
These relations are valid up to ultimate load ie up to which the strain isuniform all along the gauge length
1 True Stress at upper yield point = Nominal stress at upper yield point ( 1+e O)True strain at C = 1n (1+eo)
2 True stress at ultimate load (E1)= Nominal ultimate stress ( 1+eE)True strain at ultimate load = 1n (1+eE)
3 True stress at fracture (E1) = Pf Af
Where Af is the area of cross section at fracture can be measured True
strain at fracture = 1n (Ao Af )
Area relation is taken instead of lengths because the strains are localized in theregion between ultimate load point and fracture point
4 Strain Hardening
From lower yield point onwards increase in load is required for increase instrain Thus the stress required for further deformation is more Thisphenomenon is called strain hardening
5 True ndash stress ndash true strain curve in log ndash log co ndash ordinates
When the true ndash stress and true ndash strain are plotted on log ndash log co ndash ordinates thecurve is a straight line
7232019 MOFMOS LABpdf
httpslidepdfcomreaderfullmofmos-labpdf 4547
Department of ANE MOFMOS LAB MANUAL
983120983137983143983141 983089983097 983151983142 983090983089
6 Ductile and Brittle Materials
If a material fails without much plastic deformation it can be called brittle If the percentageelongation at fracture is less than 25 the material is classified as brittle
bull Usually the metals with FCC and CPH structures are highly ductile
PROCEDURE
1 Measure the original gauge length and diameter of the specimen
2 Insert the specimen into grips of the test machine
3 Begin the load application and record load vs elongation data
4 Take the readings more frequently as yield point is approached
5 Measure elongation values
6 Continue the test till fracture occurs
7 By joining the two broken halves of the specimen together measure the final length anddiameter of specimen at fracture
RESULTS AND DISCUSSIONS
1 Plot the Engg Stress strain curve and determine the following
bull Limit of proportionality = (Nmm2)
bull Yield strength = (Nmm2)
bull Ultimate strength = (Nmm2)
bull Young`s modulus = (Nmm2)
bull Percentage elongation = bull Percentage reduction in area =
bull Fracture strength = (Nominal Engg)
bull Toughness = Area under stress ndash strain curve up to
fracture
bull Malleability
2 Plot True Stress True strain curve after calculating true ndash stress and true strain values at various
points
Estimate1) Strength coefficient
2) Strain hardening coefficient
3) Determine whether the material is ductile or brittle4) Comment on the results
7232019 MOFMOS LABpdf
httpslidepdfcomreaderfullmofmos-labpdf 4647
Department of ANE MOFMOS LAB MANUAL
983120983137983143983141 983090983088 983151983142 983090983089
SNo Load Deformation Stress Strain E
Calculation part-
7232019 MOFMOS LABpdf
httpslidepdfcomreaderfullmofmos-labpdf 4747
Department of ANE MOFMOS LAB MANUAL
7232019 MOFMOS LABpdf
httpslidepdfcomreaderfullmofmos-labpdf 4547
Department of ANE MOFMOS LAB MANUAL
983120983137983143983141 983089983097 983151983142 983090983089
6 Ductile and Brittle Materials
If a material fails without much plastic deformation it can be called brittle If the percentageelongation at fracture is less than 25 the material is classified as brittle
bull Usually the metals with FCC and CPH structures are highly ductile
PROCEDURE
1 Measure the original gauge length and diameter of the specimen
2 Insert the specimen into grips of the test machine
3 Begin the load application and record load vs elongation data
4 Take the readings more frequently as yield point is approached
5 Measure elongation values
6 Continue the test till fracture occurs
7 By joining the two broken halves of the specimen together measure the final length anddiameter of specimen at fracture
RESULTS AND DISCUSSIONS
1 Plot the Engg Stress strain curve and determine the following
bull Limit of proportionality = (Nmm2)
bull Yield strength = (Nmm2)
bull Ultimate strength = (Nmm2)
bull Young`s modulus = (Nmm2)
bull Percentage elongation = bull Percentage reduction in area =
bull Fracture strength = (Nominal Engg)
bull Toughness = Area under stress ndash strain curve up to
fracture
bull Malleability
2 Plot True Stress True strain curve after calculating true ndash stress and true strain values at various
points
Estimate1) Strength coefficient
2) Strain hardening coefficient
3) Determine whether the material is ductile or brittle4) Comment on the results
7232019 MOFMOS LABpdf
httpslidepdfcomreaderfullmofmos-labpdf 4647
Department of ANE MOFMOS LAB MANUAL
983120983137983143983141 983090983088 983151983142 983090983089
SNo Load Deformation Stress Strain E
Calculation part-
7232019 MOFMOS LABpdf
httpslidepdfcomreaderfullmofmos-labpdf 4747
Department of ANE MOFMOS LAB MANUAL

7232019 MOFMOS LABpdf
httpslidepdfcomreaderfullmofmos-labpdf 4747
Department of ANE MOFMOS LAB MANUAL