molecular dynamics simulation of the interactions between · molecular dynamics simulation of the...
TRANSCRIPT
Yu et al. / J Zhejiang Univ-Sci B (Biomed & Biotechnol) 2015 16(10):883-896 883
Molecular dynamics simulation of the interactions between
EHD1 EH domain and multiple peptides*#
Hua YU, Mao-jun WANG, Nan-xia XUAN, Zhi-cai SHANG†‡, Jun WU†‡ (Department of Chemistry, Zhejiang University, Hangzhou 310027, China)
†E-mail: [email protected]; [email protected]
Received May 2, 2015; Revision accepted Aug. 4, 2015; Crosschecked Sept. 13, 2015
Abstract: Objective: To provide essential information for peptide inhibitor design, the interactions of Eps15 homology domain of Eps15 homology domain-containing protein 1 (EHD1 EH domain) with three peptides containing NPF (asparagine-proline-phenylalanine), DPF (aspartic acid-proline-phenylalanine), and GPF (glycine-proline-phenylalanine) motifs were deciphered at the atomic level. The binding affinities and the underlying structure basis were investigated. Methods: Molecular dynamics (MD) simulations were performed on EHD1 EH domain/peptide complexes for 60 ns using the GROMACS package. The binding free energies were calculated and decomposed by molecular mechanics/ generalized Born surface area (MM/GBSA) method using the AMBER package. The alanine scanning was performed to evaluate the binding hot spot residues using FoldX software. Results: The different binding affinities for the three peptides were affected dominantly by van der Waals interactions. Intermolecular hydrogen bonds provide the struc-tural basis of contributions of van der Waals interactions of the flanking residues to the binding. Conclusions: van der Waals interactions should be the main consideration when we design peptide inhibitors of EHD1 EH domain with high affinities. The ability to form intermolecular hydrogen bonds with protein residues can be used as the factor for choosing the flanking residues.
Key words: Binding affinity, EHD1 EH domain, Molecular dynamics simulation, Inhibitor design, Peptide doi:10.1631/jzus.B1500106 Document code: A CLC number: Q67
1 Introduction
The Eps15 homology domain (EH domain), a highly conserved region comprising about 100 resi-dues, exists in various organisms ranging from yeast to mammals (Santolini et al., 1999; Miliaras and Wendland, 2004). Most of the EH domains are gen-erally present in the N-terminus of Eps15 and Eps15- related proteins that are involved in internalization
events (Fazioli et al., 1993; Benmerah et al., 1995; 1998; Wong et al., 1995; Carbone et al., 1997; Delft et al., 1997; Polo et al., 2003). The EH domain is also contained at the C-terminus of certain proteins with the functional regulation of several critical endocytic events, such as internalization and recycling of vari-ous receptors (Naslavsky and Caplan, 2005; Grant and Caplan, 2008). EHD1 is one of the four highly homologous C-terminal EH domain-containing pa-ralogs expressed in mammalian cells, and is also well characterized. EHD1 controls the recycling of various receptors from the endocytic recycling compartment (ERC) to the plasma membrane, such as the transfer-rin receptor (TfR) (Lin et al., 2001), major histo-compatibility complex (MHC) class I proteins (Caplan et al., 2002), and β-integrins (Jović et al., 2007). Nevertheless, it was reported that derailed
Journal of Zhejiang University-SCIENCE B (Biomedicine & Biotechnology)
ISSN 1673-1581 (Print); ISSN 1862-1783 (Online)
www.zju.edu.cn/jzus; www.springerlink.com
E-mail: [email protected]
‡ Corresponding authors * Project supported by the National Natural Science Foundation of China (Nos. 11172259 and 31471807) and the Special Fund for Agro- scientific Research in the Public Interest (No. 201403030), China # Electronic supplementary materials: The online version of this article (http://dx.doi.org/10.1631/jzus.B1500106) contains supplementary materials, which are available to authorized users
ORCID: Hua YU, http://orcid.org/0000-0002-1151-466X © Zhejiang University and Springer-Verlag Berlin Heidelberg 2015
Yu et al. / J Zhejiang Univ-Sci B (Biomed & Biotechnol) 2015 16(10):883-896
884
internalization and recycling routes are features of cancer (Mosesson et al., 2008). For example, an in-creased recycling of β-integrins from ERC to the plasma membrane, which is regulated by EHD1, has been observed in motile cancer cells (Caswell and Norman, 2008; Mosesson et al., 2008). The aberrant expression of EHD1 has also been observed in many other human diseases (Maher et al., 2001; Galindo et al., 2003; Hansel et al., 2004; Cortez et al., 2006; Shin et al., 2007; Ammann and Goodman, 2009; Jansen et al., 2009; Tripathi et al., 2009; Dervan et al., 2010; Naslavsky and Caplan, 2011). EHD1 and other proteins involved in the endocytic events are thus becoming potential cancer targets for peptide inhibi-tor design. Recently, several cyclic peptides have been designed with higher affinities toward the EHD1 EH domain (Kamens et al., 2014).
The main binding partner of the C-terminal EH domain is the NPF (asparagine-proline-phenylalanine) motif (Guilherme et al., 2004; Naslavsky et al., 2004; 2006; Smith et al., 2004; Xu et al., 2004; Braun et al., 2005; Shi et al., 2007; Doherty et al., 2008; Sharma et al., 2009). Based on the crystal structure of mouse EHD2, an internal GPF (glycine-proline-phenylalanine) motif that was predicted to bind to the C-terminal EH domain of the opposing dimeric EHD2 was identified (Daumke et al., 2007). Kieken et al. (2009) first studied the structure of the EHD1 EH domain-DPF (aspartic acid-proline-phenylalanine) motif and quantitatively compared the binding ability of the EHD1 EH domain to these three peptide motifs (NPF, DPF, and GPF). However, the molecular mechanisms of different interactions of the three peptide motifs with the EHD1 EH domain remain unclear. Elucidation of different binding affinities of the three peptide motifs in terms of structures and energies is of significance for the better design of future peptide inhibitors.
In the present study, molecular dynamics (MD) simulations for the three EHD1 EH domain/peptide complexes were conducted for the comprehensive comparison of structural and energetic terms related to the different binding affinities. Alanine scanning for the ensemble of the nuclear magnetic resonance (NMR) structure of each complex was performed to identify binding hot spot residues. The results can provide essential information for the rational design of functional peptide inhibitors and provide some guidance for relevant inhibitor design for other proteins.
2 Materials and methods
2.1 Molecular dynamics simulation
There are four EHD1 EH domain-peptide com-plexes (PDB ID: 2KFF, 2KFG, 2KFH, and 2KSP) in the Protein Data Bank (PDB) (Rose et al., 2013). The proteins of the four complexes are the same. The peptides of 2KFF, 2KFG, and 2KFH contain NPF, DPF, and GPF motifs, respectively, and have the exact same flanking residues (FNYESTNPFTAK, FNYESTDPFTAK, and FNYESTGPFTAK). The peptide of 2KSP contains the NPF motif but entirely different flanking residues from 2KFF, 2KFG, and 2KFH (LESKPYNPFEEEEED). In order to be more comparable, we chose the complexes 2KFF, 2KFG, and 2KFH with the smallest changes between each other. The tertiary structures of these three complexes were obtained from the PDB. In order to intuitively reflect the component of the peptide, 2KFFNPF, 2KFGDPF, and 2KFHGPF are used to replace their respective PDB ID in the following. The initial coor-dinates for MD simulations were the first model of the ensemble of the NMR structures uniformly and the Ca2+ existing in the structure was retained.
MD simulations were performed using the GROMACS (ver. 4.5.4) package (Hess et al., 2008). The Amber03 force field (Duan et al., 2003) and the TIP3P (Jorgensen et al., 1983) water model were chosen for all simulations. Each complex was placed in the center of a dodecahedron box and the distance between the solute and the box edge was 12 Å. Proper numbers of Na+ were added to keep neutralization. The steepest-descent energy minimization was used and the maximum force was set to 100 kJ/(mol·nm) on any atom. The solvated system was equilibrated with two steps. First, the system was equilibrated for 1 ns under a constant volume ensemble (NVT) with a harmonic position restraint applied on heavy atoms of the solute. Second, the system was equilibrated for another 1 ns under a constant pressure ensemble (NPT) without any restraint. Production simulation was conducted for 60 ns under the NPT ensemble. All bonds containing hydrogen atoms were constrained using the default linear constraint solver (LINCS) algorithm (Hess et al., 1997). The coupling algorithm of Berendsen et al. (1984) was used to maintain temperature (300 K) and pressure (1 atm, 101 325 Pa) with the constant of 0.1 and 1.0 ps, respectively. The

Yu et al. / J Zhejiang Univ-Sci B (Biomed & Biotechnol) 2015 16(10):883-896 885
electrostatic interactions were treated with the particle- mesh-Ewald (PME) method (Darden et al., 1993; Essmann et al., 1995). A cutoff of 14 Å was applied in the calculation of the van der Waals interactions. Periodic boundary conditions were used in all three directions. The time step was 2 fs and a snapshot was collected for every 1 ps.
2.2 Binding free energy calculation
Two thousand snapshots collected once for every 10 ps from the trajectory of 40–60 ns obtained by GROMACS were converted to the trajectory file pattern recognized by AMBER using VMD 1.9.1 software (Humphrey et al., 1996). For each complex, molecular mechanics/generalized Born surface area (MM/GBSA) method (Kollman et al., 2000) incor-porated in AmberTools 13 (Case et al., 2012) was used for the binding energy calculation and decom-position with the total 2000 snapshots.
∆Gbinding=Gcomplex−(Gprotein+Gpeptide), (1)
where Gcomplex, Gprotein, and Gpeptide are the absolute free energies of the complex, protein, and peptide, respectively. Trajectories of the protein and the pep-tide calculating Gprotein and Gpeptide were directly ob-tained from the trajectory of the complex (a single trajectory method). Each absolute free energy was estimated as the sum of the gas phase free energy (Egas), the solvation free energy (Gsolv), and the en-tropy term (−TS; T is temperature and S is entropy):
G=Egas+Gsolv−TS, (2)
where Egas is the sum of the internal energy (Eint), the electrostatic energy (Eele), and the van der Waals energy (Evan):
Egas=Eint+Eele+Evan. (3)
The solvation free energy (Gsolv) is the sum of the polar free energy and the nonpolar free energy:
Gsolv=Gpolar+Gnonpolar, (4)
where the polar free energy was estimated using the GB model (IGB=5) with the dielectric constants 1 and 80 set to the solute and water, respectively, while the
nonpolar free energy was computed from Eq. (5), where SASA is the solvent-accessible surface area calculated using the linear combination of pairwise overlaps (LCPO) model (Weiser et al., 1999) and γ has the dimension of surface-tension which was set to 0.0072 kcal/(mol·Å2) (default unit, 1 kcal=4.184 kJ):
Gnonpolar=γ·SASA. (5)
As entropy calculation using normal mode analysis (NMA) is very expensive for large systems and the three complexes are highly similar systems, the entropic contribution (−TS) to the absolute free energy was ignored just as reported in other literature (Wang and Kollman, 2001; Lindahl et al., 2006; Zhang et al., 2009; Lu et al., 2011). However, in order to verify the accuracy of our calculation through direct comparison with the experimental value, we calculated the entropy term (−TS) of 2KFFNPF using NMA with 40 snapshots (collected once for every 50 snapshots). The translational entropy, rotational en-tropy, and vibrational entropy constitute the entropic contribution to the free energy. Thus, the binding free energy is estimated by Eq. (6) below:
∆Gbinding=∆Egas+∆Gsolv−T∆S, (6)
where,
∆Egas=∆Eele+∆Evan, (7)
as ∆Eint equals zero in a single trajectory method. ∆Eele and ∆Evan are the electrostatic interaction energy and the van der Waals interaction energy between the protein and the peptide, respectively.
∆Gsolv=∆Gpolar+∆Gnonpolar, (8)
where ∆Gpolar and ∆Gnonpolar are the polar solvation free energy and the nonpolar solvation free energy during the binding process of the protein and the peptide, respectively.
2.3 Alanine scanning with FoldX
Alanine scanning experiments were done with FoldX (Guerois et al., 2002; Schymkowitz et al., 2005) (ver. 3.0 Beta 6) which has been widely used (Stein and Aloy, 2008; London et al., 2010), especially

Yu et al. / J Zhejiang Univ-Sci B (Biomed & Biotechnol) 2015 16(10):883-896
886
for the prediction of hot spot residues. All 10 con-formations of the NMR structures of each complex were calculated and averaged at the temperature of 300 K. First, the command of “RepairPDB” was used to repair the residues which have bad torsion angles, or van der Waals’ clashes, or total energy (option VdWDesign=2). Then, the command of “complex_ alascan” was used to calculate the contribution of each residue on the interaction interface of the peptide to the binding of the protein and the peptide through esti-mating the binding free energy differences (∆∆G) after mutating the residue to Ala (option VdWDesign=0). Details of the formula of the binding free energy (∆G) are attached to supporting information (Formula S1).
∆∆G=∆Gmutate−∆Gwild, (9)
where ∆Gmutate and ∆Gwild are the binding free ener-gies of the mutant complex and the wild-type com-plex, respectively.
3 Results
3.1 System stability during MD simulations
In total three production simulations were car-ried out. The root mean square deviation (RMSD) of the backbone was calculated to estimate the system stability during the production simulation with the initial minimized structure as the reference confor-mation. In general, RMSD values of 2KFFNPF com-plex begin to be stable after 20 ns simulation while the stable situation occurs after about 25 and 35 ns simulations for 2KFGDPF and 2KFHGPF complexes, respectively (Fig. 1). Fluctuations of RMSD values of the peptides were a little higher than those of the complexes and proteins in 2KFGDPF and 2KFHGPF. This is probably caused by the high peptide flexibility in these complexes. The trajectory of the last 20 ns was used for the calculation and decomposition of binding free energy for their relatively good stability for all complexes, proteins, and peptides. Fluctuations of the total energy of the whole system including solution were less than 0.1% of its average value for each complex. Combined with small fluctuations of the temperature, volume, and density during the produc-tion simulation (data not shown), we believe that the three simulation systems all reached a relatively good equilibrium during the last 20 ns simulations.
3.2 Binding free energy calculation and energy decomposition
The binding free energy (Table 1) was calculated to study the thermodynamics. For the three complexes, similar thermodynamic phenomena were observed. The polar components (∆Eele and ∆Gpolar) get together to make a negative contribution to the binding, while all the nonpolar components (∆Evan and ∆Gnonpolar) make positive contributions. Energy values of the van der Waals interactions (∆Evan) are nearly 8 times smaller than that of the nonpolar solvation free energy (∆Gnonpolar) in all three complexes, which suggests the importance of the van der Waals interaction for binding. Binding free energy without the entropy contribution is listed as GBTOT in Table 1. From the study of Kieken et al. (2009), we obtained the experi-mental disassociation constants (Kd) of the three com-plexes (2KFFNPF, 245 μmol/L; 2KFGDPF, 1.2 mmol/L; 2KFHGPF, 2.4 mmol/L). Correlation analysis applied to the calculated GBTOTs and pKd showed that there exists a relatively high correlation (r=−0.89) between them. The calculated total binding free energy of
Fig. 1 RMSD of the backbone atoms of the complex, pro-tein, and peptide during the 60 ns production simulation Black: complex; Red: protein; Blue: peptide (Note: for interpretation of the references to color in this figure leg-end, the reader is referred to the web version of this article)
RM
SD
(nm
)R
MS
D (
nm)
RM
SD
(nm
)
Yu et al. / J Zhejiang Univ-Sci B (Biomed & Biotechnol) 2015 16(10):883-896 887
2KFFNPF, which includes the entropic contribution (−T∆S, 31.02 kcal/mol), is −4.71 kcal/mol. This value is very close to the experimental binding free energy (−4.93 kcal/mol) converted from the disassociation constant (Kieken et al., 2009). Both these results demonstrated that our energy calculation is reliable.
Per-residue energy decomposition (Table 2) was performed to estimate the contribution of each residue to binding. More detailed information about the con-tribution of each energetic component in this de-composition is given in the supporting information (Table S1).
3.3 Structure analysis of the three complexes
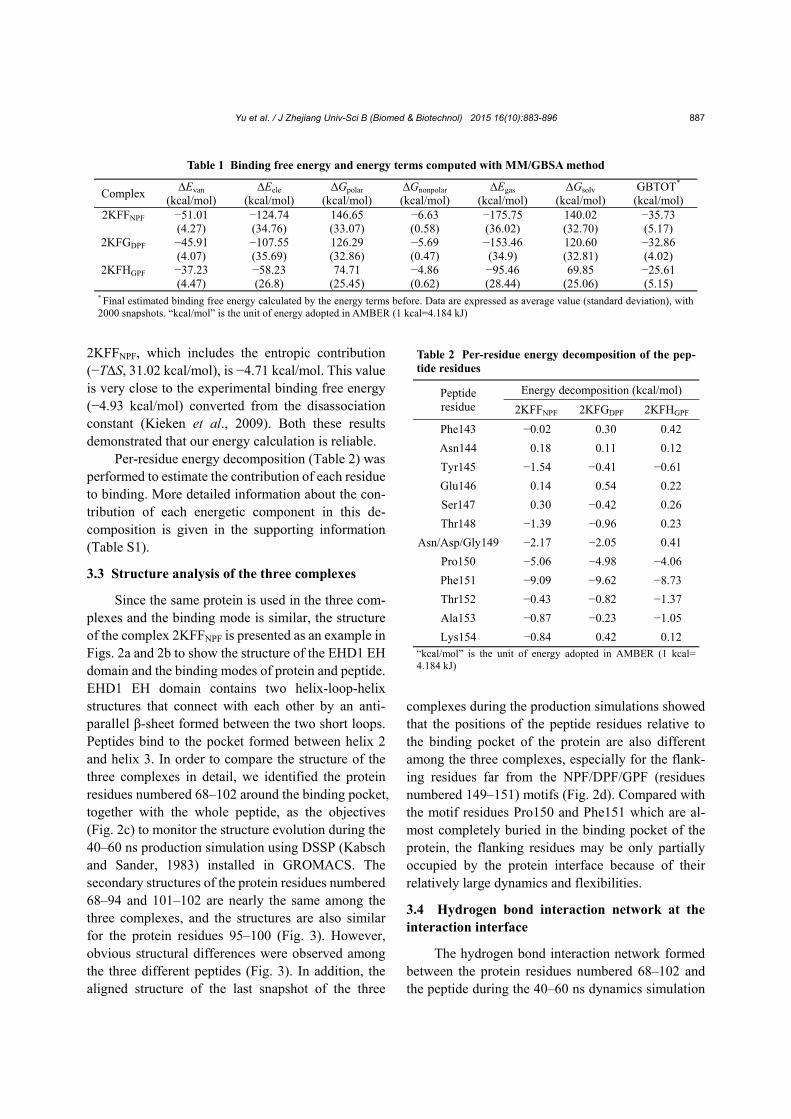
Since the same protein is used in the three com-plexes and the binding mode is similar, the structure of the complex 2KFFNPF is presented as an example in Figs. 2a and 2b to show the structure of the EHD1 EH domain and the binding modes of protein and peptide. EHD1 EH domain contains two helix-loop-helix structures that connect with each other by an anti-parallel β-sheet formed between the two short loops. Peptides bind to the pocket formed between helix 2 and helix 3. In order to compare the structure of the three complexes in detail, we identified the protein residues numbered 68–102 around the binding pocket, together with the whole peptide, as the objectives (Fig. 2c) to monitor the structure evolution during the 40–60 ns production simulation using DSSP (Kabsch and Sander, 1983) installed in GROMACS. The secondary structures of the protein residues numbered 68–94 and 101–102 are nearly the same among the three complexes, and the structures are also similar for the protein residues 95–100 (Fig. 3). However, obvious structural differences were observed among the three different peptides (Fig. 3). In addition, the aligned structure of the last snapshot of the three
complexes during the production simulations showed that the positions of the peptide residues relative to the binding pocket of the protein are also different among the three complexes, especially for the flank-ing residues far from the NPF/DPF/GPF (residues numbered 149–151) motifs (Fig. 2d). Compared with the motif residues Pro150 and Phe151 which are al-most completely buried in the binding pocket of the protein, the flanking residues may be only partially occupied by the protein interface because of their relatively large dynamics and flexibilities.
3.4 Hydrogen bond interaction network at the interaction interface
The hydrogen bond interaction network formed between the protein residues numbered 68–102 and the peptide during the 40–60 ns dynamics simulation
Table 1 Binding free energy and energy terms computed with MM/GBSA method
Complex ∆Evan
(kcal/mol) ∆Eele
(kcal/mol) ∆Gpolar
(kcal/mol) ∆Gnonpolar
(kcal/mol) ∆Egas
(kcal/mol) ∆Gsolv
(kcal/mol) GBTOT*
(kcal/mol) 2KFFNPF −51.01
(4.27) −124.74 (34.76)
146.65 (33.07)
−6.63 (0.58)
−175.75 (36.02)
140.02 (32.70)
−35.73 (5.17)
2KFGDPF −45.91 (4.07)
−107.55 (35.69)
126.29 (32.86)
−5.69 (0.47)
−153.46 (34.9)
120.60 (32.81)
−32.86 (4.02)
2KFHGPF −37.23 (4.47)
−58.23 (26.8)
74.71 (25.45)
−4.86 (0.62)
−95.46 (28.44)
69.85 (25.06)
−25.61 (5.15)
* Final estimated binding free energy calculated by the energy terms before. Data are expressed as average value (standard deviation), with 2000 snapshots. “kcal/mol” is the unit of energy adopted in AMBER (1 kcal=4.184 kJ)
Table 2 Per-residue energy decomposition of the pep-tide residues
Peptide residue
Energy decomposition (kcal/mol)
2KFFNPF 2KFGDPF 2KFHGPF
Phe143 −0.02 0.30 0.42
Asn144 0.18 0.11 0.12
Tyr145 −1.54 −0.41 −0.61
Glu146 0.14 0.54 0.22
Ser147 0.30 −0.42 0.26
Thr148 −1.39 −0.96 0.23
Asn/Asp/Gly149 −2.17 −2.05 0.41
Pro150 −5.06 −4.98 −4.06
Phe151 −9.09 −9.62 −8.73
Thr152 −0.43 −0.82 −1.37
Ala153 −0.87 −0.23 −1.05
Lys154 −0.84 0.42 0.12 “kcal/mol” is the unit of energy adopted in AMBER (1 kcal= 4.184 kJ)

Yu et al. / J Zhejiang Univ-Sci B (Biomed & Biotechnol) 2015 16(10):883-896
888
was analyzed for each complex (Fig. S1). The geo-metrical criteria used to determine the hydrogen bond are that the donor-acceptor distance and the hydrogen- donor-acceptor angle are not greater than 0.35 nm and 30°, respectively. Generally, the number of the hy-drogen bond decreases and the peptide residues in-volved in the hydrogen bond increasingly focus on a few residues within (such as Pro150 and Phe151) or around the motif residues from 2KFFNPF, 2KFGDPF, to 2KFHGPF (Fig. S1).
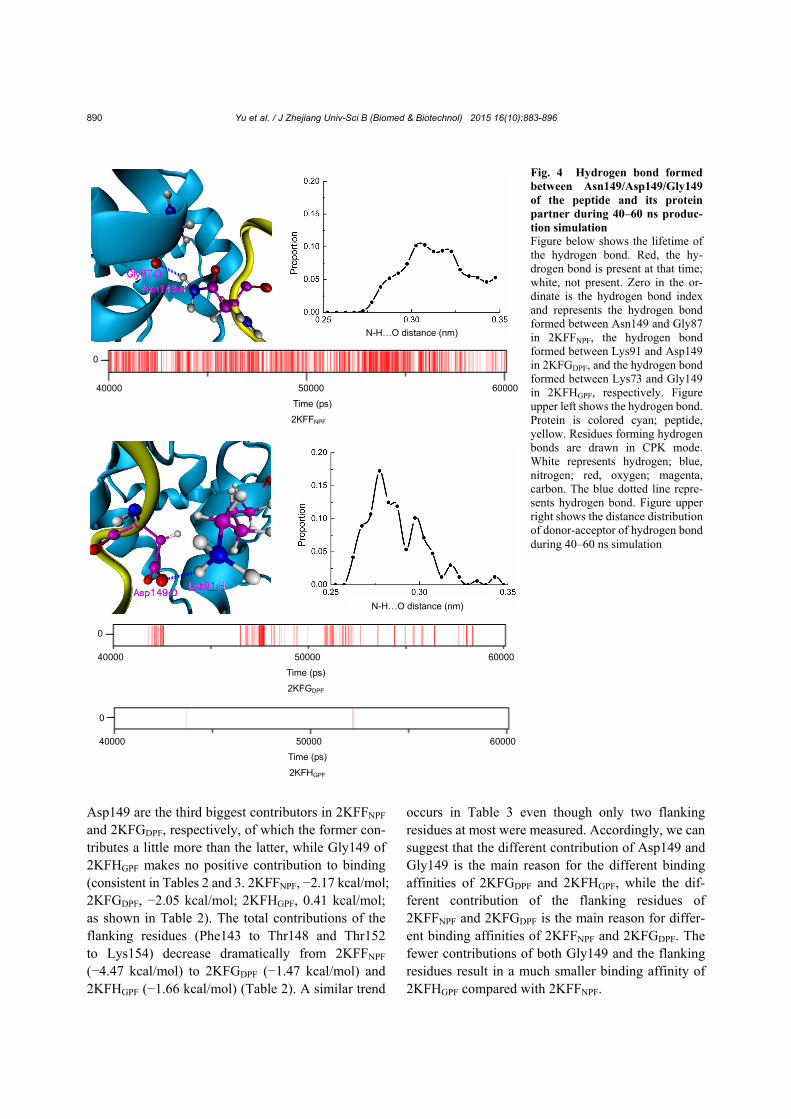
Intermolecular hydrogen bonds formed between Asn149/Asp149/Gly149 of the peptides and its pro-tein partners (Fig. 4) were further analyzed owing to its possible importance for the binding affinity sug-gested by Kieken et al. (2009). In 2KFFNPF, a rela-tively stable main-chain/side-chain hydrogen bond formed between the carbonyl oxygen of Gly87 and the amino hydrogen of Asn149 was observed with an
average bond length of 0.31 nm. A relatively unstable side-chain/side-chain hydrogen bond formed between the carboxyl oxygen of Asp149 and the amino hy-drogen of Lys91 was observed with an average bond length of 0.29 nm in 2KFGDPF. And an extremely unstable main-chain/side-chain hydrogen bond between the carbonyl oxygen of Gly149 and the amino hy-drogen of Lys73, which can be ignored, was observed in 2KFHGPF. Existence of all these hydrogen bonds is consistent with that reported by Kieken et al. (2009).
3.5 Alanine scanning with FoldX
As the entropy contribution cannot be decom-posed in the energy decomposition analysis with AMBER and the hydrogen bond energy cannot be evaluated separately by MM/GBSA, alanine scanning with FoldX was conducted as a supplement of quan-titative analysis.
Side view Top view
Fig. 2 Structures of the complex 2KFFNPF and aligned structures of complexes 2KFFNPF, 2KFGDPF, and 2KFHGPF Structures of complex 2KFFNPF were viewed from the side (a) and the top (b) of the binding pocket. (c) The structure of peptide and protein residues numbered 68–102. The partition of the residues is consistent with the structure module in Fig. 3. (d) This picture was obtained by superimposing the residues on the protein interface numbered 68–102 of the three com-plexes. Protein and peptide were displayed in Surf and NewCartoon styles, respectively. The highlighted parts of the peptides represent Pro150 and Phe151
Yu et al. / J Zhejiang Univ-Sci B (Biomed & Biotechnol) 2015 16(10):883-896 889
Taking ∆∆G>1 kcal/mol as the threshold to de-
fine hot spot residues (London et al., 2010), Asn149, Pro150, and Phe151 were identified to be the hot spot residues of 2KFFNPF, while only Pro150 and Phe151 were identified to be the hot spot residues of both 2KFGDPF and 2KFHGPF (Table 3). The value of ∆∆G of Asp149 of 2KFGDPF is also relatively large. However, Gly149 of 2KFHGPF was not even identi-fied on the interaction interface in any conformation, which suggests that this residue does not contribute much to the protein-peptide binding even though it is a key component of the motif.
4 Discussion
EHD1 plays an important role in endocytic transport via interactions by EH domain and thus becomes a new drug target of peptide inhibitor design. Previous work has shown that the EHD1 EH domain has different binding affinities with three different peptide motifs (NPF, DPF, and GPF motifs) (Kieken et al., 2009). However, the molecular mechanism resulting in these different binding affinities is still unclear. Therefore, we investigated the structural and energetic bases of these different binding affinities among the three complexes via MD simulations.
Pro150 and Phe151 are buried in the binding pocket of the protein (Fig. 2d) and therefore contrib-ute the most in all three complexes (consistent in Tables 2 and 3). The total contributions of these two residues to the binding of their respective complex are similar in energy value among the three complexes according to Table 3, in which energy components are more comprehensive than those in Table 2 for the calculation of the entropy contribution. Asn149 and
Table 3 Binding free energy difference (∆∆G) meas-ured by FoldX
Peptide residue
∆∆G (kcal/mol) 2KFFNPF 2KFGDPF 2KFHGPF
Thr148 0.04 0.02 N Asn/Asp/Gly149 1.21 0.94 N
Pro150 1.54 1.38 1.52 Phe151 4.63 4.80 4.72 Thr152 0.27 N N
N represents that the residue is not identified on the interaction interface of all 10 conformations. “kcal/mol” is the unit of energy adopted in FoldX (1 kcal=4.184 kJ)
Res
idue
num
ber
Time (ps) Time (ps) Time (ps)
Fig. 3 Secondary structure evolution of peptide and protein residues numbered 68–102 during 40–60 ns dynamics simulation Zero in the ordinate, as a chain separator, is the boundary of the protein and peptide residues. The upper part represents the peptide residues numbered 143–154, while the lower part represents the protein residues numbered 68–102
2KFFNPF 2KFGDPF 2KFHGPF
Yu et al. / J Zhejiang Univ-Sci B (Biomed & Biotechnol) 2015 16(10):883-896
890
Asp149 are the third biggest contributors in 2KFFNPF and 2KFGDPF, respectively, of which the former con-tributes a little more than the latter, while Gly149 of 2KFHGPF makes no positive contribution to binding (consistent in Tables 2 and 3. 2KFFNPF, −2.17 kcal/mol; 2KFGDPF, −2.05 kcal/mol; 2KFHGPF, 0.41 kcal/mol; as shown in Table 2). The total contributions of the flanking residues (Phe143 to Thr148 and Thr152 to Lys154) decrease dramatically from 2KFFNPF (−4.47 kcal/mol) to 2KFGDPF (−1.47 kcal/mol) and 2KFHGPF (−1.66 kcal/mol) (Table 2). A similar trend
occurs in Table 3 even though only two flanking residues at most were measured. Accordingly, we can suggest that the different contribution of Asp149 and Gly149 is the main reason for the different binding affinities of 2KFGDPF and 2KFHGPF, while the dif-ferent contribution of the flanking residues of 2KFFNPF and 2KFGDPF is the main reason for differ-ent binding affinities of 2KFFNPF and 2KFGDPF. The fewer contributions of both Gly149 and the flanking residues result in a much smaller binding affinity of 2KFHGPF compared with 2KFFNPF.
40000 50000 60000
Time (ps)
0
2KFFNPF
N-H…O distance (nm)
N-H…O distance (nm)
40000 50000 60000
Time (ps)
0
2KFGDPF
40000 50000 60000
Time (ps)
0
2KFHGPF
Fig. 4 Hydrogen bond formed between Asn149/Asp149/Gly149 of the peptide and its protein partner during 40–60 ns produc-tion simulation Figure below shows the lifetime of the hydrogen bond. Red, the hy-drogen bond is present at that time; white, not present. Zero in the or-dinate is the hydrogen bond index and represents the hydrogen bond formed between Asn149 and Gly87 in 2KFFNPF, the hydrogen bond formed between Lys91 and Asp149 in 2KFGDPF, and the hydrogen bond formed between Lys73 and Gly149 in 2KFHGPF, respectively. Figure upper left shows the hydrogen bond. Protein is colored cyan; peptide, yellow. Residues forming hydrogen bonds are drawn in CPK mode. White represents hydrogen; blue, nitrogen; red, oxygen; magenta, carbon. The blue dotted line repre-sents hydrogen bond. Figure upper right shows the distance distribution of donor-acceptor of hydrogen bond during 40–60 ns simulation

Yu et al. / J Zhejiang Univ-Sci B (Biomed & Biotechnol) 2015 16(10):883-896 891
Differences among Asn149, Asp149, and Gly149 mainly include the hydrogen bond formed at the interaction interface (Fig. 4), the polarity and charge, and the size of the side chain. As the hydrogen bond energy is included in the electrostatic interaction energy (∆Eele) by AMBER and cannot be isolated, we obtained it through the decomposition of ∆∆G by FoldX. Results showed that contributions of the in-termolecular hydrogen bonds are 0.41 and 0.32 kcal/mol for Asn149 and Asp149, respectively. The former contributes a little more than the latter owing to dif-ferent types and stabilities of the two hydrogen bonds (Fig. 4). In addition, even if we postulate that the value of the electrostatic interaction energy of Asn149 comes from the hydrogen bond, the energy of the stronger hydrogen bond formed by Asn149 is only −1.38 kcal/mol, let alone the weaker hydrogen bond formed by Asp149. However, though contribution of the hydrogen bond decreases from Asn149 to Asp149, the electrostatic interaction energy of these two resi-dues enhances from −1.38 to −13.01 kcal/mol (Table S1, ∆Eele). As the binding pocket of the protein is highly positively charged (Kieken et al., 2007) and the dis-tances between residues numbered 149 and the binding pocket are nearly the same for the two com-plexes (distance between two centers of mass: 2KFFNPF, 0.69 nm; 2KFGDPF, 0.68 nm), this en-hancement of the electrostatic contribution should be attributed to the different polarities between the polar residue Asn149 and the negatively charged residue Asp149. Finally, as Gly149 of 2KFGDPF was not identified to be on the interaction interface under the threshold defined by FoldX, we did not obtain the intermolecular hydrogen bond energy of this residue by decomposition of ∆∆G. However, we believe that the hydrogen bond energy formed by Gly149 will be very small as this hydrogen bond is extremely unsta-ble (Fig. 4). In addition, as the distance between Gly149 and the binding pocket is larger than the dis-tance between Asn149 and the binding pocket (dis-tance between two centers of mass: 2KFFNPF, 0.69 nm; 2KFHGPF, 1.02 nm), it is somewhat surprising that the contribution of the electrostatic interaction of the hydrophobic amino acid Gly149 (−1.95 kcal/mol) is a little larger than that of the polar amino acid Asn149 (−1.38 kcal/mol) (Table S1). Further analysis of the pairwise energy decomposition (data not shown) indicated that even though the electrostatic attraction
between Gly149 and some protein residues is weaker than the corresponding force of Asn149, the electro-static repulsion between Gly149 and the remaining protein residues is much weaker. Thus, a little higher electrostatic contribution occurs instead. However, on the whole, the electrostatic contributions (Table S1, ∆Eele) of all three residues numbered 149 are all eliminated completely by the polar solvation free energies (Table S1, ∆Gpolar) which get larger as the electrostatic contributions increase. The polar com-ponents (∆Eele+∆Gpolar) get together to make adverse contributions to binding with an energy of about 2 kcal/mol for Asn149 and Asp149 and an energy of 0.79 kcal/mol for Gly149 (Table S1). These energy values demonstrate that the polar components of the two polar amino acids Asn149 and Asp149 are more adverse for binding than that of the nonpolar amino acid Gly149. In the end, the van der Waals interac-tions of the three residues numbered 149 become the major positive contributions of binding (Table S1). Because of the longest distance between Gly149 and the binding pocket (distance between two centers of mass: 2KFFNPF, 0.69 nm; 2KFGDPF, 0.68 nm; 2KFHGPF, 1.02 nm) and the smallest side chain of Gly149, the van der Waals interaction energy of Gly149 is the largest among the three residues numbered 149 (∆Evan: Asn149, −3.74 kcal/mol; Asp149, −3.72 kcal/mol; Gly149, −0.35 kcal/mol) and does not offset the adverse contributions of its own polar components (∆Eele+∆Gpolar: Gly149, 0.79 kcal/mol) (Table S1). However, the van der Waals interaction energies of Asn149 and Asp149, which are ten times smaller than that of Gly149, eliminate the adverse contributions of their respective polar components (∆Eele+∆Gpolar: Asn149, 2.03 kcal/mol; Asp149, 2.01 kcal/mol; Table S1) and make positive contributions to binding together with the favorable nonpolar free energies. Therefore, compared with Gly149 of 2KFHGPF, con-tributions of Asn149 and Asp149 to the larger binding affinities of 2KFFNPF and 2KFGDPF are achieved through the much larger van der Waals interactions.
Generally, the van der Waals interaction is also the main contributor of the total contributions of the flanking residues (Table S1). However, the van der Waals interaction may be affected by the intermo-lecular hydrogen bonds whose presence is different among the three complexes because of the different structures of the three peptides observed in Figs. 2d

Yu et al. / J Zhejiang Univ-Sci B (Biomed & Biotechnol) 2015 16(10):883-896
892
and 3. A typical flanking residue is Tyr145. The van der Waals interaction energy of this residue in 2KFFNPF (−2.11 kcal/mol) is three times the corre-sponding energy in 2KFGDPF (−0.70 kcal/mol) and more than twice of the corresponding energy in 2KFHGPF (−0.92 kcal/mol), as shown in Table S1. The energy differences mainly come from the dif-ferent van der Waals interaction energies between Tyr145 and Lys97, which are −1.47, −0.14, and −0.002 kcal/mol for 2KFFNPF, 2KFGDPF, and 2KFHGPF, respectively, according to pairwise energy decompo-sition. Further analysis showed that three hydrogen bonds exist between Tyr145 and Lys97 in 2KFFNPF. Consistently, only two less stable hydrogen bonds exist between these two residues in 2KFGDPF and no hydrogen bond occurs in 2KFHGPF (Fig. S1). The fixation function of intermolecular hydrogen bonds restricts flexibilities of Tyr145 and Lys97 to varying degrees, which makes them bind in different affinities. On the whole, the existence of intermolecular hy-drogen bonds narrows the distance of the peptide and the protein. The mass center of the flanking residues numbered 143–148 gets farther and farther away from that of the protein binding pocket from 2KFFNPF (1.44 nm), 2KFGDPF (1.47 nm), to 2KFHGPF (1.53 nm) with their intermolecular hydrogen bonds less and weaker in turn (Fig. S1). Correspondingly, the con-tributions of the van der Waals interactions (2KFFNPF, −6.88 kcal/mol; 2KFGDPF, −4.83 kcal/mol; 2KFHGPF, −1.79 kcal/mol; Table S1) and then the total contri-butions of these residues (2KFFNPF, −2.33 kcal/mol; 2KFGDPF, −0.84 kcal/mol; 2KFHGPF, 0.64 kcal/mol; Tables 2 and S1) decrease in turn. This correlation between hydrogen bonds and energy contributions is also true for the flanking residues numbered 152–154. Thus, 2KFFNPF, which has the largest number of in-termolecular hydrogen bonds, has the largest contri-butions of flanking residues.
At first, Kieken et al. (2007) predicted that the EHD1 EH domain may have a higher binding affinity for peptides containing the more negatively charged DPF motif than for those containing NPF motif be-cause of its highly positive surface potential. How-ever, their subsequent study estimating binding af-finities of 2KFFNPF and 2KFGDPF confirmed that the opposite is true (Kieken et al., 2009), which implies that it is not reliable to speculate the binding affinity based solely on the surface potential and residue
charge state. The reasons are just as what we have discussed above, i.e. peptide structures of 2KFFNPF and 2KFGDPF differ even though only one residue is different, and what’s more, the influence of electric charges on binding affinity is not obvious because of the offset of ∆Eele and ∆Gpolar. Similarly, the situation also occurs in the neutral/negatively charged N-terminal EH domains. de Beer et al. (2000) predicted that the second EH domain of Eps15 (EH2) cannot bind to peptides containing DPF motif because of electro-static repulsion between Glu170 of EH2 and the neg-atively charged residue Asp taking the structure of EH2-NPF as reference. Shortly after that, Kim et al. (2001) proved that the Reps1 EH domain that has a nearly equal overall conformation of the binding pocket and the same orientation of the side chains of critical conserved hydrophobic residues with EH2 can bind to the DPF-containing peptide because of the different arrangement for the gate residues Glu55 (Glu170 in EH2) and Lys37 of the EH domain. Later, the EH domain of POB1, a closely related but not identical to Reps1, was also confirmed to bind to the DPF motif (Santonico et al., 2007). All these cases imply the importance of comprehensive consideration of sequence differences, structural changes, and crit-ical energies for binding. In addition, it is worth not-ing that the Reps1 EH domain prefers NPF motif over DPF motif with all other flanking residues being equal (Kim et al., 2001). This situation is similar to the EHD1 EH domain here. However, explaining this preference through exact energy calculations just like here is currently not possible because of the lack of structures of Reps1 EH domain-NPF peptide and Reps1 EH domain-DPF peptide.
However, contributions of the flanking residues only occupy 21.5%, 8.0%, and 11.0% of the total con-tributions of all residues in 2KFFNPF, 2KFGDPF, and 2KFHGPF, respectively (Table 2). The three motifs are still the most important contributors to the binding. This is consistent with a previous systemic study, which demonstrated that the motif and the flanking residues contribute on average 79% and 21% of the global binding energy, respectively, in protein-peptide interactions (Stein and Aloy, 2008). Hence, special attention should be paid to the choice of motif resi-dues when we design peptide inhibitors with high binding affinities. Residues which can interact with the protein partner with larger van der Waals interactions

Yu et al. / J Zhejiang Univ-Sci B (Biomed & Biotechnol) 2015 16(10):883-896 893
should be considered at first. For proteins with mul-tiple binding pocket or oligomers, repeating occur-rence of the motif is another way to strengthen the binding just like some EH domain containing protein (EHD protein)/peptide complexes found in vivo (Braun et al., 2005; Naslavsky et al., 2006). Never-theless, attention to the flanking residues is always necessary for their responsibility for the specificity in EH domain/peptide interactions (Grant and Caplan, 2008; Naslavsky and Caplan, 2011) as well as their energy contributions to improve binding affinities. Previous studies have found that EHD proteins prefer acidic residues following the NPF motif in the +1, +2, and +3 positions because of salt bridges or entropic cost (Henry et al., 2010; Kieken et al., 2010). Here, we emphasized the structural importance of inter-molecular hydrogen bonds of the flanking residues. Peptides that have acidic residues following the NPF motif in the +1, +2, and +3 positions and flanking residues in other positions which have a strong ability to form intermolecular hydrogen bonds may bind to EHD proteins better. In addition, design of cyclic peptides may be another choice to get high affinity. Studies have shown that cyclic NPF-containing pep-tides bind to the N-terminal EH domain with higher affinities than the linear ones (Yamabhai et al., 1998; de Beer et al., 2000). And a new cyclic peptide de-signed for the EHD1 EH domain has obtained nearly 4-fold improvement in affinity in contrast to a typical linear peptide (Kamens et al., 2014). Usually, the β-turn conformation that is adopted by the NPF motif of bound state was well stabilized in these cyclic peptides. An excellent conformational fit between protein and peptide was obtained. On the other hand, the less flexible cyclic peptide is more likely to lose less entropy upon binding thermodynamically, and thus should bind more tightly, all other things being equal. However, just as in the observation of Kim et al. (2001), the rigid cyclic peptide may induce larger conformational changes of its protein partner, slow the association rate, and thus get a lower affinity. Weaker binding affinities were also observed when increasing or decreasing the ring size of a good cyclic peptide (Kamens et al., 2014). Therefore, how to design a specific cyclic peptide with an appropriate conformation is a big challenge for the future.
In conclusion, we have investigated the molec-ular mechanisms of different binding affinities of
three complexes formed between the EHD1 EH do-main and peptides containing NPF, DPF, and GPF motifs from structural and energetic perspectives via MD simulations. Our results emphasized the im-portance of the van der Waals interactions and the intermolecular hydrogen bonds of the flanking resi-dues in the EHD1 EH domain interactions with pep-tide, all of which provide a clear guidance to the peptide inhibitor design of the EHD1 EH domain and even other related proteins.
Compliance with ethics guidelines
Hua YU, Mao-jun WANG, Nan-xia XUAN, Zhi-cai SHANG, and Jun WU declare that they have no conflict of interest.
This article does not contain any studies with human or animal subjects performed by any of the authors.
References Ammann, L.P., Goodman, S.R., 2009. Cluster analysis for the
impact of sickle cell disease on the human erythrocyte protein interactome. Exp. Biol. Med., 234(6):703-711. [doi:10.3181/0806-RM-211]
Benmerah, A., Gagnon, J., Bègue, B., et al., 1995. The tyrosine kinase substrate eps15 is constitutively associated with the plasma membrane adaptor AP-2. J. Cell Biol., 131(6): 1831-1838. [doi:10.1083/jcb.131.6.1831]
Benmerah, A., Lamaze, C., Bègue, B., et al., 1998. AP-2/Eps15 interaction is required for receptor-mediated endocytosis. J. Cell Biol., 140(5):1055-1062. [doi:10.1083/jcb.140. 5.1055]
Berendsen, H.J.C., Postma, J.P.M., van Gunsteren, W.F., et al., 1984. Molecular dynamics with coupling to an external bath. J. Chem. Phys., 81(8):3684-3690. [doi:10.1063/ 1.448118]
Braun, A., Pinyol, R., Dahlhaus, R., et al., 2005. EHD proteins associate with syndapin I and II and such interactions play a crucial role in endosomal recycling. Mol. Biol. Cell, 16(8):3642-3658. [doi:10.1091/mbc.E05-01-0076]
Caplan, S., Naslavsky, N., Hartnell, L.M., et al., 2002. A tubular EHD1-containing compartment involved in the recycling of major histocompatibility complex class I molecules to the plasma membrane. EMBO J., 21: 2557-2567. [doi:10.1093/emboj/21.11.2557]
Carbone, R., Fré, S., Iannolo, G., et al., 1997. eps15 and eps15R are essential components of the endocytic path-way. Cancer Res., 57(24):5498-5504.
Case, D.A., Darden, T.A., Cheatham, T.E.III, et al., 2012. AMBER 13. University of California, San Francisco, p.349-369.
Caswell, P., Norman, J., 2008. Endocytic transport of integrins during cell migration and invasion. Trends Cell Biol., 18(6):257-263. [doi:10.1016/j.tcb.2008.03.004]
Yu et al. / J Zhejiang Univ-Sci B (Biomed & Biotechnol) 2015 16(10):883-896
894
Cortez, K.J., Lyman, C.A., Kottilil, S., et al., 2006. Functional genomics of innate host defense molecules in normal human monocytes in response to Aspergillus fumigatus. Infect. Immun., 74(4):2353-2365. [doi:10.1128/IAI.74.4. 2353-2365.2006]
Darden, T., York, D., Pedersen, L., 1993. Particle mesh Ewald: an N·log(N) method for Ewald sums in large systems. J. Chem. Phys., 98(12):10089-10092. [doi:10.1063/1.464397]
Daumke, O., Lundmark, R., Vallis, Y., et al., 2007. Architec-tural and mechanistic insights into an EHD ATPase in-volved in membrane remodelling. Nature, 449(7164): 923-927. [doi:10.1038/nature06173]
de Beer, T., Hoofnagle, A.N., Enmon, J.L., et al., 2000. Mo-lecular mechanism of NPF recognition by EH domains. Nat. Struct. Mol. Biol., 7(11):1018-1022. [doi:10.1038/ 80924]
Delft, S.V., Schumacher, C., Hage, W., et al., 1997. Associa-tion and colocalization of Eps15 with adaptor protein-2 and clathrin. J. Cell Biol., 136(4):811-821. [doi:10.1083/ jcb.136.4.811]
Dervan, E.W., Chen, H., Ho, S.L., et al., 2010. Protein macroarray profiling of serum autoantibodies in pseudo-exfoliation glaucoma. Invest. Ophthalmol. Vis. Sci., 51(6): 2968-2975. [doi:10.1167/iovs.09-4898]
Doherty, K.R., Demonbreun, A.R., Wallace, G.Q., et al., 2008. The endocytic recycling protein EHD2 interacts with myoferlin to regulate myoblast fusion. J. Biol. Chem., 283(29):20252-20260. [doi:10.1074/jbc.M802306200]
Duan, Y., Wu, C., Chowdhury, S., et al., 2003. A point-charge force field for molecular mechanics simulations of pro-teins based on condensed-phase quantum mechanical calculations. J. Comput. Chem., 24(16):1999-2012. [doi: 10.1002/jcc.10349]
Essmann, U., Perera, L., Berkowitz, M.L., et al., 1995. A smooth particle mesh Ewald method. J. Chem. Phys., 103(19):8577-8593. [doi:10.1063/1.470117]
Fazioli, F., Minichiello, L., Matoskova, B., et al., 1993. Eps15, a novel tyrosine kinase substrate, exhibits transforming activity. Mol. Cell. Biol., 13(9):5814-5828. [doi:10.1128/ MCB.13.9.5814]
Galindo, C.L., Sha, J., Ribardo, D.A., et al., 2003. Identifica-tion of Aeromonas hydrophila cytotoxic enterotoxin- induced genes in macrophages using microarrays. J. Biol. Chem., 278(41):40198-40212. [doi:10.1074/jbc.M3057 88200]
Grant, B.D., Caplan, S., 2008. Mechanisms of EHD/RME-1 protein function in endocytic transport. Traffic, 9(12): 2043-2052. [doi:10.1111/j.1600-0854.2008.00834.x]
Guerois, R., Nielsen, J.E., Serrano, L., 2002. Predicting changes in the stability of proteins and protein complexes: a study of more than 1000 mutations. J. Mol. Biol., 320(2): 369-387. [doi:10.1016/S0022-2836(02)00442-4]
Guilherme, A., Soriano, N.A., Bose, S., et al., 2004. EHD2 and the novel EH domain binding protein EHBP1 couple endocytosis to the actin cytoskeleton. J. Biol. Chem., 279(11):10593-10605. [doi:10.1074/jbc.M307702200]
Hansel, D.E., Rahman, A., House, M., et al., 2004. Met proto- oncogene and insulin-like growth factor binding protein 3 overexpression correlates with metastatic ability in well- differentiated pancreatic endocrine neoplasms. Clin. Cancer Res., 10(18):6152-6158. [doi:10.1158/1078-0432.CCR- 04-0285]
Henry, G.D., Corrigan, D.J., Dineen, J.V., et al., 2010. Charge effects in the selection of NPF motifs by the EH domain of EHD1. Biochemistry, 49(16):3381-3392. [doi:10.1021/ bi100065r]
Hess, B., Bekker, H., Berendsen, H.J.C., et al., 1997. LINCS: a linear constraint solver for molecular simulations. J. Comput. Chem., 18(12):1463-1472. [doi:10.1002/(SICI) 1096-987X(199709)18:12<1463::AID-JCC4>3.0.CO;2-H]
Hess, B., Kutzner, C., van der Spoel, D., et al., 2008. GROMACS 4: algorithms for highly efficient, load- balanced, and scalable molecular simulation. J. Chem. Theory Comput., 4(3):435-447. [doi:10.1021/ct700301q]
Humphrey, W., Dalke, A., Schulten, K., 1996. VMD: visual molecular dynamics. J. Mol. Graph., 14(1):33-38. [doi:10. 1016/0263-7855(96)00018-5]
Jansen, F.H., Krijgsveld, J., van Rijswijk, A., et al., 2009. Exosomal secretion of cytoplasmic prostate cancer xenograft-derived proteins. Mol. Cell. Proteomics, 8(6): 1192-1205. [doi:10.1074/mcp.M800443-MCP200]
Jorgensen, W.L., Chandrasekhar, J., Madura, J.D., et al., 1983. Comparison of simple potential functions for simulating liquid water. J. Chem. Phys., 79(2):926-935. [doi:10. 1063/1.445869]
Jović, M., Naslavsky, N., Rapaport, D., et al., 2007. EHD1 regulates β1 integrin endosomal transport: effects on focal adhesions, cell spreading and migration. J. Cell Sci., 120(5):802-814. [doi:10.1242/jcs.03383]
Kabsch, W., Sander, C., 1983. Dictionary of protein secondary structure: pattern recognition of hydrogen-bonded and geometrical features. Biopolymers, 22(12):2577-2637. [doi:10.1002/bip.360221211]
Kamens, A.J., Eisert, R.J., Corlin, T., et al., 2014. Structured cyclic peptides that bind the EH domain of EHD1. Biochemistry, 53(29):4758-4760. [doi:10.1021/bi500744q]
Kieken, F., Jovic, M., Naslavsky, N., et al., 2007. EH domain of EHD1. J. Biomol. NMR, 39(4):323-329. [doi:10.1007/ s10858-007-9196-0]
Kieken, F., Jovic, M., Tonelli, M., et al., 2009. Structural insight into the interaction of proteins containing NPF, DPF, and GPF motifs with the C-terminal EH-domain of EHD1. Protein Sci., 18(12):2471-2479. [doi:10.1002/pro. 258]
Kieken, F., Sharma, M., Jovic, M., et al., 2010. Mechanism for the selective interaction of C-terminal Eps15 homology domain proteins with specific Asn-Pro-Phe-containing partners. J. Biol. Chem., 285(12):8687-8694. [doi:10. 1074/jbc.M109.045666]
Kim, S., Cullis, D.N., Feig, L.A., et al., 2001. Solution struc-ture of the Reps1 EH domain and characterization of its binding to NPF target sequences. Biochemistry, 40(23):
Yu et al. / J Zhejiang Univ-Sci B (Biomed & Biotechnol) 2015 16(10):883-896 895
6776-6785. [doi:10.1021/bi002700m] Kollman, P.A., Massova, I., Reyes, C., et al., 2000. Calculating
structures and free energies of complex molecules: combining molecular mechanics and continuum models. Acc. Chem. Res., 33(12):889-897. [doi:10.1021/ar000033j]
Lin, S.X., Grant, B., Hirsh, D., et al., 2001. Rme-1 regulates the distribution and function of the endocytic recycling compartment in mammalian cells. Nat. Cell Biol., 3(6): 567-572. [doi:10.1038/35078543]
Lindahl, E., Azuara, C., Koehl, P., et al., 2006. NOMAD-Ref: visualization, deformation and refinement of macromo-lecular structures based on all-atom normal mode analysis. Nucleic Acids Res., 34(Suppl. 2):W52-W56. [doi:10. 1093/nar/gkl082]
London, N., Movshovitz-Attias, D., Schueler-Furman, O., 2010. The structural basis of peptide-protein binding strategies. Structure, 18(2):188-199. [doi:10.1016/j.str. 2009.11.012]
Lu, S., Jiang, Y., Lv, J., et al., 2011. Mechanism of kinase inactivation and nonbinding of fratide to GSK3β due to K85M mutation: molecular dynamics simulation and normal mode analysis. Biopolymers, 95(10):669-681. [doi:10.1002/bip.21629]
Maher, E.A., Furnari, F.B., Bachoo, R.M., et al., 2001. Ma-lignant glioma: genetics and biology of a grave matter. Genes Dev., 15(11):1311-1333. [doi:10.1101/gad.891601]
Miliaras, N., Wendland, B., 2004. EH proteins. Cell Biochem. Biophys., 41(2):295-318. [doi:10.1385/CBB:41:2:295]
Mosesson, Y., Mills, G.B., Yarden, Y., 2008. Derailed endocytosis: an emerging feature of cancer. Nat. Rev. Cancer, 8(11):835-850. [doi:10.1038/nrc2521]
Naslavsky, N., Caplan, S., 2005. C-terminal EH-domain- containing proteins: consensus for a role in endocytic trafficking, EH? J. Cell Sci., 118(18):4093-4101. [doi:10. 1242/jcs.02595]
Naslavsky, N., Caplan, S., 2011. EHD proteins: key conductors of endocytic transport. Trends Cell Biol., 21(2):122-131. [doi:10.1016/j.tcb.2010.10.003]
Naslavsky, N., Boehm, M., Backlund, P.S., et al., 2004. Rabenosyn-5 and EHD1 interact and sequentially regu-late protein recycling to the plasma membrane. Mol. Biol. Cell, 15(5):2410-2422. [doi:10.1091/mbc.E03-10-0733]
Naslavsky, N., Rahajeng, J., Sharma, M., et al., 2006. Interactions between EHD proteins and Rab11-FIP2: a role for EHD3 in early endosomal transport. Mol. Biol. Cell, 17(1):163-177. [doi:10.1091/mbc.E05-05-0466]
Polo, S., Confalonieri, S., Salcini, A.E., et al., 2003. EH and UIM: endocytosis and more. Sci. Signal., 213:re17. [doi:10.1126/stke.2132003re17]
Rose, P.W., Bi, C., Bluhm, W.F., et al., 2013. The RCSB Protein Data Bank: new resources for research and edu-cation. Nucleic Acids Res., 41(D1):D475-D482. [doi:10. 1093/nar/gks1200]
Santolini, E., Salcini, A.E., Kay, B.K., et al., 1999. The EH network. Exp. Cell Res., 253(1):186-209. [doi:10.1006/ excr.1999.4694]
Santonico, E., Panni, S., Falconi, M., et al., 2007. Binding to DPF-motif by the POB1 EH domain is responsible for POB1-Eps15 interaction. BMC Biochem., 8:29. [doi:10. 1186/1471-2091-8-29]
Schymkowitz, J.W.H., Rousseau, F., Martins, I.C., et al., 2005. Prediction of water and metal binding sites and their affinities by using the Fold-X force field. PNAS, 102(29): 10147-10152. [doi:10.1073/pnas.0501980102]
Sharma, M., Giridharan, S.S.P., Rahajeng, J., et al., 2009. MICAL-L1 links EHD1 to tubular recycling endosomes and regulates receptor recycling. Mol. Biol. Cell, 20(24): 5181-5194. [doi:10.1091/mbc.E09-06-0535]
Shi, A., Pant, S., Balklava, Z., et al., 2007. A novel require-ment for C. elegans Alix/ALX-1 in RME-1-mediated membrane transport. Curr. Biol., 17(22):1913-1924. [doi:10.1016/j.cub.2007.10.045]
Shin, J., Monti, S., Aires, D.J., et al., 2007. Lesional gene expression profiling in cutaneous T-cell lymphoma reveals natural clusters associated with disease outcome. Blood, 110(8):3015-3027. [doi:10.1182/blood-2006-12- 061507]
Smith, C.A., Dho, S.E., Donaldson, J., et al., 2004. The cell fate determinant numb interacts with EHD/Rme-1 family proteins and has a role in endocytic recycling. Mol. Biol. Cell, 15(8):3698-3708. [doi:10.1091/mbc.E04-01-0026]
Stein, A., Aloy, P., 2008. Contextual specificity in peptide- mediated protein interactions. PLoS ONE, 3(7):e2524. [doi:10.1371/journal.pone.0002524]
Tripathi, A.K., Sha, W., Shulaev, V., et al., 2009. Plasmodium falciparum-infected erythrocytes induce NF-κB regulated inflammatory pathways in human cerebral endothelium. Blood, 114:4243-4252. [doi:10.1182/blood-2009-06-22 6415]
Wang, W., Kollman, P.A., 2001. Computational study of protein specificity: the molecular basis of HIV-1 protease drug resistance. PNAS, 98(26):14937-14942. [doi:10. 1073/pnas.251265598]
Weiser, J., Shenkin, P.S., Still, W.C., 1999. Approximate atomic surfaces from linear combinations of pairwise overlaps (LCPO). J. Comput. Chem., 20(2):217-230. [doi:10.1002/ (SICI)1096-987X(19990130)20:2<217::AID-JCC4>3.0.CO;2-A]
Wong, W.T., Schumacher, C., Salcini, A.E., et al., 1995. A protein-binding domain, EH, identified in the receptor tyrosine kinase substrate Eps15 and conserved in evolu-tion. PNAS, 92(21):9530-9534. [doi:10.1073/pnas.92.21. 9530]
Xu, Y., Shi, H., Wei, S., et al., 2004. Mutually exclusive in-teractions of EHD1 with GS32 and syndapin II. Mol. Membr. Biol., 21(4):269-277. [doi:10.1080/0968768041 0001716871]
Yamabhai, M., Hoffman, N.G., Hardison, N.L., et al., 1998. Intersectin, a novel adaptor protein with two Eps15 homology and five Src homology 3 domains. J. Biol. Chem., 273(47):31401-31407. [doi:10.1074/jbc.273.47. 31401]

Yu et al. / J Zhejiang Univ-Sci B (Biomed & Biotechnol) 2015 16(10):883-896
896
Zhang, J., Li, C., Shi, T., et al., 2009. Lys169 of human glucokinase is a determinant for glucose phosphorylation: implication for the atomic mechanism of glucokinase catalysis. PLoS ONE, 4(7):e6304. [doi:10.1371/journal. pone.0006304]
List of electronic supplementary materials Table S1 Per-residue energy decomposition of the peptide
residues in detail Fig. S1 Hydrogen bond interaction network at the interaction
interface Formula S1 Calculation of ∆G by FoldX
中文概要
题 目:EHD1 蛋白中的 Eps15 同源结构域与多种肽链相
互作用的分子动力学模拟
目 的:从结构和能量两个角度,探究 EHD1 蛋白中的
Eps15 同源结构域与不同肽链之间形成的复合物
之间的亲和力差异的原因,为肽类抑制剂设计提
供关键信息。
创新点:通过分子动力学模拟的方法,详细分析了三个复
合物的结构差异。通过结合自由能计算及能量分
解,定量对比了三条肽链中各个残基对复合物形
成的贡献,确定了范德华相互作用以及侧面残基
的氢键是影响亲和力大小的关键因素。
方 法:用 GROMACS 程序对 EHD1 蛋白中的 Eps15 同源
结构域与肽链形成的三个复合物进行各
60 纳秒的分子动力学模拟,用 AMBER 程序中的
MM/GBSA 方法进行结合自由能计算和能量分
解,用 FoldX 软件对三个复合物进行丙氨酸扫描
实验。
结 论:在对 EHD1 蛋白中的 Eps15 同源结构域进行高亲
和力的肽类抑制剂设计时,范德华相互作用应该
成为主要考虑因素。与蛋白质形成氢键的能力是
侧面残基选择的参考因素。
关键词:亲和力;Eps15 同源结构域;分子动力学模拟;
抑制剂设计;肽