molecular genetic study of the variability of the tuberous
TRANSCRIPT
Zentrum für Kinderheilkunde und Jugendmedizin
Albert-Ludwigs-Universität
Freiburg, Germany
MOLECULAR GENETIC INVESTIGATION OF THE VARIABILITY OF THE GTPase
ACTIVATING PROTEIN- (GAP-) RELATED DOMAIN OF THE TUBEROUS
SCLEROSIS - 2 (TSC2) GENE IN TSC PATIENTS AND HEALTHY SUBJECTS
Inaugural - Dissertation
zur
Erlangung des Medizinischen Doktorgrades
der Medizinischen Fakultät
der Albert-Ludwigs-Universität
Freiburg i. Br.
Vorgelegt 2002
von Karin Louise Zügge geb. Gierke
geboren in Madison, Wisconsin/U.S.A.
Dekan: Prof. Dr. med. J. Zentner
1. Gutachter: Prof. Dr. med. L.B. Zimmerhackl
2. Gutachter: Prof. Dr. med. E. Schulz
Jahr der Promotion: 2004
i
Table of Contents 1 Introduction 1-12
1.1 History 1
1.2 Clinical characteristics 3
1.3 Pathogenesis 5
1.4 Genetics 6
1.5 Protein products 7
1.6 The clinical variability predicament 10
1.7 The Freiburg-Heidelberg project 11
1.8 Objectives and research questions 12
2 Materials and Methods 13-22
2.1 Materials 13-15
2.1.1 Apparatus and equipment 13
2.1.2 Buffers and solutions 13
2.1.3 Chemicals, enzymes, kits and size markers 14
2.1.4 Databases and software 14
2.1.5 Media and cell cultures 14
2.1.6 Oligonucleotides and DNA-sequencing 15
2.2 Methods 15-22
2.2.1 Probands 15
2.2.1.1 TSC patients and families 15
2.2.1.2 Healthy population 15
2.2.2 Cell culture and transformation from peripheral blood samples 16
2.2.3 Freezing of cells 16
2.2.4 DNA extraction 17

ii
2.2.5 PCR 18
2.2.6 PCR product analysis 19
2.2.7 SSCP 20
2.2.8 Purification of the PCR product 21
2.2.9 Sequencing 21
2.2.10 Sequence analysis 22
3 Results 23-31
3.1 Patient group 23
3.1.1 Amplification of exons 23
3.1.2 Mutational screening 23
3.1.3 Sequencing results 24
3.1.3.1 Mutations 24
3.1.3.2 Polymorphisms 26
3.1.4 Exon 40 and quality control 26
3.2 Control group of healthy probands 28
3.2.1 Exon amplification 28
3.2.2 Mutational screening 28
3.2.3 Sequencing results and numerical comparison to patient group 29
3.3 The Freiburg-Heidelberg project 30
4 Discussion 32-43
4.1 Patient group 32
4.1.1 PCR products 32
4.1.2 SSCP 32
4.1.3 Sequencing 33
4.1.3.1 Mutations 33
4.1.3.2 Polymorphisms 35
Table of Contents
iii
Table of Contents
4.1.3.3 Quality control and exon 40 36
4.2 Control group of healthy probands 36
4.2.1 Exon amplification and mutational screening 37
4.2.2 Sequencing results and numerical comparison to patient group 37
4.3 Screening the whole gene 38
4.3.1 Number and type of mutations found 38
4.3.2 Genotype-phenotype correlation 39
4.3.3 Clinical variability 40
4.3.4 TSC1 and TSC2 frequency ratios 41
4.4 Conclusions 42
4.5 Future 43
5 Summary 44
6 Zusammenfassung 45
7 Appendix 46-50
8 Abbreviations and symbols 51-52
9 Literature 53-58
10 Acknowledgments 59
11 Curriculum vitae 60
12 Publications 61
1
1 Introduction
Tuberous sclerosis complex (TSC) is not a disease that summons a definite
picture to mind for most of us. It is, however, one of the most common genetic
illnesses with a frequency of approximately 1:6000 (Kwiatkowska et al., 1999; Gomez
et al, 1999).1 A defect in one of two genes, TSC1 or TSC2, causes the disorder. A
wide variety of clinical manifestations and several different names make TSC such a
commonly unfamiliar disease.
TSC is a complex hereditary syndrome with a broad array of clinical
characteristics and thus various faces. The one unifying characteristic of TSC is the
development of benign localized tumors (hamartomas) in various tissues. The basis
of the name tuberous sclerosis is given by the cortical tubers found in the brain.
Further typical manifestations include renal angiomyolipomas and cysts, cardiac
rhabdomyomas, facial angiofibromas and pigment disorders in the skin. The severity
of manifestation is as variable as the tissues affected by the disease. The scale goes
from a few irregularities in the skin to severe multi-organ TSC with epilepsy, behavior
disorders and mental retardation, multiple kidney lesions and renal failure. (Roach et
al., 1998)
1.1 History
Not only do the varying manifestations of TSC make this a hard disease to
characterize, but also the various names given TSC over the centuries illustrate the
complexity of the disorder. The earliest documented description of a likely TSC case
is accredited to von Recklinghausen in 1862. He performed an autopsy on a newborn
child, who died shortly after birth, in which he described multiple heart tumors and
hardened areas in the brain. Bourneville described TSC as a form of epilepsy in Paris
in 1880, and thus TSC is also known as Maladie de Bourneville in France. Pringle
described the skin manifestation of Adenoma sebaceum in 1885, making TSC
synonymous with Pringle’s Disease in England. (Gomez et al., 1999)
These early scholars did not correlate their findings to other manifestations or
make the connection that these might all belong to the same disorder. It was Vogt
1 Some examples of well known inherited disorders include: galactosemia (1:50000), adrenogenital syndrome (1:10000), phenylketonuria (1:7000), hypothyroidism (1:4000), neurofibromatosis (von Recklinghausen, NF1 = 1:4000) and cystic fibrosis (1:2000). (von Harnack, 1994)
2
who first described a trias of facial angiofibromas, epileptic seizures and intellectual
handicap that could also include heart and kidney tumors in 1908. The establishment
of autosomal dominant inheritance was based on the report of a family with affected
members in three generations by H. Berg in 1913. The term “phakomatoses”
(neurocutaneous dysplasias) for diseases such as TSC and neurofibromatosis was
proposed in 1921 by van der Hoeve. Von Hippel-Lindau and Sturge-Weber
syndromes were later included in the list of phakomatoses. Accurate nomenclature
and the term tuberous sclerosis were proposed to replace the poorly chosen epiloia
by Critchley and Earl in 1932. (Gomez et al., 1999)
Over the course of the twentieth century, modern medical technology has
brought great progress in diagnostics. The introduction of computer tomography of
the head in 1973 and the use of ultraviolet light to detect skin lesions has increased
the diagnosis of both patients and asymptomatic family members. Magnetic
resonance imaging is proving to be an even better diagnostic tool for identifying
cortical tubers before they calcify. These methods along with careful clinical
examination allow for a certain diagnosis of TSC -- a decisive factor in the increasing
awareness that this is a relatively common disorder. (Gomez et al., 1999)
Recent events and progress in genetic research promise new possibilities for
molecular diagnostics and hope for future treatment advances. Research impulses
were given and a consensus in diagnostic criteria was established at the 1991 New
York Academy of Science TSC meeting (Roach et al., 1998). The identification of
TSC2 on chromosome 16 in 1993 (European Chromosome 16 Tuberous Sclerosis
Consortium, 1993) and of TSC1 on chromosome 9 in 1997 (van Slegtenhorst et al.,
1997) have provided for new possibilities in molecular screening.
Advances in molecular diagnostic methods are currently being explored to
simplify the as yet very lengthy process of screening all exons of both large genes.
Molecular genetic identification of the disease causing mutation is becoming
increasingly significant for patients and their families, because this information is
essential for adequate genetic counseling. Despite the many current and the hope for
future advances, the clinical diagnosis of TSC remains of central importance for the
individual patient and treatment of TSC continues to emphasize symptomatic
measures.
Introduction
3
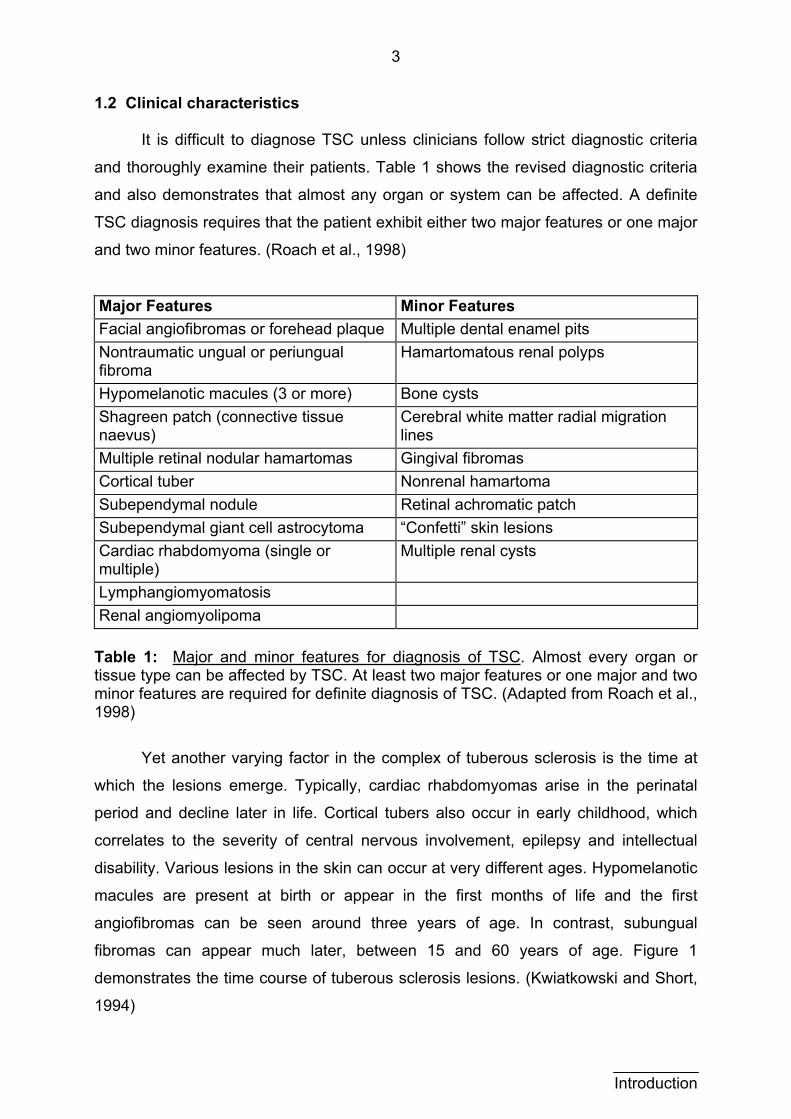
1.2 Clinical characteristics
It is difficult to diagnose TSC unless clinicians follow strict diagnostic criteria
and thoroughly examine their patients. Table 1 shows the revised diagnostic criteria
and also demonstrates that almost any organ or system can be affected. A definite
TSC diagnosis requires that the patient exhibit either two major features or one major
and two minor features. (Roach et al., 1998)
Major Features Minor Features Facial angiofibromas or forehead plaque Multiple dental enamel pits Nontraumatic ungual or periungual fibroma
Hamartomatous renal polyps
Hypomelanotic macules (3 or more) Bone cysts Shagreen patch (connective tissue naevus)
Cerebral white matter radial migration lines
Multiple retinal nodular hamartomas Gingival fibromas Cortical tuber Nonrenal hamartoma Subependymal nodule Retinal achromatic patch Subependymal giant cell astrocytoma “Confetti” skin lesions Cardiac rhabdomyoma (single or multiple)
Multiple renal cysts
Lymphangiomyomatosis Renal angiomyolipoma
Table 1: Major and minor features for diagnosis of TSC. Almost every organ or tissue type can be affected by TSC. At least two major features or one major and two minor features are required for definite diagnosis of TSC. (Adapted from Roach et al., 1998)
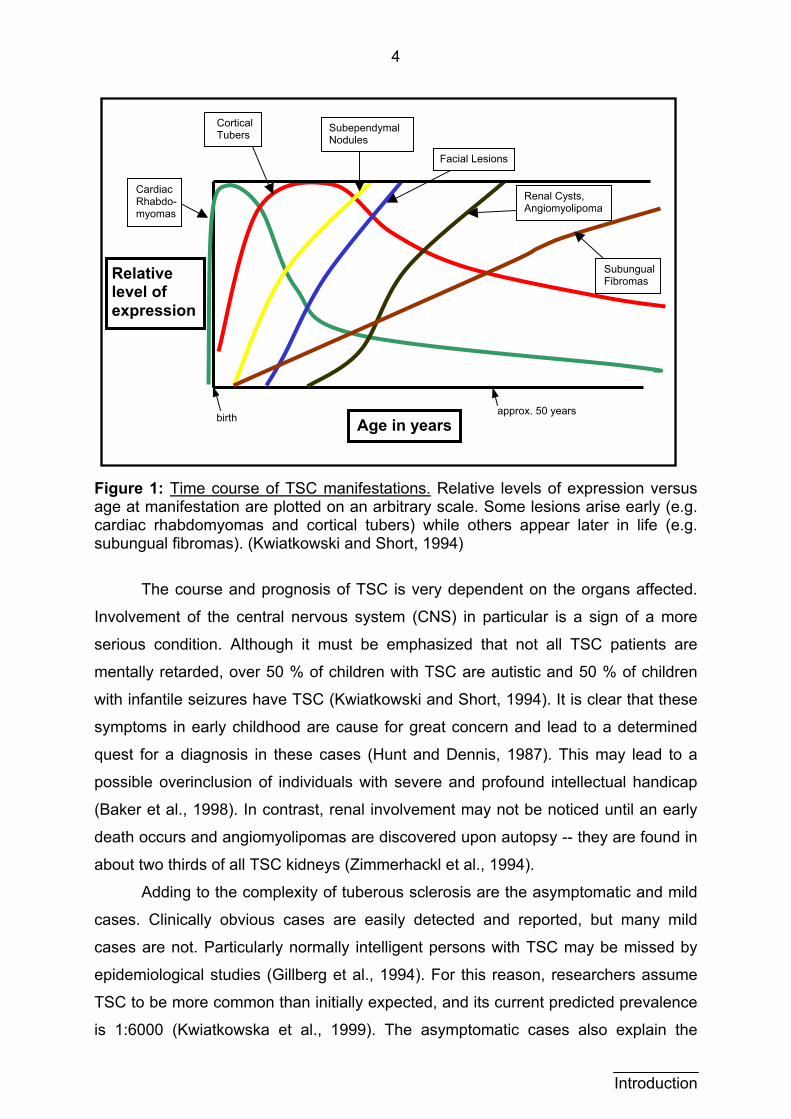
Yet another varying factor in the complex of tuberous sclerosis is the time at
which the lesions emerge. Typically, cardiac rhabdomyomas arise in the perinatal
period and decline later in life. Cortical tubers also occur in early childhood, which
correlates to the severity of central nervous involvement, epilepsy and intellectual
disability. Various lesions in the skin can occur at very different ages. Hypomelanotic
macules are present at birth or appear in the first months of life and the first
angiofibromas can be seen around three years of age. In contrast, subungual
fibromas can appear much later, between 15 and 60 years of age. Figure 1
demonstrates the time course of tuberous sclerosis lesions. (Kwiatkowski and Short,
1994)
Introduction
4
Age in years
Relative level of expression
Cardiac Rhabdo-myomas
Cortical Tubers Subependymal
Nodules
Facial Lesions
birth appr
Figure 1: Time course of TSC manifestations. Relative levage at manifestation are plotted on an arbitrary scale. Somecardiac rhabdomyomas and cortical tubers) while others subungual fibromas). (Kwiatkowski and Short, 1994)
The course and prognosis of TSC is very dependen
Involvement of the central nervous system (CNS) in partic
serious condition. Although it must be emphasized that n
mentally retarded, over 50 % of children with TSC are autis
with infantile seizures have TSC (Kwiatkowski and Short, 19
symptoms in early childhood are cause for great concern a
quest for a diagnosis in these cases (Hunt and Dennis, 19
possible overinclusion of individuals with severe and profo
(Baker et al., 1998). In contrast, renal involvement may not
death occurs and angiomyolipomas are discovered upon au
about two thirds of all TSC kidneys (Zimmerhackl et al., 1994
Adding to the complexity of tuberous sclerosis are th
cases. Clinically obvious cases are easily detected and
cases are not. Particularly normally intelligent persons with
epidemiological studies (Gillberg et al., 1994). For this reas
TSC to be more common than initially expected, and its curr
is 1:6000 (Kwiatkowska et al., 1999). The asymptomatic
Renal Cysts, Angiomyolipoma
Subungual Fibromas
ox. 50 years
els of expression versus lesions arise early (e.g.
appear later in life (e.g.
t on the organs affected.
ular is a sign of a more
ot all TSC patients are
tic and 50 % of children
94). It is clear that these
nd lead to a determined
87). This may lead to a
und intellectual handicap
be noticed until an early
topsy -- they are found in
).
e asymptomatic and mild
reported, but many mild
TSC may be missed by
on, researchers assume
ent predicted prevalence
cases also explain the
Introduction
5
difficulty in genetic counseling. Parents with a child, who seems to be a sporadic TSC
case, are told that there is a 2 % recurrence risk in subsequent children (Osborne et
al., 1991, Rose et al., 1999). It is hoped that greater awareness of the clinical aspects
of TSC and the intense efforts to fully resolve its genetic mechanisms will help
clinicians more fully advise and treat their patients.
1.3 Pathogenesis
Though TSC is characterized by high variability, the typical manifestation is
the development of hamartomas -- lesions that display abnormal tissue
differentiation. These tumors are rarely malignant, meaning they do not grow
invasively and do not metastasize. Lesions are as a norm localized and the
surrounding tissue usually remains healthy. Rare malignant forms of hamartomas are
known as hamartoblastomas. Localized lesions are responsible for TSC symptoms in
the organs in which they occur, or they may occasionally be asymptomatic.
(summarized in Gomez et al., 1999)
Histological examination of hamartomas shows tissue reminiscent of neuronal
cells. It is assumed that TSC is based upon a disturbance in neuronal cell migration
and differentiation, in particular neural cells derived from the neural crest. For
example, the major feature of hypomelanotic macules in the skin represent a local
pigment disorder in melanocytes, which are derived from the neural crest cells.
(summarized in Rott et al., 1999)
The migration of neural crest cells in various tissues is one possible
explanation for the ability of TSC to occur in almost any organ. TSC lesions have
been often described in the CNS, kidney, skin, heart, lung, retina, bone, and teeth.
Skeletal muscle, peripheral nervous system and thymus involvement have as yet not
been described. Despite these tendencies, there is as yet no common trend in the
emergence of hamartomas that can predict the course of the disease. (summarized
in Rott et al., 1999)
An argument for the theory that TSC lesions arise from a single cell is
demonstrated in the example of angiomyolipomas. A progenitor cell in which one of
the TSC genes is defective can give rise to the three different cell types (blood
vessel, smooth muscle and fat) found in angiomyolipomas (Young and Povey, 1998).
The unicellular origin is confirmed by the finding of non-random X-inactivation in
tumors from female TSC patients (Green et al, 1996).
Introduction
6
Hamartomas also demonstrate loss of heterozygosity, which is evidence for
the tumor suppressor function of the two TSC genes (Carbonara et al., 1994 and
Henske et al., 1996). The loss of both alleles of a gene coding for a tumor suppressor
is required for loss of growth control (Lewin 1998). This loss of the healthy allele
means that TSC behaves recessively at the cellular level. Patients have been
studied, who were heterozygous for TSC1 or TSC2 markers, but whose
angiomyolipoma tissue were homozygous for these markers (Young and Povey,
1998). Depending on when and where the loss of the healthy allele occurs, the
clinical outcome of the disease will therefore vary.
1.4 Genetics
TSC is autosomal dominantly inherited, but more than 50 % of patients with
TSC have sporadic mutations (Verhoef et al., 1999). TSC is genetically
heterogeneous, meaning that a defect in one of two genes (TSC1 and TSC2) and
their products (hamartin and tuberin, respectively) cause the disorder. In 1993 the
TSC2 gene was identified on chromosome 16p13.3 (European Chromosome 16
Tuberous Sclerosis Consortium, 1993) and TSC1 followed in 1997 on chromosome
9q34.3 (van Slegtenhorst et al., 1997). TSC1 spans 45 kb of genomic DNA and
contains 23 exons. The TSC2 genomic DNA is 43 kb long and consists of 41 exons.
The location of TSC2 is particularly interesting. It is located directly next to the
gene affected in polycystic kidney disease, PKD-1, and kidney cysts are also one of
the possible clinical features of TSC (European Chromosome 16 Tuberous Sclerosis
Consortium, 1993). PKD-1 lies directly centromeric to TSC2 and the genes are
separated by only 60 base pairs. Another neighbor of TSC2 on chromosome 16 is
CYLD-1 at 16q12-13, which, when mutated, results in autosomal dominant
cylindromatosis (Verhoef et al., 1998). CYLD causes skin lesions clinically similar to
the typical TSC facial angiofibromas. These diseases, in some cases clinically very
similar to TSC, further complicate the diagnosis of this complex.
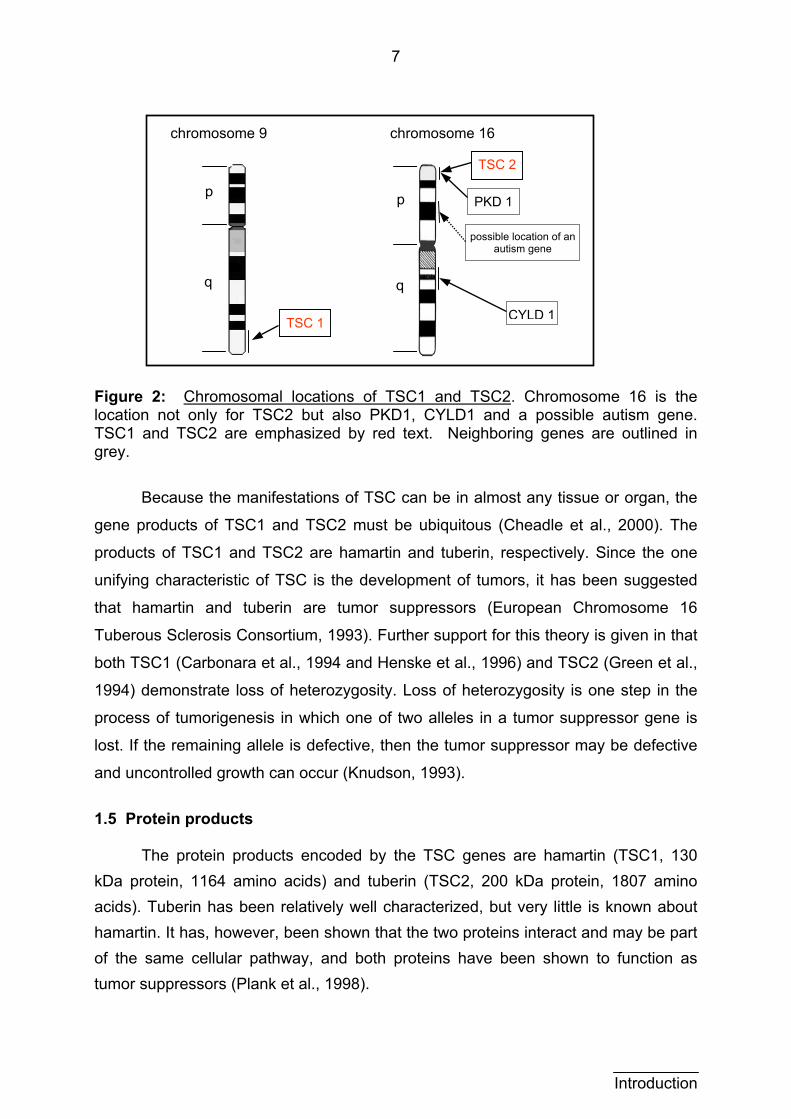
Recent initial evidence for the location of genes that might be involved in
autism also revealed linkage to chromosome 16p near TSC2 (International Molecular
Genetic Study of Autism Consortium, 1998). Autism and other psychiatric and
behavioral disorders including attention deficit hyperactivity disorder, aggression and
anxiety are often comorbid with TSC (Smalley, 1998). The chromosomal locations of
TSC1 and TSC2 can be seen in figure 2.
Introduction
7
chromosome 9
TSC 2
PKD 1
chromosome 16
TSC 1
p
q
CYLD 1
p
q
possible location of an autism gene
Figure 2: Chromosomal locations of TSC1 and TSC2. Chromosome 16 is the location not only for TSC2 but also PKD1, CYLD1 and a possible autism gene. TSC1 and TSC2 are emphasized by red text. Neighboring genes are outlined in grey.
Because the manifestations of TSC can be in almost any tissue or organ, the
gene products of TSC1 and TSC2 must be ubiquitous (Cheadle et al., 2000). The
products of TSC1 and TSC2 are hamartin and tuberin, respectively. Since the one
unifying characteristic of TSC is the development of tumors, it has been suggested
that hamartin and tuberin are tumor suppressors (European Chromosome 16
Tuberous Sclerosis Consortium, 1993). Further support for this theory is given in that
both TSC1 (Carbonara et al., 1994 and Henske et al., 1996) and TSC2 (Green et al.,
1994) demonstrate loss of heterozygosity. Loss of heterozygosity is one step in the
process of tumorigenesis in which one of two alleles in a tumor suppressor gene is
lost. If the remaining allele is defective, then the tumor suppressor may be defective
and uncontrolled growth can occur (Knudson, 1993).
1.5 Protein products
The protein products encoded by the TSC genes are hamartin (TSC1, 130 kDa protein, 1164 amino acids) and tuberin (TSC2, 200 kDa protein, 1807 amino acids). Tuberin has been relatively well characterized, but very little is known about hamartin. It has, however, been shown that the two proteins interact and may be part of the same cellular pathway, and both proteins have been shown to function as tumor suppressors (Plank et al., 1998).
Introduction
8
Tuberin is highly conserved among vertebrates including primate, rodent, marsupial and reptile with little homology from fish or nonvertebrate species (European Chromosome 16 Tuberous Sclerosis Consortium, 1993). Tuberin expression is ubiquitous, however, it varies as a function of development (Geist and Gutmann, 1995).
Evidence has been given that tuberin plays a role in cell cycle control. For example, the loss of TSC2 induces quiescent cells to enter the S phase, and prevents active cells from entering G0 (Soucek et al., 1997). Similar results have been produced in a Drosophila model with gigas, the homologue of TSC2. The gigas mutant cells grown were enlarged and repeated S phase without entering M phase (Ito and Rubin, 1999).
Additional evidence that tuberin might be involved in cell cycle control is its
homology to the Ras-related GTPase activating proteins (GAPs) Rap1GAPs
(Wienecke et al., 1995). The Ras family of GAPs are known tumor suppressors. They
regulate the receptors of growth factors, for example. GAPs activate the intrinsic
GTPase of the GTP-binding proteins, keeping them in the inactive GDP-bound state.
These GTPases regulate mitogenic signal transduction pathways and thus are critical
players in controlling the proliferation of many cell types (Lewin, 1998). Mutations in
the genes coding for these regulator proteins lead to the formation of tumors in
various tissues. The homology of TSC2 to this family of tumor suppressor genes
suggests that tuberin has a similar function.
It has furthermore been demonstrated that tuberin possesses specific GAP
activity. When tuberin is incubated with [γ-32P] GTP-bound recombinant Rap1a,
Rap2, Ras and Rho, significant GAP activity toward these proteins is exhibited
(Wienecke et al., 1995). Co-localization of tuberin to Rap1 in the Golgi apparatus
provides additional support for the theory that tuberin plays a role in the catalytic
activity of Rap1 (Wienecke et al., 1996).
Hamartin, the protein product of TSC1, has been less intensely studied than
tuberin, in part because TSC1 was identified four years later. No homology with other
known vertebrate proteins has been shown, but a possible match to a yeast protein
has been detected suggesting that it might participate in eukaryotic cell growth
regulation (van Slegtenhorst et al., 1997).
Hamartin also has no homology to tuberin, but it seems to interact with and is
also localized near tuberin in cytoplasmatic vesicles -- indicating that they are
partners in a common cellular pathway. Although they are shown to interact and co-
Introduction
9
localize, hamartin is also expressed in Eker rat tumor cells (ERC18M) that lack
functional tuberin. This suggests that hamartin is not dependent on functional tuberin.
In spite of this, hamartin may require a part of tuberin for its stability. This means that
the presence of a tuberin fragment might suffice for hamartin to function normally.
(summarized in Plank et al., 1998)
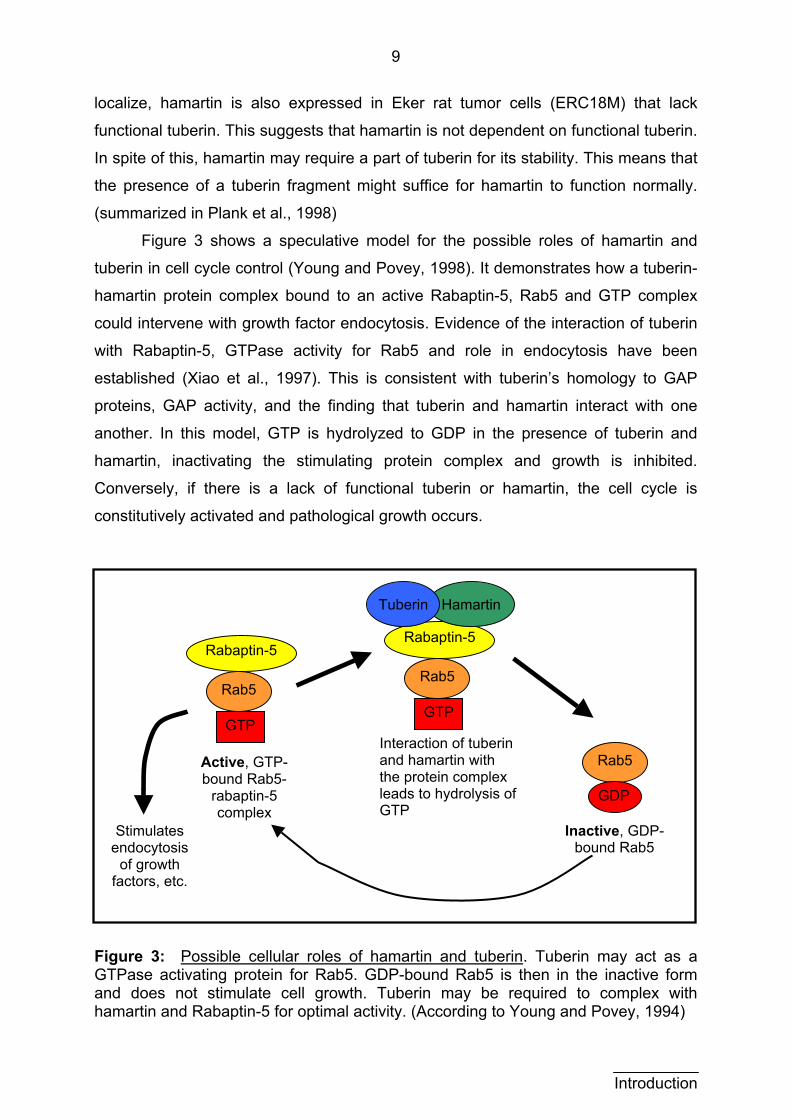
Figure 3 shows a speculative model for the possible roles of hamartin and
tuberin in cell cycle control (Young and Povey, 1998). It demonstrates how a tuberin-
hamartin protein complex bound to an active Rabaptin-5, Rab5 and GTP complex
could intervene with growth factor endocytosis. Evidence of the interaction of tuberin
with Rabaptin-5, GTPase activity for Rab5 and role in endocytosis have been
established (Xiao et al., 1997). This is consistent with tuberin’s homology to GAP
proteins, GAP activity, and the finding that tuberin and hamartin interact with one
another. In this model, GTP is hydrolyzed to GDP in the presence of tuberin and
hamartin, inactivating the stimulating protein complex and growth is inhibited.
Conversely, if there is a lack of functional tuberin or hamartin, the cell cycle is
constitutively activated and pathological growth occurs.
Active, GTP-bound Rab5-
rabaptin-5 complex
Inactive, GDP-bound Rab5
Stimulates endocytosis
of growth factors, etc.
Interaction of tuberin and hamartin with the protein complex leads to hydrolysis of GTP
GDP
Rab5
Rabaptin-5
Rab5
GTP
Tuberin Hamartin
Rabaptin-5
Rab5
GTP
Figure 3: Possible cellular roles of hamartin and tuberin. Tuberin may act as a GTPase activating protein for Rab5. GDP-bound Rab5 is then in the inactive form and does not stimulate cell growth. Tuberin may be required to complex with hamartin and Rabaptin-5 for optimal activity. (According to Young and Povey, 1994)
Introduction
10
Despite these advances in protein characterization, much remains unknown
about the TSC1 and TSC2 protein products. The three dimensional protein structures
have not yet been elucidated, and the exact role of these players in the complex
disease process is unclear. Evidence for the importance of various protein regions is
gradually being revealed, but until significantly more progress is accomplished, the
diagnosis and treatment of TSC remains founded in clinical and symptomatic
measures.
1.6 The clinical variability predicament
Although the exact role of hamartin and tuberin is not known in full detail, it is
clear that either a mutation in TSC1 or TSC2 causes the disease tuberous sclerosis.
This does not, however, explain the broad variation in clinical manifestations of the
disease. Furthermore, most mutational studies find a mutation in TSC1 or TSC2 in
only about two thirds of patients with definite TSC disease (Au et al., 1998, Jones et
al., 1999b, Zhang et al., 1999, Langkau et al., 2002 and others).
Possible explanations for this apparent discrepancy include the existence of a
third allele, the high rate of mosaicism in TSC and the Knudson Two-Hit-Hypothesis.
The existence of a third allele seems at present very improbable, as intense studies
over several years have not yielded a third site for TSC and half of TSC families
show linkage to TSC1 and half to TSC2 (Cheadle et al., 2000). Mosaicism, the
condition in which only a portion of somatic and germ line cells contain a mutation
(Lewin, 1998), is very feasible. Cases of mosaicism in TSC have been described,
and this can greatly complicate clinical and genetic analysis (Kwiatowska et al.,
1999). Knudson’s Two-Hit-Hypothesis describes the process of tumorigenesis and
the possible role of tumor suppressor genes (Knudson, 1971) and also provides a
good explanation for the high clinical variability of TSC (see section 4.3.3, figure 11).
The two hit hypothesis refers to the loss of both alleles of a gene in order for
the sick phenotype to occur. The loss of the first allele can occur very early or be
inherited. Depending on when and where the second loss (second hit) occurs, the
phenotype of the TSC patient can be very variable. If the loss occurs early, for
example during cellular differentiation, then a larger number of cells or even tissues
can be affected. The loss in a later, more differentiated cell, would then affect only
this tissue. Milder forms of TSC can therefore be explained by later occurrence of
second hits.
Introduction
11
Mild forms of TSC may also bias statistics concerning penetrance and
reproductive fitness. Cases of minimal expression and non-penetrance have been
reported, in particular upon meticulous re-examination of seemingly unaffected
parents of a TSC diagnosed child (Webb and Osbourne, 1991). Persons with very
mild forms of TSC have no reduction in reproductive fitness and it has been
postulated that these cases usually involve the TSC1 locus (Langkau et al., 2002).
This might explain why only about 10 % of sporadic cases have been found to
involve TSC1 (Janssen et al., 1994 and Povey et al., 1994), while half of the families
with TSC show mutations in TSC1 and the other half in TSC2 (Cheadle et al., 2000).
Initial reports that TSC lesions may be able to metastasize have recently been
published. Sporadically occurring lymphangioleiomyomatosis of lung was recently
brought into connection with the occurrence of renal angiomyolipomas, proposing a
model involving the spread of smooth muscle cells from the angiomyolipoma to the
lung (Carsillo et al., 2000). Also, a variant epithelial form of angiomyolipoma has
been reported, which demonstrated unusually malignant qualities including
metastases (Martignoni et al., 2000). Although as yet far from proven, a model
involving possible metastasizing of TSC lesions opens new possibilities for explaining
varying localizations of TSC manifestations.
1.7 The Freiburg-Heidelberg project
In the Freiburg-Heidelberg project, the University of Freiburg Children’s
Hospital and the Institute for Human Genetics in Heidelberg cooperated to screen
TSC patients and their families for mutations in the TSC1 and TSC2 genes. An
uncommonly large pool of TSC patient and relative blood samples (over 300) had
been accumulated since 1994. In addition to the advantage of a very large sample
size, the patient information and blood samples were collected from not only several
regions but also several countries thus counteracting any possible regional bias.
Complete screening of all exons of both genes in two centers was a lengthy
process that was only recently completed (Langkau et al., 2002). The detection of
large mutations and the screening of TSC1 and exons 1-19 of TSC2 for small
mutations were pursued in Heidelberg. TSC2 exons 20-41 were examined in
Freiburg. The number of mutations, type, location and size was compared to
previously published studies.
Introduction
12
Introduction
This dissertation deals with the results of the TSC screening project in exons
30, 34, 36 and 38 - 40 of TSC2, including the region of GAP homology of TSC2
(exons 34 to 38). An additional population of healthy probands was subjected to
mutational analysis in exon 40 of TSC2 as a control group to study the variability of
TSC2 in an unaffected population.
1.8 Objectives and research questions
What mutations do the TSC patients demonstrate in the final exons of the
TSC2 gene (the regions of GAP homology)?
The goal of this study was to screen TSC patient DNA for variations and to
analyze the sequence for mutational diagnosis as part of the Freiburg-Heidelberg
Project. It was expected that a relatively large amount of mutations would be found in
the final (5') exons of the TSC2 gene, as a number of these were within the region of
known GAP homology (Wienecke et al., 1995). This region is presumably important
for the function of the protein product (Wienecke et al., 1996), which is assumed to
be defective in TSC patients. The exons examined here were 30, 34, 36 and 38 - 40
of TSC2. These exons were amplified via PCR (polymerase chain reaction),
screened via SSCP (single strand conformational polymorphism), sequenced by
external commission and analyzed by hand.
How much variation is in the healthy TSC2 gene, and how do the types of
variations found compare with the patient group?
An additional group of healthy patients was chosen for mutational analysis in
one exon as the control population. Exon 40 was chosen as the target of this initial
screening. It was an exon in which our group had discovered several variations in the
patient group, and it was the exon chosen for quality control analysis. This means
that all samples of exon 40 were sequenced, allowing for a more complete screening
for better comparison between the patient and healthy populations.
The findings of the patient group were compared with those of previous
studies and it was speculated, that a genotype-phenotype correlation would be
found. These findings were also weighed against those of the healthy population so
as to bring the known mutations in the patient group into proper context. No genetic
analysis of healthy probands has as yet been published, and it was considered
important to examine a control group for this study.
13
2 Materials and Methods
2.1 Materials
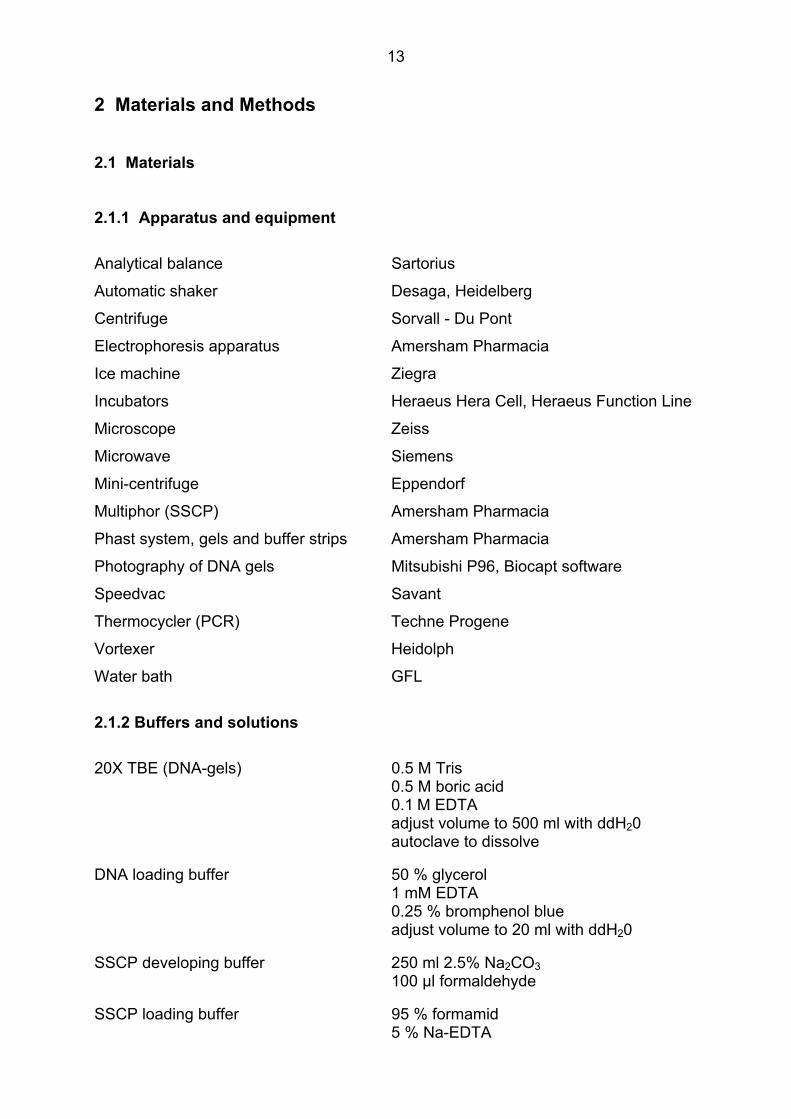
2.1.1 Apparatus and equipment
Analytical balance Sartorius
Automatic shaker Desaga, Heidelberg
Centrifuge Sorvall - Du Pont
Electrophoresis apparatus Amersham Pharmacia
Ice machine Ziegra
Incubators Heraeus Hera Cell, Heraeus Function Line
Microscope Zeiss
Microwave Siemens
Mini-centrifuge Eppendorf
Multiphor (SSCP) Amersham Pharmacia
Phast system, gels and buffer strips Amersham Pharmacia
Photography of DNA gels Mitsubishi P96, Biocapt software
Speedvac Savant
Thermocycler (PCR) Techne Progene
Vortexer Heidolph
Water bath GFL
2.1.2 Buffers and solutions
20X TBE (DNA-gels) 0.5 M Tris 0.5 M boric acid 0.1 M EDTA adjust volume to 500 ml with ddH20 autoclave to dissolve
DNA loading buffer 50 % glycerol 1 mM EDTA 0.25 % bromphenol blue adjust volume to 20 ml with ddH20
SSCP developing buffer 250 ml 2.5% Na2CO3 100 µl formaldehyde
SSCP loading buffer 95 % formamid 5 % Na-EDTA
14
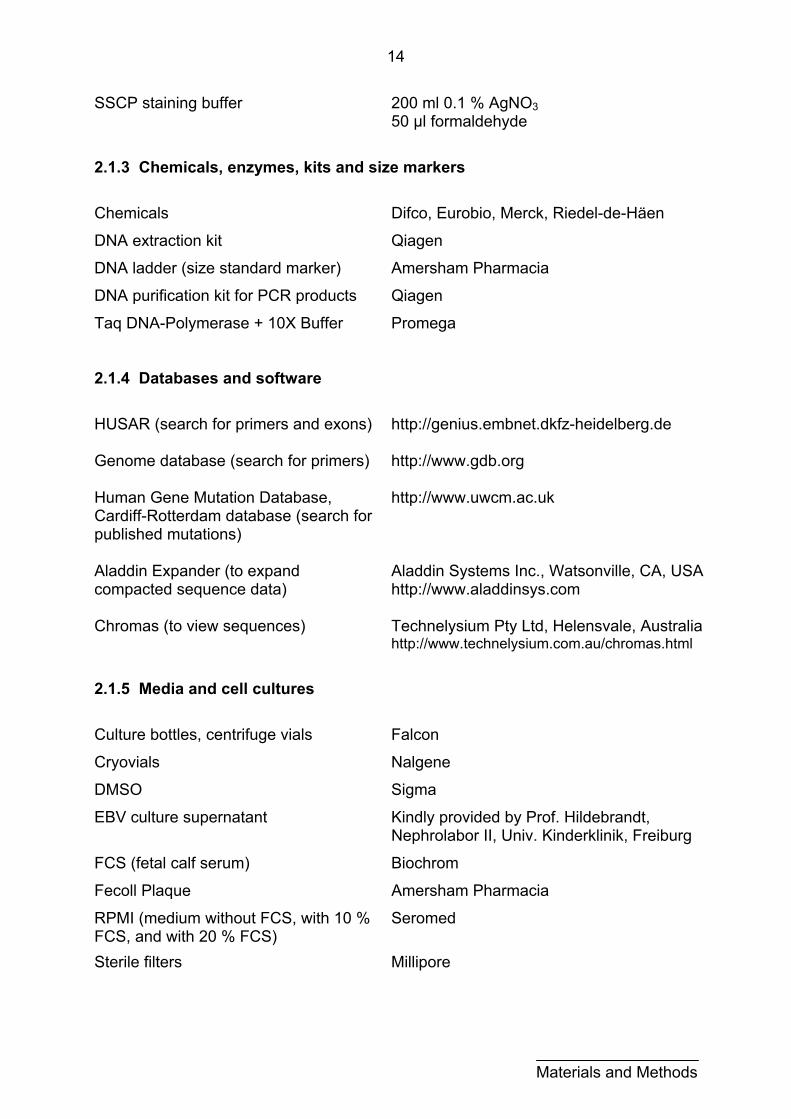
SSCP staining buffer 200 ml 0.1 % AgNO3 50 µl formaldehyde
2.1.3 Chemicals, enzymes, kits and size markers
Chemicals Difco, Eurobio, Merck, Riedel-de-Häen
DNA extraction kit Qiagen
DNA ladder (size standard marker) Amersham Pharmacia
DNA purification kit for PCR products Qiagen
Taq DNA-Polymerase + 10X Buffer Promega
2.1.4 Databases and software
HUSAR (search for primers and exons) http://genius.embnet.dkfz-heidelberg.de
Genome database (search for primers) http://www.gdb.org
Human Gene Mutation Database, Cardiff-Rotterdam database (search for published mutations)
http://www.uwcm.ac.uk
Aladdin Expander (to expand compacted sequence data)
Aladdin Systems Inc., Watsonville, CA, USA http://www.aladdinsys.com
Chromas (to view sequences) Technelysium Pty Ltd, Helensvale, Australia http://www.technelysium.com.au/chromas.html
2.1.5 Media and cell cultures
Culture bottles, centrifuge vials Falcon
Cryovials Nalgene
DMSO Sigma
EBV culture supernatant Kindly provided by Prof. Hildebrandt, ephrolabor II, Univ. Kinderklinik, Freiburg N
FCS (fetal calf serum) Biochrom
Fecoll Plaque Amersham Pharmacia
RPMI (medium without FCS, with 10 % FCS, and with 20 % FCS)
Seromed
Sterile filters Millipore
Materials and Methods
15
2.1.6 Oligonucleotides and DNA-sequencing
HPLC purified oligonucleotides Gene Scan (Big Biotech)
Primer sources • Literature (Northrup et al., genome data base)• Sequence search (HUSAR database) and
Gerd Wiegele
Sequencing Seqlab (Göttingen) and CORE-Facility (Freiburg) 2.2 Methods 2.2.1 Probands
The source of DNA for this study was from two groups of probands; one
population of TSC patients and their families, and one healthy population.
2.2.1.1 TSC patients and families
Blood samples from TSC patients have been collected in Freiburg and
Heidelberg since 1994. Patients were German, Austrian or from the Czech Republic.
It was requested that each attending physician send a completed TSC clinical
evaluation form and also blood samples from all available relatives. Of the more than
300 patients in our pool, the first 86 patients and their families were selected for this
study whose physician had completed a clinical evaluation and a definitive TSC
diagnosis was made. 70 of these 86 patients were completely screened in both
Freiburg and Heidelberg.
2.2.1.2 Healthy population
Healthy genomic DNA samples were provided for analysis by Dr. Klaus
Deichmann from the department of Zentrale Klinische Forschung in Freiburg. DNA
was isolated from the peripheral blood of various healthy volunteers (mostly
students), who represented a relatively heterogeneous population, as they were not
all from the same geographical region or family (K. Deichmann, personal
communication). 25 specimens from these healthy DNA samples were randomly
selected for the control group in this study.
Materials and Methods
16
2.2.2 Cell culture and transformation from peripheral blood samples
Peripheral blood mononuclear cells are transformed with EBV in order to
increase the rate of cell divisions and therefore facilitate cultivation. A greater cell
count is achieved and thereby a greater amount of DNA can be harvested.
Procedure:
4-6 ml of RPMI was added to 2-3 ml of peripheral blood (collected in Na-
heparin or NH4-heparin vials) and mixed well. The blood-medium mixture was gently
layered over 9 ml Ficoll-Plaque in a 50 ml Falcon tube and centrifuged at 1500-1800
rpm for 30 min. (without break). Approximately 6 ml of supernatant were then slowly
aspirated and discarded. The white leukocyte ring was then cautiously aspirated and
saved in a 50 ml Falcon tube. 10 ml RPMI with 10 % FCS were added to the
leukocytes and recentrifuged at 1500-1800 rpm for 10 min. The supernatant was
discarded and the pellet was resuspended in RPMI with 10 % FCS. This was again
centrifuged at 1500-1800 rpm for 10 min. and the supernatant was again discarded.
5 ml supernatant of an L922-EBV culture was harvested and sterile filtered. 2
ml of this and 2 ml of RPMI with 20 % FCS were added to the cell pellet. The pellet
was resuspended and incubated in culture flasks. This portion of the procedure was
always prepared to yield a double amount.
After 24-48 h of incubation (at 37°C, 7.5 % CO2), 1 ml of medium was carefully
aspirated and 3 ml RPMI were added to the culture. The medium was renewed once
every week as follows: 2 ml of cell suspension were removed and 3 ml of RPMI with
20 % FCS were added. After the indicating buffer in the medium changed color from
red to yellow, RPMI with 10 % FCS was used and renewed as needed.
2.2.3 Freezing of cells Procedure for cultured, transformed leukocytes:
The medium was carefully aspirated from two full culture flasks and discarded.
The cells were transferred to a 50 ml Falcon tube, which was subsequently filled with
RPMI (10 % FCS) and centrifuged at 1200 rpm for 10 min. The supernatant was
discarded and 7 ml of cold FCS with 10 % sterile DMSO were added to the pellet and
mixed well. This cell suspension was distributed into 4 cryovials, placed in a cooled
cryo-box and frozen at -70 °C for 24 h. The cryovials were then transferred to a
liquid nitrogen tank for storage. Materials and Methods
17
Procedure for whole blood:
1.8 ml of each sample of peripheral blood collected in either Na-heparin or
NH4-heparin was set aside before transformation with EBV. This was added to a
cryovial containing 200 µl of sterile DMSO and mixed well. The cryovials were then
placed in a cooled cryo-box and frozen at -70 °C. After 24 h they were transferred to
a liquid nitrogen tank for storage.
2.2.4 DNA extraction
Leukocyte suspensions (or alternatively whole blood in DMSO) frozen in liquid
nitrogen were defrosted at room temperature and DNA was extracted according to
the Qiagen Genomic Tip Protocol:
Leukocyte suspensions were poured into a 15 ml Falcon tube and centrifuged
at 4500 rpm for 5-10 min at 20 °C. The supernatant was discarded. The cells were
resuspended with 2 ml ice cold PBS and recentrifuged. This step was repeated one
more time, then the leukocytes were resuspended with 2 ml of C1 buffer and 6 ml of
cold ddH20 and incubated on ice for 10 min.
Cells from whole blood samples in DMSO were poured into 15 ml Falcon
tubes, directly centrifuged, resuspended with 2 ml of C1buffer and 6 ml of cold ddH20
and then incubated on ice for 10 min.
Continued procedure for either leukocyte suspensions or cells from whole blood samples in DMSO:
After lysis, the samples were centrifuged at 3500 rpm for 15 min. at 4 °C, and
the supernatant was discarded. The pellet was resuspended with 1 ml cold C1 buffer
and 3 ml ddH2O, and then recentrifuged. This time the pellet was resuspended with 5
ml of G2 buffer, and 95 µl of QIAGEN protease or Proteinase K was added. This
mixture was incubated in a water bath at 50 °C over night.
On the next day, the QIAGEN genomic tip 100/G columns were equilibrated
with 4 ml of QBT buffer. Each incubated sample was vortexed to resuspend and was
immediately applied to a column. The column was then washed twice with 7.5 ml of
QC buffer. DNA was eluted into 15 ml Falcon tubes with 5 ml of QF buffer that was
warmed to 50 °C in the water bath. The DNA was then precipitated with 3.5 ml
isopropanol, vortexted to mix well, and centrifuged at 8000 rpm and 4 °C for 30-35
min. The supernatant was discarded and the pellet was washed with 2 ml of ice cold Materials and Methods
18
70 % ethanol, vortexed to resuspend and centrifuged again at 8000 rpm and 4 °C for
15 min. The supernatant was discarded and the tubes were allowed to dry for
approx. 15 min. The extracted DNA was resuspended in 500 µl ddH2O, allowed to
dissolve over night at 55 °C and stored at -20 °C in Eppendorf tubes.
2.2.5 PCR
PCR (polymerase chain reaction) was employed to selectively amplify each of
the exons in the TSC-2 gene. The amount of amplified product is so large that the
amount of template DNA is in comparison infinitely small and consequently
negligible. Nucleotides and other chemicals in each sample are also very small and
can be considered insignificant. Therefore each of the PCR products for each exon
could be analyzed via the SSCP method as described below.
First, sense and antisense primers were found for each exon (see table 2
below). These were chosen to be in a nearby intron sequence bordering each exon.
For best results the primers must have similar annealing temperatures (nearly the
same guanosine-cytidine nucleoside content) and should not be complementary to
each other to prevent the formation of primer-dimers. A standard PCR procedure
follows. In this basic protocol, the annealing temperature was varied according to the
annealing temperature of the primers; the annealing time, elongation time and
number of cycles were also varied to obtain an optimal product.
Procedure: reaction mix: 5 µl 10 X reaction buffer (contains 25 mM MgCl2)
5 % DMSO 200 µM dNTP mix 0.3 µM sense primer 0.3 µM antisense primer 1 Unit Taq polymerase 0.5 µg template DNA adjust to 50 µl with ddH2O
All ingredients except the template DNA were added to PCR vials and kept on
ice. The template DNA was added to the prepared vials as a final step -- the vials
were then briefly centrifuged and immediately placed in the programmed
thermocycler. As a negative control one sample was prepared with 5 µl ddH2O
instead of template DNA.
Materials and Methods
19
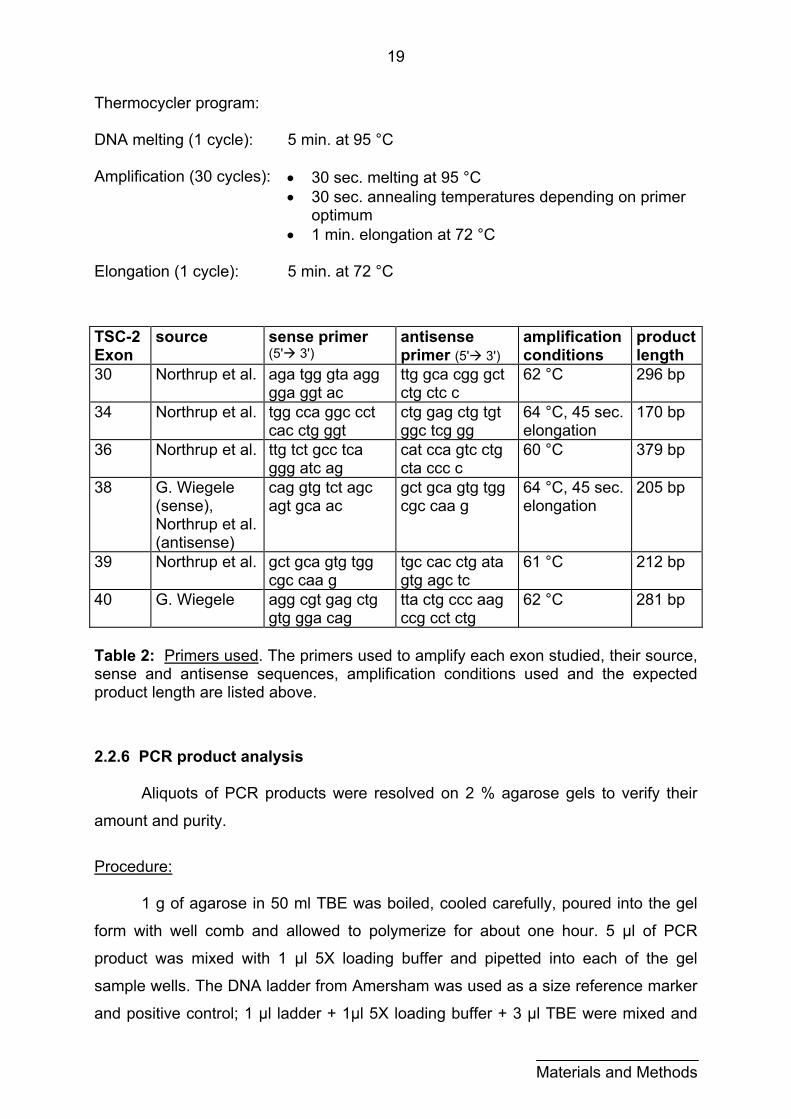
Thermocycler program: DNA melting (1 cycle): 5 min. at 95 °C
Amplification (30 cycles): • 30 sec. melting at 95 °C
• 30 sec. annealing temperatures depending on primer optimum
• 1 min. elongation at 72 °C
Elongation (1 cycle): 5 min. at 72 °C
TSC-2 Exon
source sense primer (5' 3')
antisense primer (5' 3')
amplification conditions
product length
30 Northrup et al. aga tgg gta agg gga ggt ac
ttg gca cgg gct ctg ctc c
62 °C 296 bp
34 Northrup et al. tgg cca ggc cct cac ctg ggt
ctg gag ctg tgt ggc tcg gg
64 °C, 45 sec. elongation
170 bp
36 Northrup et al. ttg tct gcc tca ggg atc ag
cat cca gtc ctg cta ccc c
60 °C 379 bp
38 G. Wiegele (sense), Northrup et al. (antisense)
cag gtg tct agc agt gca ac
gct gca gtg tgg cgc caa g
64 °C, 45 sec. elongation
205 bp
39 Northrup et al. gct gca gtg tgg cgc caa g
tgc cac ctg ata gtg agc tc
61 °C 212 bp
40 G. Wiegele agg cgt gag ctg gtg gga cag
tta ctg ccc aag ccg cct ctg
62 °C 281 bp
Table 2: Primers used. The primers used to amplify each exon studied, their source, sense and antisense sequences, amplification conditions used and the expected product length are listed above.
2.2.6 PCR product analysis
Aliquots of PCR products were resolved on 2 % agarose gels to verify their
amount and purity.
Procedure:
1 g of agarose in 50 ml TBE was boiled, cooled carefully, poured into the gel
form with well comb and allowed to polymerize for about one hour. 5 µl of PCR
product was mixed with 1 µl 5X loading buffer and pipetted into each of the gel
sample wells. The DNA ladder from Amersham was used as a size reference marker
and positive control; 1 µl ladder + 1µl 5X loading buffer + 3 µl TBE were mixed and
Materials and Methods
20
pipetted into one well. As a negative control, the negative PCR control (ddH2O in
stead of template DNA) was also applied to the gel; 5 µl product mixed with 1 µl 5X
loading buffer and pipetted into one well. 100 V were applied to the gel for 1 h.
The gel was then developed in a shaking bath of ethidium bromide for approx.
30 min. and a photograph was taken in UV-light to visualize bands of DNA.
Impure products were discarded and the PCR was repeated at a higher
annealing temperature and/or with fewer cycles. This step was repeated until single
bands were visualized. If no product was achieved, the annealing temperature was
reduced and/or more cycles were run. If pure product could not be achieved, a
different set of primers was used to try to amplify a pure product.
2.2.7 SSCP
SSCP (single strand conformational polymorphism) is a technique used to
detect small mutations, and is based on the migration of single stranded DNA
fragments in native gradient polyacrylamide gel electrophoresis. Individual variances
in a DNA sequence can be detected due to the varying banding patterns, which are
caused by the various DNA segment lengths and the formation of secondary
structures in the single stranded state. Varying banding patterns can be detected for
sequence variations as small as single base pair mutations. (summarized in Orita et
al., 1989)
Procedure:
The Phast system, ready-to-use gradient polyacrylamide gels and native buffer
strips from Amersham Pharmacia were used for gel electrophoresis.
Ready-to-use gels with buffer strips were placed in the Phast apparatus according
to the manufacturer’s instructions and pre run at 250 V and 100 Vh to equilibrate.
Meanwhile, 3 µl of PCR product were mixed with 3 µl of SSCP loading buffer and
denatured at 95 °C for 5 minutes in a thermocycler and immediately cooled on ice.
After the pre run, 4.5 µl of this denatured DNA sample was loaded onto the gel. The
electrophoresis was then run at 250 V and 300-600 Vh depending on the size and
nature of the PCR product. The length of the run (in Vh) and the temperature (5-15
°C) was varied for each exon, so that the bands could be visualized near the center
of the gradient gel for optimal separation. Conditions for each exon can be seen in
Materials and Methods
21
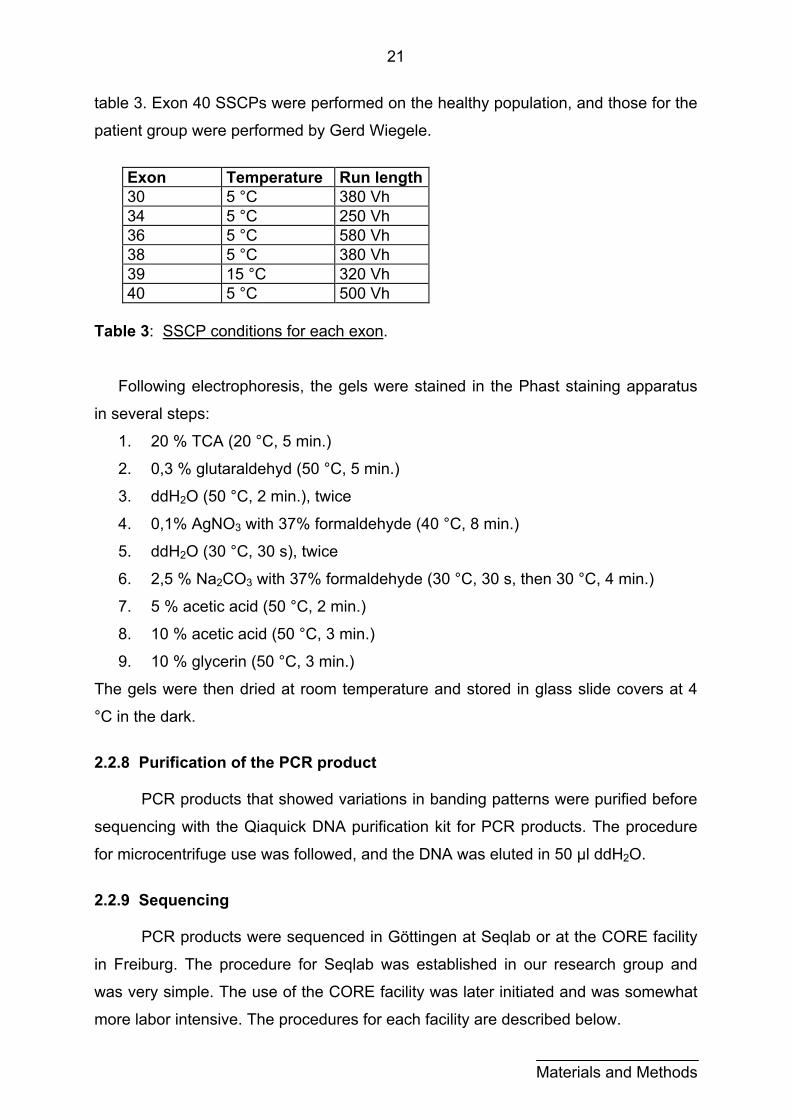
table 3. Exon 40 SSCPs were performed on the healthy population, and those for the
patient group were performed by Gerd Wiegele.
Exon Temperature Run length30 5 °C 380 Vh 34 5 °C 250 Vh 36 5 °C 580 Vh 38 5 °C 380 Vh 39 15 °C 320 Vh 40 5 °C 500 Vh
Table 3: SSCP conditions for each exon.
Following electrophoresis, the gels were stained in the Phast staining apparatus
in several steps:
1. 20 % TCA (20 °C, 5 min.)
2. 0,3 % glutaraldehyd (50 °C, 5 min.)
3. ddH2O (50 °C, 2 min.), twice
4. 0,1% AgNO3 with 37% formaldehyde (40 °C, 8 min.)
5. ddH2O (30 °C, 30 s), twice
6. 2,5 % Na2CO3 with 37% formaldehyde (30 °C, 30 s, then 30 °C, 4 min.)
7. 5 % acetic acid (50 °C, 2 min.)
8. 10 % acetic acid (50 °C, 3 min.)
9. 10 % glycerin (50 °C, 3 min.)
The gels were then dried at room temperature and stored in glass slide covers at 4
°C in the dark.
2.2.8 Purification of the PCR product
PCR products that showed variations in banding patterns were purified before
sequencing with the Qiaquick DNA purification kit for PCR products. The procedure
for microcentrifuge use was followed, and the DNA was eluted in 50 µl ddH2O.
2.2.9 Sequencing PCR products were sequenced in Göttingen at Seqlab or at the CORE facility
in Freiburg. The procedure for Seqlab was established in our research group and
was very simple. The use of the CORE facility was later initiated and was somewhat
more labor intensive. The procedures for each facility are described below.
Materials and Methods
22
Materials and Methods
Procedure for Seqlab, Göttingen:
Purified PCR products, sense and antisense primers were sent to Seqlab in
Göttingen for sequencing.
Procedure for CORE facility: PCR reaction mix: 5 µl of purified PCR product 1 µl of only either sense or antisense Primer 4 µl of Big Dye Mix (provided by CORE) Final volume adjusted to 20 µl Thermocycler program (25 cycles): 96 °C, 30 s 50 °C, 15 s 60 °C, 60 s
The reaction products were immediately cooled on ice after thermocycling.
Each product was placed in an autoclaved 1.5 ml Eppendorf tube for precipitation as
follows:
80 µl of 75 % isopropanol was added to 20 µl of product, vortexed to mix well
and let stand at room temperature for 15 min. The product was then centrifuged in a
microcentrifuge for 20 min at maximum speed. The supernatant was carefully
discarded. 250 µl of 75 % isopropanol was added to the pellet. This was again
vortexed to mix and then centrifuged at maximum speed for 5 min. The supernatant
was again carefully discarded and the pellet was dried for 10 to 15 min. in a vacuum
centrifuge. This product was stored at - 20 °C until it was sent to CORE.
2.2.10 Sequence analysis
Sequencing results were received electronically as compacted .sea files.
These files were expanded with the Aladdin expander program and visualized using
the Chromas program. The sequences were printed and interpreted by hand -- each
exon and splice region was read and compared to the wild-type sequence.
Sequences that were difficult to interpret were resequenced (depending on
occasional difficulty with a freshly produced and purified PCR product) or
reinvestigated in the Humangenetisches Institut in Heidelberg.
23
3 Results 3.1 Patient group 3.1.1 Amplification of exons
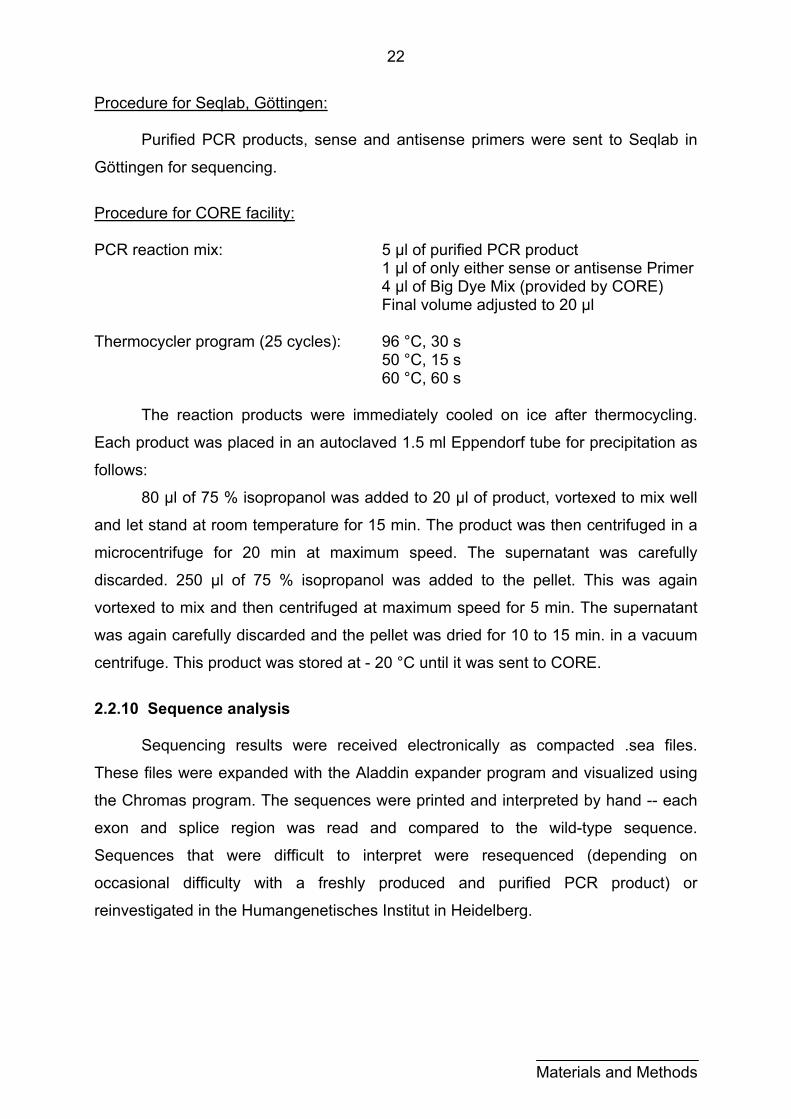
Exons 30, 34, 36, 38, 39, and 40 were amplified from genomic DNA for each
of the patients via PCR, according to methods described in section 2. The PCR
products were then separated on an agarose gel to determine their purity. The gel
depicted in figure 4 is an illustration of typical products -- exon 30, in this example. It
shows single, sharp bands at the size expected for the PCR product. The positive
control was the DNA size standard (lane one) and no bands appear in the lane of the
negative control (final lane). For examples of agarose gel results for each exon, see
figure 12 in the appendix. Some gels were photographed as negative images for
better visualization of faint bands. For the conditions used in each exon, see table 2
in the methods section 2.2.5.
300 bp
1 2 3 4 5 6 7 8 Figure 4: Sample PCR result, exon 30. Lane 1: DNA size standard (positive control). Lanes 2-7: PCR products (expected size = 296 bp, see table 2 in section 2.2.5). Lane 8: negative control.
3.1.2 Mutational screening
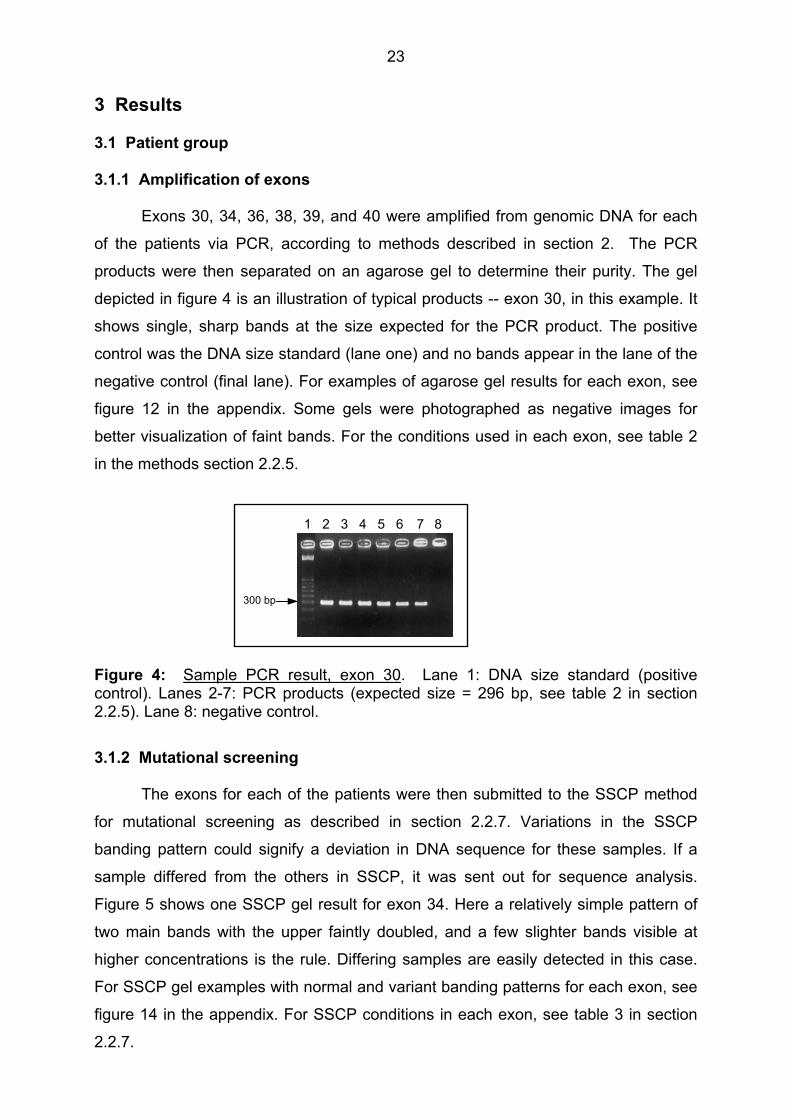
The exons for each of the patients were then submitted to the SSCP method
for mutational screening as described in section 2.2.7. Variations in the SSCP
banding pattern could signify a deviation in DNA sequence for these samples. If a
sample differed from the others in SSCP, it was sent out for sequence analysis.
Figure 5 shows one SSCP gel result for exon 34. Here a relatively simple pattern of
two main bands with the upper faintly doubled, and a few slighter bands visible at
higher concentrations is the rule. Differing samples are easily detected in this case.
For SSCP gel examples with normal and variant banding patterns for each exon, see
figure 14 in the appendix. For SSCP conditions in each exon, see table 3 in section
2.2.7.
24
143138128124122121117 111
extra bands
Figure 5: Sample SSCP result, exon 34. Conditions: 5 °C and 250 Vh run length. Patients 111 and 117 show variations in banding pattern.
Selecting samples for sequencing was often simple, when the SSCP banding
patterns showed obvious deviation. This can easily be seen in figure 5 in exon 34. In
some cases, however, complex banding patterns were difficult to screen. Exon 36,
for example, required careful scrutiny to see a missing band in patient 154 (figure 14,
appendix). At times a number of patients were manually selected for sequencing,
when a large group of seemingly identical patterns were revealed.
3.1.3 Sequencing results 3.1.3.1 Mutations
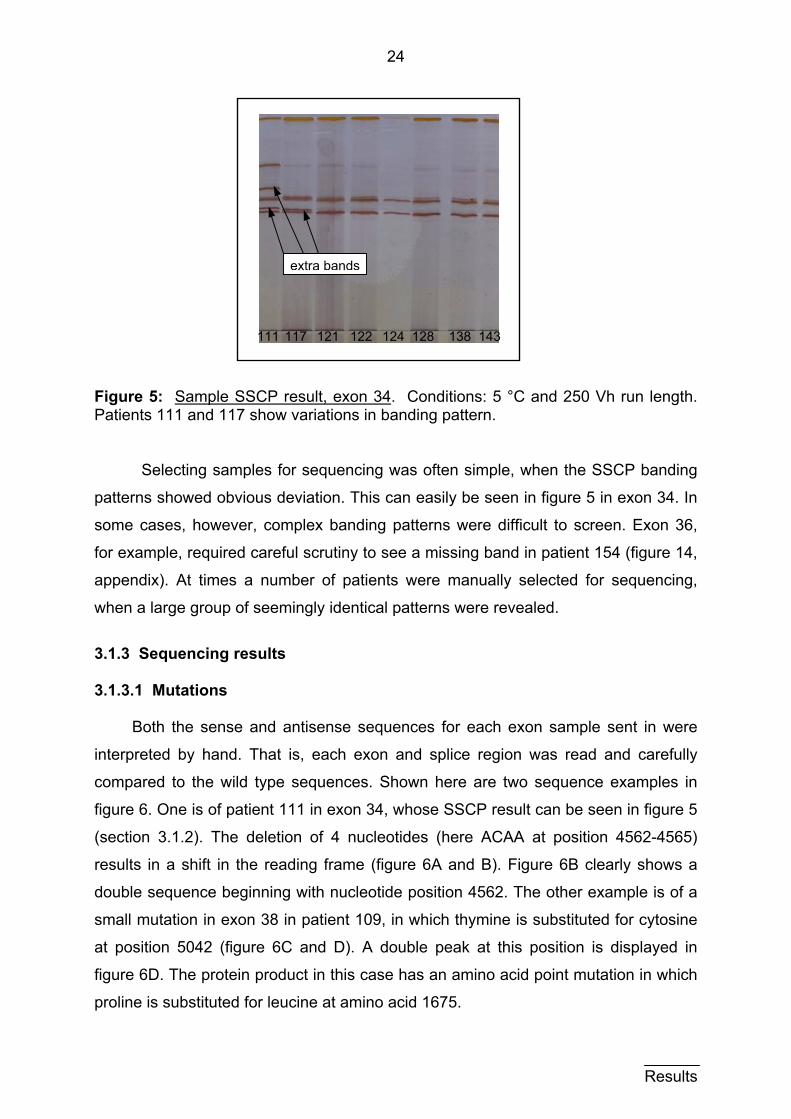
Both the sense and antisense sequences for each exon sample sent in were
interpreted by hand. That is, each exon and splice region was read and carefully
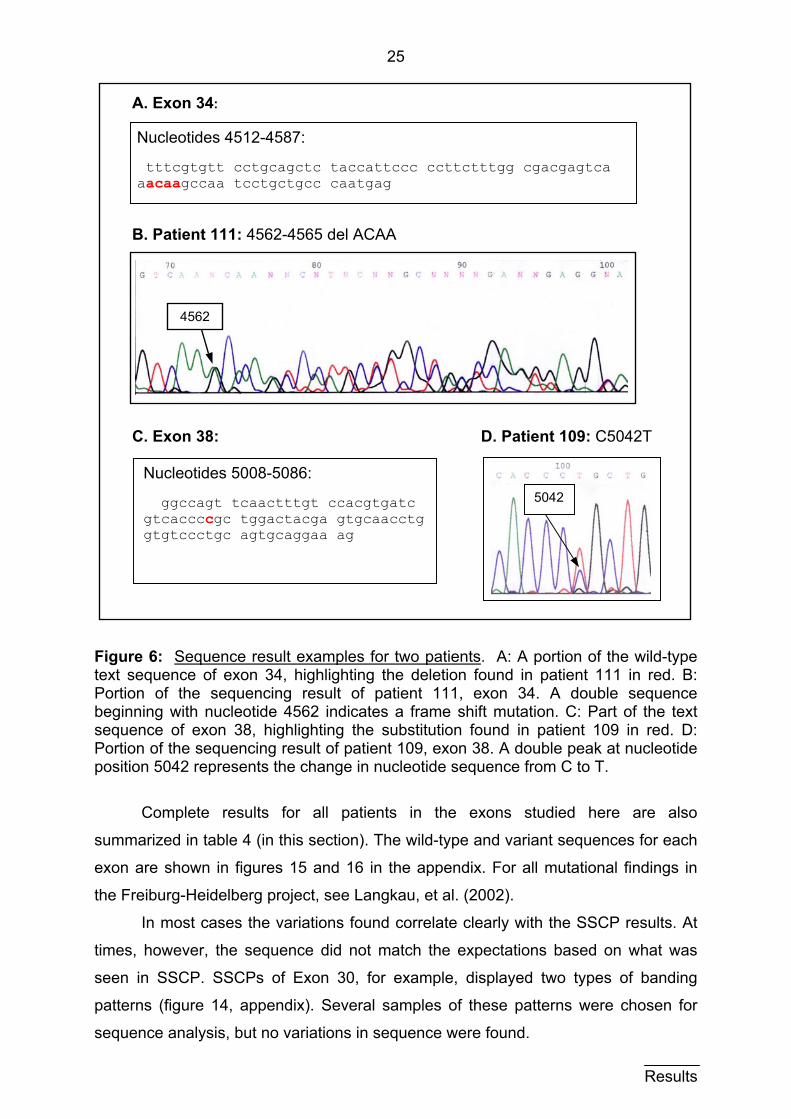
compared to the wild type sequences. Shown here are two sequence examples in
figure 6. One is of patient 111 in exon 34, whose SSCP result can be seen in figure 5
(section 3.1.2). The deletion of 4 nucleotides (here ACAA at position 4562-4565)
results in a shift in the reading frame (figure 6A and B). Figure 6B clearly shows a
double sequence beginning with nucleotide position 4562. The other example is of a
small mutation in exon 38 in patient 109, in which thymine is substituted for cytosine
at position 5042 (figure 6C and D). A double peak at this position is displayed in
figure 6D. The protein product in this case has an amino acid point mutation in which
proline is substituted for leucine at amino acid 1675.
Results
25
A. Exon 34:
B. Patient 111: 4562-4565 del ACAA C. Exon 38: D. Patient 109: C5042T
4562
5042
Nucleotides 5008-5086: ggccagt tcaactttgt ccacgtgatc gtcaccccgc tggactacga gtgcaacctg gtgtccctgc agtgcaggaa ag
Nucleotides 4512-4587: tttcgtgtt cctgcagctc taccattccc ccttctttgg cgacgagtca aacaagccaa tcctgctgcc caatgag
Figure 6: Sequence result examples for two patients. A: A portion of the wild-type text sequence of exon 34, highlighting the deletion found in patient 111 in red. B: Portion of the sequencing result of patient 111, exon 34. A double sequence beginning with nucleotide 4562 indicates a frame shift mutation. C: Part of the text sequence of exon 38, highlighting the substitution found in patient 109 in red. D: Portion of the sequencing result of patient 109, exon 38. A double peak at nucleotide position 5042 represents the change in nucleotide sequence from C to T.
Complete results for all patients in the exons studied here are also
summarized in table 4 (in this section). The wild-type and variant sequences for each
exon are shown in figures 15 and 16 in the appendix. For all mutational findings in
the Freiburg-Heidelberg project, see Langkau, et al. (2002).
In most cases the variations found correlate clearly with the SSCP results. At
times, however, the sequence did not match the expectations based on what was
seen in SSCP. SSCPs of Exon 30, for example, displayed two types of banding
patterns (figure 14, appendix). Several samples of these patterns were chosen for
sequence analysis, but no variations in sequence were found. Results
26
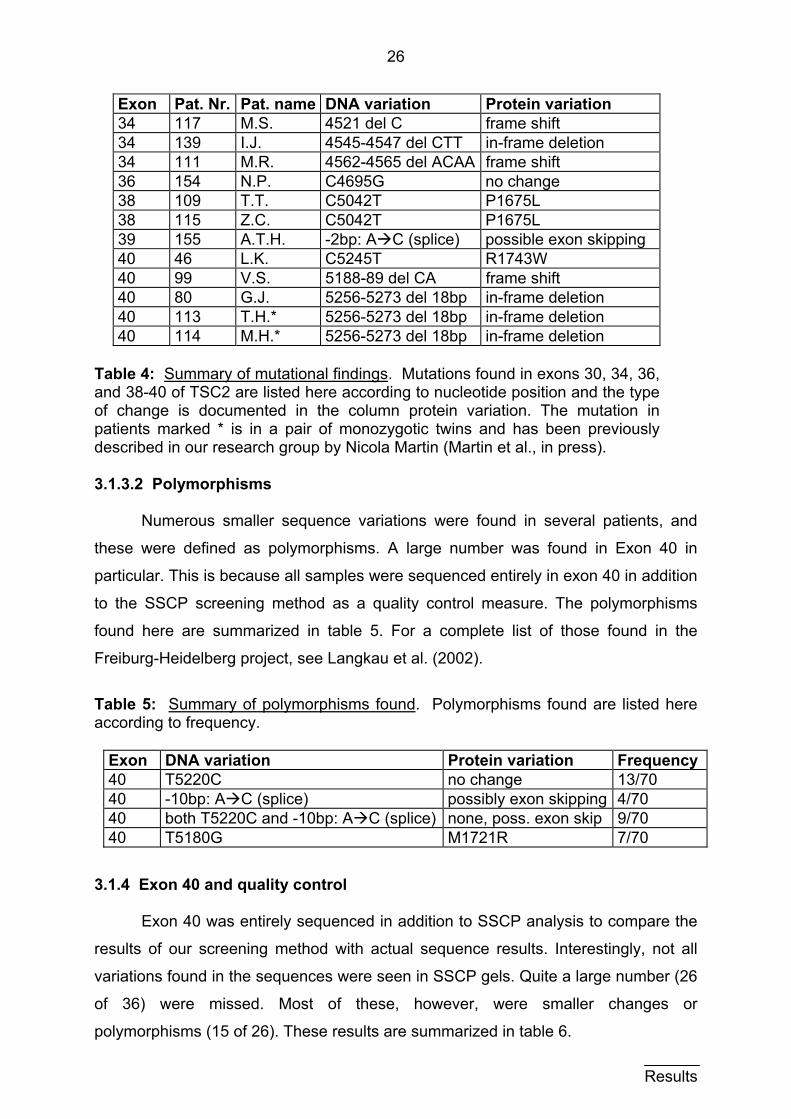
Exon Pat. Nr. Pat. name DNA variation Protein variation 34 117 M.S. 4521 del C frame shift 34 139 I.J. 4545-4547 del CTT in-frame deletion 34 111 M.R. 4562-4565 del ACAA frame shift 36 154 N.P. C4695G no change 38 109 T.T. C5042T P1675L 38 115 Z.C. C5042T P1675L 39 155 A.T.H. -2bp: A C (splice) possible exon skipping 40 46 L.K. C5245T R1743W 40 99 V.S. 5188-89 del CA frame shift 40 80 G.J. 5256-5273 del 18bp in-frame deletion 40 113 T.H.* 5256-5273 del 18bp in-frame deletion 40 114 M.H.* 5256-5273 del 18bp in-frame deletion
Table 4: Summary of mutational findings. Mutations found in exons 30, 34, 36, and 38-40 of TSC2 are listed here according to nucleotide position and the type of change is documented in the column protein variation. The mutation in patients marked * is in a pair of monozygotic twins and has been previously described in our research group by Nicola Martin (Martin et al., in press).
3.1.3.2 Polymorphisms
Numerous smaller sequence variations were found in several patients, and
these were defined as polymorphisms. A large number was found in Exon 40 in
particular. This is because all samples were sequenced entirely in exon 40 in addition
to the SSCP screening method as a quality control measure. The polymorphisms
found here are summarized in table 5. For a complete list of those found in the
Freiburg-Heidelberg project, see Langkau et al. (2002).
Table 5: Summary of polymorphisms found. Polymorphisms found are listed here according to frequency.
Exon DNA variation Protein variation Frequency40 T5220C no change 13/70 40 -10bp: A C (splice) possibly exon skipping 4/70 40 both T5220C and -10bp: A C (splice) none, poss. exon skip 9/70 40 T5180G M1721R 7/70
3.1.4 Exon 40 and quality control
Exon 40 was entirely sequenced in addition to SSCP analysis to compare the
results of our screening method with actual sequence results. Interestingly, not all
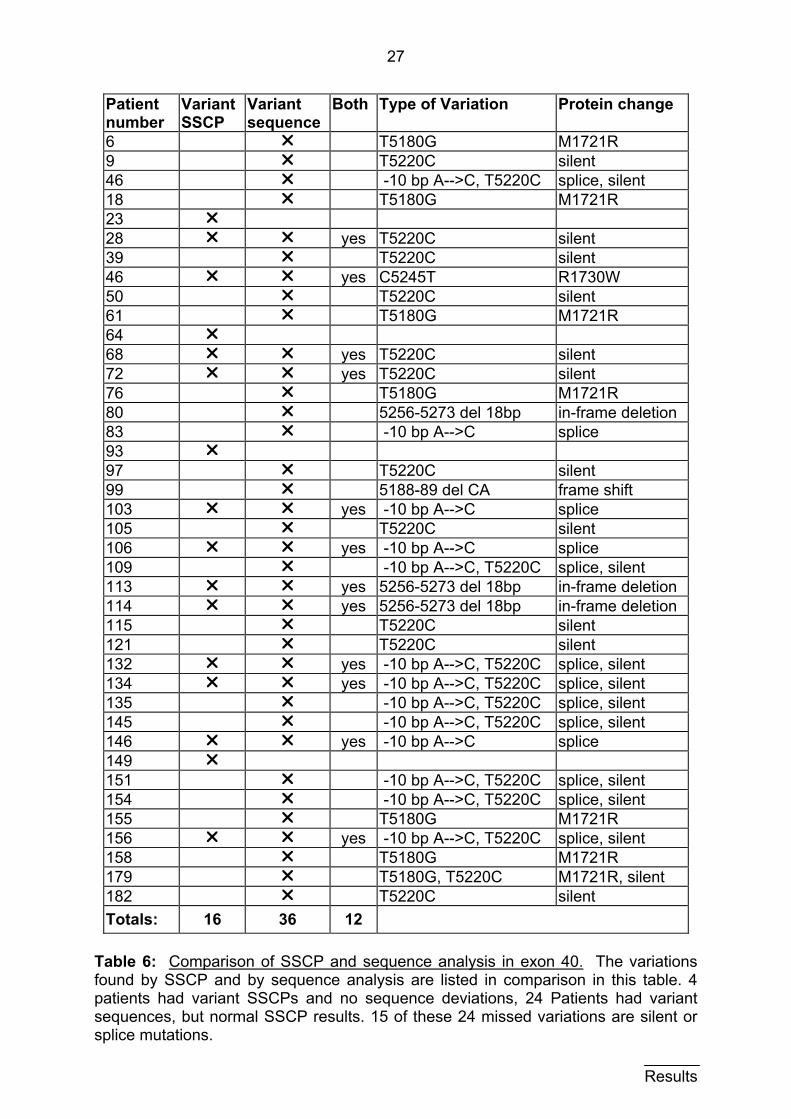
variations found in the sequences were seen in SSCP gels. Quite a large number (26
of 36) were missed. Most of these, however, were smaller changes or
polymorphisms (15 of 26). These results are summarized in table 6.
Results
27
Patient number
Variant SSCP
Variant sequence
Both Type of Variation Protein change
6 r T5180G M1721R 9 r T5220C silent 46 r -10 bp A-->C, T5220C splice, silent 18 r T5180G M1721R 23 r 28 r r yes T5220C silent 39 r T5220C silent 46 r r yes C5245T R1730W 50 r T5220C silent 61 r T5180G M1721R 64 r 68 r r yes T5220C silent 72 r r yes T5220C silent 76 r T5180G M1721R 80 r 5256-5273 del 18bp in-frame deletion 83 r -10 bp A-->C splice 93 r 97 r T5220C silent 99 r 5188-89 del CA frame shift 103 r r yes -10 bp A-->C splice 105 r T5220C silent 106 r r yes -10 bp A-->C splice 109 r -10 bp A-->C, T5220C splice, silent 113 r r yes 5256-5273 del 18bp in-frame deletion 114 r r yes 5256-5273 del 18bp in-frame deletion 115 r T5220C silent 121 r T5220C silent 132 r r yes -10 bp A-->C, T5220C splice, silent 134 r r yes -10 bp A-->C, T5220C splice, silent 135 r -10 bp A-->C, T5220C splice, silent 145 r -10 bp A-->C, T5220C splice, silent 146 r r yes -10 bp A-->C splice 149 r 151 r -10 bp A-->C, T5220C splice, silent 154 r -10 bp A-->C, T5220C splice, silent 155 r T5180G M1721R 156 r r yes -10 bp A-->C, T5220C splice, silent 158 r T5180G M1721R 179 r T5180G, T5220C M1721R, silent 182 r T5220C silent Totals:
16
36
12
Table 6: Comparison of SSCP and sequence analysis in exon 40. The variations found by SSCP and by sequence analysis are listed in comparison in this table. 4 patients had variant SSCPs and no sequence deviations, 24 Patients had variant sequences, but normal SSCP results. 15 of these 24 missed variations are silent or splice mutations. Results
28
Mutational screening of exon 40 in the patient group was performed by Gerd
Wiegele and the column of SSCP results shown in table 6 are based upon his
analysis of the samples.
3.2 Control group of healthy probands
A group of 25 healthy probands was screened for mutations in exon 40 of
TSC2. Since this exon appeared to have the highest density of mutations it was
chosen as the best candidate for comparison between healthy and affected
individuals. (See figure 9, section 3.3.) Another advantage was that the patient group
was entirely sequenced in exon 40, so that complete results were available for
comparison. (See section 3.1.4.) The control group was therefore also entirely
sequenced in exon 40 in addition to SSCP analysis.
3.2.1 Exon amplification
Exon 40 was amplified from genomic DNA for each of the healthy probands
via PCR according to methods described in section 2.2.5. These DNA samples were
kindly provided by Dr. Klaus Deichmann. The PCR products were then separated on
an agarose gel to determine their purity. These results are analogous to those for the
patient population in section 3.1.1. For an example of PCR results for the healthy
population, see figure 13, in the appendix.
3.2.2 Mutational screening
Once pure PCR products were obtained, these were separated on an SSCP
gel to determine, if there were variations in banding patterns that could signify a
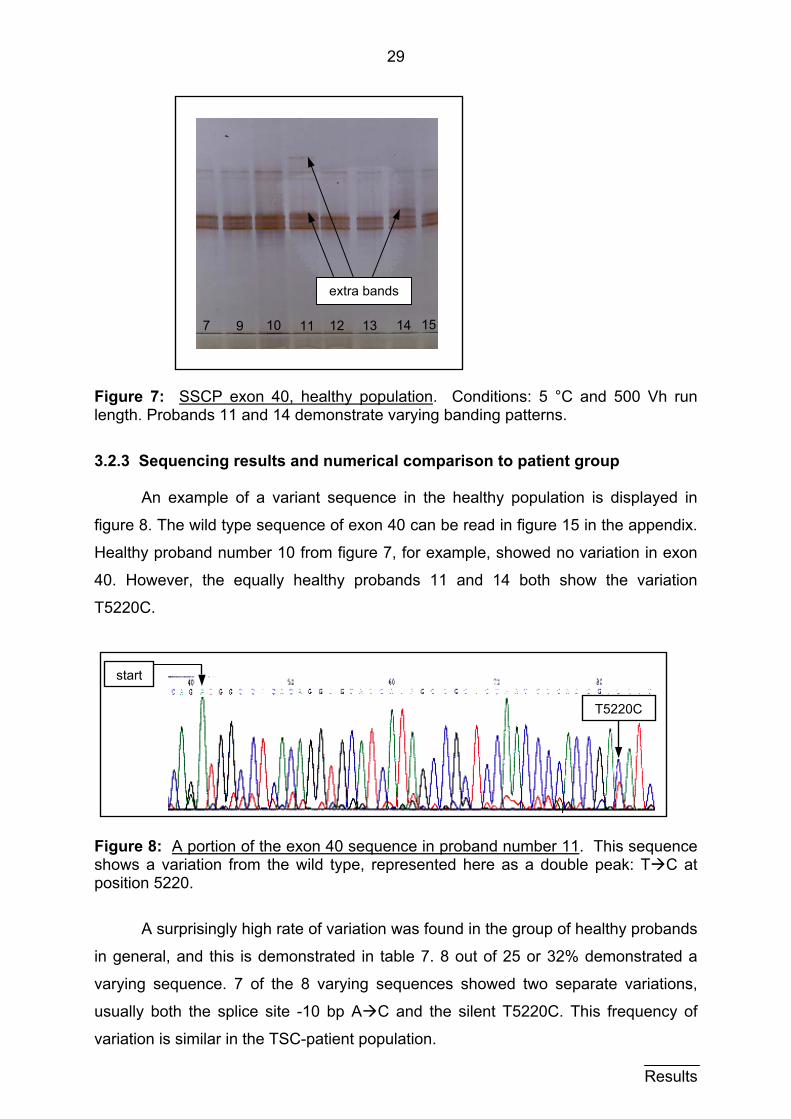
variation in DNA sequence for these samples. Figure 7 shows an example of an
SSCP gel result from the healthy population. A typical, simple banding pattern was
revealed for exon 40 (analogous to the results demonstrated by Gerd Wiegele in the
patient population), with two lighter upper bands and a triplet of stronger bands
below. Variations are marked in the figure, and the sequence results verify these
findings (figure 8).
Results
29
151411 13129 10 7
extra bands
Figure 7: SSCP exon 40, healthy population. Conditions: 5 °C and 500 Vh run length. Probands 11 and 14 demonstrate varying banding patterns.
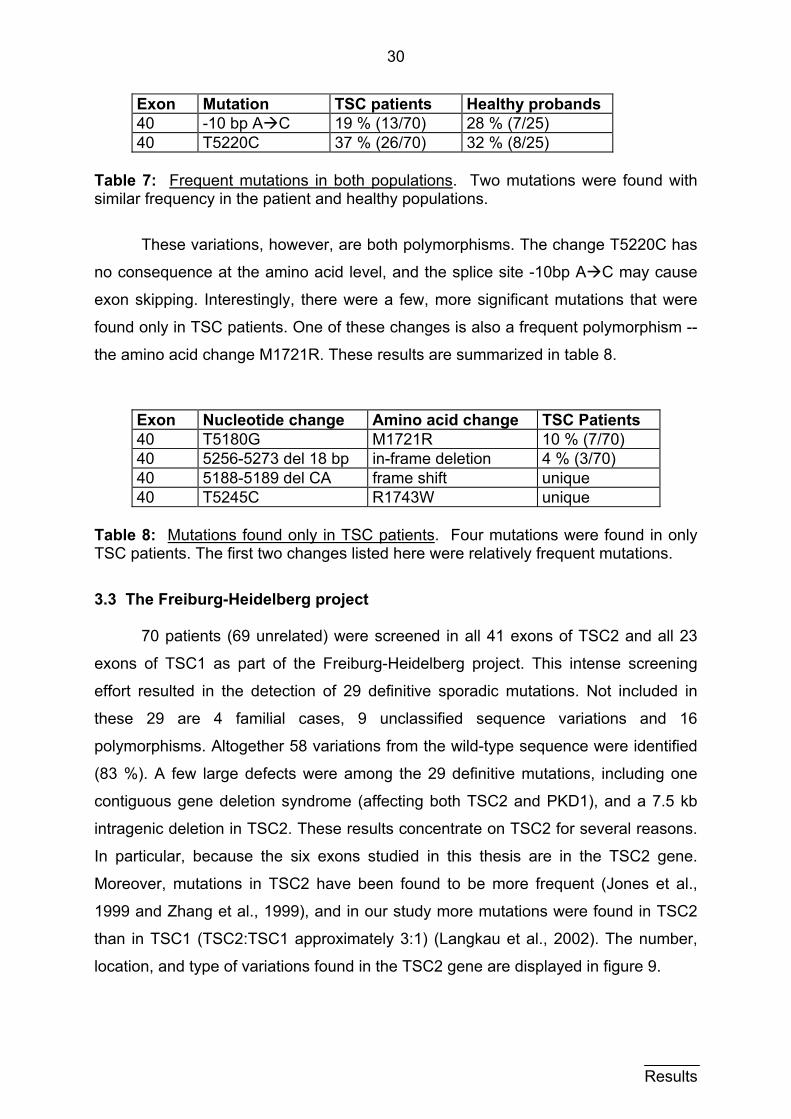
3.2.3 Sequencing results and numerical comparison to patient group
An example of a variant sequence in the healthy population is displayed in
figure 8. The wild type sequence of exon 40 can be read in figure 15 in the appendix.
Healthy proband number 10 from figure 7, for example, showed no variation in exon
40. However, the equally healthy probands 11 and 14 both show the variation
T5220C.
t
Fishpo
in
va
us
va
star
gure 8: A portion of the exon 40 sequence in proband number 11. ows a variation from the wild type, represented here as a doublesition 5220.
A surprisingly high rate of variation was found in the group of he
general, and this is demonstrated in table 7. 8 out of 25 or 32% d
rying sequence. 7 of the 8 varying sequences showed two sepa
ually both the splice site -10 bp A C and the silent T5220C. Th
riation is similar in the TSC-patient population.
T5220C
This sequence peak: T C at
althy probands
emonstrated a
rate variations,
is frequency of
Results
30
Exon Mutation TSC patients Healthy probands 40 -10 bp A C 19 % (13/70) 28 % (7/25) 40 T5220C 37 % (26/70) 32 % (8/25)
Table 7: Frequent mutations in both populations. Two mutations were found with similar frequency in the patient and healthy populations.
These variations, however, are both polymorphisms. The change T5220C has
no consequence at the amino acid level, and the splice site -10bp A C may cause
exon skipping. Interestingly, there were a few, more significant mutations that were
found only in TSC patients. One of these changes is also a frequent polymorphism --
the amino acid change M1721R. These results are summarized in table 8.
Exon Nucleotide change Amino acid change TSC Patients 40 T5180G M1721R 10 % (7/70) 40 5256-5273 del 18 bp in-frame deletion 4 % (3/70) 40 5188-5189 del CA frame shift unique 40 T5245C R1743W unique
Table 8: Mutations found only in TSC patients. Four mutations were found in only TSC patients. The first two changes listed here were relatively frequent mutations.
3.3 The Freiburg-Heidelberg project
70 patients (69 unrelated) were screened in all 41 exons of TSC2 and all 23
exons of TSC1 as part of the Freiburg-Heidelberg project. This intense screening
effort resulted in the detection of 29 definitive sporadic mutations. Not included in
these 29 are 4 familial cases, 9 unclassified sequence variations and 16
polymorphisms. Altogether 58 variations from the wild-type sequence were identified
(83 %). A few large defects were among the 29 definitive mutations, including one
contiguous gene deletion syndrome (affecting both TSC2 and PKD1), and a 7.5 kb
intragenic deletion in TSC2. These results concentrate on TSC2 for several reasons.
In particular, because the six exons studied in this thesis are in the TSC2 gene.
Moreover, mutations in TSC2 have been found to be more frequent (Jones et al.,
1999 and Zhang et al., 1999), and in our study more mutations were found in TSC2
than in TSC1 (TSC2:TSC1 approximately 3:1) (Langkau et al., 2002). The number,
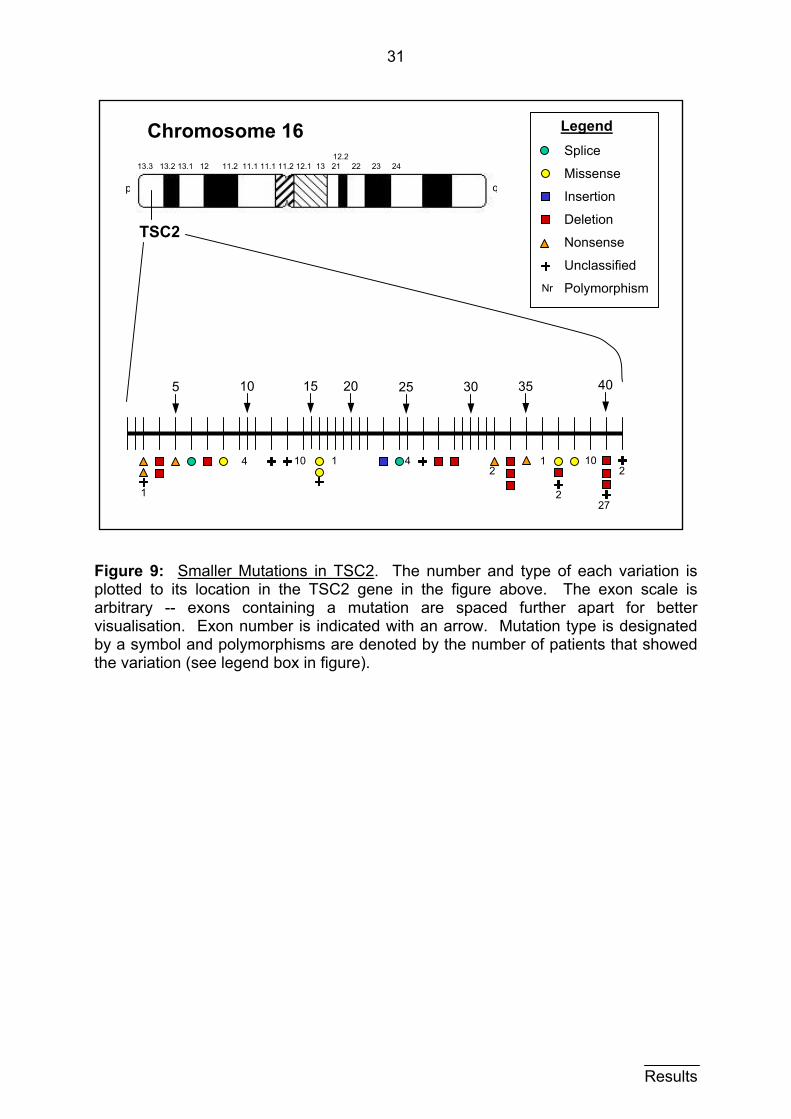
location, and type of variations found in the TSC2 gene are displayed in figure 9.
Results
31
Results
Legend
Nr
Splice
Missense
Insertion
Deletion
Nonsense
Unclassified
Polymorphism
35 40 30 25 20 15 10
2
27
10
2
1 4 1 4 10
1
2
5
Chromosome 16
qp
13.3 13.2 13.1 12 11.2 11.1 11.1 11.2 12.1 13 21 22 23 24 12.2
TSC2
Figure 9: Smaller Mutations in TSC2. The number and type of each variation is plotted to its location in the TSC2 gene in the figure above. The exon scale is arbitrary -- exons containing a mutation are spaced further apart for better visualisation. Exon number is indicated with an arrow. Mutation type is designated by a symbol and polymorphisms are denoted by the number of patients that showed the variation (see legend box in figure).
32
4 Discussion 4.1 Patient group 4.1.1 PCR products
The screening of TSC2 for mutations ensued exon by exon. Each exon was
individually examined for variations that could be caused by mutations in the
sequence. The basis of this method required the amplification of each exon via PCR
as described in sections 2 and 3 above. This was in most cases the rate-limiting step
in the lengthy process of obtaining a sequence. Some PCR products were more
difficult to obtain than others. In order to achieve a pure product, a set of primers was
chosen and an initial run was performed. The conditions were varied as described in
2.2.5 until a single, sharp band, no byproducts and a negative control were visualized
in an agarose gel.
In some cases, extreme variations in number of cycles and temperatures
became necessary to achieve a pure product. A new set of primers was required in
two cases (exons 34 and 38) after intense efforts with the first pair of primers failed to
yield acceptable results. It was particularly difficult to achieve quality products in exon
38. Almost none of the agarose gels showed clean bands for each patient. Usually
only half of the products were acceptable, when a run of PCR batches was
performed in exon 38. Consequently, many repeated runs were required to achieve
satisfactory products for each patient.
4.1.2 SSCP
The SSCP method is based on the migration of single stranded DNA
fragments in gel electrophoresis, as explained in section 2.2.7. The banding pattern
shown is unique for each DNA sequence. The amplified exons from each patient
were applied to SSCP gels for mutational screening as described in sections 2.2.7
and 3.2.2. Variations in the principal pattern visualized suggest variations in DNA
sequence, and each varying sample was sequenced.
Some exons exhibited simple patterns, which made the decision for samples
that required sequencing obvious. Exon 34, for example, shows a pattern with only 3
major bands, and figure 5 in section 3.1.2 demonstrates easily recognizable
variations from the norm. Other exons displayed complex banding, which made the
selection of varying patterns difficult. This is the case for exon 36, in which diffuse
banding was shown and patients were at times manually selected for sequencing
Discussion
33
(see appendix, figure 14). Exon 30 showed two main patterns of banding, and a
selection of patients from each of the two patterns was sequenced, revealing no
sequence variations (figure 14, appendix).
The use of SSCP for mutational screening is dependant upon the examination
of gels by a trained eye, and is therefore in certain cases not extraordinarily
objective. This is a definite drawback to the SSCP method. Subtle variations could be
overlooked and the diagnosis of a mutation consequently missed. The detection of
mutations in only about two thirds of patients could be in part explained by
weaknesses in SSCP screening.
Analysis of the sensitivity of SSCP vary somewhat from study to study. Orita et
al. (1989) state that it is possible to detect single nucleotide differences in a DNA
sample. Vidal-Puig and Moller (1994) report a 95 % (18 of 19) rate of mutation
detection via SSCP and the Phast System. In contrast, more recent studies
comparing SSCP with other detection methods, including direct sequencing found an
only 85 % rate of detection in a large pool of samples (88 of 103) (Jones et al.,
1999a). These studies concur, however, in that SSCP is a cost-effective and
technically simple method for screening a large patient pool prior to sequencing. The
results of this dissertation are in agreement on this point. We detected a total of 58
variations in 70 patients (83 %).
4.1.3 Sequencing 4.1.3.1 Mutations
9 variant sequences that were defined as mutations were found in 12 patients.
These results are summarized in table 4 (section 3.1.3.1), and the varying sections of
these sequences are shown in detail in figure 16 (appendix). Most of the sequence
findings correlate with a varying banding pattern in SSCP. In a few cases, however,
these results did not match up. Exon 30, for example, showed no deviations in
sequence despite seemingly different patterns in SSCP. The two patterns seen
(figure 14, appendix) were simply two normal banding versions.
As discussed in the previous section (4.1.2), it is a limitation of the SSCP
method that a level of uncertainty exists in screening DNA samples for mutations
before sequencing. The sequencing itself, on the other hand, is merely dependent
upon the quality of the DNA sample, which was purified according to methods
described in 2.2.8. If the resulting sequence was readable, a good DNA sample
Discussion
34
(PCR product) was achieved. The SSCP method was used as a pre-screening, to
significantly reduce the cost of our project and the time needed to sift through a large
patient pool.
As for the types of mutations found, these were also very diverse. Deletions,
insertions, silent base pair changes, missense mutations, and splice site variances
were all included in the findings (see table 4, section 3.1.3.1 and figure 9, section
3.3). The consequences of these mutations lie at the amino acid level. That is not
always easy to determine. For example, a change in a single nucleotide found in
patient 154 in exon 36 has no significance at the amino acid level. This is due to the
degenerate nature of the genetic code -- the fact that several different triplets can
code for a single amino acid. Often single nucleotide changes will not cause a
change in the amino acid. However, the single nucleotide change in exon 40 in
patient 46 causes a missense variation in the tuberin protein (R1743W), because a
significant nucleotide was substituted (here C5245T).
Small deletions may seem relatively harmless at first consideration. However,
depending at what position and how many nucleotides are affected, the change can
be quite serious. Patients 80, 113 and 114 all have the same 18 base pair in-frame
deletion. In contrast, patient 99 has a mere two base pair deletion that changes the
entire reading frame for exon 40. An insertion can also cause a shift in reading frame.
One insertion was found in the Freiburg-Heidelberg project (see figure 9, section
3.3), but none in the exons examined for this thesis (see table 4, section 3.1.3.1).
Another interesting type of sequence variation that was quite frequently
detected is the so-called splice variation. These deviations from the wild type
sequence occur in the intron region up to 10 nucleotides before exon begin, and can
affect the splicing of exons in the production of mRNA. This can result in exon
skipping, if the change is not homologous enough to the wild type sequence
(Krawczak et al., 1992). The finding that 13 patients showed the change A C at
-10bp in exon 40 (see table 5 in section 3.1.3.2) is an example of a very common
splice site variation. According to Krawczak et al. (1992), a pyrimidine is predicted to
be at this position with an 85 % probability. However, according to the Cardiff-
Rotterdam reference sequence (European Chromosome 16 Tuberous Sclerosis
Consortium, 1993), a purine (adenine, A) belongs in this position. This was
substituted with a pyrimidine (cytosine, C) in these patients. Interestingly, this
particular change is also quite frequent in the healthy control population (see section
4.2), which is evidence against the pathogenicity of this variation.
Discussion
35
Cheadle et al. (2000) consider a mutation to be pathogenic, when the
following criteria for missense, in-frame deletions and splice mutations outside the
two invariant donor and acceptor bases are met:
• The mutation was found in a sporadic TSC patient or a founding family member and
• the mutation was not present in the unaffected parents and
• the TSC patient DNA sample had been completely screened for other changes in all exons of TSC1 and TSC2.
Nonsense (nucleotide change resulting in a stop codon) and frame shift mutations,
on the other hand, are seen as clearly pathogenic because of protein truncation or
other significant disturbance in the amino acid sequence.
Despite these reasonable guidelines, what a mutation means at the protein
level is still not completely clear. How the amino acid sequence is affected is known,
but what a change in this sequence means for the protein function is not known. Until
the protein structure and function has been more clearly elucidated, the mutations
found can not be put into their complete context.
4.1.3.2 Polymorphisms
As described in section 3.1.3.2, a significant number of smaller changes were
discovered in the patient group and were classified as polymorphisms (see table 5 in
section 3.1.3.2). This classification was not simple, because the term polymorphism
seems to imply a benign change. This is not always the rule: the coexistence of
several variations of a sequence in a population is called polymorphism. More
precisely, an allele is defined as polymorph, when it is found to have a frequency
greater than 1 % in the population. This definition includes such examples of
polymorphism in healthy individuals as the blood groups and the genes that code for
the MHC (major histocompatibilty complex). (summarized in Lewin, 1998)
This definition does not, however, exclude frequent stable variations that can
be categorized as “sick”. A classic example of this is the polymorphism in the
hemoglobin gene that causes the disease sickle cell anemia. In wild type
hemoglobin, glutamic acid occupies amino acid position 6 of the β chain, while sickle
cell hemoglobin has valine at this position (von Harnack, 1994). This common
change satisfies the frequency regulation for the definition polymorphism. Although it
is small, its location dictates a structural change in hemoglobin and a sick phenotype.
Discussion
36
One exon in which the most polymorphisms were detected was exon 40 (see
table 5 in section 3.1.3.2). The reason for this is undoubtedly the complete screening
of this exon, as discussed in the following section.
4.1.3.3 Quality control and exon 40
The comparison of SSCP and sequence analysis in exon 40 is summarized in table 6 in section 3.1.4. In 4 patients, a variant SSCP was shown, but no sequence
deviation was found. Conversely, 26 patients had variant sequences but apparently
normal SSCP results. 15 of these 26 missed variations are silent or splice mutations.
This could indicate that most of the larger mutations were detected by SSCP and
less significant changes are more likely to be missed. This assumption is clearly
contradicted by the fact that 9 of the 10 sequence variations detected via SSCP are
also silent or splice mutations.
The SSCP method should detect changes as small as a single nucleotide
(Orita et al., 1989), and this is not contradicted by our results. Also, SSCP provides
for an inexpensive and relatively expeditious way to screen a large patient group.
However, the ability to detect mutations with a great degree of certainty was not
substantiated here. Hindrances that account for the discrepancies between SSCP
and sequence results are discussed in section 4.1.2.
4.2 Control group of healthy probands
The mutations found in the patient group lacked meaning without further
knowledge of the protein product and its functionality in TSC patients. As we know,
some smaller changes in DNA sequence do not always lead to amino acid changes.
Some amino acid changes are also not crucial to protein function. The size of a
mutation, therefore, does not always directly correlate to its gravity. This can be
decided when more about the protein is known.
One simple way to lend context to the mutational screening results was to
examine the variability of healthy TSC2. For this purpose, a group of 25 healthy
probands was screened for mutations in exon 40 of TSC2. Exon 40 was chosen,
because this exon was completely sequenced and would have the most complete
results. A control study of healthy exon 40 was of particular interest also because this
was an exon in which several seemingly significant mutations were found in our
patient group.
Discussion
37
DNA samples from 25 random, non-related, healthy probands for this control
group were kindly provided by Dr. Klaus Deichmann. As described in section 2.2.1.2,
these healthy samples were randomly selected from a large group of donor DNA.
The source of the DNA was healthy volunteers from various geographical regions, so
no hereditary or regional bias could be assumed.
4.2.1 Exon amplification and mutational screening
Exon 40 was amplified from genomic DNA for each of the healthy probands
via PCR. The procedure for exon 40 was already established in our patient group,
and it was not problematic to achieve satisfactory products. Mutational screening via
SSCP was also straightforward, due to the simple banding pattern displayed by exon
40 (see figure 13 in the appendix and figure 7 in section 3.2.2). All samples were
sequenced so as not to miss any minor variances.
4.2.2 Sequencing results and numerical comparison to patient group
As described in section 3.2.3, the group of healthy probands demonstrated an
unexpectedly high rate of variation. Two mutations were found to have a similar
frequency in both populations (see table 7). However, four mutations were found only
in the patient population (see table 8). Figure 8 in section 3.2.3 shows an example of
a variant sequence in the healthy population and the wild type sequence of exon 40
can be read in figure 15 in the appendix.
This is the key to placing known mutations in proper context. It is difficult to
say whether a mutation is disease causing until we know the full extent of natural
variation in the healthy population or can directly compare the wild type with the
mutated protein. Certain healthy genes in humans are by nature highly variant. One
example is the gene that codes for the variable portion of antibody L-chain (Lewin,
1998). In this case, variation is necessary to achieve the goal of specificity for many
various antigens with which our immune system is confronted. Other genes must be
strictly nonvariant, because their variation could cause a serious disease or be fatal.
The question is, then, how variant is TSC2 normally? Once we completely answer
this, then much more can be said about the mutations found in the patient population.
Not only the amount of variation, but significance of location in the TSC2 gene
can be much better determined, once a healthy population is thoroughly examined. It
can now be more accurately assumed, that the four mutations found only in the
Discussion
38
patient group are disease causing. The two frequent variations (polymorphisms) that
were found in both groups then have little consequence for TSC disease.
Polymorphisms in general, however, can not be dismissed as irrelevant. One
of the four mutations found only in the patient population occurred with a high
frequency as well. This is the nucleotide change T5180G, which results in the amino
acid change M1721R and is found in 10 % of our patients.
4.3 Screening the whole gene 4.3.1 Number and type of mutations found
Concerted screening of both TSC genes in this project yielded the detection of
29 sporadic mutations, 4 familial mutations and 9 unclassified variations in 69 TSC
patients. These results correspond to a 61 % (42/69) detection rate, which matches
literature values (Au et al., 1998, Zhang et al., 1999, among others). Nonetheless,
this is quite a discrepancy, when one considers that each of the patients included in
our study was carefully screened and received a definite TSC diagnosis. This is one
reason why it is particularly difficult to correlate phenotype with genotype in tuberous
sclerosis.
TSC is also characterized by a high rate of somatic mosaicism, which offers a
feasible explanation for finding mutations in only 60 % of patients (Yates et al., 1997).
In addition to mosaicism, an eventual third gene involved in TSC could explain the
failure to find a mutation in a number of the patients examined. However, this
possibility is becoming increasingly unlikely due to the concerted efforts of linkage
studies over the years (Cheadle et al., 2000). The likelihood of another locus is even
further reduced by the finding that half of the TSC families show linkage to TSC1 and
the other half to TSC2 (Cheadle et al., 2000).
To further complicate matters, there are no hot spots that can be concentrated
on in the study of this disease. As figure 9 in the results section shows, there is no
clustering of mutations in a specific region of the TSC2 gene. Of particular interest is
that mutations occur in regions of known GAP-related domains (exons 34-38) and
coiled-coil regions (exons 10 and 26) as well as in other regions. See figure 10 for a
summary of these findings.
Discussion
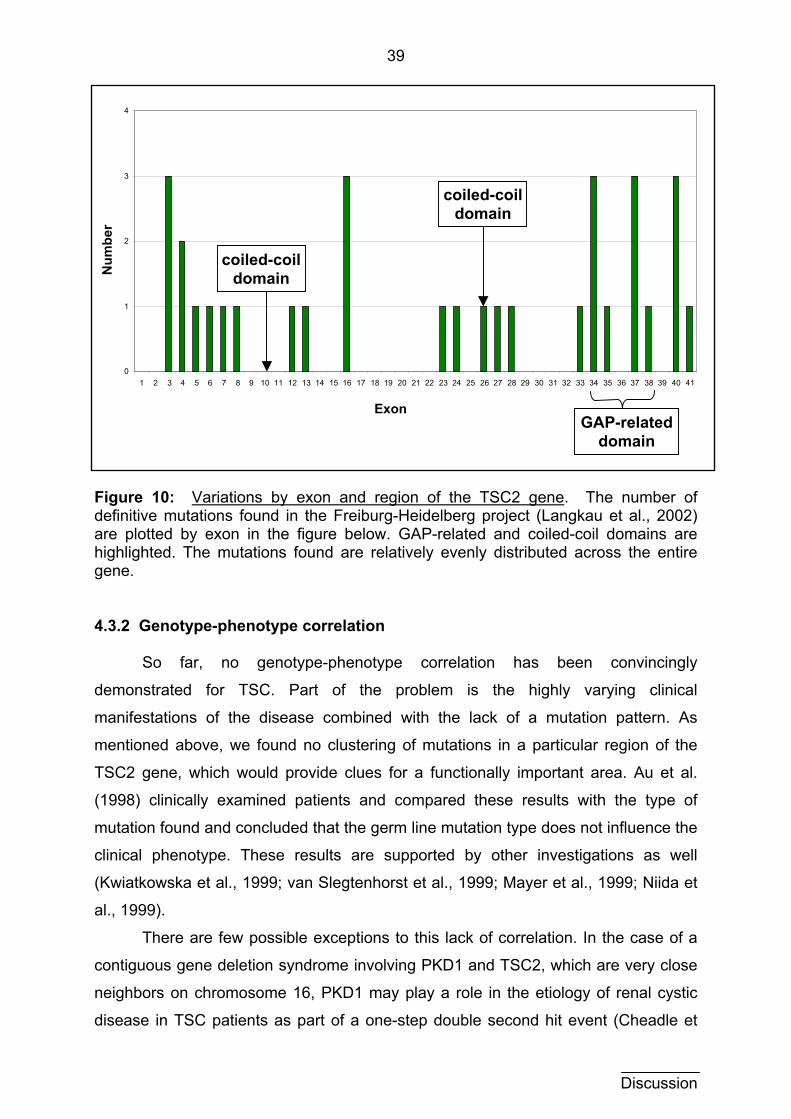
39
0
1
2
3
4
1 2 3 4 5 6 7 8 9 10 11 12 13 14 15 16 17 18 19 20 21 22 23 24 25 26 27 28 29 30 31 32 33 34 35 36 37 38 39 40 41
Exon
coiled-coil domain N
umbe
r
coiled-coil domain
GAP-related domain
Figure 10: Variations by exon and region of the TSC2 gene. The number of definitive mutations found in the Freiburg-Heidelberg project (Langkau et al., 2002) are plotted by exon in the figure below. GAP-related and coiled-coil domains are highlighted. The mutations found are relatively evenly distributed across the entire gene. 4.3.2 Genotype-phenotype correlation
So far, no genotype-phenotype correlation has been convincingly
demonstrated for TSC. Part of the problem is the highly varying clinical
manifestations of the disease combined with the lack of a mutation pattern. As
mentioned above, we found no clustering of mutations in a particular region of the
TSC2 gene, which would provide clues for a functionally important area. Au et al.
(1998) clinically examined patients and compared these results with the type of
mutation found and concluded that the germ line mutation type does not influence the
clinical phenotype. These results are supported by other investigations as well
(Kwiatkowska et al., 1999; van Slegtenhorst et al., 1999; Mayer et al., 1999; Niida et
al., 1999).
There are few possible exceptions to this lack of correlation. In the case of a
contiguous gene deletion syndrome involving PKD1 and TSC2, which are very close
neighbors on chromosome 16, PKD1 may play a role in the etiology of renal cystic
disease in TSC patients as part of a one-step double second hit event (Cheadle et
Discussion
40
al., 2000). There is also evidence for a relationship between pulmonary
Lymphangiomyomatosis and TSC2 (Carsillo et al., 2000). Jones et al., (1997)
reported the finding that patients with TSC2 are significantly more often mentally
retarded than patients with TSC1 mutations, but this is not supported by other studies
(van Slegtenhorst et al., 1999; Niida et al., 1999; Yamashita et al., 2000).
Examples of inherited diseases with a more obvious connection between
genetic defect and clinical manifestation include cystic fibrosis and Duchenne
muscular dystrophy. The most common mutation causing cystic fibrosis, delta F508,
results in a more easily degradable protein product. Duchenne muscular dystrophy is
the consequence of a dystrophin protein deficiency. The size of the faulty area of the
gene correlates directly with the lack of dystrophin and the severity of the disease.
(summarized in von Harnack, 1994)
4.3.3 Clinical variability
If it is not yet possible to definitely correlate genetic defect and clinical
phenotype in TSC, then other theories for the very broad manifestations of TSC
disease must be explored. Despite the variable expressivity of TSC, it is thought to
be highly penetrant (Rose et al., 1999). This means that a defective TSC gene (TSC1
or TSC2) very definitely results in TSC disease. A complication of high penetrance is
the case of mosaicism, in which not all cells are affected by the mutation and,
consistent with a dosage effect, less severe clinical phenotypes result -- emulating
non-penetrance. The very nature of the tumor suppressor genes hamartin and
tuberin and the timing of their loss of function is the underlying reason for the varying
clinical outcome of TSC.
Cell growth and differentiation is complex, but highly regulated. A mistake
must be made in the normal process in order for tumorous tissue to occur.
Depending on when and where a mistake happens, the outcome can be highly
variable. (Young and Povey, 1998). This process of tumorigenesis and the role
played by tumor suppressor genes can be described by Knudson’s Two-Hit
Hypothesis (Knudson, 1971). This theory also provides explanation for the high
clinical variability of TSC.
According to Knudson, we start with two healthy alleles of a tumor suppressor
gene (such as TSC-2, for example). At some point a random event can occur,
causing a mutation in one of the alleles (usually a germ line mutation). The remaining
healthy allele is dominant and the phenotype is still healthy. Later, a random second
Discussion
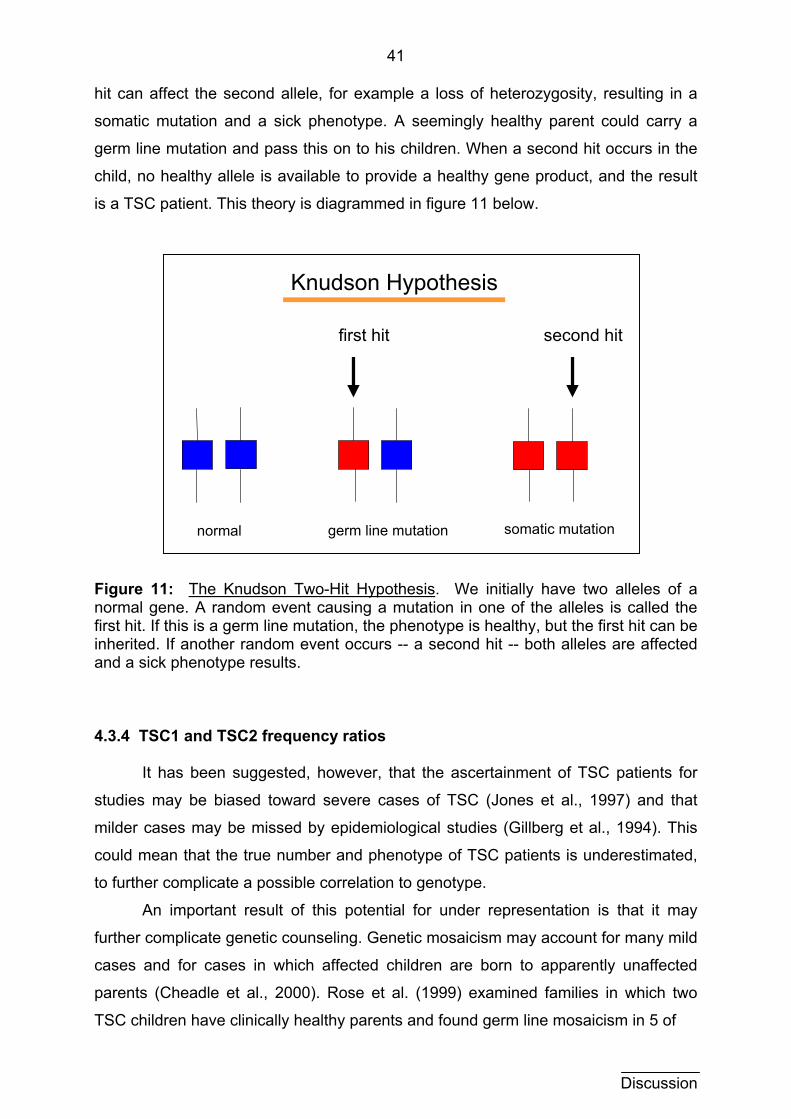
41
hit can affect the second allele, for example a loss of heterozygosity, resulting in a
somatic mutation and a sick phenotype. A seemingly healthy parent could carry a
germ line mutation and pass this on to his children. When a second hit occurs in the
child, no healthy allele is available to provide a healthy gene product, and the result
is a TSC patient. This theory is diagrammed in figure 11 below.
Knudson Hypothesis
second hit first hit
somatic mutation germ line mutationnormal
Figure 11: The Knudson Two-Hit Hypothesis. We initially have two alleles of a normal gene. A random event causing a mutation in one of the alleles is called the first hit. If this is a germ line mutation, the phenotype is healthy, but the first hit can be inherited. If another random event occurs -- a second hit -- both alleles are affected and a sick phenotype results. 4.3.4 TSC1 and TSC2 frequency ratios
It has been suggested, however, that the ascertainment of TSC patients for
studies may be biased toward severe cases of TSC (Jones et al., 1997) and that
milder cases may be missed by epidemiological studies (Gillberg et al., 1994). This
could mean that the true number and phenotype of TSC patients is underestimated,
to further complicate a possible correlation to genotype.
An important result of this potential for under representation is that it may
further complicate genetic counseling. Genetic mosaicism may account for many mild
cases and for cases in which affected children are born to apparently unaffected
parents (Cheadle et al., 2000). Rose et al. (1999) examined families in which two
TSC children have clinically healthy parents and found germ line mosaicism in 5 of
Discussion
42
the 7 families. Based upon these results, a conservative recurrence risk for
apparently unaffected parents with one affected child is estimated to be 2 to 3 %
(Rose et al., 1999).
According to Langkau et al. (2002) and Cheadle et al. (2000), mildly affected
cases of TSC do not have a reduced reproductive fitness -- that is they are just as
likely to have offspring as healthy persons. It is assumed that mild forms of TSC are
based on mutations in TSC1 (Jones et al., 1997; Langkau et al., 2002), because
most sporadic cases involve TSC2 although half of TSC families show linkage to
TSC1 and the other half to TSC2. The explanation for this is that mild (TSC1) cases
are not clinically obvious and lie outside the ascertainment window. Our patient
population, for example, required strict fulfillment of diagnostic criteria for inclusion in
this study. Because of this, many mild cases may have been missed and that is why
so few TSC1 mutations were represented here and in other studies (Jones et al.,
1997; Cheadle et al., 2000; Langkau et al., 2002).
4.4 Conclusions
The mutations detected in this study were in number and type similar to
previous studies. No clustering at a particular region of the TSC2 gene was
observed. No genotype-phenotype correlation has been decisively made, and this
may be influenced by the widely varying clinical presentation of TSC. This variability
makes it a difficult disease to characterize, and may also account for missing milder
cases. Clinical variability can be explained by mosaicism (somatic and germ line) and
the Knudson Two Hit Hypothesis. The potential for metastasizing TSC lesions has
been initially examined, but is not proven and requires further study (Martignoni et al.,
2000).
Until more is known about the protein structures and functions of hamartin and
tuberin, the context of discovered mutations remains incomplete. The screening of a
healthy population has proven helpful in bringing mutations and polymorphisms
found into perspective until more is known about the protein products of the TSC
genes. This initial screen should be broadened to include all exons. An SSCP
example of various banding patterns observed in healthy populations would be
helpful in this pre-screening of samples, in particular those cases with complex
banding.
Discussion
43
Discussion
4.5 Future Screening: As screening efforts advance a clustering of mutations may be found to allow
for a concentrated effort on a smaller group of exons. SSCP as a screening method
is inexpensive, uncomplicated and relatively reliable. In combination with other
methods (such as DHPLC or PTT), an increased detection sensitivity has been
observed (Jones et al., 1999a). Other methods are more complex and can be used in
specialized centers with greater human resources. The eventual development of
DNA chips for diagnostics in the future would provide a possibility for diagnostic
screening (Young and Povey, 1998). As yet the time consuming and expensive
process is a hindrance to this goal.
Therapy:
As yet the therapy of TSC is symptomatic. Antiepileptic drugs for reducing
seizure frequency and early support are key factors in combating mental retardation
and behavioral complications. These symptoms are of great concern to patients and
parents. The surgical removal of hemorrhages and fibromas when possible is
important for the management of the disease as well. (Gutierrez et al., 1998)
Causal therapy in the form of gene therapy is far in the future. Local
application or substitution of missing proteins may become possible once more is
known about hamartin and tuberin. This may be especially difficult in TSC because
both proteins involved are ubiquitous -- reducing the possibility for a cure via gene
therapy. The concentration of efforts in localized lesions may therefore be necessary.
Cancer research:
The implications of TSC in cancer research in general will be exciting in the
years to come. Ubiquitous proteins that are phylogenetically conserved and play a
role in cell cycle control are undeniably interesting to study. The understanding of the
tumor suppressor process in this disease may provide valuable insight for research
into this and other diseases involving tumors.
44
5 Summary
Tuberous sclerosis complex is an inherited disorder characterized by the development of benign tumors in various tissues. These tumors can affect the central nervous system, skin, kidney, heart and almost any organ. The frequency is currently estimated to be 1:6000 and the variation in severity of disease is great. Epilepsy, mental retardation, renal failure and reduced life expectancy are all possible, although a number of mildly affected persons lead normal lives with no reduction in reproductive fitness.
Two genes and their products have been identified as causing TSC when they are defective: TSC1 on chromosome 9q34.3 codes for the protein hamartin and TSC2 on chromosome 16p13.3 codes for tuberin. Tuberin shows homology to GTPase activating proteins (GAPs) and hamartin and tuberin may interact with one another to control the cell cycle, suggesting a tumor suppressor function for these proteins.
Efforts to screen patient populations for mutations in both genes in this study and others have been successful in identifying a large number of mutations. However, no clustering of mutations has been shown that might allow for concentration of efforts on a particular region of either gene. Sporadic mutations in TSC1 are less frequent than in TSC2 despite the fact that half of the TSC families show linkage to TSC1 and the other half to TSC2. It has been postulated that TSC1 patients are more mildly affected and may have a higher reproductive fitness than TSC2 patients.
The wide distribution of mutations and the high variability in clinical manifestation of TSC further complicate the quest for genotype-phenotype correlation. If the structure and function of the protein products were clearly established, then the consequence of the great number of mutations found thus far would be known. In order to lend some context to the mutations in the patient population, a group of healthy probands was screened as a control group in exon 40 of TSC2.
29 sporadic mutations, 4 familial cases, 9 unclassified variations and 16 polymorphisms making a total of 58 variations from the wild-type sequence were found in the 70 patients examined for this project. 8 out of 25 healthy probands also demonstrated variations in sequence, which were classified as polymorphisms. The presence of these variations in the healthy population helps define them as non-disease causing.
Future screening efforts may include methods of even higher sensitivity and the control of a healthy population until the gene products are better characterized. As screening efforts improve, diagnostic methods will evolve and greatly support genetic counseling. And as more is known about the function of tuberin and hamartin the closer we will come to the possibility of a causal therapy for TSC.

45
6 Zusammenfassung
Tuberöse Sklerose Komplex (TSC) ist eine vererbbare Erkrankung, die durch das Auftreten von gutartigen Tumoren gekennzeichnet wird. Die Tumoren können sich im zentralen Nervensystem, der Haut, der Niere, dem Herz und fast jedem anderen Organ entwickeln. Derzeit wird eine Häufigkeit von 1:6000 angenommen, wobei die klinischen Erscheinungen bei den einzelnen Betroffenen stark variieren. Es gibt schwere Verläufe mit Epilepsie, geistiger Behinderung, Niereninsuffizienz und verminderter Lebens-erwartung. Gleichzeitig sind auch Patienten bekannt, die ein normales Leben führen.
Zwei Gene und ihre jeweiligen Proteinprodukte sind identifiziert worden, die TSC verursachen, wenn sie Defekte aufweisen: TSC1 auf Chromosom 9q34.3 kodiert für das Protein Hamartin und TSC2 auf Chromosom 16p13.3 für Tuberin. Tuberin weist Sequenzhomologien zu bekannten GTPase-aktivierenden Proteinen (GAP) auf. Hamartin und Tuberin interagieren und üben möglicherweise Einfluß auf den Zellzyklus aus, was auf eine Tumorsuppressorfunktion dieser Proteine hinweist.
Durch genetisches Screening von Patientengruppen wurden eine Vielzahl von Mutationen in dieser und in anderen Arbeiten gefunden. Jedoch wurde keine Anhäufung von Mutationen in einer bestimmten Genregion festgestellt, auf die sich die Forschung konzentrieren könnte. Obwohl die Hälfte aller TSC Familien genetische Kopplung zu TSC1 und die andere zu TSC2 zeigen, sind sporadische Mutationen in TSC1 seltener als in TSC2. Es ist vermutet worden, daß TSC1 Patienten mildere Verläufe und bessere relative Fortpflanzungs-Fitness als TSC2 Patienten aufweisen.
Die breite Streuung der Mutationen und die hohe klinische Variabilität der Erkrankung sorgt für Herausforderungen in der Suche nach genotyp-phänotyp Korrela-tionen. Wäre die Struktur der Proteine aufgeklärt, würde man die Konsequenzen der Vielzahl der bisher gefundenen Mutationen eher erkennen können. Um die bekannten Sequenzvariationen in einen größeren Zusammenhang zu stellen, wurde in dieser Arbeit Exon 40 des TSC2 Gens zusätzlich in einer Gruppe gesunder Probanden untersucht.
In den 70 Patienten dieses Projektes sind zusammen 58 Abweichungen von der Wildtyp-Sequenz gefunden worden: 29 sporadische Mutationen, 4 familäre Fälle, 9 unklassifizierte Variationen und 16 Polymorphismen. 8 von 25 gesunde Probanden wiesen ebenfalls Sequenzveränderungen auf, die als Polymorphismen klassifiziert wurden. Diese Veränderungen in der gesunden Gruppe können somit als nicht krankheitsverursachend eingestuft werden.
Genetische Screeningmethoden, die noch höhere Sensitivität bieten, werden sicherlich in der Zukunft weiterentwickelt. Bis die Strukturen der TSC-Proteine bekannt werden, werden aber intensivere Untersuchungen in gesunden Populationen notwendig bleiben. Diagnostische Möglichkeiten für betroffene Familien werden ebenso mit der Zeit verfeinert und werden die genetische Beratung weiter unterstützen. Je mehr über die Funktion von Hamartin und Tuberin bekannt wird, desto näher rückt die Möglichkeit einer kausalen Therapie für TSC.
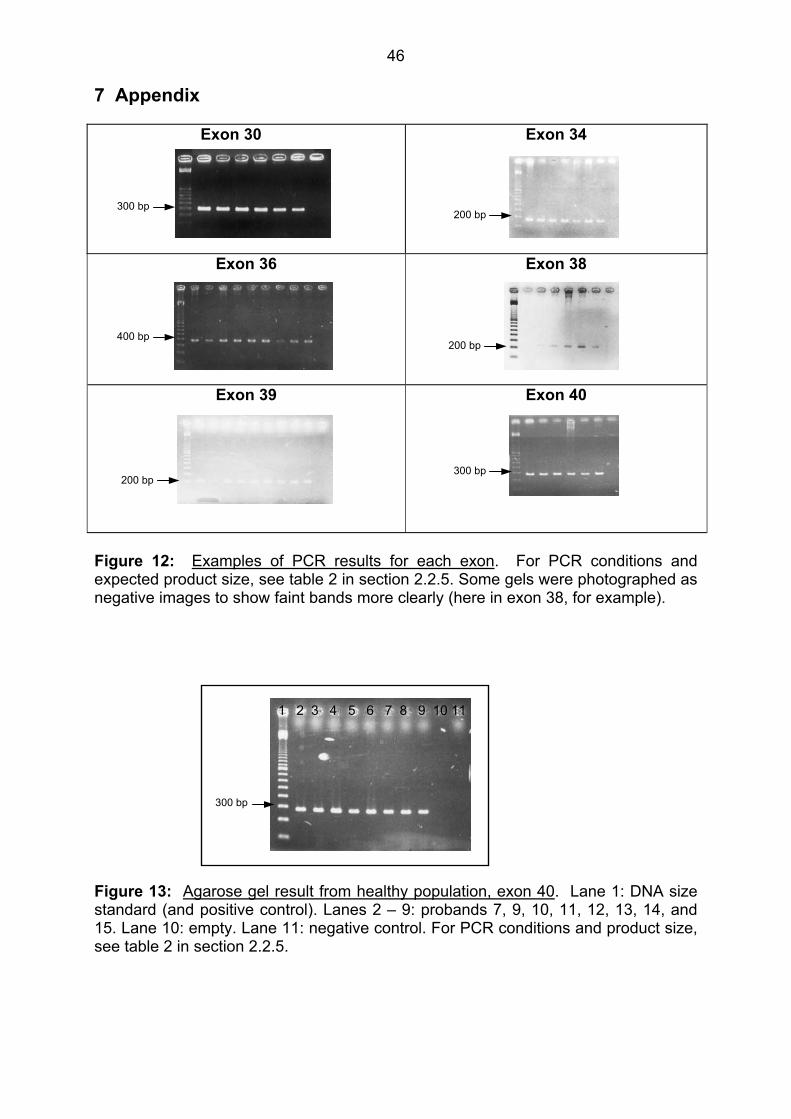
46
7 Appendix
Exon 30
Exon 34
Exon 36
Exon 38
Exon 39
Exon 40
300 bp
300 bp
200 bp
200 bp
400 bp
200 bp
Figure 12: Examples of PCR results for each exon. For PCR conditions and expected product size, see table 2 in section 2.2.5. Some gels were photographed as negative images to show faint bands more clearly (here in exon 38, for example).
300 bp
1 2 3 4 5 6 7 8 9 10 11 Figure 13: Agarose gel result from healthy population, exon 40. Lane 1: DNA size standard (and positive control). Lanes 2 – 9: probands 7, 9, 10, 11, 12, 13, 14, and 15. Lane 10: empty. Lane 11: negative control. For PCR conditions and product size, see table 2 in section 2.2.5.
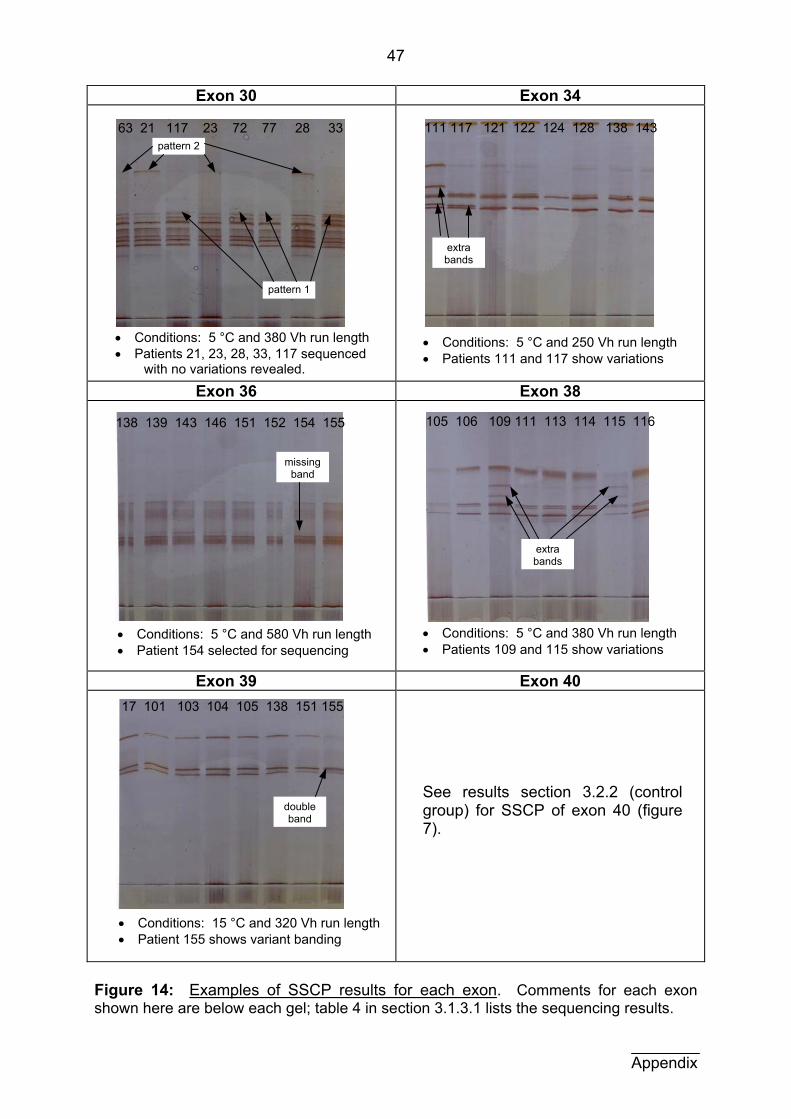
47
Exon 30 Exon 34
Exon 36 Exon 38
Exon 39 Exon 40
111 117 121 122 124 128 138 143
extra bands
pattern 1
pattern 2 63 21 117 23 72 77 28 33
• Conditions: 5 °C and 380 Vh run length• Patients 21, 23, 28, 33, 117 sequenced
with no variations revealed.
• Conditions: 5 °C and 250 Vh run length • Patients 111 and 117 show variations
See results section 3.2.2 (control group) for SSCP of exon 40 (figure 7).
138 139 143 146 151 152 154 155
• Conditions: 5 °C and 580 Vh run length • Patient 154 selected for sequencing
missing band
• Conditions: 5 °C and 380 Vh run length • Patients 109 and 115 show variations
extra bands
double band
17 101 103 104 105 138 151 155
105 106 109 111 113 114 115 116
• Conditions: 15 °C and 320 Vh run length • Patient 155 shows variant banding
Figure 14: Examples of SSCP results for each exon. Comments for each exon shown here are below each gel; table 4 in section 3.1.3.1 lists the sequencing results.
Appendix
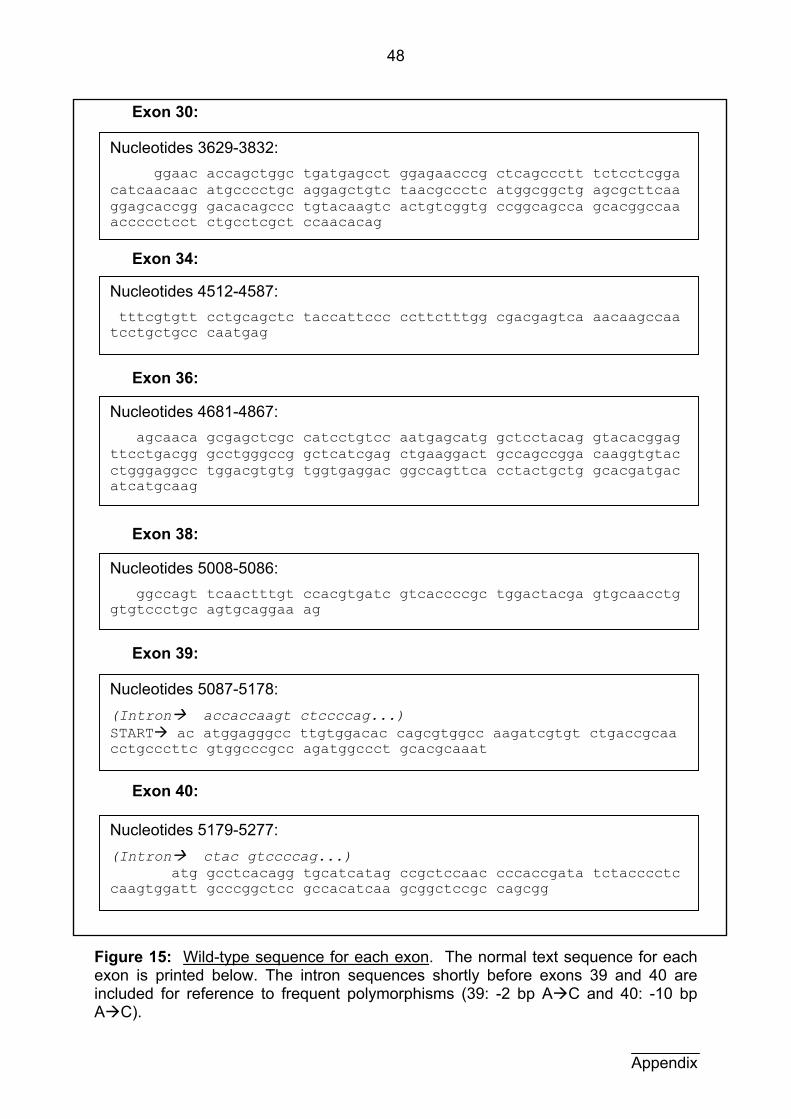
48
Exon 30:
Exon 34:
Exon 36:
Exon 38:
Exon 39:
Exon 40:
N
ucleotides 5179-5277: (Intron ctac gtccccag...) atg gcctcacagg tgcatcatag ccgctccaac cccaccgata tctacccctc caagtggatt gcccggctcc gccacatcaa gcggctccgc cagcgg
N
ucleotides 5087-5178: (Intron accaccaagt ctccccag...) START ac atggagggcc ttgtggacac cagcgtggcc aagatcgtgt ctgaccgcaa cctgcccttc gtggcccgcc agatggccct gcacgcaaat
N
ucleotides 5008-5086: ggccagt tcaactttgt ccacgtgatc gtcaccccgc tggactacga gtgcaacctg gtgtccctgc agtgcaggaa ag
N
ucleotides 4681-4867: agcaaca gcgagctcgc catcctgtcc aatgagcatg gctcctacag gtacacggag ttcctgacgg gcctgggccg gctcatcgag ctgaaggact gccagccgga caaggtgtac ctgggaggcc tggacgtgtg tggtgaggac ggccagttca cctactgctg gcacgatgac atcatgcaag
N
ucleotides 4512-4587: tttcgtgtt cctgcagctc taccattccc ccttctttgg cgacgagtca aacaagccaa tcctgctgcc caatgag
N
ucleotides 3629-3832: ggaac accagctggc tgatgagcct ggagaacccg ctcagccctt tctcctcgga catcaacaac atgcccctgc aggagctgtc taacgccctc atggcggctg agcgcttcaa ggagcaccgg gacacagccc tgtacaagtc actgtcggtg ccggcagcca gcacggccaa accccctcct ctgcctcgct ccaacacag
Figure 15: Wild-type sequence for each exon. The normal text sequence for each exon is printed below. The intron sequences shortly before exons 39 and 40 are included for reference to frequent polymorphisms (39: -2 bp A C and 40: -10 bp A C).
Appendix
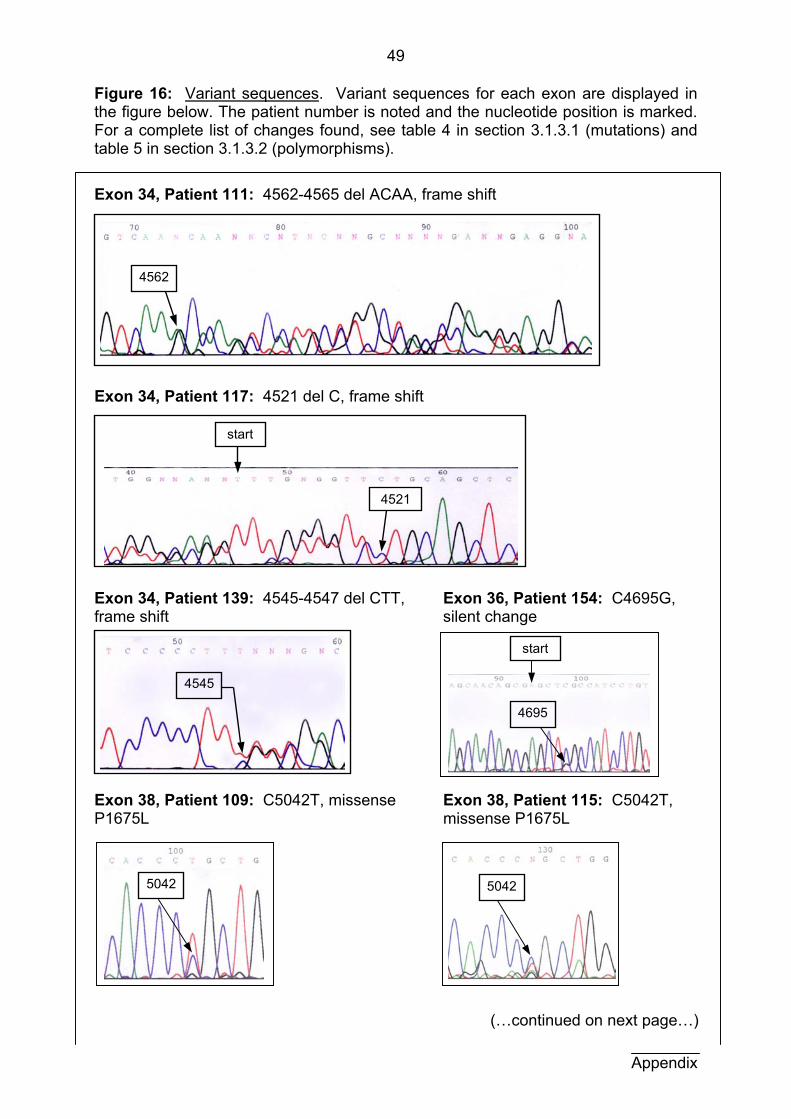
49
Figure 16: Variant sequences. Variant sequences for each exon are displayed in the figure below. The patient number is noted and the nucleotide position is marked. For a complete list of changes found, see table 4 in section 3.1.3.1 (mutations) and table 5 in section 3.1.3.2 (polymorphisms).
Exon 34, Patient 111: 4562-4565 del ACAA, frame shift Exon 34, Patient 117: 4521 del C, frame shift Exon 34, Patient 139: 4545-4547 del CTT, Exon 36, Patient 154: C4695G, frame shift silent change Exon 38, Patient 109: C5042T, missense Exon 38, Patient 115: C5042T, P1675L missense P1675L (…continued on next page…) Appendix
50425042
start
4695
4545
4521
start
4562
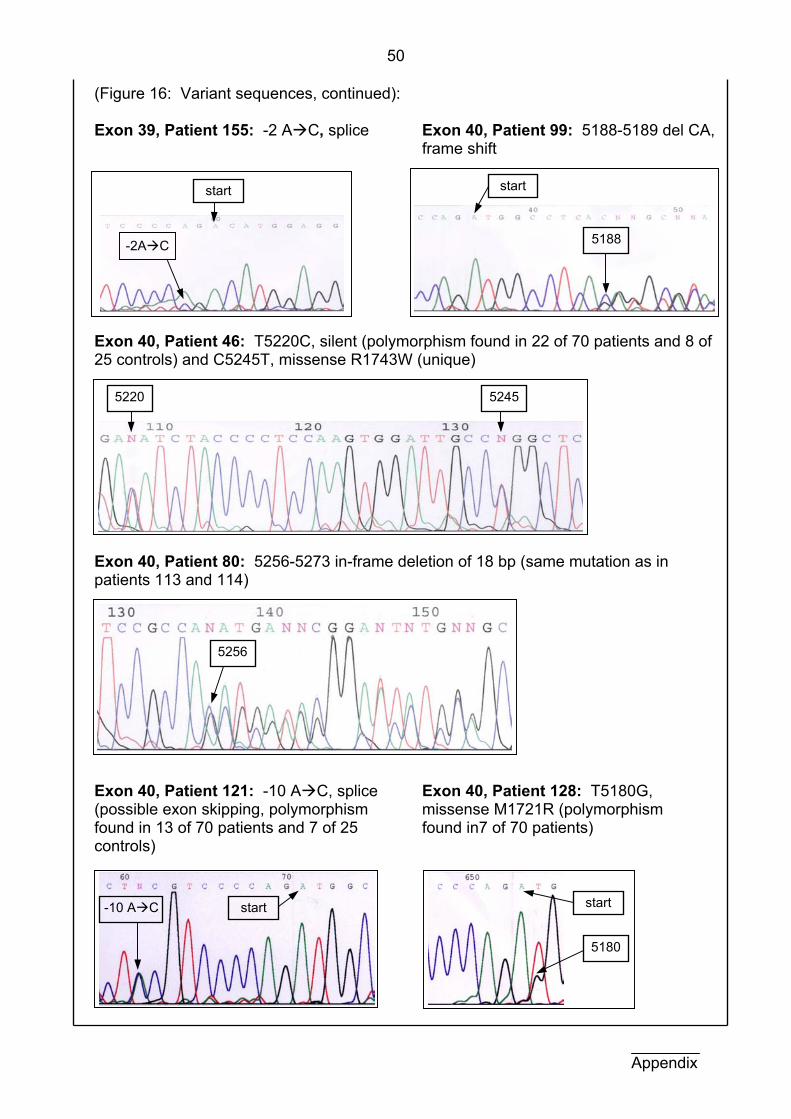
50
Appendix
(Figure 16: Variant sequences, continued): Exon 39, Patient 155: -2 A C, splice Exon 40, Patient 99: 5188-5189 del CA,
frame shift
Exon 40, Patient 46: T5220C, silent (polymorphism found in 22 of 70 patients and 8 of 25 controls) and C5245T, missense R1743W (unique) Exon 40, Patient 80: 5256-5273 in-frame deletion of 18 bp (same mutation as in patients 113 and 114)
Exon 40, Patient 121: -10 A C, splice (possible exon skipping, polymorphism found in 13 of 70 patients and 7 of 25 controls)
Exon 40, Patient 128: T5180G, missense M1721R (polymorphism found in7 of 70 patients)
start
5188
start
-2A C
start
5180
-10 A C start
52455220
5256
51
8 Abbreviations and Symbols A Adenosine (nucleoside, as in AMP)
AgNO3 Silver nitrate
approx. Approximately
AMP Adenosine monophospate, a nucleotide
ATP Adenosine triphospate
bp Base pairs
C Cytidine (nucleoside, as in CMP)
°C Degrees Celsius
CMP Cytidine monophosphate, a nucleotide
CNS Central nervous system
CORE Sequence facility of the Universitätsklinikum Freiburg
CTP Cytidine triphosphate
CYLD Familial cylindromatosis
ddH2O Deionized distilled water
DHPLC Denaturing high performance liquid chromatography
DMSO Dimethyl sulfoxide
DNA Desoxyribonucleic acid
dNTP Desoxyribonucleic acid triphosphate (dATP, dCTP, dGTP, dTTP)
EBV Epstein-Barr virus
EDTA Ethylene diamine tetraamino acid
F Phenylalanine
FCS Fetal calf serum
FISH Fluorescent in-situ hybridization
g Gram(s)
G Guanosine (nucleoside, as in GMP)
G0 Part of the interphase portion of the cell cycle (gap - or interruption in NA synthesis). D
GAP GTPase activating protein
GDP Guanosine diphosphate
GMP Guanosine monophosphate, a nucleotide
GTP Guanosine triphosphate
h Hour(s)
H2O Water
52
Abbreviations
HPLC High performance liquid chromatography MgCl2 Magnesium chloride µg Microgram(s) MHC Major histocompatibility complex
min. Minute(s) ml Milliliter(s) µl Microliter(s) mM Millimolar µM Micromolar Na Sodium
Na2CO3 Sodium carbonate NH4 Ammonium PBS Phosphate buffered saline PCR Polymerase chain reaction PKD Polycystic kidney disease PTT Protein truncation test
rpm Rotations per minute RPMI Cell culture medium (Roswell Park Memorial Institute) s Second(s) S Part of the interphase portion of the cell cycle (synthesis of DNA) SSCP Single strand conformational polymorphism
T Thymidine (nucleoside, as in TMP) TBE Buffer consisting of: Tris, boric acid and EDTA TCA Tricarboxylic acid TMP Thymidine monophosphate, a nucleotide TTP Thymidine triphosphate TSC Tuberous sclerosis complex
TSC1 TSC gene in humans, on chromosome 9q34 TSC2 TSC gene in humans, on chromosome 16p13 tsc1 or tsc2 TSC genes in non-humans (e.g. Eker rat model) U Uridine (nucleoside, as in UMP) UMP Uridine monophosphate, a nucleotide
UV Ultra violet V Volt(s) Vh Volt-hour(s)
53
9 Literature
Au KS, Rodriguez JA, Finch JL, Volcik KA, Roach ES, Delgado MR, Rodrigues E Jr,
and Northrup H (1998) Germ-line mutational analysis of the TSC2 gene in 90
tuberous-sclerosis patients. Am J Hum Genet 62:286-294
Baker P, Piven J, Yutaka S (1998) Autism and tuberous sclerosis complex:
prevalence and clinical features. J Autism Dev Disord 28(4):279-285
Becker WM and Deamer DW (1991) The World of the Cell. Benjamin/Cummings
Publishing Company, Inc., Redwood City, CA/USA
Carbonara C, Longa L, Grosso E, Borrone C, Garre MG, Brisigotti M, Bigone N (1994)
9q34 loss of heterozygosity in tuberous sclerosis astrocytoma suggests a growth
suppressor-like activity also for the TSC1 gene. Hum Mol Genet 3:1829-1832
Carsillo T, Astrinidis A, Henske EP (2000) Mutations in the tuberous sclerosis complex
gene TSC are a cause of sporadic pulmonary lymphangioleiomyomatosis. Proc Natl
Acad Sci USA 97(11):6085-6090
Cheadle JP, Reeve MP, Sampson JR, Kwiatkowski DJ (2000) Molecular genetic
advances in tuberous sclerosis. Hum Genet 107:97-114
Crino PB, Henske EP (1999) New developments in the neurobiology of the tuberous
sclerosis complex. Neurology 53(7):1384-1390
European Chromosome 16 Tuberous Sclerosis Consortium (1993) Identification and
characterization of the tuberous sclerosis gene on chromosome 16. Cell 75:1305-1313
Geist R, Gutmann DH (1995) The tuberous sclerosis 2 gene is expressed at high
levels in the cerebellum and developing spinal cord. Cell Growth Differ 6(11):1477-
1483
Gillberg Ca, Gillberg Ch, Ahlsen G (1994) Autistic behavior and attention deficits in
tuberous sclerosis: a population based study. Dev Med Child Neurol 36:50-56
Gomez MR, Sampson JR, Whittemore VH (1999) Tuberous Sclerosis Complex.
Oxford University Press, New York-Oxford
Berg H (1913) Z Ges Neurol Psychiatr 19:528-539 (as cited in Gomez, 1999)
Critchley M, Earl CJC (1932) Brain 55:311-346 (as cited in Gomez, 1999)
Vogt H (1908) Z Erforsch Behandl Jugendl Schwachsinns 2:1-12 (as cited in
Gomez, 1999)
Von Recklinghausen F (1862) Monatsschr Geburtskd 20:1-2 (as cited in Gomez,
1999)
54
Green AJ, Smith M, Yates JR (1994) Loss of heterozygosity on chromosome 16p133
in hamartomas from tuberous sclerosis patients. Nat Genet 6:193-196
Green AJ, Sepp T, Yates JRW (1996) Clonality of tuberous sclerosis hamartomas
shown by non-random X-chromosome inactivation. Hum Genet 97:240-243
Gutierrez G, Smalley SL, Tanguay PE (1998) Autism in tuberous sclerosis complex. J
Autism Dev Disord 28(2):97-103
Harms V (1988) Biomathematik, Statistik und Dokumentation. Harms Verlag, Kiel
Henry KW, Yuan X, Koszewaki NJ, Onda H, Kwiatkowski DJ, and Noonan DJ (1998)
Tuberous sclerosis gene 2 product modulates transcription mediated by steroid
hormone receptor family members. J Biol Chem 273:20535-20539
Henske EP, Scheithauer BW, Short MP, Wollman R, Nahmias J, Hornigold N, van
Slegtenhorst M, Welsh CT, Kwiatkowski D (1996) Allelic loss is frequent in tuberous
sclerosis kidney lesions but rare in brain lesions. Am J Hum Genet 59:400-406
Hunt A, Dennis J (1987) Psychiatric disorder among children with tuberous sclerosis.
Dev Med Child Neurol 29:190-198
Hunt A, Stores G (1994) Sleep disorder and epilepsy in children with tuberous
sclerosis: A questionnaire-based study. Dev Med Child Neurol 36:108-115
International Molecular Genetic Study of Autism Consortium (1998) A full genome
screen for autism with evidence for linkage to a region on chromosome 7q. Hum
Mol Genet 7(3):571-8
Ito N and Rubin G (1999) Gigas, a Drosophila homolog of tuberous sclerosis gene
product-2, regulates the cell cycle. Cell 96:529-539
Janssen B, Sampson J, van der Est M, Deelen W, Verhoef S, Daniels I, Hesseling A,
Brook-Carter P, Nellist M, Lindhout D, Sandkuijl L, Halley D (1994) Refined
localization of TSC1 by combined analysis of 9q34 and 16p13 data in 14 tuberous
sclerosis families. Hum Genet 94(4):437-40
Jin F, Wienecke R, Guang-Hui X, Maize JC, DeClue JE, Yeung RS (1996)
Suppression of tumorigenicity by the wild-type tuberous sclerosis 2 (Tsc2) gene and
its C-terminal region. Proc Natl Acad Sci USA 93:9154-9159
Jones AC, Austin J, Hansen N, Hoogendoorn B, Oefner PJ, Cheadle JP, O’Donovan
MC (1999a) Optimal temperature selection for mutation detection by denaturing
HPLC and comparison to single-stranded conformation polymorphism and
heteroduplex analysis. Clin Chem 45(8):1133-1140
Literature
55
Jones AC, Daniells CE, Snell RG, Tachatake M, Idziaszczyk SA, Krawczak M,
Sampson JR, Cheadle JP (1997) Molecular genetic and phenotypic analysis reveals
differences between TSC1 and TSC2 associated familial and sporadic tuberous
sclerosis. Hum Mol Genet 6(12):2155-2161
Jones AC, Shyamsundar MM, Thomas MW, Maynard J, Idziaszczyk S, Tomkins S,
Sampson JR, Cheadle JP (1999b) Comprehensive mutation analysis of TSC1 and
TSC2 – and phenotypic correlations in 150 families with tuberous sclerosis. Am J
Hum Genet 64:1305-1315
Knudson AG (1971) Mutation and cancer: statistical study of retinoblastoma. Proc Natl
Acad Sci USA 68:820-823
Knudson AG (1993) Antioncogenes and human cancer. Proc Natl Acad Sci USA
90:10914-10921
Krawczak M, Reiss J, Cooper DN (1992) The mutational spectrum of single base-pair
substitutions in mRNA splice junctions of human genes: causes and consequences.
Hum Genet 90(1-2):41-54
Kwiatkowska J, Wigowska-Sowinska J, Napierala D, Slomski R, Kwiatkowski D (1999)
Mosaicism in tuberous sclerosis as a potential cause of the failure of molecular
diagnosis. N Engl J Med 340(9):703-707
Kwiatkowski D and Short P (1994) Tuberous Sclerosis. Arch Dermatol 130:348-354
Langkau N, Martin N, Brandt R, Zügge K, Quast S, Wiegele G, Jauch A, Rehm M,
Kuhl A, Mack-Vetter M, Zimmerhackl LB, Janssen B (2002) TSC1 and TSC2
mutations in tuberous sclerosis, the associated phenotypes and a model to explain
observed TSC1/TSC2 frequency ratios. Eur J Pediatr 161:393-402.
Lewin B (1998) Molekularbiologie der Gene. Spektrum Akademischer Verlag,
Heidelberg-Berlin
Martignoni G, Pea M, Rigaud G, Manfrin E, Colato C, Zamboni G, Scarpa A,
Tardanico R, Roncalli M, Bonetti F (2000) Renal angiomyolipoma with epithelioid
sarcomatous transformation and metastases: demonstration of the same genetic
defects in the primary and metastatic lesions. Am J Surg Pathol 24:889-894
Martin N, Gierke K, Langkau N, Brandt R, Quast S, Wiegele G, Jauch A, Rehm M,
Kuhl A, Mack-Vetter M, Janssen B and Zimmerhackl LB. Discordant clinical
manifestations in monozygotic twins with the identical mutation in the TSC2 gene.
(accepted for publication by Clin Genet)
Literature
56
Mayer K, Ballhausen W, Rott HD (1999) Mutation screening of the entire coding
regions of the TSC1 and the TSC2 gene with the protein truncation test (PTT)
identifies frequent splicing defects. Hum Mutat 14(5):401-11
Niida Y, Lawrence-Smith N, Banwell A, Hammer E, Lewis J, Beauchamp RL, Sims K,
Ramesh V, Ozelius L (1999) Analysis of both TSC1 and TSC2 for germline
mutations in 126 unrelated patients with tuberous sclerosis. Hum Mutat 14(5):412-
22
Orita M, Iwahana H, Kanazawa H, Hayashi K, Sekiya T (1989) Detection of
polymorphisms of human DNA by gel electrophoresis as single-strand-conformation
polymorphisms. Proc Natl Acad Sci USA 83(3):2766-2770
Osborne JP, Fryer A, Webb D (1991) Epidemiology of tuberous sclerosis. Ann NY
Acad Sci 615:125-127
Plank TL, Yeung RS, Henske EP (1998) Hamartin, the product of the tuberous
sclerosis 1 (TSC1) gene, interacts with tuberin and appears to be localized to
cytoplasmatic vesicles. Cancer Res 58:4766-4770
Povey S, Burley MW, Attwood J, Benham F, Hunt D, Jeremiah SJ et al. (1994) Two
loci for tuberous sclerosis: one on 9q34 and one on 16p13. Ann Hum Genet 58:107-
127
Roach ES, DiMario FJ, Kandt RS, Northrup H (1999) Tuberous sclerosis consensus
conference: recommendations for diagnostic evaluation. J Child Neurol 14(6):401-
407
Rose VM, Au KS, Pollom G, Roach ES, Prashner HR, Northrup H (1999) Germ-line
mosaicism in tuberous sclerosis: how common? Am J Hum Genet 64:986-992
Rott HD, Ballhausen W, Mayer K (1999) Klinik und Genetik der tuberösen Sklerose.
Pädiat Prax 56:233-244
Smalley SL (1998) Autism and tuberous sclerosis. J Autism Dev Disord 28(5):407-14
Soucek T, Pusch O, Wienecke R, DeClue JE, Hentstschläger M (1997) Role of the
tuberous sclerosis gene-2 product in cell cycle control. J of Biol Chem
272(46):29301-29308
Vanderhooft SL, Francis JS, Pagon RA, Smith LT, Sybert VP (1996) Prevalence of
hypopigmented macules in a healthy population. J Pediatr 129(3):355-361
Literature
57
Van Slegtenhorst M, de Hoogt R, Hermans C, Nellist M, Janssen B, Verhoef S,
Lindhout D, van den Ouwenland A, Halley D, Young J, Burley M, Jeremiah S,
Woodward K, Nahmias J, Fox M, Ekong R, Osborne J, Wolfe J, Povey S, Snell R,
Cheadle J, Jones A, Tachataki M, Ravine D, Sampson J, Reeve M, Richardson P,
Wilmer R, Munro C,Hawkins T, Sepp T, Ali J, Ward S, Green A, Yates J,
Kwiatkowska J, Henske E, Short M, Haines J, Jozwiak S, and Kwiatkowski D (1997)
Identification of the tuberous sclerosis gene TSC1 on chromosome 9q34. Science
277:805-808
Van Slegtenhorst M, Nellist M, Nagelkerken B, Cheadle J, Snell R, van den
Ouwenland A, Reuser A, Sampson J, Halley D, van der Sluijs P (1998) Interaction
between hamartin and tuberin, the TSC1 and TSC2 gene products. Hum Mol Genet
7(6):1053-1057
Van Slegtenhorst M, Verhoef S, Tempelaars A, Bakker L, Wang Q, Wessels M,
Bakker R, Nellist M, Lindhout D, Halley D, van den Ouwenland A, (1999) Mutational
spectrum of the TSC1 gene in a cohort of 225 tuberous sclerosis complex patients:
no evidence for genotype-phenotype correlation. J Med Genet 36:285-289
Verhoef S, Bakker L, Tempelaars AMP, Hesseling-Janssen ALW, Mazurczak T,
Jozwiak S, Fois A, Bartalini G, Zonnenberg BA, van Essen AJ, Lindhout D, Halley
DJJ, van den Oweland AMW (1999) High rate of mosaicism in tuberous sclerosis
complex. Am J Hum Gen 64:1632-1637
Verhoef S, Schrander-Stumpel CTRM, Vuzevski VD, Tempelaars AMP, Jansen ALJ,
Malfeyt GAM, Ceelen TL, Lindhout D, Halley DJJ, van den Oweland AMW (1998)
Familial cylindromatosis mimicking tuberous sclerosis complex and confirmation of
the cylindromatosis locus, CYLD-1, in a large family. J Med Genet 35(10):841-5
Vidal-Puig A and Moller DE (1994) Comparative sensitivity of alternative single-strand
conformational polymorphism (SSCP) methods. Biotechniques 17(3):490-2, 494,
496.
Von Harnack, ed. (1994) Kinderheilkunde. 9 Aufl. Springer, Berlin-Heidelberg
Webb DW, Osborne JP, (1991) Non-penetrance in tuberous sclerosis. J Med Genet
28:417-419
Wienecke R, König A, De Clue JE (1995) Identification of tuberin, the tuberous
sclerosis-2 product. J Biol Chem 270(27):16409-16414
Literature
58
Literature
Wienecke R, Maize JC Jr, Shoarinejad F, Vass WC, Reed J, Bonifacino JS, Resau JH,
de Gunzburg J, Yeung RS, DeClue JE (1996) Co-localization of the TSC2 product
tuberin with its target Rap1 in the Golgi apparatus. Oncogene 13:913-923
Xiao GH, Shoarinejad F, Jin F, Golemis EA, Yeung RS (1997) The tuberous sclerosis
2 gene product, tuberin, functions as a Rab5 GTPase activating protein (GAP) in
modulating endocytosis. J Biol Chem 272:6097-6100
Yamashita Y, Ono J, Okada S, Wataya-Kaneda M, Yoshikawa K, Nishizawa M,
Hirayama Y, Kobayashi E, Seyama K, Hino O (2000) Analysis of all exons of TSC1
and TSC2 genes for germ line mutations in Japanese patients with tuberous
sclerosis: report of 10 mutations. Am J Med Genet 90(2):123-6
Yates JRW, van Bakel I, Sepp T, Payne SJ, Webb DW, Nevin NC, Green AJ (1997)
Female germ line mosaicism in tuberous sclerosis confirmed by molecular genetic
analysis. Hum Mol Genet 6(13):2265-2269
Young J and Povey S (1998) The genetic basis of tuberous sclerosis. Mol Med Today
July:313-319
Zhang H, Nanba E, Yamamoto T, Ninomiya H, Ohno K, Mizuguchi M, Takeshita K
(1999) Mutational analysis of TSC1 and TSC2 genes in Japanese patients with
tuberous sclerosis complex. J Hum Genet 44:391-396
Zimmerhackl LB, Rehm M, Kaufmehl K, Kurlemann G, Brandis M (1994) Renal
involvement in tuberous sclerosis complex: a retrospective survey. Pediatr Nephrol
8(4):451-7

59
10 Acknowledgments
I would first like to thank Prof. Dr. L.B. Zimmerhackl for allowing me to be part
of this research project, for his immense time investment and excellent advising
throughout the entire dissertation.
I am likewise very indebted to my predecessor, Dr. Nicola Martin, for her
patient explanations, fruitful discussions and thorough training in methods.
The entire Nephrolabor and all members of our research group deserve many
thanks for their teamwork and for the very valuable, pleasant and educational
experience we shared. I am particularly grateful to the technical assistants in the
Nephrolabor, Bärbel Höfflin, Simone Joos, Monika Kramer and Monika Mack-Vetter
who organized materials and were in charge of all the cell cultures.
A great deal of credit for an enjoyable and productive cooperation on this
project is owed to Dr. Bart Janssen and coworkers from the Heidelberg Institut für
Humangenetik.
I also thank Dr. Angela Gerber, Andrea Lohrmann, Dr. Nicola Martin, Dr.
Jochen Zügge, and Dr. Ulrich Zügge for their indispensable efforts in reading,
correcting and commenting on this thesis.
I truly appreciate the work of Dr. Hennighausen and Prof. Dr. Schulz for their
support as second referees of this thesis.
Last but far from least, I would like to thank my family for their constant
encouragement and support, without which I never would have been able to finish
this project.
60
11 Curriculum vitae
Birth date and place
January 25th, 1973 in Madison, Wisconsin / U.S.A. Maiden name: Gierke
Current position
July 1st, 2004 - present
Ärztin im Praktikum (first year resident) Department of Anesthesiology Hospital zum Heiligen Geist, Frankfurt
University education
July 2nd, 2004 USMLE Step 2
J une 9th, 2004 Drittes Staatsexamen (3rd state examination)
October 2002 - June 2004
J ohann-Wolfgang-von-Goethe-Universität, Frankfurt Practical year, Universitätsklinikum April 2003 - March 2004
Elective subject: pediatrics Rotations in transplant and thoracic surgery, University
of Wisconsin - Madison, April - June 2003 Zweites Staatsexamen (2nd state examination) March 2003
October 1996 - September 2002
Albert-Ludwigs-Universität, Freiburg Thesis in the nephrology laboratory of the Universitäts
Kinderklinik, advisor: Prof. Dr. L.B. Zimmerhackl, October 1999 - July 2002
USMLE Step 1, March 2001 Erstes Staatsexamen (1st state examination), August 1999 Physikum (preclinical examination), March 1998
1991 - 1996 University of Wisconsin - Madison / U.S.A.
Bachelor of Science (B.S.) with honors in biochemistry and German literature, May 1996
Honors thesis in biochemistry, 1995 - 1996 Study abroad year at the Albert-Ludwigs-Universität,
Freiburg, 1994 - 1995
61
12 Publications
(in chronological order) Martin N, Zügge K, Langkau N, Brandt R, Friebel D, Janssen B and Zimmerhackl LB
(2003) Discordant clinical manifestations in monozygotic twins with the identical
mutation in the TSC2 gene. Clin Genet May 63(5):427-30.
Lankau N, Martin N, Brandt R, Zügge K, Quast S, Wiegele G, Jauch A, Rehm M,
Kuhl A, Mack-Vetter M, Zimmerhackl LB and Janssen B (2002) TSC1 and TSC2
mutations in tuberous sclerosis, the associated phenotypes and a model to
explain observed TSC1/TSC2 frequency ratios. Eur J Pediatr July 161:393-402.
Gierke K, Martin N, Langkau N, Brandt R, Quast S, Wiegele G, Jauch A, Rehm M,
Mack-Vetter M, Janssen B and Zimmerhackl LB (2001) Tuberous Sclerosis
Complex (TSC): Mutational analysis in patients and healthy probands – the
challenges of genotype-phenotype correlation. Arbeitsgemeinschaft für
Pädiatrische Nephrologie in Wien, 22.-24. März.
Gierke K, Martin N, Langkau N, Brandt R, Quast S, Wiegele G, Jauch A, Rehm M,
Mack-Vetter M, Janssen B and Zimmerhackl LB (2000) Mutational Analysis and
Genotype-Phenotype Correlation in Tuberous Sclerosis Complex (TSC) – the
Freiburg-Heidelberg Project. Third Symposium of the Upper Rhine University
Children‘s Hospitals in Basel, June 30th.
Spangler NJ, Meyers MR, Gierke KL, Kerby RL, Roberts GP, Ludden PW (1998)
Substitution of valine for histidine 265 in carbon monoxide dehydrogenase from
Rhodospirillum rubrum affects activity and spectroscopic states. J Biol Chem Feb
13; 273(7): 4059-64.