molecular masses - climates
TRANSCRIPT

THE KINETIC ATMOSPHERE Molecular Masses
Copyright 2016 by Patrick Tyson www.climates.com Page 1 of 14
MOLECULAR MASSES
The System of Study: Let us postulate a system of study consisting of a p-population of gaseous
atmospheric molecules in random motion in proximity space. The surface of interest is the
intangible surface of an imaginary sphere surrounded by the p-population.
Definition of Mean Molecular Mass: The mean molecular mass of this p-population is defined as:
1
1 N
p pm m
N MSS01
Here, p
m is the mean molecular mass in kilograms, N is the number of atmospheric gas molecules
in the system, and p
m is the individual molecular mass in kilograms.
Variability of Molecular Masses
The molecules that make up our atmosphere have many different molecular masses.
Nitrogen, the most common atmospheric gas has three different molecular masses. Oxygen, the
next most common, has six. Argon has three. Carbon dioxide has twelve. Water vapor has nine
different molecular masses. And these masses are just for the un-ionized atmospheric molecules.
When you add in all the different masses of the atmospheric ions, the number of different molecular
masses grows even greater.
Moreover, the proportions of the various gases in the free atmosphere vary from time to time
and from place to place. Yes, there are standard mixing ratios and standard molecular masses for
dry air and for water vapor. However, your chances of getting a random sample of the free
atmosphere with the exact mean molecular mass as the standard value are slim, at best. There are
several reasons for this.
Variability as a Function of Scale: Let’s take a system sample of the free atmosphere. The system
sample size is one cubic centimeter. The mean molecular mass of the cubic millimeter in that
sample’s upper northeast corner (test sample A) is very likely to be the same to within five
significant figures, or more as the mean molecular mass of the cubic millimeter in the lower
southwest corner (test sample B).

THE KINETIC ATMOSPHERE Molecular Masses
Copyright 2016 by Patrick Tyson www.climates.com Page 2 of 14
If we expand that system sample size to one cubic meter, the mean molecular masses of those
two test samples in opposite corners will still (usually, but not always) match to within three
significant figures. There are plenty of places within the free atmosphere where that match will only
be to one significant figure1.
Change our system sample size to one cubic kilometer, and matches to only one significant
figure will be the norm.
Variability as a Function of Meteorological Processes: The most common cause of variability in
mean molecular mass is simple changes in humidity. Anything that changes the ratio of water vapor
to dry air will change the mean molecular mass significantly. Let us take a vertical column through
the base of a simple cumulus cloud. The mean molecular mass of the air near the surface of the
ground will differ from the air just under the base of the cloud. This, in turn, will differ from that
within the cloud and from that a few meters above the cloud.
Water vapor ratios are not the only culprit. Concentrations of carbon dioxide, ozone, carbon
monoxide, methane, and the like vary significantly from place to place and time to time within the
atmosphere. Even the concentration of oxygen will vary from a crowded auditorium to the open
ocean to a polar desert to the depths of a forest at night. Differences of composition with elevation
appear when you leave the troposphere, and even at times within the troposphere.
This principle still holds true on a smaller scale. The air next to a rain drop will probably
have a different mixing ratio (water vapor to dry air) than air some distance away. Condensing air
around a cloud droplet at the base of a cloud will have a different mean molecular mass than
evaporating air around a cloud droplet at the cloud’s margin. And so on and so forth.
As a matter of fact, we can say with some confidence that whenever weather is occurring
there exist many disparities in mean molecular masses from place to place and from time to time
within that weather system.
Variability as a Function of Ecological Processes: A moment’s thought will convince you that the
air you exhale has a different mean molecular mass than the air you inhaled a moment earlier. It has
a higher concentration of water vapor and carbon dioxide and a lower concentration of oxygen.
Similarly, the air moving toward the ocean surface will usually have a different mean molecular
1 It must be admitted that matches of only one significant figure are made more probable by the fact
that the most common mean value, 4.81 x 10⁻²⁶ kilograms per molecule, is reduced to a single
significant figure match when compared to a sample whose mean mass has dropped by a mere four-
tenths of one percent.

THE KINETIC ATMOSPHERE Molecular Masses
Copyright 2016 by Patrick Tyson www.climates.com Page 3 of 14
mass than the air moving away from that surface. This is also due to differing concentrations of
water vapor and carbon dioxide.
This principle generally holds true for other landscapes as well. Forests absorb carbon
dioxide and oxygen and release carbon dioxide and oxygen and water vapor. The proportions vary
with time of day and time of year and weather conditions. Water bodies are both sources and sinks
of both water vapor and carbon dioxide and other gases. Areas of decaying vegetation produce
methane—as do large herds of ruminants (and the occasional human). Cities are enormous sources
of all kinds of strange gases—in addition to the obvious water vapor, carbon dioxide and carbon
monoxide.
The consequence of these three sources of mean mass variability is to make us extremely
leery of using an overly precise value for the mean molecular mass of any portion of the free
atmosphere.
Mean Molecular Masses
In the discussion above, we suggested caution in using a “one size fits all” mean molecular
mass for the free atmosphere. This does not mean that we should not acknowledge standards. They
are useful points of departure.
By taking many samples of atmospheric air at different places, different seasons, and
different elevations, atmospheric scholars have arrived at a mean molecular value for dry
tropospheric air. It is:
p
m 4.80985 x 10⁻²⁶ kilograms
Here, the dot below the mass symbol denotes that the symbol refers to the mass of dry air only. A
tilde (~) below the mass symbol would denote that the symbol referred only to water vapor. The
mass symbol without anything at all beneath it refers to humid air. All significant parcels of the free
atmosphere are composed of humid air. The p subscript denotes that the molecules are members of
the p-population.
All tables may be found at the end of the text section. Table MSS01 shows how this mean
molecular mass for dry air was reached. For each component gas of the atmosphere, the component
name, chemical symbol, mean molecular mass, and mean atmospheric abundance are shown.
Sources for these values can be found in the References section at the end of this paper.
The mean molecular mass for the water molecule is that specified by the Vienna Standard
Mean Ocean Water (VSMOW) protocol. Its value is:
pm 2.99150512 x 10⁻²⁶ kilograms

THE KINETIC ATMOSPHERE Molecular Masses
Copyright 2016 by Patrick Tyson www.climates.com Page 4 of 14
In case you are wondering, the VSMOW standard is not unique to Vienna and has nothing to do with
ocean water. It applies solely to fresh water of laboratory isotopic composition and purity. Once
again, the p subscript denotes that the molecules are members of the p-population.
For humid air within the p-population, the mean molecular mass becomes:
1
( )p p p
m m p m pp
MSS02
Isotopic Variations in Molecular Masses: Except for Iodine, every common atmospheric gas is
present in two or more isotopes. Each of these isotopes has its own mass and its own atmospheric
abundance. Table MMS02 shows these isotopes.
Carbon-14: Not included in the MMS02 listing because it is unstable is carbon-14, also known as
radioactive carbon. This isotope is found in all atmospheric carbon compounds in the parts per
trillion concentrations. Its half-life is on the order of 5,730 years. It is produced in the upper
atmosphere by the bombardment of 14N by cosmic rays; and decays back into 14N by beta decay. In
the form of carbon-dioxide, it dissolves in water and thence is taken up by all living things. After
being “fixed” in these life forms it starts to decay at a predictable rate. By measuring the rate of
decay, scholars can determine how long it has been since the isotope was fixed. The technique is
useful for dating samples up to about 60,000 years old.
Abundance of Water Vapor in the Free Atmosphere: Studies suggest that water vapor makes up
roughly four-tenths of one percent by volume of the atmospheric gases. Close to the surface, its
abundance varies from virtually nil to several percent.
At an atmospheric temperature of 25°C, an atmospheric pressure of 100,000 Pascals, and a
vapor pressure of 1,583.8 Pascals (50% RH), water vapor makes up an obvious 1.5838% by volume
of the atmosphere where most of us live. This seems to me to be a useful working average for the
anthroposphere.
Mean Molecular Impulse Masses
For the i-subpopulation of molecules (molecules temporarily interacting with the surface of
interest), the mean molecular masses will be somewhat different. As we see in Molecular Speeds,
this is because this interactive population will have a higher proportion of faster molecules in its

THE KINETIC ATMOSPHERE Molecular Masses
Copyright 2016 by Patrick Tyson www.climates.com Page 5 of 14
impulse speed distribution than are found in the proximity speed distribution of the p-population.
Higher speeds are more likely to be associated with lower masses.
We can state with some confidence that for almost every sample of air from the free
atmosphere, the mean molecular impulse mass is less than the mean molecular proximity mass. That
is,
i pm m
The next step is to evaluatei
m for dry air. To do that, we need to know how frequently the
molecules of each of the various dry air isotopes hit a square meter of surface in one second of time.
The frequency with which a molecular isotope strikes a surface is termed the molecular flux rate for
that isotope. Borrowing the universal flux rate from Molecular Flows gives us:
iso iso isof n v MSS03
In this specific case, isof is the isotopic flux in number of impacts per square meter of surface per
second, iso
n is the isotopic number density in number of isotopic molecules per cubic meter with a
component of translatory movement normal to and toward the surface, and iso
v is the mean
translational isotopic proximity speed in meters per second normal to and toward the surface.
We may safely substitute isotopic abundance for pn if we keep our equations normalized. To
evaluateiso
v , we borrow from Molecular Speeds the equivalence:
σ2iso
v
MSS04
Here, σ is sigma, the standard deviation of the proximity speed distribution ( /p
dn dv ). We can
evaluate σ by borrowing from Kinetic Energies of Translation the equivalence:
Bσ k2
isom T MSS05
In this specific case, iso
m is the singular isotopic mass in kilograms, Bk is Boltzmann’s Constant in
joules per molecule per Kelvin, and T is the isotopic gas temperature in Kelvins.
For each isotope, we now have the mean isotopic speed:
Bk12
2iso
iso
Tv
m
MSS06

THE KINETIC ATMOSPHERE Molecular Masses
Copyright 2016 by Patrick Tyson www.climates.com Page 6 of 14
The frequency with which each isotope impacts upon a surface thus becomes:
iso isof Av MSS07
Here, A is the isotopic abundance shown in Table MSS02.
To get the mean value (isov
) for all ninety-five isotopes, we sum all ninety-five of the
individual fluxes, and divide by the total abundance (unity). That is:
95
1
iso isov f MSS08
We then convert this new value of isov
into the equivalent value of .
π2 isov MSS09
We can now obtain the value of isom .
Bk
σ2iso
Tm
MSS10
After all of this, it turns out that the value of the mean impulse mass for the mixture of
ninety-five dry air isotopes is:
im = 47.9514505 x 10⁻²⁷ kilograms
This compares to the mean molecular proximity mass for dry air of:
pm 48.0985096 x 10⁻²⁷ kilograms
This is only a diminution of barely under one percent over the mean dry air molecular mass. Still, it
is a diminution.
It should be noted that—despite the use of the temperature term in the above equations—the
mean impulse mass is independent of temperature. It is purely a function of the individual isotopic
masses and the individual isotopic abundances.

THE KINETIC ATMOSPHERE Molecular Masses
Copyright 2016 by Patrick Tyson www.climates.com Page 7 of 14
Mean Impulse Mass of Water Vapor: Following the identical procedure for water vapor, we
arrive at the mean molecular impulse mass of:
.29 9144976i
m x 10-27 kilograms
This compares to the mean molecular mass of:
.29 9150512pm x 10-27 kilograms
The very slight diminution (less than nineteen parts per million) is a consequence of the fact that the
most common isotope of water makes up a full 99.73% of all water vapor molecules.
Significance of the Mean Impulse Mass: It should be noted that the mean impulse mass should
always be used in preference to the mean molecular mass whenever we calculate parameters
involving molecular passages or other interactions with a surface of interest; such as impacts,
collisions, diffusion, kinetic energies, and the like. The mean molecular proximity mass (p
m ) is
useful only for calculating atmospheric mass density. Both the pressure parameter and the
temperature parameter make use of the mean impulse mass; and make no use of the mean molecular
mass.
Of course, if you only use three significant figures in your calculations, the argument
becomes moot—most of the time!
Molecular Masses in Moving Air: Molecular mass is not affected by either wind speed or wind
direction.
* * * * *

THE KINETIC ATMOSPHERE Molecular Masses
Copyright 2016 by Patrick Tyson www.climates.com Page 8 of 14
TABLES
TABLE MSS01 - MEAN MOLECULAR MASSES OF DRY AIR
COMPONENT GAS
ATMOSPHERIC
ABUNDANCE
MASS
NUMBER
(u)
MEAN
MOLECULAR
MASS x 10-27 kg
Nitrogen 0.780795000000 28.013400 46.517
Oxygen 0.209447777200 31.998800 53.135
Argon 0.009340000000 39.947800 66.335
Carbon Dioxide 0.000390000000 44.009500 73.079
Neon 0.000018180000 20.179700 33.509
Helium 0.000005240000 4.002602 6.646
Methane 0.000001790000 16.042460 26.639
Krypton 0.000001140000 83.798000 139.150
Hydrogen 0.000000550000 2.158800 3.585
Nitrous Oxide 0.000000300000 44.012800 73.085
Carbon Monoxide 0.000000010000 28.010100 46.512
Xenon 0.000000009000 131.293000 218.017
Ozone 0.000000003500 47.998200 79.703
Nitrogen Dioxide 0.000000000200 46.005500 76.394
Iodine 0.000000000100 253.808940 421.460
Dry Air 1.000000000000 28.965604 48.0985

THE KINETIC ATMOSPHERE Molecular Masses
Copyright 2016 by Patrick Tyson www.climates.com Page 9 of 14
TABLE MSS02 - ISOTOPIC MASSES AND ABUNDANCES OF DRY AIR
COMPONENT
GAS
SYMBOL
ISOTOPE
ISOTOPIC MASS
x 10-27 kg
ATMOSPHERIC
ABUNDANCE
Nitrogen N2 14N14N 46.50529 0.775121158
14N15N 48.16091 0.005663497
15N15N 49.81653 0.000010345
Oxygen O2 16O17O 54.78789 0.000158794
16O18O 56.44848 0.000856649
17O17O 56.45543 0.000000030
17O18O 58.11602 0.000000326
18O18O 59.77661 0.000000880
Argon Ar 36Ar 59.72550 0.000031158
37Ar 63.03859 0.000005875
38Ar 66.35909 0.009302967
Carbon Dioxide CO2 12C16O16O 73.04682 0.000383954
12C16O17O 74.71436 0.000000293
12C16O18O 76.37495 0.000001578
12C17O17O 76.38190 <1 ppb
12C17O18O 78.04249 0.000000001
12C18O18O 79.70308 0.000000002
13C16O16O 74.71293 0.000004153
13C16O17O 76.38047 0.000000003
13C16O18O 78.04106 0.000000017
13C17O17O 78.04801 <1 ppb
13C17O18O 79.70860 <1 ppb
13C18O18O 81.36918 <1 ppb
Neon Ne 20Ne 33.19822 0.000016449
21Ne 34.86110 0.000000049
22Ne 36.51755 0.000001682
Helium He 3He 5.008234 <1 ppb
4He 6.646478 0.000005240
Methane CH4 12CHHHH 26.62060 0.000001770
12CHHHD 28.29156 0.000000001
12CHHDD 29.96252 <1 ppb
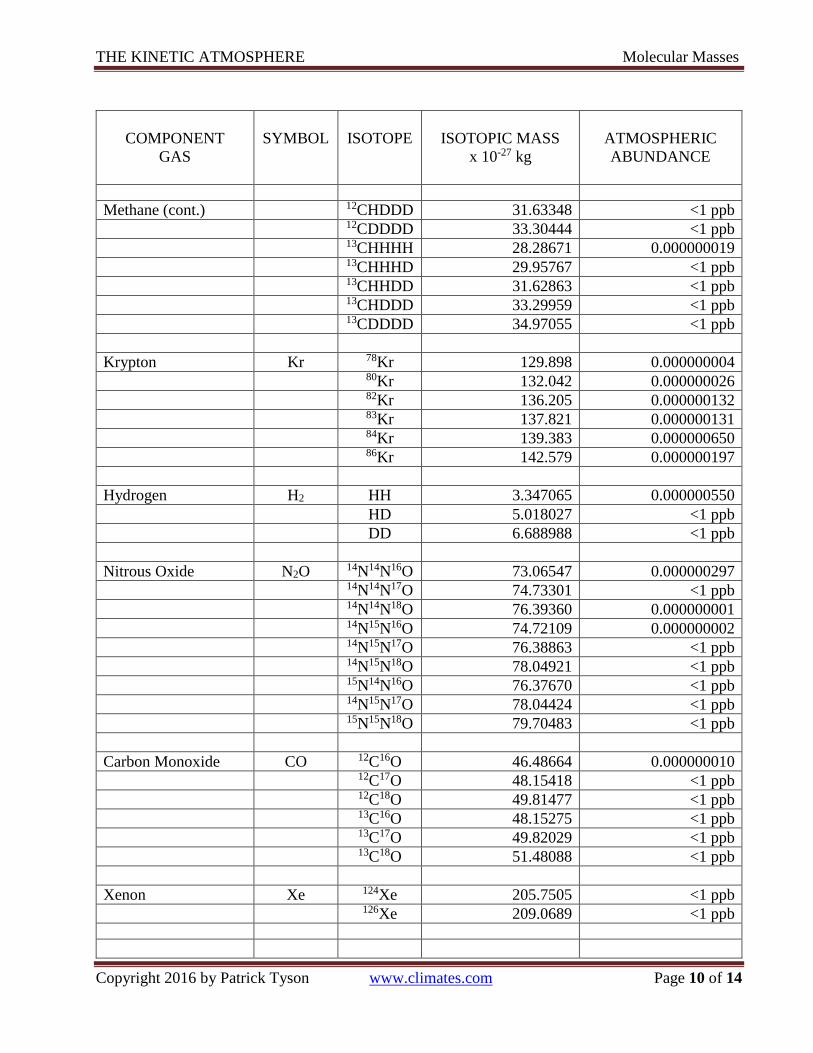
THE KINETIC ATMOSPHERE Molecular Masses
Copyright 2016 by Patrick Tyson www.climates.com Page 10 of 14
COMPONENT
GAS
SYMBOL
ISOTOPE
ISOTOPIC MASS
x 10-27 kg
ATMOSPHERIC
ABUNDANCE
Methane (cont.) 12CHDDD 31.63348 <1 ppb
12CDDDD 33.30444 <1 ppb
13CHHHH 28.28671 0.000000019
13CHHHD 29.95767 <1 ppb
13CHHDD 31.62863 <1 ppb
13CHDDD 33.29959 <1 ppb
13CDDDD 34.97055 <1 ppb
Krypton Kr 78Kr 129.898 0.000000004
80Kr 132.042 0.000000026
82Kr 136.205 0.000000132
83Kr 137.821 0.000000131
84Kr 139.383 0.000000650
86Kr 142.579 0.000000197
Hydrogen H2 HH 3.347065 0.000000550
HD 5.018027 <1 ppb
DD 6.688988 <1 ppb
Nitrous Oxide N2O 14N14N16O 73.06547 0.000000297
14N14N17O 74.73301 <1 ppb
14N14N18O 76.39360 0.000000001
14N15N16O 74.72109 0.000000002
14N15N17O 76.38863 <1 ppb
14N15N18O 78.04921 <1 ppb
15N14N16O 76.37670 <1 ppb
14N15N17O 78.04424 <1 ppb
15N15N18O 79.70483 <1 ppb
Carbon Monoxide CO 12C16O 46.48664 0.000000010
12C17O 48.15418 <1 ppb
12C18O 49.81477 <1 ppb
13C16O 48.15275 <1 ppb
13C17O 49.82029 <1 ppb
13C18O 51.48088 <1 ppb
Xenon Xe 124Xe 205.7505 <1 ppb
126Xe 209.0689 <1 ppb

THE KINETIC ATMOSPHERE Molecular Masses
Copyright 2016 by Patrick Tyson www.climates.com Page 11 of 14
COMPONENT
GAS
SYMBOL ISOTOPE ISOTOPIC MASS
x 10-27 kg
ATMOSPHERIC
ABUNDANCE
Xenon (continued) 128Xe 212.3888 <1 ppb
129Xe 214.0514 0.000000002
130Xe 215.7098 <1 ppb
131Xe 217.3730 0.000000002
132Xe 219.0320 0.000000002
134Xe 222.3551 0.000000001
136Xe 225.6792 0.000000001
Ozone O3 16O16O16O 79.68053 0.000000003
16O16O17O 81.34807 <1 ppb
16O16O18O 83.00866 <1 ppb
16O17O17O 83.01561 <1 ppb
16O17O18O 84.67620 <1 ppb
16O18O18O 86.33679 <1 ppb
17O17O17O 84.68315 <1 ppb
17O16O18O 86.34374 <1 ppb
17O18O18O 88.00433 <1 ppb
18O18O18O 89.66491 <1 ppb
Nitrogen Dioxide NO2 14N16O16O 76.37300 <1 ppb
14N16O17O 78.04054 <1 ppb
14N16O18O 79.70113 <1 ppb
14N17O17O 79.70808 <1 ppb
14N17O18O 81.36867 <1 ppb
14N18O18O 83.02926 <1 ppb
14N16O16O 78.02861 <1 ppb
14N16O17O 79.69616 <1 ppb
14N16O18O 81.35674 <1 ppb
14N17O17O 81.36370 <1 ppb
14N17O18O 83.02428 <1 ppb
14N18O18O 84.68487 <1 ppb
Iodine I2 127I127I 421.45960 <1 ppb

THE KINETIC ATMOSPHERE Molecular Masses
Copyright 2016 by Patrick Tyson www.climates.com Page 12 of 14
TABLE MSS03 - ISOTOPIC MASSES AND ABUNDANCES OF WATER VAPOR
(VSMOW)
GAS
SYMBOL
ISOTOPE
ISOTOPIC
MASS
x 10-27 kg
ISOTOPIC
ABUNDANCE
Water Vapor H2O HH16O 29.9072411 0.997309885333
HD16O 31.5782027 0.000310690470
DD16O 33.2491643 0.000000024197
HH17O 31.5747826 0.000378881958
HD17O 33.2457441 0.000000118033
DD17O 34.9167057 0.000000000009
HH18O 33.2353700 0.001999776964
HD18O 34.9063315 0.000000622988
DD18O 36.5772931 0.000000000049
VSMOW H2O - 29.9150512 1.000000000000

THE KINETIC ATMOSPHERE Molecular Masses
Copyright 2016 by Patrick Tyson www.climates.com Page 13 of 14
REFERENCES
Internal References: References to other essays in this collection are linked in the essay text by
hyperlinks. You may follow these hyperlinks or ignore them, as you choose.
External References: These are papers by other authors that contain statements or data that are
specifically incorporated into this essay.
Gaseous Composition of Dry Atmosphere: Wikipedia – retrieved 28/02/2011.
http://en.wikipedia.org/wiki/Atmosphere_of_Earth .
Atomic Weights and Isotopic Compositions: NIST – retrieved 28/02/2011.
http://physics.nist.gov/egi-bin/Composition/stand_alone.pl .
Atomic Mass Unit: Wikipedia – retrieved 28/02/2011.
http://en.wikipedia.org/wiki/Atomic_mass_unit
Isotopic Masses and Abundances of Atmospheric Argon - Jee-Yon Lee, Kurt Marti, Jeffrey P.
Severinghaus, Kenji Kawamura, Hee-Soo Yoo, Jin Bok Lee, and Jin Seog Kim; A redetermination
of the isotopic abundances of atmospheric Ar, Elsevier, 2006. www.sciencedirect.com
Isotopic Masses and Abundances of Water (VSMOW): The International Association for the
Properties of Water and Steam; Guideline on the Use of Fundamental Physical Constants and
Basic Constants of Water; Gaithersburg, 2001, revised July 2005. http://www.iapws.org .
Carbon-14: Wikipedia – retrieved 05/03/2011.
http://en.wikipedia.org/wiki/Carbon-14
CODATA Recommended Values of Fundamental Physical Constants: Peter J Mohr, Barry N
Taylor, and David B Newell; National Institute of Standards and Technology; December 2007.
http://physics.nist.gov/cuu/Constants/codata.pdf
General References: These are works that I have read carefully and whose views have helped to
shape the views presented in this collection. None of these authors are have any responsibility for
my many unconventional views and opinions.
Arthur Brown; Statistical Physics; Elsevier, New York, 1970.
D. Tabor; Gases, Liquids, and Solids; Third Edition; Cambridge University Press, 1991.

THE KINETIC ATMOSPHERE Molecular Masses
Copyright 2016 by Patrick Tyson www.climates.com Page 14 of 14
Charles Kittel; Thermal Physics; John Wiley & Sons, New York, 1969.
R. R. Rogers, M. K. Yau; A Short Course in Cloud Physics; Third Edition; Elsevier, New York,
1989.
William D. Sellers, Physical Climatology; University of Chicago Press, Chicago, 1965.
* * * * *
Table MMS01 Methodology: The starting point was the table in the Wikipedia article.
Abundances in this table totaled greater than unity. Consequently, abundances for nitrogen and
oxygen were reduced proportionately so that the total abundance equaled unity.
Computational System: All calculations were carried out by Microsoft’s© Excel Program 2003
(SP3).