monitoring and event management - bradmark€¦ · bradmark technologies surveillance white paper 4...
TRANSCRIPT

Today’s business systems have undergone a radical transformation in order to meet the new business imperatives. The days of scheduled down-time and unimpeded overnight batch runs have disappeared. Almost every business, in every industry
has found that its transactions have converged on a real-time horizon, regardless of time-zones and regardless of location.
What changed?With the commercialization of the Internet, businesses opened up their real-time production databases to their suppliers, partners, employees and customers. Now, customers could access their data and perform transactions at any time of day or night and from anywhere in the world. Whether tracking a package, reconciling a bank account or ordering a book, everyone wants to do business in their own time and place.
Yet another fundamental transition took place, as Email became the de-facto standard for business and personal communication. E-commerce greatly replaced the complexity involved in EDI (electronic data interchange systems). Again, the business was faced with the challenge of delivering this ubiquitous communication method on an uninterrupted basis, from anywhere in the world. The impact on the database availability has been dramatic. The pressure to maintain uninterrupted 24 X 7 systems is now a critical requirement to every business.
New World RequirementsNew technologies emerged to help DBAs cope with this new world. High availability systems, disaster recovery and back-up systems, dedicated data warehouse systems and sophisticated database monitoring and administration tools are now a necessity for most businesses. Add the multi-platform support for most DBAs – distributed systems, mainframes and various operating systems – and you have the complex world of the DBA.
Meeting New World Challenges with Real-Time, Performance Monitoring and Event Management
The Evolution of Information
Technical Whitepaper
Bradmark Technologies Surveillance White Paper 2
Data Solutions from Bradmark
Overview of the Surveillance Technology
The task of the DBA is an around-the-clock challenge, but now, there’s a real-time, proactive monitoring and management solution that can help maintain your IT goals and business objectives. Built by a single team using a common architecture it provides a comprehensive, cross-platform monitoring and administration solution for DBAs.
With Bradmark’s Surveillance DB™, system performance and availability can be viewed and managed from multiple Windows workstations, regardless of location. DBAs are now able to share information between the various agents, minimizing data retrieval and overhead while maximizing efficiency on complex networks. Surveillance monitor all of your Oracle, Sybase, MS SQL Server and DB2 UDB databases from a console with an intuitive, graphical user interface. Available on Microsoft Windows XP, 2000 and NT, the client interface has proven to be one of Surveillance DB’s strongest attributes. This customizable user interface provides focussed views to zero in on particular problems. For example, if resource contention is an immediate concern, the DBA can click and view a graphical representation of current locks on the database.
Connectionless monitoring and alerting capabilities decrease overhead and maximize resources.Bradmark’s distributed agent architecture enables DBAs to focus on critical issues while data collection and analysis continues on the same or other servers. Data collection and analysis modules are autonomous from the user interface. A Console can disconnect from the server without disrupting the monitoring process. In fact, the Console does not have to be running to receive or respond to alert messages—a crucial capability in any 24 X 7 environment.
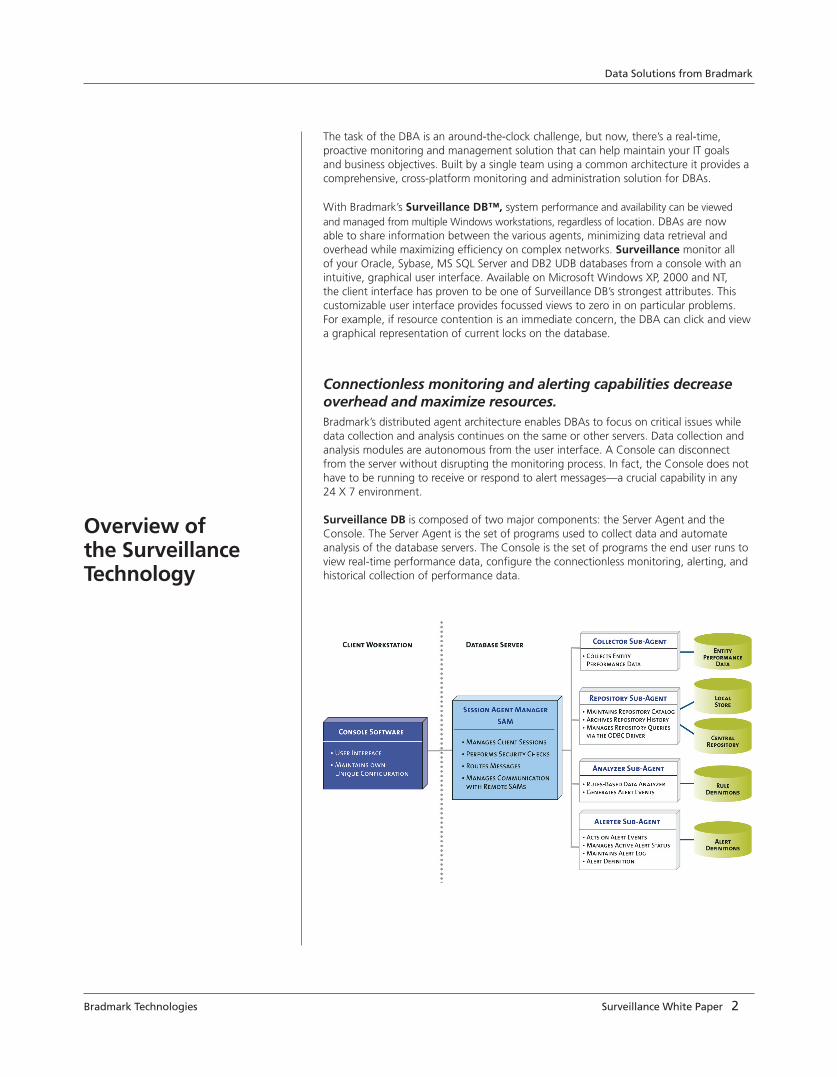
Surveillance DB is composed of two major components: the Server Agent and the Console. The Server Agent is the set of programs used to collect data and automate analysis of the database servers. The Console is the set of programs the end user runs to view real-time performance data, configure the connectionless monitoring, alerting, and historical collection of performance data.

Bradmark Technologies Surveillance White Paper 3
Data Solutions from Bradmark
Bradmark’s Surveillance provides the technology to support the complex databases in production. Extending support to the industry-leading RDBMS opens the door for more flexible and effective solutions to the database management problems faced by companies today. Operating from a console anywhere model, Surveillance can manage diverse and complex database environments, yet remains friendly enough to tackle even the most basic database implementations.
Comprehensive Performance Monitoring of Large DatabasesWhether your business requires a centralized or distributed database, performance and availability are essential. Large databases are routinely used to warehouse data or process on-line transactions. In all of these environments, databases become mission-critical. The risk of hardware or software failure, and the potentially disastrous financial consequences, cannot be ignored.
To achieve maximum performance, very large databases require tuning tools which can be operated while the system is running. It is also imperative to have monitoring and diagnostic tools that are able to isolate and quickly identify database problems.
Creating Integrated RDBMS Solutions
Demand for around-the-clock surveillance increases as databases proliferate within an environment. A single tool that can manage the databases and scale to grow with the environment becomes even more important. The distributed environment demands proactive management that detects and resolves problems automatically wherever possible. However, avoiding problems alone is not enough.
With Surveillance as the command center, DBAs can spend more time on day-to-day operations, and less time on problem solving.
The ConsoleThe Console is the user interface that allows the user to view real-time performance data and configure the sub-agents. The primary configurable window of the Console is the grid window, which looks and functions like a spreadsheet window. It not only links a collection with rows of data it also can be filled with rows and columns from predefined collections. As an added bonus, all of the columns in the grid window are resizable and sortable.
The graph window is another configurable window on the Console where data can be displayed in either line graph or bar graph format.
The Console contains an interface to the alerter, allowing the user to configure, receive, respond to, and reset alerts.
Solutions for Every EnvironmentThe “console anywhere” approach offers three different options for configuring Surveillance. These include a native implementation, virtual implementation, and three-tier implementation. Surveillance can be implemented throughout the organization utilizing a combination of available options.
Key Point:
Large mission-critical databases require tuning and proactive monitoring tools that can be applied while the database is running.
Robust Performance Monitoring of Multiple Databases

Bradmark Technologies Surveillance White Paper 4
Data Solutions from Bradmark
Native ImplementationThe preferred implementation with one or more Console workstations monitoring one or more Oracle, DB2 UDB, Sybase or MS SQL Server with each database server having resident Server Agents.
������������������������������������
����������������������������
���������������
�����
������
������
������
������
���������
Virtual ImplementationWith this configuration, Oracle, DB2UDB, Sybase or MS SQL Server may be running on an OS server platform that is not yet supported by the Server Agents. In this case, the Server Agents reside on a Console workstation with the Console software. The Server Agent communicates directly with the database via the communications protocol preferred by the RDBMS (ie:SQL*Net/Net8 or Open-Client Library).
Three-Tier ImplementationWith this configuration, Oracle, DB2 UDB, Sybase or MS SQL Server may be running on any server platform while the Server Agents reside on an Application Server that is supported by the Server Agents. The Application Server connects to the database via the communications protocol preferred by the RDBMS (ie:SQL*Net/Net8 or Open Client Library) and can simultaneously support multiple Console
workstations.
��������������������������������������
������
��������������
�������
�������
�������
���
�����
���
����������������
��������
����������������
��������
����������������
��������
������
������������������������������������
�����������������
���������������������������
���
������
�����
���������������
��
���
����������������
��������
����������������
��������
����������������
��������

Bradmark Technologies Surveillance White Paper 5
Data Solutions from Bradmark
Surveillance for any Environment
The ideal solution for a DBA to monitor their database environment is one unhampered by limitations of the hardware supported by the product. Clearly, Surveillance has the flexibility to provide multiple configuration choices, creating the means to optimally monitor the database in any environment.
The Server AgentThe Server Agent, not only collects data, performs automated data analysis then acts on that analysis by issuing alerts and recovery actions it also executes any work the Console requests. For example, if the user wants to display a real-time sessions window, the Server Agent would perform the collection and then pass the information to the Console. The Server Agent consists of multiple sub-agents designed to perform specific tasks on the server.
Session Agent Manager (SAM)The SAM sits between the Console and Sub-Agents, directing traffic and delivering messages, determining which intelligent agent should perform work requested from the Console. It also returns results to the Console, allowing the Console to disconnect and reconnect for status information later. Another key function of the SAM is that it watches over all sub-agents processes and restarts any killed or hung sub-agents.
The Collector Sub-AgentConfigured with a set of Pre-defined Collections, the collector sub-agent is the workhorse that collects information from Oracle, DB2 UDB, Sybase, and MS SQL Server databases as well as OS applications. The Console makes a request to the collector to retrieve information at one time or at specified intervals and then manages the retrieval of that information. Designed for efficiency, in the event that simultaneous requests for the same information takes place, the collector normalizes the query into one collection.
User-defined Collections extend OS and RDBMS monitoring capabilities and provide the flexibility to add custom collections as well as monitor application specific rules. After the data has been collected, a built-in derive function can be utilized to calculate deltas and values. The User-defined Collections can also be used to define rules and send alerts based on the data returned from the new collection, and all collection results can be stored in the repository for later reporting.
The Analyzer Sub-AgentThe analyzer sub-agent performs a rule-based analysis that compares performance metrics to adjustable thresholds. If a threshold is breached, an event message is generated and passed to the Alerter Sub-Agent via the SAM.
The Alerter Sub-AgentThe alerter sub-agent accepts event messages from the SAM, then selects a predefined event handler and executes the defined actions. Multiple actions can be defined for each handler and can include: e-mail, page, execute a script, forward to another SAM (to centralize alert notification) as well as generate OpenView or Tivoli alerts.
The Repository Sub-AgentThe repository sub-agent stores historical performance data retrieved by the collector.Historical data is retained in named data stores on local disk at specified time intervals. In order to minimize disk utilization, an interval compression algorithm is used.
Bradmark Technologies Surveillance White Paper 6
Data Solutions from Bradmark
The Repository Query Sub-AgentThe repository query sub-agent queries the historical data repository on local disk and forwards this information to a centralized repository in either a local or remote RDBMS.
The delivery of historical information is via ODBC drivers (provided free of charge on UNIX platforms) and thus can be of any RDBMS platform. For example, a heterogeneous environment that has Oracle, Sybase, DB2 UDB and MS SQL Server can all report history to a single Oracle database.
Detect Problems and Notify Multiple DBAs with Proactive Event Management
The Surveillance DB Event Management is used to provide peace of mind by becoming the radar detector whose sole purpose is to continually monitor the database for conditions which have a negative impact on performance and/or availability and alert technical professionals before a it becomes critical. To accomplish this, Surveillance DB uses its extensive alerting and alarming facility that comes with a large set of predefined rules.
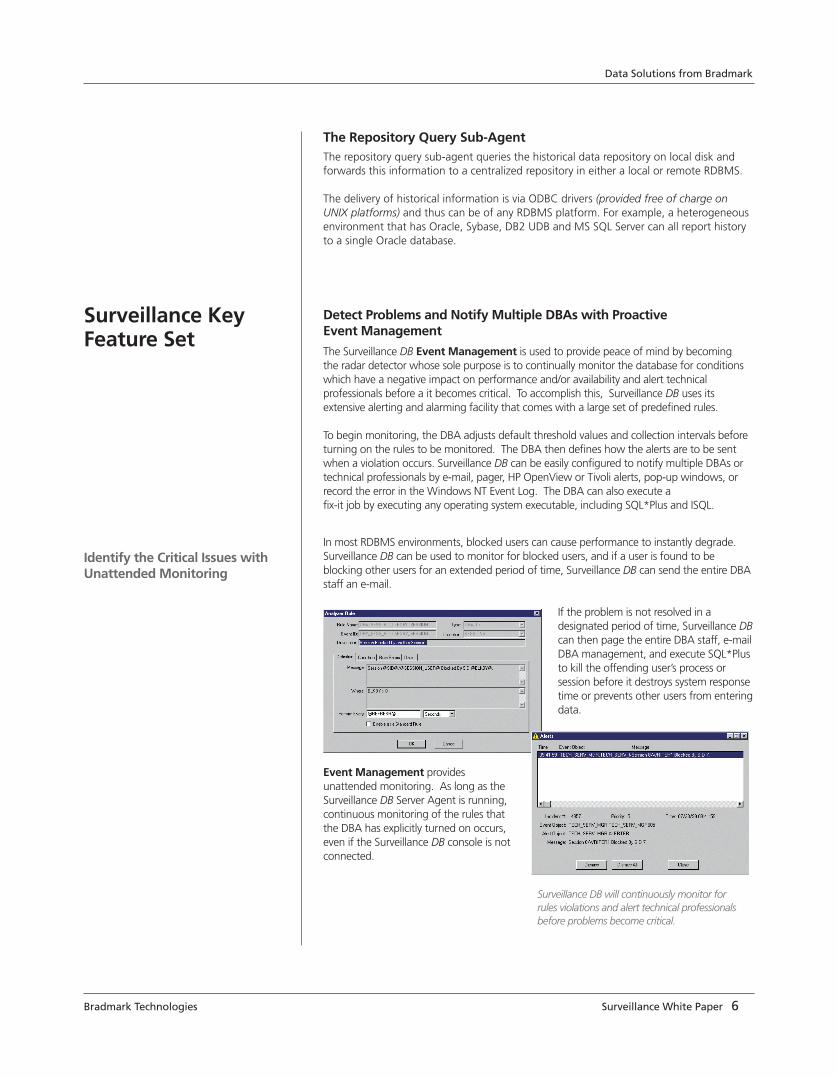
To begin monitoring, the DBA adjusts default threshold values and collection intervals before turning on the rules to be monitored. The DBA then defines how the alerts are to be sent when a violation occurs. Surveillance DB can be easily configured to notify multiple DBAs or technical professionals by e-mail, pager, HP OpenView or Tivoli alerts, pop-up windows, or record the error in the Windows NT Event Log. The DBA can also execute a fix-it job by executing any operating system executable, including SQL*Plus and ISQL.
In most RDBMS environments, blocked users can cause performance to instantly degrade. Surveillance DB can be used to monitor for blocked users, and if a user is found to be blocking other users for an extended period of time, Surveillance DB can send the entire DBA staff an e-mail.
If the problem is not resolved in a designated period of time, Surveillance DB can then page the entire DBA staff, e-mail DBA management, and execute SQL*Plus to kill the offending user’s process or session before it destroys system response time or prevents other users from entering data.
Event Management provides unattended monitoring. As long as the Surveillance DB Server Agent is running, continuous monitoring of the rules that the DBA has explicitly turned on occurs, even if the Surveillance DB console is not connected.
Surveillance Key Feature Set
Identify the Critical Issues with Unattended Monitoring
Surveillance DB will continuously monitor for rules violations and alert technical professionals before problems become critical.

Bradmark Technologies Surveillance White Paper 7
Data Solutions from Bradmark
Go Back in Time with data Flashback
Surveillance provides the capability to go back or “flashback”to a selected point-in-time to view data. Through a local repository cache, you can perform a forensic analysis on a recent issue from any real-time window or alert. Now, IT professionals can diagnose system issues that occured minutes, hours, days or weeks ago to find the root cause of an unplanned outages, and take preventive measures to avoid future outages.
Plan for the future with Historical Repository
Surveillance DB Historical Repository Option is used to obtain a historical perspective when the Surveillance DB Event Management Option detects and alerts technical professionals that conditions are occurring which are negatively impacting performance. Data from the Historical Repository can be used to trend performance and space utilization data to support system upgrades and/or additional disk space. DBAs can also use the data to establish baselines for threshold values in Event Management’s rule definitions.
To accomplish this, Surveillance DB provides a facility for the DBA to store data from predefined and user-defined collections at user-specified intervals. The DBA specifies how much data to keep, (a day, week, month, year), while the Surveillance DB Repository Manager continuously purges data that falls outside the specified time frame. Any ODBC-compliant reporting tool can be used to query and/or graph the historical data.
Most DBAs want to know the rate at which their databases are growing to ensure that sufficient disk space is always available and to estimate when a database might run out of space at the current growth rate.
Surveillance DB Historical Repository Option can be used to store the daily utilization for the database’s data files or tablespaces. An ODBC-compliant reporting tool can then be used to query and/or graph the utilization, in addition to calculating the growth rate. This data
will enable the DBA to estimate when additional disk space will be required and provide ample time for technical professionals to purchase and install that disk space. To ensure efficient performance, the Historical Repository Option is designed to query and save only the data that the DBA has requested.
User-defined collections (UDCs) are used to extend the Surveillance DB Event Management and Historical
Repository capabilities to application data and data integrity. To accomplish this, Surveillance DB provides a facility for DBAs to easily write new data collections, which are the basis for new rules or repository stores. A user-defined collection is an easily configurable file that specifies the SQL statement to be executed by Surveillance DB. Business executives might want to be notified when the number of orders being processed each hour falls below a certain number. The DBA can write a user-defined collection that queries the count of records in the ORDERS table. The Surveillance DB built-in statistics calculator can be used to derive the change in the numbers of orders since the last refresh interval. The Event Management Option can page or e-mail business executives when the hourly rate of orders processed falls below a certain number.
Support System Upgrade Planning
Extend Monitoring Capabilities to Application Data
Use the Historical Repository to track performance over time, and establish a baseline for performance expectations.
Bradmark Technologies Surveillance White Paper 8
Data Solutions from Bradmark
The Historical Repository Option can be used to store this hourly count over a period of time. This information could then be used to graph the growth rate of orders over the last week, month, quarter, etc., thus providing business executives with the necessary information. User-defined collections are not limited to application data and data integrity. They can be used in conjunction with the Surveillance DB standard, predefined collections to monitor additional performance data. The built-in statistics calculator can also be used to calculate averages, high water marks, and rate per second.
View the Big Picture or the Details with a Real Time Perspective
Surveillance DB Real Time Diagnostics Option is used during a crisis situation to determine exactly what is currently happening in the database. Data from Real Time Diagnostics is also used to obtain a real-time perspective when the Event Management detects and alerts technical professionals that conditions are occurring which are negatively impacting performance or availability. DBAs can also use real-time data to establish baselines for threshold values in Event Management’s rule definitions.
Surveillance DB provides a facility to display an extensive set of predefined windows that provide an immediate global view of database activity and detailed performance metrics such as session/process activity, locks, batch contention, file I/O, and much more. Real-time data from multiple RDBMS can be viewed simultaneously. Data from each window can be sorted or filtered while most statistics can be graphed over time. In addition, each window or graph can be configured to refresh at either the default collection interval or its own refresh interval.
If Event Management alerts the DBA that a user is blocking other users for an extended period of time – causing a work stoppage, Real-time Diagnostics can be used to identify the user’s session that is causing the problem. Drilling down to session details reveals that the user’s session has issued an exclusive lock on the LEDGERS table that is preventing other users from entering general ledger records. The DBA is also able to determine that the user has selected data for update purposes, but has neglected to save or abort the update, causing other users to wait. The DBA can then request that the user save or abort the data. If the user can’t be found, the DBA could decide to kill the user’s session, allowing other users to enter general ledger records. If the DBA is not available, Event Management that’s pre-configured, can kill the session automatically – the work stoppage will be eliminated without intervention from technical professionals.
Without Surveillance DB, work stoppage will continue until the DBA is notified by the user community that there is a performance problem. Once available, the DBA has to write and/or run scripts that query the multitude of performance statistics to determine the cause of the problem before the work stoppage can be eliminated.
Key Point:
The value Surveillance DB provides to organizations today becomes even more significant if the DBA is unavailable for an extended period of time due to vacation, illness, or other performance problems.
Reduce Downtime by Quickly Identifying Problems
Bradmark Technologies Surveillance White Paper 9
Data Solutions from Bradmark
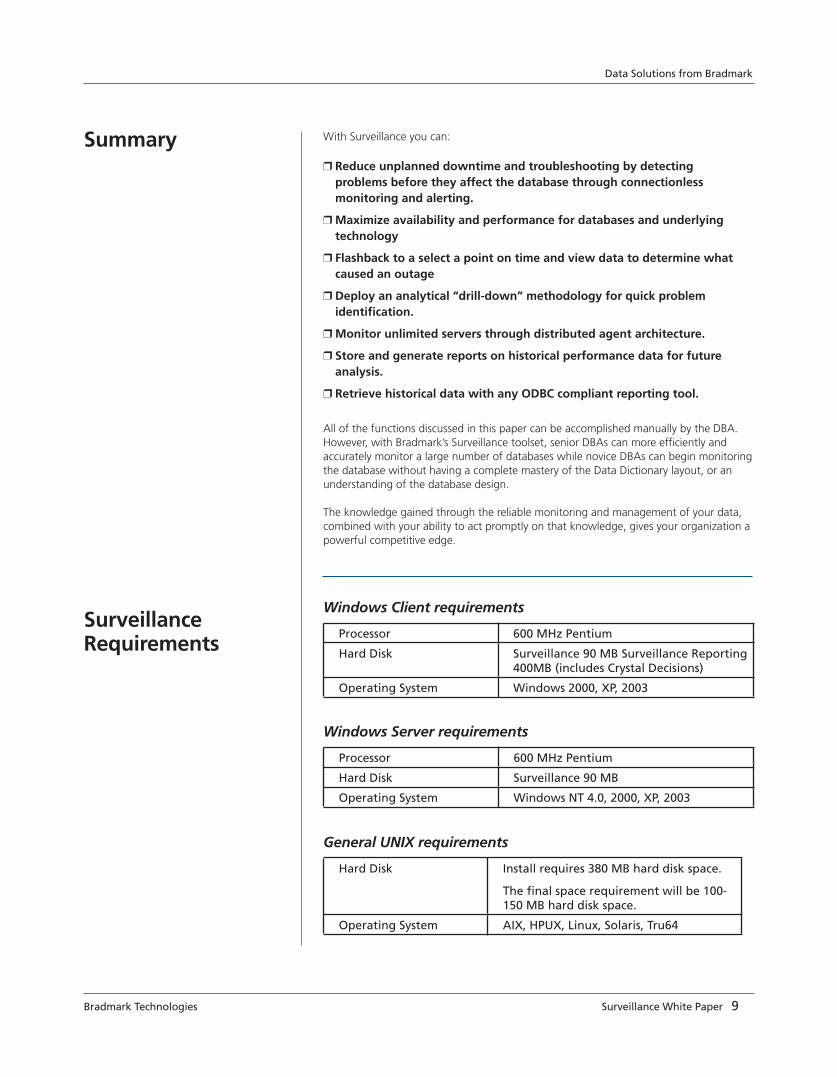
With Surveillance you can:
❒ Reduce unplanned downtime and troubleshooting by detecting problems before they affect the database through connectionless monitoring and alerting.
❒ Maximize availability and performance for databases and underlying technology
❒ Flashback to a select a point on time and view data to determine what caused an outage
❒ Deploy an analytical “drill-down” methodology for quick problem identification.
❒ Monitor unlimited servers through distributed agent architecture.
❒ Store and generate reports on historical performance data for future analysis.
❒ Retrieve historical data with any ODBC compliant reporting tool.
All of the functions discussed in this paper can be accomplished manually by the DBA.However, with Bradmark’s Surveillance toolset, senior DBAs can more efficiently and accurately monitor a large number of databases while novice DBAs can begin monitoring the database without having a complete mastery of the Data Dictionary layout, or an understanding of the database design.
The knowledge gained through the reliable monitoring and management of your data, combined with your ability to act promptly on that knowledge, gives your organization a powerful competitive edge.
Windows Client requirements Processor 600 MHz Pentium
Hard Disk Surveillance 90 MB Surveillance Reporting 400MB (includes Crystal Decisions)
Operating System Windows 2000, XP, 2003
Windows Server requirements Processor 600 MHz Pentium
Hard Disk Surveillance 90 MB
Operating System Windows NT 4.0, 2000, XP, 2003
General UNIX requirements
Hard Disk Install requires 380 MB hard disk space.
The final space requirement will be 100-150 MB hard disk space.
Operating System AIX, HPUX, Linux, Solaris, Tru64
Summary
Surveillance Requirements

Bradmark Technologies Surveillance White Paper 10
Data Solutions from Bradmark
Surveillance OS requirements Surveillance OS supports monitoring on these operating systems:
Windows (32-bit) NT 4.0 (SP 6), 2000, XP, 2003
AIX 4.3.3, 5.1, 5.2, 5.3
HPUX 10.20, 11.00, 11.11 (32- and 64-bit supported for 11.00 and 11.11)
HPUX Itanium 11.23 ia64
Linux (32-bit, x86) 2.2 kernel, 2.4 kernel, 2.6 kernel
Solaris 2.6, 7, 8, 9, 10
Surveillance DB requirements Surveillance can connect virtually (remotely) or natively (locally) to the following databases:
• Oracle: 7.3.4, 8.0, 8.1, 9.0, 9.2, 10.1, 10.2
• Sybase ASE: 11.0, 11.5, 11.9, 12.0, 12.5, 15
• Sybase Replication Server: 12.1, 12.5, 12.6, 15.0
• Sybase IQ Server: 12.5, 12.6, 12.7
• MS SQL Server: 7.0, 2000, 2005
• DB2 UDB 7.2 Fixpak 6, 8.1.3, 8.2, 9.1
© 2008, 2006 Bradmark Technologies, Inc. All Rights Reserved. Surveillance DB, OS, IQ and RS are trademarked product names of Bradmark Technologies, Inc. Sybase is a registered trademark of Sybase, Inc. All other product names herein have been used for identification purposes only, and may be trademarks and/or registered trademarks of their respective companies.
Surveillance WhitepaperPrint Date: 5/08
For more information onSybase or other Bradmark products:
Phone: (800) 621-2808 orOutside the U.S.: (713) 621-2808Fax: (713) 621-1639Web site: www.bradmark.com
Bradmark Technologies UK Ltd.Tel: +44 (0) 870 240 6285Fax: +44 (0) 121 321 3555
Bradmark Deutschland Tel: +49 (0) 89 962 09012Fax: +49 (0) 89 962 80860
Bradmark NetherlandsTel: +31 (0) 251 268 248 Fax: +31 (0) 251 268 249
Bradmark AsiaTel: +86 (10) 8458 0860Fax: +86 (10) 8458 5027
Surveillance Requirements