monitoring & early warning in tajikistan...tajikistan monitoring & early warning monthly...
TRANSCRIPT

1 RMWS Report – November 2010
Tajikistan Monitoring & Early Warning Monthly Report
MONTHLY REPORT JANUARY 2012
Monitoring & Early Warning in Tajikistan

2
Tajikistan Monitoring & Early Warning Report – January 2012
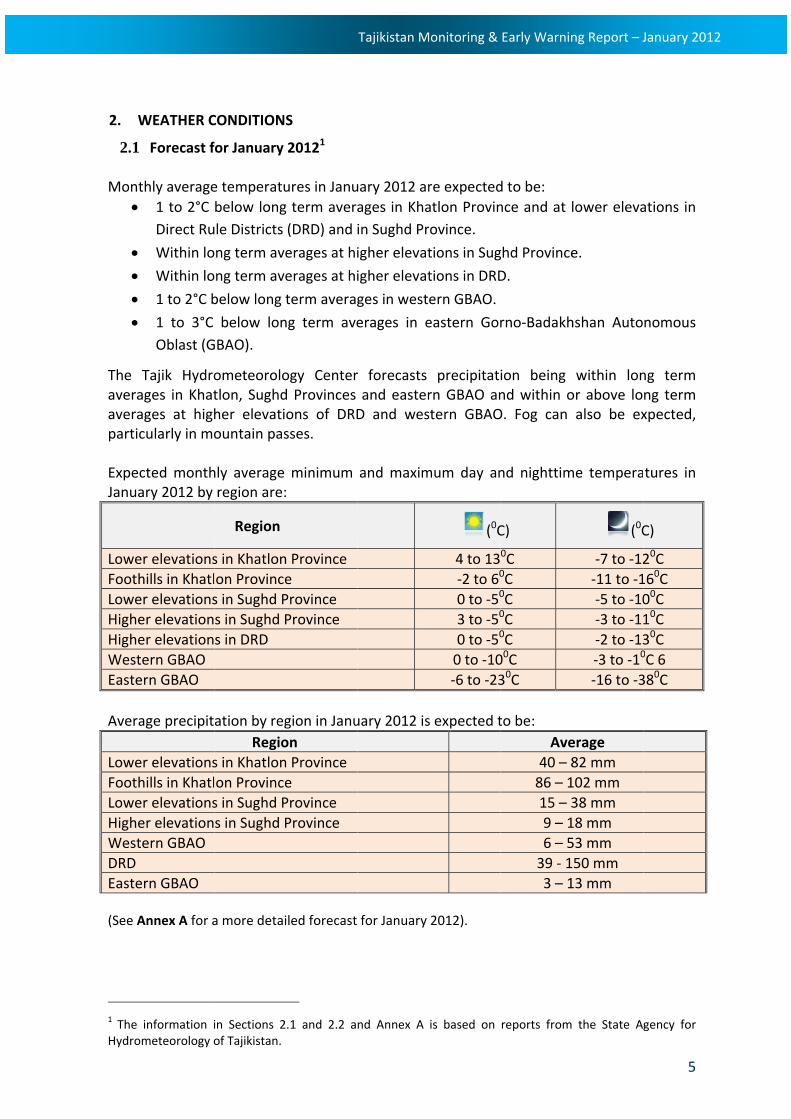
GENERAL TRENDS NATURAL HAZARDS Heavy snowfall, frost and avalanches are the major natural hazards events that can be expected in January 2012, according to the Information Management and Analysis Center (IMAC) at the Committee of Emergency Situations. WEATHER The Tajik Hydrometeorology Center forecasts precipitation will be close to long term averages in Khatlon, Sughd Provinces and eastern GBAO and close to or above long term averages at higher elevations of DRD and western GBAO. Monthly average temperatures in January 2012 are expected to be 1 to 2°C below long term averages mostly in all the regions. ENERGY SECURITY Above average water supplies in Nurek indicate better than average energy security for Tajikistan in the coming months, although conditions can change due to dryer than normal or colder than normal weather. Barki Tojik reports that electricity generation in December 2011 totaled 1,532 Gigawatts (GW) or an average of 49.4 GW per day, a 15.9% (243 GW) increase compared to November 2011. Total coal production in 2011 equaled 233,853 tons, which is 33,000 tons more that in 2010. FOOD SECURITY Wheat prices have continued to decline from historical high in main markets but remain at historical levels in Khorog and Garm. Fuel prices have dropped slightly but remain at historically high levels. The Ministry of Agriculture reports a total of 187,353 hectares were planted with wheat during the fall of 2011, which is slightly more than the 180,956 hectares planted during the fall of 2010. A good wheat harvest yield in spring 2012 will depend on good weather conditions, a lack of damage from locust, and an absence of floods, mudflows, and drought. ECONOMY The consumer price inflation rate from January to November was 9.1% and food prices increased by 10%. Government income from taxes and related sources for 2011 totaled 6.8 billion Tajik Somoni (1.4 billion USD), 29.5% of GDP. Bank loans issued in November totaled 4.6 billion Tajik Somoni (0.97 billion USD) with overdue loans totaling 491.3 million Tajik Somoni (103.2 million USD). From January to November 2011, the trade deficit totaled 1.7 billion USD, a 160 million USD increase on the deficit total for October 2011.
3
Tajikistan Monitoring & Early Warning Report – January 2012
Contents
GENERAL TRENDS ................................................................................................................ 2
1. HAZARDOUS EVENTS ....................................................................................................... 4
1.1 Hazard Events in December 2011 ............................................................................ 4
2. WEATHER CONDITIONS ................................................................................................... 5
2.1 Forecast for January 2012 ........................................................................................ 5
2.2 Weather Summary for December 2011 ................................................................... 6
3. ENERGY ............................................................................................................................ 7
3.1 Electricity Production ............................................................................................... 7
3.2 Electricity Consumption ........................................................................................... 7
3.3 Natural Gas & Coal ................................................................................................... 7
3.4 Coal ........................................................................................................................... 8
3.5 Reservoir Levels ........................................................................................................ 8
4. FOOD SECURITY ............................................................................................................. 11
4.1 Food Security Reports ............................................................................................ 11
4.2 Cereal Prices ........................................................................................................... 12
4.3 Fuel Prices .............................................................................................................. 13
5. HEALTH .......................................................................................................................... 15
6. ECONOMIC TRENDS ....................................................................................................... 16
6.1 Delayed Rail Freight Deliveries to Tajikistan .......................................................... 16
6.2 General Trends ....................................................................................................... 16
6.3 Population Movement/Migration .......................................................................... 17
6.4 Employment ........................................................................................................... 18
6.5 Exchange Rate ........................................................................................................ 18
6.6 Remittances ............................................................................................................ 19
ANNEX A Weather Forecast for January – 2012 .......................................................... 21
ANNEX B. Total Electricity Production in Tajikistan (Nov 2009 to Dec 2011) .................. 23
ANNEX C. Daily Average Electricity Consumption in Tajikistan (Apr 2010 to Nov 2011) . 24
4
Tajikistan Monitoring & Early Warning Report – January 2012
1. HAZARDOUS EVENTS
1.1 Possible Events in January 2012
The Information Management and Analytical Center (IMAC) of the Committee of Emergency Situations (CoES) reports that heavy snowfall, freezing condition and avalanches are the major natural hazards events which can be expected in January 2012.
Between 2009 and 2011, statistics indicate that 7 disasters occurred in January, including earthquakes, avalanches, and landslides. 1.1 Hazard Events in December 2011 IMAC/CoES reported 3 hazard events in December 2011: December 5
An earthquake of 4 points of the 12‐point Medvedev‐Sponheuer‐Karnik (MSK) intensity scale, 310 km south‐east of Dushanbe; caused no damaged to infrastructure in Dushanbe.
December 7
Landslide in Vakhdat District; damaged 500 meters of the Vakhdat – Romit auto‐road.
December 29
An earthquake scoring 2‐2.5 on the 12‐point MSK scale with an epicenter in the Islamic State of Afghanistan affected the village of Lukhsh, Saghirdasht Jamoat, Darvoz District resulting in human injuries, and damage to houses and infrastructure.
According to the information provided by the Tajik Red Crescent Society (RCST) branch in Darvaz the damage caused by the earthquake included:
• 4 persons hospitalized in Sagirdasht and Tavildara district hospitals,
• 55 households (est. 385 people, 7 person per family average used) affected;
• 30 houses partly damaged;
• 25 houses completely destroyed
RCST National Disaster Response Team is continuing rapid assessments and rendering first aid to earthquake victims.
For more detailed information please contact Shamsudin Muhudinov, IFRC Tajikistan, at [email protected]
2. W
2.1 Mont
•
• • • •
The Taveraaverapartic ExpecJanua
LoweFoothLoweHigheHigheWesteEaste Avera
LoweFoothLoweHigheWesteDRD Easte (See A
1 The Hydrom
WEATHER C
Forecast f
thly average1 to 2°C Direct Ru
Within lo
Within lo
1 to 2°C b
1 to 3°C Oblast (G
Tajik Hydroges in Khatges at highcularly in mo
cted monthary 2012 by
r elevationshills in Khatlr elevationser elevationer elevationern GBAO rn GBAO
age precipit
r elevationshills in Khatlr elevationser elevationern GBAO
rn GBAO
Annex A for a
information imeteorology o
CONDITIONS
for January
e temperatubelow longle Districts
ng term ave
ng term ave
below long t
below lonGBAO).
ometeorolotlon, Sughdher elevatiountain pas
hly average region are:
Region
s in Khatlonon Provinces in Sughd Ps in Sughd Ps in DRD
ation by regRegio
s in Khatlonon Provinces in Sughd Ps in Sughd P
a more detai
in Sections 2of Tajikistan.
S
20121
ures in Janug term avera(DRD) and i
erages at hi
erages at hi
term averag
ng term ave
ogy Centerd Provinces ons of DRDsses.
minimum
n Province e Province Province
gion in Januon n Province e Province Province
iled forecast
.1 and 2.2 a
Tajikistan M
uary 2012 arages in Khain Sughd Pr
igher elevat
igher elevat
ges in west
erages in e
r forecasts and easterD and wes
and maxim
uary 2012 is
for January
nd Annex A
Monitoring &
re expectedatlon Provinrovince.
tions in Sug
tions in DRD
ern GBAO.
eastern Gor
precipitatrn GBAO anstern GBAO
mum day an
(0C
4 to 13‐2 to 60
0 to ‐50
3 to ‐50
0 to ‐50
0 to ‐10‐6 to ‐23
s expected t
2012).
is based on
Early Warnin
d to be: nce and at l
ghd Province
D.
rno‐Badakh
ion being nd within oO. Fog can
nd nighttim
C) 0C 0C 0C 0C 0C 00C 30C
to be: Ave
40 – 886 – 115 – 39 – 16 – 539 ‐ 13 – 1
reports from
ng Report – J
lower eleva
e.
hshan Auto
within lonor above loalso be ex
me tempera
(0C
‐7 to ‐12‐11 to ‐1‐5 to ‐10‐3 to ‐11‐2 to ‐13‐3 to ‐10
‐16 to ‐3
erage 82 mm 102 mm 38 mm 18 mm 53 mm 150 mm 13 mm
the State A
5
January 2012
ations in
nomous
ng term ng term xpected,
tures in
C)
20C 160C 00C 10C 30C 0C 6 380C
gency for
2

6
Tajikistan Monitoring & Early Warning Report – January 2012
2.2 Weather Summary for December 2011 Weather conditions and temperatures in December were less than average. Monthly average temperatures were 2 to 4°C below long term averages. In GBAO temperatures were 2 to 4°C below long term averages. Average temperatures at lower elevations were 2 to 5°C, at higher elevations ‐2 to ‐7°C and in the foothills ‐9 to ‐15°C. As a result of cold air flow from the western region of Russia and eastern Siberia on December 12, 15, 19‐22 and 30, daytime temperatures at lower elevations were ‐3 to +1°C, and in Sughd Province to ‐7°C. The lowest temperatures were recorded during the night of December 21‐23, when the temperatures were no higher than ‐10 to ‐16°C. Warmer temperatures were recorded during December 8th ‐ 11th, 17th, and 23rd – 26th, when the daily temperature increased up to +10 to +16°C. Monthly average precipitation was below and within long term averages in most of the regions, except in Sughd Province, where the precipitation was above long term averages. The most significant precipitation occured on December 2nd, 5th, 20th and between December 26th – 27th. The heavy snowfall was recorded in Direct Rule Districts on December 19th – 20th. Daily precipitation in the Hissar Valley in the DRD totaled from 22 to 27 mm. (See Annex A for more information.) At lower elevations and in the foothills there was fog and in some places wind speeds reached between 64 and 83 km/hours. Percent of Average Precipitation in December 2011 compared to 30‐year Average (1960‐1990)
Area of Tajikistan % Khatlon Province 80 ‐ 122 Sughd Province 100 ‐ 175 Direct Rule Districts 50 ‐ 125 GBAO 6 ‐ 95

3. EN
3.1 Barki Gigawincrea
The ielectr
Total
3.2
AveraAlumifollowIn Dedue tlevel. TALCO
3.3 Naturmillioin 201impor
The pper 1,m3, 2m3 of
2 Data
2468101214161820
NERGY
Electricity
Tojik repowatts (GW) ased by 15.9
ncrease in ricity produ
Electricity
Electricity
age daily coinum Compwing table. cember, eleo increasedElectricity O.
Natural Ga
ral gas impon m3 more 10. Accordirted natura
price of imp,000 m3). N2.65 millionimports pr
on electricity
0200400600800000200400600800000
Nov‐09
Dec‐09
y Productio
orted that or an aver9% (243 GW
electricityction in Dec
Production
y Consumpt
onsumptionpany (TALCOTotal electrectricity cond productioconsumptio
as & Coal
orts in Decthan in Novng to Tajiktl gas is the
ported natuNatural gas n m3 more tojected for
generation a
Jan‐10
Feb‐10
Mar‐10
Apr‐10
on
total elecrage of 49.W) compare
productiocember 201
n – Novemb
ion2
n of electricO), the largericity consunsumption on, leading ton increase
ember wervember 201transgaz (TDushanbe‐b
ural gas remimports frothan in 2012011.
nd consumpti
Apr
10
May‐10
June
‐10
July‐10
Nurek
Tajikistan M
ctricity gen4 GW per ed to Novem
n in Decem10 when com
ber 2009 – D
city by majoest commerumption in Dwas 249 Gto an incread in the No
re 14.77 mi11 and 2.3 majik Naturabased Tajik
mained uncom January t10, and 1.05
ion is provide
Aug
‐10
Sep‐10
Oct‐10
Nov‐10
k HEP
Monitoring &
eration in day. Electrmber 2011 (
mber 2011mpared to
December 2
or regions rcial energyDecember wW more thase in electorth, South,
illion m3 (4million m3 ml Gas Compcement (Ta
changed froto Decembe5 million m3
d by MEW Go
Dec‐10
Jan‐11
Feb‐11
Mar
11
Total for Tajik
Early Warnin
Decembericity produ(see Annex
1 follows siNovember
2011 (GW)
of Tajikistay consumerwas 1,525 Gan in Novetricity suppand Dusha
76 thousanmore than fpany), the mjik Cement
om November 2011 tot3 short the t
oT expert from
Mar‐11
Apr‐11
May‐11
June
‐11
kistan
ng Report – J
r 2011 waction in DeB).
imilar increlevels.
n and by t, is indicateGW (see Anmber 2011ly at the conbe, and sl
nd m3 per dfor the samemajor consCompany).
ber 2011 (3aled 178.95total of 180
m Barki Tojik.
July‐11
Aug
‐11
Sep‐11
Oct‐11
7
January 2012
s 1,532 ecember
eases in
he Tajik ed in the nnex C). , mainly onsumer ightly at
day), 2.2 e period umer of
311 USD 5 million 0 million
Oct
11
Nov‐11
Dec‐11
2

8
Tajikistan Monitoring & Early Warning Report – January 2012
Local media reports that Uzbekistan stopped gas shipments to Tajikistan on 4 January 2012 as the agreement between Tajikistan and Uzbekistan on gas supplies had expired. In response, a Tajik government delegation, led by Deputy Prime Minister Mr. Murodali Alimardon traveled to Tashkent on January 5th, 2012 to discuss Uzbek natural gas deliveries to Tajikistan in 2012.3 As a result, Uzbekistan agreed to resume shipments of natural gas for the first quater in 20124 at a reported price of $331 per 1,000 m3.
Natural Gas Imports by Tajikistan, 2004 – 2012
Year 2004 2005 2006 2007 2008 2009 2010 2011 2012
(Projected)million m3
622.5 629 635 644.7 512.7 216.7 156.3 178.95 200
Natural Gas Imports – January 2010 – December 2011 (million m3)
3.4 Coal According to the Ministry of Energy and Industry, a total of 7,875 tons of coal were produced in December 2011. Coal production in December decreased due to the winter season and inaccessibility in mountainous coal mining areas. Total coal production in 2011 equaled 233,853 tons, 33,000 tons more that in 2010.
3.5 Reservoir Levels5 The Water Volume – Nurek HEP chart below shows the volume of the water in the Nurek HEP reservoir at the of end of December 2011 compared to average volume over the past six years (2004 to 2010). In late December the water level in Nurek HEP reservoir was 899.77 m above sea level and 42.77 m above the “dead level” (857 m)6.
3 http://news.tj/en/news/tajik‐delegation‐departs‐fro‐tashkent‐discuss‐natural‐gas‐delivery‐issues 4 http://www.avesta.tj/goverment/10722‐murodali‐alimardon‐uladil‐gazovyy‐vopros.html
5 Data from CAWaterInfo, http://www.cawater‐info.net/analysis/water/nurek_e.htm# 6 Data obtained from Barki Tojik
0
5
10
15
20
25
Jan Feb Mar Apr May Jun Jul Aug Sep Oct Nov Dec
2010
2011

9
Tajikistan Monitoring & Early Warning Report – January 2012
According to Central Asia Water Information online data7, the total volume of the water in the Nurek HEP reservoir in late December was 9,029 million m3, 841 thousand m3 more than the six year average volume in late December (8,188 million m3).
Water Volume – Nurek HEP (million m3)
The Water Inflow – Nurek HEP chart below shows water inflows into the Nurek HEP. In late December 2011, the water inflow in Nurek HEP was 219 m3/sec, above the 2004‐2010 average of 195.6 m3/sec. Water inflow in late December decreased compared to late November 2011 from 294 m3/sec to 219 m3/sec.
Water Inflow – Nurek HEP (m3/sec)
As indicated in the Water Outflow – Nurek HEP chart below, releases from Nurek HEP in late December increased slightly when compared to late November, from 522 m3/sec up to 563 m3/sec. Average water releases in late December (563 m3/sec) were below the six‐year averages (580.1 m3/sec).
7 http://www.cawater‐info.net/analysis/water/2011/nur_veg_e.htm
5500
6500
7500
8500
9500
10500
11500
Oct I
Oct III
Nov II
Dec I
Dec III
Jan II
Feb I
Feb II
Mar II
April I
April III
May II
June
I
June
III
July II
Aug
I
Aug
III
Sept II
Oct I
Oct III
Nov II
Dec I
Dec III
2010‐2011, million m3 Average, 6 years, million m3
0200400600800
100012001400160018002000
Oct I
Oct III
Nov II
Dec I
Dec III
Jan II
Feb I
Feb II
Mar II
April I
April III
May II
June
I
June
III
July II
Aug
I
Aug
III
Sept II
Oct I
Oct III
Nov II
Dec I
Dec III
Inflow, m3/sec 2010‐2011 Inflow, m3/sec, Average 6 years

10
Tajikistan Monitoring & Early Warning Report – January 2012
Water Outflow – Nurek HEP (m3/sec)
The current above average level of water storage in Nurek should ensure better than average energy security for the rest of the winter if outflows remain close to historical averages. However, lower than average precipitation for the remainder of the winter or during the spring, or periods of unusually cold weather, would reduce the current level of energy security.
300
500
700
900
1100
1300
1500
Outflow 2010‐2011, m3/sec Outflow, average, 6 years, m3/sec
11
Tajikistan Monitoring & Early Warning Report – January 2012
4. FOOD SECURITY
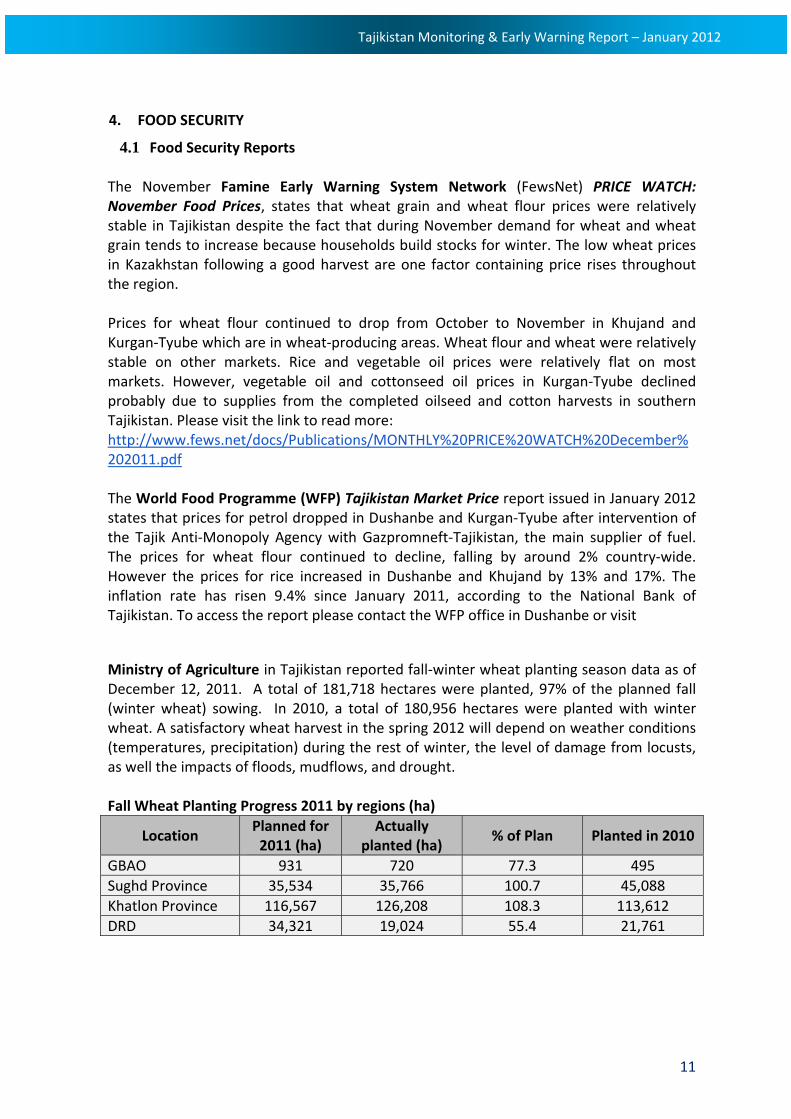
4.1 Food Security Reports The November Famine Early Warning System Network (FewsNet) PRICE WATCH: November Food Prices, states that wheat grain and wheat flour prices were relatively stable in Tajikistan despite the fact that during November demand for wheat and wheat grain tends to increase because households build stocks for winter. The low wheat prices in Kazakhstan following a good harvest are one factor containing price rises throughout the region. Prices for wheat flour continued to drop from October to November in Khujand and Kurgan‐Tyube which are in wheat‐producing areas. Wheat flour and wheat were relatively stable on other markets. Rice and vegetable oil prices were relatively flat on most markets. However, vegetable oil and cottonseed oil prices in Kurgan‐Tyube declined probably due to supplies from the completed oilseed and cotton harvests in southern Tajikistan. Please visit the link to read more: http://www.fews.net/docs/Publications/MONTHLY%20PRICE%20WATCH%20December%202011.pdf The World Food Programme (WFP) Tajikistan Market Price report issued in January 2012 states that prices for petrol dropped in Dushanbe and Kurgan‐Tyube after intervention of the Tajik Anti‐Monopoly Agency with Gazpromneft‐Tajikistan, the main supplier of fuel. The prices for wheat flour continued to decline, falling by around 2% country‐wide. However the prices for rice increased in Dushanbe and Khujand by 13% and 17%. The inflation rate has risen 9.4% since January 2011, according to the National Bank of Tajikistan. To access the report please contact the WFP office in Dushanbe or visit Ministry of Agriculture in Tajikistan reported fall‐winter wheat planting season data as of December 12, 2011. A total of 181,718 hectares were planted, 97% of the planned fall (winter wheat) sowing. In 2010, a total of 180,956 hectares were planted with winter wheat. A satisfactory wheat harvest in the spring 2012 will depend on weather conditions (temperatures, precipitation) during the rest of winter, the level of damage from locusts, as well the impacts of floods, mudflows, and drought. Fall Wheat Planting Progress 2011 by regions (ha)
Location Planned for 2011 (ha)
Actually planted (ha)
% of Plan Planted in 2010
GBAO 931 720 77.3 495 Sughd Province 35,534 35,766 100.7 45,088 Khatlon Province 116,567 126,208 108.3 113,612 DRD 34,321 19,024 55.4 21,761

12
Tajikistan Monitoring & Early Warning Report – January 2012
4.2 Cereal Prices8 1st Grade Wheat Flour
The chart below shows prices for 1st grade wheat flour in Dushanbe, Khujand, and Kurgan‐Tube from January 2008 to late December 2011. Wheat prices in December dropped in Dushanbe, and remained unchanged in Kurgan‐Tyube and Khujand markets compared to November 2011. Wheat flour prices in all three markets are below the highest prices of mid‐2008.
1st Grade Wheat Flour Price in Three Main Markets, January 2008 – December 2011 (TJS/kg)
The chart below provides prices for 1st grade wheat flour in two large regional markets, Gharm and Khorog, and the average price for the Dushanbe, Khujand and Kurgan‐Tube. In December wheat flour prices in Gharm remained unchanged and prices in Khorog increased compared to November prices. Prices in Gharm are still at historical highs.
8 Food and fuel prices are from WFP Food Security Weekly Market Monitoring, Tajikistan http://untj.org/country_context/coordination_mechanisms/agriculture&food_security/fsms/
1,40
1,90
2,40
2,90
3,40
Jan
Feb
Feb
Mar
Apr
May Jun Jul
Aug Sep
Oct
Nov Dec Jan
Feb
Mar
Apr
Apr
May Jun Jul
Aug Sep
Oct
Nov Dec Jan
Feb
Mar
Apr
Apr
May Jun Jul
Aug Sep
Oct
Nov Dec
Jan
Feb
Mar
Mar
Apr
May
June July
Aug Sep
Oct
Nov Dec
Dushanbe Khujand Kurgan‐Tyube
13
Tajikistan Monitoring & Early Warning Report – January 2012
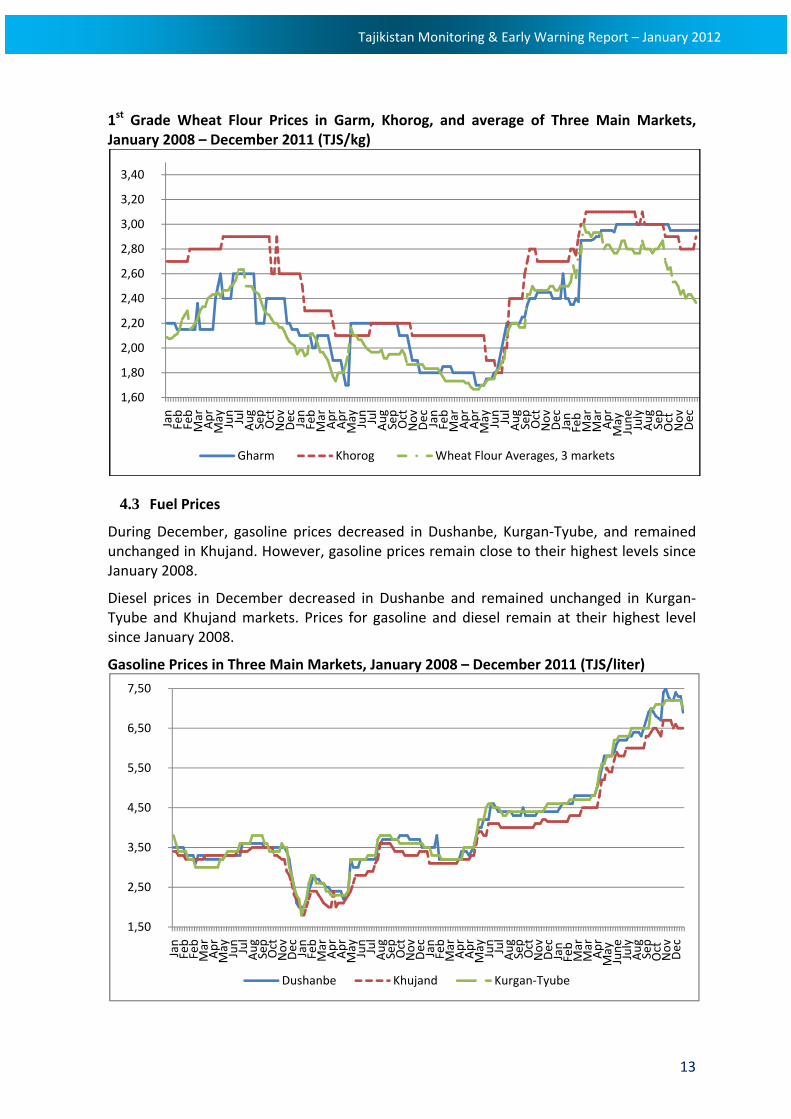
1st Grade Wheat Flour Prices in Garm, Khorog, and average of Three Main Markets, January 2008 – December 2011 (TJS/kg)
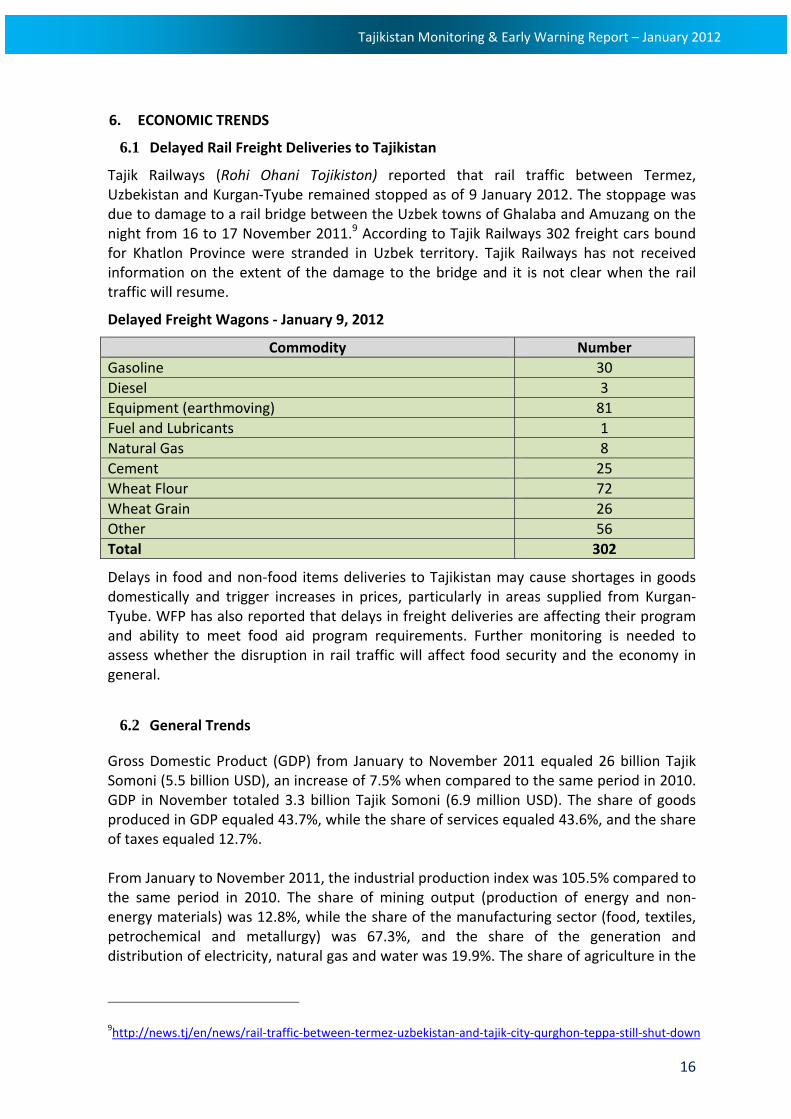
4.3 Fuel Prices During December, gasoline prices decreased in Dushanbe, Kurgan‐Tyube, and remained unchanged in Khujand. However, gasoline prices remain close to their highest levels since January 2008.
Diesel prices in December decreased in Dushanbe and remained unchanged in Kurgan‐Tyube and Khujand markets. Prices for gasoline and diesel remain at their highest level since January 2008.
Gasoline Prices in Three Main Markets, January 2008 – December 2011 (TJS/liter)
1,60
1,80
2,00
2,20
2,40
2,60
2,80
3,00
3,20
3,40 Jan
Feb
Feb
Mar
Apr
May Jun Jul
Aug Sep
Oct
Nov Dec Jan
Feb
Mar
Apr
Apr
May Jun Jul
Aug Sep
Oct
Nov Dec Jan
Feb
Mar
Apr
Apr
May Jun Jul
Aug Sep
Oct
Nov Dec
Jan
Feb
Mar
Mar
Apr
May
June July
Aug Sep
Oct
Nov Dec
Gharm Khorog Wheat Flour Averages, 3 markets
1,50
2,50
3,50
4,50
5,50
6,50
7,50
Jan
Feb
Feb
Mar
Apr
May Jun Jul
Aug Sep
Oct
Nov Dec Jan
Feb
Mar
Apr
Apr
May Jun Jul
Aug Sep
Oct
Nov Dec Jan
Feb
Mar
Apr
Apr
May Jun Jul
Aug Sep
Oct
Nov Dec
Jan
Feb
Mar
Mar
Apr
May
June July
Aug Sep
Oct
Nov Dec
Dushanbe Khujand Kurgan‐Tyube

14
Tajikistan Monitoring & Early Warning Report – January 2012
Diesel Prices in Three Main Markets, Jan 2008 – December 2011 (TJS/liter)
1,50
2,50
3,50
4,50
5,50
6,50
7,50 Jan
Feb
Feb
Mar
Apr
May Jun Jul
Aug Sep
Oct
Nov Dec Jan
Feb
Mar
Apr
Apr
May Jun Jul
Aug Sep
Oct
Nov Dec Jan
Feb
Mar
Apr
Apr
May Jun Jul
Aug Sep
Oct
Nov Dec
Jan
Feb
Mar
Mar
Apr
May
June July
Aug Sep
Oct
Nov Dec
Dushanbe Khujand Kurgan‐Tuybe

15
Tajikistan Monitoring & Early Warning Report – January 2012
5. HEALTH
The Ministry of Health in Tajikistan (MoH) Sanitary Epidemiological Service (SES) reported that during 11 months in 2011 there were a total 259,531 cases of acute respiratory virus infection against 256,118 cases in all of 2010). There total of 7,098 cases of pneumonia in 2011 (6,792 cases of pneumonia in 2010). During the fall‐winter 2011, there were 15,749 reported cases of influenza, 800 cases more than in 2010. There was one case of H3 type influenza, while in 2010 there were three types of influenza including H1N1, H3, and B.
The MoH reports that there was immunization campaign in 2010 against H1N1. As a result, the immunized population should have some remaining immunity to H1N1 and other varieties of influenza included in the vaccination used. For more detailed information please contact Monitoring and Early Warning Center at Ministry of Economic Development and Trade at [email protected] at (+992) 372 27‐36‐04.
16
Tajikistan Monitoring & Early Warning Report – January 2012
6. ECONOMIC TRENDS
6.1 Delayed Rail Freight Deliveries to Tajikistan Tajik Railways (Rohi Ohani Tojikiston) reported that rail traffic between Termez, Uzbekistan and Kurgan‐Tyube remained stopped as of 9 January 2012. The stoppage was due to damage to a rail bridge between the Uzbek towns of Ghalaba and Amuzang on the night from 16 to 17 November 2011.9 According to Tajik Railways 302 freight cars bound for Khatlon Province were stranded in Uzbek territory. Tajik Railways has not received information on the extent of the damage to the bridge and it is not clear when the rail traffic will resume.
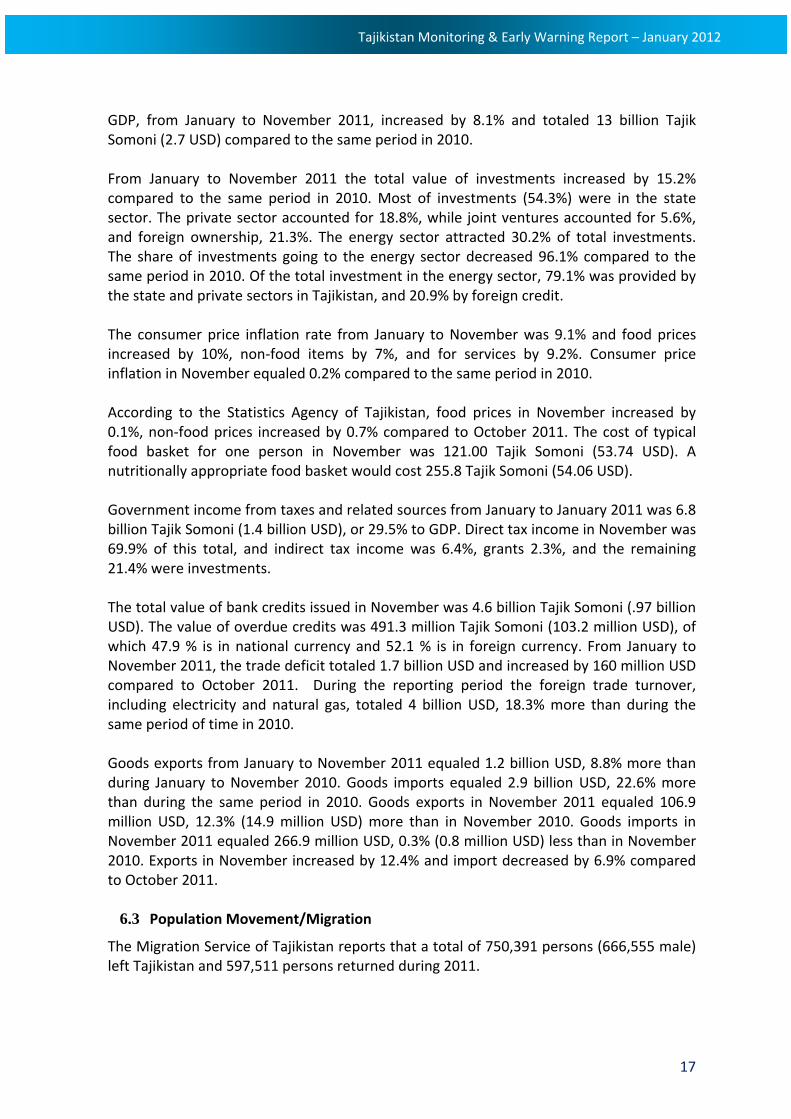
Delayed Freight Wagons ‐ January 9, 2012
Commodity Number Gasoline 30 Diesel 3 Equipment (earthmoving) 81 Fuel and Lubricants 1 Natural Gas 8 Cement 25 Wheat Flour 72 Wheat Grain 26 Other 56 Total 302
Delays in food and non‐food items deliveries to Tajikistan may cause shortages in goods domestically and trigger increases in prices, particularly in areas supplied from Kurgan‐Tyube. WFP has also reported that delays in freight deliveries are affecting their program and ability to meet food aid program requirements. Further monitoring is needed to assess whether the disruption in rail traffic will affect food security and the economy in general.
6.2 General Trends Gross Domestic Product (GDP) from January to November 2011 equaled 26 billion Tajik Somoni (5.5 billion USD), an increase of 7.5% when compared to the same period in 2010. GDP in November totaled 3.3 billion Tajik Somoni (6.9 million USD). The share of goods produced in GDP equaled 43.7%, while the share of services equaled 43.6%, and the share of taxes equaled 12.7%. From January to November 2011, the industrial production index was 105.5% compared to the same period in 2010. The share of mining output (production of energy and non‐energy materials) was 12.8%, while the share of the manufacturing sector (food, textiles, petrochemical and metallurgy) was 67.3%, and the share of the generation and distribution of electricity, natural gas and water was 19.9%. The share of agriculture in the
9http://news.tj/en/news/rail‐traffic‐between‐termez‐uzbekistan‐and‐tajik‐city‐qurghon‐teppa‐still‐shut‐down
17
Tajikistan Monitoring & Early Warning Report – January 2012
GDP, from January to November 2011, increased by 8.1% and totaled 13 billion Tajik Somoni (2.7 USD) compared to the same period in 2010. From January to November 2011 the total value of investments increased by 15.2% compared to the same period in 2010. Most of investments (54.3%) were in the state sector. The private sector accounted for 18.8%, while joint ventures accounted for 5.6%, and foreign ownership, 21.3%. The energy sector attracted 30.2% of total investments. The share of investments going to the energy sector decreased 96.1% compared to the same period in 2010. Of the total investment in the energy sector, 79.1% was provided by the state and private sectors in Tajikistan, and 20.9% by foreign credit. The consumer price inflation rate from January to November was 9.1% and food prices increased by 10%, non‐food items by 7%, and for services by 9.2%. Consumer price inflation in November equaled 0.2% compared to the same period in 2010. According to the Statistics Agency of Tajikistan, food prices in November increased by 0.1%, non‐food prices increased by 0.7% compared to October 2011. The cost of typical food basket for one person in November was 121.00 Tajik Somoni (53.74 USD). A nutritionally appropriate food basket would cost 255.8 Tajik Somoni (54.06 USD). Government income from taxes and related sources from January to January 2011 was 6.8 billion Tajik Somoni (1.4 billion USD), or 29.5% to GDP. Direct tax income in November was 69.9% of this total, and indirect tax income was 6.4%, grants 2.3%, and the remaining 21.4% were investments. The total value of bank credits issued in November was 4.6 billion Tajik Somoni (.97 billion USD). The value of overdue credits was 491.3 million Tajik Somoni (103.2 million USD), of which 47.9 % is in national currency and 52.1 % is in foreign currency. From January to November 2011, the trade deficit totaled 1.7 billion USD and increased by 160 million USD compared to October 2011. During the reporting period the foreign trade turnover, including electricity and natural gas, totaled 4 billion USD, 18.3% more than during the same period of time in 2010. Goods exports from January to November 2011 equaled 1.2 billion USD, 8.8% more than during January to November 2010. Goods imports equaled 2.9 billion USD, 22.6% more than during the same period in 2010. Goods exports in November 2011 equaled 106.9 million USD, 12.3% (14.9 million USD) more than in November 2010. Goods imports in November 2011 equaled 266.9 million USD, 0.3% (0.8 million USD) less than in November 2010. Exports in November increased by 12.4% and import decreased by 6.9% compared to October 2011.
6.3 Population Movement/Migration
The Migration Service of Tajikistan reports that a total of 750,391 persons (666,555 male) left Tajikistan and 597,511 persons returned during 2011.

18
Tajikistan Monitoring & Early Warning Report – January 2012
Migration To and From of Tajikistan January – December 2011 (persons)
Location Left Returned Dushanbe and Direct Rule Districts 406,386 353,088 GBAO 235 456 Sughd Province 172,670 155,935 Khatlon Province 171,100 88,032 Total 750,391 597,511
Migration Service in Tajikistan reported 884 deceased labor migrants retuned in 2011. In 2010 the total number of deceased labor migrants was 878.
Deceased Labor Migrants Returned to Tajikistan, 2010 – 2011
Region of Origin 2010 (persons)
2011 (persons)
Khatlon Province 249 260 Sughd Province 297 302 GBAO 50 57 DRD 186 161 Dushanbe 81 83 Rasht Valley 15 21
Total 878 884 Cause of Death
Murder 85 93 Suicide 21 20 Car accident 92 102 Disease/illness 339 340 Accident (work related) 244 227 Building Fire 0 4 Intoxication 13 14 Undetermined reason 68 58 Drowned 13 19 Explosion 3 2
Total 878 884
Out the total deceased labor migrants to date in 2011, 818 were male and 66 were female.
6.4 Employment
An update for will be provided in the February report.
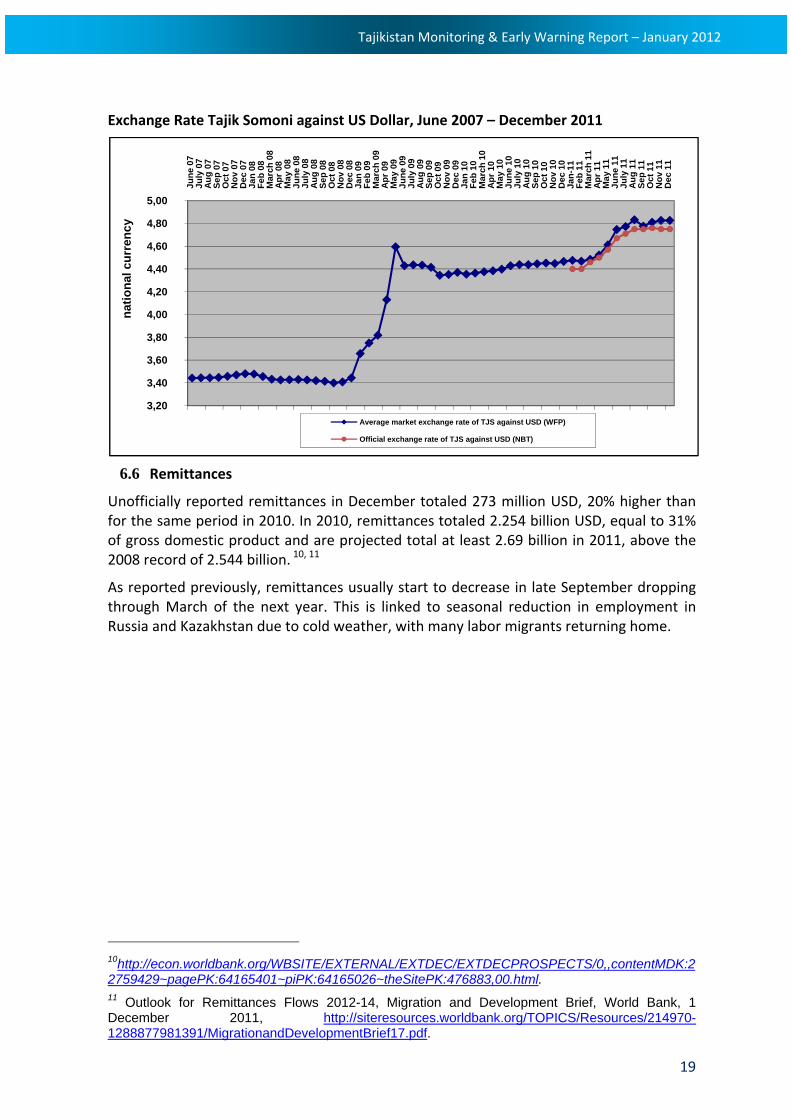
6.5 Exchange Rate The following chart provides both the official National Bank of Tajikistan’s (NBT) exchange rate and unofficial (market) exchange rate monitored weekly by WFP. The NBT rate as of December 31, 2011 was 4.75 Tajik Somoni to one USD. The WFP reported an average market exchange rate for 5 markets in Tajikistan on December 28, 2011 of 4.83 Tajik Somoni per one USD.
19
Tajikistan Monitoring & Early Warning Report – January 2012
Exchange Rate Tajik Somoni against US Dollar, June 2007 – December 2011
6.6 Remittances
Unofficially reported remittances in December totaled 273 million USD, 20% higher than for the same period in 2010. In 2010, remittances totaled 2.254 billion USD, equal to 31% of gross domestic product and are projected total at least 2.69 billion in 2011, above the 2008 record of 2.544 billion. 10, 11
As reported previously, remittances usually start to decrease in late September dropping through March of the next year. This is linked to seasonal reduction in employment in Russia and Kazakhstan due to cold weather, with many labor migrants returning home.
10http://econ.worldbank.org/WBSITE/EXTERNAL/EXTDEC/EXTDECPROSPECTS/0,,contentMDK:22759429~pagePK:64165401~piPK:64165026~theSitePK:476883,00.html. 11 Outlook for Remittances Flows 2012-14, Migration and Development Brief, World Bank, 1 December 2011, http://siteresources.worldbank.org/TOPICS/Resources/214970-1288877981391/MigrationandDevelopmentBrief17.pdf.
3,20
3,40
3,60
3,80
4,00
4,20
4,40
4,60
4,80
5,00 Ju
ne 0
7Ju
ly 0
7A
ug 0
7Se
p 07
Oct
07
Nov
07
Dec
07
Jan
08Fe
b 08
Mar
ch 0
8A
pr 0
8M
ay 0
8Ju
ne 0
8Ju
ly 0
8A
ug 0
8Se
p 08
Oct
08
Nov
08
Dec
08
Jan
09Fe
b 09
Mar
ch 0
9A
pr 0
9M
ay 0
9Ju
ne 0
9Ju
ly 0
9A
ug 0
9Se
p 09
Oct
09
Nov
09
Dec
09
Jan
10Fe
b 10
Mar
ch 1
0A
pr 1
0M
ay 1
0Ju
ne 1
0Ju
ly 1
0A
ug 1
0Se
p 10
O
ct 1
0N
ov 1
0D
ec 1
0Ja
n-11
Feb
11M
arch
11
Apr
11
May
11
June
11
July
11
Aug
11
Sep
11O
ct 1
1N
ov 1
1D
ec 1
1
natio
nal c
urre
ncy
Average market exchange rate of TJS against USD (WFP)
Official exchange rate of TJS against USD (NBT)

20
Tajikistan Monitoring & Early Warning Report – January 2012
Monthly Remittances, January 2006 to December 2011 (Million USD)
Inflowing Remittances in Tajikistan, 2002‐2011 (million USD)
$0
$50
$100
$150
$200
$250
$300
$350
$400Ja
n-06
Feb-
06M
ar-0
6A
pr-0
6M
ay-0
6Ju
n-06
Jul-0
6A
ug-0
6S
ep-0
6O
ct-0
6N
ov-0
6D
ec-0
6Ja
n-07
Feb-
07M
ar-0
7A
pr-0
7M
ay-0
7Ju
n-07
Jul-0
7A
ug-0
7S
ep-0
7O
ct-0
7N
ov-0
7D
ec-0
7Ja
n-08
Feb-
08M
ar-0
8A
pr-0
8M
ay-0
8Ju
n-08
Jul-0
8A
ug-0
8S
ep-0
8O
ct-0
8N
ov-0
8D
ec-0
8Ja
n-09
Feb-
09M
ar-0
9A
pr-0
9M
ay-0
9Ju
n-09
Jul-0
9A
ug-0
9S
ep-0
9O
ct-0
9N
ov-0
9D
ec-0
9Ja
n-10
Feb-
10M
ar-1
0A
pr-1
0M
ay-1
0Ju
n-10
Jul-1
0A
ug-1
0S
ep-1
0O
ct-1
0N
ov-1
0D
ec-1
0Ja
n-11
Feb-
11M
ar-1
1A
pr-1
1M
ay-1
1Ju
n-11
Jul-1
1A
ug-1
1S
ep-1
1O
ct-1
1N
ov-1
1D
ec-1
1
mill
ion
USD
$0
$50
$100
$150
$200
$250
$300
$350
$400
Jan.
Feb.
Mar
Apr
.
May
June July
Aug
.
Sep
.
Oct
.
Nov
.
Dec
.
Mill
ion
USD
2002 2003 2004 2005 20062007 2008 2009 2010 2011

21
Tajikistan Monitoring & Early Warning Report – January 2012
ANNEX A Weather Forecast for January – 2012
Khatlon Province and Lower Elevations of Direct Rule Districts (DRD)
Monthly average temperatures are expected to be 1 to 20C below long term averages. Average temperatures at lower elevations will be 0 to 20C, and in the foothills temperatures will be ‐2 to ‐40C.
During the first and last 5‐day period of the month temperatures are expected drop. temperatures. Daytime temperatures at lower elevations will be ‐3 to +20C, and at the foothills the temepratures will be ‐2 to ‐70C. . During the second half of of the month average temperatures at lower elevations will be ‐3 to +20C, and in the foothills the temperatures are expected to be ‐3 to ‐80C.
Monthly average temperatures at lower elevations will range from 4 to 130C, and in the foothills the temperatures will range from ‐2 to +60C. Nightime temperatures at lower elevations during the first half of the month will be ‐7 to ‐120C, in the foothils ‐11 to ‐160C.
Monthly precipitation is expected to be within long term averages. Average precipitation at lower elevations is 40 – 82 mm, in the far south of Khatlon Province average precipitation is 28 mm, in the foothills average precipitation is 86 – 102 mm. Western wind speeds will be 65 – 83 km/h. There will be fog.
Sughd Province
Monthly average temperatures at lower elevations and in the foothills are expected to be 1 to 20C below long term averages, temperatures at higher elevations will be within the long term averages. Temperatures at lower elevations will be ‐2 to ‐30C, and at higher elevations ‐5 to ‐80C.
It is expected that the temperatures at lower elevations and in the foothills will be below the average during the entire month. Nightime temperatures at lower elevations are expected to be ‐5 to ‐100C, and daytime temperatures will be 0 to ‐50C.
The coldest temepratures at higher elevations are expected during the first 10 days in the month with nightime temperatures ‐16 to ‐210C, and daytime temperatures will be ‐7 to ‐120C. During the last 20 days in the month a fluctuation of cold and warm temperatures is expected. Nightime temperatures will range from ‐3 to ‐110C and daytime temperatures will range from +3 to ‐50C.
Monthly precipitation is expected to be within long term averages. Average precipitation at lower elevations is 15 to 38 mm, and at higher elevations 9 to 18 mm. Wind speeds will be 61.2 – 79.2 km/h. There will be fog.
Higher Elevations of DRD and Western Regions of Gorno‐Badakhshan Autonomous Oblast
Monthly average temperatures at higher elevations of DRD are expected to be within long term averages. Temperatures in western Gorno Badakshan Autonomus Oblast will be 1 to 20C below long term averages with temperatures ‐6 to ‐70C.
It is expected that temperatures at western GBAO will be low during the entire month. Nigthtime temperatures will range from ‐3 to ‐160C, and daytime temperatures 0 to ‐100C. The coldest temperatures are expetcted during the second 5‐day time period in the month when the tempratures will drop to ‐18 to ‐230C.

22
Tajikistan Monitoring & Early Warning Report – January 2012
During the first half of the month the nightime temperatures at higher elevation in Direct Rule Districts will be ‐10 to ‐150C, and daytime temperatures will be ‐3 to ‐80C. During the second half of the month the nightime temperatures will range from ‐2 to ‐10C , and daytime temperatures will range from 0 to ‐50C.
Monthly precipitation is expected to be within long term averages. Average precipitation in western GBAO is 6 to 53 mm, and DRD is 39 to 150 mm. Wind speeds will be 61.2 – 79.2 km/h. There wil be fog on the road passes.
Eastern Regions of GBAO
Monthly average temperatures are expected to be 1 to 30C below long term averages. Average temperatures will be ‐15 to ‐170C, and in Burunkul ‐210C.
Low temperatures can be expected during the entire month. Daytime temperatures will range from ‐6 to ‐230C , and nightime temperatures will range from ‐16 to ‐380C. Nightime temperatures in Burunkul may drop to ‐500C.
Monthly precipitation is expected to be within long term averages with average precipitation ranging from 3 to 12 mm. Wind speeds will be 61.2 – 79.2 km/h.
23
Tajikistan Monitoring & Early Warning Report – January 2012
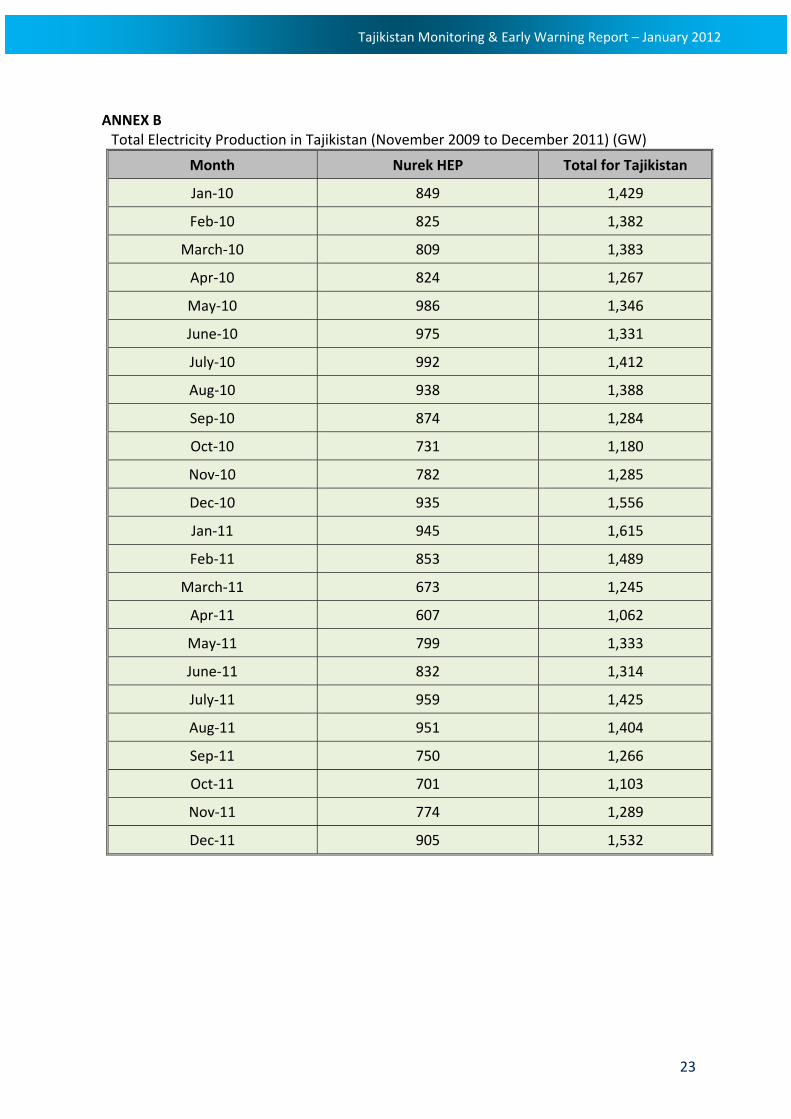
ANNEX B Total Electricity Production in Tajikistan (November 2009 to December 2011) (GW)
Month Nurek HEP Total for Tajikistan
Jan‐10 849 1,429
Feb‐10 825 1,382
March‐10 809 1,383
Apr‐10 824 1,267
May‐10 986 1,346
June‐10 975 1,331
July‐10 992 1,412
Aug‐10 938 1,388
Sep‐10 874 1,284
Oct‐10 731 1,180
Nov‐10 782 1,285
Dec‐10 935 1,556
Jan‐11 945 1,615
Feb‐11 853 1,489
March‐11 673 1,245
Apr‐11 607 1,062
May‐11 799 1,333
June‐11 832 1,314
July‐11 959 1,425
Aug‐11 951 1,404
Sep‐11 750 1,266
Oct‐11 701 1,103
Nov‐11 774 1,289
Dec‐11 905 1,532

24
Tajikistan Monitoring & Early Warning Report – January 2012
ANNEX C Daily Average Electricity Consumption in Tajikistan (April 2010 to November 2011) (GW)
Month South North TALCO Dushanbe
Apr‐10 35 7 18 6
May‐10 36 6.5 18.5 5.9
June‐10 35 11.8 18.2 4.5
July‐10 33 12 18 4.8
Aug‐10 33 12 18 4.8
Sep‐10 32 10 17 4.8
Oct‐10 32 5.9 17 5.7
Nov‐10 37 6.9 17 8.4
Dec‐10 42 8.2 17 11
Jan‐11 44 8.6 17 12
Feb‐11 44 8.7 17 11.7
March‐11 34.27 5.6 17 8.1
Apr‐11 39.8 18 16 5.5
May‐11 31.4 11.9 14 4.8
June‐11 31.7 12.5 13.8 4.8
July‐11 31.9 14.2 13.5 4.7
Aug‐11 31.6 13.6 13.4 4.8
Sep‐11 30.5 11.1 14 4.4
Oct‐11 29.1 6.1 14.1 5.5
Nov‐11 35.4 7.1 14.4 9.3
Dec‐11 41.2 8 14.9 12.2

25
Tajikistan Monitoring & Early Warning Report – January 2012
The aim of the Tajikistan Monthly Monitoring and Early Warning (MEWS) Reports is to provide regular information and succinct analysis on the evolution of natural, economic, food‐related, energy‐related and other risk factors in Tajikistan. Data and information in this report are provided by different sources and compiled by the MEW System GoT Group of Experts and UN Agencies in Tajikistan. The United Nations Development Program in Tajikistan and Monitoring and Early Warning Center at MEDT are not responsible for the quality or accuracy of the data provided by external sources or the analysis contained in this report.
Contact information:
Ministry of Economic Development and Trade of Tajikistan UNDP Disaster Risk Management Program 37, Bokhtar St, 5th floor, room # 506. Dushanbe 734002 Monitoring and Early Warning Unit (MEW),Tajikistan 37/1, Bokhtar Str., 6th floor, suite 604,Tel: (992 37) 227‐36‐04 “VEFA” Business Center. Dushanbe 734019e‐mail: [email protected] Tel: (992 47) 6005912 Mobile: (992 91) 842‐19‐62 e‐mail: [email protected]
The report is available at:
http://untj.org/country_context/coordination_mechanisms/disaster_management/compound_crisis/early_warning_indicators/