monitoring leakage pathways - joint em and seismic
TRANSCRIPT

Monitoring Leakage Pathways -
Joint EM and Seismic
Project Number LBNL-ESD14095
David Alumbaugh
Energy Geosciences Division
Lawrence Berkeley National Laboratory
U.S. Department of Energy
National Energy Technology Laboratory
Carbon Management and Oil and Gas Research Project Review Meeting – Carbon Storage
August 2 - 11, 2021
2
Presentation Outline
• Project background and description of the CaMI
Site
• Processed/inverted baseline data
• New crosswell system hardware and test results
• Studies of electric field measurements
• Progress on joint inversion of crosswell seismic
and EM data
• Conclusions
CaMI Field Research Station (FRS)
3

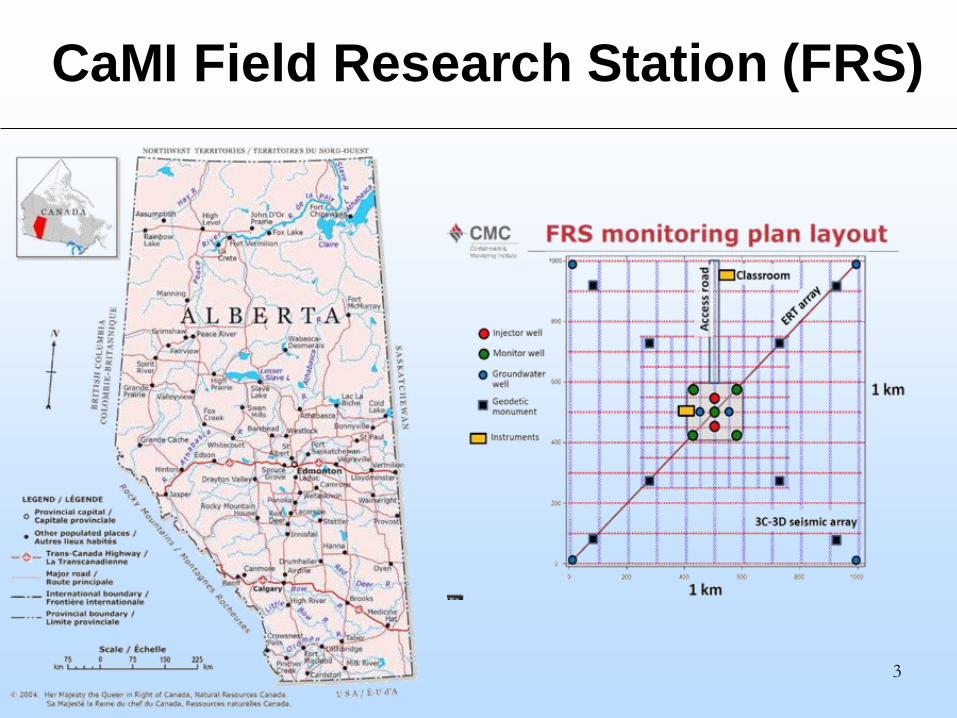
CaMI Field Research Station (FRS)
4
Transmitter well (Monitoring Well OB2) is highly deviated.
OB1 is steel-cased, whereas OB2 is open-well (fiberglass).
In general, CaMI-FRS site has layered geological structures.
Why Joint Seismic and EM?
5
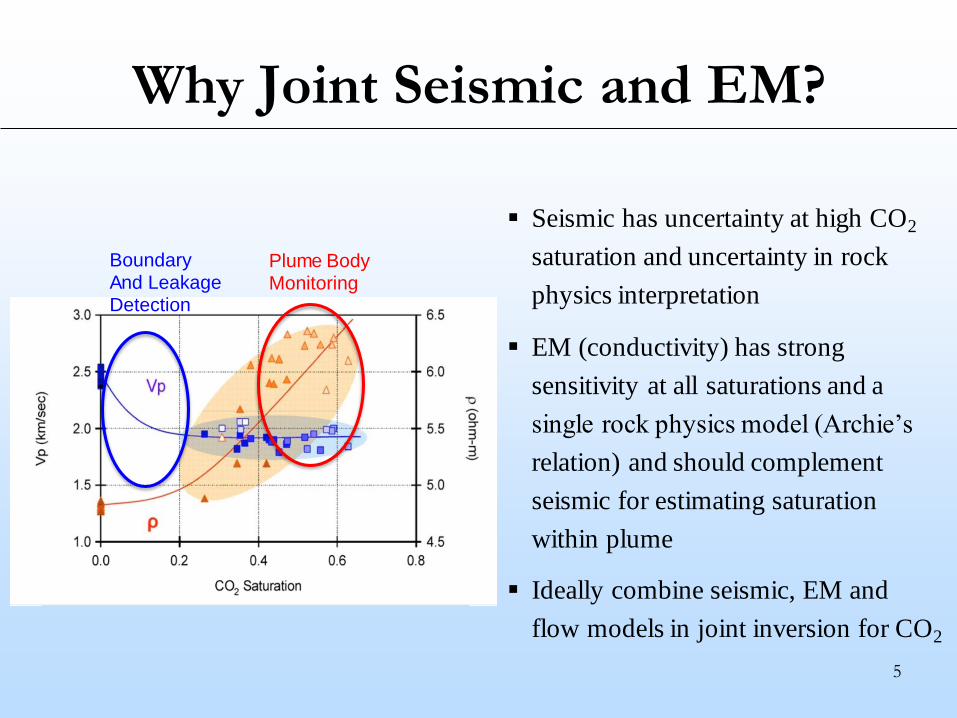
Boundary And LeakageDetection
Plume BodyMonitoring
▪ Seismic has uncertainty at high CO2
saturation and uncertainty in rock
physics interpretation
▪ EM (conductivity) has strong
sensitivity at all saturations and a
single rock physics model (Archie’s
relation) and should complement
seismic for estimating saturation
within plume
▪ Ideally combine seismic, EM and
flow models in joint inversion for CO2

Why Crosswell Measurements?
6
• LBNL has a Unique Capability in
in Borehole Seismic EM and
Imaging
• These tools fill a ‘Resolution Gap’
between Surface and Logging
Methods, and thus can be Critical
for Reservoir Scale Imaging
• LBNL and their partners also have
numerical tools and experience in
2D and 3D Imaging
• Joint EM/Seismic and Fluid Flow
Imaging also Available
0.001 0.01 0.1 1 10 100 1,000 10,000 100,000
Depth of Investigation (m)
0.01
0.1
1
10
100
1000
Ve
rtic
al R
eso
luti
on
(m) Basin Scale (surface tools)
Logging Tools
Reservoir ScaleCrosswell and STB tools)

Crosswell Baseline Survey -2017
7
Piezoelectric source deployment in Well OB1
Hydrophone sensors deployment in Well OB2
CO2
Tank
Dual Sensor EM string
Magnetic receiver deployment in Well OB1
Magnetic source
deployment in Well OB2

Log-Constrained Inversion Workflow
8
• Inversion with resistivity log constraints at wells:
• Upscaled/averaged resistivity logs are used as constraints.
• Well deviation logs are used for correctly positioning sources and receivers.
Starting Model Inversion
Result

Log-Constrained Inversion Workflow
• Inversion with initial model created from sonic logs.
• Well deviation logs are used for correctly positioning sources and receivers.
Starting Model
Inversion Result

Seismic and EM Image Comparison

Testing of Crosswell SystemBreadvan Source Deployment at
RFS Test Field Site
Seismic
Source
Magna DC Power Supply)
H Bridge Driver
Tuning Load
Current Toroid
Source Surface Electronics
12’
Seismic Source
EM Source
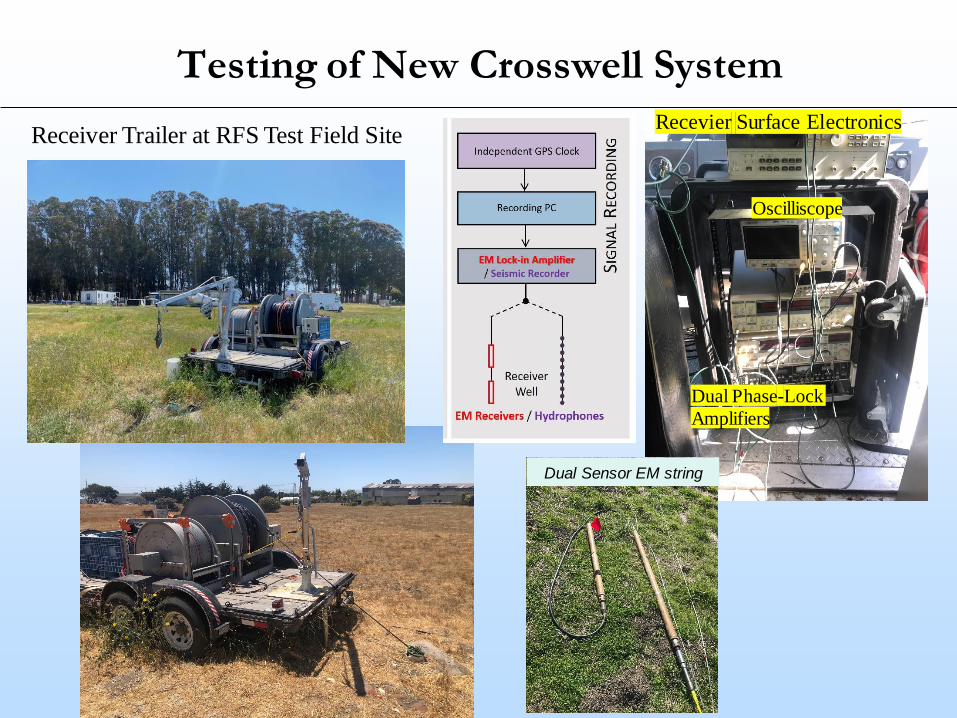
Testing of New Crosswell System
Receiver Trailer at RFS Test Field SiteRecevier Surface Electronics
Oscilliscope
Dual Phase-Lock
Amplifiers
Dual Sensor EM string

Testing of Crosswell System
12’
New Crosswell EM Tx
• Housing: fiberglass pipe
• Diameter: 3.5”
• Length: 12 ft
• Weight: ~150 lbs
• Tool head GH-7
– Gerhardt-Owen 7 conductor
• Send amplified signal from the surface
– Maximum 300 V
– Maximum 2 amp/ wire
2017 Baseline Data
Acquisition
2021 Time -Lapse Data
Acquisition (estimated)

Testing of Crosswell System
Integrated EM System Testing
Testing of GPS Clocks
• Provides wireless connection between Tx and Rx electronics
• 0.1 degrees phase stability during daylong stability test
EM Data Acquisition
• Dual lock-in amplifiers
• PC acquisition using LabView
Continuous Active Source EM (CASEM)
• Run for 60 hours continuously on house power at 650 Hz
• 0.1% amplitude repeatability
• 0.2o phase repeatability
Correction for Receiver in Steel Casing
• Modification of MARE2DEM algorithm of Key (2016) for inversion of complex casing attenuation coefficient
Seismic Acquisition • Provided by Geometrics Geode
• Software currently being modified
Blue Line: Measured Voltage
Red Dashed Line: Theoretical

Electric Field Studies
Well OB2 Completion DiagramPermanently Installed ERT
Array
– Advantage over Crosswell
EM
• Provides ‘galvanic’
measurement which is more
sensitive to resistive CO2
target
• Crosswell ‘inductive’
magnetic field measurement
more sensitive to conductors
than resistors
– Disadvantage compared to
Crosswell EM
• Mostly sensitive along OB2
well: little interwell
sensitivity
• Crosswell EM more
sensitive to interwell region
• What if you don’t have
permanently installed
electrodes?
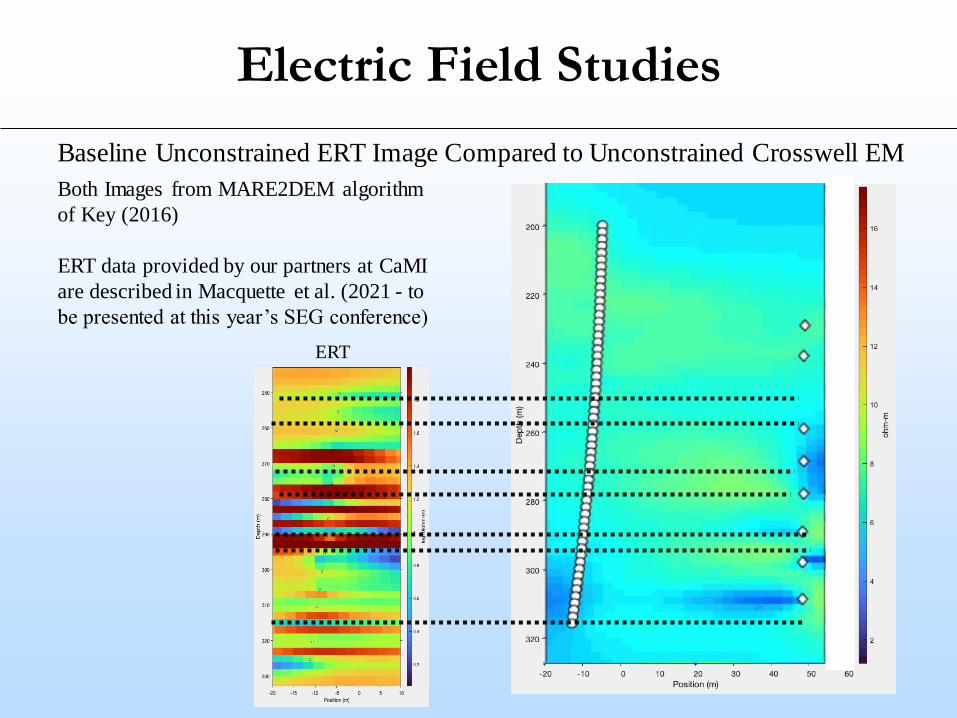
Electric Field Studies
Baseline Unconstrained ERT Image Compared to Unconstrained Crosswell EM
Crosswell EM
ERT
Both Images from MARE2DEM algorithm
of Key (2016)
ERT data provided by our partners at CaMI
are described in Macquette et al. (2021 - to
be presented at this year’s SEG conference)

Electric Field Studies
Baseline Unconstrained ERT Image Compared to Log-constrained Crosswell EM
ERT
Crosswell EM
Both Images from MARE2DEM algorithm
of Key (2016)
ERT data provided by our partners at CaMI
are described in Macquette et al. (2021 - to
be presented at this year’s SEG conference)
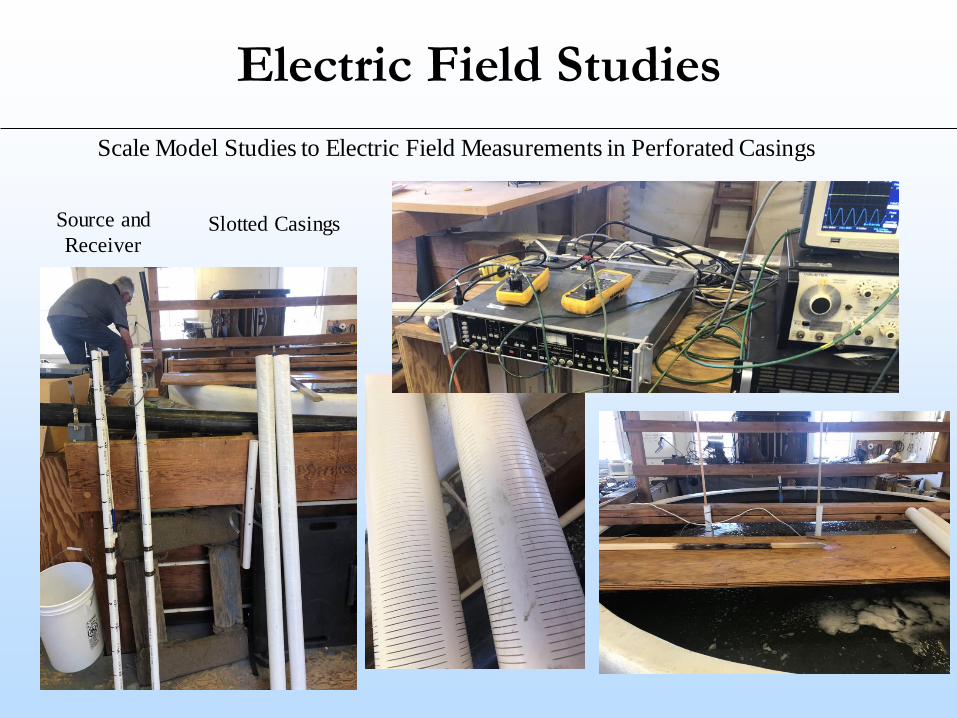
Electric Field Studies
Scale Model Studies to Electric Field Measurements in Perforated Casings
Source and
ReceiverSlotted Casings
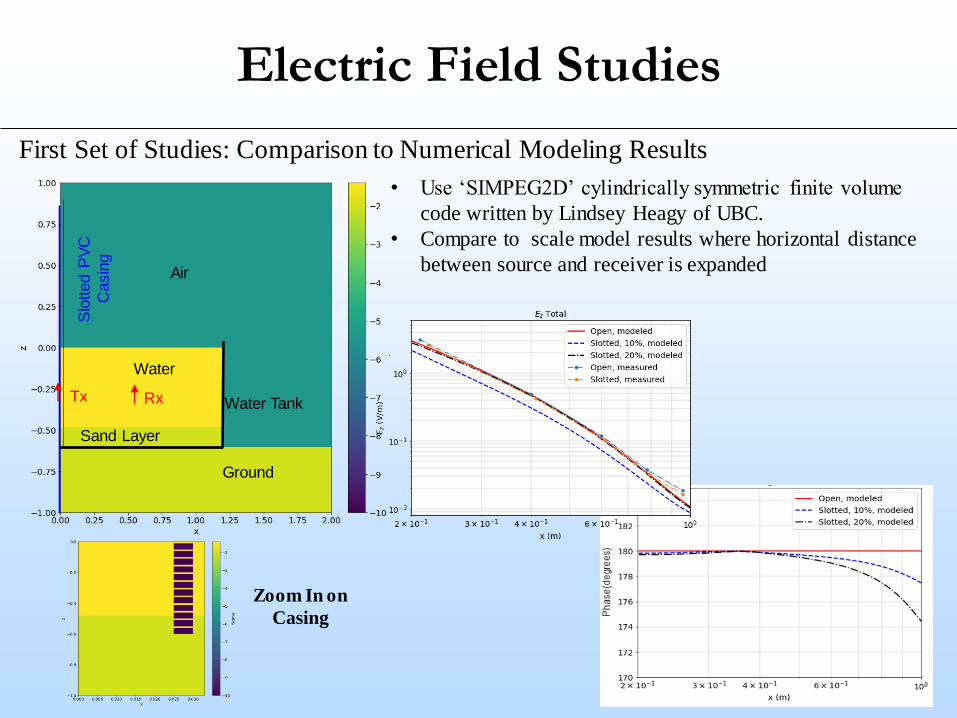
Electric Field Studies
First Set of Studies: Comparison to Numerical Modeling Results
Slo
tted P
VC
Casin
g
Water Tank
Ground
Sand Layer
RxTx
Air
Water
Zoom In on
Casing
• Use ‘SIMPEG2D’ cylindrically symmetric finite volume
code written by Lindsey Heagy of UBC.
• Compare to scale model results where horizontal distance
between source and receiver is expanded

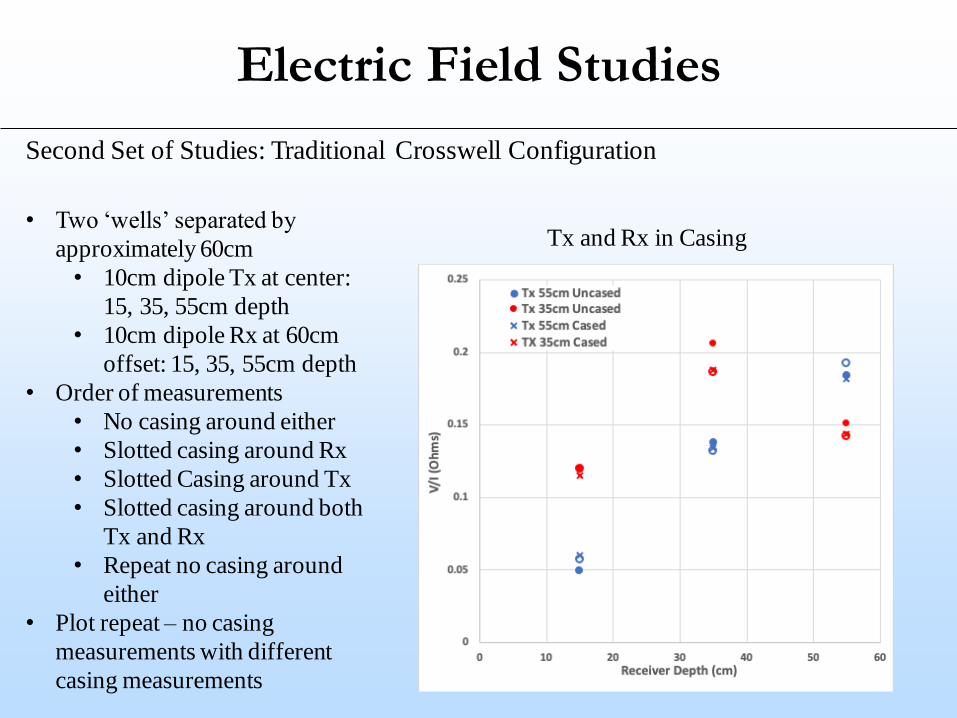
Electric Field Studies
Second Set of Studies: Traditional Crosswell Configuration
• Two ‘wells’ separated by
approximately 60cm
• 10cm dipole Tx at center:
15, 35, 55cm depth
• 10cm dipole Rx at 60cm
offset: 15, 35, 55cm depth
• Order of measurements
• No casing around either
• Slotted casing around Rx
• Slotted Casing around Tx
• Slotted casing around both
Tx and Rx
• Repeat no casing around
either
• Plot repeat – no casing
measurements with different
casing measurements
Tx in Casing: Rx no Casing
Electric Field Studies
Second Set of Studies: Traditional Crosswell Configuration
• Two ‘wells’ separated by
approximately 60cm
• 10cm dipole Tx at center:
15, 35, 55cm depth
• 10cm dipole Rx at 60cm
offset: 15, 35, 55cm depth
• Order of measurements
• No casing around either
• Slotted casing around Rx
• Slotted Casing around Tx
• Slotted casing around both
Tx and Rx
• Repeat no casing around
either
• Plot repeat – no casing
measurements with different
casing measurements
Tx and Rx in Casing
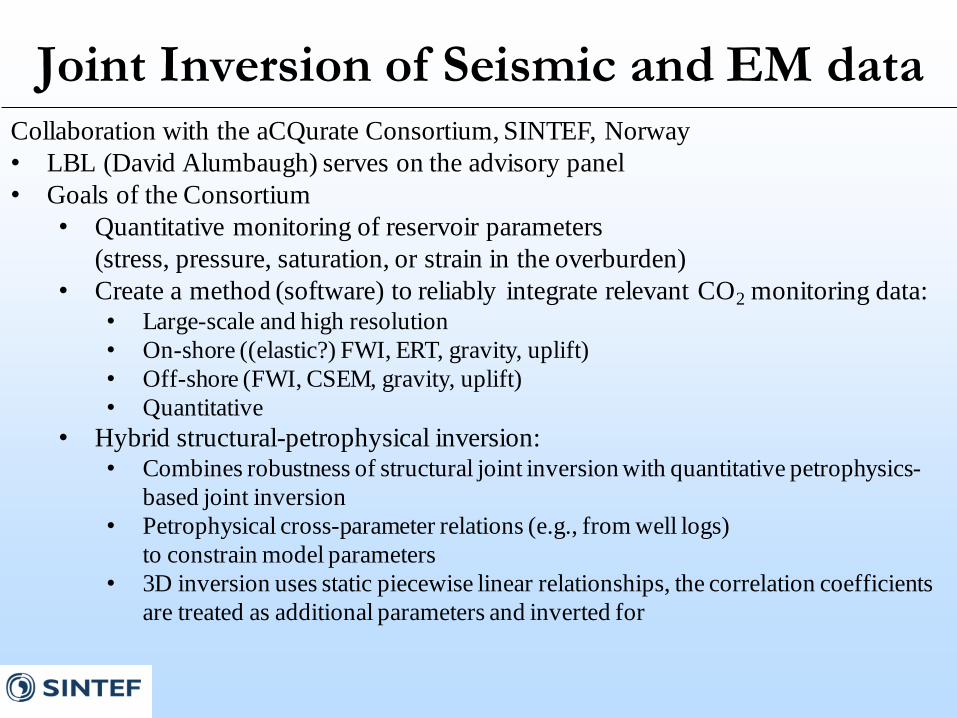
Joint Inversion of Seismic and EM dataCollaboration with the aCQurate Consortium, SINTEF, Norway
• LBL (David Alumbaugh) serves on the advisory panel
• Goals of the Consortium
• Quantitative monitoring of reservoir parameters
(stress, pressure, saturation, or strain in the overburden)
• Create a method (software) to reliably integrate relevant CO2 monitoring data:• Large-scale and high resolution
• On-shore ((elastic?) FWI, ERT, gravity, uplift)
• Off-shore (FWI, CSEM, gravity, uplift)
• Quantitative
• Hybrid structural-petrophysical inversion:• Combines robustness of structural joint inversion with quantitative petrophysics-
based joint inversion
• Petrophysical cross-parameter relations (e.g., from well logs)
to constrain model parameters
• 3D inversion uses static piecewise linear relationships, the correlation coefficients
are treated as additional parameters and inverted for

Joint Inversion of Seismic and EM data
Structural ‘Cross-Gradient’ constrained joint inversion
Seismic weight: 10-3
CSEM weight: 1
CG weight: 10-2

Joint Inversion of Seismic and EM data
Petrophysical Joint Inversion: Constraint Development
Stratigraphical units of interest:
• Foremost (138.10-290.22 m)
• Basal Belly River (290.22-296.85 m)
• Pakowki (296.85-358.10 m)
Linear cross-correlation between model
parameters:
Δ𝑣 = 𝐵 log10 𝜌 + 𝑎
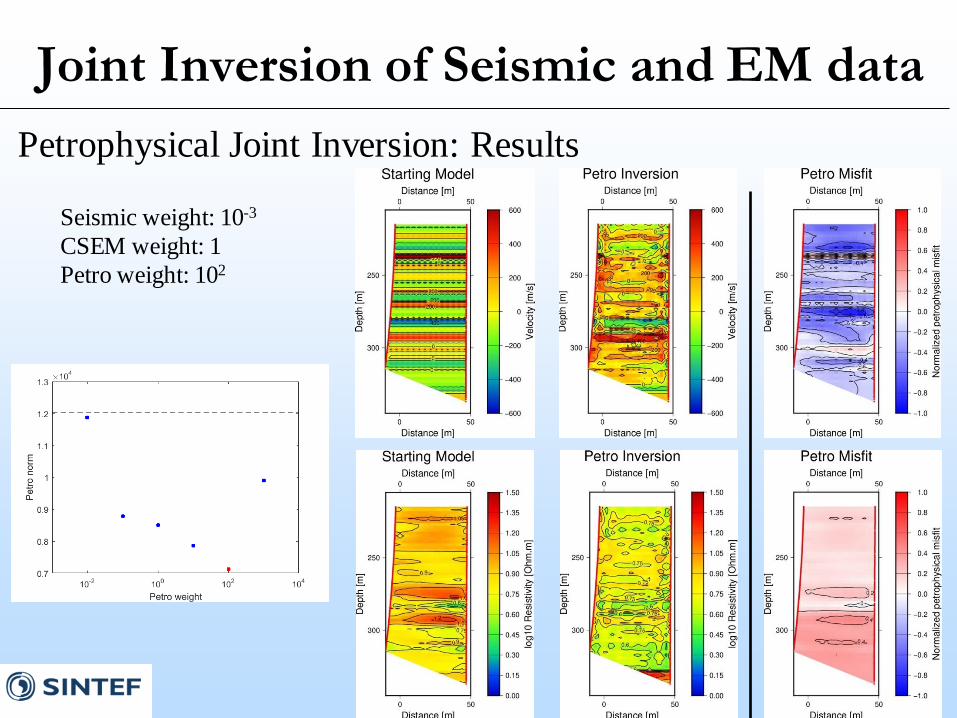
Joint Inversion of Seismic and EM data
Petrophysical Joint Inversion: Results
Seismic weight: 10-3
CSEM weight: 1
Petro weight: 102
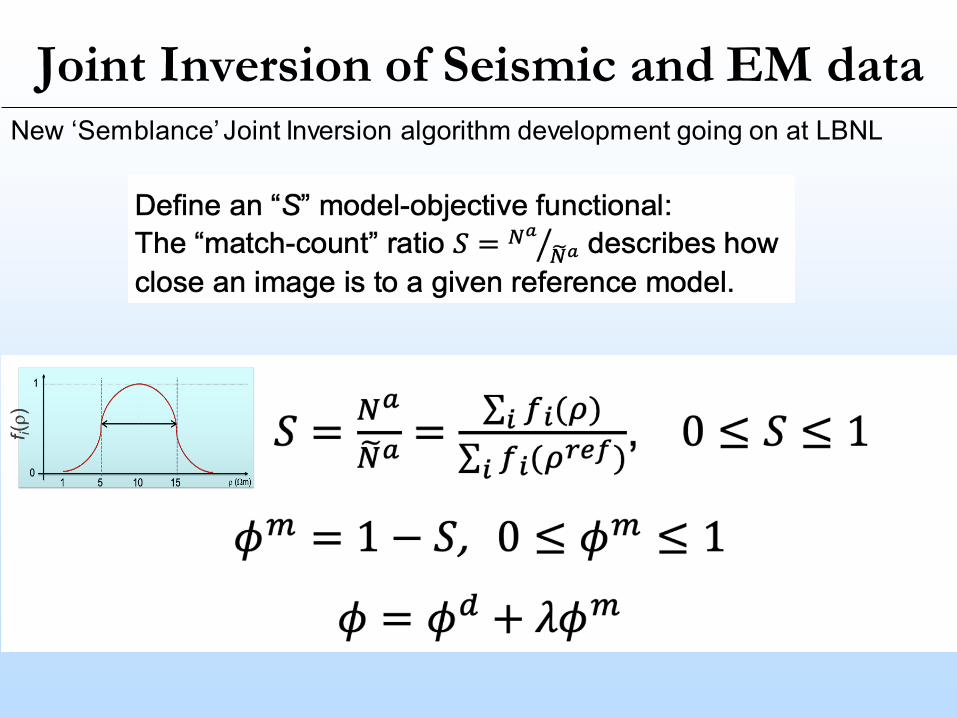
Joint Inversion of Seismic and EM dataNew ‘Semblance’ Joint Inversion algorithm development going on at LBNL
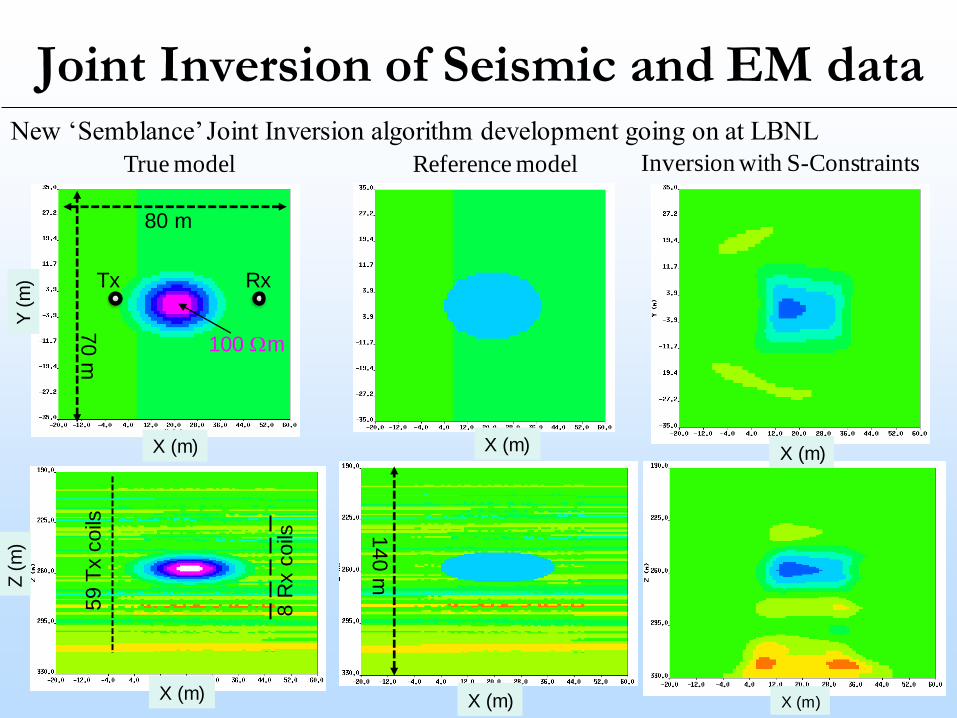
Joint Inversion of Seismic and EM dataNew ‘Semblance’ Joint Inversion algorithm development going on at LBNL
True model Reference model
80 m
70 m
100 Wm
Tx Rx
59 T
x coils
8 R
x coils
X (m)
Y (m
)Z
(m
)
X (m)
X (m)X (m)
140 m
X (m)
X (m)
Inversion with S-Constraints

Accomplishments to DateBackground
– Baseline crosswell EM and seismic data acquired (2017)
– High resolution velocity and resistivity baseline images provided via
log-constrained workflow
– CaMI currently injecting 600kg’s CO2 / week
LBL Crosswell System Improvements
– EM Transmitter: 10 to 20 times more power at low frequencies
– Use of GPS clocks for source-receiver synchronization eliminate
ground loop problems
– 60 hour continuous operation indicates 0.1% amplitude and 0.2o
phase stability which
– Inclusion of casing correction in MARE2DEM28
Accomplishments to Date
Electric Field Studies
– Inversion of CaMI single-well baseline ERT data completed using
the same MARE2DEM algorithm used for crosswell EM inversion,
and are comparable to well logs and crosswell inversion results
– Model studies have proved that electric field measurements can be
made in perforated/screened resistive casing as long as there is
adequate hydraulic connection to the formation
Joint Inversion
– Initial joint inversion results have been completed on the baseline
crosswell data collected at CaMI by our partners at SINTEF, with the
structural cross-gradient approach proving to provide better results
than petrophysically derived constraints 29

Lessons Learned– CO2 can be challenging to get into the ground (repeat CaMI data
acquisition was delayed by this)
– The crosswell EM data need to be acquired at a higher frequency
than was available for the baseline acquisition to improve resolution
– Repeat crosswell seismic data sets (2016 and 2017) showed poor
repeatability.
– Crosswell seismic acquisition using DAS fiber proved to be of poor
quality
– Current EM simulation technology can not provide accurate
simulations at the range of scales required to simulate perforated
resistive casing
– With current scale and numerical modeling capabilities we can not
determine if a correction is required for electric field data collected in
perforated resistive casing30

Lessons Learned– Deterministic joint inversion of crosswell seismic and EM data is
difficult, with many ‘knobs’ and ‘buttons’ that need to be tweaked
within the algorithms to produce optimal images
– The COVID pandemic has significantly delayed our ability to acquire
time-lapse data at the CaMI site
31

Project Summary
– LBL has developed a crosswell system that can collect both
seismic and EM data using many of the same components
– A well log constrained workflow has been developed to provide
high resolution images of velocity and resistivity collected with
the crosswell system
– The inclusion of electric fields in the EM data can improve
resistivity resolution
– Joint inversion of crosswell seismic and EM data can provide
higher resolution, structurally consistent images
– LBL hopes to return to CaMI this fall to make repeat
measurements with the goal of imaging the CO2 plume
32

Appendix
– These slides will not be discussed during the presentation, but
are mandatory.
33

34
Benefit to the Program
• In this task, LBNL is developing technologies to improve
monitoring and quantification of an important aspect of
carbon storage: geologic leakage pathways.
• This field experiment is crucial to understand monitoring of
gas-phase CO2 at intermediate depth for a leak into a
secondary accumulation (“thief zone”).
• The joint use of seismic and EM methods together will
ultimately allow for the imaging of subsurface CO2 over a
wide range of saturations.

35
Project Overview Goals and Objectives
• Funding:
– Started FY2021 with $624k in DOE Funding
– Currently have $245k for remaining FY2021 Work
– $0 Cost share other that what our partners (CaMI, SINTEF) are providing in in-
kind contributions
• Overall Project Performance Dates: To date Task 3 of the CCSMR program has
been funded by DOE on a year-to-year basis
• Project Participants : LBL, CaMI (University of Calgary, Canada), SINTEF
(Norway)
• Overall Project Objectives:
– Demonstrate, and acquire data with, LBL’s borehole geophysical data acquisition
systems
– Validate use of joint EM and seismic data acquisition and imaging for imaging
CO2 in shallow conditions
– Validate joint-inversion technologies for higher resolution imaging
36
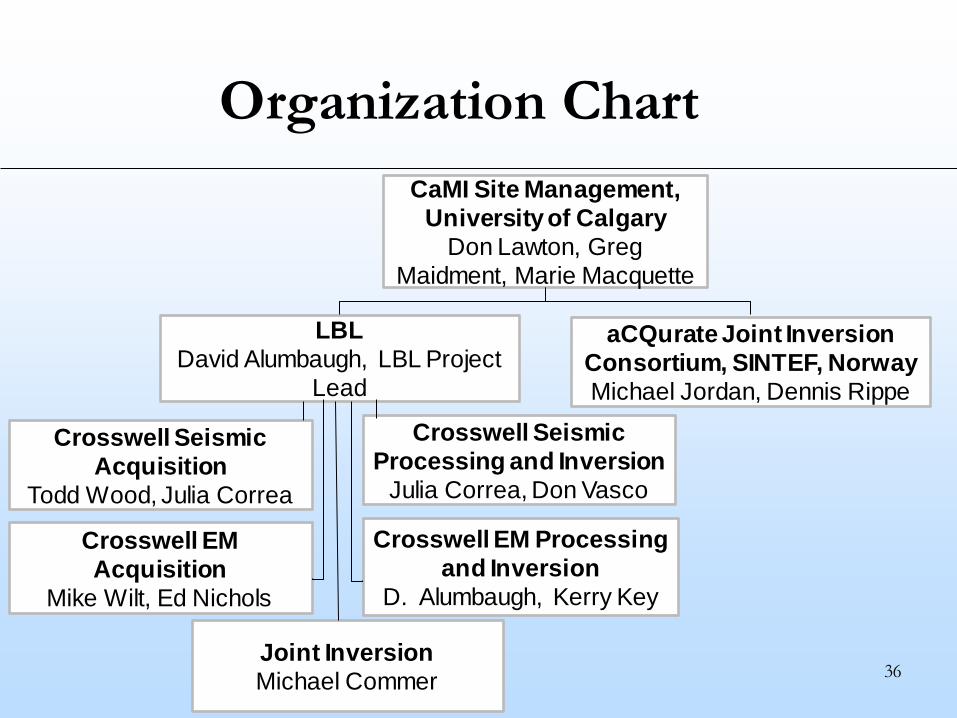
Organization Chart
CaMI Site Management,
University of Calgary
Don Lawton, Greg
Maidment, Marie Macquette
LBL
David Alumbaugh, LBL Project
Lead
Crosswell Seismic
Acquisition
Todd Wood, Julia Correa
Crosswell EM
Acquisition
Mike Wilt, Ed Nichols
Crosswell Seismic
Processing and Inversion
Julia Correa, Don Vasco
Crosswell EM Processing
and Inversion
D. Alumbaugh, Kerry Key
Joint Inversion
Michael Commer
aCQurate Joint Inversion
Consortium, SINTEF, Norway
Michael Jordan, Dennis Rippe

37
Gantt Chart
1 2
5
4
Major Milestones
3
1
2
3
4
Development of Sequential and Joint Inversion Capabilities
Crosswell EM, Seismic an Surface-to-Borehole First Repeat Surveys
DSS Dataset Acquisition During Injection : Changed Due to COVID
Sequential and Joint Inversion of Repeat EM, ERT, and Seismic Datasets
From FY2020 PMP-SOPO
1
1
1
2
2
2
3
4
5
Develop Workflows for Electric Field Measurements in Perforated Resistive Casing
3
Analysis of DSS datasets for strain signature of CO2 injection : Cancelled Due to COVID
6
7
Crosswell EM, Seismic an Surface-to-Borehole First Repeat Surveys : Cancelled Due to COVID
4
7
Sequential and Joint Inversion of Repeat EM, ERT, and Seismic Datasets : Cancelled Due to COVID
6
6
Color Scale
Original Planned Dates Delays Due to COVID

38
Gantt Chart
1
2
1
2
3
4
Major Milestones
3
1
2
3
4
Complete Development of Sequential and Joint Inversion Capabilities
Joint Inversion of Crosswell EM and ERT Data Using the MARE2DEM Code
Crosswell EM and Seismic Repeat Surveys Acquistion
Sequential and Joint Inversio of Repeat EM, ERT, and Seismic Datasets
Other Advances
1 Finish Testing of Crosswell EM System at RFS
3
2 Finish Testing of Crosswell Seismic System at RFS
3Complete first inversion of CaMI Baseline ERT Data using MARE2DEM code
For FY2021 PMP-SOPO

Bibliography
– List peer reviewed publications generated from the project per
the format of the examples below.
39