monitoring: pre-post closure of artificial channel · monitoring: pre-post closure of artificial...
TRANSCRIPT

Sal ty Lagoon
M o n i t o r i n g : P r e - P o s t C l o s u r e o f A r t i f i c i a l C h a n n e l
Project Management
and Ecosystem Health Report January 2012
Prepared for: Richmond Valley Council © GeoLINK, 2012
PO Box 119 Lennox Head NSW 2478
T 02 6687 7666
PO Box 1446 Coffs Harbour NSW 2450
T 02 6651 7666

Version History UPR Description Date Issued Issued By Reviewed By 1731548 Initial draft 28/02/2012 MB CWH / client 1731860 Final 11/04/2012 CWH

Table of Contents
Salty Lagoon Project Management & Ecosystem Health Monthly Report, January 2012 1731860
i
1 Introduction 1
2 Methodology 3
2.1 Discrete Sampling .................................................................................................................................. 3
2.2 Permanent Water Quality Monitoring Stations ....................................................................................... 3
3 Results 7
3.1 Water Quality Samples ........................................................................................................................... 7
3.2 Permanent Water Quality Monitoring Stations ....................................................................................... 7
4 Discussion 11
4.1 Water Quality ........................................................................................................................................ 11
4.2 Other Observations .............................................................................................................................. 13
4.3 Adaptive Management Response ........................................................................................................ 13
5 Key Points 15
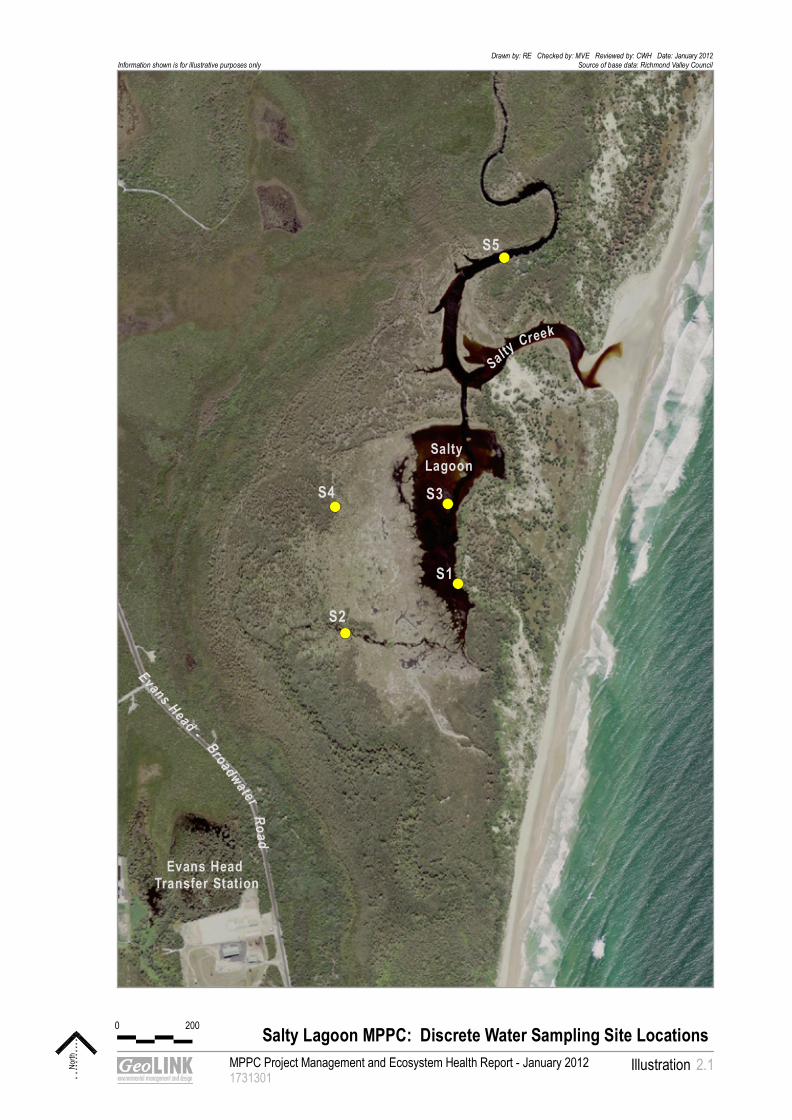
Illustrations Illustration 2.1 Salty Lagoon MPPC Discrete Water Sampling Site Locations, January 2012 .................... 5
Illustration 3.1 Salty Lagoon rainfall and water quality monitoring station data 13 December 2011 to 9 January 2012 ................................................................................................................ 8
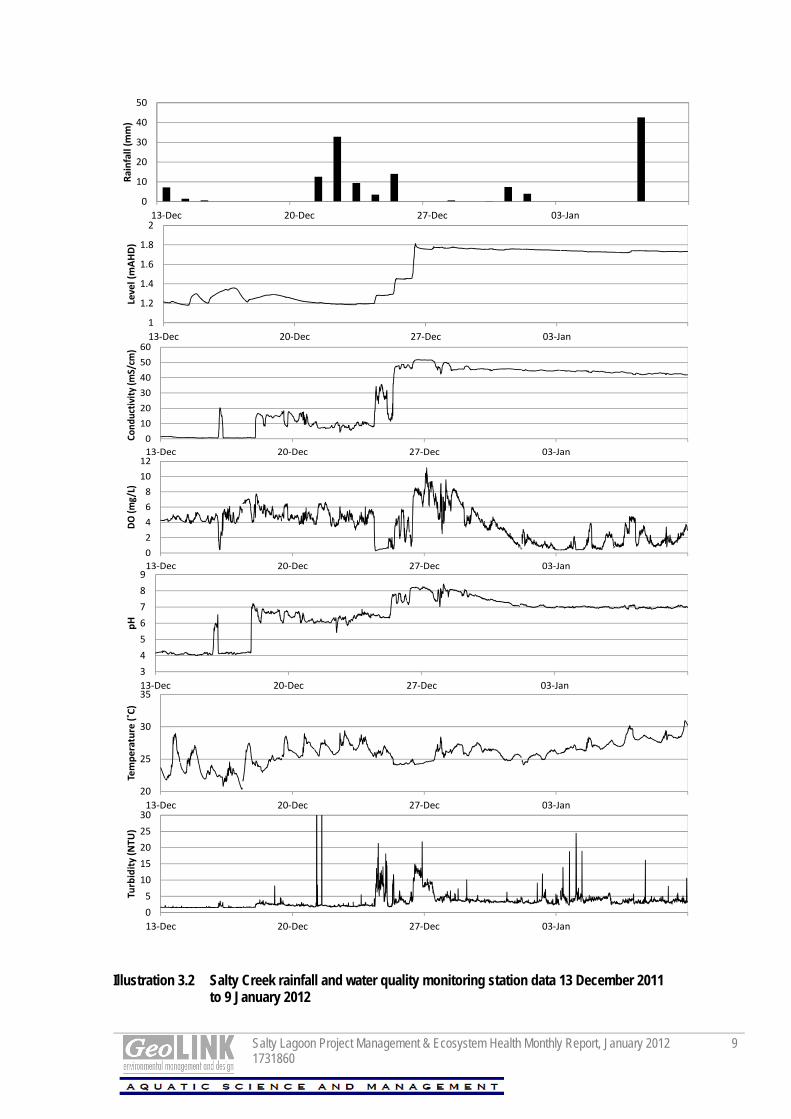
Illustration 3.2 Salty Creek rainfall and water quality monitoring station data 13 December 2011 to 9 January 2012 ................................................................................................................ 9
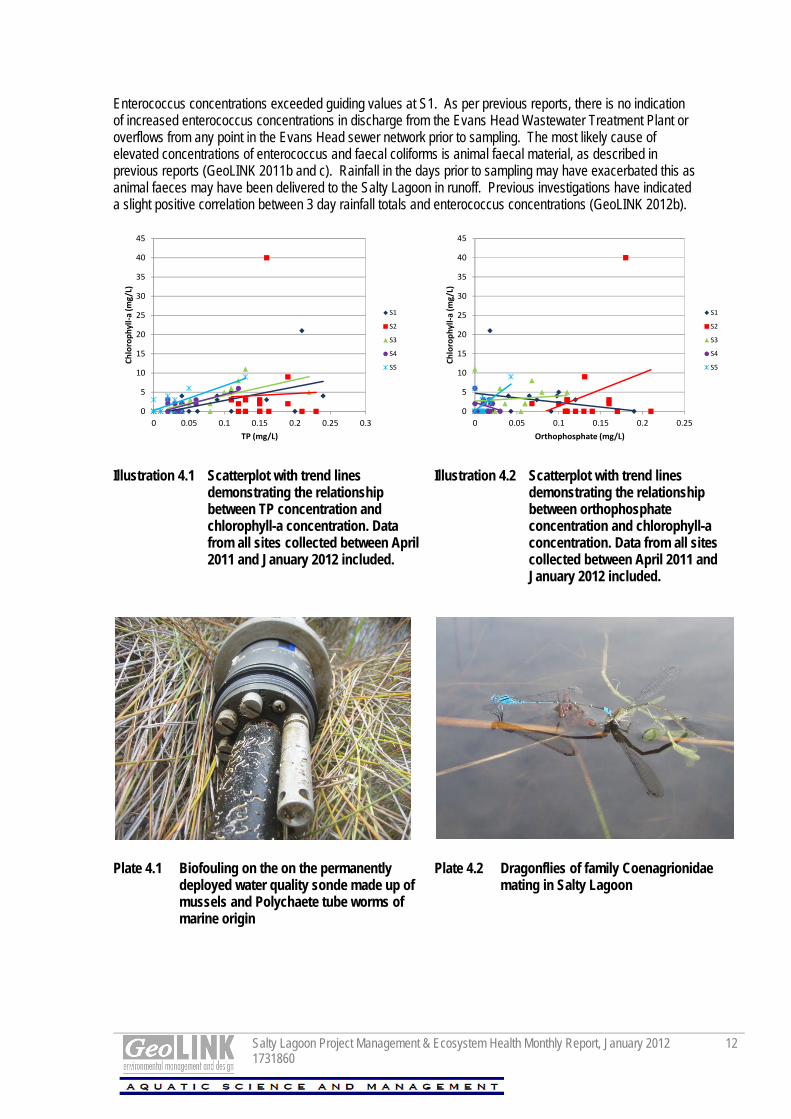
Illustration 4.1 Scatterplot with trend lines demonstrating the relationship between TP concentration and chlorophyll-a concentration. Data from all sites collected between April 2011 and January 2012 included. ..................................................................................................... 12
Illustration 4.2 Scatterplot with trend lines demonstrating the relationship between orthophosphate concentration and chlorophyll-a concentration. Data from all sites collected between April 2011 and January 2012 included. ............................................................................. 12
Tables Table 2.1 Locations of Water Quality Sample Sites in Salty Lagoon and Salty Creek (WGS84) ................. 3
Table 3.1 Water Quality Monitoring Results for Samples Collected on 9 January 2012 .............................. 7
Salty Lagoon Project Management & Ecosystem Health Monthly Report, January 2012 1731860
ii
Plates Plate 2.1 The entrance to Salty Creek; closed on 9 January 2011 ............................................................. 4
Plate 2.2 Scattered blue green algae on the western shore of Salty Lagoon .............................................. 4
Plate 4.1 Biofouling on the on the permanently deployed water quality sonde made up of mussels and Polychaete tube worms of marine origin .......................................................................................................... 12
Plate 4.2 Dragonflies of family Coenagrionidae mating in Salty Lagoon ................................................... 12
Plate 4.3 Fixed point photo at S2 looking North, 12 December 2011. ....................................................... 13
Plate 4.4 Fixed point photo at S2 looking North, 09 January 2012. .......................................................... 13
1
Salty Lagoon Project Management & Ecosystem Health Monthly Report, January 2012 1731860
1
Introduction 1 1 1
The following report provides an evaluation of the continuously recorded and discrete sample data collected from Salty Lagoon and Salty Creek as part of the Salty Lagoon Ecosystem Recovery Monitoring Program; Pre – Post Closure of Artificial Channel (MPPC) (Hydrosphere Consulting 2010). This current report is for the monitoring period 13 December 2011 to 9 January 2012.

This page has been intentionally left blank.

2
Salty Lagoon Project Management & Ecosystem Health Monthly Report, January 2012 1731860
3
Methodology 2 2 2
2.1 Discrete Sampling The site visit, including routine maintenance of permanent water quality monitoring stations and discrete water quality sampling, was undertaken on 9 January 2011. Water quality samples were collected between the hours of 10.00 am and 1.00 pm on that day. A 1.80 m high tide was forecast for 9.03 am. Discrete water quality samples were taken from surface water (approx. 0.2 m depth) at four sites in Salty Lagoon (S1-S4) and a single site (S5) in Salty Creek (refer to Illustration 2.1). An additional quality assurance (QA) replicate sample was collected at S3. The specific locations of all sites sampled are presented in Table 2.1 and displayed in Illustration 2.1. Table 2.1 Locations of Water Quality Sample Sites in Salty Lagoon and Salty Creek (WGS84)
Site S 1 S 2 S 3 S 4 S 5 Eastings 0542064 0541799 0542037 0541754 0542187 Northings 6782801 6782669 6783013 6783033 6783665 Site Description Lagoon
monitoring station
SE of Drainage Channel
NE area of lagoon
NW area of lagoon
Creek monitoring station
Physico-chemical water quality parameters were measured with an HORIBA U-52 hand held water quality meter. In addition to samples of surface water further samples were taken at 1 m depth intervals at sites where the water depth permitted this. Physico-chemical measurements at 1 m depth were taken from S1, S3 and S5. Samples were collected in jars for analysis of chemical and biological parameters at the Coffs Harbour Laboratory (CHL). Sterile jars were used for collection of samples for bacteriological analysis and brown glass jars were used for collection of samples for analysis of chlorophyll-a content. Samples were placed upon ice in an esky and delivered to CHL on the day following collection. In addition to water quality samples, photos were taken showing the environment to the north, east, south and west of each water quality sample site. These sites will be used for fixed point photo monitoring for the duration of the project.
2.2 Permanent Water Quality Monitoring Stations There are two permanent water quality monitoring stations (PWQMS) in place for the duration of the MPPC, measuring water level, temperature, pH, conductivity, turbidity and dissolved oxygen (DO) concentrations. Data from the PWQMS is sent to a Richmond Valley Council (RVC) server via a telemetry system. This data was accessed at least twice weekly, checked for errors and outlying data, and incorporated into a database for the current reporting period. The water level data was corrected prior to being included in this report. In order to do this a correction factor was developed using observations of actual water level in the field and the surveyed levels of the measuring boards at each of the permanent water quality monitoring stations. The correction factor was then applied to the raw data so that levels could be reported relative to Australian Height Datum (AHD).

Salty Lagoon Project Management & Ecosystem Health Monthly Report, January 2012 1731860
4
Routine maintenance of the permanent water quality monitoring stations involved the following steps: Removal of the YSI sondes from their protective sleeve to remove built up fouling; Check the integrity of the dissolved oxygen (DO) membrane and turbidity wiper mechanism; Check all connections for signs of corrosion or leaks; Replace the Salty Lagoon sonde with a spare, serviced and calibrated sonde; Check the desiccant capacity; and Visual check of modem function. Climate information was sourced from the Evans Head bombing range weather station on the Bureau of Meteorology website (BoM, 2012). Evans Head STP facility routine sampling information was provided by RVC, as was data from the permanent data logger stations.
Plate 2.1 The entrance to Salty Creek; closed on 9 January 2011
Plate 2.2 Scattered blue green algae on the western shore of Salty Lagoon
!(
!(!(
!(
!(
Salty Lagoon
SaltyCreek
Evans Head Transfer Station
Evans Head -Broadwater
Road
S1
S2
S3S4
S5
MPPC Project Management and Ecosystem Health Report - January 20121731301
Illustration
Salty Lagoon MPPC: Discrete Water Sampling Site Locations
North 2.1
Drawn by: RE Checked by: MVE Reviewed by: CWH Date: January 2012Source of base data: Richmond Valley CouncilInformation shown is for illustrative purposes only
0 200

This page has been intentionally left blank.

3
Salty Lagoon Project Management & Ecosystem Health Monthly Report, January 2012 1731860
7
Results 3 3 3
3.1 Water Quality Samples Results of the water quality monitoring undertaken on 9 January 2012 are reported in Table 3.1. Table 3.1 Water Quality Monitoring Results for Samples Collected on 9 January 2012
Parameter S1 S1 (1m
depth)
S2 S3 S3* (QA)
S3 (1m
depth)
S4 S5 S5 (1m
depth)
Blue Green Algae ID (cells/mL)
Nil ns Nil Nil Nil ns Nil Nil ns
Nitrite Nitrogen (mg/L) <0.01 ns <0.01 <0.01 <0.01 ns <0.01 <0.01 ns
Nitrate Nitrogen (mg/L) <0.01 ns <0.01 <0.01 <0.01 ns <0.01 <0.01 ns
Oxidized Nitrogen (mg/L) <0.01 ns <0.01 <0.01 <0.01 ns <0.01 <0.01 ns
Ammonia Nitrogen (mg/L) <0.01 ns <0.01 <0.01 <0.01 ns <0.01 <0.01 ns
Total Kjeldahl Nitrogen (mg/L) 1.26 ns 1.27 1.16 1.14 ns 1.53 0.97 ns
Total Nitrogen (mg/L) 1.26 ns 1.27 1.16 1.14 ns 1.53 0.97 ns
Total Phosphorus(mg/L) 0.04 ns 0.16 0.11 0.05 ns 0.03 0.05 ns
Orthophosphate (mg/L) <0.01 ns 0.18 0.03 0.02 ns <0.01 <0.01 ns
Chlorophyll-a (mg/L) 2 ns 40 6 3 ns <1 6 ns
Enterococcus (mg/L) TNTC ns 55 # 82 ns 4 40 ns
Faecal Coliforms (mg/L) 2 ns 12 # 0 ns 3 6 ns
Temp (˚C) 27.2 27.6 25.4 27.3 ns 27.3 25.9 29.8 27.4
pH 6.72 6.76 5.6 6.97 ns 6.91 5.24 6.77 6.91
ORP (mV) 7 19 -236 7 ns -30 -289 55 54
Cond (mS/cm) 37.6 39.6 16.8 40.1 ns 40.4 12.4 38.9 41.1
Turbidity (NTU) 5.6 12.9 26.4 8.1 ns 12.9 15 0 0
DO (mg/L) 5.44 4.47 3.08 4.84 ns 3.35 2.87 9.84 4.46
DO (% sat) 79.6 66.5 40.5 71.6 ns 49.7 37.3 150.7 66.4
TDS (mg/L) 23 24.2 10.2 24.5 ns 24.6 7.65 23.7 25.1
Sal (ppt) 23.8 25.3 9.8 25.6 ns 25.8 7.1 24.8 26.3
Depth (m) Surface 0.8 Surface Surface Surface 1 Surface Surface 1 Note: * = randomly selected quality assurance sample. ns = not sampled. bold text = outside of MPPC guiding values (See GeoLINK 2011a).
levels below detection limits incorporated into databases as 0 for the purpose of statistical analyses TNTC = too numerous to count – incorporated in to databases as 5000 for the purpose of statistical analyses # = sample spilled in transit
3.2 Permanent Water Quality Monitoring Stations The data collected by the permanent water quality monitoring stations, and rainfall data correlating to the same period is presented in Illustration 3.1 and Illustration 3.2.

Salty Lagoon Project Management & Ecosystem Health Monthly Report, January 2012 1731860
8
Illustration 3.1 Salty Lagoon rainfall and water quality monitoring station data 13 December 2011 to 9 January 2012
0
10
20
30
40
50
13‐Dec 20‐Dec 27‐Dec 03‐Jan
Rainfall (m
m)
1
1.2
1.4
1.6
1.8
2
13‐Dec 20‐Dec 27‐Dec 03‐Jan
Level (mAHD)
0
10
20
30
40
50
60
13‐Dec 20‐Dec 27‐Dec 03‐Jan
Conductivity (m
S/cm
)
0
2
4
6
8
10
12
13‐Dec 20‐Dec 27‐Dec 03‐Jan
DO (mg/L)
6
6.5
7
7.5
8
8.5
9
13‐Dec 20‐Dec 27‐Dec 03‐Jan
pH
20
25
30
35
13‐Dec 20‐Dec 27‐Dec 03‐Jan
Temperature (˚C)
0
5
10
15
20
25
30
13‐Dec 20‐Dec 27‐Dec 03‐Jan
Turbidity (NTU
)
Salty Lagoon Project Management & Ecosystem Health Monthly Report, January 2012 1731860
9
Illustration 3.2 Salty Creek rainfall and water quality monitoring station data 13 December 2011 to 9 January 2012
0
10
20
30
40
50
13‐Dec 20‐Dec 27‐Dec 03‐Jan
Rainfall (m
m)
1
1.2
1.4
1.6
1.8
2
13‐Dec 20‐Dec 27‐Dec 03‐Jan
Level (mAHD)
0
10
20
30
40
50
60
13‐Dec 20‐Dec 27‐Dec 03‐Jan
Conductivity (m
S/cm
)
0
2
4
6
8
10
12
13‐Dec 20‐Dec 27‐Dec 03‐Jan
DO (mg/L)
3
4
5
6
7
8
9
13‐Dec 20‐Dec 27‐Dec 03‐Jan
pH
20
25
30
35
13‐Dec 20‐Dec 27‐Dec 03‐Jan
Temperature (˚C)
0
5
10
15
20
25
30
13‐Dec 20‐Dec 27‐Dec 03‐Jan
Turbidity (NTU
)
This page has been intentionally left blank.

4
Salty Lagoon Project Management & Ecosystem Health Monthly Report, January 2012 1731860
11
Discussion 4 4 4
4.1 Water Quality The entrance to Salty Creek was open at the beginning of the reporting period and the water levels were low. There were some small spikes in the water level, which drained relatively quickly, in the following six days. On 24 December 2011 a large volume of seawater entered the system and the entrance closed. There were two more instances of seawater ingress on the following two days and the water levels remained very high until the end of the reporting period. The conductivity measurements indicate that most of the significant increases in water level were a result of seawater ingress. Interestingly, seawater ingress during the first 5 days of the reporting period led to stronger increases in salinity measured at the Salty Lagoon PWQMS than at the Salty Creek PWQMS. On 24, 25 and 26 December 2011 seawater ingress led to conductivity measurements approaching seawater at both Salty Lagoon and Salty Creek PWQMS. Conductivity levels of >80% seawater then persisted until the end of the reporting period. Discrete sampling revealed very little stratification at S1, S3 and S5. Conductivity at S2 and S4 had reduced since 26 December 2012 (see GeoLINK 2012a) but was still relatively high for these sites. The high levels of salinity experienced resulted in significant bio-fouling from organisms of marine origin on the PWQMS (see Plate 4.2). The DO concentrations in both Salty Creek and Salty Lagoon fluctuated with changes in conductivity. In general increases in conductivity led to rapid reductions in DO concentration measured at both PWQMS. Seawater ingress on 24, 25 and 26 of December resulted in critically low DO concentrations in both Salty Lagoon and Salty Creek. The low DO concentrations resulted in a standard adaptive management response (see GeoLINK 2012a). The DO concentrations measured at both PWQMS initially recovered following seawater ingress but again reduced to critical levels numerous times until the end of the reporting period. With the exception of surface waters at S1 and S5 DO concentrations were below guiding values in all discrete samples on 9 January 2012. Low DO concentrations are commonly associated with high conductivity measurements in Salty Lagoon. As per previous reports (GeoLINK 2011 b & c) the pH recorded at both PWQMS reflected the major source of water throughout the reporting period. However, following the major seawater ingress on 24, 25 and 26 December 2011 the pH at both PWQMS slowly reduced over a period of 3-4 days to around neutral although conductivities remained high. This indication of a natural pH buffering effect in Salty Lagoon is a consistent feature of data from the PWQMS. The pH in discrete samples collected at S2 and S4, the two westernmost sites, was below the guiding range on 9 January 2012. This indicates the impact of rainfall runoff on these two sites, with moderate rainfall occurring three days prior to discrete sampling. The concentrations of all nutrients were within guiding values at all sites with the exception of TN and TKN at S4. The overall trend for the concentration of nitrogen species in recent months appears to be steady and TN concentrations are regularly higher at S4 than at the other sites. Whilst phosphorus concentrations remain well below guiding values at all sites, the orthophosphate concentration at S2 was relatively high and coincided with a chlorophyll-a concentration that exceeded guiding values and is indicative of algal bloom conditions. It is likely that the elevated orthophosphate concentration contributed to the increase in algal growth indicated by high chlorophyll-a concentrations. Further investigations of the relationship between phosphorus and chlorophyll-a concentrations across all sites has been undertaken. The results are shown in Illustration 4.1and Illustration 4.2. There appears to be a positive correlation between TP and chlorophyll-a at all sites. However, the relationship is not so clear for orthophosphate (the bioavailable component of TP), with negative correlations showing at S1 and S4.
Salty Lagoon Project Management & Ecosystem Health Monthly Report, January 2012 1731860
12
Enterococcus concentrations exceeded guiding values at S1. As per previous reports, there is no indication of increased enterococcus concentrations in discharge from the Evans Head Wastewater Treatment Plant or overflows from any point in the Evans Head sewer network prior to sampling. The most likely cause of elevated concentrations of enterococcus and faecal coliforms is animal faecal material, as described in previous reports (GeoLINK 2011b and c). Rainfall in the days prior to sampling may have exacerbated this as animal faeces may have been delivered to the Salty Lagoon in runoff. Previous investigations have indicated a slight positive correlation between 3 day rainfall totals and enterococcus concentrations (GeoLINK 2012b).
Illustration 4.1 Scatterplot with trend lines demonstrating the relationship between TP concentration and chlorophyll-a concentration. Data from all sites collected between April 2011 and January 2012 included.
Illustration 4.2 Scatterplot with trend lines demonstrating the relationship between orthophosphate concentration and chlorophyll-a concentration. Data from all sites collected between April 2011 and January 2012 included.
Plate 4.1 Biofouling on the on the permanently deployed water quality sonde made up of mussels and Polychaete tube worms of marine origin
Plate 4.2 Dragonflies of family Coenagrionidae mating in Salty Lagoon
0
5
10
15
20
25
30
35
40
45
0 0.05 0.1 0.15 0.2 0.25 0.3
Chlorophyll‐a (m
g/L)
TP (mg/L)
S1
S2
S3
S4
S5
0
5
10
15
20
25
30
35
40
45
0 0.05 0.1 0.15 0.2 0.25
Chlorophyll‐a (m
g/L)
Orthophosphate (mg/L)
S1
S2
S3
S4
S5

Salty Lagoon Project Management & Ecosystem Health Monthly Report, January 2012 1731860
13
4.2 Other Observations The entrance to Salty Creek was completely closed on 9 January 2011 and a high entrance berm was in place. It is expected that the high entrance berm would have reduced opportunities for both seawater ingress and entrance opening events. No aquatic weeds were observed during the site inspection. Dead emergent freshwater macrophytes were noted at various points around the lagoon, a response to the high levels of salinity experience in the prior weeks. At S2 the cover of ferny azolla (Azolla pinnata) had increased since the previous report, to around 50% (see Plate 4.3 and Plate 4.4). Much of this appeared to be dying, probably due to the recent high salinities experienced at that site. Large numbers of fish were noted jumping and breaking the surface in the Salty Lagoon, despite the persistent low DO measurements recorded in the weeks prior to the site visit.
Plate 4.3 Fixed point photo at S2 looking North, 12 December 2011.
Note the low cover of ferny azolla on the water surface and the healthy cumbungi (Typha orientalis) to the left of the photo.
Plate 4.4 Fixed point photo at S2 looking North, 09 January 2012.
Note the increased cover of ferny azolla and the dying cumbungi (Typha orientalis) to the left of the photo.
4.3 Adaptive Management Response In response to critically low DO concentrations measured at the Salty Lagoon permanent water quality monitoring station a site inspection and extra round of water quality sampling were undertaken on 26 December 2011. The low DO concentrations were associated with very high conductivity measurements described in Section 4.1of this report. No negative environmental impacts associated with the influx of saline water or the low DO concentrations were observed. Details of the site inspection and results of water quality inspections are in a separate report (GeoLINK, 2012a). Further very low DO concentrations occurred between 26 December 2011 and 9 January 2012 but were considered to be a continuation of the first event and no further site visits were undertaken.

This page has been intentionally left blank.

5
Salty Lagoon Project Management & Ecosystem Health Monthly Report, January 2012 1731860
15
Key Points 5 5
1. The entrance to Salty Creek was open at the beginning of the reporting period and water levels were low. The entrance remained open until 24 December 2011 when it closed during storm conditions. Three days of entrance washovers resulted in very high water levels that persisted until the end of the reporting period.
2. Conductivities following the entrance washovers were very high.
3. The DO concentrations in Salty Lagoon and Salty Creek dropped quickly following seawater ingress and remained quite low until the end of the monitoring period.
4. Critically low DO led to an adaptive management response on 26 December 2011. Critically low DO conditions occurred regularly until the end of the reporting period.
5. Elevated enterococcus concentrations were detected at S1. These are probably related to rainfall prior to the sampling date.
6. Elevated Chlorophyll-a concentrations were detected at S2. These were associated with unusually high orthophosphate concentrations.
7. The majority of the results from discrete sampling were within guiding values.

This page has been intentionally left blank.

5
Salty Lagoon Project Management & Ecosystem Health Monthly Report, January 2012 1731860
17
The project team members included: Mathew Birch Aquatic Ecologist Aquatic Science and Management Charlie Hewitt Environmental Engineer / Project Manager GeoLINK

This page has been intentionally left blank.
References
Salty Lagoon Project Management & Ecosystem Health Monthly Report, January 2012 1731860
19
Bureau of Meteorology (2012). http://www.bom.gov.au/. Accessed 06/02/2012
GeoLINK (2011a). Salty Lagoon Monitoring: Pre-Post Closure of Artificial Channel – Project Management and Ecosystem Health Monthly Report – March 2011. Report to Richmond Valley Council.
GeoLINK (2011b). Salty Lagoon Monitoring: Pre-Post Closure of Artificial Channel – Project Management and Ecosystem Health Monthly Report – November 2011. Report to Richmond Valley Council
GeoLINK (2011c). Salty Lagoon Monitoring: Pre-Post Closure of Artificial Channel – Project Management and Ecosystem Health Monthly Report – December 2011. Report to Richmond Valley Council
GeoLINK (2012a). Salty Lagoon Monitoring: Pre-Post Closure of Artificial Channel – Adaptive Management Response Report – December 26 2011.
GeoLINK (2012b). Salty Lagoon Monitoring: Pre-Post Closure of Artificial Channel – Project Management and Ecosystem Health Monthly Report – December 2011. Report to Richmond Valley Council
Hydrosphere Consulting (2010). Salty Lagoon Monitoring Program Pre/Post Closure of the Artificial Channel. Report to Richmond Valley Council.

This page has been intentionally left blank.
Copyright and Usage
Salty Lagoon Project Management & Ecosystem Health Monthly Report, January 2012 1731860
21
GeoLINK, 2012 This document, including associated Illustrations and drawings, was prepared for the exclusive use of Richmond Valley Council. It is not to be used for any other purpose or by any other person, corporation or organisation without the prior consent of GeoLINK. GeoLINK accepts no responsibility for any loss or damage suffered howsoever arising to any person or corporation who may use or rely on this document for a purpose other than that described above. This document, including associated illustrations and drawings, may not be reproduced, stored, or transmitted in any form without the prior consent of GeoLINK. This includes extracts of texts or parts of illustrations and drawings.