monocle: di erential expression and time-series analysis for...
TRANSCRIPT
Monocle: Differential expression and time-series analysis forsingle-cell RNA-Seq and qPCR experiments
Cole Trapnell
Harvard University,Cambridge, Massachussetts, [email protected]
Davide Cacchiarelli
Harvard University,Cambridge, Massachussetts, [email protected]
March 24, 2014
Abstract
Single cell gene expression studies enable profiling of transcriptional regulation during complex biological pro-cesses and within highly hetergeneous cell populations. These studies allow discovery of genes that identify certainsubtypes of cells, or that mark a particular intermediate states during a biological process. In many single cellstudies, individual cells are executing through a gene expression program in an unsynchronized manner. In effect,each cell is a snapshot of the transcriptional program under study. The package monocle provides tools for analyz-ing single-cell expression experiments. It performs differential gene expression and clustering to identify importantgenes and cell states. It is designed for RNA-Seq studies, but can be used with qPCR or other targeted assays. Formore information on the algorithm at the core of monocle, or to learn more about how to use single cell RNA-Seqto study a complex biological process, see Trapnell and Cacchiarelli et al [1]
Contents
1 Introduction 1
2 Single-cell expression data in Monocle 22.1 The CellDataSet class . . . . . . . . . . . . . . . . . . . . . . . . . . . . . . . . . . . . . . . . . . . 2
3 Quality control of single cell RNA-Seq experiments 3
4 Basic differential expression analysis 4
5 Ordering cells by progress 6
6 Advanced differential expression analysis 86.1 Finding genes that distinguish cell type or state . . . . . . . . . . . . . . . . . . . . . . . . . . . . . 86.2 Finding genes that change as a function of pseudotime . . . . . . . . . . . . . . . . . . . . . . . . . 96.3 Multi-factorial differential expression analysis . . . . . . . . . . . . . . . . . . . . . . . . . . . . . . . 10
7 Clustering genes by pseudotemporal expression pattern 11
8 Citation 12
9 Acknowledgements 12
10 Session Info 13
1 Introduction
The monocle package provides a toolkit for analyzing single cell gene expression experiments. It was developed toanalyze single cell RNA-seq data, but can also be used with qPCR measurements. This vignette provides an overview ofa single cell RNA-Seq analysis workflow with Monocle. Monocle was developed to analyze dynamic biological processessuch as cell differentiation, although it also supports simpler experimental settings.
1

As cells differentiate, they undergo a process of transcriptional re-configuration, with some genes being silencedand others newly activated. While many studies have compared cells at different stages of differentiation, examiningintermediate states has proven difficult, for two reasons. First, it is often not clear from cellular morphology orestablished markers what intermediate states exist between, for example, a precursor cell type and its terminallydifferentiated progeny. Moreover, two cells might transit through a different sequence of intermediate stages andultimately converge on the same end state. Second, even cells in a genetically and epigenetically clonal populationmight progress through differentiation at different rates in vitro, depending on positioning and level of contacts withneighboring cells. Looking at average behavior in a group of cells is thus not necessarily faithful to the process throughwhich an individual cell transits.
Monocle computationally reconstructs the transcriptional transitions undergone by differentiating cells. It orders amixed, unsynchronized population of cells according to progress through the learned process of differentiation. Becausethe population may actually differentiate into multiple separate lineages, Monocle allows the process to branch, and canassign each cell to the correct sub-lineage. It subsequently identifies genes which distinguish different states, and genesthat are differentially regulated through time. Finally, it performs clustering on all genes, to classify them according tokinetic trends. The algorithm is inspired by and and extends one proposed by Magwene et al to time-order microarraysamples [2]. Monocle differs from previous work in three ways. First, single-cell RNA-Seq data differ from microarraymeasurements in many ways, and so Monocle must take special care to model them appropriately at several steps in thealgorithm. Secondly, the earlier algorithm assumes that samples progress along a single trajectory through expressionspace. However, during cell differentiation, multiple lineages might arise from a single progenitor. Monocle can findthese lineage branches and correctly place cells upon them. Finally, Monocle also performs differential expressionanalysis and clustering on the ordered cells to help a user identify key events in the biological process of interest.
2 Single-cell expression data in Monocle
The monocle package takes a matrix of expression values, which are typically for genes (as opposed to splice variants),as calculated by Cufflinks [3] or another gene expression estimation program. Monocle assumes that gene expressionvalues are log-normally distributed, as is typical in RNA-Seq experiments. Monocle does not normalize these expressionvalues to control for library size, depth of sequencing, or other sources of technical variability - whichever program thatyou use to calculate expression values should do that. Monocle is not meant to be used with raw counts, and doingso could produce nonsense results.
2.1 The CellDataSet class
monocle holds single cell expression data in objects of the CellDataSet class. The class is derived from the BioconductorExpressionSet class, which provides a common interface familiar to those who have analyzed microarray experimentswith Bioconductor. The class requires three input files:
1. exprs, a numeric matrix of expression values, where rows are genes, and columns are cells
2. phenoData, an AnnotatedDataFrame object, where rows are cells, and columns are cell attributes (such as celltype, culture condition, day captured, etc.)
3. featureData, an AnnotatedDataFrame object, where rows are features (e.g. genes), and columns are geneattributes, such as biotype, gc content, etc.
The expression value matrix must have the same number of columns as the phenoData has rows, and it must havethe same number of rows as the featureData data frame has rows. Row names of the phenoData object shouldmatch the column names of the expression matrix. Row names of the featureData object should match row namesof the expression matrix.
You can create a new CellDataSet object as follows:
# not run
fpkm_matrix <- read.table("fpkm_matrix.txt")
sample_sheet <- read.delim("cell_sample_sheet.txt")
gene_ann <- read.delim("gene_annotations.txt")
pd <- new("AnnotatedDataFrame", data = sample_sheet)
fd <- new("AnnotatedDataFrame", data = gene_ann)
HSMM <- new("CellDataSet", exprs = as.matrix(fpkm_matrix), phenoData = pd, featureData = fd)
It is often convenient to know how many express a particular gene, or how many genes are expressed by a givencell. Monocle provides a simple function to compute those statistics:
Monocle: Differential expression and time-series analysis for single-cell RNA-Seq and qPCR experiments

HSMM <- detectGenes(HSMM, min_expr = 0.1)
print(head(fData(HSMM)))
## gene_short_name biotype num_cells_expressed
## ENSG00000000003.10 TSPAN6 protein_coding 224
## ENSG00000000005.5 TNMD protein_coding 0
## ENSG00000000419.8 DPM1 protein_coding 234
## ENSG00000000457.8 SCYL3 protein_coding 32
## ENSG00000000460.12 C1orf112 protein_coding 88
## ENSG00000000938.8 FGR protein_coding 0
expressed_genes <- row.names(subset(fData(HSMM), num_cells_expressed >= 50))
The vector expressed_genes now holds the identifiers for genes expressed in at least 50 cells of the data set.We will use this list later when we put the cells in order of biological progress. It is also sometimes convenient toexclude genes expressed in few if any cells from the CellDataSet object so as not to waste CPU time analyzing themfor differential expression.
3 Quality control of single cell RNA-Seq experiments
Before proceeding with an in-depth analysis of your experimental data with monocle, you should verify that your datapasses several quality control checks. Your single cell RNA-Seq protocol may have given you the opportunity to imageindividual cells after capture but prior to lysis. This image data allows you to score your cells, confirming that noneof your libraries were made from empty wells or wells with excess cell debris. With some protocols and instruments,you may get more than one cell captured instead just a single cell. You should exclude libraries that you believe didnot come from a single cell, if possible. Empty well or debris well libraries can be especially problematic for Monocle.It’s also a good idea to check that each cell’s RNA-seq library was sequenced to an acceptible degree. While thereis no widely accepted minimum level for what constitutes seequencing “deeply enough”, use your judgement: a cellsequenced with only a few thousand reads is unlikely to yield meaningful measurements.
CellDataSet objects provide a convenient place to store per-cell scoring data: the phenoData slot. Simply includescoring attributes as columns in the data frome you used to create your CellDataSet container. You can then easilyfilter out cells that don’t pass quality control. You might also filter cells based on metrics from high throughputsequencing quality assessment packages such as FastQC. Such tools can often identify RNA-Seq libraries made fromheavily degraded RNA, or where the library contains an abnormally large amount of ribosomal, mitochondrial, or otherRNA type that you might not be interested in.
The HSMM dataset included with this package has scoring columns built in:
print(head(pData(HSMM)))
## Library Well Time cell_id Cells.in.Well Debris Clump
## T0_CT_A01 SCC10013_A01 A01 T0_CT_ T0_CT_A01 1 FALSE FALSE
## T0_CT_A03 SCC10013_A03 A03 T0_CT_ T0_CT_A03 1 FALSE FALSE
## T0_CT_A05 SCC10013_A05 A05 T0_CT_ T0_CT_A05 1 FALSE FALSE
## T0_CT_A06 SCC10013_A06 A06 T0_CT_ T0_CT_A06 1 FALSE FALSE
## T0_CT_A07 SCC10013_A07 A07 T0_CT_ T0_CT_A07 1 FALSE FALSE
## T0_CT_A08 SCC10013_A08 A08 T0_CT_ T0_CT_A08 1 FALSE FALSE
## Unusual.Shape Control Time.1 Cell.Type Media Raw.Fragments
## T0_CT_A01 FALSE FALSE 0 HSMM GM
## T0_CT_A03 FALSE FALSE 0 HSMM GM
## T0_CT_A05 FALSE FALSE 0 HSMM GM
## T0_CT_A06 FALSE FALSE 0 HSMM GM
## T0_CT_A07 FALSE FALSE 0 HSMM GM
## T0_CT_A08 FALSE FALSE 0 HSMM GM
## Mapped.Fragments Raw.Reads Aligned.Reads Expression.File
## T0_CT_A01 1958074 NA NA NA
## T0_CT_A03 1930722 NA NA NA
## T0_CT_A05 1452623 NA NA NA
## T0_CT_A06 2566325 NA NA NA
## T0_CT_A07 2383438 NA NA NA
Monocle: Differential expression and time-series analysis for single-cell RNA-Seq and qPCR experiments

## T0_CT_A08 1472238 NA NA NA
## num_genes_expressed Pseudotime State
## T0_CT_A01 9770 7.200 1
## T0_CT_A03 9180 2.716 1
## T0_CT_A05 8528 2.272 1
## T0_CT_A06 7096 6.461 1
## T0_CT_A07 7590 3.402 1
## T0_CT_A08 7702 20.300 2
This dataset has already been filtered using the following commands:
valid_cells <- row.names(subset(pData(HSMM), Cells.in.Well == 1 & Control ==
FALSE & Clump == FALSE & Debris == FALSE & Mapped.Fragments > 1e+06))
HSMM <- HSMM[, valid_cells]
Once you’ve excluded cells that do not pass your quality control filters, you should verify that the expression valuesstored in your CellDataSet follow a distribution that is roughly lognormal:
# Log-transform each value in the expression matrix.
L <- log(exprs(HSMM[expressed_genes, ]))
# Standardize each gene, so that they are all on the same scale, Then melt
# the data with plyr so we can plot it easily'melted_dens_df <- melt(t(scale(t(L))))
# Plot the distribution of the standardized gene expression values.
qplot(value, geom = "density", data = melted_dens_df) + stat_function(fun = dnorm,
size = 0.5, color = "red") + xlab("Standardized log(FPKM)") + ylab("Density")
## Warning: Removed 2854443 rows containing non-finite values (stat_density).
0.0
0.1
0.2
0.3
0.4
0.5
−10 −5 0 5Standardized log(FPKM)
Den
sity
4 Basic differential expression analysis
Differential gene expression analysis is a common task in RNA-Seq experiments. Monocle can help you find genes thatare differentially expressed between groups of cells and assesses the statistical signficance of those changes. Thesecomparisons require that you have a way to collect your cells into two or more groups. These groups are defined bycolumns in the phenoData table of each CellDataSet. Monocle will assess the signficance of each gene’s expressionlevel across the different groups of cells.
Performing differential expression analysis on all genes in the human genome can take a substantial amount oftime. For a dataset as large as the myoblast data from [1], which contains several hundred cells, the analysis cantake several hours on a single CPU. Let’s select a small set of genes that we know are important in myogenesis todemonstrate Monocle’s capabilities:
marker_genes <- row.names(subset(fData(HSMM), gene_short_name %in% c("MEF2C",
"MEF2D", "MYF5", "ANPEP", "PDGFRA", "MYOG", "TPM1", "TPM2", "MYH2", "MYH3",
"NCAM1", "TNNT1", "TNNT2", "TNNC1", "CDK1", "CDK2", "CCNB1", "CCNB2", "CCND1",
"CCNA1", "ID1")))
Monocle: Differential expression and time-series analysis for single-cell RNA-Seq and qPCR experiments

In the myoblast data, the cells collected at the outset of the experiment were cultured in“growth medium”(GM) toprevent them from differentiating. After they were harvested, the rest of the cells were switched over to“differentiationmedium” (DM) to promote differentiation. Let’s have monocle find which of the genes above are affected by thisswitch:
diff_test_res <- differentialGeneTest(HSMM[marker_genes, ], fullModelFormulaStr = "expression~Media")
# Select genes that are significant at an FDR < 10%
sig_genes <- subset(diff_test_res, qval < 0.1)
# Attach the HUGO symbols and other featureData for these genes
sig_genes <- merge(fData(HSMM), sig_genes, by = "row.names")
sig_genes[, c("gene_short_name", "pval", "qval")]
## gene_short_name pval qval
## 1 TNNT1 1.609e-03 1.099e-02
## 2 MYH3 2.106e-15 4.422e-14
## 3 CCND1 3.050e-03 1.525e-02
## 4 MYF5 1.734e-12 3.295e-11
## 5 TNNC1 1.296e-07 1.684e-06
## 6 MEF2D 1.227e-02 4.907e-02
## 7 TNNT2 1.414e-05 1.555e-04
## 8 MYOG 4.811e-11 8.179e-10
## 9 CDK2 4.478e-05 4.478e-04
## 10 MYH2 2.482e-04 2.234e-03
## 11 ID1 7.530e-10 1.205e-08
## 12 CCNB1 9.507e-09 1.426e-07
## 13 PDGFRA 1.130e-07 1.582e-06
## 14 TPM1 5.034e-07 6.041e-06
## 15 CCNB2 5.277e-14 1.055e-12
## 16 ANPEP 3.843e-04 3.074e-03
## 17 CDK1 1.119e-11 2.014e-10
## 18 TPM2 1.571e-03 1.099e-02
So 18 of the 22 genes are significant at a 10% false discovery rate! This isn’t surprising, as most of the abovegenes are highly relevant in myogenesis. Monocle also provides some easy ways to plot the expression of a small setof genes grouped by the factors you use during differential analysis. This helps you visualize the differences revealedby the tests above. One type of plot is a “jitter” plot.
MYOG_ID1 <- HSMM[row.names(subset(fData(HSMM), gene_short_name %in% c("MYOG",
"ID1"))), ]
plot_genes_jitter(MYOG_ID1, grouping = "Media", ncol = 2)
ID1 MYOG
1
100
1
100
DM GM DM GMMedia
Exp
ress
ion
Note that we can control how to layout the genes in the plot by specifying the number of rows and columns. Seethe man page on plot_genes_jitter for more details on controlling its layout. Most if not all of Monocle’s plottingroutines return a plot object from the ggplot2. This package uses a grammar of graphics to control various aspects ofa plot, and makes it easy to customize how your data is presented. See the ggplot2 book [?] for more details.
Monocle: Differential expression and time-series analysis for single-cell RNA-Seq and qPCR experiments

5 Ordering cells by progress
In many biological processes, cells do not progress in perfect synchrony. In single-cell expression studyies of processessuch as cell differentiation, captured cells might be widely distributed in terms of progress. That is, in a population ofcells captured at exactly the same time, some cells might be far along, while others might not yet even have begunthe process. Monocle can informatically put the cells “in order” of how far they have progressed through the processyou’re studying. Monocle may even be able to find where cells diverge, with groups of cells proceeding down distinctpaths. In this section, we will put a set of differentiating myoblasts in order of progress through myogenesis.
First, we must decide which genes we will use to define a cell’s progress through myogenesis. Monocle orders cellsby examining the pattern of expression of these genes across the cell population. Monocle looks for genes that vary in“interesting” ways (that is aren’t just noisy), and uses these to structure the data. We ultimately want a set of genesthat increase (or decrease) in expression as a function of progress through the process we’re studying.
Ideally, we’d like to use as little prior knowledge of the biology of the system under study as possible. We’d liketo discover the important ordering genes from the data, rather than relying on literature and textbooks, because thatmight introduce bias in the ordering. One effective way to isolate a set of ordering genes is to simply compare the cellscollected at the beginning of the process to those at the end and find the differentially expressed genes, as describedabove. The command below will find all genes that are differentially expressed in response to the switch from growthmedium to differentiation medium:
# not run
diff_test_res <- differentialGeneTest(HSMM[expressed_genes, ], fullModelFormulaStr = "expression~Media")
ordering_genes <- row.names(subset(diff_test_res, qval < 0.01))
However, for the sake of keeping the running time in this vignette short, we will leverage the developmental biologycommunity’s extensive knowledge of expression dynamics during skeletal myogenesis, and use the small set of genesdiscussed above.
ordering_genes <- row.names(subset(diff_test_res, qval < 0.1))
# Only use genes are detectably expressed in a sufficient number of cells
ordering_genes <- intersect(ordering_genes, expressed_genes)
Once we have a list of gene ids to be used for ordering, we need to set them in the HSMM object, because the nextseveral functions will depend on them.
HSMM <- setOrderingFilter(HSMM, ordering_genes)
The genes we’ve chosen to use for ordering define the state space of the cells in our data set. Each cell is a pointin this space, which has dimensionality equal to the number of genes we’ve chosen. So if there are 500 genes used forordering, each cell is a point in a 500-dimensional space. For a number of reasons, Monocle works better if we canreduce the dimensionality of that space before we try to put the cells in order. In this case, we will reduce the spacedown to one with two dimensions, which we will be able to easily visualize and interpret while Monocle is ordering thecells.
HSMM <- reduceDimension(HSMM, use_irlba = F)
Now that the space is reduced, it’s time to order the cells. The call below has two important optional arguments.The first num_paths allows Monocle to assign cells to one of several alternative fates. In this case, we know there arecontaminating fibroblasts in the culture, so by setting num_paths= 2, the fibroblasts wind up on their own trajectoryin response to the serum switch, instead of getting mixed in with the myoblasts. The second important argument isthe reverse flag. Monocle won’t be able to tell without some help which cells are at the beginning of the processand which are at the end. The reverse flag tells Monocle to reverse the orientation of the entire process as it’sbeing discovered from the data, so that the cells that would have been assigned to the end are instead assigned to thebeginning, and so on.
HSMM <- orderCells(HSMM, num_paths = 2, reverse = F)
Monocle: Differential expression and time-series analysis for single-cell RNA-Seq and qPCR experiments
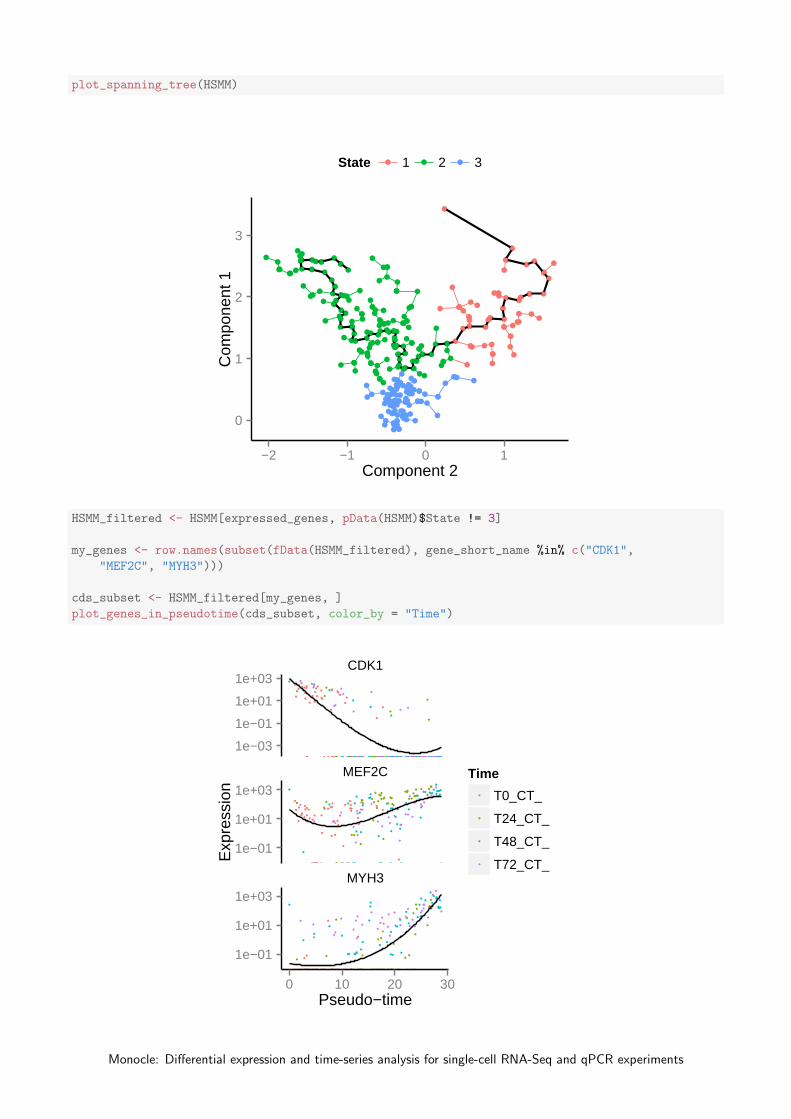
plot_spanning_tree(HSMM)
0
1
2
3
−2 −1 0 1Component 2
Com
pone
nt 1
State 1 2 3
HSMM_filtered <- HSMM[expressed_genes, pData(HSMM)$State != 3]
my_genes <- row.names(subset(fData(HSMM_filtered), gene_short_name %in% c("CDK1",
"MEF2C", "MYH3")))
cds_subset <- HSMM_filtered[my_genes, ]
plot_genes_in_pseudotime(cds_subset, color_by = "Time")
CDK1
MEF2C
MYH3
1e−03
1e−01
1e+01
1e+03
1e−01
1e+01
1e+03
1e−01
1e+01
1e+03
0 10 20 30Pseudo−time
Exp
ress
ion
Time
T0_CT_
T24_CT_
T48_CT_
T72_CT_
Monocle: Differential expression and time-series analysis for single-cell RNA-Seq and qPCR experiments
6 Advanced differential expression analysis
In this section, we’ll explore how to use Monocle to find genes that are differentially expressed according to severaldifferent criteria. First, we’ll look at how to use Monocle’s classification of cell ”States” to find genes that distinguishsubpopulations of cells. Second, we’ll look at how to find genes that are differentially expressed as a function ofpseudotime, such as those that become activated or repressed during differentiation. Finally, you’ll see how to performmulti-factorial differential analysis, which can help subtract the effects of confounding variables in your experiment.
To keep the vignette simple and fast, we’ll be working with small sets of genes. Rest assured, however, thatMonocle can analyze many thousands of genes even in large experiments, making it useful for discovering dynamicallyregulated genes during the biological process you’re studying.
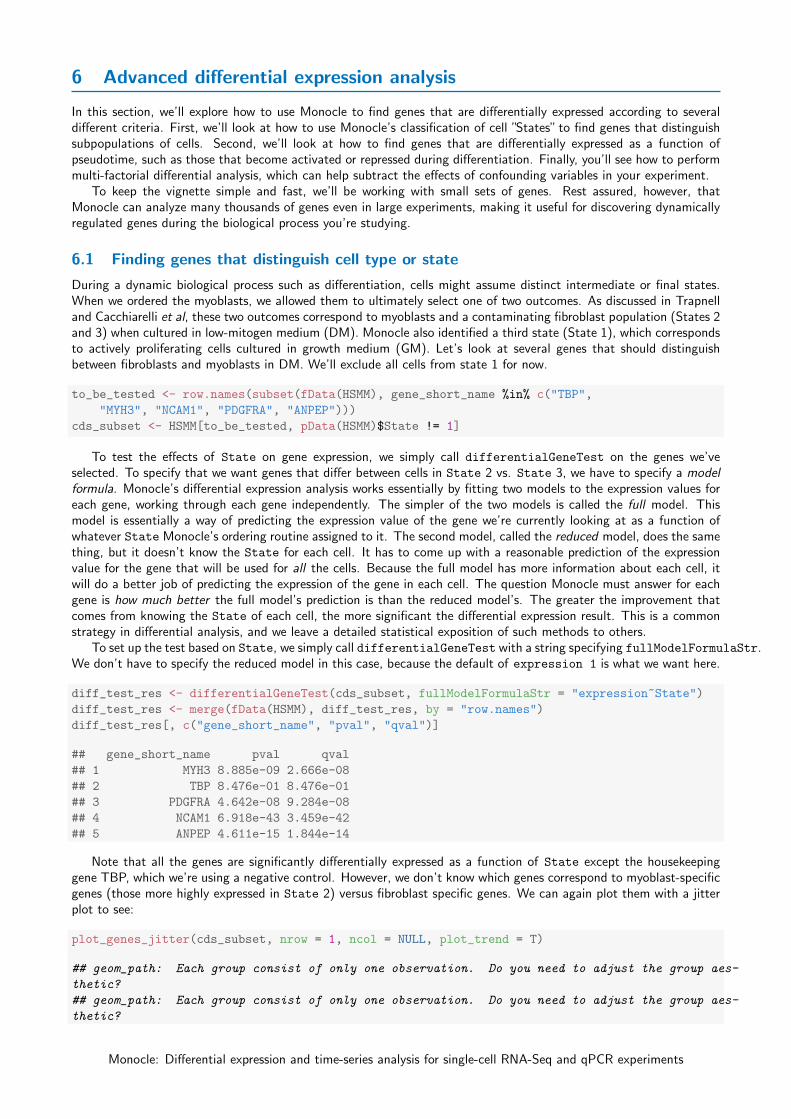
6.1 Finding genes that distinguish cell type or state
During a dynamic biological process such as differentiation, cells might assume distinct intermediate or final states.When we ordered the myoblasts, we allowed them to ultimately select one of two outcomes. As discussed in Trapnelland Cacchiarelli et al, these two outcomes correspond to myoblasts and a contaminating fibroblast population (States 2and 3) when cultured in low-mitogen medium (DM). Monocle also identified a third state (State 1), which correspondsto actively proliferating cells cultured in growth medium (GM). Let’s look at several genes that should distinguishbetween fibroblasts and myoblasts in DM. We’ll exclude all cells from state 1 for now.
to_be_tested <- row.names(subset(fData(HSMM), gene_short_name %in% c("TBP",
"MYH3", "NCAM1", "PDGFRA", "ANPEP")))
cds_subset <- HSMM[to_be_tested, pData(HSMM)$State != 1]
To test the effects of State on gene expression, we simply call differentialGeneTest on the genes we’veselected. To specify that we want genes that differ between cells in State 2 vs. State 3, we have to specify a modelformula. Monocle’s differential expression analysis works essentially by fitting two models to the expression values foreach gene, working through each gene independently. The simpler of the two models is called the full model. Thismodel is essentially a way of predicting the expression value of the gene we’re currently looking at as a function ofwhatever State Monocle’s ordering routine assigned to it. The second model, called the reduced model, does the samething, but it doesn’t know the State for each cell. It has to come up with a reasonable prediction of the expressionvalue for the gene that will be used for all the cells. Because the full model has more information about each cell, itwill do a better job of predicting the expression of the gene in each cell. The question Monocle must answer for eachgene is how much better the full model’s prediction is than the reduced model’s. The greater the improvement thatcomes from knowing the State of each cell, the more significant the differential expression result. This is a commonstrategy in differential analysis, and we leave a detailed statistical exposition of such methods to others.
To set up the test based on State, we simply call differentialGeneTest with a string specifying fullModelFormulaStr.We don’t have to specify the reduced model in this case, because the default of expression 1 is what we want here.
diff_test_res <- differentialGeneTest(cds_subset, fullModelFormulaStr = "expression~State")
diff_test_res <- merge(fData(HSMM), diff_test_res, by = "row.names")
diff_test_res[, c("gene_short_name", "pval", "qval")]
## gene_short_name pval qval
## 1 MYH3 8.885e-09 2.666e-08
## 2 TBP 8.476e-01 8.476e-01
## 3 PDGFRA 4.642e-08 9.284e-08
## 4 NCAM1 6.918e-43 3.459e-42
## 5 ANPEP 4.611e-15 1.844e-14
Note that all the genes are significantly differentially expressed as a function of State except the housekeepinggene TBP, which we’re using a negative control. However, we don’t know which genes correspond to myoblast-specificgenes (those more highly expressed in State 2) versus fibroblast specific genes. We can again plot them with a jitterplot to see:
plot_genes_jitter(cds_subset, nrow = 1, ncol = NULL, plot_trend = T)
## geom_path: Each group consist of only one observation. Do you need to adjust the group aes-
thetic?
## geom_path: Each group consist of only one observation. Do you need to adjust the group aes-
thetic?
Monocle: Differential expression and time-series analysis for single-cell RNA-Seq and qPCR experiments

## geom_path: Each group consist of only one observation. Do you need to adjust the group aes-
thetic?
## geom_path: Each group consist of only one observation. Do you need to adjust the group aes-
thetic?
## geom_path: Each group consist of only one observation. Do you need to adjust the group aes-
thetic?
ANPEP MYH3 NCAM1 PDGFRA TBP
1
100
1
100
1
100
1
100
1
100
2 3 2 3 2 3 2 3 2 3State
Exp
ress
ion
Note that we could also simply compute summary statistics such as mean or median expression level on a per-Statebasis to see this, which might be handy if we are looking at more than a handful of genes.
The differentialGeneTest function is actually quite simple “under the hood”. The call above is equivalent to:
full_model_fits <- fitModel(cds_subset, modelFormulaStr = "expression~State")
reduced_model_fits <- fitModel(cds_subset, modelFormulaStr = "expression~1")
diff_test_res <- compareModels(full_model_fits, reduced_model_fits)
diff_test_res
Occassionally, as we’ll see later, it’s useful to be able to call fitModel directly.
6.2 Finding genes that change as a function of pseudotime
Monocle’s main job is to put cells in order of progress through a biological process (such as cell differentiation) withoutknowing which genes to look at ahead of time. Once it’s done so, you can analyze the cells to find genes that changesas the cells make progress. For example, you can find genes that are significantly upregulated as the cells “mature”.Let’s look at a panel of genes important for myogenesis:
to_be_tested <- row.names(subset(fData(HSMM), gene_short_name %in% c("MYH3",
"MEF2C", "CCNB2", "TNNT1")))
cds_subset <- HSMM[to_be_tested, pData(HSMM)$State != 3]
Again, we’ll need to specify the model we want to use for differential analysis. This model will be a bit morecomplicated than the one we used to look at the differences between State. Monocle assigns each cell a“pseudotime”value, which records its progress through the process in the experiment. The model can test against changes as afunction of this value. Monocle uses the VGAM package to model a gene’s expression level as a smooth, nonlinearfunction of pseudotime:
diff_test_res <- differentialGeneTest(cds_subset, fullModelFormulaStr = "expression~VGAM::bs(Pseudotime)")
The VGAM::bs function states that Monocle should fit a B-spline through the expression values to help it describethe changes in expression as a function of progress. We’ll see what this trend looks like in just a moment. Othersmoothing functions are available.
Once again, let’s add in the gene annotations so it’s easy to see which genes are significant.
diff_test_res <- merge(fData(HSMM), diff_test_res, by = "row.names")
diff_test_res[, c("gene_short_name", "pval", "qval")]
Monocle: Differential expression and time-series analysis for single-cell RNA-Seq and qPCR experiments
## gene_short_name pval qval
## 1 MEF2C 8.788e-12 8.788e-12
## 2 TNNT1 3.652e-20 7.305e-20
## 3 MYH3 9.663e-24 2.899e-23
## 4 CCNB2 3.857e-36 1.543e-35
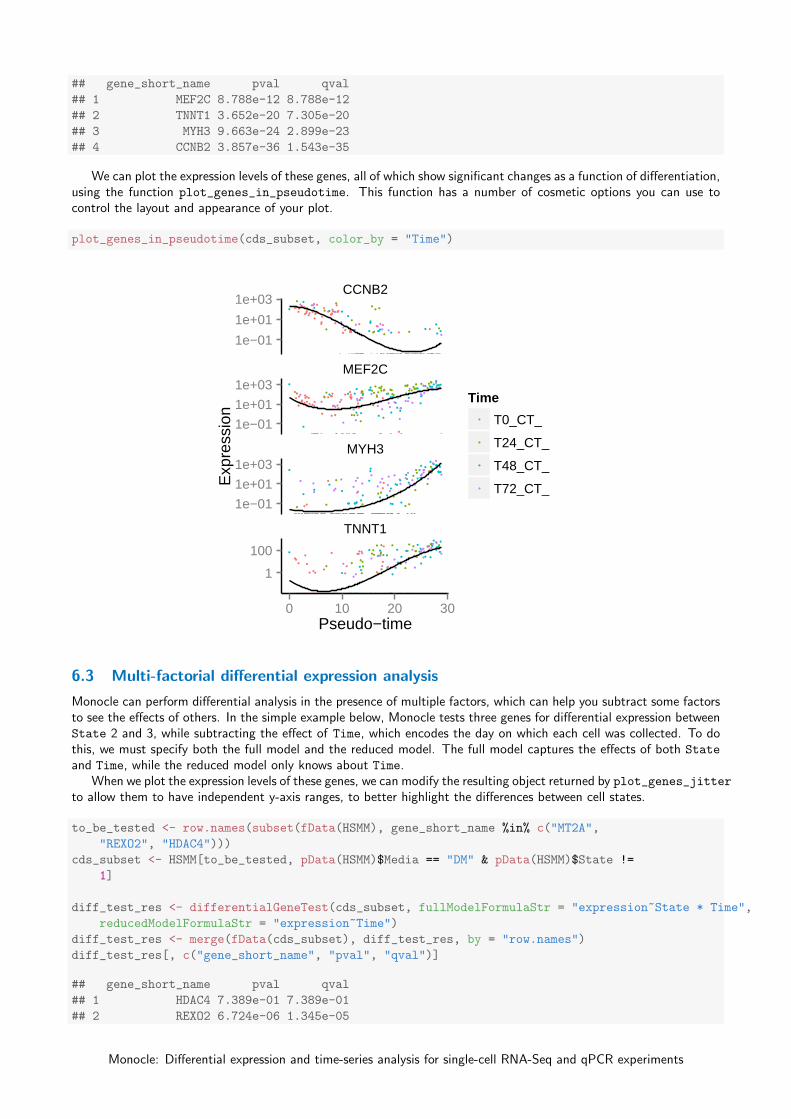
We can plot the expression levels of these genes, all of which show significant changes as a function of differentiation,using the function plot_genes_in_pseudotime. This function has a number of cosmetic options you can use tocontrol the layout and appearance of your plot.
plot_genes_in_pseudotime(cds_subset, color_by = "Time")
CCNB2
MEF2C
MYH3
TNNT1
1e−01
1e+01
1e+03
1e−01
1e+01
1e+03
1e−01
1e+01
1e+03
1
100
0 10 20 30Pseudo−time
Exp
ress
ion
Time
T0_CT_
T24_CT_
T48_CT_
T72_CT_
6.3 Multi-factorial differential expression analysis
Monocle can perform differential analysis in the presence of multiple factors, which can help you subtract some factorsto see the effects of others. In the simple example below, Monocle tests three genes for differential expression betweenState 2 and 3, while subtracting the effect of Time, which encodes the day on which each cell was collected. To dothis, we must specify both the full model and the reduced model. The full model captures the effects of both State
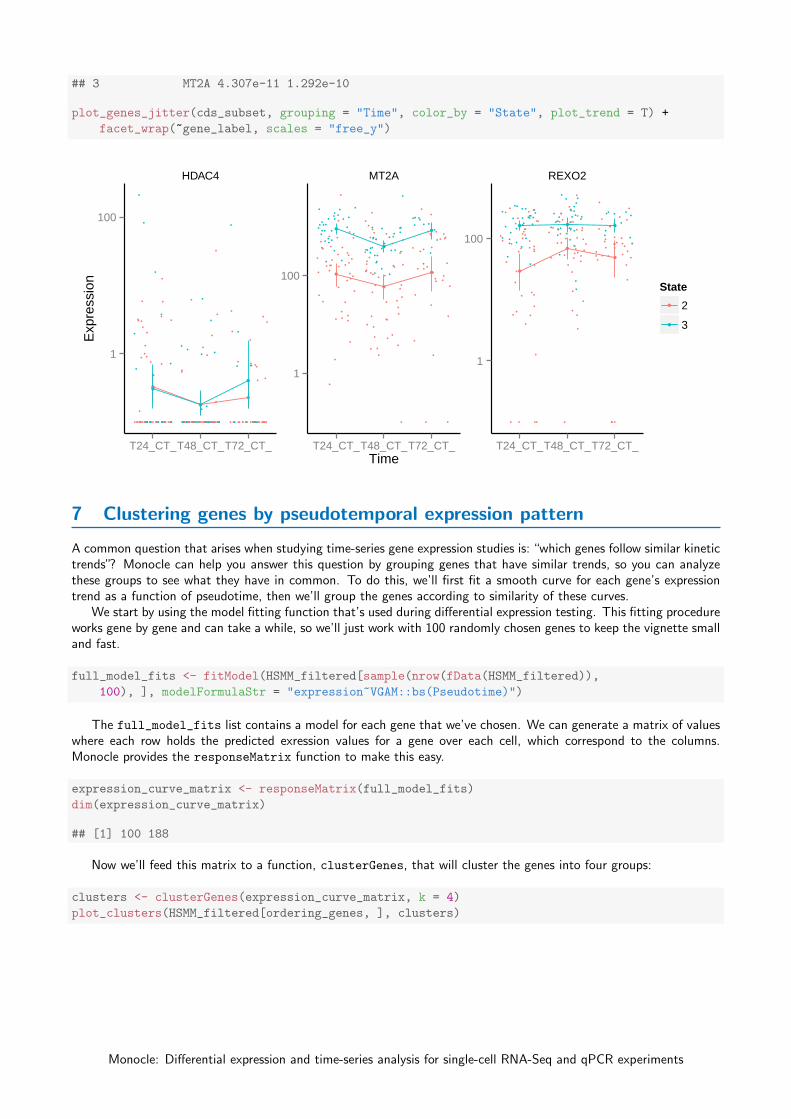
and Time, while the reduced model only knows about Time.When we plot the expression levels of these genes, we can modify the resulting object returned by plot_genes_jitter
to allow them to have independent y-axis ranges, to better highlight the differences between cell states.
to_be_tested <- row.names(subset(fData(HSMM), gene_short_name %in% c("MT2A",
"REXO2", "HDAC4")))
cds_subset <- HSMM[to_be_tested, pData(HSMM)$Media == "DM" & pData(HSMM)$State !=
1]
diff_test_res <- differentialGeneTest(cds_subset, fullModelFormulaStr = "expression~State * Time",
reducedModelFormulaStr = "expression~Time")
diff_test_res <- merge(fData(cds_subset), diff_test_res, by = "row.names")
diff_test_res[, c("gene_short_name", "pval", "qval")]
## gene_short_name pval qval
## 1 HDAC4 7.389e-01 7.389e-01
## 2 REXO2 6.724e-06 1.345e-05
Monocle: Differential expression and time-series analysis for single-cell RNA-Seq and qPCR experiments
## 3 MT2A 4.307e-11 1.292e-10
plot_genes_jitter(cds_subset, grouping = "Time", color_by = "State", plot_trend = T) +
facet_wrap(~gene_label, scales = "free_y")
HDAC4 MT2A REXO2
1
100
1
100
1
100
T24_CT_T48_CT_T72_CT_ T24_CT_T48_CT_T72_CT_ T24_CT_T48_CT_T72_CT_Time
Exp
ress
ion
State
2
3
7 Clustering genes by pseudotemporal expression pattern
A common question that arises when studying time-series gene expression studies is: “which genes follow similar kinetictrends”? Monocle can help you answer this question by grouping genes that have similar trends, so you can analyzethese groups to see what they have in common. To do this, we’ll first fit a smooth curve for each gene’s expressiontrend as a function of pseudotime, then we’ll group the genes according to similarity of these curves.
We start by using the model fitting function that’s used during differential expression testing. This fitting procedureworks gene by gene and can take a while, so we’ll just work with 100 randomly chosen genes to keep the vignette smalland fast.
full_model_fits <- fitModel(HSMM_filtered[sample(nrow(fData(HSMM_filtered)),
100), ], modelFormulaStr = "expression~VGAM::bs(Pseudotime)")
The full_model_fits list contains a model for each gene that we’ve chosen. We can generate a matrix of valueswhere each row holds the predicted exression values for a gene over each cell, which correspond to the columns.Monocle provides the responseMatrix function to make this easy.
expression_curve_matrix <- responseMatrix(full_model_fits)
dim(expression_curve_matrix)
## [1] 100 188
Now we’ll feed this matrix to a function, clusterGenes, that will cluster the genes into four groups:
clusters <- clusterGenes(expression_curve_matrix, k = 4)
plot_clusters(HSMM_filtered[ordering_genes, ], clusters)
Monocle: Differential expression and time-series analysis for single-cell RNA-Seq and qPCR experiments

1 2
3 4
−2
−1
0
1
2
3
−2
−1
0
1
2
3
0 10 20 300 10 20 30Pseudo−time
Exp
ress
ion
The plot_clusters function returns a ggplot2 object showing the shapes of the expression patterns followed bythe 100 genes we’ve picked out. The topographic lines highlight the distributions of the kinetic patterns relative tothe overall trend lines, shown in red.
8 Citation
If you use Monocle to analyze your experiments, please cite:
citation("monocle")
##
## Cole Trapnell and Davide Cacchiarelli et al (2014): The dynamics
## and regulators of cell fate decisions are revealed by
## pseudo-temporal ordering of single cells. Nature Biotechnology
##
## A BibTeX entry for LaTeX users is
##
## @Article{,
## title = {The dynamics and regulators of cell fate decisions are revealed by pseudo-temporal ordering of single cells},
## author = {Cole Trapnell and Davide Cacchiarelli and Jonna Grimsby and Prapti Pokharel and Shuqiang Li and Michael Morse and Niall J. Lennon and Kenneth J. Livak and Tarjei S. Mikkelsen and John L. Rinn},
## year = {2014},
## journal = {Nature Biotechnology},
## }
9 Acknowledgements
Monocle was built by Cole Trapnell and Davide Cacchiarelli, with substantial design input John Rinn and TarjeiMikkelsen. We are grateful to Sharif Bordbar, Chris Zhu, Amy Wagers and the Broad RNAi platform for technicalassistance, and Magali Soumillon for helpful discussions. Cole Trapnell is a Damon Runyon Postdoctoral Fellow. DavideCacchiarelli is a Human Frontier Science Program Fellow. Cacchiarelli and Mikkelsen were supported by the HarvardStem Cell Institute. John Rinn is the Alvin and Esta Star Associate Professor. This work was supported by NIHgrants 1DP2OD00667, P01GM099117, and P50HG006193-01. This work was also supported in part by the SingleCell Genomics initiative, a collaboration between the Broad Institute and Fluidigm Inc. This vignette was created
Monocle: Differential expression and time-series analysis for single-cell RNA-Seq and qPCR experiments

from Wolfgang Huber’s Bioconductor vignette style document, and patterned after the vignette for DESeq, by SimonAnders and Wolfgang Huber.
10 Session Info
sessionInfo()
## R version 3.0.2 (2013-09-25)
## Platform: x86_64-apple-darwin12.5.0 (64-bit)
##
## locale:
## [1] en_US.UTF-8/en_US.UTF-8/en_US.UTF-8/C/en_US.UTF-8/en_US.UTF-8
##
## attached base packages:
## [1] grid stats4 splines parallel stats graphics grDevices
## [8] utils datasets methods base
##
## other attached packages:
## [1] monocle_0.99.0 cluster_1.14.4 HSMMSingleCell_0.99.0
## [4] plyr_1.8 Hmisc_3.12-2 Formula_1.1-1
## [7] survival_2.37-4 reshape2_1.2.2 ggplot2_0.9.3.1
## [10] fastICA_1.2-0 combinat_0.0-8 igraph_0.7.0
## [13] matrixStats_0.8.5 irlba_1.0.2 Matrix_1.0-14
## [16] lattice_0.20-23 VGAM_0.9-3 Biobase_2.20.1
## [19] BiocGenerics_0.6.0 knitr_1.5
##
## loaded via a namespace (and not attached):
## [1] colorspace_1.2-2 dichromat_2.0-0 digest_0.6.3
## [4] evaluate_0.5.1 formatR_0.10 gtable_0.1.2
## [7] highr_0.3 labeling_0.2 MASS_7.3-29
## [10] munsell_0.4.2 proto_0.3-10 R.methodsS3_1.4.4
## [13] RColorBrewer_1.0-5 rpart_4.1-3 scales_0.2.3
## [16] stringr_0.6.2 tools_3.0.2
References
[1] Cole Trapnell, Davide Cacchiarelli, Jonna Grimsby, Prapti Pokharel, Shuqiang Li, Michael Morse, Niall J. Lennon,Kenneth J. Livak, Tarjei S. Mikkelsen, and John L. Rinn. The dynamics and regulators of cell fate decisions arerevealed by pseudotemporal ordering of single cells. Nature Biotechnology, 2014.
[2] P M Magwene, P Lizardi, and J Kim. Reconstructing the temporal ordering of biological samples using microarraydata. Bioinformatics, 19(7):842–850, May 2003.
[3] Cole Trapnell, Adam Roberts, Loyal Goff, Geo Pertea, Daehwan Kim, David R Kelley, Harold Pimentel, Steven LSalzberg, John L Rinn, and Lior Pachter. Differential gene and transcript expression analysis of RNA-seq experi-ments with TopHat and Cufflinks. Nature Protocols, 7(3):562–578, March 2012.
Monocle: Differential expression and time-series analysis for single-cell RNA-Seq and qPCR experiments