monocular visual acuity of persons 4-74 years · series 11 number 201 monocular visual acuity of...
TRANSCRIPT

Data from theNATIONAL HEALTH SURVEY
U.S. DEPARTMENT OF HEALTH, EDUCATION, AND WELFAREPublic Health Setvice
series 11Number 201
Monocular Visual Acuity
Of Persons 4-74 YearsUnited States -1971-1972
Visual acuity levels with usual correction, if any, as determined inthe opthahnology examination before diIation by race, geographicregion, family income, and other selected demographic variabIes.
DHEW Publication No. (HRA) 77-1646
Health ResourcesAdministrationNational Center for Health StatisticsRockvilie, Md. March 1977

NATIONAL CENTER FOR HEALTH STATISTICS
DOROTHY P. RICE, Director
ROBERT A. ISRAEL, Deputy Director
JACOB J. FELDW, Ph.D., Associate Director for Analysis
GAIL F. FISHER, Associate Director jor the Cooperative Health Statistics System
ELIJAH L. WHITE, Associate Director for Data Systems
ANDERS S. LUNDE, Ph.D., Associate Director for International Statistics
ROBERT C. HUBER, Associate Director for Management
MONROE G. SIRKEN, Ph.D., Associate Director for Mathematical S tatistics
PETER L. HURLEY, Associate Director for Operations
JAMES M. ROBEY, Ph.D., Associate Director for Program Development
ALICE HAYWOOID, Information Officer
DIVISION OF HEALTH EXAMINATION STATISTICS
ARTHUR J. McDOWELL, Director
JEAN-PIERRE HABICHT, M.D., Ph.D., SpeciajAssistant to Director
PETER V. V. HAMILL, M.D., Medical Adviser
JEAN ROBERTS, Chiej Medical Statistics Branch
ROBERT S. MURPHY, Chiej Survey P&znning and Development Branch
ARNOLD ENGEL, M.D., Medical Adviser, Adult Program
COOPERATION OF THE BUREAU OF THE CENSUS
In accordance with specificaticms established by the National HealthSurvey, the Bureau of the Census, under a contractual agreement, partici-pated in the design and selection of the sample, and carried out the first stageof the field interviewing and certain parts of the statistical processing.
Vital and Health Statistics-Series 11-No. 201
DHEW Publication No. (HRA) 77-1646
Library of Congress Catalog Card Number 76-608246

. .
Library of Congress Cataloging in Publication Data
Roberts, Jean
Monocular visual acuity of persons 4-74 years, United States, 1971-1972.
(Vital and health statistics: series 11, Data from the National Health Survey, Datafrom the health examination survey; no. 201) (DHEW publication; no. (HRA) 77-1 646)
Caption title.Bibliography: p.Supt. of Dots. no.: HE 20.6209:11/2011. Visual acuity–United States–Statistics. 2. Visually handicapped–United States–
Statistics. 3. Health surveys-United States. I. Ludford, Jacqueline, joint author. II.Title. III. Series: United States. National Center for Health Statistics. Vital and healthstatistics: Series 11, Data from the National Health Survey, Data from the health examina-tion survey; no. 201. IV. Series: United States. Dept. of Health, Education, and Welfare.DHEW publication; no. (HRA) 77-1646. [DNLM: 1. Vision tests. 2. Visual acuity.W2 AN148vk no. 201]RA407.3.A347 no. 201 [RE925] 312’.0973s [312’.6]ISBN 0-8406 -0083-6 76-608246
For sale by the Superintendent of Documents, U.S. Government Printing OfficeWashington, D.C. ‘2o4w - Price $1.30
Stlxk.No. 017-O’2HM30- 1

CONTENTS
Page
Introduction . . . . . . . . . . . . . . . . . . . . . . . . . . . . . . . . . . ...1
Ophthalmology Examination.. . . . . . . . . . . . . . . . . . . . . . . . ...3Visual Acuity Testing . . . . . . . . . . . . . . . . . . . . . . . . . . . . . . . 3Optotypes . . . . . . . . . . . . . . . . . . . . . . . . . . . . . . . . . . . . . .Quality Control . . . . . . . . . . . . . . . . . . . . . . . . . . . . . . . . . .
,Findings . . . . . . . . . . . . . . . . . . . . . . . . . . . . . . . . . . . . . . . 6AgeandSex . . . . . . . . . . . . . . . . . . . . . . . . . . . . . . . . . . ..$Race . . . . . . . . . . . . . . . . . . . . . . . . . . . . . . . . . . . . . . . .Ancestry . . . . . . . . . . . . . . . . . . . . . . . . . . . . . . . . . . . . . . 11Geographic Region . . . . . . . . . . . . . . . . . . . . . . . . . . . . . ...11SizeofPlaceofResidence. . . . . . . . . . . . . . . . . . . . . . . . . . ...14Income . . . . . . . . . . . . . . . . . . . . . . . . . . . . . . . . . . . ...14Education . . . . . . . . . . . . . . . . . . . . . . . . . . . . . . . . . . . . . 15ComparisonWithPreviousStudies . . . . . . . . . . . . . . . . . . . . . . . . . 18Other Prevalence Estimates of Defective Acuity . . . . . . . . . . . . . . . . . . 22
Summary . . . . . . . . . . . . . . . . . . . . . . . . . . . . . . . . . . . . . . . 22
References . . . . . . . . . . . . . . . . . . . . . . . . . . . . . . . . . . . . . . 24
ListofDetailedTables . . . . . . . . . . . . . . . . . . . . . . . . . . . . . . . . 25
AppendixI.StatisticaINotes.. . . . . . . . . . . . . . . . . . . . . . . . . . . . 61TheSurveyDesign . . . . . . . . . . . . . . . . . . . . . . . . . . . . . . ...61Nonresponse . . . . . . . . . . . . . . . . . . . . . . . . . . . . . . . . . . . . 62Missing Data . . . . . . . . . . . . . . . . . . . . . . . . . . . . . . . . . ...64SmaIINumbers . . . . . . . . . . . . . . . . . . . . . . . . . . . . . . . . . . . 65SamplingandMeasurementError . . . . . . . . . . . . . . . . . . . . . . ...65
AppendixII. DemographicandSocioeconomicTerms . . . . . . . . . . . . . . . . 66

SYMBOLS
Data not a\'aiIable--------------------------------------- ---
Category not applicablle------------------------------ . . .
Quantity zero --------------------------------------------- -
Quantity more than Obut less than 0.05---- 0.0
Figure does not meet standards ofreliability or precision ---------------------------- *

MONOCULAR VISUAL ACUITYOF PERSONS 4-74 YEARS
Jean Roberts and Jacqueline Ludford, &z3iorz of Health Examination Statistics
INTRODUCTION
This report on monocular distance acuitylevels of persons 4-74 years of age in the UnitedStates is the first in a series containing nationalestimates based on findings from the ophthal-mological examination of a national probabilityysample of the U.S. population during the firstHealth and Nutrition Examination Survey in1971-1972. The findings for the monocularacuity levels with usual correction, if any, areanalyzed with respect to age, sex, race, ancestry,geographic region, population size of place ofresidence, annual family income, and education.
The Health Examination Survey, in whichthese data were obtained, is one of the majorprograms of the National Center for HealthStatistics authorized under the National HealthSurvey Act of 1956 by the 84th Congress as acontinuing Public Health Service activity todetermine the health status of the population.
The data systems programs used to cmry outthe intent of the National Health Surveylinclude, in addition to the Health ExaminationSurvey, the Health Interview Survey, whichcollects health information from samples ofpeople by household interviews and focusesprimarily on the impact of illness and disabilitywithin various population groups; the HealthManpower and Facilities surveys, which obtaindata on hospitals, nursing homes, and otherresident institutions; and Health Resources Util-ization surveys, which obtain information onpersons using and the extent of the use of healthfacilities and health manpower.
The Health Examination Survey is one ofthese programs designed to collect the kind of
needed health statistics information obtainableonly through direct examinations of probabilitysamples of the population. From direct examina-tions, tests, and measurements, data are ob-tained in this program on the prevalence ofmedically defined illness-known as well aspreviously unknown or undiagnosed condi-tions–and on the distributions of a variety ofhealth-related physical, physiological, andpsychological measurements from which norma-tive data and appropriate cutoff points for whatis abnormal can be determined. Also collectedare medical history, demographic, and socio-economic data on the sample population understudy with which the examination findings maybe interrelated.
Since 1960 the Health Examination Surveyhas been conducted as a series of separate,consecutive programs called “cycles,” each ofwhich is Iimited to some specific segment of theU.S. population and to specific aspects ofhealth. During the first cycle in 1960-1962, theprevalence of certain chronic diseases and thedistributions of various physical and physiologi-cal measures, including visual acuity, were deter-mined among a defined adult population.z Z3 Forthat program a national probability sample of7,710 persons 18-79 years of age, of whom6,672 (86.5 percent) were examined, was se-lected to represent the 111 million in that agesegment of the civilian Boninstitutionalized U.S.population at that time.
The target populations for the second andthird cycles in 1963-1965 and 1966-1970 were,respectively, the Nation’s noninstitutionalizedchildren 6-11 years of age and youths 12-17years of age.4YS In both these programs, the
1

examination was focused primarily on healthfactors related to growth and development. Forthe second program a probability sample of7,417 was selected to represent the nearly 24million noninstitutionalized children in the U.S.population, o f whom 7,119 (96 percent) wereexamined. For the third program a probabilitysample of 7,514 was selected to represent the22.7 million noninstitutionalized youths in theU.S. population at midsurvey. Of these, 6,768(90 percent) were examined.
The Health and Nutrition Examination Sur-vey (HANES) program, from which the findingsin this report were derived, was designed tomeasure the nutritional status of the U.S.population of ages 1-74 years and to obtain somelimited information on the general health statusof the entire age group as well as more detailedinformation on the health status and medicalcare needs of persons age 25-74 years in thecivilian noninstitutionalized population. A de-scription of the specific content and plan ofoperation, including sample design, has beenpublished.6
As in the previous Health Examination Surveyprograms, the U.S. Bureau of the Census cooper-ated in the sample design and in the initial visitsfor interviewing at the eligible households in theprimary sampling units (PSU’S) selected in thevarious parts of the country. Members of thefield teams of the mobile examination center didfurther household interviewing and explaining ofthe examination portion of the program. Theselected sample persons for whom appointmentscould be made were brought into the speciallyconstructed mobile examination centers thatwere moved into a central location in each ofthe primary sampling units. The team thattraveled to the various survey locations through-out the country included professional and para-professional medical and dental examiners alongwith technicians, interviewers, and managementstaff.
The probability sample design used in thestudy provided for oversampling, at predeter-mined rates, among the poor, preschool chil-dren, women of childbearing ages, and theelderly, so that the nutritional status of thesehigh-risk groups could be more accurately esti-mated. It further provided for a nationally
representative subset , of 35 of the initiallyplanned primary sampling units throughout theUnited States so that some preliminary nationalfindings on the nutritional status of the popula-tion could be published before the total surveywas completed and so that national estimatescould be obtained from those parts o,f theexamination that were included only in this35-stand subsample.
During the planning for the HANES program,Dr. Carl Kupfer, Director, National Eye Institute(NEI), indicated the interest of that Institute inobtaining more definitive information than wascurrently available on the prevalence and ,clistri-bution of specific eye diseases and relatedconditions throughout the United States as anaid in setting goals and priorities for futureemphasis in their programs. Consistent with theoverall objectives of the survey, an evaluation oftreatment needs was also incorporated into theexamination.
Two ophthalmologists from NEI, Drs. JamesP. Ganley and Arthur F. Garcia, developed theexamination form and standardized protocol forthe ophthalmic examination and were responsi-ble for recruiting and training the examiningophthalmologists as well as for verifying theresultant diagnoses and for other aspects ofquality control in this area.
The National Eye Institute decided to discon-tinue the ophthalmology examination after 35stands because of problems encountered inrecruiting ophthalmologists to conduct theexaminations and the insufficient number ofstaff within the Institute to carry out theprogram adequately. While the size of thesample was not as large as originally planned,these unique national eye examination findingsdo provide the basis for analysis needed to meetmost of the original purposes of this part of theexamination.
For the 35 locations at which the ophthalmo-logical examination was given during the periodbetween April 1971 and October 1972, a na-tional probability sample of 14,147 persons wasselected to represent the 192.7 million in thetarget population age 1-74 years. Despite inten-sive efforts, only 10,126 of the sample personscame in for examination. This represents 72.8percent of the sample persons selected when
2

adjustments are made for the differential sam-pling rates for the age-, sex-, and income-definedpopulation subgroups. (The unadjusted overallresponse rate was 71.6 percent.)
Surveys conducted by the National Center forHeidth Statistics, including all previous programsof the Health Examination Survey, haveachieved higher levels of response than havebeen reached for the 35-stand subsample in thisfirst HANES. The 72.8-percent response ratefails to meet fully the requirements of theoriginal probability design. However, following apolicy of remunerating participants–adoptedafter the completion of 20 primary samplingunits-there was a significant increase in partici-pation.7 Because of the lower-than-usual re-”sponse rate, the national estimates of the moreseverely visually handicapped in this report willprobably understate slightly the actual prev-alence of this disability in the noninstitu-tionalized population 25-74 years of age.
National estimates in this report are based onweighted observations; i.e., the data obtained foreach examined person were inflated to the levelof the total population. The estimates have beencalculated as though the examined persons ineach of the age, sex, and income ckisses are arandom subsample of the sample persons in thesame class (appendix I). Although there isevidence from the eadier examination surveysand medical history data from HANES thatthese are not unreasonable approximations, it isclear that some estimates are subject to consider-able risk of bias when more than one-quarter ofthe sample persons in a particular age-sex-income class were not examined.
Even though all examinees 1-74 years of agewere examined and tested by the survey oph-thalmologists, visual acuity determinations weremade only for those age 4-74 years. Hence,findings in this report are based on the examina-tion of the 9,263 persons age 4-74 years at thetime of examination. No attempt was made toestimate the acuity levels for the 863 examinedchildren under 4 years of age.
OPHTHALMOLOGY EXAMINATION
At each of the 35 selected locations through-out the country, arrangements were made for 10
different sample persons to come or be broughtinto the specialIy designed mobile center foreach of the morning, afternoon, and eveningexamination sessions. These included eightexaminees from the nutrition sample (1-74years) and two from the detailed sample (25-74years). The ophthalmology examination, whichwas one of the first procedures scheduled ineach session, was similar for persons in thenutrition sample and for those in the detailedsample except for the refraction component inwhich determination was made of best correctedacuity. The examination for those over 3 yearsof age included the taking of an ocular historyregarding previously known eye disorders orprevious eye surgery; a determination of monoc-ular distance visual acuity with usual correction,if any, and with a pinhole test to determinecorrectability for those with acuity less than20/20; type of motility defects; prescription ofpresent glasses; dilation, and within 20-70minutes following diIation, retinoscopy for de-tailed examinees with acuity less than 20/40 andspherical trial lens test for nutrition examineeswith acuity less than 20/40; applanation tonom-etry on examinees 20 years and older; andexamination of the pupils, lids, globes, conjunc-tival, sclera, corneas, anterior chambers, irides,and lenses. The pupils were dilated in mostinstances for the spherical refraction and retino-scopy tests and the examination of the vitreousand retina.
Visual Acuity Tasting
In the visual acuity testing of examinees overthe age of 3 years, the survey ophthalmologistsused a standard A-O Project-O-Chart with thetarget image (Variable Focus Image and Opto-type slides) from the projector focused on amirror from which the image was reflected tothe Project-O-Chart screen (above and behindthe examinees) cIearly visible on a second mirrorat eye level in front of the examinee. The opticaldistance of the target and the image visible tothe examinee was carefully adjusted to thestandard 20 feet for distance acuity testingwitbin the limited space available in the examin-ing room.
Target optotypes on slides available for thistesting included, in order of examination proto-
3
col preference for use, Snellen letters, illiterateE, Landolt ring, and Picture.
Visual acuity testing was done with all light inthe examining room turned off, except for theoverhead lamp on the Reliance InstrumentStand, which was turned on dim and aimedtoward a wall above and behind the examinee.
Only monocular distance acuity was tested;the eye not under test was occluded. Corrected
acuity only was determined for the 37 percentof the examinees who had brought their glassesor contact lenses. For the 63 percent of exam-inees without glasses, uncorrected monoculardistance acuity was measured. Thus the availablevisual acuity data from this part of the examina-tion is limited to “corrected” vision, denotingfunctional acuity or the level at which theexaminees were actually seeing with whatevercorrection they were using.
The visual acuity testing was started with thelarger Snellen letters (or other optotype) on theprojector chart; then the projected optotypeswere decreased in size until a complete linecould not be read. If an individual appeared tohave good vision, the examiner began at the20/30 or 20/25 line and then proceeded to the20/20 line and smaller.
Visual acuity was recorded as the smallestcomplete line read correctly (no more than oneoptotype missed), plus any letters read on thenext line (e.g., 20/30+3, rather than 20/25- 3).In cases where the visual acuity was less than20/400, the examiner recorded the best acuity–whether the examinee could see finger countingand at what distance, hand movements, lightperception with projection, light perceptiononly, or no light perception.
When because of uncorrected astigmatism anexaminee missed one or two letters on severallines with successively larger letters, credit wasgiven for the line with the larger letters justabove the line with the smallest letters in whichno more than two letters were missed. Addi-tional credit was shown for those smaller letterscorrectly determined on the line immediatelybelow.
For purposes of this report the visual acuitylevel attained was that corresponding to the linewith the smallestcorrectly with no
letters or o~her op{otypes readmore than one error in the line
with the one exception notedwith uncorrected astigmatism.
OptcNypes
above for those
For 95 percent of the visual acuity tests thetarget slides with Snellen letter optotypes wereused. The proportion of tests administered usingthese letters was lowest among young childrenand increased with age from 4 percent at age 4years to 60 percent at age 6, 92 percent at age 7,and 99 percent at ages 8-74 (table A).
At ages 4 and 5 years, nearly two-thirds weretested with the illiterate E targets. When theilliterate E was not used, testing was more Iikelyto have been done with the picture targets at age4 years (29 percent of all 4-year-olds) andSnellen letters at age 5 (24 percent of all5-year-olds) than with the other optotypes. Atage 6, about 60 percent were tested with Snel]enletters and about 27 percent with the illiterate Etarget. Landolt rings were infrequently used, butsomewhat more often at ages 4-6 years (less than3 percent) than at the older ages (less than 0.5percent).
Hence, comparability of visual acuity meas-ures obtained on the three types of targets wasof concern primarily for the younger childrenunder 7 years of age. Various investigateors haveassessed the comparability and factors affectingthe measurement of visual acuity with differenttargets.g -13 While the targets used were notidentical with those used in the present study,their findings give some indication of the possi-ble effect of the use of different targets on theprecision of acuity measurement among theyoung children in the present study. In particu-lar, Jonkersl z of Rotterdam in his study of 173children 3 years of age and over found thereliability of visual acuity test results to be bestwith letter charts and poorest with picturecharts. Results with the illiterate E were some-what more reliable than test results on the samechildren with Landolt rings. However, boththese targets provided more reliable acuity testresults than the picture charts.
Lippmannl 3 in his studies of 3-5-year-oldchildren enrolled in day care centers admin-isteredfoundsteady
by the Office of Economic Opportunityacuity on all testincrease of visual
methods showed aacuity rating with
4

Table A. Percent of persons reaching specified visual acuity levels and percent distribution of persons tested by age, accmding” tooptotype used:UnitedStates,1971-1972
I Age in yearsTotal
4 I 5 6 7 8I
9-11I
12-74Visual acuity level and optotype used
Percent of persons reaching or exceedingvisual acuity level with specific optotype
20120orbetter
Alloptotypes . . . . . . . . . . . . . . . . . . . . .
Snellen letters . . . . . . . . . . . . . . . . . . . . . . .
Illiterate E . . . . . . . . . . . . . . . . . . . . . . . . .Pictures . . . . . . . . . . . . . . . . . . . . . . . . . . .
20/25 or Mter
Alloptotypes . . . . . . . . . . . . . . . . . . . . . .
Snellen letters . . . . . . . . . . . . . . . . . . . . . . .Illiterate E . . . . . . . . . . . . . . . . . . . . . . . . .Pictures. . . . . . . . . . . . . . . . . . . . . . . . . . .
20/30 or better
Alloptotypes . . . . . . . . . . . . . . . . . . . . . .
Sneilenletters . . . . . . . . . . . . . . . . . . . . . . .Illiterat e E . . . . . . . . . . . . . . . . . . . . . . . .Pictures . . . . . . . . . . . . . . . . . . . . . . . . . . .
20/50 or poorer
Alloptotypes . . . . . . . . . . . . . . . . . . . . . .
Snellenletters . . . . . . . . . . . . . . . . . . . . . . .Illiterat e E . . . . . . . . . . . . . . . . . . . . . . . .Pictures. . . . . . . . . . . . . . . . . . . . . . . . . . .
Persons tested
Alloptotypes, . . . . . . . . . . . . . . . . . . . . .
Snellenletters . . . . . . . . . . . . . . . . . . . . . . .Illiterate E . . . . . . . . . . . . . . . . . . . . . . . . .Pictures . . . . . . . . . . . . . . . . . . . . . . . . . . .Landoltrings . . . . . . . . . . . . . . . . . . . . . . . .
72.8 23.2 40.2 50.8 70.4 76.8 79.6 74.5
58.525.7
5.1
27.9
43.544.6
3.7
51.9
63.234.114.6
65.0
71.461.128.7
88.5
76.938.9
100.0
91.9
80.150.9
86.5
74.929.6
87.7
---. . .---
85.5
74.831.8
5.4
95.3
84.747.3
5.4
93.6
85.736.514.6
95.8
91.061.128.7
93.4
92.238.9
100.0
95.9
87.150.9
92.1
88232.245.8
93.3
. . .
. . .---
93.5~
---..-. . .
3.3
---. . .---
98.495.084.9
2.1
95.893.091.6
1.8
93.389.4
100.0
2.5
94.778.274.2
2.7
95.8100.0100.0
3.7
92.284.4
100.0
4.1
93.574.145.8
3.5
4.1 3.0 3.8 4.3 3.417.414.5
1.73.8
1.6
6.8
Percent distribution
100.0 100.0 100.0 100.0 IWO I 100.0 100.0
8&90.40.40.3
100.0
84.83.91.10.2
4.264.029.0
2.8
23.863.411.7
1.1
60.327.310.6
1.8
92.0 89.07.6 0.60.4 0.3
0.1
98.20.80.00.0
advancing age of children. Best results wereobtained with a symbol-type chart not used inthe present study and second best with theilliterate E. Snellen letter charts were not in-cludedin these clinical studies.
In the present national survey the proportionof children 4-6 years of age reaching the better
*
acuity levels was generally substantially higheramong those tested with SneIlen letter opto-types than among those tested with the illiterateEorpicture charts. The proportion with monoc-ukr acuity of 20/25 or betteron the Snellentargets was more than twice that in the grouptested with the illiterate E and 6-16 times that
5

with the picture optotypes (table A). Theproportion reaching the 20/30 level or betterwas similar on all three types of targets. TheLandolt ring optotypes test was used so sel-dom that its potential influence r-mthe visualacuity estimates would be negligible even amongthe age group 4-6 years, where it was mostfrequently used (but for less than 3 percent evenin that young age group). Regardless of age, allof the persons tested with the Landolt ringsreached the 20/20 acuity level.
Whether the differences in acuity levels ob-tained for the younger children on the varioustargets used reflected real differences in acuitylevels among the individuals tested, differencesin equivalence or difficulty among the targetsused, or differences in the degree of cooperationor attention of the examinees, or a combinationof these factors cannot be determined from thedata in this study.
Quality Control
Drs. Ganley and Garcia, senior ophthalmolo-gists from the National Eye Institute (NEI),were responsible for recruiting the 91 surveyophthalmologists and for training them in thestandard examination procedures used at thefirst 35 examination locations of the Health andNutrition Examination Survey.
In addition, the senior ophthalmologists fromNEI developed a protocol for replicate testingwhich they carried out at 24 of the 35 locationsto ensure the accuracy of the ophthalmologyexamination data, to provide an estimate of itsrepeatability or reliability, and to aid in main-taining uniformity in examining procedures.
For this, the examinations of all samplepersons in the first two sessions at each of 24 ofthe 35 stands were observed and replicated bythe senior ophthalmologists of NEI who thenevaluated the methods and findings of theexaminers and made the necessary recommenda-tions where needed. The NEI observer con-ducted the first part of these examinationssimultaneously with the examiner and recordedhis findings for each patient on a separatereplicate form. The fundoscopic examinationwas done by the observer when the examinerhad completed his examination of the sampleperson; evaluation of the fundoscopic findings
was made without the observer knowing theexaminer’s results.
The examiner was observed for technique,facility with the instruments, and adherence tothe protocol. Written comments were made onthe observer’s records, including specific prob-lems or questions that arose during the examina-tion. Recommendations to the examiner, ifneeded, were made at the end of each session.
At the end of each session, after the exami-ner’s findings had been transferred to the repli-cate examination form, the examiner’s evalua-tion of each exarninee was compared with thatof the observer.
In all, 230 ophthalmology examinations (2.5percent) of the 9,263 given were replicated.Visual acuity test results from the replicateexaminations showed a high level of agreementbetween examiner and observer findings. Clf the230 examinees, there was exact agreement onacuity levels for 94 percent of the monoculartests (right plus left eye), 1 percent differed byone acuity level, and 5 percent differed by twolevels. Where there was a disagreement, theexaminer was more likely to have obtained ahigher acuity level than the observer (70 percentof the tests where there was disagreement).
Testing equipment and illumination werechecked periodically throughout the cycle to besure they were in good working order and, metthe required standa~ds.
FINDINGS
Age and Sex
Nearly three-fourths (72.8civilian noninstitutionalized
percent) of thepopulation 4-74
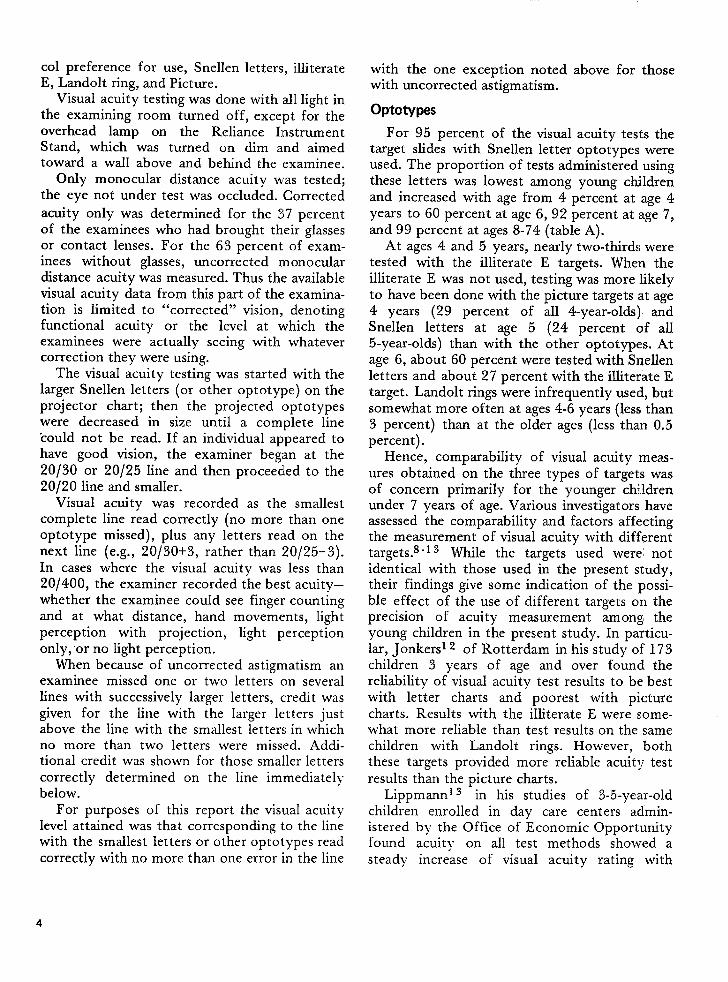
years of age in the United St&e~ have distancevisual acuity of at least 20/20 in their better eye“with usual correction” (figure 1, table 1).These estimates are based on findings from theHealth and Nutrition Examination Survey of1971-1972 among a national probability sa:mpleof examinees of whom about one-third (37percent) were tested with their glasses or contactlenses and the remaining 63 percent withoutcorrection. Only 2.4 percent had better monoc-ular distance acuity exceeding the 20/20 level.The prevalence of defective better monoculardktance acuity of 20/50 or less “with usualcorrection” in this total agq range is 3.3 percent,
6
7
1
;u>Eu~1
15 20 25 2040 50 701002@3400tianor ~
better 400
ACUITY LEVEL (SNELLEN RATIO)
So
60
20
0
or or
better womACUITY LEVEL (SNELLEN RATlO)
Figure 1. Percent of the population age 4-74 years reaching Figu ra 2. Percent of the population age 4-74 wars reaching
specified acuity levels for usual distance vision in the better
eye: United States, 1971-1972.
includlng 0.2 percent with acuity less than20/200 on this measure. At rnidsurvey point in1972, an estimated 6.16 million in the U.S.population age 4-74 years would have haddistance acuity of 20/50 or less in their bettereye with usual correction and for 0.21 miWon ofthese their usual better-eye acuity would havebeen less than 20/200 (table 2).
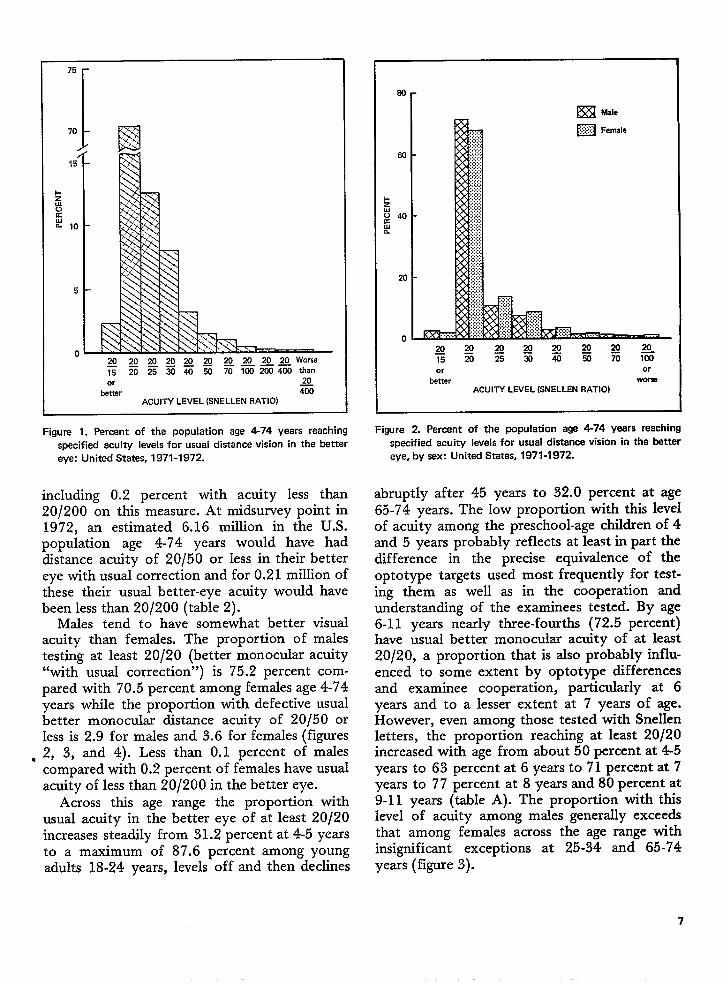
Males tend to have somewhat better visualacuity than females. The proportion of malestesting at least 20/20 (better monocular acuity“with usual correction”) is 75.2 percent com-pared with 70.5 percent among females age 4-74years while the proportion with defective usualbetter monocular distance acuity of 20/50 orless is 2.9 for males and 3.6 for females (figures
t 2, 3, and 4). Less than 0.1 percent of malescompared with 0.2 percent of females have usualacuity of less than 20/200 in the better eye.
Across this age range the proportion withusual acuity in the better eye of at least 20/20increases steadily from 31.2 percent at 4-5 yearsto a maximum of 87.6 percent among youngadults 18-24 years, levels off and then decIines
specified acuity levels for usual distance vision in the batter
eye, by sex: United States, 1971-1972.
abruptly after 45 years to 32.0 percent at age65-74 years. The low proportion with this IeveIof acuity among the preschool-age children of 4and 5 years probably reflects at least in part thedifference in the precise equivalence of theoptotype targets used most frequently for test-ing them as well as in the cooperation andunderstanding of the examinees tested. By age6-11 years nearly three-fourths (72.5 percent)have usual better monocular acuity of at least20/20, a proportion that is also probabIy influ-enced to some extent by optotype differencesand examinee cooperation, particularly at 6years and to a lesser extent at 7 years of age.However, even among those tested with Snellenletters, the proportion reaching at least 20/20increased with age from about 50 percent at 45years to 63 percent at 6 years to 71 percent at 7years to 77 percent at 8 years and 80 percent at9-11 years (table A). The proportion with thislevel of acuity among males generally exceedsthat among females across the age range withinsignificant exceptions at 25-34 and 65-74years (figure 3).

100r
I80 -
60 -
40 -
20 -
0 1
4.5 6.11 32.17 18-24 25-34
AGE IN YEARS
35-44 45.54 55-&s 65-74
Figure 3. Percent of the population with usual distance vision o{ at least 20/20 in the better eye, byage and sex: United States,
1971-1972.
1-Zwua:
20
10
0
4.5 6-11 12-17 18-24 25.34 35-44 4554 55-54 65-74
AGE IN YEARS
Figure 4. Percent of the population with usual distance vision of 20/500 rworse in the better eye, byage and sex: United States,1971-11972.

The prevalence of defectiveor less ‘in the better eve with
acuity of 20/50 20/50 or poorer with the left eye “with usualusual correction correction” comDared with 64.6 ~ercent reach-
decreases steadily with-increase in age from 3.5percent at 6-11 years to 0.7 percent at 35-44years then increases to 14 percent at age 65-74years. The trend with age in the prevalence ofthis degree of defective acuity is generaHysimilar among males and females but tends to beslightly more prevalent among females except at6-11 years and 55-64 years (figure 4).
With usual correction, the dktribution ofacuity levels for the right and left eyes aregenerally similar (table 3), with more thanthree-fourths (76.7 percent) showing no differ-ence in acuity level between the two eyes onmonocular tests. When there is a difference, it ismore likely to be of only one level (16 percent)than of more than one (7 percent) and to beslightly better in the left than in the right eye.Among those 4-74 years of age, 66.0 percenttested 20/20 or better and 5.9 percent tested
ing 20/20 or be;ter and 6.4 per;ent no betterthan 20/50 with the right eye.
Race
Negro persons age 4-74 years tend to havepoorer acuity with usual correction than whitepersons in the United States (figures 5, 6, andtable 4). Less than two-thirds (65.8 percent) ofthe Negroes reached at Ieast the 20/20 level onbetter monocular acuity tests compared with73.6 percent of white persons, w-file 5.1 percentof the Negro group compared with 3.1 percentof the white group could not read above the20/50 leveI. The number of persons of otherraces in the population and hence in the samplewas too small .to provide estimates of their visualacuity sufficiently reliabIe for publication.
Across the age range in the study, the
4-5 S-II 12.17 18.24 2534
AGE IN YEARS
35.44 45.% 55-M
Figure 5. Percent of the white and Negro populations with usual distance vision of at least 20/20 in the better eye, by age:
United States, 1971-1972.
9
r30
20
10
04.5 611 12.17 1S-24 25-34 35-44 45-54 55-64 65-74
AGE IN YEARS
Figure 6. Percent of the white and Negro populations with usual distance vision of 20/50 or worse in the better eye, by age:United States,,
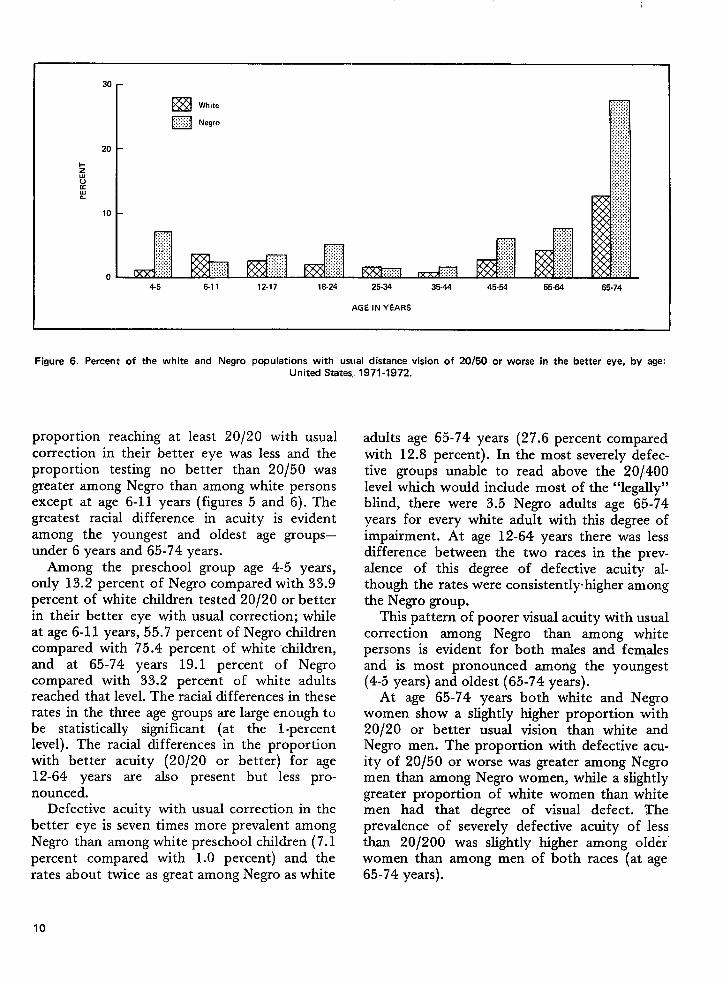
proportion reaching at least 20/20 with usualcorrection in their better eye was less and theproportion testing no better than 20/50 wasgreater among Negro than among white personsexcept at age 6-11 years (figures 5 and 6). Thegreatest racial difference in acuity is evidentamong the youngest and oldest age groups—under 6 years and 65-74 years.
Among the preschool group age 4-5 years,only 13.2 percent of Negro compared with 33.9percent of white children tested 20/20 or betterin their better eye with usual correction; whileat age 6-11 years, 55.7 percent of Negro childrencompared with 75.4 percent of white “children,and at 65-74 years 19.1 percent of Negrocompared with 33.2 percent of white adultsreached that level. The racial differences in theserates in the three age groups are large enough tobe statistically significant (at the l-percentlevel). The racial differences in the proportionwith better acuity (20/20 or better) for age12-64 years are also present but less pro-nounced.
Defective acuity with usual correction in thebetter eye is seven times more prevalent amongNegro than among white preschool children (7. 1percent compared with 1.0 percent) and therates about twice as great among Negro as white
1971-1972.
adults age 65-74 years (27.6 percent comparedwith 12.8 percent). In the most severely defect-ive groups unable to read above the 20~400level which wouId include most of the “legally”blind, there were 3.5 Negro adults age 65-74years for every white adult with this degree ofimpairment. At age 12-64 years there was: lessdifference between the two races in the prev-alence of this degree of defective acuity al-though the rates were consistently higher amongthe Negro group.
This pattern of poorer visual acuity with usualcorrection among Negro than among whitepersons is evident for both males and femalesand is most pronounced among the youngest(4-5 years) and oldest (65-74 years).
At age 65-74 years both white and Negrowomen show a slightly higher proportion with20/20 or better usual vision than white andNegro men. The proportion with defective acu-ity of 20/50 or worse was greater among Negromen than among Negro women, while a slightlygreater proportion of white women than whitemen had that degree of visual defect. Theprevalence of severely defective acuity of less&a.n 20/200 was slightly higherwomen than among men of both65-74 years).
among older”races (at age
10

Ancestry
In the household questionnaire, informationwas obtained on the principal ancestry ornational origin for each of those examineeswhose race was not classified as “Negro” by thecensus interviewer. From this, estimates of thevisual acuity levels for three of the largerminority groups including Spanish and MexicanAmerican, Chinese and Japanese, and AmericanIndians living off reservations have been ob-tained. Recent immigrants from Puerto Rico areincluded with those of Spanish ancestry. Thesample size is not large enough to providenational estimates in greater ethnic detail andeven for these three groups, the survey sample isnot large enough to provide estimates suffi-ciently reliable to assess ethnic differences invisual acuity. The population size, relation be-tween the ancestry and racial classifications, andthe acuity levels of these ethnic or ancestrysubgroups are shown for adults 18-74 years ofage in table 5. The findings are generally similaramong children.
Of the three ethnic subgroups, the Orientals–Chinese and Japanese–have the lowest propor-tion with better as well as with poorer acuity(better eye with usuaI correction), while theAmerican Indians have the highest proportion inboth acuity groups. However, because of thesmall number of persons reporting themselves tohave such ancestry in relation to the size of thesample, the precision of the national estimatesof acuity levels for many of them is below thelevel usually published in this series and rela-tively large differences in prevalence rates prob-ably reflect sampling variability alone and notactual ancestry or ethnic differences in visualacuity.
Geographic Region
Children and youths under 18 years of age inthe South generally have somewhat better usualvisual acuity in the better eye than do those inthe other three regions of the country. Theproportion with acuity of at Ieast 20/20 isgreater at age 4-17 years and the proportionwith defective acuity of 20/5 O or poorer is lowerat age 6-17 years in the South than elsewhere(figures 7, 8, and table 6). This regional patternin the distribution of acuity is present but less
marked among boys than that shown for bothsexes combined, but is not consistent amonggirls.
Among adults 18-74 years of age the regionaldifferences in the distribution of visual acuityare less consistent than those for children andyouths. However, the proportion of adults withdefective acuity of 20/50 or poorer is consist-ently lower among those in the Midwest thanelsewhere across the 18-74-year age range for alladults and across the 45-74-year range for menand women.
In three of the four regions the proportion ofpersons with visual acuity 20/20 or betterreaches a maximum of 84-88 percent amongyounger adults 18-44 years, while in the Souththe maximum is reached earlier among youths12-17 years where the rate slightly exceeds thatin the 18-44-year age range. From the maximumrate the proportion with acuities of 20/20 orbetter decreases consistently with age until by65-74 years the proportion with that degree ofusuaI acuity in the better eye is reduced to28-36 percent in the four regions.
The proportion with defective acuity of20/50 or poorer is at a minimum of 1-2 percentamong younger adults 18-44 years, then gener-ally consistently increases with age and is at amaximum among the oldest age group, to 65-74years, with rates ranging from 8-20 percent inthe four regions. This age-related trend in bothbetter and defective visual acuity is generallyconsistent among males and females in each ofthe regions.
The regional distribution of visual acuityamong white persons in this country is generallysimilar to that deseribed above for persons of allraces combined, but is somewhat less consistentamong the Negro population.
Among white preschool-age children, the pro-portion with usual acuity of at Ieast 20/20 in thebetter eye is greatest in the South–51.3 per100–compared with rates ranging from 15.9 inthe West to 38.4 in the Midwest. The widevariability in these rates is probably partly dueto differences in targets selected for use intesting. At the other end of the visual acuityscaIe, no white preschool children in the Southhad usual defective acuity of 20/50 or poorerwhile the proportion in the other three regionsranged from 1 percent or less in the West and
11

100
80
560
8cIJJ
40
20
0
100
80
+ 60
5v
:L 40
20
0
Northeast Midwest South
12.17 years
100
80
60
40
20
0
100
80
60
40
20
0 I
west
100
80
60
40
Northeast Mldwesl South West
GEOGRAPHIC REGION
6-11 years
Midwest South
18.54 years
West
Northeast M,dwesr South west
65.74 years
Northeast Midwest South West
GEOGRAPHIC REGION
Figure 7. Percent of the white and, Negro populations age 4-74 yealrs with at least 20/20 usual distance vision in the better eye, by age
and geographic region: United States, 1971-1972,
12
40— 4-5 years 40- 6-11 years
~ White
30 ~ ~egro 30
2ug 20 20
E
10 - 10
0Northeast Midwest South west Northeast Midwest south West
40 12.17 years 40 1S-54 years
30 - 30
1-Z
: 20 20LLJ
10 10
0Northeast Midwest South West Northeast Midwest .%uth West
40
[
55-64 years 40
30t
30
10 -: .,
0Northeast Midwest South West
GEOGRAPHICREGION
20
10
0Northeast Midwest South west
GEOGRAPHIC REGION
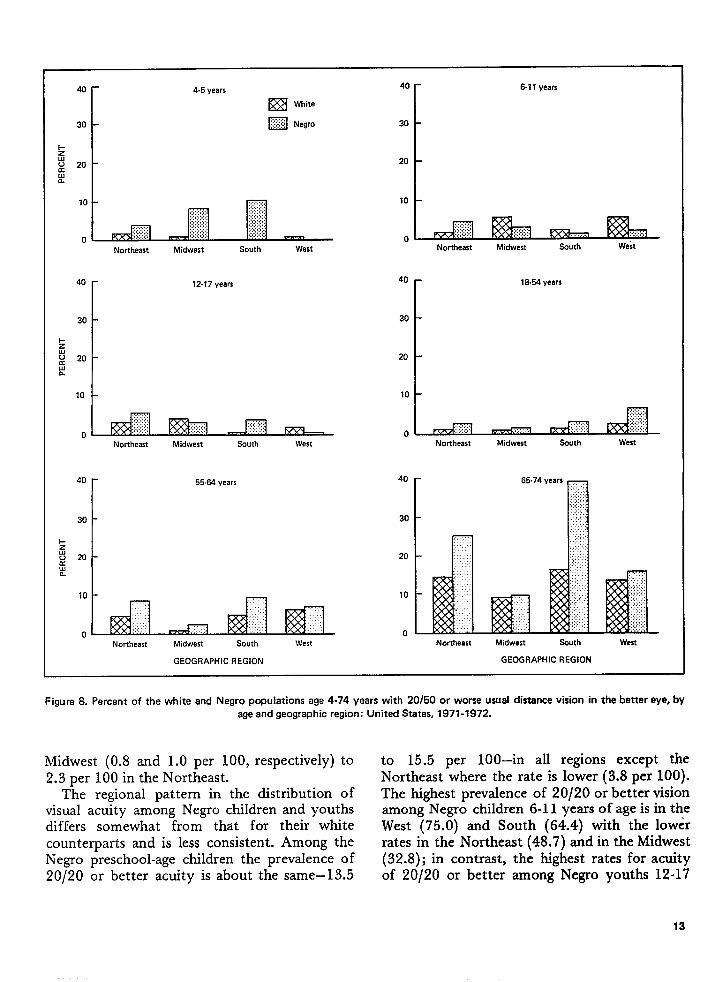
Figure 8. Percent of the white and Negro pqmlations age 4-74 years with 20/50 or worse usual distance vision in the better eye, by
age and geographic region: United States, 1971-1972.
Midwest (0.8 and 1.0 per 100, respectively) to2.3 per 100 in the Northeast.
The regional pattern in the distribution ofvisual acuity among Negro children and youthsdiffers somewhat from that for their whitecounterparts and is less consistent. Among theNegro preschool-age children the prevalence of20/20 or better acuity is about the same–13.5
to 15.5 per 100–in all regions except theNortheast where the rate is lower (3.8 per 100).The highest prevalence of 20/20 or better visionamong Negro children 6-11 yeas of age is in theWest (75.0) and South (64.4) with the lowerrates in the Northeast (48.7) and in the Midwest(32.8); in contrast, the highest rates for acuityof 20/20 or better among Negro youths 12-17
13

years of age are in the Midwest (80.3) and South(81.8) and the lowest rates are in the West(68.7).
Between the ages of 18 and 54 years there islittle regional difference in the proportion of thewhite population with usual acuity of 20/20 orbetter, while among Negro younger adults thosein the South show a somewhat higher prevalencerate for better acuity than do those in the otherregions. The proportion with defective acuity of20/50 or less in the better eye with usualcorrection is highest in the West, particularly forNegro adults.
At 55-64 years of age both white and Negroadults in the Midwest, tend to have somewhatbetter usual acuity–relatively more 20/20 orbetter, and fewer with defective acuity of 20/50or poorer—than do those in the other threeregions,
Among the oldest age group, 65-74 years, theproportion with defective acuity (usual bettermonocular vision of 20/50 or less) is substan-tially greater among Negro adults in the South(38.9 percent) and Northeast (25.0 percent)than in the West (16.1 percent) or Midwest (9.7percent). Regional differences in the distributionof visual acuity are less marked among olderwhite adults. However, relatively fewer of bothwhite and Negro adults in the Midwest thanelsewhere have that degree of defective acuity.
The prevalence of usual monocular visualacuity levels of 20/20 or better (in the bettereye) is greater among white than among Negrochildren and among youths 4-17 years of age ineach of the four regions except in the West forchildren 6-11 years of age (figure 7). Negligiblewhite-Negro differences in these better acuityrates may be seen among preschool children, 4-5years, in the West and 12-17-year-old youths inthe Midwest.
Among adults the regional pattern of thewhite-Negro differences in the proportion withusual visual acuity of at least 20/20 in the bettereye is less consistent than that shown forchildren and youths. Between the ages of 18 and54 years, there is little difference in the preva-lence of usual acuity of 20/20 or better betweenwhite and Negro adults, in each of the regions,except in the West at 45-54 years, where theproportion of Negro adults with this level ofbetter acuity is significantly less than that in the
other regions. By 65-74 years of age, except inthe Midwest where the prevalence rates for thetwo races are similar, the proportion of whiteadults with 20/20 or better usual acuity con-sistently exceeds that for Negroes in each of theregions. Prevalence rates for defective acuity(20/50 or poorer) in the South and Northeastare more than twice as great for Negro as forwhite persons 65-74 years of age, while theproportion with this degree of defect amongNegroes in the Midwest and West is onlynegligibly greater than for their white counter-parts.
Size of Place of Residence
There is no consistent pattern of differencesin the distribution of usual visual acuity (bettereye) by size of place of residence for the ‘U.S.civilian noninstitutionalized population age 4-74years. Among persons living in urbanized areas,72.4 percent have usual monocular acuity of20/20 or better, compared with 73.2 percent inurban communities outside of urbanized areasand 73.1 percent in rural areas. The proportionswith defective acuity of 20/50 or poorer aresimilarly close: 3.5 percent for those in urban-ized areas, 3.6 percent in nonurbanized areas,and 3.0 percent in rural areas. The differences inrates are not statistically significant nor is therea consistent pattern in visual acuity rates by age,race, or sex (table 7).
Income
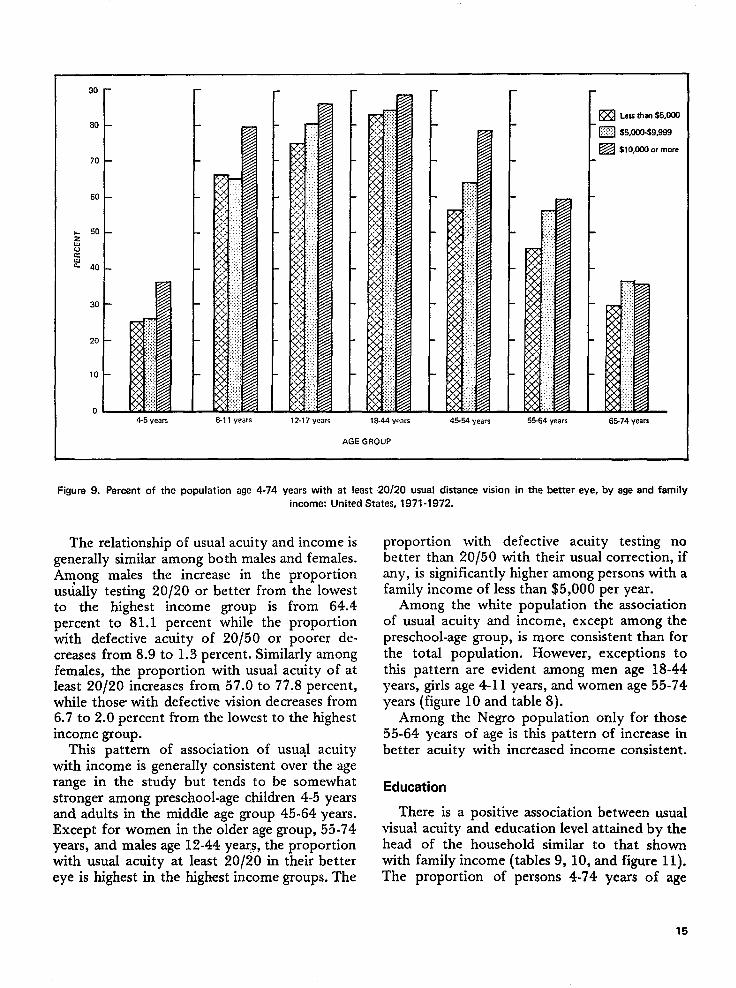
There is a consistent relationship between thelevel of family income and usual visual acuity ofpersons 4-74 years of age in the United States.The proportion with usuaI acuity of at least20/20 in the better eye increases with the size ofthe annual family income from 60.1 percentamong those in families with income under$5,000 to 70.5 percent in the middle incc)mebrackets to 79.5 percent among those withincome of $10,000 or more per year, while theproportion with defective acuity of 20/50 orpoorer decreases from 7.6 percent in the lowestincome bracket to 3.3 percent for those withincomes of $5,000 to $10,000 to 1.7 percentamong those in the highest income brackets(table 8 and figure 9).
14
30 ~
80
70
60
+ 50z
8a
~ 40
30 -
20
10 –
o—4.5 years 6.11 years 12.17 years 1S.44 wars
AGE GROUP
4554 years 55.64 years
r~ Lessthan$5WI
[
~ $5,rJlJ@$9,9gg
~ SIO,LMOOrinOre
65.74 years
Figure 9. Percent of the population age 4-74 years with at least 20/20 usual distance vision in the better eye, by age and family
income: United States, 1971-1972.
The relationship of usual acuity and income isgenerally similar among both males and females.Among males the increase in the proportionusually testing 20/20 or better from the lowestto the highest income group is from 64.4percent to 81.1 percent while the proportionwith defective acuity of 20/50 or poorer de-creases from 8.9 to 1.3 percent. Similarly amongfemales, the proportion with usual acuity of atleast 20/20 increases from 57.0 to 77.8 percent,while those with defective vision decreases from6.7 to 2.0 percent from the lowest to the highestincome group.
This pattern of association of usuql acuitywith income is generally consistent over the agerange in the study but tends to be somewhatstronger among preschool-age children 4-5 yearsand adults in the middle age group 45-64 years.Except for women in the older age group, 55-74years, and males age 12-44 yeqs, the proportionwith usual acuity at least 20/2 O in their bettereye is highest in the highest income groups. The
proportion with defective acuity testing nobetter than 20/50 with their usual correction, ifany, is significantly higher among persons with afamily income of less than $5,000 per year.
Among the white population the associationof usual acuity and income, except among thepreschool-age group, is more consistent than forthe total population. However, exceptions tothis pattern are evident among men age 18-44years, girls age 4-11 years, and women age 55-74years (figure 10 and table 8).
Among the Negro population only for those55-64 years of age is this pattern of increase inbetter acuity with increased income consistent.
Education
There is a positive association between usualvisual acuity and education level attained by thehead of the household similar to that shownwith family income (tables 9, 10, and figure 11).The proportion of persons 4-74 years of age
15

30 – 4-5 years
~ White
~ Negro
20
l’-
Zv
k4.
10,,,.,,,.,,,,,.,,,,,.,.,.,,,,:,:.:,:,:,,.,,,,,,,.:,:,,,::,,,,,,,,,,.::::,:::::,.,,,,,.,.,.,,,.,,,,,,,,,.,,,,
0 —
30
20
10
0
1844 years
o
30
20
i-ZwvKuL
ANNUAL FAMILY INCOME IN THOUSANDS
30
20
&11 years 12-17 years
20
10I
45.54 vears
30
20
10
0
658.74 years
1
——
UJg &v$~
ANNUAL FAMILY INCOME IN THOUSANDS
Figure 10. Percent of the white and Negro populations age 4-74 years with 20/500 rworseusual distance vision inthebettereye, byegeand family income: Urlited States, 1971-1972.
16

100r 4-5 years100r
20
0None Elementary High Collegs
school
100
r
None Elementary High College
school
100r 65-74 years
80
t
None Elementary High College
EDUCATION OF HEAD OF HOUSEHOLD
6-11 wars100
r12-17 years
None Elementary High College
schwl
45-54 years
None Elementary High College
school
60t-
5564 years
None Elementary High College None Elementary High Collegeschool school
EDUCATION OF HEAD OF HOUSEHOLO EDUCATION OF HEAD OF HOUSEHOLD
Figure 11. Percent of the population age 4-74 years with at least 20/20 usual distance vision inthebetter eye, byageandaducation
ofhead of household: United States, 1971-1972.
with usual acuity of at least 20/20 in the better extremes of the education groups decIined fromeye increases from 36.5 percent among those 20.9 to 1.7 percent.whose household head had no formal schooling This pattern of association of usual visualto 79.9 percent among those with some college acuity with this socioeconomic indicator (educa-education, while the proportion with defective tion of househoId head) is generally similar foracuity no better than 20/50 in these two males and females and across the age groups in
17

this study. It is also more consistentwhite than the Negro population.
among the
Among the adults 18-74 years of age, theassociation between visual acuity and the educa-tion of the examinee shown in table 10 is similarto that with educational level of the head of thehousehold. These data are included for compara-bility with acuity data published for adults fromthe 1960-1962 Health Examination Survey.
Comparison With Previous Studies
Monocular visual acuity was measured withand without correction (the individual’s ownglasses or contact lenses) in the 1!360-1 962
Health Examination Survey among the nationalprobability sample representative of the civiliannoninstitutionalized population of adults age18-79 years and in the 1966-1970 Health Ex-amination Survey among the national probabil-ity sample representative of the noninstitutional-ized population of youths age 12-17 years.
National estimates of the distribution ofvisual acuity levels in the better eye with usualcorrection, if any, from these two earlier studiesare shown in tables 11 and 12 along withcomparable data from the present study.
The apparent improvement shown in usualvisual acuity of U.S. youths and adults in thepresent study over findings for these age groupsin the population in the earlier national surveysmay be the resultant of a number of factors thatneed to be considered in interpreting these data.These changes probably reflect improvement ineye care and in socioeconomic conditions amongthe population as well as differences in testingmethods and examiners among the surveys.Moreover, the sampling variability for some inthose age groups in the present survey issomewhat larger than in the previous surveysbecause of the smaller sample size in thosegroups. There is evidence from the qualitycontrol of the present study that the ophthal-mologist examiners tended to obtain slightlyhigher acuity levels than did the more experi-enced observers. On this basis it might beassumed that the data in all three surveys willsomewhat overestimate the proportion reachingthe better acuity levels and that the overstate-ment may be somewhat less in the present thanin earlier studies because of the greater skill ofthe examiners in the present study.
Among youths 12-17 years of age, someimprovement in usual visual acuity level may beseen in the present survey from that founld inthe preceding national study, the midpoint forwhich was approximately 4 years earlier. Theproportion of boys with usual acuity of at least20/20 in the better eye increased 5 percent(from 82.3 percent to 86.6 percent), while theproportion with usual acuity no better than20/50 decreased 38 percent (from 3.7 percent to2.3 percent, figure 12). Girls of that age showeda negligible improvement of less than 1 percentin the proportion with usual acuity at least20/20 from 78.3 percent to 79.0 percent, whilethe prevalence of defective acuity no better than
20/50 with usual correction decreased about 40percent from 5.3 percent to 3. ~ percent (figure13).
From the survey among adults completed 10years earlier, consistent improvement in usualacuity level that generally increased ~th agemay be seen in the present study findings formen from age 35 years and women 25 years andover.
Among men 35 years and. over the proportiontesting at least 20/20 with usual acuity in thebetter eye shows increases ranging from :2.8percent at 35-44 years to 16.9 percent at 55-64years, while the proportion with usual acuity nobetter than 20/50 shows decreases ranging from16 percent at 45-54 years to 61 percent at 35-44years.
The proportion of women with usual acuityof at least 20/20 within each age group increasedconsistently between 1960-1962 and197 1-1972; gains ranged from 3 percent at age25-34 years to 48 percent at 65-74 years. Theproportion with defective acuity no better than
20/50 decreased from 1960-1962 to 1971-1972at each age from 25 years on; the percentage
reductions ranged from a low of 23 percent at65-74, years to a maximum of 59 percent at
55-64 years.Since only uncorrected acuity levels were
measured in the 1963-1965 Health Examination
Survey among the national probability y sample
representative of the noninstitutionalized (chil-
dren 6-11 years of age in this country, monocu-
lar acuity levels obtained in that earlier survey
shown in table 13 are not comparable with those
18

100
90
80
70
1-ZwvuIlla. 60
50
40
30
0
20
1-
i?lva 10~
0
Males, better monocular,
at least 20/20
— 1971.1972
1966.1970 and. . . . . . .1960.1962
I I I I I I I I
5 15 25 35 45 55 65 75
AGE IN YEARS
Males, better monocular,
20/50 or worse ..
— 1971-1972 . .. . .
. . . . . . . 1966.1970 and ..
1960-1962,.
. . .. . .
. .. .
. ...”. ..”
. ..”●
. . . . . . . . . . . . . . . . . . . .
6 15 25 35 46 55 65 75
AGE IN YEARS
Figure 12. Percent of males age 12-74 years with usual distance acuity of at least 20/20 and percent with 20/50 or worse in the better
eye, by age from the present and previous national surveys: United states, 1971-1972 (12-74 years), 1966-1970 (12-17 years), and
1960-1962 (18-74 years).
19

90
80
70
60
2
:50
EL
40
30
20
.
.
0
20
b
Eu 10a:
—.
Females, better monocular,
at least 20/20
— 1971.1972.,, . . . . 1966.1970 and
1960.1962 “.
‘.
‘.‘,
[ I I I I I I
5
J
15 25 35 45 55 65 75
AGE IN YEARS
....Females, better monocular, . . .
20/50 CM worse ,.. ”...
_ 1971.1972 . . .. . . . . 1966.1970 and . . .
. . . .. . . .
. . . . . .. . .
. ..”,..
. . . . . . . . . . . . . . . . . .
n I
5 15 25 35 45 55 65 75
AGE IN YEARS
Figure 13. Percent of females age 12-74 years with usual distance acuity of at least 20/20 and percent with 20/50 or worse in the
better eye, by age from the present andprevious national surveys: United States, 1971 -1972 (12-74 years), 1966-1970 (12-17
years), and 1960-1862 (18-74 years).

100
W
So
70
1-28agao
50
40
30
0
Both sexes, ●t least 20/20
— Estimatd binocular 1971-1972
-—— Binocular 1960-1962,1966.1970
—.- Better monocular 1971.1972
. . . . . . . Better monocular 19S0-19S2, 1%S-1970
-......
....,.
5 15 25 35 45 55 65 75
AGE IN YEARS
20- Both sexes, 20/EO or worse
E$timatad binocular 1971.1972..
Binacdw 19S0.19S2, 19SS-1970..””/
—-- . . /
—.— Better monocular 1971-1972; . . . . . . . Better monc.whr 19S0.19S2, 1966-1970v 10 -au -.40& ....
5 15 2s 35 4s 65 t% 7s
AGE IN YEARS
Figura 14. Estimated percent of population age 12-74 years with usual binocular and parcent with usual better monocular of at least20/20 or of 20/!YJ or worse, by aga from presant and previous national sway= United Statas, 1971-1972 (1 2-74 yaars), 1966-1970
(12-17 yaars), and 19S0-19S2 (18-74 years).
21

for children in the present study. At least someif not all of the increase between the two surveyperiods may reflect the corrected acuity statusof these children at the time of the earliersurvey, since about 10 percent of the childrenwere known to have glasses or contact lenses.
Other Prevalence Estimates of Defective Acuity
In the three preceding national surveys, meas-ures of binocular acuity were obtained. Thismeasure was not included in the ophthalmologyexamination given in the present Health andNutrition Examination Survey because that partof the examination was concerned principallywith the detection of ocular pathology notpreviously attempted in the earIier surveys.
However, if the relationship between monoc-ular, better monocular, and binocular acuityfrom the preceding survey findings also were toexist in the target population for the presentstudy, the improvement in usual acuity levels ofthe adult population between the national esti-mates from the present study in 1971-1972 andthose from the 1960-1962 survey is even greaterfrom age 35 years on than that shown by thebetter monocular acuity (figure 14).
The estimate for those with usual binocularacuity less than 20/200 from the present studywould just slightly exceed the estimate of 0.2per 100 obtained from the better monocularacuity findings.
No measure of near visual acuity was obtainedin the present study. Consequently, it is notpossible to determine from these data the
proportion of the population who have bothdefective distance and near acuity. From the1960-1962 Health Examination Survey amongadults age 18-79 years there were 5.0 percentwith usual binocular distance acuity of less than20/40 and 9.1 percent with usual near acuity ofless than 14/28. This included 2.8 percent whohad at least that degree of visual defect at bothnear and distance or a total of 11.3 percent whohad that degree of defect at near or distance.
The trend with age for those with one or bothtypes of visual defect is similar to that fordefective distance acuity (table 14). It increasesslowly among young adults from 1.8 percent at18-24 years to 6.5 percent at 35-44 years. Thesharp increase at 45-54 years reflects the in-
crease in defective near acuity. The proportionthen increases steadily from 29.2 percent at45-54 years to 63.9 percent at 75-79 years.
SUMMARY
This report contains national estimates of thedistribution of monocular distance acuity withusual correction, if any, among the civiliannoninstitutionalized population age 4-74 yearsin the United States, based on findings from theophthalmologic examination in the Health andNutrition Examination Survey of 1971-1972.The findings for the usual acuity in the bettereye are analyzed by age, sex, race, ancestry,geographic region, population, size of place ofresidence, annual family income, and education.
For the first 35 examination locations of theHealth and Nutrition Examination Survey of1971-1972, a national probability sample of14,147 persons between the ages of 1 ancl 74years was carefully and scientifically selected torepresent the 192.7 million in the civiliannoninstitutionalized population of that agc inthe United States at the midsurvey time. The10,126 persons who came in for examinationrepresent 72.8 percent of the sample personsselected when adjustments are made for thedifferential sampling rates used in the age-, sex-,and income-defined population subgroups. Thevisual acuity measurements were obtained onthe 9,263 examinees over the age of 3 years.
Major findings from this study include:
●
●
●
Nearly three-fourths (72.8 percent) of theU.S. population 4-74 years of age havedistance visual acuity of at least 20/20 intheir better eye with their usual correction,if any. For these tests about one-third woretheir own glasses or contact lenses, andtwo-thirds were tested without correction.About 3 percent (3.3 percent) or &16million persons in the total 4-74-year agerange have usual acuity of 20/50 or less intheir better eye including 0.2 percent or0.21 million persons whose usual acuity isless than 20/200 in their better eye.Across the age range the proportion withvisual acuity in the better eye with usualcorrection, if any, of at least 20/20 in-creases steadily from 31.2 percent at age
22
4-5 years to a maximum of 87.6 percentamong young adults 18-24 years of age,levels off, and then declines from 45 yearson to 32.0 percent at age 65-74 years.
. Defective acuity of 20/50 or poorer (in thebetter eye with usual correction) decreasessteadily with age from 3.5 percent at 6-11years to 0.7 percent at 35-44 years thenincreases to a maximum of 14.1 percent atage 65-74 years.
. The trend with age is similar for males andfemales in the population but proportion-ately more males than females have acuityof at least 20/20 and fewer of 20/50 orless.
. Negro persons age 4-74 years have poorervisual acuity (better eye) with their usualcorrection, if any, than do white persons.Previous national surveys in which bothuncorrected and corrected acuities wereobtained for each examinee would indi-cate that this probably reflects differencesin the availability or utilization of eye carefor the two races. The greatest racialdifference in acuity is evident among theyoungest and oldest age groups (under 6years and 65-74 years).
. Children and youths under 18 years of agein the South generally have somewhatbetter usual acuity (better eye) than dothose in the other three geographic regionsof the country. The geographic pattern inthe distribution of visual acuity amongadults is less consistent than that forchildren and youths. The proportion ofadults with acuity 20/50 or poorer in thebetter eye with usual correction is con-
sistently Iower among those in the Midwestthan elsewhere across the 18-74-year agerange.
. Population size of place of residence is notcorrelated with visual acuity levels. Thedistribution of usual visual acuity amongpersons in rural areas is similar to thatamong persons in urbanized areas andurban places outside of urbanized areas.
. Both education and famiIy income show anassociation with usual visual acuity. Personsin families with the Iowest income andwhose household head has the least educa-tion have the highest proportion withdefective acuity (better eye with usualcorrection, if any), whiIe those in familieswith some college education and those inthe highest income level families have thelowest proportion with usual defectiveacuity.
. Comparison of the visual acuity findingsamong U.S. adults 18-74 years of age in1971-1972 with those from 1960-1962shows consistent improvement from 10years ago in the usual (better monocular)acuity levels for men from 35-74 years andfor women 25-74 years. Some improve-ment in acuity is also evident amongyouths 12-17 years of age in the presentstudy from comparable findings amongthat age group of the population from the1966-1970 National Health ExaminationSurvey. These trends probably reflect im-provement in eye care and in socioeco-nomic conditions as well as differences intesting methods and examiners in the vari-ous surveys.
000
23

1National Center for Health Statistics: Origin, pro-gram, and operation of the U.S. National Health Survey.Vital and Health Statistics. PHS Pub. No. 1000-Seriesl-No. 1. Public Health Service. Washington. U.S. Gover-nmentPrinting Office, Aug. 1963.
2Nation~ Center for He~th Statistics: plm adinitial program of the Health Examination Survey. Vitaland Health Strztktz”cs. PHS Pub. No. 1000-Series l-No. 4.Public Health Service. Washington. U.S. GovernmentPrinting Office, July 1965.
3National Center for Health Statistics: Cycle I of theHealth Examination Survey: Sample and response,United States, 1960-62. Vital and Health Statistics. PHSPub. No. 1000-Series 1l-No. 1. Public Health Service.Washington. U.S. Government Printing Office, Apr.1964.
4National Center for Health Statistics: Plan, oper-ation, and response results of a program of children’sexaminations. Vital and Health S tatrktics. PHS Pub. No.1000-Series l-No. 5. Public Health Service. Washington.U.S. Government Printing Office, Oct. 1967.
5National Center for Health Statistics: Plan andoperation of a Health Examination Survey of U.S.youths 12-17 years of age. Vital and Health Stattitics.PHS Pub. No. 1000-Series l-No. 8. Public HealthService. Washington. U.S. Government Printing Office,Sept. 1969.
6 Nation~ center for He~th Stattitics: p~, and
operation of the Health and Nutrition ExaminationSurvey, United States, 1971-1973. Vital and HealthStatistics. Series 1-Nos. 10a and 10b. DHEW Pub. No.(HSM) 73-1310. Washington. U.S. Government PrintingOffice, Feb. 1973.
7National Center for Health Statistics: A study of theeffect of remuneration upon ‘response in the Health andNutrition Examination Survey, United States. Vital andHealth Statistics. Series 2-No. 67. DHEW Pub. No.(HRA) 76-1341. Washington. U.S. Government PrintingOffice, Oct. 1975.
8 Sloan, L. L.: Measurement of visual acuity. Arch.Ophthalmol. 45:704-725, June 1951.
9 Sloan, L. L.; Rowland, W. M.; and Altman, A.:Comparison of three types of test target for themeasurement of visual acuity. Q. Rev. OphthalmoZ.8(1):4-16, Mar. 1952.
10 Radideau, G. F.: Differences in visual acuity meas-urements obtained with different types of targets.PsychoL itfonogr.69(10): 1-12, 1955.
11Westheimer, G.: Visual acuity. Ann. Rev. P~choL
16:359-380, 1965.12Jonkers, G. H.: The examination of the visual
acuity of children. Ophthalmologz”ca 136:140-144, Sept.1958.
13 Lippmann, O.: Vision screening of young children.Am. ]. Public Health. 61(8): 1586-1601, Aug. 1971.,
24

LIST OF DETAILED TABLES
Table 1.
2.
3.
4.
5.
6.
7.
8.
9.
10.
11.
12.
13.
14.
Percent distribution of the population age 4-74 years reaching specified acuity Iwels for usual distance vision in thebetter eye, according to age and sex, with standard errors for totals: United States, 1971-1972 . . . . . . . . . . . .
Number in the population age 4-74 years reaching specified acuity levels for usual distance vision in tha better eye,byageand sex: United States,1971-1972 . . . . . . . . . . . . . . . . . . . . . . . . . . . . . . . . . . . . . . .
Percent of the population age4-74 years reaching specified visual acuity Ievelsin the right, Ieft, and better eye, byageandsex: United Statas,1971-1972 . . . . . . . . . . . . . . . . . . . . . . . . . . . . . . . . . . . . . . . .
Percent distribution of the population age 4-74 years reaching specifid acuiWiwels forusual dis@ncevision in the&ttereye, according torace, age, andsex, with fiandard errors: Unitd States,l97l-l972 . . . . . . . . . . . . . .
Percent of the population age 18-74 years reaching at leaw20/20 ornobetier than 20/Wwith usual,tistance visualacui~in thektter eye, byancest~and race, with standard errors: United States, 1971-1972 . . . . . . . . . . . .
Percent of the population age 4-74 years reaching specified acuity levels for usual distance vision in the better aye, bygeographic region, age, race, andsex, with stindard errors: Unitd StaWs, l97l-l972 . . . . . . . . . . . . . . . . .
Percent of the popu Iation age 4-74 years reaching specified acuity levels for usual distance vision in the bettar eye, bysize ofplace ofresidence, age, race, andsex, with standard errors: United States, 1971-1972 . . . . . . . . . . . . .
Percent of the population age 4-74 years reaching specified acuity levels for usual distance vision in the better eye, byfamily income, age, race, and sex, with standard errors: United States, 1971-1972 . . . . . . . . . . . . . . . . . .
Percent of the population age 4-74 years reaching specified acuity levels for usual distance vision in the better eye, byeducation of head of household, age, race, and sex, with standard errors: Unitad States, 1971-1972 . . . . . . . . .
Percent of population age 18-74 years reaching specified acuity levels for usual distance vision in the better aye, byeducation of person, age, and sex, with standard errors: United States, 1971-1972 - . . . . . . . . . . . . . . . .
Percent distribution of adults age 18-74 years reaching specified acuity levels for usual distance vision in tha bettareye, according toage and sex: United States, 1960-1862 and 1971-1972 . . . . . . . . . . . . . . . . . . . . . . .
Percent distribution of youths age 12-17 years reaching specified acuity levels for usual distance vision in the bettareye, according to age and sex, with standard errors for totals: United States, 1866-1970 and 1971-1972 . . . . . . .
Percent distribution of children age 6-11 years reaching specified acuity Iwels for distance vision in the Wter aye,“without correction” and “with usual correction,” according to age and sex, with standard errors for totals: UnitedStates, 1963-1965 and 1971-1972.. . . . . . . . . . . . . . . . . . . . . . . . . . . . . . . . . . . . . . . . . .
Percent of adults age 18-79 years with defective binocular distance and/or near visual acuity with usual correction,byageandsex: Unitad States, 1960-1962 . . . . . . . . . . . . . . . . . . . . . . . . . . . . . . . . . . . . . . .
Page
26
27
28
29
33
34
40
43
*
56
57
E8
58
6U
25

Table 1. Percent distribution of the population aga4-74 years reaching specified acuity levelsfor usual distance vision in the better eye, acmrding to age and
Age and sex
Sax, with standard errors for totals: United States, 1971-1972
Acuity level–Snellen ratio—
20/1 o Womeor 20/1 5 20/20 20/25 20/30 20/40 20/50 20/70 20/100 20/200 20/400 than
better 20/400—
Both sexes Percent distribution
4-74yeara . . . . . . . . . . . . 0.0
0.1
0.0
0.1
12.7 S.o 3.2 1.5 1.0 0.4 0.2
0.20.30.7
0.20.30.4
0.2
0.1
0.0
0.1
0.0
0.10.5
0.0
0.1—.
0.0
0.00.00.20.4
0.0
2.4 70.4
30.471.579.583.480.382.770.154.631.3
72.4
35.273.882.183.579.584.773.855.830.9
68.5
25.569.276.383.181.180.666.553.631 (j
0.81.03.34.23.92.71.11.40.7
2.8
7.712.08.95.8
10.19.9
14.823.127.7
11.4
55.69.12.83.43.02.77.3
113.414.3
7.7
52.07.9‘1.94.42.4‘1.58.59.7
14.9
8.4
3.62.92.80.91.11.33.55.6
11.9
2.8
0.61.20.40.50.60.31.21.93.6
1.2
0.60.50.50.50.00.10.50.21.7
0.3
4-5 years .&11 years .12-17 vears18-24 years25-34 years3544 yaar545-54 years66-64 vears65-74 years
. . . . . . . . . . . .
. . . . . . . . . . . . .
. . . . . . . . . . . . .
. . . . . . . . . . . . .
. . . . . . . . . . . . .
. . . . . . . . . . . . .
. . . . . . . . . . . . .
. . . . . . . . . . . . .
. . . . . . . . . . . . .
0.51.61.50.50.90.31.32.07.3
1.2
Malea
4-74years . . . . . . . . . . . .
4-5years . . . . . . . . . . . ;..
&ll years..........,<. .12-17years . . . . . . . . . . . . .l%24yeara . . . . . . . . . . . . .25-34yeara . . . . . . . . . . . . .35-44years . . . . . . . . . . . . .45-54years . . . . . . . . . . . . .55-64years . . . . . . . . . . . . .65-74years . . . . . . . . . . . . .
1.01.24.55.04.33.21.31.10.6
2.0
0.50.92.23.43.52.21.01.70.8
7.510.77.54.6
11.66.5
10.623.027.1
13.9
3.22.51.70.80.81.62.75.2
13.0
3.6
0.11.61.00.10.40.11.62.06.3
1.8
0.91.71.90.71.20.61.12.08.0
0.90.20.50.1
0.5
2.0
0.6
0.1
0.5
0.1
1.80.50.41.00.40.93.14.2
0.6
0.30.21.1
0.1
0.3
0.2
0.1
0.10.2
0.1——
0.00.00.20.6
Females
4-74vears . . . . . . . . . . . .
59.310.4
3.6i!.53.63.86.2
11.1131.8
4-5years .&ll Yeara .12-17 yaarsl&24veers25-34 vears3S-44 vears4S54 Vears55-64 vears65-74veara
. . . . . . . . . . . . .
. . . . . . . . . . . . .
. . . . . . . . . . . . .
. . . . . . . . . . . . .
. . . . . . . . . . . . .
. . . . . . . . . . . . .
. . . . . . . . . . . . .
. . . . . . . . . . . . .
. . . . . . . . . . . . .
7.913.110.5
7.16.7
11.318.623.128.3
4.03.33.81.01.61.04,16.4
11.1
1.60.50.30.60.30.21.40.93,4
0.30.90.61.00.00.20.50.41.5
0.00.30.4
0.40.50.5
0.2
0.1
0.10.5
Standard error
Both sexea,4-74Vears . . . .
Meles.4-74years . . . . . . . . . .Femelee,4-74years . . . . . . . . .
26

Tabla2. Numbarin thepopulation age474yeam reaching specified acuiWlewls forusual distance vision inthebatter eye, byase and sex:
United States, 1971-1972
Acuity Iwels – Snellen ratio
20/1 o Worse
or 20/1 5 20/20 20125 20130 20/40 20/50 20170 20/100 20/200 20/400 than
twtter 20/400
Age and sex
Number in thousandsBoth sexes
1,904 811 425
4071
160
5647
51
214
105
3
17
8
9
67
32
101
10
2
6
30
54
30
4-74 yaars . . .
4-5yaars . . . . . .
&ll years . . . . .
12-17 years . . . .16-24 years . . . .
26-34 yaars . . . .
35-44 years . . . .45-54 years . . . .
55-64 years . . . .
65-74 years . . . .
Males
4-74 years . . .
4-5years . . . . . .
6-n years . . . . .
12-17 years . . . .
16-24 years . . . .
2534 years . . . .
3544 years . . . .
45-54 years . . . .
55-64 years . . . .
65-74 years . . . .
Females
4-74 years . . .
4-5years. . . . . .
&ll years . . . . .
12-17 years . . . .
16-24 years . . . .
25-34 years . . . .
3544 years . . . .
45-54 years . . . .
5564 years . . . .
6574 years . . . .
20
20
128,877
2,226
17*759
19,67318,001
20,715
19,913
16,431
10,190
3>69
64,085
23,279
564
2,966
2,210
1,264
2,588
2,387
3,482
4,284
3,523
10,129
14,655 5,866 2,8114,306
34
404362
105
222
79
312
367!
926
1,088
2
200
125
16
51
10
177
173
344
1,713
32
204
237
80
171
68
134
194
563
58
286
104
111
155
78
279
356
477
1,105
220
63
47
115
52
107
270
231
788
66
65
41
63
40
26
172
87
247
43
135
129
117
523
108
37
214
268
56258
825
899
997
655
266
259
93
2.442
4,066
2,269
682
735
775
6481,721
1,943
1,816
6,722
263
719681
193
291
310
811
1,0841,514
2,485
120
317
216
83
90
188
308
453
710
3,381
143
402
465
110
201
122
503
631
604
280
1,364
932
470
1,407
886
1,191
2,006
1,483
13,150
284
1,601
1,278
784
1,192
1,391
2,291
2,289
2,040
1,941
992
244
463
284
178
862
844
814
7,933
2,125
1,277
439
271
491
470
759
1,089
1,002
32
28
589
53
105
523
3
28
73
39
145
561
523
521
382
147
92
32
1,866
1,310
9,287
.10,270
8.797
9,562
9,976
8,330
4,876
1,687
64,782
916
8,472
9,404
9,204
11,152
9,937
8,101
5,314
2,282
10
7
13
7120
37
31
121
9
16
211
17
113
264376
476
273
118
168
61
12
106
71106
5
23
55
37
106
3
40
39
46
47
36
17
8
9
39
2
6
22
41
20
27

Table 3. Percent of the population age 4-74 years reaching specified visual acuity levels in the right, left, and better eye, by age andsex: United States, 1971-1972
Right eye Left eye Better eye—
20/20 20/25 20/30 20150 20120 20/25 20130 20/50 20/20 20/50or or or or or or or or or
betteror
better better worse better better better worse better worse
Age and sex
Both sexes Percent
4-74years . . . . . . . . . . . . .
4-5 Veals . . . . . . . . . . . . . . .
6-n Vears . . . . . . . . . . . . . . .12-17 years . . . . . . . . . . . . . .18-44Vears . . . . . . . . . . . . . .45-54years . . . . . . . . . . . . .55-64years . . . . . . . . . . . . . .65-74years . . . . . . . . . . . . . .
Males
64.6 88.7 6.4
2.65.73.73.46.7
13.222.8
6.5
66.0
28.768.778.478.860.647.3
23.8
68.1
80.2 89.4
91.090.892.294.388.983.063.2
90.5
78.8
35.880.888.188.477.168.147.1
79.7
40.483.089.887.176.571.144.0
78.1
5.9
3.45.14.53.26.48.5
22.1
5.1
72.8
31.272.582.885.771.256.032.0
75.2
3.3.—.—
27.766.578.276.760.446.023.0
66.5
92.990.492.294.685.779.363.2
89.3
36.780.587.890.179.271.848.7
81.7
1.93.52.71.53.24.7
14.1
2.9——
1,13.92.31.23.15.2
‘13.5
3.6
4-74years . , . . . . . . . . . . .
4-5Vears . . . . . . . . . . . . . . .6-n years . . . . . . . . . . . . . . .12-17years . . . . . . . . . . . . . .18-44years . . . . . . . . . . . . . .45-54years . . . . . . . . . . . . . .
55-64years . . . . . . . . . . . . . .65-74Vears . . . . . . . . . . . . . .
Females
4-74years . . . . . . . . . . . . .
4-5years . . . . . . . . . . . . . . .6-n years . . . . . . . . . . . . . . .12-17years . . . . . . . . . . . . . .18-44Vears . . . ., . . . . . . . . .45-54Vears . . . . . . . . . . . . . .55-64Vears . . . . . . . . . . . . . .65-74years . . . . . . . . . . . . . .
32.470.081.475.364.046.123.9
62.9
95.691.593.194.384.779.260.9
88.2
2.3
6.13.43.27.0
15.124.1
6.5
34.470.682.979.564.845.423.7
64.1
41.882.791.190.980.569.949.7
78.9
92.692.094.794.590.982.563.5
88.5
2.05.22.92.65.39.9
21.8
6.4
36.275.086.686.775.156.931.5
70.5
22.763.074.977.157.146.022.3
30.978.786.388.777.7
65.549.5
90.089.591.193.986.779.565.0
2.85.04.03.76.4
11.821.9
22.866.873.878.156.949.023.9
31.578.484.489.378.173.548.1
89.589,889.594.287.183.563.1
5.05.06.33.87.47.2
22.3
26.070.179.084.667.555.332.3
2.83.13.11.83,44.1
14.5
28

Table4. Percent distribution of the population age 4.74 years reaching specified acuity levels forusual distince vision inthe&ttar eye, according to ram,age, andsex, with standard errors: United States, 1971-1972
Age and sex
White
2017020/1 o
orbetter
0.0
0.1
I20/1 5 20/20 T20/25 20/30Worsethan
20/40020/50 20/1 00 20/200 20/40020/40
Percent distribution
3.1 1.4
1.81.30.20.90.21.42.16.7
1.2
1.0
0.61.10.30.50.60.41.11.63.4
1.2
8oth sexes . . . . . . . . . . 7.7 0.4~
0.40.60.60.30.00.10.20.01.6
0.2
0.2
0.20.20.9
0.20,20.3
0.3
0.0
0.0
0.10.2
0.0
2.3 71.3 12.5 0.1
0.0
0.1
0.0
0.6
0.0
4-5 years .&11 years .12-17 years1%24 years25-34 years35-44 years45-54 years55.64 years6S74 years
. . . . . . . . . . . . .
. . . . . . . . . . . . .
. . . . . . . . . . . . .
. . . . . . . . . . . . .
. . . . . . . . . . . . .
. . . . . . . . . . . . .
. . . . . . . . . . . . .
. . . . . . . . . . . . .
. . . . . . . . . . . . .
0.90.93.44.03.82.s1.31.40.8
2.7
33.074.580.683.981.283.470.355.232.4
73.1
8.010.2
8.15.99.39.5
15.023.528.6
11.3
53.98.62.63.52.92.57.4
10.113.6
7.3
3.22.12.90.71.21.43.15.8
11.8
2.7Males . . . . . . . . . . . . . .
4-5years . . . . . . . . . . . . . .&llyaara . . . . . . . . . . . . . .72-17vears . . . . . . . . . . . . .18-24years . . . . . . . . . . . . .25-34yaers . . . . . . . . . . . . .35-44years . . . . . . . . . . . . .46-54years . . . . . . . . . . . . .55-64vears . . . . . . . . . . . . .65-74years . . . . . . . . . . . . .
1.20.84.84.64.72.91.51.10.6
1.9
36.775.183.283.781.085.275.455.832.2
69.6
28.873.878.024.281.581.765.754.532.6
7.810.06.94.5
10.38.3
10.423.628.4
13.7
8.310.49.37.38.7
10.819.223.428.8
51.47.41.84.61.91.48.69.0
14.0
8.1
56.69.93.42.43.63.66.2
11.213.2
2.42.51.60.70.71.61.75.4
13.0
3.4
0.40.30.5
1.9
0.5
0.1
0.5
0.1
0.2
0.0
0.6
0.0
0.1
1.80.60.20.40.11.72.05.3
1.7
1.80.30.41.00.50.63.13.8
0.8
0.30.21.3
0.1
0.2
0.2
0.1
0.1
0.0
0.20.3
Females . . . . . . . . . . . . .
0.61.01.93.43.02.11.11.60.9
4.11.64.20.71.51.04.46.2
10.9
1.40.50.40.60.30.21.50.33.2
0.30.90.60.60.00.20.40.01.4
45years . . . . . . . . . . . . . .&llyeers . . . . . . . . . . . . . .12-17vears . . . . . . . . . . . . .l%24vaars . . . . . . . . . . . . .25-34yeers . . . . . . . . . . . . .3S44years . . . . . . . . . . . . .4564years . . . . . . . . . . . . .6!M4years . . . . . . . . . . . . .65-74vears . . . . . . . . . . . . .
1.91.80.21.30.41.22.27.5
0.30.4
0.30.40.5
29

Table4. Percent distribution of the populaticm age 4.74 years reaching specified acuity Ievels for usual distance vision inthebetter eye, according to race,
age, and sex, with standard errors: United States, 1971-1972-Con.
=
Age and sex
White
20/25 20/30 20/40 20/50 20/70 20/100 20/200 20/400I20/1 o
or 20/1 5
better
Worse
than
20/400
20/20
Standard error
0.32 0.17 0.13
0.48
0.32
0.15
0.28
0.34
0.28
0.46
0.66
0.51
0.22
0.67
0.25
0.48
0.72
0.49
0.49
1.49
0.73
0.12
1.03
0.34
0.12
0.33
0.13
0.21
0.76
0.24
0.66
Bmh sexes . . . . . . . . . . 0.01
0.08
0.51 1.09 0.87 0.07 0.02
0.05
0.06
0.02
0.19
0.02
0.02————
0.05
0.13
0.16
0.02——
0.10
0.14
0.03
0.48 0.12
4-5 years .
&11 years .
12-17 years
18-24 years
25-34 years
3%$4 years
45-54 years
55.84 years
65-74 years
. . . . . . . . . . . . 0.53
0.29
1.03
1.25
1.13
0.74
0.62
0.74
0.41
0.71
3.37
1,96
1.93
1.51
1.53
1.96
3.34
3.21
1.81
1.21
5.26
2.91
2.38
2.41
2.14
2.00
3.58
4.30
2.33
1.39
5.39
2.34
3.50
1.73
1.57
2.91
4.03
3.38
2.07
1,94
1.46
1.10
1.23
1,08
1,34
2.03
2,50
1.72
0.B9
2.06
1.87
1.02
1.30
2.11
1.90
2.31
3.94
2.45
0.82
3.10
0.74
0.61
0.99
0.80
0.83
1.82
1.74
1.29
0.63
5.25
1.70
0,70
1.69
0,99
0.85
2.21
2.67
1.38
0.70.—
5,03
1.70
0.92
0.92
1.12
1.42
1.88
2.27
1.89
1.14
0.53
1.12
0.32
0.41
0.51
0.99
1.45
1.41
0.32
0.27
0.35
0.31
0.25
0.02
0.11
0.14
0.01
0.66
0.11
0.79
0.56
0.13
0.44
0.13
0.47
0.74
1.27
0.20
0.19
0,18
0.51
0.14
0.24
0.16
0.13
. . . . . .. . . . . . . . . . .
. . . . . . . . . . .
. . . . . . . . . . . .. . . . . . . .
. . . . . . . . . . . .
. . . . . . . . . . . .
. . . . . . . . . . . .
Males . . . . . . . . . . . . .
4-5years .
611years .
12-17 years
18-24 years
25-34years
3!N4 years
45-54 years
55+4 years
6S74 years
. . . . . . . . . . . . .
. . . . . . . . . . . .
. . . . . . . . . . . . .. . . . . . . . .
. . . . . . . . . . .
. . . . . . . . . . . . .
. . . . . . . . . . .
. . . . . . . . . .
. . . . . . . . . . . .
0.81
0.19
1.61
1.57
2.04
0.90
0.91
1.10
0.48
0.35
1.23
0.98
0.55
0.59
0.52
0.93
0.90
1.54
1.62
0.48
0.40
0.24
0.42
1.12
0.18
0.09
0.24
0.030.02
1.23
0.44
0.17
0.31
0.10
0.73
1.29
1.24
0.27
0.37
0.24
0.97
0.10
0.15
0.07Females . . . . . . . . . . . . .
4-5 years .
S11 years .
12-17 years
18-24 years
2&34years
35-44years
45-54yeara
55-84 years
6574years
. . . . . . . . . . .
. . . . . . . . . . .
. . . . . . . . . . . . .
. . . . . . . . . . . .
. . . . . . . . . . .
. . . . . . . . . . . . .
. . . . . . . . . . . .
. . . . . . . . . . . . .
. . . . . . . . . . . . .
0.59
0.51
0.74
1.25
2.56
2.01
1.93
1.78
0.86
1.73
2.84
3.33
2.63
1.64 0.36
0.70
0.45
0.47
0.05
0.22
0.26
0.03
0.57
0.15
0.85
0.84
0.21
0.70
0.25
0.83
1.08
1.80
0.27
0.31
0.25
0.45
0.23
0.11
0.04
0.29
0.24
0.25
0.66
2.07
0.34
0.61
0.41
1.51
1.90
1.61
0.94
0.83
0.58
0.89
0.39
30

Table4. Percent distribution of thepopu[ation age 4-74 years reaching specified acuity levels for usual dietance vision inthebetter eye, according to rem,
age, and sex, with standard errors: United States, 1971-1 972-Con.
Negro
T20/40 20/5020/10
or
better
Age and sex Worse
than20/400
20/15 20/20 20/25 20/30 20/70 20/100 20/200 20/400
Percent distribution
4.4 2.0 1.4Both sexes . . . . . . . . . . 0.0 2.6 63.2 14.7 10.0 1.1 0.3
0.10.6
0.50.61.0
0.1
0.1
0.2
0.70.3
0.0
0.2
4-5yeare . . . . . . . . . . . . . .Gll years . . . . . . . . . . . . . .12-17 years . . . . . . . . . . . . .13-24 years . . . . . . . . . . . . .2S34years . . . . . . . . . . . . .35-44years . . . . . . . . . . . . .4H4years . . . . . . . . . . . . .55-84years . . . . . . . . . . . . .65-74years . . . . . . . . . . . . .
13.253.874.681.373.573.866.951.618.9
66.2
6.222.014.6
5.115.213.913.720.516.2
13.1
67.612.5
3.01.84.34.66.7
12.121.6
9.0
5.97.62.21.81.01.56.56.5
13.5
4.1
9.72.52.61.21.12.3
11.62.3
13.5
4.7
3.40.71.72.40.71.20.50.8
13.9
1.4
1.71.20.90.40.6
2.32.57.2
1.9
2.0020.22.1
2.72.52.7
1.1
0.1
1.92.25.14.64.7
1.70.2
3.0
0.10.20.52.5
0.1Males . . . . . . . . . . . . . .
4-5years .&ll years .12-17 years
1S24 years25-34 years35-44 years45-54 years65+4 years65-74 years
. . . . . . . . . . . .
. . . . . . . . . . . . .
. . . . . . . . . . . . .
. . . . . . . . . . . . .
. . . . . . . . . . . . .
19.864.678.384.869.274.860.562.817.0
60.9
5.816.011.4
4.420.911.411.917.114.6
16.0
59.511.3
1.40.95.83.27.4
11.524.5
10.8
0.50.61.3
0.8
0.61.7
14.9
2.4
4.7
0.30.6
4.4
3.0
1.10.0
0.2
3.22.87.81.48.3
0.3
2.3
1.81.60.30.8
3.63.28.9
1.0
0.3
1.5
0.4
0.8
0.1
1.11.3
0.3
. . . . . . . . . . . . .
. . . . . . . . . . . . .
. . . . . . . . . . . . .
. . . . . . . . . . . . .
Females . . . . . . . . . . . . .
45years . . . . . . . . . . . . . .Gll years . . . . . . . . . . . . . .12-17years . . . . . . . . . . . . .18-24years . . . . . . . . . . . . .25-34years . . . . . . . . . . . . .3544years . . . . . . . . . . . . .45-54years . . . . . . . . . . . . .55-64years . . . . . . . . . . . . .65-74vears . . . . . . . . . . . . .
8.843.371.078.577.673.473.043.020.4
6.427.917.85.69.9
15.015.423.320.9
73.113.74.62.72.85.36.0
12.719.4
3.312.4
1.82.30.91.11.69.7
13.4
5.40.82.04.40.51.80.4
13.0
2.80.80.20.40.4
1.01.95.9
0.20.40.23.3
1.04.42.5
0.61.62.67.7
3.0
2.80.4
0.10.8
1.11.00.6
0.3
1.2
0.10.5
3.5
31

Table4. Percent distribution Of the population age 4-74 years reaching specified acuity Ievels for usual distance vision inthebetter eye, according to race,
age, andsex, with standard errors: lJnited States, 1971-1972-Con.
=
Negro—
20/10 worse
or 20/1 5 20/20 20/25 20/30 20/40 20/50 20/70 20/1 00 20/200 20/400 than
better 2014100.
Age and sax
Standard error
Bothsexes . . . . . . . . . .
45years . . . . . . . . . . . . .
&ll years . . . . . . . . . . . . .
12-17 years . . . . . . . . . . . .
lB-24years . . . . . . . . . . . .
2S34years, . . . . . . . . . . .
3544years . . . . . . . . . . .
4554years . . . . . . . . . . . .
55-64years . . . . . . . . . . . .
65-74years . . . . . . . . . . . .
Males . . . . . . . . . . . . .
45years . . . . . . . . . . . . .
&llyears . . . . .
12-17years . . . . . . . . . .
l&24years . .
2534years .
3544years . . . . .
45-54years . . . . . . .
5544years. . . . . . . . . . . . .
65-74years . . . . . . . . . . . .
Females . . . . . . . . . . . . .
45years . . . . . . . . . . . . .
6-n years . . . . . . . . . . . . .
12-17years . . .
lB-24years . . . . . . . . . .
25-34years . . . . . . . . . . . . .
3544years . . . . . . . . . . .
45-5-4years . . . .
55-64years . , . .
6574vears . . . . . . . . . . . .,
0.01
0.08
0.82 1.05 0.48 0.10 0.06 0.121.63 0.64 0.26 0.25 0.40
3.90
5.13
4.02
4.12
4.20
5.40
5.34
8.29
3.80
2.97
7.84
5.97
4.94
8.26
6.4.5
9.93
7.30
9.16
3.88
1.97
2.63
3.95
3.31
2.07
2.89
3.34
2.34
7.04
2.90
2.42
5.64
1.79
1.36
0.78
1.65
1.65
2.66
3.64
2.29
0.90
8.14
2.77
0.70
0.87
3.33
2.12
5.04
7.02
5.10
0.6B
2.26
2.28
1.11
0.92
0.77
0.77
3.18
2.81
2.33
1.02
4.70
1.90
1.88
0.97
1.25
1.59
5.90
1.61
2.54
1.13
2.47
0.36
0.66
1.56
0.52
0.72
0.37
0.50
1.50
0.23
0.52
0.48
0.83
0.94
0.62
1.20
3.83
0.40
1.39
0.63
0.82
0.18
-0.42
1.77
1.11
2.12
0.47
0.88
1.66
0.33
0.86
3.38
3.44
3.78
0.22
1.98
0.15
0.17
1.44
2.22
1.55
1.11
0.67
0.92
0.93
2.65
2.72
2.38
1.49
0.24
1.29
2.20
1.26
5.28
1.01
7,27
0.36
0.81
0.08
0.36
0.40
0.59
0.36
0.07
0.20
0.69
0.19
0,02
10.1010.17
(3.48
:2.05
(0,09
3.78
4.55
4.67
2.94
5.42
5.26
4.23
7.38
2.49
1.57
4.80
0.28
0.82
4.39
1.75
0.570.02
0.35
0.74
0.17
0.45
0.09
‘1.14
0.73
1).21——
[0.16
(0.33
3.68
4.4.3
6.37
5.45
3.30
5.15
5.41
5.B5
10.B5
4.92
3.64
4.44
5.21
2.33
3.03
5.09
4.25
8.82
4.47
7.31
3.31
2.51
1.15
0.66
1.96
1.98
4.7B
3.29
1.61
5.15
0.89
1.24
0.53
0.43
1.13
4.80
3.48
4.10
0.55
1.21
2.57
0.25
1.05
0.42
3.50
2.28
0.62
0.24
0.26
0.27
1.06
1.71
1.15
0.22
0.31
0.20
2.25
0.95
2.89
1.07
0.48
0.78
1.35
4.29
1.86
2.60
0.42
0.17
0.15
0.60
0.81
0.99
0.47
0.30
1.25
32

Table5. Percent of thepopulation age18-74 years reaching at least 20/200r no better than 20/50with usual distance visual acuity in
the better eye, by ancestry and race, with standard errors: United States, 1971-1972
Better usual monocular acuity
and ancestry
20/20 or better
Spanish, Mexican’ . . . . . . . . . . . . . . . . . .
Chinese, Japanese . . . . . . . . . . . . . . . . . .
American lndian2 . . . . . . . . . . . . . . . . . . .
All other . . . . . . . . . . . . . . . . . . . . . . .
20/50 or poorer
Spanish, Mexican l . . . . . . . . . . . . . . . . . .
Chinese, Japanese . . . . . . . . . . . . . . . . . .
American lndian2 . . . . . . . . . . . . . . . . . .
All other . . . . . . . . . . . . . . . . . . . . . . .
Total in population . . . . . . . . . . . . . . . .
Spanish, Mexican’ . . . . . . . . . . . . . . . . . .
Chinese, Japanese . . . . . . . . . . . . . . . . . .
American lndianz . . . . . . . . . . . . . . . . . .
All other . . . . . . . . . . . . . . . . . . . . . . .
Race, 1B-74 years
Percent
68.3
50.3
72.2
73.7
7.5
1.1
8.9
3.3
Ilncludespuemo Rican immigrants.
2Living off reservations.
68.3
73.6
74.1
7.6
6.2
3.0
70.0
6.0
●69.2
63.5
*52.3
86.2
*1.3
*47.7
* 0.6
Number in thousends
122,404 108,453 13,000 951
5,685 5,615 70587 123 464
1,588 1,463 105114,544 101,232 13,000 312
Standard error
5.0516.446.071.40
1.761.664.570.35
...
...
...
...
...
5.03
6.921.38
1.80
4.500.35
...
...
...
...
...
3.0
3.5
*27.2411.60
*32.333.46
●1.74*32.33*0.64
,.. . . .
. . . . . .
. . . . . .
. . . . . .
. . . . . .
●Figure does not meet standards of reliability or precision usually set for these reports.
33

Table 6. Percent of the population age 4-74 years reaching specified acuity levels for usual distance vision in the better eve. bv qeoaraDhic reaion...- ---age, r“ace,and sex, -with standard e;rors: United States, 1971-1972
20/20 or better I 20125-20140 I 20/50 or worse
Age, race,l and sex
Both sexes Percent
4-74 years . . . . . . .
All races, 4-5 years . . .
White . . . . . . . . . . . . .
Negro . . . . . . . . . . . .
All races, 6-11 years .
White . . . . . . . . . . . . .Negro . . . . . . . . . . . .
All races, 12-17 years . .
White . . . . . . . . . . . . .Negro . . . . . . . . . . . .
All races,18-44years . . .
white . . . . . . . . . . . . .Negro . . . . . . . . . . . .
All races, 45-54 years .
White . . . . . . . . . . . . .Negro . . . . . . . . . . . .
Allraces,55-64 years . . .
White . . . . . . . . . . . . .
Negro . . . . . . . . . . . .
All races, 65-74 years . . .
white . . . . . . . . . . . . .Negro . . . . . . . . . . . .
73.9
36.5
72.5
42.7
5’[ .3
15.5
78.0
71.7
15.7
23.8
7
24.2
54.7 83.5
48.7 83.3
73.9 85.7
20.1 25.4TFF
3.0 2.7 3.7 4.1
2.5 1.7 2.6 0.8
2.3 1.0 - 0.8
3.7 8.0 10.6 -
72.8
27.5
24.2.—.—
70.0.—
68.2
92.5
23.4
61.8
29.5
3.8
73.1
75.948.7
84.1
38.4
13.5
69.6
75.1
32.8
81.3
15.9
14.3
69.6
68.675.0
80.4
60.6
78.5
24.9.—
22.4
46.7
25.4 2.0 I 5.0 ] 1.9 1 5.0
1.7 5.4 2.2 5.3
4.6 3.0 1.1 2.0
83.3
64.4
86.5
19.5
64.2
14.5 26.1
34.5 23.0
12.0 17.1 3.3 3.6 1.5 2.5
3.0 3.7 0.8 2.1
5.8 3.1 3.7 0.8
1.1 1.0 1.4 2.3
1.0 1.1 1.1 2.3
2.6 1.8 2.3 4.7
2.9 2.0 3.9 4.9
2.9 1.8 2.9 3.9
3.1 2.1 6.8 17.1
4.7 1.4 6.7 6.8
4.3 1.3 4.7 6.28.4 2.5 8.9 7.0
13.0 8.2 19.5 13.6
12.4 8.8 16.5 13.2
25.0 9.7 38.9 16.1
12.6 15.1
85.871.1
87.5
88.0
74.5
76.4
81.480.3
86.7
87.2
78.0
74.5
88.18 ‘1.8
85.9
82.368.7
84.1
11.223.1
14.916.6
11.1 15.614.5 30.5
12.7 13.611.4 12.3
85.9
85.3
65.1
83.7
79.8
67.7
11.022.9
11.720.2z13.0 14.0
12.4 15.5
31.0 27.4
32.4 25.828.8 35.6
41.6 32.2
41.7 29.6
32.6 54.5
52.5 49.9
20.7 23.5
23.2
27.675.0
85.4
46.6
75.0
70.3
61.0
64.7
64.4
51.7
70.347.3
61.0
22.111.5
48.7.—
48.0
45.8
37.6
47.7
45.8
32.5
60.9
65.2
34.1
53.6
58.5
28.0
64.2
38.5
36.5
37.8
32.3
54.5 57.7
32.1
11.7
32.6
35.8
30.4
15.1
37.9
22.7
55.5
63.3
58.6
54.5
53.1 I 48.9
46.0 61.2
lRates forall races incl.de other than white and Ne9ro.
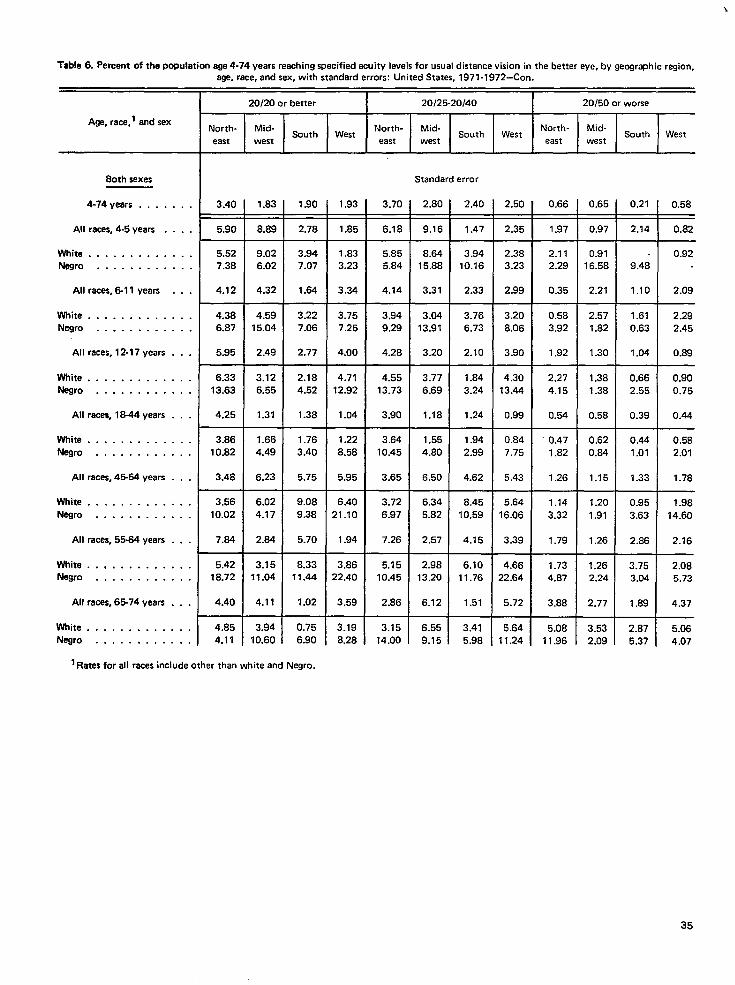
Table 6. Peraent of the population age 4-74 years reaching specified acuity levels for usual distance vision in the better eye, by geographic reqion.age, rece, andsex, with standard errors: United States, 1971-1972-Con.
20/20 or better 20125-20140 20[50 or wocse
North- Mid-South West
North- Mid-South West
North- Mid-
east westSouth
eastWest
west east west
Age, race,’ and sax
Standard errorBoth sexes
4-74years . . . . . . .
All races, 4-5 years . . . .
White . . . . . . . . . . . . .
Negro . . . . . . . . . . . .
Allreces,6-11 years . . .
White . . . . . . . . . . . . .Negro . . . . . . . . . . . .
Allraces, 12-17 years . . .
White . . . . . . . . . . . . .
Negro . . . . . . . . . . . .
Allreces, 16-44years . . .
White . . . . . . . . . . . . .
Negro . . . . . . . . . . . .
All races,4&54 years . . .
White . . . . . . . . . . . . .
Negro . . . . . . . . . . . .
Allraces, 55-64 years . . .
White . . . . . . . . . . . . .
Negro . . . . . . . . . . . .
Allraces,6574 years . . .
White . . . . . . . . . . . . .Negro . . . . . . . . . . . .
3.40 I 1.83 3.70
6.18
2.80
9.16
2.50 0.66
2.35 1.97
2.38 2.113.23 2.29
2.99 0.35
3.20 0.58
8.06 3.92
3.90 1.92
4.30 2.27
13.44 4.15
0.99 0.54
0.84 0.477.75 1.82
5.43 1.26
5.64 1.14
16.06 3.32
3.39 1.79
4.66 1.7322.64 4.87
5.72 3.88
5.64 5.0811.24 11.96
0.21 0.58
2.14 0.82
0.929.48 -
1.10 2.09
1.61 2.29
0.63 2.45
1.04 0.89
0.66 0.902.55 0.75
0.39 0.44
0.44 0.58
1.01 2.01
1.33 1.78
0.95 1.98
3.63 14.60
2.86 2.16
3.75 2.08
3.04 5.73
1.68 4.37
2.87 5.06
5.37 4.07
1.90
2.78
1.93
1.85
2.40
1.47
3.94
10.16
2.33
0.65
0.97
0.91
16.58
2.21T5.90 8.S8
5.52 9.02
7.38 6.02
4.12 4.32
4.38 4.596.87 15.04
5.95 2.49
3.947.07
1.64
1.83
3.23
3.34
5.855.84
8.64
15.88
4.14 3.31
3.227.06
2.77
3.757.25
4.00
3.94
9.29
3.0413.91
3.76
6.73
2.10
2.57
1.82
1.304.28 3.20
6.33 3.1213.63 6.55
4.25 1.31
3.86 1.66
10.82 4.49
3.46 6.23
3.56 6.02
10.02 4.17
7.84 2.84
5.42 3.1518.72 11.04
4.40 4.11
4.85 3.94
4.11 10.60
2.18
4.52
1.38
1.76
3.40
5.75
4.71
12.92
1.04
4.55
13.733.77
6.69
1.84
3.24
1.24
1.94
2.99
4.62
1.38
1.38
0.583.90
3.64
10.45
1.18
1.55
4.80
1.22
8.58
5.95
0.62
0.84
1.15
1.20
1.91
1.26
3.65 6.50
9.08
9.38
5.70
6.40
21.10
1.94
3.72
6.97
6.34
5.82
8.45
10.59
4.167.26 2.57
8.3311.44
1.02
3.8622.40
3.59
5.1510.45
2.98
13.206.10
11.76
1.51
3.41
5.98
1.262.24
2.772.86 6.12
6.55
9.15
0,75
6.90
3.19
8.28
3.15
14.003.53
2.09
1Rates for aII rwes include other than white and Ne9r0.
35
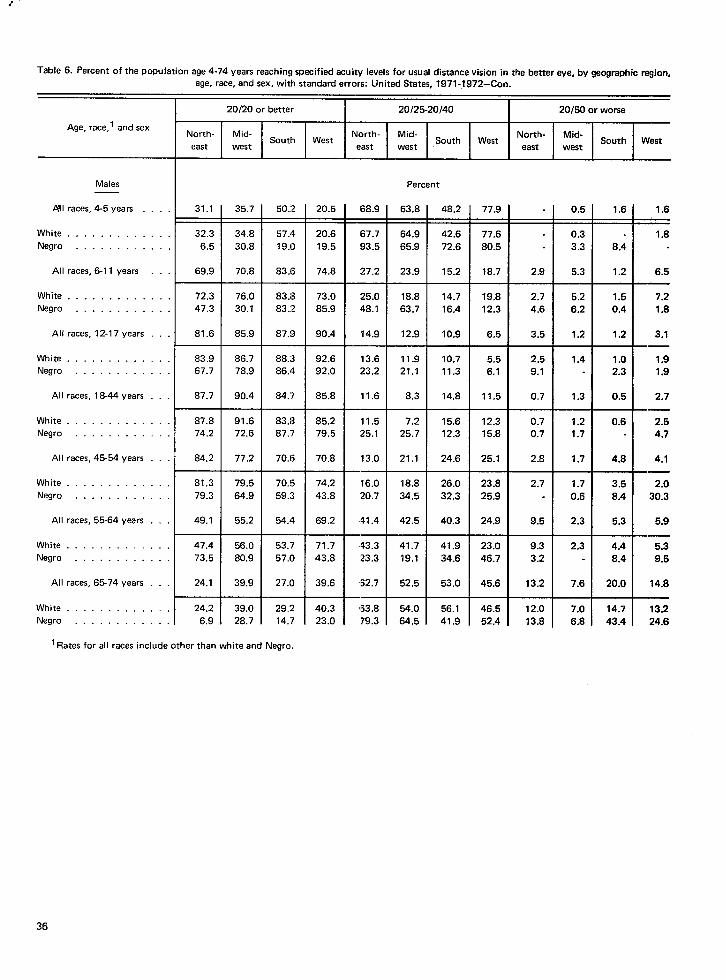
Table 6. Percent of thepopulation age4-74years reaching specified acuit\, Ievelsfor usual distance vision inthebetter eye, by geographic region,
age, race, and sex, with standard errors: United States, 1971-1972–Con.
20/20 or better I 20125-20/40 I 20/50 or worse
Age, race,l and sexNorth- Mid-
South WestN(]rth- Mid-
,South WestNorth- Mid-
east west east westSouth West
east west
Males
All races, 4-5 years .
Percent
‘m
68.9 63.8 48.2 77.9=
167.7 64.9 42.6 77.6
!93.5 65.9 72.6 80.5
27.2 23.9 15.2 18.7
31.1 50.2
57.4
19.0
83.6
20.5
20.6
19.5
74.8
0.5 1.6 1.6
0.3 - 1.8
3.3 8.4 -
2.9 5.3 1.2 6.5
2.7 5.2 1.5 7.2
4.6 6.2 0.4 1.8
3.5 1.2 1.2 3.1
2.5 1.4 1.0 1.9
9.1 - 2.3 1.9
0.7 1.3 0.5 2.7
0.7 1.2 0.6 2.5
0.7 1.7 - 4.7
2.8 1.7 4.8 4.7
2.7 1.7 3.5 2.0
0.6 8.4 30.3
9.5 2.3 5.3 5.9
9.3 2.3 4.4 5.3
3.2 - 8.4 9.5
13.2 7.6 20.0 14.8
12.0 7.0 14.7 13.2
13.8 6.8 43.4 24.6
35.7
34.8
30.8
70.8
White . . . . . . . . . . . . .
Negro . . . . . . . . . . . .
32.3
6.5
All races, 6-11 years . . 69.9
White . . . . . . . . . . . . .Negro . . . . . . . . . . . .
72.3
47.3
76.0
30.1
85.9
83.8
83.2
87.9
88.3
86.4
84.7
73.0
85.9
90.4
25.0
48.1
18.8
63.7
14.7 19.8
16.4 12.3
All races, 12-17 years . 81.6 14.9——
13.6
23.2
12.9
t
10.9 6.5
70.7 5.511.3 6.1
White . . . . . . . . . . . . .
Negro . . . . . . . . . . . .83.967.7
86.778.9
90.4
92.6
92.0
85.8
11.9
21.1
-t
14.8 11.5
15.6 12.312.3 15.8
All races, 16-44 years . 87.7 11.6 8.3
white. . . . . . . . . . . . .Negro . . . . . . . . . . . .
87.874.2
91.6
72.6
77.2
79.5
64.9
55.2
56.0
80.9
39.9
83.8
87.7
70.6
85.279.5
70.8
74.2
43.8
69.2
11.5:25.1
7.2
25.7
-t-
24.6 25.1
26.0 23.8
32.3 25.9
All races, 45-54 years . . . 84.2
81.3
79.3
13.0——
16.0
20.7
21,1
whit e. . . . . . . . . . . .Negro . . . . . . . . . . . .
70,5
59.3
54.4
53.7
57,0
27.0
18.8
34.5
All races, 5564 years . . 49.1
47.4
73.5
42.5 40.3 I 24.9,41.4
White . . . . . . . . . . . . .
Negro . . . . . . . . . . . .
71.7
43.8
39.6
43.3
:23.3
41.7
19.1
41.9 23.0
34.6 46.7
All races, 6574 years . . 24.1 (62.7 52.5 53.0145.6
White . . . . . . . . . . . . .
Negro . . . . . . . . . . . .
24.2
6.9
39.0
28.7
29.2
14.7
40.3
23.0IB3.8
I54.0 56.1 I 46.5
79.3 64.5 41.9 52.4
lRates forall races include other than white and Ne9r0.
36

Table 6. Percent of thepopulation age4-74years reaching spmified muiwlevels forusual dismnce vision inthebetier we. bvqemra~hicreaion.age, race, and sex, wi;h standard errors: United States, 1971-1972—Con.
---- -.
20/20 or better 20/25-20140 20150 or worse
North- Mid-South West
North- Mid-South West
North- Mid-South
east west eastWest
west east west
Age, race,l and sex
Males Standard error
4.61
5.09
7.27
6.09
6.672.19
1.93
1.06
5.24
1.54
1.59
21.47
5.67
9.17 5.26
12.73 5.87
14.04 7.27
2.98 5.29
4.82 5.64
4.67 3.04
2.43 1.87
3.05 1.41
1.30 5.48
1.49 1.60
2.03 0.65
6.31 13.05
2.90 4.69
9.22 4.40
13.43 30.38
4.83 5.06
6.37 4.438.34 24.15
4.48 4.82
4.92 5.29
6.09 15.95
0.33 I 1.60 I 1.73Allraces,4-5 years . . . . 8.71 9.87 10.60
8.82 10.10 12.73
9.47 23.31 12.07
5.49 4.37 2.57
6.74 4.90 4.00
16.16 10.66 4.55
6.31 1.99 2.31
6.20 2.94 2.50
17.19 12.36 1.83
5.73 1.73 1.30
5.71 2.12 1.45
24.73 9.11 6.31
4.32 7.20 5.92
8.71
8.82
9.47
5.T7
5.9616.86
4.99
4.59
16.54
5.75
5.82
24.29
5.62
9.94
10.04
21.32
3.73
3.95
9.37
1.05
2.25
12.36
1.16
1.48
10.19
8.24
White . . . . . . . . . . . . .Negro . . . . . . . . . . . .
0.31
8.24 9.08
1.96
0.69
1.214.41
1.97
2.20
6.51
0.79
0.73
0.99
2.07
2.03
2.45
6.55
1.20 3.84Allraces,6-11 years . . .
1.54
0.54
4.34
2.22White . . . . . . . . . . . . .Negro . . . . . . . . . . . .
1.57 ] 0.86 / 1.09Allraces, 12-17 years . . .
white.............Negro . . . . . . . . . . . . 1.47 1.61
0.83 0.49 0.72Allraces,l&44years . . .
m3white. . . . . . . . . . . . .Negro . . . . . . . . . . . .
1.55 I 3.13 1.59All races, 45-54 years . . .
White . . . . . . . . . . . . .
Negro . . . . . . . . . . . .
5.24
41.05
6.28 10.93
13.22 9.905.42
30.05
7.60
6.42
41.05
6.91
7.4214.49
6.02
2.13
5.59
1.67 2.14
5.13 5.96
1.53
25.36
All races, 55-64 years . . . 7.47 6.81 I 6.45 2.44 I 3.81 I 3.86
2.41 3.768.80
3.647.10
White . . . . . . . . . . . . .Negro . . . . . . . . . . . .
6.5017.92
7.0134.69
7.7213.88
6.6930.85
4.81
5.09
8.20
4.3017.57
5.75
5.65
9.26
6.2816.59
5.53
6.06
11.92
5.382.16
6.67
6.29
7.61
All races, 65-74 years . . . 4.45
4.80
8.83
3.10
3.72
11.49
3.34
2.98
6.00
3.73
3.53
4.65
2.35 3.31
3.93
8.40white. . . . . . . . . . . . .Negro . . . . . . . . . . . .
3.15
7.96
lRates f~rall races include other than white and Ne9r0.
37

Table 6. Percent of thepopulation age4-74years re~hing W~ified acuiWlevels forusual distance vision inthebetter eye, by geographic region,age, race, and sex, with standard
20/20 or better
I 1 I
vclrs: United States, 1971-1972—Con.=
20/25-20/40 20/50 or worse—
Age, race,l and sexNorth- 1Mid- 1South IWest INorth- 1Mid-
east ISouth IWestwest east west
North- 1Mid- 1South IWesteast west
1 1 I 1 I I— I I I I
Females Percent
All races, 4-5 years . . . .
White . . . . . . . . . . . . .Negro . . . . . . . . . . . .
All races, 6-11 years .
White . . . . . . . . . . . . .
Negro . . . . . . . . . . . .
All races, 12-17 years . .
White . . . . . . . . . . . . .
Negro . . . . . . . . . . . .
Allraces, 18-44yaars . .
White . . . . . . . . . . . . .Negro . . . . . . .
All races, 45-54 years . .
White . . . . . . . . . . . . .Negro . . . . . . . . . . . .
All races, 55-64 years . . .
White . . . . . . . . . . . . .Negro . . . . . . . . . . . .
All races, 65-74 years .
white.. . . . . .Negro . . . . . . . . . .
24.6
27.1
2.8
77.0
59.7 64.7 4.4 3.0 I 4.037.3 31.3
40.3
12.3
71.2
11.6
11.8
10.7
64.0
71.0-—
68.6
92.2
22.1
88.4
88.2
89.3
32.7
32.5
37.9
26.3
24.2
47.7
15.4
42.54.9
68.8
55.684.8
26.3
59.775.0
26.1
4.3
5.0
0.9
1.9 -
10.3 12.7
4.9 2.7 3.3
80.3
50.2
87.1
88.1
77.0
87.3
74.5
34.3
76.7
76.1
81.7
82.9
82.6
44.2
85.1
87.9
78.1
86.9
64.1
59.9
71.8
73.6
52.3
82.6
19.3
45.2
9.8
8.3
23.0
11.2
20.0
64.5
17.3
14.3
54.1
13.1
0.4
4.6
3.1 I5.5 3.1
1.2 1.7
6.0 1.8
6.0 0.6
6.1 4.9
0,8 2.2
1.0 1.61.9 4.2
2.3 3.1
3.42.2
1.9.—
2.2
2.0
17.9
12.2
16.3
11.5
17.0
10.9
3.6
1.5
88.174.6
70.3
70.0
88.6
44.8
82.783.7
71.1
69.3
75.1
68.0
87.683.4
60.1
60.0
70.1
49.0
82.379.9
64.8
66.8
51.8
54.6
10.621.9
26.7-—
26.9
6.7
53.8.—
51.4
77.4
47.9
16.314.4
26.6
10.812.4
36.8
15.515.3
29.7
27.7
48.2
37.9
1.3
3.5
3.0
2.24.8
5.5
28.8
21.4
31.7
37.6
25.0
42.9
3.1
4.7
1.4
1.9 2.4
3.5 4,9
0.3 8.1
5.6
7.5
6.8
5.9
12.7
47.9
7.0
39.3
66.7
58.2
30.1
53.4
59.9
28.8
58.5
36.1
33.9
33.3
38.2
61.3
41.7
30.7
52.0
34.7
58.0
53.4
0.7
15.6
12.8
4.9
3.6 9.4
8.6 19.2
10.0 17.6
11.4 35.1
38.5
15.3
28.1
39.9
31.215.4
36.0
22.4
48.8
51.6
61.948.7
51.2
49.5
50.9
67.8
12.7
33.113.1
9.8
lRate~ f~rall races include other than white and Negro
38

Table6. Percent of thepwulation ~e4-74yeam reaching spwified muitylevels forusual diswncevision inthebetter eye, by geographic region,age, race, andsex, with standard errors: United States, 1971 -1972–Con.
20/20 or better I 20125-20/40 I 20/50 or worse
Age, race, 1 and sexNorth- Mid-
South WestNorth- Mid-
east westSouth West
east west
North- 1Mid- 1South Westeast west
Females
All races, 4-5 years . . . .
White . . . . . . . . . . . . .Negro . . . . . . . . . . . .
Allraces,6-11 years . . .
White . . . . . . . . . . . . .
Negro . . . . . . . . . . . .
Allraces, 12-17 years . . .
White . . . . . . . . . . . . .Negro . . . . . . . . . . . .
Allraces, 18-44years . . .
White . . . . . . . . . . . . .Negro . . . . . . . . . . . .
All races, 45-54 years . . .
White . . . . . . . . . . . . .
Negro . . . . . . . . . . . .
Allraces, 55-64 years . . .
White . . . . . . . . . . . . .Negro . . . . . . . . . . . .
All races, 6&74 years . . .
White . . . . . . . . . . . . .
Negro . . . . . . . . . . . .
Standard error
3.73
4.45
2.68
3.23
3.56
3.05 R2.49 3.76 -
2.16 - -
21.61 10.45
2.60 2.22 0.68
3.00 3.16 0.59
2.00 1.11 2.91
13.39
12.63
24.80
4.04
13.38
16.44
13.86
1.92 2.42 0.79
5.15 4.95 6.70 1.96 5.377.49 19.55 10.04 19.16 9.83
6.45 5.40 5.33 6.93 4.76
3.3318.69
5.95
5.519.73
4.84
1.86
19.91
0.45
3.71
1.14 I 1.46 I 1.276.61 2.22
7.08 6.19 4.89 7.62
11.62 5.39 8.03 14.545.39
11.626.624.09
2.88
3.08
2.60
7.96
4.82
6.60
1.93
2.46
3.07
7.14
7.15
14.54
2.58 1.24 0.56 1.40
2.11 3.70 -
0.44 0.90 0.283.27
2.64
6.70
1.33
1.47
8.66
0.70
0.65
2.73
1 I
0.71 0.92 0.25
1.03 1.85 2.46
1.87 0.87 2.805.25I
7.43 I 6.74I
8.53 5.56 8.14 2.05
1.98 1.49 2.87
2.62 3.31
0.34 3.40 2.34
4.64 8.44 8.35 9.08 5.33
7.25 9.97 12.14 16.29 4.81
9.72 6.25 5.37 7.55 8.91
9.26
11.56
6.35
8.69
10.09
4.63
8.68
16.29
2.03
4.73
8.00 1.26
7.83 7.11 10.55 6.22 7.12
5.57 24.13 13.87 24.48 10.33
4.73 5.92 1.41 2.99 3.36
7.1126.91
7.71
7.5317.92
3.97
7.46
32.170.83
13.775.77 2.46
3.07 5.44 5.22
3.52 3.48 5.907.22 2.19
5.56 I 5.18 I 2.83 I 2.05 I 3.33
6.90 19.38 9.51 11.78 18.59
7.71
19.41
6.88
6.04
6.65
14.27
4.52
16.35
4.41 4.67 6.41
5.63 5.97 4.70
lRatesfOr allraces include other than white and Negro.
39

Table7. Percent of the copulation age4-74vears reaching specified acuity Ievels for usual distance vision in the better eye, by size of place of
residence, age, race, and;ex, with standard errors: United States, 1971-1972
20/20 or better 20150 or worsa
=:
Standard error
1.73 1.65 1.16 0.37 0.76 0.35~
4.11 13.17 4.49 0.98 4.27 0.52
Age, race,l end sex Non-
urban-ized
Rural
Both sexes
4-74 years . . . . . .
All races, 4-5 years . . .
White . . . . . . . . . . . . .Negro . . . . . . . . . . . . .
All races, 6-11 years . . .
White . . . . . . . . . . . . .Negro . . . . . . . . . . . . .
Allraces, 12-17 years . . .
White . . . . . . . . . . . . .Negro . . . . . . . . . . . . .
Allracas, 18-44years . . .
White . . . . . . . . . . . . .Negro . . . . . . . . . . . . .
Allraces,45454y ears . . .
White . . . . . . . . . . . . .Negro . . . . . . . . . . . . .
Ail races, 55-64 years . . .
White . . . . . . . . . . . . .Negro . . . . . . . . . . . . .
All races, 65-74 years . . .
White . . . . . . . . . . . . .
Negro . . . . . . . . . . . . .
Percent
T
73.1 3.5
26.8 2.1
28.7 1.96.1 3.4
73.9 3.8
+
3.6 3.0
5.5 0.5
72.4
35.4
73.2
28.5
4.29 16.46 4.90 1.13 1.70
4.05 15.14 3.66 2.42 24.29 7.53
2.44 4.86 2.64 1.14 0.80 1.79
39.4
14.0
7i.5
30.121.3
73.1
1.722.2 5.9
3.42.3
2.46 5.67 3.16 1.48 0.98 2.03
6.43 14.59 7.28 1.26 1.24 1.10
2.69 3.26 2.39 0.68 1.28 1.13
76.051.4
82.2
75.059.9
64.9
74.7 4.1
65.4 2.7
63.0 2.8
2.41.8
3.61.2
2.1 2.8
83.477.4
84.7
88.1
65.7
86.4
83.4 2.678.5 1.9
86.8 1.8
86.8 1.786.3 2.7
70.3 2.8
72.2 2.848.5 2.6
54.9 3.6
55.3 3.843.6 8.3
29.7 15.9
0.516.9
2.92.8
2.64 3.30
5.72 16.93
2.79 0.99 0.5911.16 0.60 11.87
1.162.05
2.2 I 0.8 1.55 I 1.51 0.34
1.81
I1.70
3.05 11.3785.679.8
71.2
87.277.6
72.7
1.96.6
0.81.1 0.56
-t-t
5.37 0.74 2.54
5.63 0.66 2.8711.38 1.14 -
5.90 0.90 2.86+
4.01 4.94
4.44 6.894.33 22.18-=-t-
3.3 3.9
3.7 2.618.9
1.25
71.172.1
54.6
72.475.6
54.7
10.52
4.9 5.8 2.95 I 4.34 2.06
3.02 4.63 6.26 0.97 2.80 2.4110.65 20.28 13.61 2.27 4.93 6.86
3.31 4.68 3.35 2.39 3.61 2.72
3.42 5.04 3.04 2.93 4.30 2.695.73 12.97 7.06 6.30 20.41 5.19
55.549.0
29.4
54.5
59.5
34.0
4.5
6.2
4.8
15.2
13.1 I 11.5
29.8
25.0
35.7
14.9
30.9 I 16.0
11.9 25.312.9 I 11.2
34.0 30.6
lTOtal~ include races other than whita and Negro.
40

Table7. Percent of the population age 4-74 years reaching specified acuity Ievelsfor usual distance vision inthebatter eye, by size of place of
residence, age, race, andsex, with standard errors: United States, 1971-1972–Con.
20/20 or batter 20150 or worse 20120 or better 20/50 or worse
Age, race,l and sex Non- Non- Non- Non-
Urban urban- Rural Urban urban- Rural Urban urban- Rural Urban urban- Rural
ized ized ized ized
Males Percent Standard error
I74.4 3.1 3.1 3.2 1.72 3.59
28.5 0.3 6.7 - 5.01 12.39
30.2 0.2 3.4 - 5.51 15.228.6 1.1 19.9 - 9.19 25.79
75.2 4.4 3.8 3.1 3.95 6.01
74.7 4.6 4.1 3.6 4.70 7.2376.7 3.4 1.9 - 8.68 19.32
87.2 2.1 2.0 2.7 2.24 6.20
86.8 1.3 - 2.8 2.00 5.1668.3 1.9 29.0 2.3 6.97 36.93
86.9 1.6 0.4 0.9 2.10 4.01
4-74years . . . . . . .
FF
76.0 73.4
All races, 4-5 years . . . . 44.9 28.6
whit e . . . . . . . . . . . . 47.2 27.4Negro . . . . . . . . . . . . . 20.5 33.2
1.40 0.48 0.86 0.45
0.21 4.238.55
0.191.12
3.3319.42
9.%5.88
2.90Allraces, &ll years . . . .
tt
74.5 75.6
white . . . . . . . . . . . . . 76.6 76.6N&J-o . . . . . . . . . . . . . 64.7 65.5
3.86
4.56
5.92
1.07
1.401.61
2.06
2.282.30
3.32
Allraces, 12-17 years . . .
t-t
86.4 85.6
~ite . . . . . . . . . . . . . 88.3 91.0Negro . . . . . . . . . . . . . 80.6 50.9
2.31 1.11 2.31 1.05
0.871.11 31.22
1.122.20
2.71
3.75
Allraces, 18-44 years . . .
1+
86.6 86.4
WMte . . . . . . . . . . . . . s8.0 86.8Negro . . . . . . . . . . . . . 77.4 81.4
2.05 0.59 0.28 0.59
w86.6 1.7 0.1 0.968.3 0.8 3.6 0.8
75.6 2.6 1.8 4.4
79.2 2.9 2.1 1.8
38.4 0.3 - 31.1
53.5 3.9 5.3 6.7
2.54 4.78
5.46 28.950.700.61
0.145;25
0.610.88
2.124.66
Allraces,4H4y ears . . .
tt
75.5 73.0
White . . . . . . . . . . . . . 76.4 73.5
Negro . . . . . . . . . . . . . 68.3 69.7
t
4.25 10.05
3.92 14.6610.79 27.01
5.91
5.5011.80
1.15
1.30
0.45
2.15 2.44
1.44
20.16
2.80
t+
Allrwes,65-64 years . . . 58.4 51.2
~ite . . . . . . . . . . . . . 56.3 50.9Negro . . . . . . . . . . . . . 67.5 57.4
4.13 I 7.58 8.OU 2.00 4.80 3.66
54.2 4.6 4.7 6.8 4.84 8.1742.2 3.9 12.2 10.9 10.74 32.03
8.2817.27
1.682.06
4.91 3.8513.73 11.42
Aliraces,65.74years . . .
H-
28.2 32.6
mite . . . . . . . . . . . . . 28.9 34.7Negro . . . . . . . . . . . . . 19.6 17.9
31.2 I 12.9 I 17.7 I 13.1 I 4.o7 I 3.28 2.97 6.47 I 2.585.42
3.49 I 8.07 2.7810.17 20.43 7.34
32.6 I 11.6
I
17.3
I
11.5 I 4.16 5.127.3 29.1 32.6 42.3 6.08 18.01
5.244.63
1To~IS include races other than white and Ne8rc
41.

Table7. Percent of the population age4-74 years reaching specified acuity leval.s for usual distance vision in the better eye, by size of piactsof
residence, aga, race, andsex, with standard errors: United States, 1971 -1972 –Con.
Age, race,l and sex
Females
4-74year3 . . . . . .
All races, 4-5 years . . . .
Whita . . . . . . . . . . . . .Negro . . . . . . . . . . . . .
Allraces,6-11 years . . . .
White . . . . . . . . . . . . .Negro . . . . . . . . . . . . .
All races, 12-17 years . .
White . . . . . . . . . . . . .Negro . . . . . . . . . . . . .
Allraces, 18-44 years . .
white . . . . . . . . . . . . .Nag. . . . . . . . . . . . .
All races, 45-54 years . . .
White . . . . . . . . . . . . .Negro . . . . . . . . . . . . .
Allraces,55-84 years .
white . . . . . . . . . . . . .Negro . . . . . . . . . . . .
Allraces,65-74 years . . .
white . . . . . . . . . . . . .Negro . . . . . . . . . . . . .
Percent
69.1
26.2
30.711.0
68.7
75.3
39.0
77.3
77.773.6
83.0
83.281.3
67.6
66.574.9
51.5
73.1 71.8 3.9 4.1=
28.4 25.0 3.9 4.1
32.9 27.0 3.7 -5.2 3.3 4.4 25.3
69.7 72.5 3.3 0.3
72.7 74.7 3.6 -W?.6 53.0 2.0 1.6
84.3 79.1 3.7 2.1
85.7 80.3 4.1 1.073.1 70.4 2.0 10.9
86.4 86.8 1.9 3.8
87.6 87.1 1.6 3.474.2 82.7 3.9 9.3
72.4 65.2 3.0 5.1
71.2 65.6 2.8 5.494.0 60.5 4.1
58.0 56.3 3.4 4.6
2.8=
1.0
12.5
3.6
3.72.4
3.0
3.03.2
0.7
0.61.4
3.4
3.44.4
4.8
53.338.3
30.2
30.428.7
57.9 56.4 3.2 4.461.5 46.7 10.9
2.921.7
!&la&&E
Standard error
1.95 1.54 1.71 0.42 0.77 0,51*
5.13 17.72 8.51 1.97 5.43 11,11—
6.82 20.75 9.25 2.36 -6.29 5.20 3.37 3.36 35.08 14.38
2.19 8.99 3.13 1.44 0.26 2,15—
2.67 10.95 4.13 1.85 - 2,447.04 20.80 9.61 1.47 1.60 1.95
4.63 4.94 4.05 1.10 1.42 1.45
4.97 5.66 4.45 1.38 1.10 ‘1.516.84 15.44 18.18 0.78 9.59 2.45
4.85 6.38 6.59 1.14 3.79 ‘1.53—
6.13 6.84 7.24 1.30 3.88 ‘1.855.50 25.62 17.21 1.76 - 4.57
3.70 8.87 5.92 1.16 2.52 ‘1.84—
4.04 9.21 6.37 1.49 2.44 2.9313.39 32.31 19.86 4.08 - 13.74
lTotais include racas other than white and Negro.
42

Table8. Percent of thepopulation age4-74 years reaching specified acuity levels forusual distance vision inthebetter eye, by family
income, age, race, andsex, with standard errors: United States, 1971-1972
Age, race,’ and sex
Both sexes
4-74years . . . . . . . .
All races, 4-5 years . . . . .
White . . . . . . . . . . . . . .
Negro . . . . . . . . . . . . . .
Allraces,6-11 years . . . . .
White . . . . . . . . . . . . . .
Negro . . . . . . . . . . . . . .
Allraces, 12-17 years . . . .
White . . . . . . . . . . . . . .
Negro . . . . . . . . . . . . . .
Allraces, 18-44 years . . . .
White . . . . . . . . . . . . . .
Negro . . . . . . . . . . . . . .
Allraces,4554 years . . . .
White . . . . . . . . . . . . . .
Negro . . . . . . . . . . . . . .
Allraces, 55-64 years . . . .
White . . . . . . . . . . . . . .
Negro . . . . . . . . . . . . . .
Allraces,6&74years . . . .
White . . . . . . . . . . . . . .
Negro . . . . . . . . . . . . . .
20120 or better 20125-20/40 20/50 or worse
Under $5,()(30. $’:;? Under $5,000- $’:;?
$5,000 $9,999 $5,000 $9,999Under $5,000 $’:;@Jo
over$5,000 $9,999
over over
Percent
60.1 70.5 79.5 32.3 26.2 18.8 7.6 3.3 1.7
25.0 26.5 37.1 71.8 73.0 62.1 3.1 0.5 0.9
28.3 29.3 38.2 71.7 70.1 60.9 0.5 0.9
19.7 7.2 5.3 71.9 92.2 94.7 8.4 0.6
67.0 65.4 79.5 27.4 31.9 17.0 5.6 2.7 3.5
71.8 68.9 79.9 21.0 28.2 16.5 7.2 2.9 3.5
57.4 45.6 69.2 39.5 52.7 28.7 3.1 1.7 2.0
75.3 80.5 86.3 20.2 17.6 11.3 4.5 1.9 2.4
72.2 81.8 87.1 22.1 16.2 11.0 5.7 1.9 1.9
78.8 73.9 81.6 18.3 24.2 11.8 2.9 2.0 6.7
83.3 84.2 88.2 13.9 14.0 11.0 2.8 1.9 0.8
84.1 84.3 88.8 13.5 14.0 10.3 2.4 1.7 0.9
82.0 83.6 75.9 14.0 73.7 23.9 3.9 2.7 0.2
56.6 64.1 78.1 32.2 31.5 20.9 11.2 4.4 1.0
53.6 64.9 78.0 37.0 30.2 21.0 9.3 4.9 1.0
63.6 58.7 80.2 20.3 40.1 19.5 16.1 1.2 0.3
45.7 56.4 59.5 45.9 37.0 39.5 8.4 6.6 1.1
46,2 57.3 58.5 45.7 36.7 40.5 8.1 6.0 1.0
43.3 57.5 83.1 46.6 37.4 13.5 10.0 5.1 3.4
29.1 37.2 35.5 54.2 50.8 55.8 16.6 12.0 8.8
30.7 37.6 36.3 54.3 51.3 55.1 15.0 11.1 8.6
17.9 29.4 3.3 54.7 41.6 81.8 27.4 29.0 14.9
lTotal~ include races other than white and Negrch
43
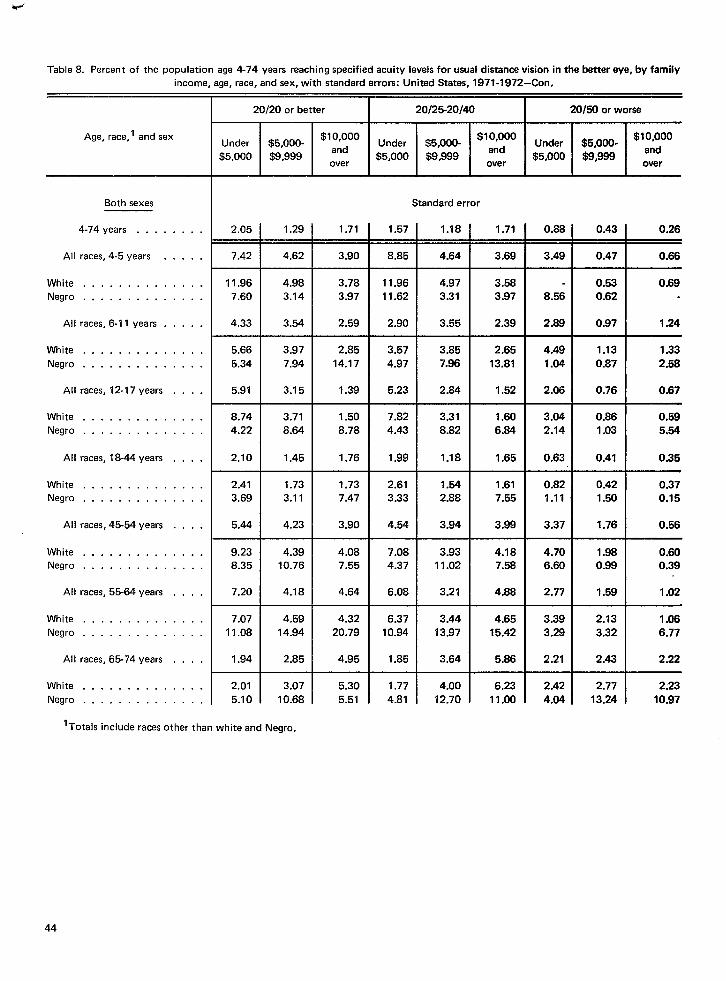
9.+
Table8. Percent of the population age 4-74 years reaching specified acuity levels forusual distance vision inthebetter eye, by family
income, age, race, andsex, with standard errors: United States, 1971-1972—Con.
Age, race,’ and sex
20/20 or better I 20/25-20/40 I 20160 or worse
$10,000and
over
$10,000andover
Under $5,000-
$5,000 $9,999Under
$5,000$5,000-$9,999
Both sexes
4-74 years . . . . . . . .
All races, 4-5 years . . . . .
White . . . . . . . . . . . . . .
Negro . . . . . . . . . . . . . .
Allraces,6-11 years . . . . .
White . . . . . . . . . . . . . .
Negro . . . . . . . . . . . . . .
All races, 12-17 years . . . .
White . . . . . . . . . . . . . .
Negro . . . . . . . . . . . . . .
All races, 18-44 years . . . .
White . . . . . . . . . . . . . .
Negro , . . . . . . . . . . . . .
All races,45-54 years . , . .
White . . . . . . . . . . . . . .
Negro . . . . . . . . . , . . . .
Allraces,55-64years . . . .
White . . . . . . . . . . . . . .
Negro . . . . . . . . . . . . . .
Allraces,65-74years . . . .
White . . . . . . . . . . . . . .
Negro . . . . . . . . . . . . . .
Stendard error
1.71 0.88 0.43
3.69 3.49 0.47
2.05 I 1.29 1.71 1.57 1.18 0.26
8.857.42 I 4.62 3.90 4.64 0.66
+
11.96 4.987.60 3.14
4.33 3.54
5.66 3.97
5.34 7.94
5.91 3.15
3.783.97
2.59—.
2.8514.17
1.39
11.9611.62
2.90
3.57
4.97
5.23
4.973.31
3.55
3.857.86
2.84
3.58 -3.97 8.56
0.530.62
0.69
1.24
t
2.39 2.89
2.65 4.4913.81 1.04
0.97
1.13
0.871.332.58
0.671.52 I 2.06 0.76
1.60 3.046.84 2.14
0.861.03
1.508.78
1.76
7.824.43
1.99
2.613.33
4.54+
8.74 3.714.22 8.64
2.10 1.45
2.41 1.733.69 3.11
5.44 4.23
3.318.82
1.18
0.595.64
0.35
t
1.65 0.63
1.61 0.827.55 1.11
0.41
1.73
7.47
3.90
1.54
2.88
3.94
0.421.50
0.370.15
0.56
t
3.99 3.37
4.18 4.707.58 6.60
1.76
9.23 4.398.35 10.76
7.20 4.18
4.087.55
4.64
3.9311.02
3.21
1.980.99
7.084.37
6.08
0.600.39
1.024.88 I 2.77 1.59
7.07 4.5911.08 14.94
1.94 2.85
4.3220.79
4.95
6.3710.94
1.85
3.4413.97
3.64
4.65 3.39 2.1315.42 3.29 3.32
5.86 2.21 2.43
1.066.77
2.22
6.23 I 2.42 2.77
11.00 4.04 13.24
2.01 3.07
5.10 10.685.305.51
1.77
4.81
4.00
12.702.23
10.97
lTotals include races other than white and Ne9r~.
44
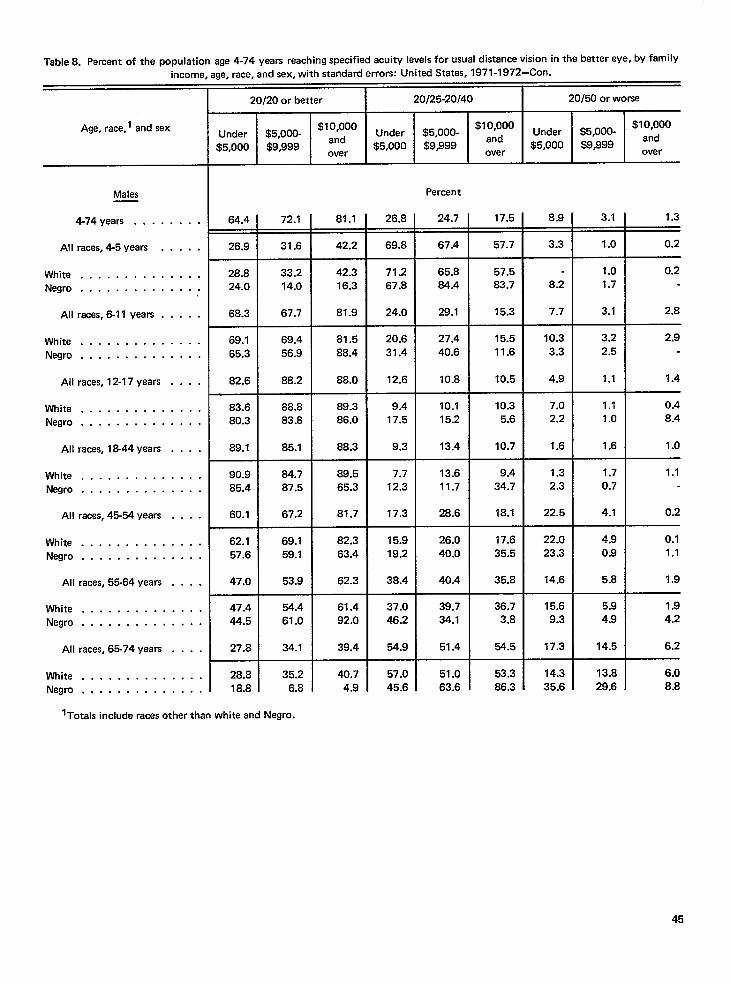
Table8. Percent of thepopulation age 4-74 years reaching specified acuity levels forusuaI distance vision inthebetter eye, by familyincome, age, race, andsex, with standard errors: United States, 1971 -1972 —Con.
Age, race,’ and sex
Males
4-74years . . . . . . . .
All races, 4-5 years . . . . .
White . . . . . . . . . . . . . .Negro . . . . . . . . . . . . . .
Allraces,6-11 years . . . . .
White . . . . . . . . . . . . . .Negro, . . . . . . . . . . . . .
Allraces,12-17years . . . .
White . . . . . . . . . . . . . .Negro . . . . . . . . . . . . . .
Allraces, l&44years . . . .
White . . . . . . . . . . . . . .Negro . . . . . . . . . . . . . .
Allraces,45-54 years . . . .
White . . . . . . . . . . . . . .Negro . . . . . . . . . . . . . .
Allraces,55-64 years . . . .
White . . . . . . . . . . . . . .Negro . . . . . . . . . . . . . .
Ailraces,65-74 years . . . .
White . . . . . . . . . . . . . .Negro . . . . . . . . . . . . . .
20/20 or better 20/25-20140 20150 or worse
Under $5,000-$10,000
Under $5,000- $’:;00 Under $5,000- $’:;00$5,000 $9,999
and$5,000 $9,999 $5,000 $9,999
over over over
Percent
64.4 I 72.1
T26.9 31.6
28.8 33.224.0 14.0
68.3 67.7
69.1 69.465.3 56.9
82.6 88.2
83.6 88.880.3 83.8
89.1 85.1
90.9 84.785.4 87.5
60.1 67.2
62.1 69.157.6 59.1
47.0 53.9
4-47.4 54.444.5 61.0
27.8 34.1
28.8 35.218.8 6.8
81.1 26.8 24.7 17.5 8.9 3.1 1.3
42.2 69.8 67.4 57.7 3.3 1.0 0.2
42.3 71.2 65.8 57.5 1.0 0.216.3 67.8 64.4 83.7 8.2 1.7
81.9 24.0 29.1 15.3 7.7 3.1 2.8
81.5 20.6 27.4 15.5 10.3 3.2 2.988.4 31.4 40.6 11.6 3.3 2.5
88.0 12.6 10.8 10.5 4.9 1.1 1.4
89.3 9.4 10.1 10.3 7.0 1.1 0.486.0 17.5 15.2 5.6 2.2 1.0 8.4
88.3 9.3 13.4 10.7 1.6 1.6 1.0
89.5 7.7 13.6 9.4 1.3 1.7 1.165.3 12.3 11.7 34.7 2.3 0.7
81.7 17.3 28.6 18.1 22.5 4.1 0.2
82.3 15.9 26.0 17.6 22.0 4.9 0.163.4 19.2 40.0 35.5 23.3 0.9 1.1
62.3 38.4 40.4 35.8 14.6 5.8 1.9
61.4 37.0 39.7 36.7 15.6 5.9 1.992.0 46.2 34.1 3.8 9.3 4.9 4.2
39.4 54.9 51.4 54.5 17.3 14.5 6.2
40.7 57.0 51.0 53.3 14.3 13.8 6.04.9 45.6 63.6 86.3 35.6 29.6 8.8
lTOta[s include races other than white and Ne9r0.
45
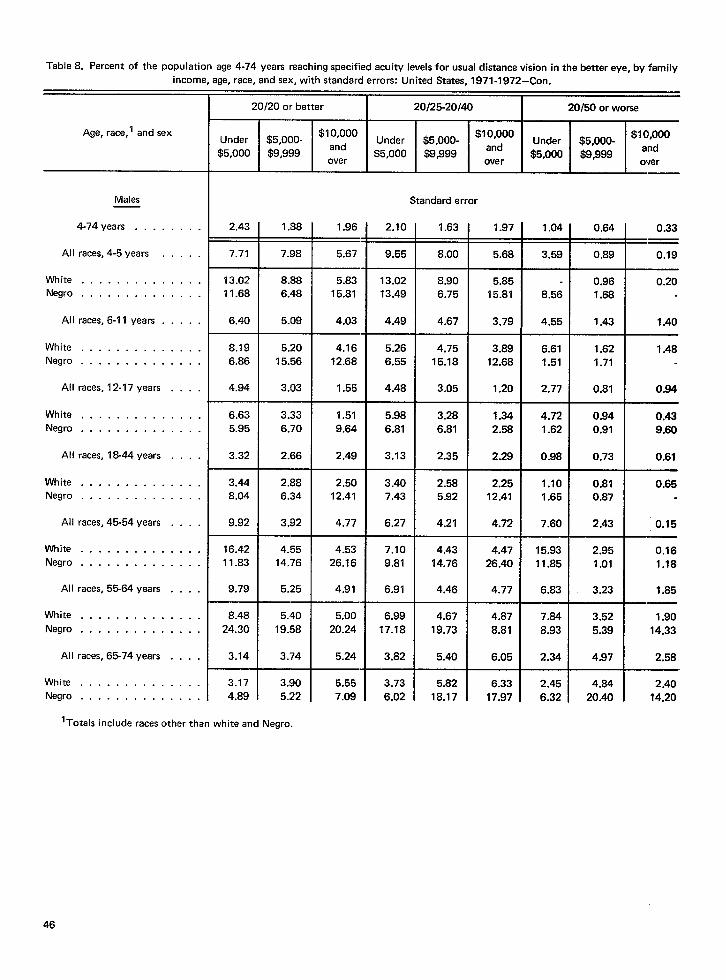
Table8. Percent of the population age 4-74 years reaching specified acuity levels forusual dismnce vision inthebetier eye, by family
income, age, race, and sex, with standarcl errore: United States, 1971-1972–Con.
20/20 or better 20/25-20/40 20/50 or worse
Age, race,l and sexUnder $5,000- $’:;y Under $5,000- $’:;00
$5,000 $9,999Under $5,000- $’:;y
$5,000 $9999over over
$5,000 $9,999over
Males Standard error
4-74years . . . . . . . .
F
2.43
All races, 4-5 years . . . . . 7.71
2.10
9.55
1.63
8.00
1.97 1.04 0.64 0.33
5.68 3.59 0.89 0.19
5.85 0.96 0.20
15.81 8.56 1.68
White . . . . . . . . . . . . . .r13.02
Negro . . . . . . . . . . . . . . 11.68
8.88 5.83
6.48 15.81
13.02
13.49
8.90
6.75
4.67Allraces,6-11 years . . . . .
t
6.40
White . . . . . . . . . . . . . . 8.19
Negro . . . . . . . . . . . . . . 6.86
t
5.09 4.03
5.20 4.16
15.56 12.68
4.49 3.79 I 4.55 ] 1.43 I 1.40
3.89
12.68
6.61
1.51
1.62 I 1.485.26
6.55
4.75
15.18
3.05
1.71 IAllracesr 12-17 years . . . .
F
4.94
White . . . . . . . . . . . . . . 6.63
Negro . . . . . . . . . . . . . . 5.95
t
3.03 1.55—
3.33 1.51
6.70 9.64
4.48 1.20 2.77
t-
0.81 0.94
0.94 0.43
0.91 9.60
5.98
6.81
3.28
6.81
2.35
1.34
2.58
4.72
1.62
All races, 18-44 years . . . .
F
3.32
White . . . . . . . . . . . . . . 3.44
Negro . . . . . . . . . . . . . . 8.04
t
2.66 2.49.
2.$8 2.50
6.34 12.41
3.13 2.29 0.98 0.73 1 0.61
3.40
7.43
2.58
5.92
4.21
2.25 1.10 0.81 0.65
12.41 1.65 0.87
4.72 7.60 2.43 0.15All races,45-54 years . . . .
t--
9.92
white . . . . . . . . . . . . . . 16.42
Negro . . . . . . . . . . . . . . 11.83
3.92 I 4.77 6.27
4.55 4.53
14.76 26.16
7.10
9.81
4.43
14.76
4.46
4.47
I15.93 2.95 I 0.16
26.40 11.85 1.01 1.18
4.77 6.83 3.23 I 1.85All races, 5564 years . . . .
t
9.79
White . . . . . . . . . . . . . . 8.48
Negro . . . . . . . . . . . . . . 24.30
5.25 ] 4.91 6.91
5.40 5.00
19.58 20.24
6.99
17.18
4.67
19.73
5.40
4.87 7.64 3.52 1.90
8.81 8.93 5.39 14.33
All races, 65-74 years . . . . 1 3.14 3.74 ] 5.24 3.82 6.05 I 2.34 I 4.97 I 2.58
3.90 I 5.55
5.22 7.09
6.33 2.45 4.84 I 2.40
17.97 6.32 20.40 14.20
white . . . . . . . . . . . . . . I 3.17
Negro . . . . . . . . . . . . . . 4.89
3.73
6.02
5.82
18.17
lTotals include races other than white an
46

Table8. Percent of thepopulation age 4-74 years reaching specified acuiWlevels forusuai distance vision inthebetier eye, by family
income, age, race, andsex, with standard errors: United States, 1971-1972—Con.
Age, race,’ and sex
Females—.
4-74years . . . . . . . .
All races, 4-5 years . . . . .
White . . . . . . . . . . . . . .
Negro . . . . . . . . . . . . . .
Allracesr 6-11 years . . . . .
White . . . . . . . . . . . . . .
Negro . . . . . . . . . . . . . .
Allraces, 12-17 years . . . .
White . . . . . . . . . . . . . .
Negro . . . . . . . . . . . . . .
Allraces,18-44years . . . .
White . . . . . . . . . . . . . .
Negro . . . . . . . . . . . . . .
Allraces,4S54years . . . .
White . . . . . . . . . . . . . .
Negro . . . . . . . . . . . . . .
AHraces,5%64years . . . .
White . . . . . . . . . . . . . .
Negro . . . . . . . . . . . . . .
Allracas,65-74years . . . .
White . . . . . . . . . . . . . .
Negro . . . . . . . . . . . . . .
20/20 or better 20/25-20/40 20150 or worse
Under $5,000- $’:;00 Under $5,000- $’:;y Under $5,000-$10,000
$5,000 $9,999 $5,000 $9,999 $5,000 $9,999and
over over over
Percent
57.0 69.0 77.8 36.3 27.6 20.2 6.7 3.4 $ 2.0
23.5 20.9 31.5 73.6 79.1 66.8 2.9 1.7
27.9 24.6 33.5 72.1 75.4 64.7 - 1.8
15.2 3.5 76.2 96.5 100.0 8.6
65.1 63.2 77.2 32.1 34.5 18.7 2.8 2.2 4.1
75.6 68.5 78.4 21.5 29.0 17.5 2.9 2.5 4.1
47.9 37.3 54.1 49.3 61.6 42.3 2.8 1,2 3.6
68.9 73.5 84.3 26.9 23.8 12.2 4.2 2.7 3.5
62.8 74.9 84.7 32.5 22.3 11.8 4.7 2.8 3.5
77.2 68.0 74.7 19.2 29.5 21.4 3.6 2.5 3.9
79.3 83.3 88.1 17.1 14.5 11.3 3.6 2.2 0.6
79.0 83.9 88.1 17.8 14.4 11.2 3.2 1.8 0.7
80.0 80.3 85.6 15.1 15.3 14.1 4.9 4.3 0.3
54.9 61.4 73.8 39.1 33.9 24.2 6.0 4.7 2.0
50.8 61.7 72.7 44.1 33.4 25.2 5.1 4.9 2.1
69.7 57.9 87.1 21,4 40.2 12.9 8.9 1.9
45.2 58.9 56.1 49.2 33.5 43.9 5.7 7.5
45.7 60.3 54.9 49.7 33.6 45.1 4.6 6.1
42.9 53.8 46.0 46.8 40.9 54.0 10.3 5.2
30.0 40.0 32.0 53.8 50.2 56.9 16.2 9.s 11.1
31.9 39.8 32.5 52.5 51.5 56.7 15.5 8.7 10.8
17.2 44.4 61.4 27.0 72.7 21.4 28.6 27.3
lTOtals include races other than white and Negro.
47

Table8. Percent of the population age4-74yeam reaching specified acuity levels forusual distance vision inthebe~er eye, byifamily
income, age, race, andsex, with standard errors: United States, 1971-1972-Con.
20/20 or better 20/25-20/40 20150 or worse
Under $5,000-$10,000
Under $5,000-$10,000
Undar $5,000- $’:doo
$5,000 $9,999and
$5,000 $9,999and
over$5,000 $8,999
over O\fer
Age, racer’ and sex
Females
474 years . . . . . . . .
All races, 4-5 years . . . . .
White . . . . . . . . . . . . . .
Negro . . . . . . . . . . . . . .
All races, 6-11 years . . . . .
White . . . . . . . . . . . . . .
Negro . . . . . . . . . . . . . .
All races, 12-17 years . . . .
White . . . . . . . . . . . . . .Negro . . . . . . . . . . . . . .
All races, 18-44 years . . . .
White . . . . . . . . . . . . . .Negro . . . . . . . . . . . . . .
All races,45-54years . . . .
White . . . . . . . . . . . . . .Negro . . . . . . . . . . . . . .
All races,55-64years . . . .
White . . . . . . . . . . . . . .Negro . . . . . . . . . . . . . .
Allraces, 65-74 years . . . .
White . . . . . . . . . . . . . .Negro . . . . . . . . . . . . . .
Standard error
=++&=++
2.88
T1.42 1.92
6.12 7.37
7.62 7.57
2.32
4.21 3.23
+=
0.47 0.41
1.349.71
13.429.90
5.82
6.127.08
7.58
13.4214.95
7.62 7.272.32
4.08 2.82
9.17
1.46
6.01
7.35
6.76
1.48 1.42 1.98
4.84 3.588.24 19.08
4.62 3.03
4.43 3.27
8.19 19.11
2.791.30
1.680.90
2.076.81
7.05 4.37 I 3.22 2.71 1.27 1.01
11.014.92
2.75
3.353.39
8.02 +
6.49 3.2412.44 16.00
1.63 1.89
1.65 1.923.54 7.73
6.35 5.34
10.77
3.85
6.19 3.45
12.55 15.98
3.882.99
1.53
1.581.063.11
0.82 0,342.36 1.65 I 1.91 0.65
3.40
3.44
1.85 1.943.98 7.81
0.922.04
0.66
2.42
0.360.27
7.22 6.37 I 5.52 2.47 2.41 1.22
9.28 7.14 6.39 3.598.25 18.53 10.35 4.86
7.50 5.35 9.32 1.80
2.54 1.331.92
2.74
11.13
11.15
8.26
7.03 6.19
17.84 10.35
4.66 9.32
5.04 9.08
16.26 34.13
4.17 6.11
7.25 6.16 9.08 2.3015.86 14.43 34.71 3.73
3.07 4.70 7.87 2.97
4.145.12
2.03 3.51
8.2814.90
2.06
4.36 6.3216.91
2.20 I 3.6618.13 24.06
2.48
6.173.48 4.88 8.05 3.12
5.35 10.24 35.49 4.49
1Totals include races other than white and Ne9r0.
48

Table9. Percent of the population age 4-74 years reaching specified acuity levels for usual distance vision in the better eye, byeducation of head of household, age, race, and sex, with standard errors: United States, 1971-1972
Age, race,l and sex
20/20 or batter acuity
3
20/50 or worse acuity
Both sexes
4-74 years . . . . . . . . . . . . . . . . .
Allraces,4-5 years . . . . . . . . . . . . . .
White . . . . . . . . . . . . . . . . . . . . . . .Negro . . . . . . . . . . . . . . . . . . . . . . .
Allraces,6-ll years . . . . . . . . . . . . . .
White . . . . . . . . . . . . . . . . . . . . . . .Negro . . . . . . . . . . . . . . . . . . . . . . .
Allraces, 12-17years . . . . . . . . . . . . .
White . . . . . . . . . . . . . . . . . . . . . . .Negro . . . . . . . . . . . . . . . . . . . . . . .
Allraces,18-44years . . . . . . . . . . . . .
White . . . . . . . . . . . . . . . . . . . . . . .Negro . . . . . . . . . . . . . . . . . . . . . . .
Allraces,4%54years . . . . . . . . . . . . .
White . . . . . . . . . . . . . . . . . . . . . . .Negro . . . . . . . . . . . . . . . . . . . . . . .
Allraces,55-64years . . . . . . . . . . . . .
White . . . . . . . . . . . . . . . . . . . . . . .Negro . . . . . . . . . . . . . . . . . . . . . . .
Allracesr65-74years . . . . . . . . . . . . .
White . . . . . . . . . . . . . . . . . . . . . . .Negro . . . . . . . . . . . . . . . . . . . . . . .
Percent
74.3 79.9 20.9 5.8 2.9 1.7
35.4 31.1 - 3.2 0.7 2.9
36.5 I 61.4
-1 18.2
38.016.2
33.24.7
0.313.3 5.1
3.218.716.8
40.7 70.8 72.2 76.0 39.5
42.3
53.2
1.7 3.2 3.8
38.0 74.960.0
49.1 79.8
75.054.7
78.243.6
1.62.0
3.32.3
4.1
83.1 86.9 3.2 3.4 I 0.9
83.979.0
46.2 81.7100.0 73.5
59.5 78.3
87.9
79.43.1 3.0 1.03.3 4.1
2.4 1.9 0.584.8 90.8 12.4
85.2 91.881.6 77.3
16.1
+-l2,3 1.7 0.42.6 3.1 2.0
6.7 2.5 0.6
6.8 2.5 0.56.1 2.6 3.3
9.0 2.3 2.5
65.0 77.364.2 81.7
9.7 63.4 72.2 I 80.7 I 24.7
11.7 61.271.8
67.6 42.3
73.0 80.963.5 75.5
11.488.0
63.3 \ 59.9 I 10.6
62.537.7
59.475.5
4.325.5
8.19.0
2.310.2
2.9
-L68.9 39.267.9 49.8
22.2 26.5
14.9 26.618.8 15.5
31.6 40.1 31.0 16.0 12.7 9.8
29.936.1
37.79.9
31.335.2
15.031.7
13.622.0
11.09.4
lTOtals include races other than white and Negro.
49

Table9. Percent of the population age 4-74 years reaching specified acuity levels for usual distance vision in the better eye, byeducation of head of household, age, race, andsex, with standerd errors: United States, 1971 -1972–Con.
Age, race,l and sex
Both sexes
4-74 years . . . . . . .
All races, 4-5 years . . . .
White . . . . . . . . . . . . .Negro . . . . . . . . . . . . .
Allraces,6-11 years . . . .
White . . . . . . . . . . . . .Negro . . . . . . . . . . . . .
Allraces, 12-17 years . . .
White . . . . . . . . . . . . .Negro . . . . . . . . . . . . .
Allraces, 18-44 years . . .
White . . . . . . . . . . . . .Negro . . . . . . . . . . . . .
Allraces,45-54 years . . .
White . . . . . . . . . . . . .Negro . . . . . . . . . . . . .
Allraces, 55-64 years . . .
White . . . . . . . . . . . . .Negro . . . . . . . . . . . . .
Allraces, 65-74 years . . .
White . . . . . . . . . . . . .Negro . . . . . . . . . . . . .
. . . . . . . . . .
. . . . . . . . . .
. . . . . . . . . .
. . . . . . . . . .
. . . . . . . . . .
. . . . . . . . . .
. . . . . . . . . .
. . . . . . . . . .
. . . . . . . . . .
. . . . . . . . . .
. ..!... . . .
. . . . . . . . . .
. . . . . . . . . .
. . . . . . . . . .
. . . . . . . . . .
. . . . . . . . . .
. . . . . . . . . .
. . . . . . . . . .
. . . . . . . . . .
. . . . . . . . . .
. . . . . . . . . .
. . . . . . . . . .
~20/20 or better acuity I 20/60 or worse acuity
Elemen- HighCollege
Elemen- HighCollege
Nonetary
or Noneschool tary
orschool
more more
Standard error
78.03 1.78 1.12 1.70
4.70 3.85 3.5s
6.38 4.00 3.90111.74 6.47 4.03
25.94 3.51 1.73 4.42
26.96 3.58 2.02 4.506.79 6.36 12.28
34.38 4.45 1.78 2.48
35.3650.00
11.75
4.81 1.87 2.818.69 5.13 14.86
2.391 1.16 ] 1.10
19.3634.41
4.57
2.54 1.19 1.104.59 3.32 6.78
5.o5 I 3.46 I 4.I5
8.87
12.69
17.9925.27
9.96
14.1314.63
6.19 3.79 4.10
5.67 9.99 18.59
tt
6.10 3.93 6.75—
6.00 3.92 5.BI‘11.43 9.37 33.85
3.19
29.37
34.3337.60
7.45
9.38
21.74
12.7462.44
10.17
5.7325.30
8.81
8.6618.19
0.32 0.37 0.41
2.04 0.64 1.55
0.38 - 1.679.21 4.18
0.84 0.60 1.91
0.90 0.79 2.041.19 1.06
1.50 0.85 0.79
1.69 0.85 0.822.30 1.92
0.66 0.39 0.20
0.78 0.451.40 1.07
2.72! 0.95
0.301.87
0.51
2,80 1.024.36 1.53
t
2.05 1.18
2.62 1.172.32. 6.51
+
2.56 1.71
3.39 2.464.67 5.42
0.503.58
0.40
0.s4
4.46
4.287.56
lTotals include racas other than white and Negro.
50

Table9. Percent of the population age 4-74 years reaching specified acuity levels for usual distance vision in the better eye, byeducation of head of household, age, race, and sex, with standard errors: United States, 1971 -1972–Con.
Age, r~ce,’ and sex
20/20 or better acuity 20/50 or worse acuity
Elemen- HighCollege
Elemen- HighCollege
Nonetary
or Noneschool tary school
ormore more
Males
4-74years . . . . ..m. m..... . . .
Allreces,4-5years . . . . . . . . . . . . . .
White . . . . . . . . . . . . . . . . . . . . . . .Negro . . . . . . . . . . . . .. . . . . . . . . . .
Allraces,6-ll years . . . . . . . . . . . . . .
White . . . . . . . . . . . . . . . . . . . . . . .Negro . . . . . . . . . . . . . . . . . . . . . . .
Allraces,12-17years . . . . . . . . . . . . .
White . . . . . . . . . . . . . . . . . . . . . . .Negro . . . . . . . . . . . . . . . . . . . . . . .
Allraces,18-44years . . . . . . . . . . . . .
White . . . . . . . . . . . . . . . . . . . . . . .Negro . . . . . . . . . . . . . . . . . . . . . . .
Allraces,45-54years . . . . . . . . . . . . .
White . . . . . . . . . . . . . . . . . . . . . . .Negro . . . . . . . . . . . . . . . . . . . . . . .
Allraces,55-64years . . . . . . . . . . . . .
White . . . . . . . . . . . . . . . . . . . . . . .Negro . . . . . . . . . . . . . . . . . . . . . . .
Allraces,65-74years . . . . . . . . . . . . .
White . . . . . . . . . . . . . . . . . . . . . . .Negro . . . . . . . . . . . . . . . . . . . . . . .
Percent
+H+F36.2 6.1
0.6
2.6 1.3
1,01.1
19.1 40.0 40.8 -11.5 24.8
77.7 73.5 79,5 47.9
79.5 75.0 80.2 53.772.7 63.8 66.1 -
83.5 87.1 88.7 -
83.9 88.0 90.8 -
0.8
1.8
1.1
3.3
.-
29.8
8.0
3.4
21.3
100.0
1.91.6
3.4
3.43.1
3.0
3.5
100.0
74.8
3.91.6
1.8
1.95.2
1.7 0.5
0.50.6
*
79.856.7
17.8
1.81.9
8.6
1.70.8
1.5m26.0
63.0
8.88.1
11.5
1.61.3
2.2 2.7m78.1
20.5
11.87.1
14.6
2.62.2
11.6
2.7
10.4
20.3 27.6
I
32.7 II 38.9 23.315.5 28.3 16.0 60.0
12.433.8
12.1
30.511.422.4
lTotais include races other than white and Negro.
51

Table9. Percent of the population age 4-74 years reaching specified acuity levels for usual distance vision in the better eye, byeducation of head of household, age, race, andsex, with standard errors: United States, 1971-1972-Con.
Age, race,’ and sex
Males Standard error
4-74 years . . . . , .
All races, 4-5 years . . .
White . . . . . . . . . . . .Negro . . . . . . . . . . . .
Allraces,6-11 years . . .
White . . . . . . . . . . . .Negro . . . . . . . . . . . .
All racesr12-17 years . .
White . . . . . . . . . . . .Negro . . . . . . . . . . . .
Allraces, 18-44 years . .
White . . . . . . . . . . . .Negro . . . . . . . . . . . .
Allraces, 45-54 years . .
White . . . . . . . . . . . .
Negro . . . . . . . . . . . .
All races, 55-64 years . .
White . . . . . . . . . . . .
Negro . . . . . . . . . . . .
All races, 65-74 years . .
White . . . . . . . . . . . .
Negro . . . . . . . . . . . .
lTotals include races mher
1.12 2.15
6.02 5.30
9.83 0.89 0.52 0.60
0.65 1.04 1.10
4.30 2.08. . . . . . . . . . .
6.46. . . . . . . . . . .
9.306.98
4.66.—
6.1410.54
4.79
6.92 5.6210.39
3.66 5.77
0.90 - 1.128.14
37.47 0.80 0.83 1.8329.39
28.03
50.00
. . . . . . . . . . .
. . . . . . . . . . .
. . . . . . . . . . .
3.98 5.90
7.19. 20.94
1.71 2.09
40.68 1.031.69
1.181.80
1.95. . . . . . . . . . .. . . . . . . . . . .
-1 2.00 1.11. . . . . . . . . . .
1.83 1.525.23 34.23
1.43 1.93
50.00
22.17
2.54 0.811.50 3.14
1.25 0.77 0.46
5.564.12
4.60
. . . . . . . . . . .
. . . . . . . . . . .
. . . . . . . . . . .
41.4539.73
16.97
17.09
12.40
8.17
12.86
17.70
5.707.37
6.69——
8.149.56
7.16——
6.77‘14.76
4.44——
4.695.31
1.49 1.644.75 16.01
3.32 4.02
1.362.02
0.870.80
0.500.62
. . . . . . . . . . .
. . . . . . . . . . .
26.271 4.97 0.96. . . . . . . . . . .
t
3.94 3.7015.82 36.81
4.72 8.79
5.00 8.0918.14 46.02
2.99 4.24
3.19 5.6213.46 28.23
21.78 4.9662.44 6.92
1.061.30
. . . . . . . . . . .
. . . . . . . . . . .
t
10.45 4.26
7.43 4.29
39.33 4.00
1.70 3,01. . . . . . . . . . ,
1.64
3.132.94. . . . . . . . . . .
. . . . . . . . . . ,
+
13.16 1.94
10.79 2.7523.58 7.21
2.15 5.75. . . . . . . . . . .
2.999.44
6.5222.40
. . . . . . . . . . .
. . . . . . . . . . .
than white and Negro.
52
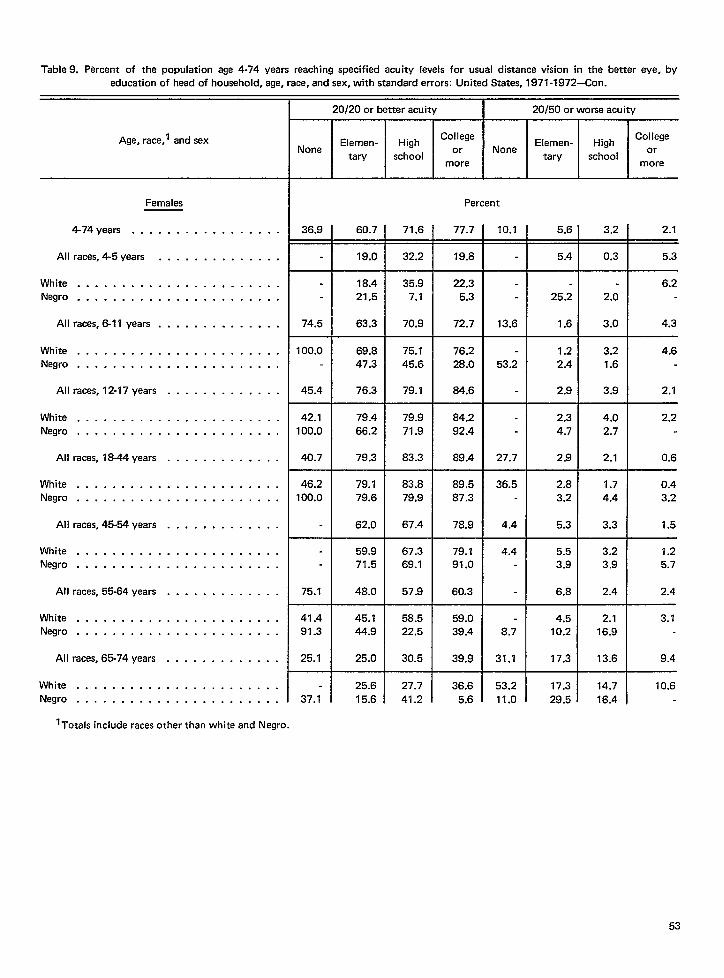
Table9. P¢ of the population age 4-74 years reaching specified acuity levels for usual distance vision in the better eye, by
educetionof head of household, age, race, andsex, with standard errors: United States, 1971 -1972 —Con.
Age, race,l and sex
Females
4-74years . . . . . . . . . . . . . . . . .
Allraces,4-5years . . . . . . . . . . . . . .
White . . . . . . . . . . . . . . . . . . . . . . .
Negro . . . . . . . . . . . . . . . . . . . . . . .
Allraces,6-ll years . . . . . . . . . . . . . .
White . . . . . . . . . . . . . . . . . . . . . . .
Negro . . . . . . . . . . . . . . . . . . . . . . .
Allraces, 12-17years . . . . . . . . . . . . .
White . . . . . . . . . . . . . . . . . . . . . . .
Negro . . . . . . . . . . . . . . . . . . . . . . .
Allraces, 18-44years . . . . . . . . . . . . .
White . . . . . . . . . . . . . . . . . . . . . . .
Negro . . . . . . . . . . . . . . . . . . . . . . .
Allraces,45-54years ,.. . . . . . . . . . .
White . . . . . . . . . . . . . . . . . . . . . . .
Negro . . . . . . . . . . . . . . . . . . . . . . .
Allraces,55-64years . . . . . . . . . . . . .
White . . . . . . . . . . . . . . . . . . . . . . .
Negro . . . . . . . . . . . . . . . . . . . . . . .
Allraces,6S74years . . . . . . . . . . . . .
White . . . . . . . . . . . . . . . . . . . . . . .
Negro . . . . . . . . . . . . . . . . . . . . . . .
20/20 or better acuity 1 20/50 or worse acu ityv
Eiemen- HighCollege
EIemen- HighCollege
Nonetary
or Noneschool tary
orschool
more more
Percent
36.9 60.7 71.6 77.7 10.1 5.6 3.2 2.1
19.0 32.2 19.8 - 5.4 0.3 5.3
18.4 35.9 22.3 - 6.2
21.5 7.1 5.3 - 25.2 2.0
74.5 63.3 70.9 72.7 13.6 1.6 3.0 4.3
100.0 69.8 75.1 76.2 - 1.2 3.2 4.6
47.3 45.6 28.0 53.2 2.4 1.6
45.4 76.3 79.1 84.6 - 2.9 3.9 2.1
42.1 79.4 79.9 84.2 - 2.3 4.0 2.2
100.0 66.2 71.9 92.4 - 4.7 2.7
40.7 79.3 83.3 89.4 27.7 2.9 2.1 0.6
46.2 79.1 83.8 89.5 36.5 2.8 1.7 0.4
100.0 79.6 79.9 87.3 - 3.2 4.4 3.2
62.0 67.4 78.9 4.4 5.3 3.3 1.5
59.9 67.3 79.1 4.4 5.5 3.2 1.2
71.5 69.1 91.0 - 3.9 3.9 5.7
75.1 48.0 57.9 60.3 - 6.8 2.4 2.4
41.4 45.1 58.5 59.0 - 4.5 2.1 3.7
91.3 44.9 22.5 39.4 8.7 10.2 16.9
25.1 25.0 30.5 39.9 31.1 17.3 13.6 9.4
25.6 27.7 36.6 53.2 17.3 14.7 10.6
37.1 15.6 41.2 5.6 11.0 29.5 16.4
lTotals include races other than white and Ne9ro.
53

Table9. Percent of the population age 474 years reaching specified acuity levels for usual distance vision in the batter eye, by
education of head of household, age, race, and sex, with standard errors: United States. 1971-1972—Con.
Age, race,’ and sex
Females
4-74 years . . . . . . . . . . . . . . . . .
Allracesr4-5 years . . , . . . . . . . . . .
White . . . . . . . . . . . . . . . . . . . . . . .
Negro . . . . . . . . . . . . . . . . . . . . . . .
Allraces,6-ll years . . . . . . . . . . . . . .
White . . . . . . . . . . . . . . . . . . . . . . .Negro . . . . . . . . . . . . . . . . . . . . . . .
Allraces, 12-17years . . . . . . . . . . . . .
White . . . . . . . . . . . . . . . . . . . . . . .
Negro . . . . . . . . . . . . . . . . . . . . . . .
Allraces, 18-44years . . . . . . . . . . . . .
white . . . . . . . . , . . . . . . .- , - . , .
Negro . . . . . . . . . . . . . . . . . . . . . .
Allraces,45-54years . . . . . . . . . . . .
White . . . . . . . . . . . . . . . . . . . . . . .
Negro . . . . . . . . . . . . . . . . . . . . . . .
Allraces,55-64years . . . . . . . . . . . . .
White . . . . . . . . . . . . . . . . . . . . . . .Negro . , . . . . . . . . . . , . . . . , . . . . .
AllracesJ65-74years . . . . . . . . . . . . .
White . . . . . . . . . . . . . . . . . . . . . . .
Negro . . . . . . . . . . . . . . . . . . . . . . .
20/20 or better acuity I 20/50 or worse acuity
College CollegeElemen-
NoneHigh
NoneElemen- High
taryor
school taryor
moreschool
more
16.98
34.58
31.62
36.00
37.05
50.00
19.40
27.13
50.00
29.64
47.57
30.42
13.46
28.71
Standard error
2.56 I 1.60=
T5.20 6.38
—
6.93 7.18
19.98 2.82
7.04 2.72—
6.62 2.96
9.18 8.44
6.22 2.55
7.13 2.79
15.30 7.54
3.10 1.76
+
3.08 1.72
4.62 4.04
5.99 4.72
7.47 5.31
4.88 9.56
8.65 5.51
+
9.23 5.44
13.49 10.68
3.64 3.33—
4.15 4.78
5.25 13,42
2.45 4.94 0.81 0.34 0.58
5.88 - 4.02 0.20 3.08
7.07 - 3.55
4.74 - 15.52 1.55
5.24 16.40 0.97 0.82 2.90
5.44 - 0.80 0.99 3.12
13.27 37.60 2.01 1.08
5.47 - 1.61 0.96 1.80
5.85 - 1.66 1.02 1.91
5.45 - 3.31 1.88
1.33 122.12 I 0.98 ] 0.47 ] 0.28
1.44 28.69 1.09 0.50 0.254.24 - 1.88 1.65 3.22
8.52 30,93 2.70 1.50 1.25
9.05 30.93 3.28 1.60 1.28
18.09 - 2.82 2.99 8.09
9.71 - 1.43 1.59 2.48
8.04 - 3.18 1.52 2.39
36.05 30.42 2.18 11.73
5.81 9,58 3.68 3.15 4.38
7.13 9.76 4.62 3.82 4.07
10.19 16.43 6.68 10.15
lTotals include races other than white and Ne9ro.
54

Table 10. Percent of population age 18-74 years reaching specified acuity levels for usuaI distance vision in the better eye, by education
ofperson, age, andsex, with standard errors: United States, 1971-1972
Age and sex
Both sexes
18-74 years . . . . . . . . . . . . . . . . . . .
18-44 years . . . . . . . . . . . . . . . . . . . .
45-54 years . . . . . . . . . . . . . . . . . . . .
55-64years . . . . . . . . . . . . . . . . . . . .
65-74years . . . . . . . . . . . . . . . . . . . .
Males
18-74years . . . . . . . . . . . . . . . . . . .
18-44years . . . . . . . . . . . . . . . . . . . .
45-54years . . . . . . . . . . . . . . . . . . . .
55-64years . . . . . . . . . . . . . . . . . . . .
65-74years . . . . . . . . . . . . . . . . . . . .
Females
18-74years . . . . . . . . . . . . . . . . . . .
18-44years . . . . . . . . . . . . . . . . . . . .
45-54years . . . . . . . . . . . . . . . . . . . .
55-64years . . . . . . . . . . . . . . . . . . . .
65-74years . . . . . . . . . . . . . . . . . . . .
Education of persons
With20/200r better vision IMth 20/50 or worse vision
Elemen- HighCollege
Elemen- HighCollege
None or Noneschool
ortary tary
moreschool
more
Percent of persons
25.4
53.5
10.1
27.0
17.7
36.6
73.5
18.0
41.7
18.7
9.3
15.9
8.2
16.2
51.0
72.4
61.0
39.7
28.8
51.4
73.3
62.1
34.9
27.4
50.7
71.4
59.7
44.0
29.9
77.2
85.9
73.1
64.4
33.1
80.1
86.5
80.0
72.0
34.6
72.2
85.4
68.4
58.8
32.0
81.7
90.4
78.7
61.5
40.0
83.4
91.5
80.7
56.4
41.7
79.5
88.9
75.8
67.9
39.0
21.7
1.9
26.0
31.6
29.4
27.4
42.9
30.4
35.9
13.4
5.6
4.4
33.1
20.4
9.2
2.8
8.8
9.7
16.5
7.9
2.0
7.3
10.6
14.0
10.4
3.7
10.7
9.018.6
2.6
1.9
2.0
1.9
12.3
2.4
1.7
1.5
2.2
11.8
2.8
2.1
2.4
1.7
12.6
1.1
0.40.21.58.8
1.1
0.4
2.79.8
1.1
0.30.4
8.2
55

Table 10. Percent of popu Iation age 18-74 years reaching specified acuity Iavels for usual distance vision in the better eye, by education
ofperaon, age, andsex, with standard errors: United States, 1971-1972-Con.
Age and sex
Both sexes
18-74 years . . . . . . . . . . . . . . . . . . .
18-44 years . . . . . . . . . . . . . . . . . . .
45-54 years . . . . . . . . . . . . . . . . . . .
55-64years . . . . . . . . . . . . . . . . .
65-74years . . . . . . . . . . . . . . . . . . . .
Males
18-74years . . . . . . . . . . . . . . . . .
18-44years . . . . . . . . . . . . . . . . . . .
45-54years . . . . . . . . . . . . . . . . . . . .
55-64years . . . . . . . . . . . . . . . . . . . .
65-74years . . . . . . . . . . . . . . . . . . . .
Females
18-74years . . . . . . . . . . . . . . . .
18-44years . . . . . . . . . . . . . . . . . . .
45-54years . . . . . . . . . . . . . . . . . . .
55-64years . . . . . . . . . . . . . . . . . . . .
65-74years . . . . . . . . . . . . . . . . . . . .
Education of persons
With 20/20 or better vision I With 20/50 or worse visicm
Elemen- HighCollege
None NoneElemen- High
taryor
school tarymore
school
Standard error
4.97
17.85
4.08
10.54
7.72
10.95
24.05
13.99
21.06
11.42
3.83
10.11
13.31
7.53
2.24
4.74
6.23
5.72
2.91
3.91
7.29
7.29
6.25
3.87
2.32
3.88
6.92
7.98
3.82
1.06
1.04
2.62
3.88
2.78
1.26
1.44
3.14
4.92
3.48
1.58
1.51
3.75
4.66
3.85
2.03
1.17
4.62
6.41
4.36
2.59
2.07
3.90
8.96
4.00
2.85
1.15
8.36
5.96
6.36
6.16
1.97
20.52
16.30
6.31
9.47
20.68
18.46
9.74
3.92
7.02
30.93
25.12
6.73
0.65
1.15
3.28
2.63
2.18
1.30
1.55
4.18
4,06
1.83
0.95
1.58
4.54
2.22
2.97
0.39
0.33
0.82
0.89
2.03
0.51
0.58
0.98
1.71
2.43
0.42
0.49
1.16
1.14
3.38
College
or
more.—
0.48
0.18
0.14
1.62
4.36
0.72
0.45
2.93
5.88
0.45
0.19
0.35
4.14
56

Table Il. Percent distribution of adults age 18-74 years reaching specified acuity Ievels for usual distance vision in the better eye,
according toageand sex: United States, 1960-1962 and 1971-1972
Age and sex
Both sexes
18-24 years . . . . . . . . . . . . . . . . . . . .25-34 years . . . . . . . . . . . . . . . . . . . .3544years . . . . . . . . . . . . . . . . . . . .45-54years . . . . . . . . . . . . . . . . . . . .55-64years . . . . . . . . . . . . . . . . . . . .65-74years . . . . . . . . . . . . . . . . . . . .
Males
18-24years . . . . . . . . . . . . . . . . . . . .25-34years . . . . . . . . . . . . . . . . . . . .35-44years . . . . . . . . . . . . . . . . . . . .45-54years . . . . . . . . . . . . . . . . . . . .55-64years . . . . . . . . . . . . . . . . . . . .65-74years . . . . . . . . . . . . . . . . . . . .
Females
18-24years . . . . . . . . . . . . . . . . . . . .25-34years . . . . . . . . . . . . . . . . . . . .35-44years . . . . . . . . . . . . . . . . . . . .45-54years . . . . . . . . . . . . . . . . . . . .55-64years . . . . . . . . . . . . . . . . . . . .65-74years . . . . . . . . . . . . . . . . . . . .
United States, 1860-1962!
United States, 1971-1972
i I I i I 1
2012020/25- 2o150-
20/200 20/2020125- 20150-
20/200or
20/40 20/1 00 ‘ror
better better20/40 20/1 00 ‘r
worse worse
81.285.583.461.839.826.1
82.688.985.168.240.031.2
80.082.481.655.639.521.8
17.713.015.033.451.455.7
16.210.213.628.152.351.3
19.015.616.638.350.559.3
0.91.21.34.07.4
15.2
1.20.80.93.26.4
15.4
0.61.51.64.98.5
15.2
Percent distribution
0.20.30.30.81.43.0
0.10.40.51.32.1
0.40.50.21.21.53.7
87.684.285.471.256.032.0
8B.583.887.975.156.931.5
86.584.782.867.555.332.3
10.114.313.925.639.353.9
9.B14.811.621.837.955.0
10.613.816.128.140.653.2
1.51.50.73.04.1
12.8
0.61.40.5
, 3.05.1
12.5
2.31.51.03.03.3
12.9
0.8
0.00.20.61.3
1.1
0.10.11.0
0.6
0.10.40.81.6
57

Table 12. Percent distributicm of youths age 12-17 years reaching specifieal acuity Ievelsfar usual distance vision in the better eye, according toage and sex,
with standard errors for totals: United States, 1966 -1970 and 1971-1972
Acuity level “with usual correction’’–Snellen ratio
United States, 1966.1970 United States, 1971-1972
Age and sex
Both sexes Percent distribution of youths
12-17 vears 80.3 12,5 0.9 0.6 82,82.7
3.9
3.5
2.3
2.8
2.4
1.3
2,6
3.0
—,
3.6
4.3
3.3
2.6
2.0
2.2
2.6
11.7 2,8 1.9 0,5 0.3
12 years . . . . . . . . . . . . . . .
13 years . . . . . . . . . . . . . .14years . . . . . . . . . . . . . .
15years . . . . . . . . . . . . . .
16years .
17years . . .
74.0
76.8
80.9
80.4
84.3
86.6
82.3
16.7
13.7
11.7
13.0
10.5
8.7
11.4
1.00.9
0.8
0.7
0.6
1.0
0.6
0.8
0.8
1.0
0.5
0.2
0.2
0.5
0.3
0.5
1.2
0.3
0.3
0.2
0.8
75,5
80.6
83.0
84.2
87.3
86.6
86.6
80.1
85.3
86.5
85.3
92.4
91.0
79.0
15.5
11.2
10.8
11.7
10.1
10,9
9.4
15.3
8.4
9.4
9.2
4.8
8.1
14.0
5,5
4.4
2.6
1.1
0.9
1.9
1.7
3.0
1,8
2.4
2.9
0.7
0,5
1.5
0.3
0.6
1.1
1.0
0.1
0.5
0.2
1.4
0.1
0.1
0.3
Boys
12-17years
12years
13years, .,, , . . . . . . . . .
14years . . . . . . . . . . . . . ,.
15years . .
16years ,.
17years
77.7
60.3
81.4
81.7
84.9
88.8
78,3
70.2
73.2
80.5
79.1
83.7
84.3
15,1
11.6
11.9
12.1
10.1
6.9
13,5
3.0
3.3
2.3
3.0
2.2
1.5
2.9
2.7
3.1
3,2
2.6
2,3
1.8
3.4
1.2
1,2
0,3
0.2
0.8
1.1
3.2
5.0
0.4
0.4
1.7
3.8
0.4
1.4
5.1
1.1
0.7
2.3
0.6
2.0
0.2
0.6
0.4
1.3
0.3
0.3
Girls
12-17years .
12years .,, , . . . . . . . . .13years
14years, . . . . . . . . . . . .
15years, , . . . . . . . . . . .
16years ,.
17years ., . . ...,,.... ,,
18.3
15,6
11.4
13.8
10.9
10.7
4.9
3.8
2.2
2.6
2.6
1.0
4.6
5.5
3.4
2.6
1.7
2.6
0.8
0.7
1.7
1.?
1.0
1.2
1.2
1.2
0.8
0.8
0.1
0.2
69.6
76.8
79.8
83.0
82.7
81.1
15.5
13.5
12.0
14.6
14.8
14.4
8.5
3.9
4.6
2.0
0.2
4.3
6.4
3.1
3.4
0.2
0.4
0.2
1.2
0.2
1,9
1.5
0.2
Standard error
Both sexes, 12.17 years
8oys,12-17years . .
Girls,12-17vears . .

Table 13. Percent distribution of children age 6-11 years reachirsts apacifiadacuitv Ievelsfor distance vision inthebatter eye, ’’without comection’’ and
''with usual correction,' 'according toqeand wx, with Wndarderrom fortotals: Unitad States, 1963-1965 and 1971-1972
“Without correction” I ‘With usual correction”
United Stat
I I
S, 1963-1965 I United States, 1971-1972
I t 1 IAge and sex
20/50-
20/7020/60-20/100
20/200or
worse
20/2020/25
or 20/30m/40
better
Percent distribution of childrenBoth sexes
2.8 0.5
0.22.9
0.1
0.2
0.262.0 24.2
30.932.627.919.617.315.9
22.7
1.3 3.3 72.5 21.1 2.9611veam . . . . . . . . . . 4.4
6.45.53.63.62.54.6
4.0
4.8
3.14.25.24.55.75.8
4.5
44.523.420.510.214.216.5
18.7
42.516.127.210.37.3
14.9
23.5
46.532.913.99.9
20.318.1
2.42.62.43.10.36.2
3.4
58.855.159.867.867.264.1
64.5
0.51.01.11.12.42.2
1.3
0.31.62.43.44.97.4
3.0
0.32.2I .5
3.13.67.2
3.5
51.570.275.380.181.474.3
74.9
56.577.267.380.390.971.6
70.1
1.63.80.53.74.02.9
2.5
6years . . . . . . . . . . . . . .7yeara . . . . . . . . . . . . . .
8yeare . . . . . . . . . . . . . .
9years . . . . . . . . . . . . . .
10years . . . . . . . . . . . . .
11 years . . . . . . . . . . . . .
1.1
0.1
BOYS
0.36-llveara . . . . . . . . . .
0.83.80.76.21.50.7
3.3
2.43.70.31.06.34.9
0.22.92.42.10.3
12.8
2.2
4.32.32.44.30.4
64.557.860.869.670.765.1
59.3
27.329.326.819.416.016.3
25.8
4.56.33.72.92.24.2
4.9
2.72.75.74.15.95.5
5.1
0.71.61.10.91.61.7
1.4
6years . . . . . . . . . . . . . .7Vears . . . . . . . . . . . . . .
8years . . . . . . . . . . . . . .
9years . . . . . . . . . . . . . .
10years . . . . . . . . . . . . .
11 yeara . . . . . . . . . . . . .
0.31.1
0.9
2.1
Girls—
0.0&llvaars . . . . . . . . . .
53.052.358.666.163.562.8
34.735.828.919.818.615.7
8.44.73.64.42.94.9
3.45.94.84.85.76.2
0.20.41.21.23.22.7
0.30.92.93.76.17.7
46.86years . . . . . . . . . . . . . .
7years . . . . . . . . . . . . . .
8years . . . . . . . . . . . . . .
9years . . . . . . . . . . . . . .
lovers . . . . . . . . . . . . .
11 years. . . . . . . . . . . . .
4.9
0.2
61.1
83.4
79.9
72.9
76.8
.-
0.1
Stand ard error
1.34 0.87 0.40 0.26 0.15 0.28 1.72 1.50 0.59 0.75 0.30 0.16
1.65 1.08 0.48 0.45 0.22 0.40 2.63 2.33 0.73 1.14 0.20 0.311.46 1.21 0.51 0.29 0.20 0.46 1.64 1.% 1.02 0.79 0.59 0.02
Both sexes,6-llvears . .
60ys,6-ll yeara . . . . . . . . .
Girls,611vears . . . . . . . . .
.i
59

Table 14. Percent of adults age 18-79 years with defective binocular distance and/or near visual acuity with usual correction, by age
and sex: United States, 1960-1962
Defective I I I Defective
Age and sex
Both sexes
18-79 years . . . . . . . . . . . . . . . . . . . . . . . . . . . . . . . . . .
18-24 years . . . . . . . . . . . . . . . . . . . . . . . . . . . . . . . . . . . .
25-34yaars . . . . . . . . . . . . . . . . . . . . . . . . . . . . . . . . . . . .
35-44years . . . . . . . . . . . . . . . . . . . . . . . . . . . . . . . . . . . .
45-54years . . . . . . . . . . . . . . . . . . . . . . . . . . . . . . . . . . . .
55-64years . . . . . . . . . . . . . . . . . . . . . . . . . . . . . . . . . . . .
65-74years . . . . . . . . . . . . . . . . . . . . . . . . . . . . . . . . . . . .
75-79years . . . . . . . . . . . . . . . . . . . . ..’...... . . . . . . . .
Males
18-79years . . . . . . . . . . . . . . . . . . . . . . . . . . . . . . . . . .
18-24years . . . . . . . . . . . . . . . . . . . . . . . . . . . . . . . . . . . .
25-34years . . . . . . . . . . . . . . . . . . . . . . . . . . . . . . . . . . . .
35-44years . . . . . . . . . . . . . . . . . . . . . . . . . . . . . . . . . . . .
45-54years . . . . . . . . . . . . . . . . . . . . . . . . . . . . . . . . . . . .
55-64years . . . . . . . . . . . . . . . . . . . . . . . . . . . . . . . . . . . .
65-74years . . . . . . . . . . . . . . . . . . . . . . . . . . . . . . . . . . . .
75-79years, . . . . . . . . . . . . . . . . . . . . . . . . . . . . . . . . . . .
Females
18-79years . . . . . . . . . . . . . . . . . . . . . . . . . . . . . . . . . .
18-24years . . . . . . . . . . . . . . . . . . . . . . . . . . . . . . . . . . . .
25-34years . . . . . . . . . . . . . . . . . . . . . . . . . . . . . . . . . . . .
35-44years . . . . . . . . . . . . . . . . . . . . . . . . . . . . . . . . . . . .
45-54years . . . . . . . . . . . . . . . . . . . . . . . . . . . . . . . . . . . .
55-64years . . . . . . . . . . . . . . . . . . . . . . . . . . . . . . . . . . . .
65-74years . . . . . . . . . . . . . . . . . . . . . . . . . . . . . . . . . . . .
75-79years . . . . . . . . . . . . . . . . . . . . . . . . . . . . . . . . . . . .
distance
and
near’
. . .
0.30.70.81.64.3
10.421.5
. . .
0.00.50.91.23.8
9.918.7
. . .
0.61.00.82.04.8
10.8
24.3
Percent
. . .. . .
0.71.51.54.37.9
16.328.4
. . .
0.20.91.53.57.2
16.2
23.3
. . .
1.21.91.55.08.4
16.3
33,3
1.41.75.8
26.527.633.657.0
. . .
1.12.33.5
27.032.035.2
56.6
. . .
1.61.37.8
25.923.532.657.5
. . ..—-—
1.82.56.5
29.231.239.563.9
. . .-—
1.32.74.1
29.335.441.5
68.2
. . .
2.22.28.5
28.927.138.1
66.5
1 Defective distance binocular acuity < 20/50, usual; defectiva near bitIOCUlar aCUkY ~ 14/35, usual.
60

The Survey Design
The sampling plan
APPENDIX I
STATISTICAL NOTES
for the first 65 stands ofthe Health- an~ Nutrition Examination Survey(HANES) followed a stratified, multistage prob-ability design in which a sample of the civiliannoninstitutionalized population, 1-74 years ofage, of the coterminous United States, wasselected. Excluded from the selection werepersons residing in Alaska and Hawaii and thosewithin the coterminous United States who wereconfined to institutions or residing on reserva-tion lands of American Indians. Successive ele-ments dealt with in the process of sampling werethe primary sampling unit, census enumerationdistrict, segment (a cluster of households),household, eligible persons, and, finally, samplepersons.
The starting points in the first stage of thisdesign were the 1960 decennial census lists ofaddresses and the nearly 1,900 primary samplingunits (PSU’S) into which the entire United Stateswas divided. Each PSU is either a standardmetropolitan statistical area (SLMSA), a singlecounty, or two or three contiguous counties.The PSU’S were grouped into 357 strata for usein the Health Interview Survey and subsequentlycollapsed into 40 superstrata for use in Cycles 11and III of the Health Examination Survey andHANES.
Fifteen of the forty superstrata contained asingle large metropolitan area of more than 2million population. These 15 large metropolitanareas were selected for the sample with cer-tainty. The 25 noncertaint y strata were classi-fied into 4 broad geographic regions of approxi-
mately equal population and cross-classified into4 broad population density groups in eachregion. Then a modified Goodman-Kish con-trolled selection technique was used to select 2PSU’S from each of the 25 noncerta.inty super-strata with the probability of selection of a PSUproportionate to its 1960 population so thatproportionate representation of specified Stategroups and rate of population change classes wasmaintained in the sample. In this matter a totalfirst stage sample of 65 PSU’S was selected.These 65 sample PSU’S or stands are the areaswithin which samples of persons would beselected for examination over a 3-year surveyperiod.
In order to produce national estimates of thenutritional status of the U.S. population at anearlier date, a probability subsample of 35stands of the 65 stands was selected. This35-stand subsample also made it possible toproduce national estimates of certain otheraspects of health status in the population thatwere critically needed at an earlier date andexamination components that for logistic rea-sons could not be continued for the remainderof the 65 stands. Included among the 35 standswere 10 of the 15 large certainty metropolitanareas and 1 stand from each of the 25 noncer-tainty superstrata. The reduction from 15 to 10large metropolitan areas was accomplished byrandomly selecting one stand from multiple-stand standard metropolitan statistical areas; e.g.,selecting the southern half of the Chicago SMSAto represent the entire SMSA. (This selectionprocedure was based on operational consid-erations, and although unbiased, is recognized as
61

not being statistically optimal. ) It is this sub-sample of 35 stands upon which the findingscontained in this report are based.
Although the 1970 census data were used asthe frame for selecting the sample within PSU’Swhen they became available, the calendar ofoperations required that 1960 census data beused for the 35-stand sample of HAN13S. Censusenumeration districts (ED’s) in each PSU weredivided into segments of an expected six housingunits each. In urban ED’s the segments wereclusters of six addresses from the 1960 censuslisting books. For ED’s not having usable ad-dresses, area sampling was employed and conse-quently some variation in the segment sizeoccurred. To make the sample representative ofthe then-current population of the UnitedStates, the address or list segments were supple-mented by a sample of housing units which hadbeen constructed since 1960.
Within each PSU a systematic sample ofsegments was selected. The enumeration districtsthat fell into the sample were codecl into oneof two economic classes. The first class, identi-fied as the “poverty stratum,” was composed of“current poverty areas” that had been identifiedby the Bureau of the Census in 1970 (pre-1970census), plus other ED’s in the PSU with a meanincome of less than $3,000 in 1959 (based on1960 census). The second economic class, the
“nonpoverty stratum,” included all ED’s notdesignated as belonging to the poverty stratum.
All sample segments classified as being in thepoverty stratum were retained in the sample.
For those sample segments in nonpoverty
stratum ED’s, the selected segments were di-vided into eight random subgroups and one of
the subgroups was chosen to remain in theHANES sample. This procedure permitted a
separate analysis with adequate reliability of
those classified as being below the poverty leveland those classified as being above the poverty
level.
After identification of the sample segments, a
list of all current addresses within the segmentboundaries was made, and the households wereinterviewed to determine the age and sex of each
household member, as well as other demo-graphic and socioeconomic information required
for the survey.
To select the persons in sample segments tobe examined in HANES, all household membersage 1-74 in each segment were listed on a sampleselection worksheet with each household in thesegment listed serially. The number of house-hold members in each of the six age-sex groupsshown below was listed on the worksheet underthe appropriate age-sex group column.. Thesample selection worksheets were then put insegment number order and a systematic randomsample of persons in each age-sex group wasselected to be examined using the followingsampling rates:
Age in years Rate
1-5 . . . . . . . . . . . . . . . . . . . . . . . . . . . 1/26-19 . . . . . . . . . . . . . . . . . . . . . . . . . . 1/420-44, mace . . . . . . . . . . . . . . . . . . . . . . 114
20-44, female . . . . . . . . . . . . . . . . . . . . , 1/245-64 . . . . . . . . . . . . . . . . . . . . . . . . . . 1/4
65-74 . . . . . . . . . . . . . . . . . . . . . . . . . . 1
The persons selected in the 35-stand ~sampleof HANES comprised a representative sample ofthe target population and included 14,147 sam-ple persons 1-74 years of age of whom 10,126 or71.6 percent were examined. When adjustmentsare made for differential sampling for high-riskgroups, the response rate becomes 72.8 plercent.
All data presented in this report are based onweighted observations; that is, data recorded foreach sample person are inflated to characterizethe subuniverse from which that sample personwas drawn. The weight for each examinedperson is a product of the reciprocal of theprobability of selecting the person, an adjust-ment for nonresponse cases (i.e., perso:ns notexamined), and a poststratified ratio adjustmentwhich increases precision by bringing surveyresults into closer alinement with known U.S.
population figures.
A more detailed description of the surveydesign and selection technique can be found in
the Plan and Operation of a Health and Nutri-
t io n Examination Survey, United States,
1971-1973, Vital and Health Statistics, Series 1,No. 10a.6
Nonresponse
In any health examination survey, after the
sample is identified and the sample perscms are
62

requested to participate in the examination, thesurvey meets one of its more severe problems.Usually a sizable number of sample persons wilInot participate in the examination. Whether ornot an individual participates is determined bymany factors, some of which are uncontrollableand, therefore, may be reasonably treated as anoutcome of a random event with a particularprobabilityy of occurrence. If these probabilitiesof participation were known and greater thanzero for all persons, then the examined personswould constitute a probability sample fromwhich unbiased estimates of the target popu-lation could be derived. In this situation, theeffect of nonparticipation would only be toreduce the sample size, thereby increasing thesampling errors of examination findings. How-ever, m practice, a potential for bias due tononresponse exists since the exact probabilitiesare never known. A further potential for biasexists if a sizable proportion of sample personshave a zero probability of participation, that is,they would never agree to participate in anexamination survey of the same procedures andinducements, and if these persons differ fromother sample persons with respect to character-istics under examination. It is for these reasonsthat intensive efforts are made in HANES todevelop and implement procedures and induce-ments that would reduce the number of nonre-spondents and thereby reduce the potential ofbias due to nonresponse. These procedures andinducements are discussed in the “Plan andOperation of the Health and Nutrition Examinat-ion Survey, “ Series 1, No. 10a.6
Despite these intensive efforts, 27.2 percentof the sample persons from the first 35 standswere not examined. Consequently, the potentialfor a sizable bias does exist in the estimates inthis publication. From what is known about thenonrespondents and the nature of nonresponse,it is believed that the likelihood of sizable bias issmall. For instance, only a small proportion ofpersons gave reasons for nonparticipation whichwould lead to the belief that they would neveragree to participate in examination surveys andthat they may differ from examined personswith respect to the characteristic under examina-tion. Only 15 percent of the nonrespondentsgave as their reasons for nonparticipation“personal illness,“ “physically unable,” “preg-nant,” “ antidoctor,” or “fear of finding some-
thing wrong.” Typical among the reasons givenby the other nonrespondents were the follow-ing: “unable because of work, school, or house-hold duties”; “suspicious” or “skeptical of theprogram”; “just not interested in participating”;and “private medical care sufficient” or “justvisited doctor.”
An analysis of medical history data obtainedfor most nonexaminees as well as examinees alsosupports the belief that the likelihood of sizablebias due to nonresponse is small. No largedifferences were found between the examinedgroup and nonexamined group for the statisticscompared. For example, 11 percent of personsexamined reported having an illness or conditionthat interfered with their eating as comparedto 9 percent of persons who were not examinedbut who had completed a mediczd history. Thepercent of persons examined who reported everbeing told by a doctor that they had arthritiswas 20 percent; the percent for high bloodpressure was 18 percent, and for diabetes was 4percent. The corresponding percents for non-examined persons were 17 percent for arthritis,21 percent for high blood pressure, and 4percent for diabetes.
As mentioned eadier, the data in this reportare based on weighted observations, and one ofthe components of the weight assigned to anexamined person was an adjustment for non-response. Since the probabilities of participationare not known for sample persons in HANES, aprocedure was adopted which multiplies thereciprocal of the probability of selection ofsample persons by a factor that brings estimatesbased only on examined persons up to a levelthat would have been achieved if all samplepersons had been examined. This nonresponseadjustment factor is the ratio of the sum ofsampling weights for all sample persons within arelatively homogeneous class defined by age,sex, and poverty status, to the sum of samplingweights for all responding sample persons withinthe same homogeneous class. To the degree thathomogeneous groups can be defined which arealso homogeneous with respect to the character-istics under study, the procedure can be effec-tive in reducing the potential bias from non-response.
For the 35-stand sample of HANES, personswere grouped into 20 age-sex-poverty statusgroups within each stand, yielding 700 separate
63

cells with an average membership of about 20sample persons each. These adjustment fdctorsare distributed among examined persons asshown in table 1.
Missing Data
Examination surveys are subject to the loss ofinformation not only through the failure to
examine all sample persons, but also from thefailure to obtain and record all items of informa-
Table 1. Percent distribution of non response adjustmentfactors: Health and Nutrition Examination Survey,
Stands 1-35, 1971-1972
Size of factorPercent
distribution
Total . . . . . . . . . . . . . . . .
1.00-1 .24 . . . . . . . . . . . . . . . .
1.25-1 .49 . . . . . . . . . . . . . . . .
1.50-1 .74 . . . . . . . . . . . . . . . .
1.75-1 .99 . . . . . . . . . . . . . . . .
2.002.49 . . . . . . . . . . . . . . . .
2.50-2.99 . . . . . . . . . . . . . . . .
3.00-3.03 . . . . . . . . . . . . . . . .
100.0
38.4
31.6
12.9
8.4
6.1
1.2
1.4
tion for examined persons. The extent of miss-ing data for the visual acuity testing ranged from3 to 5 percent for persons age 6-74 years butamong 4- and 5-year-olds more than one-fifth(22 percent) did not have visual acuity readings.The extent of missing data for those visualacuity tests is shown in table II.
Estimates were made for the missin~ visualacuity scores as follows. For each examinedperson with some (but incomplete) record ofvisual acuity, a visually examined respondent ofthe same age, sex, race, and income group withrelevant findings similar to those available forthe incompletely examined person was selectedat random and the remainder of those testresults were assigned to the individual with thosemissing values.
In doing this imputation, persons whoseexamination showed an enucleated globe wereclassed as blind in that eye; selection of :missingdata for persons with cataracts was made fromamong those with cataracts whose visual acuityhad been determined. If visual acuity for oneeye was available and other examination findingsindicated no problems with the other eye, thevision data for that eye were imputed to theother eye. For those examined persons whosevisual acuity had not been recorded, a visuallyexamined respondent of the same age, sex, race,
Table 11. Number of examinees and extent of visual acuity tests imputed, by age: HANES 1, 1971-1972
Examinees and acuity tests imputed
All examinees . . . . . . . . .
Number not tested
(Percent).....::::::::::
Uncorrected:
Right eye . . . . . . . . . . . . . .
Lefteye . . . . . . . . . . . . . . .
Both eyes . . . . . . . . . . . . . .
Corrected:
Right eye . . . . . . . . . . . . . .
Left eye . . . . . . . . . . . . . . .
Both eyes . . . . . . . . . . . . . .
I Includes eight 75-year-olds.
Age in years
=1 I “2-17 I ‘8-24 I 2’-34 I 3544 I 45-54 I 5’44 I ‘Z
Number of examinees
19,263 626
504 136
(5.4) (21 .7)
14 3
11
354 133
15
23 -
87 - I1,087 1,045
=
47 47
(4.4) (4.5)
1 1
1 2
45 40
2
2—
1,015
31
(3.1 )
2
1
24
4
1,259
49
(3.9)
1
41
1
6
1,170
(5:
2
2
32
3
21
793
(35
2
1
12
3
3
6
630
(35
115
2
3
12
1,658
(58
2
2
22
101136
64
and income group was selected at random andhis test results were assigned to the individualwith missing acuity data.
This imputation procedure was used becauseit would tend to distort the national estimatesless (than the alternative of deleting all thosepersons with missing visual acuity data) if oneassumed that the distribution of visual acuityvalues among those persons with missing data byage, sex, race, and other variables would besimilar to values for those tested.
Small Numbers
In some tables, magnitudes are shown for cellsfor which the sampIe size is so small that thesampling error may be severaI times as great asthe statistic itself. Obviously in such instancesthe numbers, if shown, have been included toconvey an impression of the overall story of thetable.
Sampling and Measurement Error
In the present report, reference has beenmade to efforts to minimize bias and variabilityof measurement techniques. The potential ofresidual bias due to the high nonresponse ratehas also been discussed.
The probability design of the survey makespossible the calculation of sampIing errors.Traditionally the role of the sampling error hasbeen the determination of how imprecise thesurvey results may be because they come from asample rather than from the measurement of allelements in the universe.
The estimation of sampling errors for a studyof the type of the Health and Nutrition Ex-amination Survey is difficult for at least threereasons: (1) measurement error and “pure”
sampling error are confounded in the data—it isnot easy to find a procedure that will eithercompletely include both or treat one or theother separately; (2) the survey design andestimation procedures are complex and, accord-ing y, require computationally involved tech-niques for the calculation of variances; and (.3)hundreds of statistics are presented in the tablesin this report, many for subclasses of thepopulation for which there were small numbersof sample cases. Estimates of sampling error areobtained from the sample data and are them-selves subject to sampling error when the num-ber of cases in a ceil is smrdl or, even occasion-ally, when the number of cases is substantial.
Estimates of the standard errors for selectedstatistics used in this report are presented in thedetailed tables. These estimates have been pre-pared by a replication technique that yieldsoverall variabilityy through observation of vari-ability among random subsamples of the totalsample. Again, readers are reminded that theseestimated sampling errors do not reflect anyresidual bias that might still be present after theattempted correction for nonresponse. Thestandard error is primarily a measure of sampIingvariabilityy; that is, the variations that mightoccur by chance because ordy a sample of thepopulation has been surveyed. As calculated forthis report, the standard error also reflects partof the variation that arises in the measurementprocess. It does not include estimates of anybiases that might exist in the data. The chancesare about 68 out of 100 that an estimate fromthe sample would differ from a complete censusby less than the standard error. The chances areabout 95 out of 100 that the difference wouldbe less than twice the standard error and about99 out of 100 that it wouId be less than 2%times as large.
000
65

APPIENDIX II
DEMOGRAPHIC AND SOCIOECONOMIC TERMS
Age. –The age recorded for each examinelewas the age at last birthday at the time ofexamination. The age criterion for inclusion inthe sample used in this survey was defined asage at time of census interview. In this samplethere were a few examinees who were 74 yearsof age at the time of interview but 75 years ofage at examination. In the adjustment andweighting procedures used to produce nationalestimates, these persons were included in the74-year-old group.
Race. –Race was recorded as “white,”“Negro,” or “other.” “Other” includes Jap-anese, Chinese, American Indian, IKorean, Es-kimo, and all races other than white and Negro.Mexicans were included with white unless defin-itely known to be American Indian or of othernonwhite race. Negroes and persons of mixedNegro and other parentage were recorded asNegro. When a person of mixed racial back-ground was uncertain about his race, the race ofhis father was recorded.
Geographic rep”on. –The 48 contiguous State:;and the District of Columbia (not Alaska andHawaii) were stratified into 4 broad geographicregions of about equal population size. With afew exceptions the compositions of the regiomwere as follows:
Region
Northeast . . . .
Midwest . . . . .
South . . . . . . .
States included
Maine, New Hampshire, Vermont, Massa-
chusetts, Connecticut, Rhode Island, New
York, New Jersey, Pennsylvania
Ohio, Michigan, Indiana, Illinois, Wisconsin,
Minnesota, Iowa, Missouri
Delaware, Maryland, Virginia, West Virginia,
Kentucky, Arkansas, Tennessee, North
Carolina, South Carolina, Georgia, Florida,
Alabama, Mississippi, Louisiana; District of
Columbia
West . . . . . . . . Washington, Oregon, Idaho, Montana,
Wyoming, Colorado, Utah, Nevada, Cal-
ifornia, Arizona, New Mexico, Texas, Okla-
homa, Kansas, Nebraska, South Dakota,
North Dakota
In a few instances the actual boundaries ofthe regions do not follow State lines. Somestrata in the Midwest and South include PSU’Sactually located in the West. Similarly, somestrata in the West contain PSU’S located in theMidwest and South.
Urban-rural. –The classification of urban-ruralareas is that used in the 1960 census. Accordingto the 1960 definition, those areas consideredurban are: (1) places of 2,500 inhabitants ormore incorporated as cities, boroughs, villages,and towns (except towns in New England, NewYork, and Wisconsin); (2) the densely settledurban fringe, whether incorporated or unin-corporated, of urbanized areas; (3) towns in NewEngland and townships in New Jersey andPennsylvania that contain no incorporated mu-nicipalities as subdivisions and have either 2,500inhabitants or more, or a population of 2,500 to25,000 and a density of 1,500 persons persquare mile; (4) counties in States other than theNew England States, New Jersey, and Pennsyl-vania that have no incorporated municipalitieswithin their boundaries and have a density of1,500 persons or more per square mile; and (5)unincorporated places of 2,500 inhabitants ormore which are not included in an37 urbanfringe. The remaining population is classified asrural.
66
By means of the first digit of the identifica-tion code on the household questionnaire, theurban and rural population is divided into thefollowing categories according to population:(1) urban, 3,000,000 or more; (2) urban,1,000,000-2,999,999; (3) urban, 250,000-999,999; (4) urban, under 250,000; (5) urbannot in urbanized area, 25,000 or more; (6) urbannot in urbanized areas, 10,000-24,999; (7) urbannot in urbanized area, 2,500-9,999; and (8)rural.
Family income. –The income recorded is thetotal income received during the 12 monthsprior to the interview by the head of thehousehold and all other household membersrelated to the head. This income is the gross cashincome (excluding pay in kind) except in thecase of a family with its own farm or business.In that instance net income is recorded. Alsoincluded is the incomeArmed Forces living at
of ahome
member of thewith his family
o
(even though he is not considered a householdmember). If he is not living at home, allotmentsand other money received by the family fromhim are included in the family income figure.
Education. –The only grades counted arethose that have been attended in a “regular”school where persons are given formal educa-tion–either graded public or private schools, dayor night, full-time or part-time attendance. Aregular school is one that advances a persontoward an elementary certificate or high schooldiploma, or a college, university, or professionalschool degree. Education received in vocational,trade, or business schools outside the regularschool system is not counted in determining thehighest grade of schooI completed. If a personattended school in a foreign country, at anungraded school, under a tutor, or under otherspecial circumstances, the nearest equivalent ofhis highest grade attended is assigned.
00
*U.S. GOVERNMENT PRINTING OFFICE: 1977-241.1805
67

T
Sen”es 1.
Sen-es 2.
Series 3,
Sert”es 4.
VITAL AND HEALTH STATISTICS PUBLICATIONS SERIES
Formerly public Health Service publication No. 1000
Programs and Collection I+ocedures. –Reports which describe the general programs of the National
Center for Health Statistics and its offices and divisions, data collection methods used, definitions, andother material necessary for understanding the data.
Data Evaluation and Methods Research. –Studies of new statistical methodology including experimental
tests of new survey methods, studies of vital statistics collection methods, new analytical techniques,objective evaluations of reliability of collected data, contributions to statistical theory.
Analytical Studies. –Reports presenting analytical or interpretive studies based on vital and healthstatistics, carrying the analysis further than the expository types of reports in tbe other series.
Documents and Co remittee Reports. –Final reports of major committees concerned with vital andhealth statistics, and documents such as recoin-mended model vital registration laws and revised birthand death certificates.
Series 10. Data from the Health Interview Survey. –Statistics on illness; accidental injuries; disability; use ofhospital, medical, dental, and other services; and other health-related topics, based on data collected ina continuing national household interview survey.
Series 11. Data j+om the Health Examination Survey. –Data from direct examination, testing, and measurementof national samples of the civilian, noninstitutionalized population provide the basis for two types ofreports: (1) estimates of the medically defined prevalence of specific diseases in the United States andthe distributions of the population with respect to physical, physiological, and psychological charac-teristics; and (2) analysis of relationships among the various measurements without reference to anexplicit fiiite universe of persons.
Series 12. Data from the Institutionalized Population Surveys. –Discontinued effective 1975. Future reports fromthese surveys will be in Series 13.
Serz”es 13. Data on Health Resources Utilization. –Statistics on the utilization of health manpower and facilitiesproviding long-term care, ambulatory care, hospital care, and family planning services.
!%n”es 14. Data on Health Resources: Manpower and Facilities. -Statistics on the numbers, geographic distrib-ution, and characteristics of health resources including physicians, dentists, nurses, other health occu-pations, hospitals, nursing homes, and outpatient facilities.
Series 20. Data on Mortality .-Various statistics on mortality other than as included in regular annual or monthlyreports. Special anal yses by cause of death, age, and other demographic variables; geographic and time
series analyses; and statistics on characteristics of deaths not available from the vital records, based onsample surveys of those records.
Sm”es 21. Data on Natality, Marriage, and Divorce. –Various statistics on natality, marriage, and divorce otherthan as included in regular annual or monthly reports. Special analyses by demographic variables;geographic and time series analyses; studies of fertility; and statistics on characteristics of births notavailable from the vital records, based on sample surveys of those records.
Sm”es 22, Dab from the National Mortality and Natality Surveys. –Discontinued effective 1975. Future reportsfrom these sample surveys based on vital records will be included in Series 20 and 21, respectively.
Serz”es23. Data from the National Survey of Family Growth. –Statistics on fertility, family formation and dk.so-lution, family planning, and related maternal and infant health topics derived from a biennial survey ofa nationwide probability sample of ever-married women 15-44 years of age.
For a list of titles of reports published in these series, write to: Scientific and Technical Information BranchNational Center for Health StatisticsPublic Health Service, HRARockville, Md. 20857
