visual acuity and its measurement
TRANSCRIPT

oPHfHRtitol0G'vclrilcs ocTOß|H RThCßICR
Ophthalmol Cl in N Am 16 (2003) 155 170
Visual acuity and its measurement
Christoph Kniestedt, MDo'b, Robert L. Stamper, MDU'*lDepartment o/ Ophthulnologt', Universih o.f Culilörnia, Roon K301. l0 Korer llav. San Frant'is<o. CA 94143-0730. L'5.4
bDepartntent oJ'Ophthulnologt'. Llniver.sitt Hospitul. Zurich. Suit:erland
Vision is one of the, if not the, most imponantsenses. It has been said that approximately 80% oftheinibrmation from the outside world is incorporatedthrough the visual pathrvays. Loss of vision has aprolound effect on the quality of life. Yet, for allvision's importance to each of us, the most commonclinical measurement of i t is relat ively crude andnarrow. The process of vision includes many func-t ions. such as central resolut ion (visual acuity). nrin-imal light sensitiviry, contrast sensitivit-v. detection ofmotion. color perception, color contrast. and peri-pheral vision (divided into spatial, temporal, motiondetection) plus the interpretive processes that occur inthe inner retina and the cerebral cortex. In the nomtalclinical sefting, we measure only one of these func-t ions-central resolut ion at high contrast (visualacuity). That this one simple test does a pretty goodjob of detecting rnost visual dysfunction is tmlyamazing. Despite the fact that visual acuity is to allof visual perception as the elephant's trunk is to thewhole elephant, it works as an acceptable screeningtest in the real world.
Millennia ago, our ancestors recognized that per-sons dif fer in their abi l i ry to see. The ancient Egyptiansassessed visual function based on the ability o1' aperson to perceive the trvin stars Mizar and Alkor,rvhich are situated inside the Big Dipper. In 1674 theEnglishman Robert Hooke reported the first systenl-atically documented measurements of the visual powerof the human eye. He realized that hvo stars musl beseparated by more than 30 seconds ofarc to be detectedas two independent l ight st imuli . To check visualresolution in a more convenient manner. different
* Corresponding author.E-mail address: stamperadritsa.ucsledu (R.L. Stamper).
0896-1549/03/$ see front matter'!: 2003, Elsevier lnc. All riehts reserved.doi : I 0. I 0 l 6/50896- l 5.19(03)000 I 3-0
investigators proposed charts cornposed of letters.The one with the first scientific basis rvas the Donde rs"E." Donders introduced the unir I minute of arc asthe smal les t ang le o f reso lu t ion in humans anddesigned his "E" letter on this unit . Snellen andDonders published their breakthrough in standardiza-tion ofvisual acuity testing in I 862. but the chart basedon their work was not accepted until the Xth lnter-national Congress of Ophthalmoloey in Luceme 1904
[1.2]. Thev inspired several ophthalmologists to fur-ther irrrprove visual testing procedures. On the occa-sion of XIth International Congress of Ophthalmologyin Naples 1909, the Landolt C rin,qs rvere introducedand accepted as the basis for visual acuity charts by theintemational community of ophthalmologists (Fig. 1).For further specifications about Landolt C ring, see theCharts and scales to express visual acuiry section.
Definition and terminologl' of visual acuitv
The ntost basic tbrm of visual perception isdetecting l ight. The simplest visibi l i ty target is a pointof light, sr,rch as a star. Although stars appear to havedifferent sizes and levels of blightness, theil visualangles are more or less the same. Hence. seeing themdepends on intensity rather than size. Indeed, whenthe sky is perfectly dark, the r,,isibility of a star is ameasure of the absolute threshold of vision. As thesky l ightens, the star becomes invisible. Because i tssize has not changed, i t nlust be that the star 'sintensity can no longer be seen above the l ightersurround. ln other words, tlre contrast (the differencebetween lhe target and surror"rnd) has diminished. Afaint star is made visible with a telescope not so muchby magnifying but by the light gathering capacit-v ofthe instn-rrnent.

TI
5bI
t_
C. Kniestedt, R.L. Sntmper / Ophthalmol CIin N Am l6 (2003) 155-170
Fig. 1. Landolt C and minimal angle of resolution.
Visual acuity is more than just detecting light; it isthe measurement of the ability to discriminate twostimuli separated in space at high contrast comparedwith the background. The minimal angle of resolutionthat allows a human optic system to identiflz twopoints as different stimuli is defined as the thresholdof resolution; visual acuity is the reciprocal of thethreshold of resolut ion. Cl inical ly. discriminatingletters on a chart determines this, but this task alsorequires recognition of the form and shape of theletters, which are processes that also involve highercenters of visual perception. Discrimination at aretinal level may therefore be determined by lesscomplex stimuli, such as confiast sensitivity gatings.Theoretically, the maximum resolving power of thehuman retina could be derived from an estimate of theangle ofapproximately 20 seconds ofarc because thisrepresents the smallest unit distance between twoindividually stimulated cones. Thus, the resolvingpower of the eye could be much greater than whatis measured by visual acuity charts, as noted later inthis section on hyperacuity. Cones subserve the high-est discriminatory capacity. but rods can also achievesome resolution. The level of acuity falls off rapidlythe greater the distance from the fovea. At approx-imately a 5o distance from the foveal center, visualacuity is only one quarter of foveal acuity [3].Because rod and cone longitudinal dimensions arenot sultciently different to explain the marked dif-ference in acuity and because the resolving power ofthe eye is greater than the theoretical limits based oncell size, other mechanisms nust underpin visualacuity. Luminance of the test object, optical abena-tions of the eye, and the degree of adaptation of theobserv'er are examples [4]. These considerationsillustrate that one simple definition of visual acuityis not likely to satisfy.
Visual thresholds can be broadly classified intothree groups: light discrimination (minimum visible,minimurn perceptible), spatial discrimination (min-imum separable, rninimum discriminable), and tem-poral discrimination, which refers to the perception oftransient visual phenomena such as flickering stimuli
[2]. Thus, many clinical tests of visual function assess
several functions simultaneously: Looking at thesky, we see the visibility of stars, the contrast ofthe moon, the shape and texture of the clouds, weresolve the airplane and recognize its motion, and wediscriminate the manifold hues of the sunrise. Each ofthese visual tasks uses different visual and neuro-logic processes.
The minimum visible is a l ight discriminationfunction. It includes brightness sensitivity and bright-ness discrimination. Minimum visible acuity is theability to detect a small difference in the brightness offwo light sources (Fig. 2). It determines the presence orabsence ofa target against a background. The physio-logic term is local brightness difference threshold (Al)(Table 1). For a more practical example, we refer to theexperiment in which one measures the minimum widthof a telephone wire that can be seen against a uniformlycolored sky. The threshold value is on the order ofI second ofarc; this represents a very small fraction ofthe diameter of a retinal photoreceptor.
Thus the minimum visible is not determined bythe visual angle subtended by an object but rather byits brightness relative to background illumination.Some authors use the term minimum perceptible fotbrightness discrimination and the term minimum
Object(Spotlight)
Optics
Image
Receptors
Fig. 2. Minimum visible

C. Kniestedt. R.L. Sramper / Ophrhalmol Clin N Am 16 (2003) 155 170
Table 1Classification of visual acuity according to criteria
ts7
Criterion Minimum vis ib le Minimum resolvable' Minimum discriminableb
Task
'Iypical forced choice
psychophysical question
Physiologic basis
Method of measurement
Magnitude of best thresholdIlflect of irnage degradation
Determine presence orabsence of a target
ls there a line in this fieldllIf there was a line in thefield. rvas it horizontal orvert ical? (Fig. 2)Local brightnessdifference threshold
Vary object size
Approximately I sec of arcModerate
Determine presence ot, ordistinguish between morethan one, identifying
feature in a visible targetAre there one or tivo lines?
Is the gap in the C up. down.r ight , or lef t l (F ig. 3)
Detection of brightnessdifferences between severaladjoining small areas.Vary object size or spacingbetween object componentsApproximately 30 sec. of arcSerious
Determine relative location oltwo or more visible featureswith respect to each other
ls the upper line to the rightor the left of the lower line?(Fig. 4A)
Assignment of relative localsigns to two or moresuprathreshold visual feahrresVary relative locationof featuresApprorimately | 3 sec of arcSlight (except in stereoacuity)
' Minimum resolvable - minimum seDarable - ordinarv visual acuitv.n Mini rnum discnminable - Vemier acuiry = hyperacui ty.
Modilied./iom WestheimerG. Visuat Acuity. In: Moses R, editor. Adler's physiology of the eye. St. Louis: Mosbv: 1987. p.418.
visible for brightness sensitivity alone. Other exam-ples of light discrimination are brightness conftastand color discrimination.
Visual acuity as measured clinically is also calledminimum resolvable or minimum separable. It is aspatial discrimination function representing the small-est visual angle at which two separate objects can bediscriminated (Fig. 3). From a physiologic point ofview. it is the detection of brightness differencesbetween ad jo in ing smal l a reas and. there fore ,depends on object contrast and the packing densiryof photoreceptors in the fovea. In a healthy observerin best focus, the resolution limit or, as it is usually
called, the minimum angle of resolution (MAR) isbetween 30 seconds of arc and 1 minute of arc.Clinical ly, we use such systems to assess visualacuity, and examples of minimum resolvable includethe Landolt C and Snellen E.
T he m i n i m u m d i s c r i m i n a b I e (hyp e r a c u i t 1,*, Ve r n i e racuiry) is another example of spatial discrimination. Itdetermines the relat ive location of two or morevisible feahrres with respect to each other. Astonish'ingly, the eye is capable of subtle discrimination inspatial localization and can detect misalignment ol'two line segnents in a lrontal plane if these segmentsare separated by as little as 3 to 5 seconds of arc,considerably less than the diameter of a single fovealcone. The mechanism subserving hyperacuity is stillbeing explored [5] (Fig. a).
Fig. 4. Minirnum discnminable. (l,B) Types of misalign-ment detected by this function. (O The more conventionallyused minimum resolvable distance betu'een two obiects.
Objects(2 Spotlights)
Optics
Images
Receptors
) \B
"1"A
Fig. 3. Mini rnum resolvable.

1 5 8 Kniestedt. R.L. Stamper Ophthalntol Clin N.4n l6 (2003) 155-170
Minimum legible or recognition threshold is usedcommonly cl inical ly and is included in visr.ral acu-i ty measurements using optotypes or shapes. I tmeans the patient's ability to recognize progressivelysmaller optotypes. The angle that the smallest rec-ognizable letter subtends on the ret ina is also ameasure of visual acuit ir . Therefore, the cl inicalmeasurement of visual acuity with a Snellen-rypechart includes minimum resolvable and minimumlegible functions.
Charts and scales to express visual acuitv
The Landolt C (Fig. l) uses a r ing with an outerdiametcr subtending 5 minutes of arc at the observ-er's eye and an inner diameter subtending 3 minutesof arc as a reference target. A gap I minute of arcwide is made as a ring. and the rine is presented withits opening in one of tr.r,o horizontal and two verticalpossible posit ions. The subject has to indicate inwhich direction the gap rn the C is pointing. Thesmallest C in which the subject can corectly identifothe gap is the visual acuity. At an obsen'er distance of20 feet (6 m). the overall size of the letter is 8.7J rnmand the gap is 1.75 mm. If this is the sub.ject 'sthreshold that is, i f the lninimum angle of resolut ionis I nrinute of arc the visual acuity is defined as20120 (in feet) and 6/6 (in meters), respectively.
The most familiar examination chart is the Snellenchart. I t is designed to measure visual acuity inangular tenns. Thus. Snellen acuity is commonlyequated with visual acuify. ln a healthy obsen'er inbest fbcus, the resolution limit is between 30 seconds
and I minute of arc. The Snellen chart consists ofletters ofdifferent visual angles. The letters (and theirparts) are proport ionately enlarged in somewhatinegular increments on each line up to the 201200or 20/400 size. Commonly. the overall size of thelefter is t-rve times the width of each limb (Fig. 5). Thesubject is asked to read the chafi from easil_,- seen tosmaller and smaller letters. The smallest line on thechart that the subject can read is usually said tosignify visual acuity. One or two mistakes per lineare often allowed.
As with the Landolt rings. acuity is recorded as afraclion. The number of feet at which the chart islocated (20 ft [6 m] bv convention) becomc's thenumeralor. The denorninator is the line with thesmallest letters in which all but fwo of the lettersare read correctly. Sometimes, especially in Europeand other parts ofthe world. the acuity is recorded asa decimal. The decimal system of acuity notat ionrepresents the reciprocal of the visual angle inminutes or the numeric l'alue of the fractional Snellennotation. For example. a r, isual acuity of 1.0 wouldbe equivalent Io 20120 (6/6) and one of 0.5 would be20140 (6t2).
If resolution is sharper than the 20120 line, thenotation still keeps the standard characteristic. Sup-pose that one has a minimal angle of resolution of0.75 minute of arc that is. at 20 feet he can resolve aletter with a feature that subtends 1.3 mm and whoseoverall size is 6.5 mm. Such a letter has a gap thatsubtends I minute of arc at l-5 feet (4.5 m) and wouldbe resolvable by an observer rvith 1 minute of arcresolut ion at such a distance. The subject is then saidto have visual acuity of 20/15 or 614.5.
| 5 min. of arc I
Fig. 5. )0 20 Snel len lener "F. .
T.I r mrn.
I ofarc

C. Knie.stedt, R.L. Stomper./Ophthalmol CIin N Am I6 (2003) 155-170 1 5 9
Early Treatnrent Diabetic RetinopathyStudy charts
Standardization of visual acuity is difficult whenprecise data are required. The standard Snellen eyechart (Fig. 6) contains lines of letters that are notrelated to one another by a linear size progression in ageometric or logarithmic sense. The main disadvan-tages of t 'onner charts are Inconsistent increase inletter size frorn one line to another. Going from the20/20 line to the 20/25 line is different from thatgoing from the 20125 line to the 20/30 line forinstance. In addition. all letters in the alphabet arenot equally legible. Certain letters (C, D, O, G, E) areinherently harder to recognize than others (A, J. L).Finally, they offer a dit-lerent number of lefters oneach l ine. Al lowing one mistake per l ine, therefore.has a different meaning at different levels of visualacuity. Furthermore, variability in background andarrrbient i l lunrination and contrast changes as thecharts age rnake it difficult to truly assess visualacuity over time and fiom patient to patient. There-fore. researchers needed a more standardizable
method of measuring visual acuiry. This is especiallyso in clinical trials in which visual acuiry is measuredover a period of time and changes represent anoutcome of the study, or in which several examinersin different locations perform measurements.
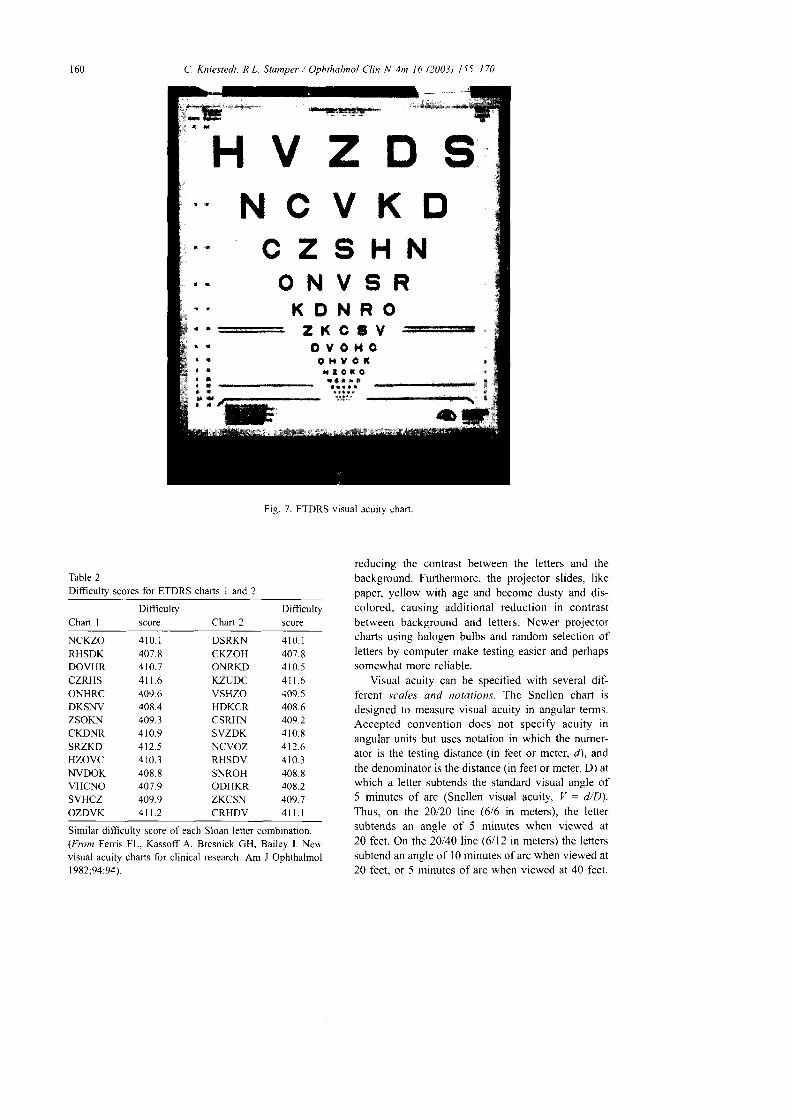
For the Early Treatment Diabetic RetinopathyStudy (ETDRS) in the early 1980s [6], more stand-ardized charts were inlroduced based on the designcreated by Bailey and Lovie [7]. Recommendationsof the Comrnittee on Vision of the National Academyof Science National Research Council (NAS-NRC)were also considered [8.9]. The ETDRS light boxchart is seen in Fig. 7. ETDRS charts seftled most ofthe disadvantages of the Snellen-type chart. Fiveletters are presented on each line. Spaces betweenletters and lines have been standardized so that thespace between letters is one letter rvide and the spacebetween lines is equal in height to the letters of thenext lower line. Letter sizes range from 58.18 mm to2.92 mm, providing a visual acuity equivalent of 20l200 to 20110 or, at a distance of 4 rn. 4/40 to 4i2, forwhich this letter chart was designed. The progressionof letter height from line to line is geometric. Letterson each line are 1.2589 times the height of the letterson the next lower line. The multiplier is the tenth rootof 10, or 0.t log unit. Ten Sloan letters had beenchosen for the ETDRS chart, namely S, D, K, H. N,O, C, V R, and Z. The dit'ficulty score of each letteris approximately equal to each other and to a LandoltC ring. Two hundred fifty-two combinations of fiveletters that can be lined up from the l0 Sloan lettersare possible. Trventy-eight of those level at the sameletter difficulty score and are therefore chosen for thecharts [9] (Table 2).
The charts are used in a standard light box. Thechart can be offered not only at 4 m but also, becausevisual acuity is often severely impaired in low-visionpatients, at a reduced test distance of I m. Visualacuities as low as 201800 can be noted in this way.For proper examination, the examinee reads slowlydown the chart, letter by letter. Only one trial of eachletter is allowed. When a letter is read correctly,even based on a vague guess, the examiner circlesthis letter on his score slreet. Visual acuity is re-corded as the smallest line read by each eye rvithoutany mistake.
In recent years, several variations on the Snellenchart have been introduced. The oldest is the pro-jector chart. which is usually used with mirrors tosimulate a 20-ft (6-m) optical distance. These chartshave the advantage of being usable in lanes smallerthan 20 feet rvhile still maintaining the traditionaltesting "distance" optically. As the bulbs in projectorchafis age. however, their illumination decreases,
Pz
rT
&k
LPTDPTCTDTDFCZP
T A L O P Z D
D t T P O T A C
t t r o ! ! c r { *
r ! r t ! e * o ä S
t I ! o r s ! I ! . ] . l f f i
l
I
*
Fig. 6. Standard Snellen chart
160 C. Kniestedt, R.L. Stamper / Ophthalmol Clin N Am 16 (2003) 155 170
_=:_:r!F_
t a
!
t
EVl,l Oc ir $r $
ctO l,lv c6 r {I r $
XrI r
' Hx lt a
3Xov
O Hx lt a
t lt t1 *
* öt *
Fiq. 7. ETDRS visual acuitv chart.
Difficulfy
Chart I score
Table 2Difficulty scores for ETDRS charts I and 2
L nart I
Difticultyscore
4 1 0 . I407.84 l 0 .5411.6409.5408.6409.24 1 0 . 8412.64 1 0 . 3408.8408.2409.74n. l
Similar difficulty score of each Sloan letter combination.(Froz Ferris FL, Kassoff A. Bresnick GH, Bailey I. Neu,visual acuity charts for clinical research. Am J Ophthalmol1982:94:94\.
reducing the contrast befween the lefters and thebackground. Furthermore, the projector slides, likepaper, yellow with age and become dusty and dis-colored, causing additional reduction in contrastbetween background and letters. Newer projectorcharts using halogen bulbs and random selection ofletters by computer make testing easier and perhapssomewhat more reliable.
Visual acuity can be specified with several di{:ferent sc'ale.r and notations. The Snellen chart isdesigned to measure visual acuity in angular terms.Accepted convention does not specify acuity inangular units but uses notation in which the numer-ator is the testing distance (in feet or meter. d), andthe denominator is the distance (in feet or meter, D) atwhich a letter subtends the standard visual angle of5 minutes of arc (Snellen visual acluiry, V : d/D).Thus, on the 20120 line (6/6 in meters), the leftersubtends an angle of 5 minutes when viewed at20 feet. On the 20140 line (6112 in meters) the letterssubtend an angle of I 0 minutes of arc when viewed at20 feet, or 5 minutes of arc when viewed at 40 feet.
NCKZORHSDKDOVHRCZRHSONHRCDKSNVZSOKNCKDNRSRZKDHZOVCNVDOKVHCNOSVHCZOZDVK
4 1 0 . 1407.8410.74n.6409.6408.4409.34 1 0 . 9412.54 1 0 . 3408.8407.9409.9411.2
DSRKNCKZOHONRKDKZUDCVSHZOHDKCRCSRHNSVZDKNCVOZRHSDVSNROHODHKRZKCSNCRHDV
H V Z D SNCVKN
CZSHNONVSR
KONROa a r e

C. Kniestedt. R.L
Table lEquivalent l,isual acuity measurements
Stumper i Ophthulmol CIin N Am 16 (2003) 155-170
In Europe, the most clinically used description ofvisual acuiry is the decimal fraction of Snellen visualacuity. Decimal visual acuity is obtained by dividingthe numerator of the Snellen fraction by the denom-inator. The reciprocal of the Snellen ftaction repre-sents the minimurn angle of resolution or rccognition(MAR). The base l0 logarithm of the reciprocalSnellen fraction approximates the logarithrn of theminimal angle of resolution (LogMAR), which rep-resents a linear scoring systern in contrast to all othernonlinear visual acuity scores. The ETDRS chart wasdesigned with LogMAR scoring in mind, and, as seenin Table 3, there is a 0.1 LogMAR unit diff,erencebefween each iine. It is possible to get an interpolated(between 0. I LogMAR unit) $,ith the ETDRS chartwith five letlers on every line, by assigning 0.02LogMAR units for each single letter read correctly oneach line. This principle can be extended to situationsin which some letters on several lines are missed.
Near visual acuity
As with distance acuity. letter size and readingdistance are needed to calculate near visual acuityproperly. lt is a bad habit of many practitioners to
l 6 l
Snel len v isuai acui ty
20 il 6 m 4 rn Decimal MAR" LogMAR
20/640 6i19220/500 6il52201400 6tr2020i320 6t9620t250 6t7620t200 6i60201160 6t4820n25 6/3820/r00 6/3020t80 6i2420t63 6t2020t50 6^520140 6t\220t32 6/ l020/25 6i7.520t20 61620116 6/520^2.5 613.7520t'10 6i3
3 2 1 . 52-5 t .420.0 1 .31 6 1 . 212.5 L I1 0 . 0 I . 08 .0 0 .96 .3 0 .85 .0 0 .11.0 0.63 .2 0 .s2 .5 0 .42 .0 0 .11 . 6 0 . 2r . 2 5 0 . 11 . 0 00 . 8 - 0 . 10.63 - 0.20 .5 - 0 .3
4t 128.1/ I 004/8041634t504/404t324t254t204 i t64112.64/l 04t84/6.41154144t3.24t2.5/ / 1
0.030.040.050.0630.080 . r 00 .1250 . t 60.200.250.320.400.500.630.80
02560
2.0
Snellen Visual Acuity in meters and feet, decinral notation,MAR. and IogMAR.ETDRS charts are based on linear LogMAR score.
' MAR, minimal angle of resolution (minute of arc).
No. 2
No. 3
No. 4b * . - 4 b s . r b \ | * b Lb * r h i l i F ! t u - F . r d
r F , r t ' | .5 e F E ü
r r a . b * d - b r q o b . ' E b b l
No. 5o a b | t 4 ü b q B F d & + U. b & - a h t d D 4 h b . 4b i l t u r d . . . 1 . . t u . - . ü d l 4 bd q F h i b , b * b F - d ü l
N o . 6
&tua. d hq. ca h +&d d.k.& ry. ulwlo.rt ü h dG blt u ü c $ E b u * - u s b l f l . t u. fd . rddn *y . r .6 f r ryc rEp
No- 7
Dd di*oblod.tu oDticdcftlion ior
tho Et-&G.Eor i. fdnd in F&1.lsra. Ia n.üdöLdnE . [email protected]"
No. I
aphericd len. dll qu6 tl|e lcal
poiDt to Eed? util it trüIr
dimtly on the Etiu
No,12
while in far-eightednesa
the foal polnt mn bNo. to
advrnced with a
eonYexlens .ü
concaYe,.
morn-JAEGERS IESI TYPES
Fig. l i . Jaeger near acuiry chan

t62
record just the letter size read without specifoing thereading distance. Conventionally, reading vision isexamined at 40 cm ( l6 in, 2.5 D add) or 35 cm ( l4 in,3 D add). The testing distance of the preferred neardistance chart should be obsen,ed accurately. Snellen,Jaeger, and point system (printer's type) notations areused for this. The Snellen notation is simply anequivalent reduction for near, maintaining the samevisual angle. Most of the Snellen-based distanceacuity charts are also commercial ly avai lable as"pocket" charts to check the irear acuity at theprefened distance for every patient or at defineddistances for cl inical tr ial purposes (see below),including ETDRS variants and Snellen letter "E."The Jaeger notation is a historic enigma. and Jaegernever committed himself to the distance at which theprint should be used. The numbers on the Jaeger chartsimply refer to the numbers on the boxes in the printshop from which Jaeger selected his type sizes inI 854; they have no biologic or optical foundation.They have no mathematical background and are evenimplemented inconsistently on different cards. Clin-ically, they are still widely used and are well acceptedby patients (Fig. 8). Not much more precise is thepoint system, doubtless useful to the printing trade forwhich it was arbitrarily adopted but not for clinical,much less scientific, measurements. Within one typestyle, they are proportional to the letter size. How-
Table 4Visual acuity equivalents for near
C. Knie.stedt, R.L. Stamper / Ophthalmol CIin N Am 16 (2003) 155-170
ever, actual letter size may vary for characters ofdifferent styles.
M-units were introduced by Sloan !01. They arethe units used in Snellen's visual acuity formula.They are the same for distance charts and readingcharts. Characters with the same M-unit designationhave the same recognizability. M-units are explainedin detail later in this section.
Interconversion from one near system to anotheris, unfortunately, approximate. Thus, 6-point type isapproximately equivalent to Jaeger 4 (J4), which isapproximately equivalent to Snellen 20/40, 0.5 indecimal system, and 0.3 LogMAR, which is, morepractically expressed, the size of print in a telephonedirectory. The letter size notation in this case wouldbe 0.8 M. Table 4 shows several visual acuitynotations for near.
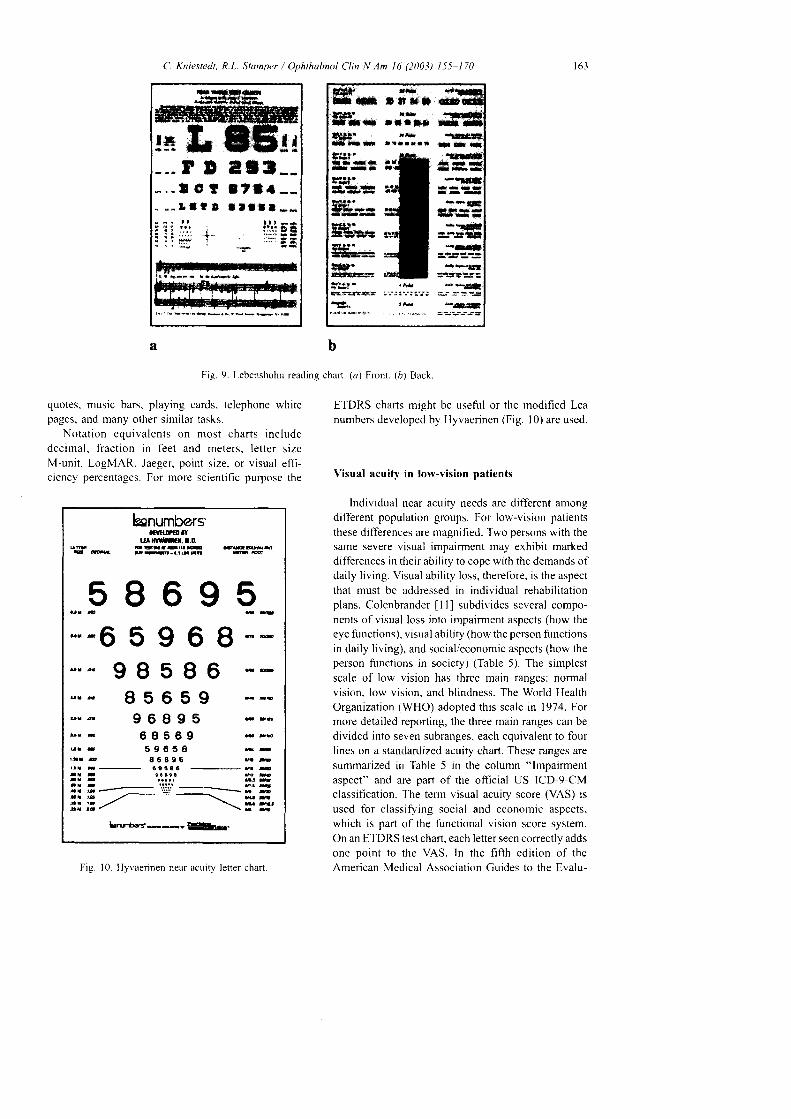
Reading charts are often more suitable than ordi-nary letter charts for testing near acuity because theytake the patient's daily reading needs into account.Numerous reading charts are commercially availablebased on the patient's daily contemporary needs,including Jaeger reading charts (Fig. 8). A full rangeof near point tasks, including words, numbers, andsymbols, is also provided by the Lebensohn nearpoint chart (Fig. 9). Schrier and Panariello included intheir charts a crossword puzzle, schedules for trains,flights, football and basketball, an obituary. stock
Snellen visual acuiry
Jaeger Point Letter size 2 0 f t b m 14 i n Decimal LogMar
l 9l 8l 6l 4t 2l 08o5
3 - 42 - 31 a
l +
60402624l 8t 417.986543
6.3 M5.0 M4.0 M3.2 M2.5 M2.0 M1 . 6 M1.25 M1 . 0 M0.8 M0.63 M0.5 M0.4 M0.32 M0.25 M0.2 M
20t32020/25020/20020il6020,l2520il0020i802Q/6320/5020t4020t3220t2520/2020/L620t12.520/t0
6t966/766/606t486/386/306/246t206/156/126lto6t7.56/66 t56/3.7 56/3
t4t222t 4 / l 7 5t4t t40t4 /n2t418714t70t4t56t4t4514/35t412814122t4lt8t4 / t4t4l l t .514t8.75l4t7
0.0630.080 . 10.t250 . 1 60.200.250.320.400.500.630.801 . 0t . 2 51.602.0
L 2l . l
1 . 00.90 .80 .70 .60.s0.40.30.20 . 10
- 0 . 1- 0 .2- 0.3
Interconversion from Jaeger system to Point system is only approximative. Neither type is standardized, and various editions,especially ofthe Jaeger types, exist that show considerable divergence in size, shape, and character ofthe fonts used. The tabledisplays an average of what is found in the literarure and on several near point test charts. LogMar is the only notation with alinear score. l4 inches = 35.6 cm reading distance.
t ,&t3: , J .a r r f l
t t t
, fL'i"rr
. - f . t ! r
i i ;.'.:: -i-.: : ä i
C. Kniestedt, R.L. Stamper / Ophthalmol Clin N Am 16 (2003) 155-170
b
Fig. 9. Lebenshohn reading chart. (a) Front. (r) Back
163
a
quotes, music bars. playing cards, telephone whitepages. and many olher similar tasks.
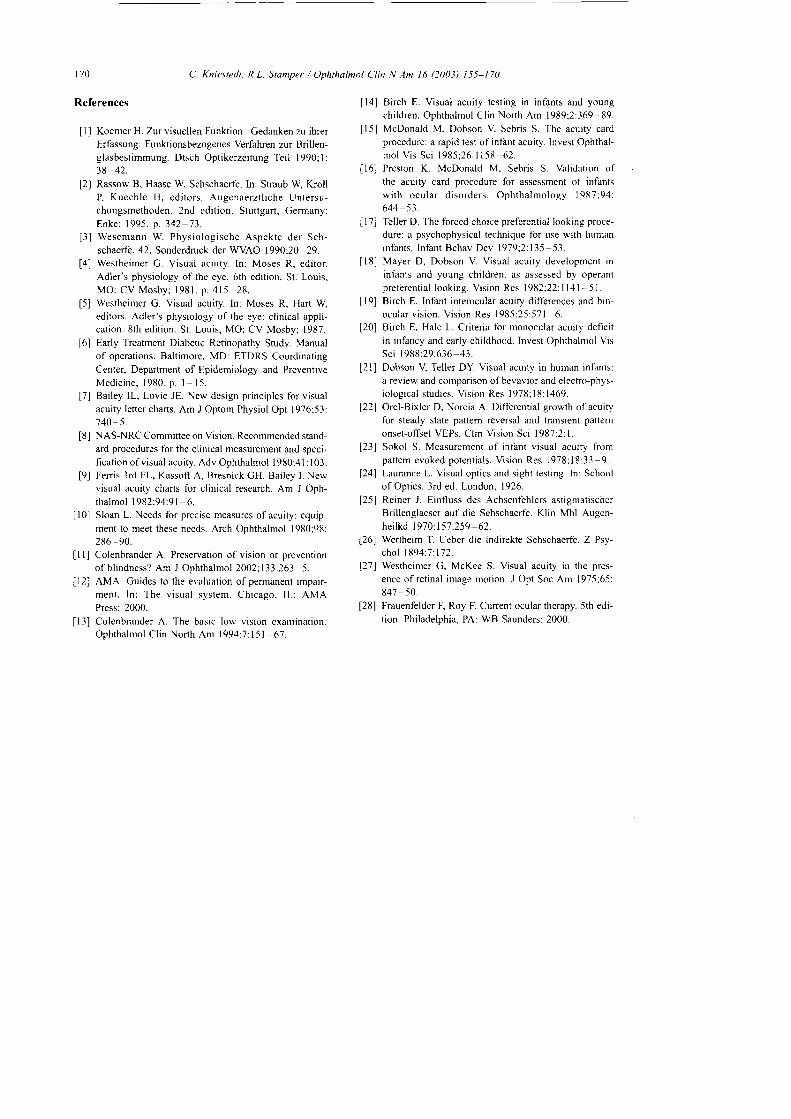
Notation equivalents on most charts includedecirnal, fract ion in feet and meters, Ietter sizeM-unit, LogMAR, Jaeger, point size. or visual effi-ciency percentages. For more scientific purpose the
bnumbersfttüm|Y
tanüt|.1.0.l IE üü t .co .E
E & E E . ' - l t r t ü n r 6 E '
EOACTE=-r - lnv=)V V V Y V
:: :65e68::ürb 9 B 5 I 6 F&
I5 6 5 I { r -g 6 g g 5 - , ü
6 g s 6 g * r ro r r 5 9 6 5 8 B -f r r a 8 6 8 9 6 6 ß
c t i 8 6 - 9 . -- f . o 9 a o t a 6 . 4
r u &
:: ; "'.:.'.' ----. I.3
t . t z - \ E E- . , - t - \ \ r u Et r r t -
bnroery-*.=l$b.
Fig. 10. Hyvaennen near acuit-v letter chart
ETDRS charts might be useful or the rnodified Leanumbers developed by lJyvaerinen (Fig. l0) are used.
Visual acuity in low-vision patients
lndividual near acuity needs are dit'ferent amongdifferent population groups. For low-vision patientsthese differences are magnified. Two persons with thesarne severe visual impairment may exhibit markeddifferences in their ability to cope with the demands ofdaily living. Visual ability loss, therefore. is the aspectthat must be addressed in individual rehabilitationplans. Colenbrander I l ] subdivides several compo-nents ofvisual loss inlo irrpairnrent aspects (how theeye functions), visual ability (how the person functionsin daily living), and social/economic aspects (how theperson functions in society) (Table 5). The simplestscale of low vision has three main ranges: normalvision. low vision. and bl indness. The World HealthOrganization (WHO) adopted this scale in 1974. Formore detailed reporting, the three main ranges can bedivided inlo seven subranges, each equivalent to fourlines on a standardized acuity chart. These ranges aresummarized in Table 5 in the column "lmpairmentaspect" and are paft of the official US ICD-9-CMclassification. I.he term visual acuity score (VAS) isused for classifoing social and economic aspects.which is part of the functional vision score system.On an ETDRS test chart, each letter seen correctly addsone point to the VAS. In the fifth edition of theAmerican Medical Association Guides to the Evalu-
r*:t l ü L s
natrtta.
tä,
. l r f r a r t a t t n l
altrr
ffic.öf f iuilrr * -rH&B.n n -
d l * t* * -
l*t**itrE!!l6
**r*n
ä x*<G

1 6 4 C. Kniesredt. R.L. Stomper / Ophthalnol Clin N1m l6 (2003) 155 170
Table 5Ranges and aspects ofvision loss
Impairment aspects(how the eye function)
Visual ability aspect/functional vision(hou' the person functions-daily living skills)
Social and economic aspects(how the person functionsin society)Ranges
( ICD-9 -CM)Visualacuiry
Nervsprint Statistical estimate( i M) of reading abi l i ty Visual aids VAS Comnrents
Normal vision
Mi ld v is ion loss
20i12.5201162012020i 25l0 '3220t1020/5020i63
Moderate vision loss l0/8020, 1 00t0 [520i160
Severe vision loss 20/20020t25020/320l0;-{00
Profund vision loss 20/50020/63020/80020/ I 000
Near-bl indness 20i 125020/1 6020i2000
Total bl indness NLP
Normal reading speedNormal reading distanceReserve capaciry forsmal l pr intNormal reading speedReduced reading distanceNo reserve for small
Near-nomal withappropnate reading aidsLow-porver magnifiersand large-pnnt booksSlorver than normal with
reading aidsHigh-po*'er rnagnifiers(restricted field)
Marginal with aidsUses magnifiers for spotreading. but may prefertalking books lbr leisure
No visual readingMust rely, on talkingbooks or othernonvisual sources
None I l 0
ll:;I ns
t::t19J/)
Vision '70
enlrancerrent 65aids 60
t;;ttit"1,.I r5
J, i:Visron l0substitution 5aids 0
Note that normal adultvision is better than20i20
Many functional cliteria(whether tbr a driver'slicense or lbr cataract
surgery) lall withinthis range.In the United States.children in this rangequalifl, for sPecialeducation assistance.ln the United States.persons in this rangeare considered legallyblind and quality lbrtax-break disabilitybenefits.In the EU, rnany benefitsstafi at this level. TheWHO includes this rangein its blindness category.
In this rarrge. residualvision tends to beconreunreliable, though itmay still be used asan adjunct to visionsubst i tut ion ski l ls ,
63 in50 i n
40 inl l i n25 i n20 inl 6 i n1 2 . 5 i n
l 0 i n8 i n6 t n5 r n4 l n
l i n2.-s inl i n
1 . 6 i n1 . 2 i nI i n
l c mI crnI cnr
The first section shorvs the ranges of visual impaimrent. as defined in ICD-9-CM. Each group covers fbur lines on an ETDRStest chart. The second section lists reading abilities. Listed performances represent statistical averages and may differ betweenindividual performances. Vision enhancement aids and vision substitution aids are used as vision begins to decreaseprogressively. Vision enhancement aids include magnifiers and higher illumination. Vision substinrtion aids include canes. suidedogs. and talkrns books. The third section lists additional comments and the vrsual acuify score. On an ETDRS chart, each lefterseen adds one point to the visual acuilv score, u'hich is part of the functional vision score system provided by the AmerieanMedical Association Guides to Evaluation of Permanent Imparrment (2000) ll2].(Franr Colenbrander A. Presen'ation of vision or prevention of blindness feditorial]? Am J Ophthalmol 2002;133:2. p. 264.)
at ion o f Permanent Impa i rment [2 ] , th is scorereplaced the visual efficiency scale, which was basedon employability data from 1925.
Commonly uscd visual charls at the typical dis-tance of 20 feet (6 n.)) are. therefore. mostly unsuit-ab le tb r pa t ie r r ts w i th severe v isua l loss . Themeasurement range can be raised by moving the testcharts to a closer distance. At l0 f 'eet (3 m) amagnification fäctor of 2 and at I rn a fäctor of 6can be reached. For reproducing a patient's everyday
function, under low-vision conditions, a printed chartwith extemal illumination should be used instead
[3]. Using a l-m examination distance also faci l i -tates the calculations betu,een the feet/inches and themetlic system that is comrronly used in low-visionoff ices. As mentioned above. Louise Sloan [0]introduced the term M-unit. Its standard acuity isdefined as the ability to recognize a standard letter( I M-unit) at a standard distance of I m or a letterwith the sanle visual angle (-r N,[-units at .y rneters).

C. Kniestedt, R.L. Stamper / Ophthalmol CIin N Am 16 (2003) 155 170 l o i
Using a leftel chart at a l-nr vierving distance
extends the measurable range down to l/50 (20li000)
if a chart rvith 50 M letters is used. It also makes more
letters per line available at each level.
Visual acuity testing in !'oung children
This section summarizes procedures for visual
acuity testing in preverbal infants and young children,
which can be a challenge tbr the examiner and for the
accornpanying parents. Early determination of vision
loss and refractive error is an essential component of'
assessing the infant's ultimate visual development
potential. The examination is generally performed
on the parent's lap. Older children may prefer to sit
alone, as long as a parent or another familiar person
remains present. The room should never be totally
darkened because this may provoke anxiety.
Measurement of visual acuiry is normally per-
formed in the course of determining the refractive
error of the optic system. Objective ret inoscopy
remains the best method of detennining a child's
refraction. Even the most uncooperative child can
undergo retinoscopy if the examiner is patient, espe-
cial ly i f the chi ld has cycloplegia.Other clinical methods involve estimation of fixa-
tion and following behavior. A test larget should
incorporate high-contrast edges. For infants younger
than 6 months. the best target represel)ts the exam-
iner's fäce. For the child of 6 months and older, an
interesting toy can be used. After assessment of the
binocular flxation pattent, the examiner should direct
attention to differences between the two eyes when
tested monocularly. Obiection to occlusion of one eye
may suggest abnormality with the less preferred eye.
To replace fixation preference testing with an
obiective and quantitative method of assessing visual
function, techniques using grating targets of varying
spatial fiequency have evolved. Such methods rely on
the detection of resolution acuity, a more sophis-
ticated measure of visual performance than only
detection of a target as used for fixation assessment.
Three common methods are used for determining
resolution acuity. They rely on behavioral techniques
(preferential looking), detecting optokinetic nystag-
mus (OKN), and recording visual evoked potentials
or responses (VEP or VER).Preferential looking acuity tests use the infant's
innate tendency to gaze at a pattem rather than a blank
field when the pattems are presented side by side in an
otherwise bland environment [14]. By determining the
smallest grating the patient will fixate, resolution
acuity can be assessed and can be expressed in minutes
of arc, LogMAR. or Snellen equivalent. Testing dis-
tance is usually beween 30 cm and I m.
Unfortunately, preferential looking tests are time
and personncl consuming. For faster teslrng. grat ing
test stimuli cards are available [15,16]. A range of
gratings from coarse to fine is used in each test'
Forced-choice preferential looking designed by Teller
(Fig. l l ) ! 71 and operant preferential looking by
Mayer and Dobson [18] are two other widely used
testlng systems.Visual acuity in children can also be estimated by
VEP recordings and by eliciting optokinetic nystag-
mus by stripes of various widths. Both nrethods are
hindered by the complicated apparatus necessary for
their performance.VEP methods provide the examiner with the
summed cortical responses to temporal changes in
pattems. Typically, three gold cup electrodes are
placed over the occipital pole, at ground, and at a
reference point. Infants usually view pattem on an
oscilloscope or a TV screen high-contrast black-
and-white checkerboards or gratings. Personal com-
puters equipped with appropriate hardware and
software are used for signal averaging and filtering
Fig. I l. Teller preferential looking test chan
ilililililllllllll
IIl

t66 C. Kniestedt, R.L. Stamper / Ophthalmol Clin N An l6 (2003) 155-170
to improve the signalto-noise ratio. The VEP iscontaminated by ongoing electroencephalogramactivity and by extemal noise sources.
Visual acuity of newboms is not the same as thatof adults. Normative data of newbom infants. asmeasured by preferential looking, are in the rangeof 30 minutes of arc (201600 Snellen equivalent)
|9 211. Acuity rapidly improves to 6 minutes ofarc (201120) by 3 months. Variability among healthyinfants is greatest during this early period of rapiddevelopment. A steady but modest improvementto approximately 3 minutes of arc (20160) occurs by12 months of age. One minute of arc is usuallyobtained at the age of 3 to 5 years. Interestingly,acuities achieved with the VEP technique show morerapid improvements of visual acuity in an infant'sdeveloping penod [22,231. VEP testing reports showthat acuity of 1 minute ofarc is even achieved by age6 to 7 months. This discrepancy between rates ofacuity development might be that each technique tapsa different stage of neural processing. Furthermorethe preferential looking method requires not only"seeing" but also requires a motor response basedon what is seen. Thus, preferential looking mighthave the disadvantage of being influenced by imma-turities of motor areas.
It is desirable to measure the visual acuity ofchildren sometime during their third year to detectstrabismic or sensory amblyopia and to recognize thepresence of severe refractive errors. In this age group
of preschool children, visual acuity testing is gettingeasier to perform and charts can be used to determinevisual acuity fairly accurately. These charts are basedon symbols and pictures such as the Henry F. AllenPreschool Test or the Osterberg Test (Fig. l2). Illit-erate E charts by playing the "E" game or evenLandolt broken ring by playing the game in which themouse leaves the ring can be performed.
Testing of low vision or examining infants withmultiple handicaps can be discouraging, even startingthe examination with the coarsest and largest pattemavailable. Ifthe infant fails to respond to the coarsestpaffem, it may mean that the infant's visual potentialis poorer than this level. Altematively, it probablymeans that a nonvisual handicap prevents the motorresponse required by preferential looking test or that astructural anomaly may be present and interferingwith the recording of the cortical potentials.
Factors affecting visual acuitv
A diminution of psychologic, physical, and phys-iologic elements in any segment of the human visualpathway and the brain may manifest itself in a reduc-tion in visual acuity. Determination of visual acuityis influenced by the judgment and experience of theobserver, the region of the retina stimulated, the in-tensity and distribution of the illumination, the spectralnature ofthe light, the time ofexposure, the effect of
ggg, 4t,
?rh
B 4 tu
sü ü4
? f fb -
a r t - l a - a r l
- o a a a . a a r - a I
f
".S-
orf{
;"
a b
Fig. 12. Symbol charts (Allen [a] and Osterberg [ö] symbols).

movements of the object, and whether the test isperformed on each eye individually or both eyestogether. Increased illumination not only sends morelight to the retina but also constricts the pupil, enhan-ces depth of focus, modifies accommodation, shiftscolor temperature, alters adaptation, and may inducesuflicient glare to cause the eye to close. Some stimulivariables have effects that are of more universal andclinical interest.
Pupil size
The pupil regulates the amount of light entering thevisual system. This control mechanism can influencevisual acuity considerably (Table 6). A smaller pupilsize increases the eye's depth of focus and objectsremain in focus inside or outside the actual near pointofthe eye, thus making visual acuity less dependent onperfect refraction. Concomitantly, uncorrected orincompletely corrected visual acuity rises. Ifa pinholeaperture is placed immediately in front of the opticalsystem, it acts as an artificial pupil, and the size of theblur circle is reduced correspondingly. Pinhole acuitycomes close to mimicking the best-corrected visualacuity in a patient with ametropia. A differencebetween uncorrected and pinhole acuity suggests thatrefractive correction would improve visual acuity.Assuming that the patient is using the pinhole cor-rectly, if a pinhole does not correct the visual acuitycompared with the uncorrected visual acuity, thenrefiaction is unlikely to significantly correct acuity.In the presence of very large refractive errors, thepinhole may not be able to correct the large ametropia.Therefore, with very large refractive errors ( > 6 D),additional lenses to approximate the refractive stateplus the pinhole may yield the best information.
The size of the blur circle on the retina generallyincreases as the size of subject's pupil increases,particularly in a patient with ametropia. The advantageofthe pinhole eflect is reduced by pupil sizes smaller
Table 6Correlation between size of pupil and depth of focus
Size of pupil (mm) Depth of focus (Di)
234567
167
Ametropia (diopters)
Fig. 13. Visual acuity as a function of spherical defocus.(Fron Westheimer G. Visual acuity. In: Moses R. editor.Adler's physiology of the eye. St. Louis, MO: Mosby; 1987.p. 423. Data .from Laurence L. Visual optics and sighttesting. In: School of Optics. 3rd edition. London: 1926;with permission.)
than 2-mm diameter because of the increased diffrac-tion of light at the edges of the pupillary aperture. Ingeneral, maximum pinhole acuity is approximately20125 because of this diffraction. On the other hand,in pupil sizes greater than 6-mm diameter, sphericaland chromatic aberrations diminish visual acuity beadding additional blur to the image.
Refi"active error
Uncorrected ametropia is a common cause of pooracuity (Fig. l3). As soon as the optics of the eye aredefocused, the point-spread function widens, and twostimuli, to be identified as separate, must be furtherapart than in fully focused state. The width of thedefocused point-spread functions depends directly onthe amount ofdefocus and inversely on the pupil size.Spherical and astigmatic refractive errors enlarge theblurred area on the retina. Spherical errors produce ablur circle, whereas astigmatisrn may produce a blurellipse or line. According to Westheimer [5], Laur-ance [24], and Reiner [25], spherical errors of *0.5
D and astigmatic errors of +1.0 D, respectively,reduce visual acuity by approximately one half theSnellen fraction of maximum (Fig. la).
Retinal eccentricity
Only in the center of the fovea are conditionsappropriate for maximum acuiry. Even I o away from
C. Kniestedt. R.L. Stamper / Ophthulmol Clin N.4m 16 O003) 155 170
o
+ 0.40+ 0 .28+ 0.20+ 0 . 1 6+ 0 . 1 4+ 0 . 1 3
(Fron Rassow B, Haase W. In: Straub W Kroll P, KuechleHJ, editors. Augenaerztliche Untersuchungsmethoden.2nd edition. Stuttgart, Germany: Enke Verlag Stuttgart:1995 . p . 354 . )

1 6 8 C. Knie.stedt. R.L. Stamper / Ophthalmol Clin N Am 16 (2003) 155-170
30' 50"
Deviation from Axis of Astigmatism (Degrees)
Fig. lzl. Visual acuity as a function of astigmatism. (Fronr Reiner J. Einfluss des Achsenfehlers astigmatischer Brillenglaeser aufdie Sehschaerfe. Kl in N4bl Augenhei lkd 19701157:259 62: rv i th oemission.)
1 . 0
0.8
E U.O
d o.45
0.2
60'40'20"10 "0'
it. there is a reduction to approximately 70To ofmaxinal cenh'al visual acuity (Fig. l5). The peripheraldecrease in visual acuiry results fiorn neural connec-tivity rather than optical blur or receptor spacing, andit is steeper than the decrease of photoreceptorsbecause of the strong cortical representation of thecent ra l re t ina [3 ] . As ear ly as 1894. Wer the i rndescribed this eflect as indircct visudl ocuih'L261.
Retinul delbcts
Contrast sensitivity lirnctions and laser interfer-ence fringers hold promise in evaluating media opac-it ies and in studying ret inal and neural defects.Specific spatial loss may occur because lrequencychannels are pref'erentially affected. Gratings areuseful potential screening tests. though many varia-bles still have to be sorted out. The simple pinholemay still be useful in separating optical from non-optical dei-ects. Many retinal disorders, such as macu-lar edema and age-related macular degeneration.contribute to a decrease in visual acuitv.
Opurlue ntedia
Comeal edema increases light scatter, produceshaloes, and induces glare sensit i ' " ' i ty. General ly,reduced transparency of nredia, such as comea, lens,and vitreous, increases the amount of scattered lightcoming onto the retina. which may be superimposedon the sharply focused image causing increasedvisual conlusion. In addit ion, opaque media may
magnily the scatter produced by disadvarrtageor.rsenvironmental illumination. Clinically, patients withopaque media often complain of glare in brightly litenvironments. Polaroid glasses reduce glare by 509/ofor outdoor activities, though they are not recom-mended for driving at night. Driving during thesehours may have to be curtailed if glare is caused byan untreatable problem. Fortunately, most mediaopacities are treatable. Improper lighting while read-ing or fiom computer or TV screens may also be a
Foveal Eccentricity (Degrees)
Fig. 15. Visual acuit_v as a fllnction of retinal eccentricity.(Fron Westheimer G. Visual acuity. ln: Moses R, editor.Adler 's physio logy of ' the eye. St . Louis. MO: Mosby; 1987.p. 123. Data. l iozr Wertheim T. Ueber d ie indirekteSehschaerft. Z Psychol 1894:-l:172: u'ith permission.)
d
t\t \
c y l + 0 ,
\I
_ c y l + I , 0I
- 6 y l f 4 , 5
- c y l + 1 , 51 l+2 ,5
I

problem. Halogen bulbs that can be used with indirectlighting (bounced off the ceiling) or with highlydirected and adjustable lamps may be helpful forreading. Glare screens are available for computersand TV to reduce glare from ambient lighting. Theeffect of glare can be tested to some exlent in theoffice by comparing visual acuiry in a dirnmed roomto that obtained when the lights are on. Commercialdevices such as the Marco glare tester are also usefulto estimate the et'fect of glare.
Erposure time
Exposure time is rarely a factor in clinical testingbut n.ray become significant in driving, flying, oper-ating fast-moving machinery, or detecting a blip on aradar screen. As we age, the ability to respond toshort stimuli decreases [2]
Dvtamic actti^,
Acuity for rnoving targets dinrinishes approxi-mately as a cubic function of target velocity andcorrelates poorly with static acuity. Despite i1s obviousimportance. it is seldom nteasured clinically. Motionthreshold in empty fields is approximately 8.5 minutesof arclsecond. Increasing illuminance may improveperfonnance. Drifts and spikes ofthe fixating eye areneeded to maintain ongoing stimulation of the retina.Experiments with unmoving eyes show that withinseconds, the eye becomes unable to detect anythingwithout this ocuiar drift and microsaccades [271.
Centrol defetts
Acuity defects associated rvith central nervoussystem lesions, such as cortical def-ects, are generallydiagnosed by ancillary testing of visual fields, visr-ralevoked potentials, and other neurologic and psychi-atric symptoms. Motility disturbances may accom-pany poor acuity. as in congenital nystagmus.
Ph a rm a cologi c infl uence
Many drugs can affect acuity. The l i terature,though enormous, is mostly descriptive. Among com-mon agents that can change refractive error are miot-ics, cycloplegics, phenothiazines, barbiturates, andsull'onamides. Some anxiolytics can actually affectthe ret ina, as can chloroquine derivatives, digoxin.and sildenafll. An extensive sumr.nary of drug-inducedocular side eftbcts is given by Frauenfelder [28].
1 6 9
Summary and practical recommendations
Distance acuity testing can still effectively beaccomplished with Snellen chans, either paper orprojectors. Care should be taken to replace bulbs thatare yellowing and charts that are losing contrast fromdirt or dust. Computerized projector systems maymake the job easier. Many projcctors are commer-cially available (Zeiss, Rodenstock, Marco, Reichert,Topcon). They all are based on standardized back-ground illumination, and they all offer a huge spec-trum of letters, symbols, and figures.
It rvould be desirable to provide the computerizedprojectors with the ETDRS test chart features. To ourknowledge, this is not yet done.
For clinical studies. the ETDRS charts are recom-mended and. for many studies. mandatory. In thesecircumstances, visual acuity should be noted in Log-MAR units. Because near vision is often moreimportant in the daily life of older or infinn patients.reading charts or other near vision testing charlsshould be used as part of the routine assessment of'r , isual abi l i t ies. I t is crucial also to note the test ingdistance to compare visual acuity data over a periodof time, especially if several exantiners are involved.Although unstandardized. .Iaeger charts may be used,but for assessment over time. care should be taken touse the same system with similar lighting. Given thatreading charts differ u,idely in their comparability,one should use only one type of chan in a givenoff ice and maintain that system over t ime.
For the lou,-vision patient, the clinician shouldhave the ability to test visual acuity at closer distancesthan 20 feet (6 m). Movable light box charts (eg.ETDRS with M-units) are best. but the patient canalso be moved closer to a fired chart. Visual acuirytesting in the illiterate and developmentally challengedshould be performed with the tumbling "E" chart.This test also might be appropl iate for preschoolchi ldren. especial ly i f parents are givcn t imc to practicewith the child. Charts with symbols and pictures oftenachieve more attention for the young examinee but aredifficult to standardize. In infänts and preverbal chil-dren, preferential looking methods and estimation offixation and following behavior are the most practicalmethodology for vision assessnlent in the oftlce.
Visual acuity measurement is often taken forgranted. Many pit fal ls make this most importantassessment subject to variabiliry. Anrbient illumina-tion. aging bulbs, dirry charts or slides, srnall pupils.and poorly slandardized charts are just some of thefactors that can lead to erroneous results. A little carein ensuring the proper environment for testing cansignifi cantly improve accuracy.
C. Kniestedt. R.L. Stamper / Ophthalmol CIin N Am l6 (2003) 155-170
1 7 0 C. Kniestedt. R.L. Stamper l Ophthalmol Clin N Am 16 (2003) 155-170
References
[ ] Koemer H. Zur visuellen Funktion Gedanken zu ihrerErfassung: Funktionsbezogenes Verfahren zur Brillen-glasbest immung. Dtsch Opt ikerzei tung Tei l l990ql :38-42.
[2] Rassow B, Haase W. Sehschaerfe. In: Straub W KrollP. Kuechle FI , edi tors. Augenaerzt l iche Lln lersu-chungsmethoden. 2nd edition. Stungart, Germany:Enke : 1995 . p .342 73 .
[3] Wesemann W. Physio logische Aspekte der Seh-schaerfe. 42. Sonderdruck der WVAO 1990:2Q-29.
[4] Westheimer G. Visual acui ty. In: Moses R, edi tor .Adler's physiology of the eye. 6th edition. St. Louis.MO: CV Mosby ; 1981 . p . 415 28 .
[5] Westheimer G. Visual acuity. In: Moses R. Hart W,editors. Adler's physiology of the eye: clinical appli-cation. 8th edition. St. Louis, MO: CV Mosby; 1987.
[6] Early Treatment Diabetic Retinopathy Study. Manualof operations. Baltimore. MD: ETDRS CoordinatingCenter, Department of Epidenriology and PreventiveMed i c i ne : 1980 . p . I 15 .
[7] Bailey IL, Lovie JE. New design principles for visualacuity letter charts. Am J Optom Physiol Opt 1976:53:740 -5.
[8] NAS-NRC Committee on Vision. Recommended stand-ard procedures for the clinical measurement and speci-f icat ion of v isual acui ty. Adv Ophthalmol 1980:41:103.
[9] Ferris 3rd FL, KassoffA. Bresnick CH, Bailey I. Newvisual acuiry charts for clinical research. Am J Oph-thalmol 1982:94:91 6.
[0] Sloan L. Needs for precise measures of acuity: equip-ment to meet these needs. Arch Ophthalmol 1980:98:286 -90.
!l] Colenbrander A. Preservation of vision or preventionofbl indness? Am J Ophthalmol 2002;133:263-5.
[2] AMA. Guides to the evaluation of permanent impair-ment. In: The v isual system. Chicago. IL: AMAPress: 2000.
[3] Colenbrander A. The basic low vision examination.Ophthalmol Cl in North Am 1994;7:151 67.
[4] Birch E. Visual acuily testing in infants and young
chr ldren. Ophthalmol Cl in North Am 1989;2:369-89.
[5] McDonald M, Dobson V Sebris S. The acuity cardprocedure: a rapid test of infant acuity. Invest Ophthal-mo l V i s Sc i 1985 :26 :1158 62 .
[6] Prest<.rn K. McDonald M. Sebris S. Validation ofthe acuity card procedure for assessnrent of infantswi th ocular d isorders. Ophthalmology l t )87194:644 53.
I I 7] Teller D. The forced choice preferential looking proce-
dure: a psychophysical technique for use with human
infants. Infant Behav Der, 1979.2:135 53.
[8] Mayer D. Dobson V. Visual acuity developnrent in
infants and young chiltlren. as assessed by operantpreferent ia l looking. Vis ion Res 1982;22: l l4 l 51.
[9] Birch E. Infant interocular acuity differences and bin-ocular v is ion. Vis ion Res 1985:25:571 6.
[20] Birch E, Hale L. Criteria for monocular acuity deficit
in infancy and early childhood. Invest Ophthalmol Vis
Sc i 1988 :29 :636 43 .
[21] Dobson V Teller DY Visual acuity in hunran infants:a review and comparison ofbevavior and electrtrphys-io logical studies. Msion Res 1978;18:1469.
[22] Orel-Bixler D, Norcia A. Differential growth of acuityfor steady state pattem reversal and transient pattem
onset-offset VEPs. Clin Vision Sci 1987''2:1.
[23] Sokol S. Measurement of inlant visual acuity frompattem evoked potent ia ls. Vis ion Res 1978;18:33-9.
[24] Laurance L. Visual optics and sight testing. In: SchoolofOpt ics. 3rd ed. Londonl 1926.
[25] Reiner J. Einfluss des Achsenfehlers astigmatischerBrillenglaeser auf die Sehschaerfe. Klin Mbl Augen-hei lkd 1970:157:259 62
[26] Wertheim T. Ueber die indirekte Sehschaerfe. Z Psy-cho l 1894 :7 :172 .
[27] Westheinrer G, McKee S. Visual acuity in the pres-
ence ofretinal image nrotion. J Opt Soc Am 1975;65:847 - 50.
[28] Frauenfelder F, Roy F. Cunent ocular therapy. 5th edi-
tion. Philadetphia, PA: WB Saunders; 2000.