monolithic perovskite/silicon tandem solar cell with >29%
TRANSCRIPT
1
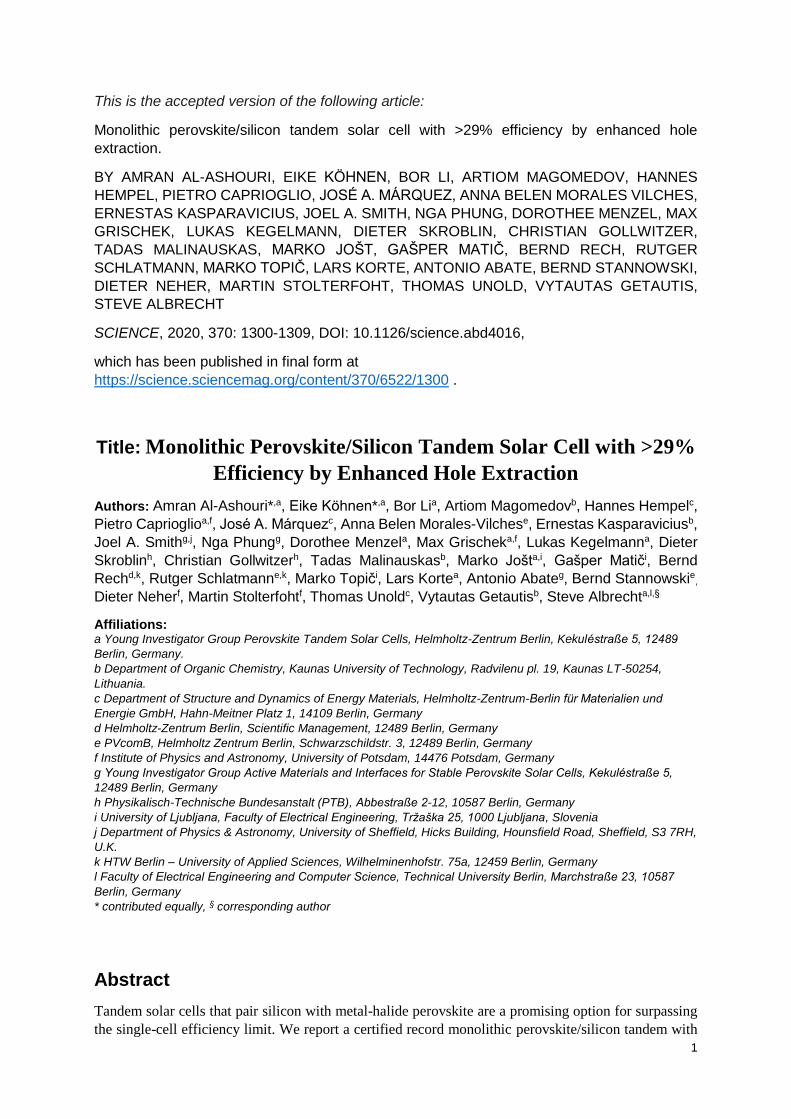
This is the accepted version of the following article:
Monolithic perovskite/silicon tandem solar cell with >29% efficiency by enhanced hole
extraction.
BY AMRAN AL-ASHOURI, EIKE KÖHNEN, BOR LI, ARTIOM MAGOMEDOV, HANNES
HEMPEL, PIETRO CAPRIOGLIO, JOSÉ A. MÁRQUEZ, ANNA BELEN MORALES VILCHES,
ERNESTAS KASPARAVICIUS, JOEL A. SMITH, NGA PHUNG, DOROTHEE MENZEL, MAX
GRISCHEK, LUKAS KEGELMANN, DIETER SKROBLIN, CHRISTIAN GOLLWITZER,
TADAS MALINAUSKAS, MARKO JOŠT, GAŠPER MATIČ, BERND RECH, RUTGER
SCHLATMANN, MARKO TOPIČ, LARS KORTE, ANTONIO ABATE, BERND STANNOWSKI,
DIETER NEHER, MARTIN STOLTERFOHT, THOMAS UNOLD, VYTAUTAS GETAUTIS,
STEVE ALBRECHT
SCIENCE, 2020, 370: 1300-1309, DOI: 10.1126/science.abd4016,
which has been published in final form at
https://science.sciencemag.org/content/370/6522/1300 .
Title: Monolithic Perovskite/Silicon Tandem Solar Cell with >29%
Efficiency by Enhanced Hole Extraction Authors: Amran Al-Ashouri*,a, Eike Köhnen*,a, Bor Lia, Artiom Magomedovb, Hannes Hempelc,
Pietro Caprioglioa,f, José A. Márquezc, Anna Belen Morales-Vilchese, Ernestas Kasparaviciusb,
Joel A. Smithg,j, Nga Phungg, Dorothee Menzela, Max Grischeka,f, Lukas Kegelmanna, Dieter
Skroblinh, Christian Gollwitzerh, Tadas Malinauskasb, Marko Josta,i, Gasper Matiči, Bernd
Rechd,k, Rutger Schlatmanne,k, Marko Topiči, Lars Kortea, Antonio Abateg, Bernd Stannowskie,
Dieter Neherf, Martin Stolterfohtf, Thomas Unoldc, Vytautas Getautisb, Steve Albrechta,l,§
Affiliations: a Young Investigator Group Perovskite Tandem Solar Cells, Helmholtz-Zentrum Berlin, Kekuléstraße 5, 12489
Berlin, Germany.
b Department of Organic Chemistry, Kaunas University of Technology, Radvilenu pl. 19, Kaunas LT-50254,
Lithuania.
c Department of Structure and Dynamics of Energy Materials, Helmholtz-Zentrum-Berlin für Materialien und
Energie GmbH, Hahn-Meitner Platz 1, 14109 Berlin, Germany
d Helmholtz-Zentrum Berlin, Scientific Management, 12489 Berlin, Germany
e PVcomB, Helmholtz Zentrum Berlin, Schwarzschildstr. 3, 12489 Berlin, Germany
f Institute of Physics and Astronomy, University of Potsdam, 14476 Potsdam, Germany
g Young Investigator Group Active Materials and Interfaces for Stable Perovskite Solar Cells, Kekuléstraße 5,
12489 Berlin, Germany
h Physikalisch-Technische Bundesanstalt (PTB), Abbestraße 2-12, 10587 Berlin, Germany
i University of Ljubljana, Faculty of Electrical Engineering, Tržaška 25, 1000 Ljubljana, Slovenia
j Department of Physics & Astronomy, University of Sheffield, Hicks Building, Hounsfield Road, Sheffield, S3 7RH,
U.K.
k HTW Berlin – University of Applied Sciences, Wilhelminenhofstr. 75a, 12459 Berlin, Germany
l Faculty of Electrical Engineering and Computer Science, Technical University Berlin, Marchstraße 23, 10587
Berlin, Germany
* contributed equally, § corresponding author
Abstract
Tandem solar cells that pair silicon with metal-halide perovskite are a promising option for surpassing
the single-cell efficiency limit. We report a certified record monolithic perovskite/silicon tandem with
2
a power conversion efficiency of 29.15%. The perovskite absorber with 1.68 eV bandgap remained
phase-stable under illumination through a combination of fast hole extraction and minimized non-
radiative recombination at the hole-selective interface. Key was a self-assembled, methyl-substituted
carbazole monolayer as hole-selective layer in the perovskite cell. The accelerated hole extraction was
linked to a low ideality factor of 1.26 and single-junction fill factors of up to 84%, while enabling the
yet highest tandem open-circuit voltage of up to 1.92 volts. In air, without encapsulation, a tandem
retained 95% of its initial efficiency after 300 hours of operation.
One Sentence Summary: Combining interface passivation with fast charge extraction for stable, highly
efficient perovskite/silicon tandem solar cells
Main text:
A tandem solar cell with a silicon cell overlaid by a perovskite solar cell (PSC) (1) could increase
efficiencies of commercial mass market photovoltaics beyond the single-junction cell limit (1, 2) without
adding substantial costs (3, 4). The power conversion efficiency (PCE) of PSCs has reached up to 25.2%
for single-junction solar cells (at an area of ~0.1 cm²) (5), 24.2% for perovskite/CIGSe (copper-indium-
gallium-selenide) tandem cells (~1 cm²) (5–7), 24.8% for all-perovskite tandem cells (0.05 cm²) (8, 9)
and 26.2% for the highest openly published perovskite/silicon tandem efficiency (~1 cm2) (10, 11).
Perovskite/silicon tandem cells have additionally undergone technological advances in both stability
and compatibility with textured silicon substrates (11–13). However, there is still room for improvement
for these perovskite-based tandem solar cells, as practical limits for all these tandem technologies are
well above 30% (14, 15).
The increase in PSC efficiency has been driven in part by advances in physical and chemical
understanding of the defect and recombination mechanisms. Some reports presented near-perfect
passivation of surfaces and grain boundaries with photoluminescence quantum yields (PLQYs)
approaching theoretical limits (16–18). Consequently, PSCs were reported with open-circuit voltage
(VOC) values of only a few 10 meV below their radiative limit (19–23). These values surpass those
reached with crystalline silicon absorbers and are comparable with solar cells based on epitaxially grown
GaAs (23, 24). However, perovskite compositions with a wider bandgap that are needed for high-
efficiency tandem solar cells still show considerable VOC losses (14, 25). The main reasons include
comparably low PLQYs of the absorber material itself, an unsuitable choice of selective contacts and
phase instabilities. Even state-of-the-art perovskite/silicon tandem cells still have VOCs well below 1.9 V.
We present a strategy to overcome these issues simultaneously, demonstrated on a 1.68 eV bandgap
triple-cation perovskite composition, which enables photostable tandem devices with a VOC of 1.92 V.
We note that the charge extraction efficiency, and with that, the fill factor (FF) of PSCs, is still poorly
understood. Although reported PSCs usually feature a small active area (~0.1 cm²) with small absolute
photocurrents (a few milliamperes), and thus small series resistance losses at the contacts, usual FFs of
high-efficiency devices generally range from 79 to 82%. However, based on the detailed balance limit,
PSCs should be able to deliver a FF of 90.6% at a bandgap of 1.6 eV. Wider bandgap perovskite
compositions near 1.7 eV seem especially prone to low FFs, resulting in tandem cell FF values
commonly below 77%, near current-matching conditions (11, 12, 26). In optimized perovskite single-
junction devices, the FFs only recently exceeded 80%, with a maximum value of 84.8% (27).
One reason for the low FF might be that there are only few techniques for quantifying and analyzing the
FF losses in PSCs. We show that intensity-dependent transient and absolute photoluminescence is a
viable technique. A main FF limitation of high-efficiency PSCs is the ideality factor nID, with typical
values of 1.4 to 1.8 for high-VOC devices (28), while established solar cell technologies reach values of
1 to 1.3 (29). Thus, an important goal for perovskite photovoltaics is to lower the ideality factor while
minimizing nonradiative interface recombination to achieve a high VOC (28). We designed a self-
assembled monolayer (SAM) with methyl group substitution as a hole-selective layer, dubbed Me-
4PACz ([4-(3,6-dimethyl-9H-carbazol-9-yl)butyl]phosphonic acid) and show that a fast hole extraction

3
led to a lower ideality factor. Thus, FFs of up to 84% in p-i-n single-junction PSCs and >80% in tandem
devices were achieved.
The SAM provided both fast extraction and efficient passivation at the hole-selective interface. This
combination slowed down light-induced halide segregation of a tandem-relevant perovskite composition
with 1.68 eV bandgap, allowed a PLQY as high as on quartz glass and led to high single-junction device
VOCs > 1.23 V. The single-junction improvements transferred into tandem devices, which allowed us to
fabricate perovskite/silicon tandem solar cells with a certified PCE of 29.15%. This value surpasses the
best silicon single-junction cell (26.7%) and is comparable to the best GaAs solar cell (27) at the same
area of 1 cm². Under maximum power point tracking (MPP) in ambient air without encapsulation, a Me-
4PACz tandem cell retained 95% of its initial efficiency after 300 h. Furthermore, we used injection-
dependent, absolute electroluminescence spectroscopy to reconstruct the individual subcell current-
voltage curves without the influence of series resistance (pseudo-J-V curves), demonstrating that the
tandem device design that features only a standard perovskite film without additional bulk passivation
could in principle realize PCE values up to 32.4%.

4
Stabilization of wide-bandgap perovskite with the hole-selective
layer
The ideal top cell bandgap for perovskite absorbers in conjunction with CIGSe and Si bottom cells is
~1.68 eV (30–32). These wider bandgap compositions often feature a Br to I ratio >20%, which can lead
to phase instabilities caused by light-induced halide segregation, most strikingly evident from
photoluminescence (PL) spectra that show a double-peak formation under continuous illumination (33,
34). Upon generation of charge carriers in the perovskite film, iodide-rich clusters can form that are
highly luminescent as they serve as charge carrier sinks given their lower bandgap compared to the
surrounding material (35). As quantified by Mahesh et al., although some portion of the VOC loss is
related to halide segregation, the dominant source of VOC loss is likely the generally low optoelectronic
quality of the Br-rich mixed halide perovskite absorbers itself, or high non-radiative recombination rates
at their interfaces (35). Hence, in order to unambiguously determine the limitations and potentials of
wide bandgap compositions, it is necessary to find suitable charge-selective contacts that do not
introduce further losses or instabilities.
We show that fast charge extraction paired with surface passivation can effectively suppress the
formation of a double-peak emission in the PL, indicative of phase stabilization, and simultaneously
enable a high quasi Fermi level splitting (QFLS) and device performance. Rather than optimizing the
perovskite composition or passivating the film, we chose a variant of the widely used Cs-, FA- and MA-
containing “triple-cation” perovskite (36) that is highly reproducible and focused on preparing an
optimal charge-selective contact on which the perovskite film was deposited. We shifted the bandgap
upward by increasing of the Br to I ratio to obtain a 1.68 eV (23% Br) absorber instead of the commonly
used 1.6-1.63 eV (~17% Br), yielding a nominal precursor composition of
Cs0.05(FA0.77MA0.23)0.95Pb(I0.77Br0.23)3.
5
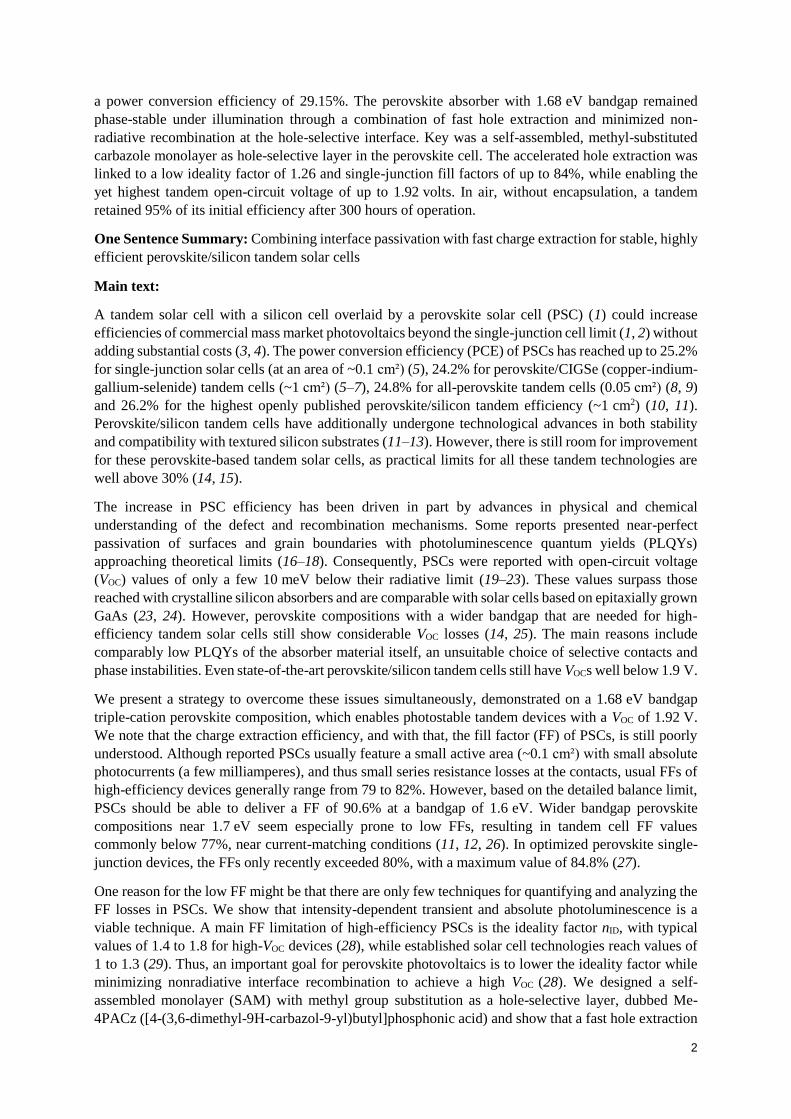
Fig. 1 Photoluminescence properties and stability assessment of perovskite films on different substrates. (A) schematic description of the photoluminescence (PL) experiment and chemical structure of a general carbazole-based SAM, with R denoting a substitution (or “termination”), which in this work is either nothing (2PACz), a methoxy group (MeO-2PACz) or a methyl group (Me-4PACz). The number 2 or 4 denotes the number of the linear C-atoms between the phosphonic acid anchor group and the conjugated carbazole main fragment. (B) Quasi Fermi level splitting (QFLS) values of non-segregated 1.68 eV bandgap perovskite films on a bare glass substrate and different hole-selective layers on the transparent and conductive indium tin oxide (ITO). (C-E), Time-dependent photoluminescence spectra analyzing phase stability of perovskite absorbers with 1.68 eV bandgap. The perovskite films were deposited either on glass (C) or on ITO substrates with different hole-selective layers (D, E). (F) PL spectra before (dashed lines) and after 600 s of light-soaking (solid lines) under 1-sun equivalent illumination flux in air, comparing the perovskite grown on Me-4PACz that was deposited on either a glass substrate or conductive ITO substrate. (G) As figure of merit for stability, the ratio of PL intensities at 780 nm and 740 nm is shown, from the PL evolutions in (C), (D), (E), and two other hole-selective layers (shown in SI, illumination spot size ~0.12 cm²). (H) Same as for (G), but at higher illumination intensity through decrease of the excitation spot size to 0.4 mm².
A schematic of the device stack and the used hole-selective layers (commonly abbreviated as HTLs,
“hole transporting layers”) used for PL measurements is shown in Fig. 1. We first compared the QFLS
measured by absolute PL and then the PL stability of this perovskite composition prepared on indium
tin oxide (ITO) substrates covered by the HTLs. In recently published high-PCE p-i-n (“inverted”)
single-junction and tandem PSCs, the polymer bis(4-phenyl)(2,4,6-trime-thylphenyl)amine] (PTAA) or
the comparable Poly(N,N'-bis-4-butylphenyl-N,N'-bisphenyl)benzidine (polyTPD) are standardly used
(10, 11, 37, 38). Alternatively, self-assembled monolayers (SAMs) based on carbazole such as MeO-
2PACz and 2PACz can form passivated interfaces while allowing for low transport losses due to their
ultrathin thickness (<1 nm) (7). The introduction of a methyl-group substitution to the “lossless” hole-
selective interface created by 2PACz (7) lead to a more optimized alignment with the perovskite valence
band edge (see energetic band edge diagram in Figure S1) with a similar dipole moment (~1.7 D) and
resulted in faster charge extraction. The supplementary materials contain the synthesis scheme of the
herein used SAMs. In literature of the n-i-p configuration of PSCs, methoxy substituents were
prevalently used in HTLs, with some works reporting a possible passivation function at the perovskite

6
interface (39–42). For the p-i-n configuration however, the standard high-performance HTLs PTAA and
polyTPD contain alkyl substituents. In the present study, we directly compared methoxy and methyl
substituents in p-i-n cells with MeO-2PACz and Me-4PACz, with the results showing advantages for
the methyl substitution regarding both passivation and hole extraction. We tested the influence of the
aliphatic chain length (n) in carbazole SAMs without (nPACz) and with methyl substitution (Me-
nPACz) on PSC performance and found an optimum FF at n = 2 for nPACz and at n = 4 for Me-nPACz
(see Figure S23). For n = 6, both SAMs lead to current-voltage hysteresis.
The QFLS values of bare perovskite films (Fig. 1B) deposited on 2PACz and Me-4PACz were similar
to that on quartz glass, commonly regarded as a perfectly passivated substrate (16). Perovskite
compositions with high Br content typically segregate into I-rich phases indicated by increased PL
intensity at lower photon energies, here at a wavelength of 780 nm (33). Pristine regions of the non-
segregated perovskite film emitted photons at a peak wavelength of around 740 nm for perovskite
deposited on glass (Fig. 1C) or ITO/PTAA (Fig. 1D), and a similar response was seen for the SAM
MeO-2PACz (Figure S3) on ITO. However, the perovskite emission was more stable over time on
ITO/2PACz and ITO/Me-4PACz substrates (Fig. 1E and Figure S3). The raw spectra are shown in
Figure S4.
Among the studied HTLs, phase segregation was only inhibited if the perovskite was grown on a
substrate that fulfilled the requirements of both fast charge extraction and good passivation; Fig. 1F
demonstrates that passivation alone was insufficient. The black curve shows a PL spectrum of the
perovskite film on an insulating glass substrate that was covered by Me-4PACz, after 10 min of
continuous spot illumination with 1-sun equivalent photon flux. The illuminated film showed signs of
I-rich phases emitting at a center wavelength of ~780 nm. The glass substrate ensured that no hole
transfer out of the perovskite bulk occurred. In contrast, a conductive ITO substrate that allowed hole
transmission in combination with Me-4PACz increased the PL stability, as evidenced by the sharp peak
with emission centered at ~740 nm even after 10 min of spot illumination.
A bare ITO substrate seemed to prevent charge accumulation as well, allowing a stable PL peak position
at 1-sun intensity (0.12 cm² spot size, see Figure S6). The connection between charge accumulation in
the perovskite and phase instability was reported in previous studies in which a reduced density of
carriers increased the activation energy of mobile ion species and allowed the film to remain in its initial
form (43, 44). Spot illumination (0.12 cm² with 1-sun photon flux) represented increased stress testing
on phase stability compared to full illumination because it created an outward driving force for ions
from the illuminated area (45). Consequently, a smaller illumination spot (i.e., larger edge-to-area ratio)
at the same illumination intensity showed a faster PL redshift (see Figure S5 & Figure S6). To compare
the degree of PL redshift and double-peak formation, we evaluated the ratio of the two emission center
intensities at 740 and 780 nm for two different excitation fluences equivalent to 1-sun and 30-suns
illumination, in Fig. 1G and H, respectively. At 1-sun-equivalent intensity, only 2PACz and Me-4PACz
on ITO had a stable ratio. However, upon increasing the intensity and thus charge carrier generation rate
30-fold, a Me-4PACz-covered ITO substrate differed from the 2PACz-covered by still displaying a
similarly stable PL intensity ratio.
7
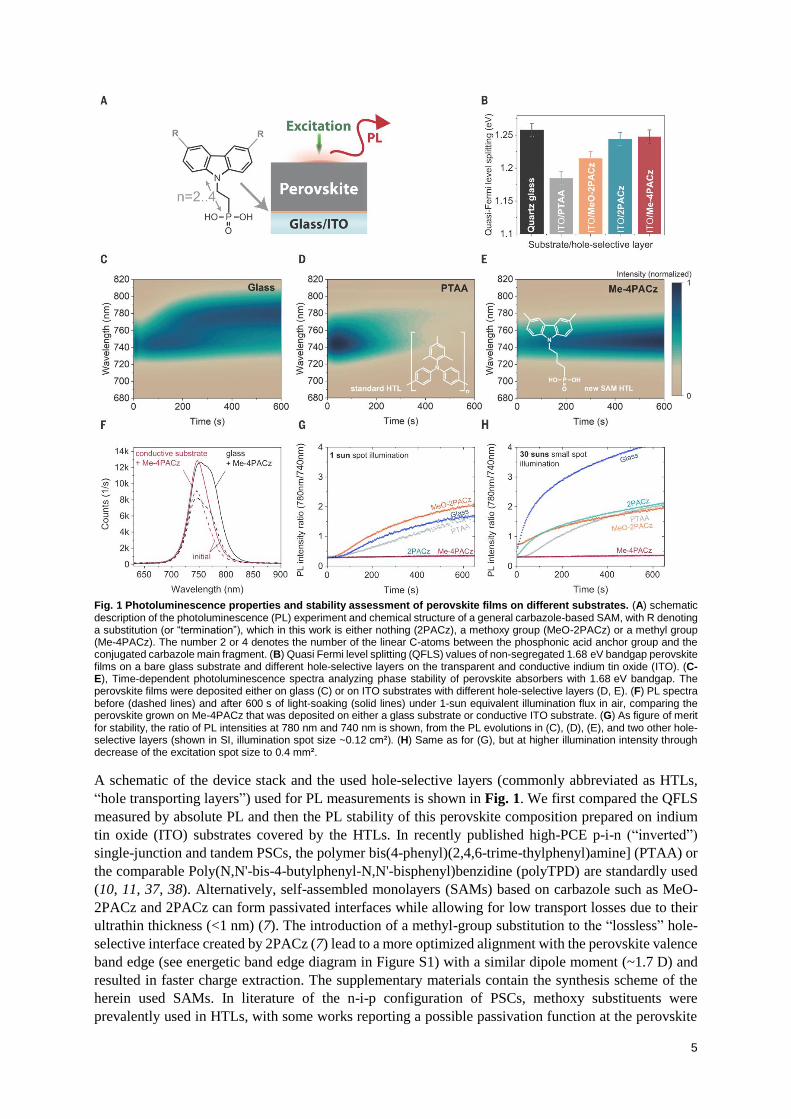
Fig. 2 Role of charge transfer on transient photoluminescence (TrPL). (A) PL transients of perovskite on ITO/hole-selective layer substrates. The dashed lines indicate the background levels. (B) Computed differential lifetimes from fits to the transients in (A), showing the single-exponential decay time at each time of the transient, with early times shown in the inset. The inset highlights the region of the Me-4PACz and 2PACz transients that is governed by hole transfer into the ITO. Excitation density is similar to 1-sun conditions (fluence of ~30 nJ/cm², 2-3 x 1015 cm-3). (C) Ratio of higher-order processes to mono-exponential decay in the TrPL transients, revealing that Me-4PACz not only extracts holes faster (inset in B), but also with a ~10 times higher efficiency compared to 2PACz, since the Me-4PACz transient shows the same magnitude of radiative recombination only at a ~10 times higher charge carrier generation (comparison along the dashed line, see Figure S10 for details).
We used transient photoluminescence (TrPL) to analyze charge carrier transfer into adjacent charge-
selective layers (46). The full decay is governed by non-radiative, trap-assisted surface/bulk
recombination (mostly mono-exponential decay), radiative recombination (“bimolecular”, second-order
differential equation) and charge transfer effects, which can be disentangled if these time constants differ
sufficiently from each other (18). Fig. 2A presents PL transients of 1.68 eV-bandgap perovskite films
on ITO/HTL substrates. With MeO-2PACz and PTAA, it is not possible to clearly differentiate between
charge extraction and trap-assisted recombination because both the nonradiative recombination is high
(as evidenced by lower QFLS values compared to quartz glass, Fig. 1B) and the transients did not
saturate towards one process. In contrast, the PL transients for 2PACz and Me-4PACz showed a clear
mono-exponential decay at later times, indicating Shockley-Read-Hall recombination (47). Fits to the
TrPL transients (Figure S8) were used to compute the differential lifetime τ = −(dln(ϕ(t))/dt)−1
(Fig.
2B), with ϕ(t) being the time-dependent PL photon flux. In this representation, the processes that reduce
the PL counts over time are separable and the transient decay time (or “lifetime”) is directly readable at
each time point (46).
The high, asymptotically reached TrPL lifetimes of >5 µs for both 2PACz and Me-4PACz suggested
that there were minimal non-radiative recombination losses at the SAM interfaces. The charge transfer
process at early times (until ~1 µs) led to a sharp rise of 𝜏, resembling simulated curves by Krogmeier
8
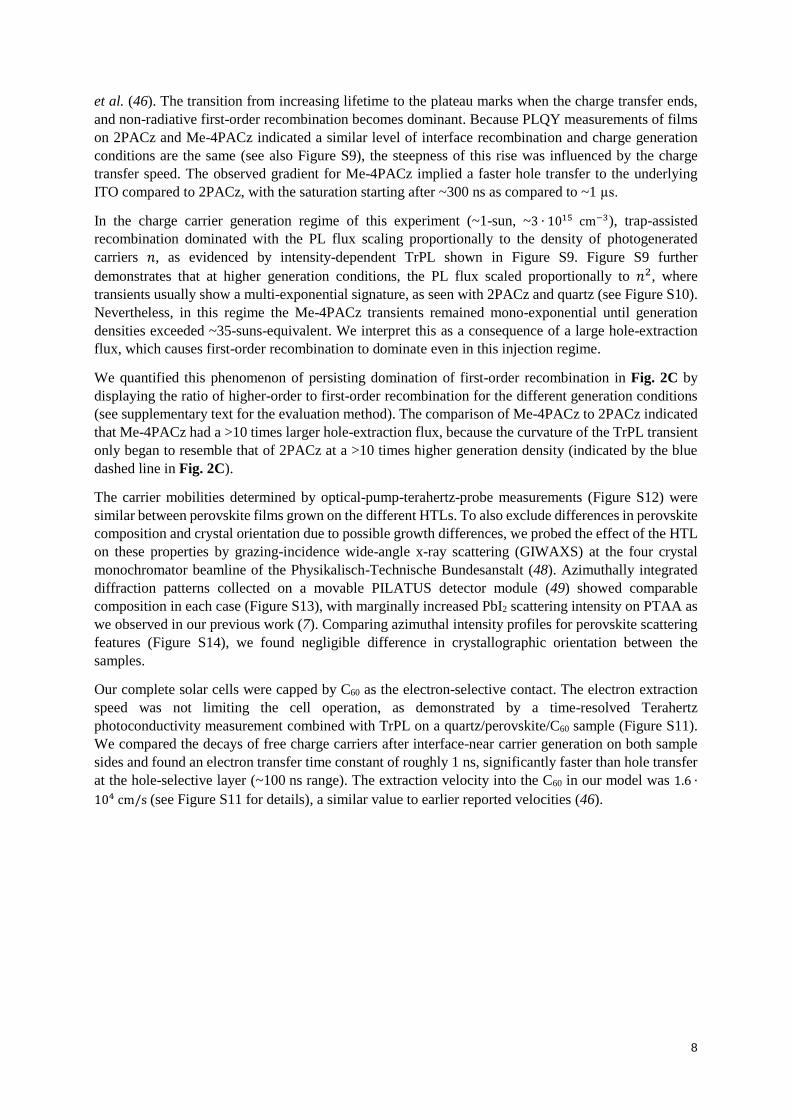
et al. (46). The transition from increasing lifetime to the plateau marks when the charge transfer ends,
and non-radiative first-order recombination becomes dominant. Because PLQY measurements of films
on 2PACz and Me-4PACz indicated a similar level of interface recombination and charge generation
conditions are the same (see also Figure S9), the steepness of this rise was influenced by the charge
transfer speed. The observed gradient for Me-4PACz implied a faster hole transfer to the underlying
ITO compared to 2PACz, with the saturation starting after ~300 ns as compared to ~1 µs.
In the charge carrier generation regime of this experiment (~1-sun, ~3 ∙ 1015 cm−3), trap-assisted
recombination dominated with the PL flux scaling proportionally to the density of photogenerated
carriers 𝑛, as evidenced by intensity-dependent TrPL shown in Figure S9. Figure S9 further
demonstrates that at higher generation conditions, the PL flux scaled proportionally to 𝑛2, where
transients usually show a multi-exponential signature, as seen with 2PACz and quartz (see Figure S10).
Nevertheless, in this regime the Me-4PACz transients remained mono-exponential until generation
densities exceeded ~35-suns-equivalent. We interpret this as a consequence of a large hole-extraction
flux, which causes first-order recombination to dominate even in this injection regime.
We quantified this phenomenon of persisting domination of first-order recombination in Fig. 2C by
displaying the ratio of higher-order to first-order recombination for the different generation conditions
(see supplementary text for the evaluation method). The comparison of Me-4PACz to 2PACz indicated
that Me-4PACz had a >10 times larger hole-extraction flux, because the curvature of the TrPL transient
only began to resemble that of 2PACz at a >10 times higher generation density (indicated by the blue
dashed line in Fig. 2C).
The carrier mobilities determined by optical-pump-terahertz-probe measurements (Figure S12) were
similar between perovskite films grown on the different HTLs. To also exclude differences in perovskite
composition and crystal orientation due to possible growth differences, we probed the effect of the HTL
on these properties by grazing-incidence wide-angle x-ray scattering (GIWAXS) at the four crystal
monochromator beamline of the Physikalisch-Technische Bundesanstalt (48). Azimuthally integrated
diffraction patterns collected on a movable PILATUS detector module (49) showed comparable
composition in each case (Figure S13), with marginally increased PbI2 scattering intensity on PTAA as
we observed in our previous work (7). Comparing azimuthal intensity profiles for perovskite scattering
features (Figure S14), we found negligible difference in crystallographic orientation between the
samples.
Our complete solar cells were capped by C60 as the electron-selective contact. The electron extraction
speed was not limiting the cell operation, as demonstrated by a time-resolved Terahertz
photoconductivity measurement combined with TrPL on a quartz/perovskite/C60 sample (Figure S11).
We compared the decays of free charge carriers after interface-near carrier generation on both sample
sides and found an electron transfer time constant of roughly 1 ns, significantly faster than hole transfer
at the hole-selective layer (~100 ns range). The extraction velocity into the C60 in our model was 1.6 ∙
104 cm/s (see Figure S11 for details), a similar value to earlier reported velocities (46).
9
Performance of perovskite single-junction solar cells
For the analysis on solar cell level, we focused on the simple single-junction device stack
glass/ITO/HTL/perovskite/C60/SnO2/Ag, with the SnO2 serving as a buffer layer for indium zinc oxide
(IZO) sputtering in the fabrication of tandem solar cells (50). We show that the combination of fast
charge extraction and passivated interface not only mitigated phase instability (re Fig. 1) but was also
linked to an increased FF of solar cell devices, mainly by a decreased diode ideality factor of the PSCs.
The FF is the major remaining parameter for which PSCs have not yet come close to the values of
established solar cell technologies (24, 51) (see Figure S16 for FF comparisons), with the ideality factor
being one of the main properties that limit high-efficiency PSCs (29). MeO-2PACz and 2PACz lead to
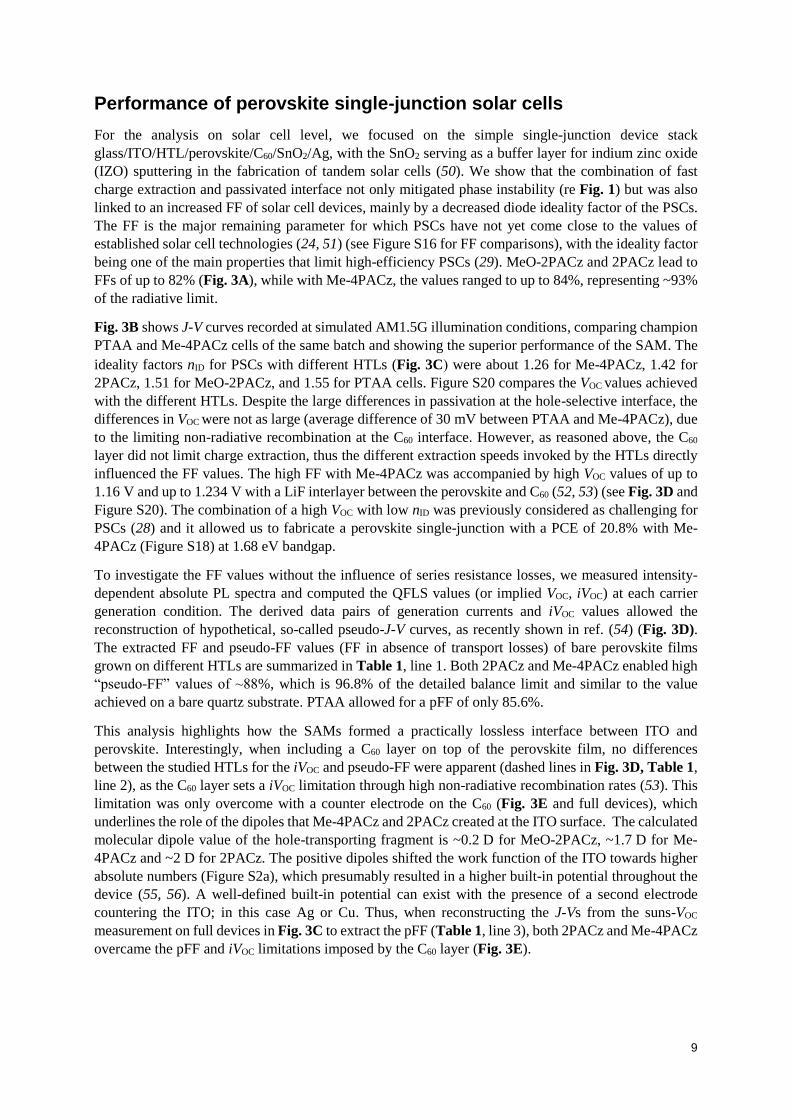
FFs of up to 82% (Fig. 3A), while with Me-4PACz, the values ranged to up to 84%, representing ~93%
of the radiative limit.
Fig. 3B shows J-V curves recorded at simulated AM1.5G illumination conditions, comparing champion
PTAA and Me-4PACz cells of the same batch and showing the superior performance of the SAM. The
ideality factors nID for PSCs with different HTLs (Fig. 3C were about 1.26 for Me-4PACz, 1.42 for
2PACz, 1.51 for MeO-2PACz, and 1.55 for PTAA cells. Figure S20 compares the VOC values achieved
with the different HTLs. Despite the large differences in passivation at the hole-selective interface, the
differences in VOC were not as large (average difference of 30 mV between PTAA and Me-4PACz), due
to the limiting non-radiative recombination at the C60 interface. However, as reasoned above, the C60
layer did not limit charge extraction, thus the different extraction speeds invoked by the HTLs directly
influenced the FF values. The high FF with Me-4PACz was accompanied by high VOC values of up to
1.16 V and up to 1.234 V with a LiF interlayer between the perovskite and C60 (52, 53) (see Fig. 3D and
Figure S20). The combination of a high VOC with low nID was previously considered as challenging for
PSCs (28) and it allowed us to fabricate a perovskite single-junction with a PCE of 20.8% with Me-
4PACz (Figure S18) at 1.68 eV bandgap.
To investigate the FF values without the influence of series resistance losses, we measured intensity-
dependent absolute PL spectra and computed the QFLS values (or implied VOC, iVOC) at each carrier
generation condition. The derived data pairs of generation currents and iVOC values allowed the
reconstruction of hypothetical, so-called pseudo-J-V curves, as recently shown in ref. (54) (Fig. 3D).
The extracted FF and pseudo-FF values (FF in absence of transport losses) of bare perovskite films
grown on different HTLs are summarized in Table 1, line 1. Both 2PACz and Me-4PACz enabled high
“pseudo-FF” values of ~88%, which is 96.8% of the detailed balance limit and similar to the value
achieved on a bare quartz substrate. PTAA allowed for a pFF of only 85.6%.
This analysis highlights how the SAMs formed a practically lossless interface between ITO and
perovskite. Interestingly, when including a C60 layer on top of the perovskite film, no differences
between the studied HTLs for the iVOC and pseudo-FF were apparent (dashed lines in Fig. 3D, Table 1,
line 2), as the C60 layer sets a iVOC limitation through high non-radiative recombination rates (53). This
limitation was only overcome with a counter electrode on the C60 (Fig. 3E and full devices), which
underlines the role of the dipoles that Me-4PACz and 2PACz created at the ITO surface. The calculated
molecular dipole value of the hole-transporting fragment is ~0.2 D for MeO-2PACz, ~1.7 D for Me-
4PACz and ~2 D for 2PACz. The positive dipoles shifted the work function of the ITO towards higher
absolute numbers (Figure S2a), which presumably resulted in a higher built-in potential throughout the
device (55, 56). A well-defined built-in potential can exist with the presence of a second electrode
countering the ITO; in this case Ag or Cu. Thus, when reconstructing the J-Vs from the suns-VOC
measurement on full devices in Fig. 3C to extract the pFF (Table 1, line 3), both 2PACz and Me-4PACz
overcame the pFF and iVOC limitations imposed by the C60 layer (Fig. 3E).
10
Fig. 3 Performance and fill factor loss analysis of p-i-n solar cells with different hole-selective layers. (A) Comparison of fill factor values of PSCs with the stack glass/ITO/HTL/perovskite/C60/SnO2/Ag, triple-cation perovskite absorber with 1.68 eV bandgap. All shown cells are made from the same perovskite precursor and contact processing batch. (B) J-V curves of the best cells of the batch in (A), and a J-V curve of a Me-4PACz cell from another batch with LiF interlayer between C60 and perovskite, reaching a VOC of 1.234 V. (C) Intensity-dependent open-circuit voltage with linear fits (dashed lines). (D) Pseudo-J-V curves reconstructed from intensity-dependent absolute PL measurements on the illustrated sample stack. The 2PACz and Me-4PACz curves almost coincide; the dashed lines represent pseudo-J-V curves from the sample variations including the electron-selective C60 layer, with which all curves are comparable due to the limiting non-radiative recombination at the C60 interface. (E) Pseudo-J-V curves reconstructed from the measurements in (C). Table 1 summarizes the FF values extracted from the pseudo-J-V curves. (F) Repartition of loss mechanisms lowering the cell’s FF below the detailed balance limit, comparing PTAA and Me-4PACz cells.
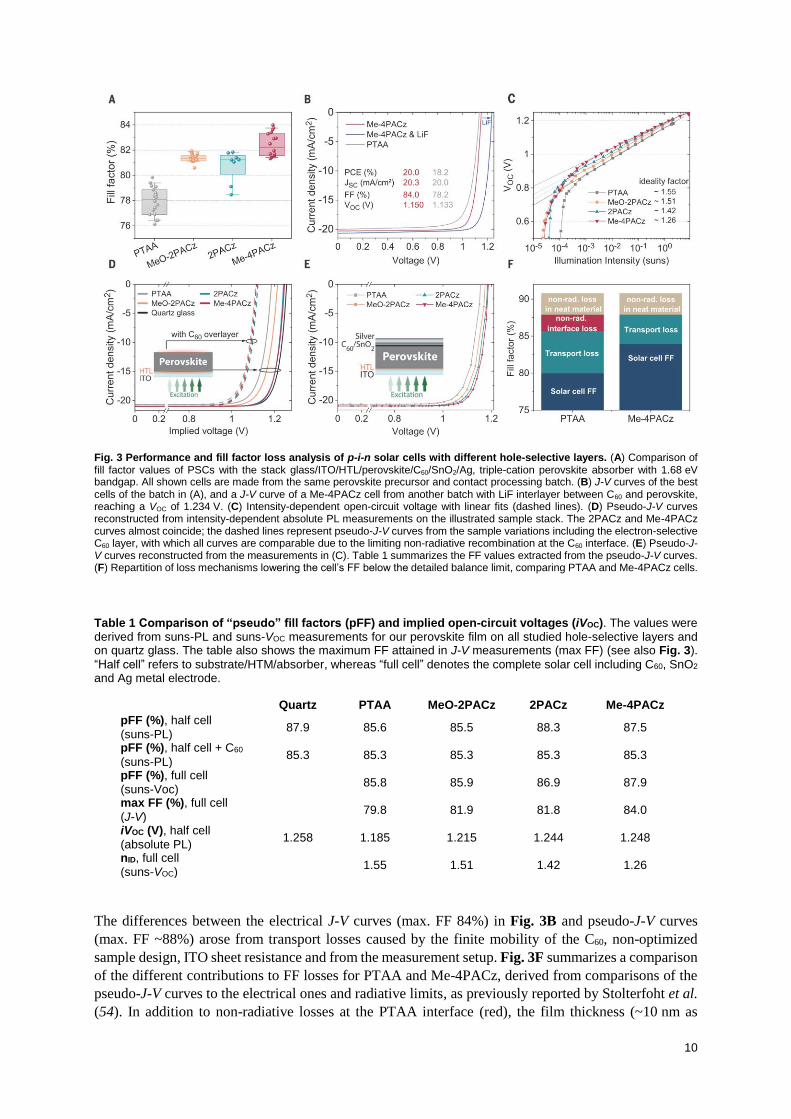
Table 1 Comparison of “pseudo” fill factors (pFF) and implied open-circuit voltages (iVOC). The values were derived from suns-PL and suns-VOC measurements for our perovskite film on all studied hole-selective layers and on quartz glass. The table also shows the maximum FF attained in J-V measurements (max FF) (see also Fig. 3).
“Half cell” refers to substrate/HTM/absorber, whereas “full cell” denotes the complete solar cell including C60, SnO2 and Ag metal electrode.
Quartz PTAA MeO-2PACz 2PACz Me-4PACz
pFF (%), half cell
(suns-PL) 87.9 85.6 85.5 88.3 87.5
pFF (%), half cell + C60
(suns-PL) 85.3 85.3 85.3 85.3 85.3
pFF (%), full cell
(suns-Voc) 85.8 85.9 86.9 87.9
max FF (%), full cell
(J-V) 79.8 81.9 81.8 84.0
iVOC (V), half cell
(absolute PL) 1.258 1.185 1.215 1.244 1.248
nID, full cell
(suns-VOC) 1.55 1.51 1.42 1.26
The differences between the electrical J-V curves (max. FF 84%) in Fig. 3B and pseudo-J-V curves
(max. FF ~88%) arose from transport losses caused by the finite mobility of the C60, non-optimized
sample design, ITO sheet resistance and from the measurement setup. Fig. 3F summarizes a comparison
of the different contributions to FF losses for PTAA and Me-4PACz, derived from comparisons of the
pseudo-J-V curves to the electrical ones and radiative limits, as previously reported by Stolterfoht et al.
(54). In addition to non-radiative losses at the PTAA interface (red), the film thickness (~10 nm as

11
compared to <1 nm with a SAM) and low conductivity of the PTAA led to greater transport losses than
with Me-4PACz.
Integration into monolithic perovskite/silicon tandem solar cells
Efficient passivation in combination with fast hole extraction of Me-4PACz in perovskite single-
junctions transferred into monolithic tandem solar cells, which led to significantly higher FF, VOC and
stability. A schematic stack of this solar cell is shown in Fig. 4A. We use a silicon heterojunction (SHJ)
solar cell as the bottom cell (26), based on a 260 µm thick n-type float-zone Si wafer processed as
described in the methods. The textured rear side enhanced the near-infrared absorption, whereas the
polished front side enabled the deposition of spin-coated perovskite. The 20 nm ITO recombination
layer also served as the anchoring oxide for the SAMs (7). The top cell, with the same 1.68 eV perovskite
band gap and nominal precursor composition Cs0.05(FA0.77MA0.23)0.95Pb(I0.77Br0.23)3 as analyzed above,
resembled the single-junction stack of ITO/HTL/Perovskite/(LiF)/C60/SnO2/IZO/Ag/LiF. Fig. 4B shows
a scanning electron microscope cross-section image of a part of the tandem solar cell; no obvious
differences were observed between perovskite films on the different HTLs (Figure S24). The molecular
SAM cannot be resolved with the SEM. A photograph and layout of the tandem device is shown in
Figure S25.
Fig. 4C compares the PCE of tandem solar cells based on PTAA, MeO-2PACz, 2PACz and Me-4PACz,
with and without a LiF interlayer at the perovskite/C60 interface. With PTAA, the LiF interlayer lead to
rapid degradation of the cells (see Figure S26 for individual parameters). Without the interlayer, we
achieved an average PCE of 25.25%. In contrast, the average efficiency of MeO-2PACz and 2PACz
was 26.21% and 26.56%, respectively. The utilization of a LiF interlayer for Me-4PACz cells increased
the VOC but reduced the FF. Thus, both configurations reached a similar average PCE of 26.25% and
26.41%, respectively. However, with Me-4PACz the maximum PCEs are with >29% higher than cells
with 2PACz, mainly because of higher FF of up to 81%. These high FF were achieved despite almost
all cells being perovskite limited (Table S1). The statistics of all photovoltaic parameters are shown in
Figure S26. The J-V measurements of the champion cells of each configuration are shown in Figure S27
and the PV parameters are summarized in Table S2.
The tandem solar cells did not reach FF values as in single-junction cells due to the larger active area
(1 cm2) and a TCO without grid fingers, leading to increased series resistance. The cells showed very
high VOCs of up to 1.92 V (Figure S28). With a VOC of ~715 mV from the bottom cell at half illumination
(Figure S29), the contribution of the perovskite subcell was ~1.2 V. Fig. 4D shows a direct comparison
between champion PTAA and Me-4PACz tandem cells, emphasizing that besides the 50 mV
improvement in VOC, the enhanced hole extraction boosted the FF by ~4% absolute.

12
Fig. 4: Characteristics of monolithic perovskite/silicon tandem solar cells utilizing various HTLs. (A) Schematic stack of
the monolithic perovskite/silicon tandem solar cell. (B) Scanning electron microscope (SEM) image of a tandem cross-section with
Me-4PACz as HTL. (C) Statistics of the PCE of several PTAA, MeO-2PACz, 2PACz and Me-4PACz tandem solar cells from J-V-
scan. (D) Certified J-V curve conducted at Fraunhofer ISE including the MPP and the device parameters (red) in comparison to a
tandem cell with PTAA (gray) as HTL measured in-house. (E) External quantum efficiency (EQE) and 1-reflection of the certified
tandem cell measured in-house. The AM1.5G-equivalent current densities are given in the legend in mA cm-2. (F) Long term MPP-
track using a dichromatic LED illumination of non-encapsulated solar cells in air at a controlled temperature of 25°C and relative
humidity of 30 to 40%. The data are normalized to the MPP average of the first 60 minutes of each individual track to account for
measurement noise. Due to the fast degradation, the MPP-track of the PTAA + LiF cell is normalized to the first recorded value.
The legend shows which HTL and whether the LiF interlayer was used.
We sent a tandem cell with Me-4PACz and LiF interlayer to Fraunhofer ISE CalLab for independent
certification (Fig. 4D; see Figure S30 for certificate). With a VOC of 1.90 V, FF of 79.4% and JSC of
19.23 mA cm-2, the cell had a PCE of 29.01% when measuring from JSC to VOC, similar to our in-house
measurement (Figure S31), and was certified at the MPP with a PCE of 29.15% with a designated area
of 1.064 cm². This PCE surpasses other monolithic (10, 27) and four-terminal perovskite-based tandem
solar cells (57), and is on par with the best GaAs single cell at the same active area (27).

13
Fig. 4E shows the external quantum efficiency (EQE) of the certified tandem cell. Under AM1.5G-
equivalent illumination conditions, the photogenerated current density Jph in the perovskite and silicon
subcells were 19.41 mA cm-2 and 20.18 mA cm-2, respectively, which agreed with the measured JSC of
19.23 mA cm-2. The tandem solar cell exhibited a non-ideal current mismatch of 0.77 mA cm-2, and
although the perovskite cell sets the tandem shunt resistance, the cell reached an FF of 79.5%. The
cumulative photogenerated current density and loss caused by reflection were 39.59 mA cm-2 and
2.57 mA cm-2, respectively. A comparison of EQEs and reflection losses between a cell of this work
(planar front side) and a fully textured cell by Sahli et al. is shown in Figure S32.
After the certification, we fabricated more Me-4PACz tandem solar cells without LiF interlayer (Figure
S26), which showed similar average performance as with LiF. The champion cell showed a higher FF
of 81% and lower VOC of 1.87 V than without LiF. Together with a JSC of 19.37 mA cm-2 this lead to a
PCE of 29.29% and a stabilized efficiency of 29.32% (Figure S33).
We measured the stability of different non-encapsulated tandem solar cells (Fig. 4F). To track the
degradation induced by either the top- or the bottom cell more carefully, we developed a dichromatic
LED setup using LEDs with 470 nm and 940 nm center emission wavelengths (Figure S34) and
independent intensity calibration and recording. We adjusted the mismatch so that the Jph in the
individual subcells was equal to that measured under AM1.5G-equivalent illumination to maintain
proper stability tracking of monolithic tandem solar cells (see below and supplementary text). The
devices were measured under continuous MPP load (using voltage perturbation), at 25 °C and in ambient
air with 30-40% relative humidity. The photogenerated current densities of the subcells are given in
Table S3 and set which subcell is limiting. The degradation for a perovskite-limited tandem cell with
Me-4PACz+LiF showed 75.9% of its initial efficiency (29.13%) after 300 hours. Substituting the Me-
4PACz with PTAA (perovskite-limited), the PCE decreased to 74.5% of its initial PCE (25.9%) after
only 90 hours.
We additionally tracked a cell with Me-4PACz as HTL without a LiF interlayer to test the intrinsic
stability of the HTL/perovskite combination. After 300 hours, the cell still operated at 95.5% of its initial
PCE. Although the cells were current-matched, this track monitored a degradation of the perovskite as
it directly translates into the performance of the tandem cell and no degradation of the Silicon subcell is
expected within these timescales. Our comparison strongly suggests that the utilization of a LiF
interlayer reduced the stability. As described in other works (58–61), the decrease in stability might be
caused by deterioration of the electrodes and C60 interface upon migration of Li+ and F- ions. We would
like to note that it is important to declare the mismatch-conditions because the utilization of a NIR-poor
spectrum would lead to a silicon limited cell and thus to a higher stability (see supplementary text).
Comparing this result to state-of-the-art stability tests of non-encapsulated tandem solar cells in ambient
conditions, where the cells retained and 90% after 61 hours (62) and 92% after 100 hours (13), our Me-
4PACz tandem solar cell showed a superior operational stability.
Beside the long-term stability measurements at 25°C, we conducted an MPP track of a Me-4PACz
tandem cell at elevated temperatures. Following the procedure of Jost et al., the temperature was
successively increased from 25°C to 85°C and back to 25°C (63). There was no loss in PCE after this
200 minutes procedure, despite the increased methylammonium and Br amount of the herein used wide
band gap perovskite (Figure S35).
Subcell J-V characteristics of a monolithic tandem solar cell
One downside of monolithic multijunction solar cells is that the subcell characteristics are barely
accessible. External quantum efficiency measurements are the only subcell-resolved measurements
presented in almost all publications reporting multijunction solar cells. Here, we used absolute
photoluminescence measurements in each subcell of a representative tandem solar cell (Me-
4PACz + LiF). With this, we could estimate the QFLS, and thus the VOC was accessible for both subcells
independently. Instead of local excitation and evaluation, we used hyperspectral imaging under 1-sun
equivalent excitation fluence (spectra and images shown in Fig. 5A).
14
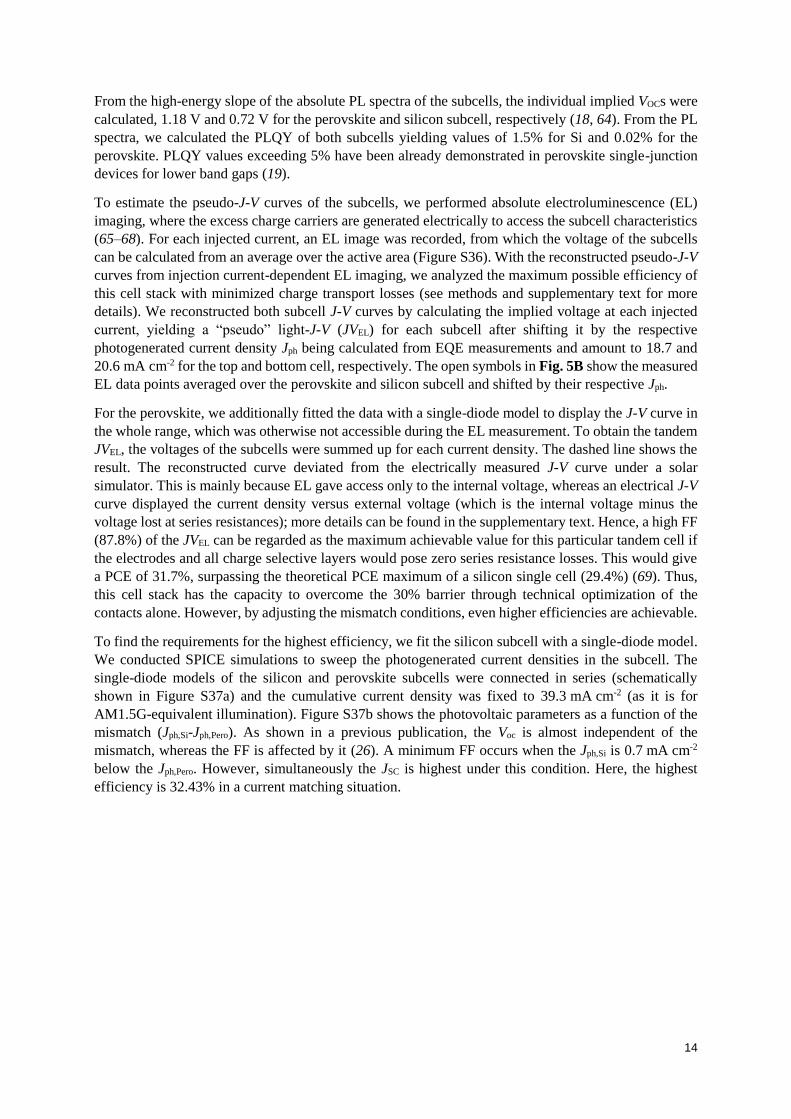
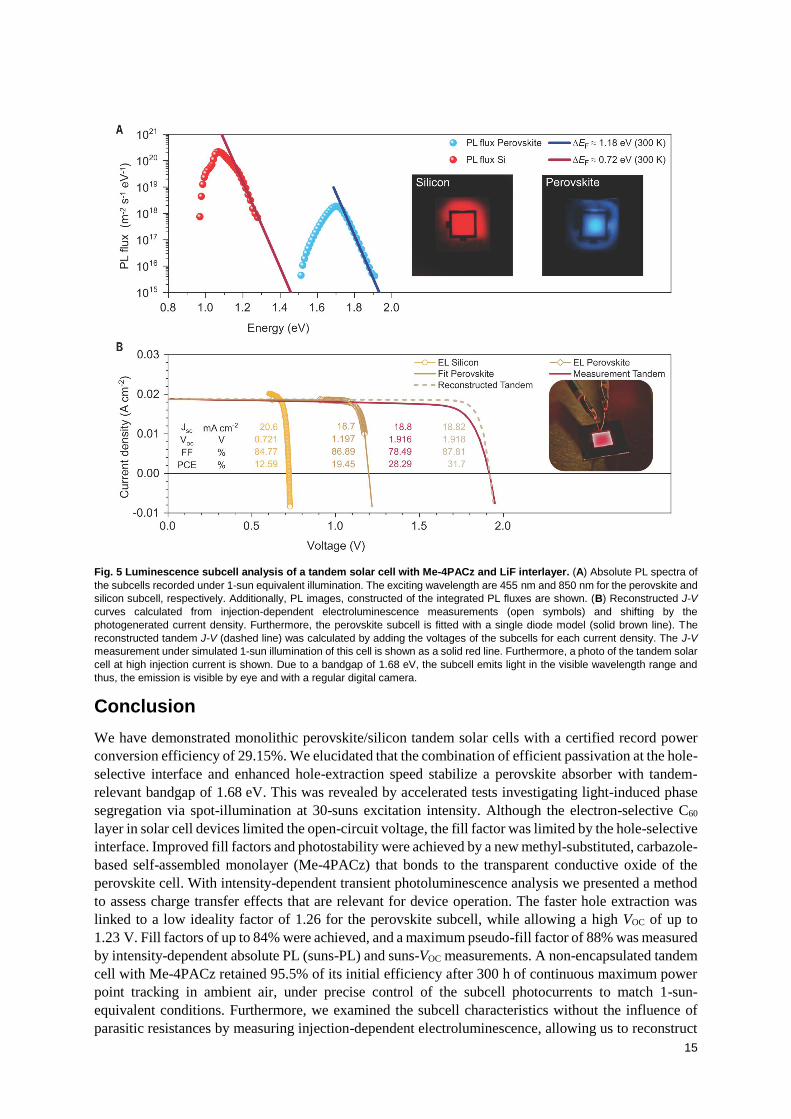
From the high-energy slope of the absolute PL spectra of the subcells, the individual implied VOCs were
calculated, 1.18 V and 0.72 V for the perovskite and silicon subcell, respectively (18, 64). From the PL
spectra, we calculated the PLQY of both subcells yielding values of 1.5% for Si and 0.02% for the
perovskite. PLQY values exceeding 5% have been already demonstrated in perovskite single-junction
devices for lower band gaps (19).
To estimate the pseudo-J-V curves of the subcells, we performed absolute electroluminescence (EL)
imaging, where the excess charge carriers are generated electrically to access the subcell characteristics
(65–68). For each injected current, an EL image was recorded, from which the voltage of the subcells
can be calculated from an average over the active area (Figure S36). With the reconstructed pseudo-J-V
curves from injection current-dependent EL imaging, we analyzed the maximum possible efficiency of
this cell stack with minimized charge transport losses (see methods and supplementary text for more
details). We reconstructed both subcell J-V curves by calculating the implied voltage at each injected
current, yielding a “pseudo” light-J-V (JVEL) for each subcell after shifting it by the respective
photogenerated current density Jph being calculated from EQE measurements and amount to 18.7 and
20.6 mA cm-2 for the top and bottom cell, respectively. The open symbols in Fig. 5B show the measured
EL data points averaged over the perovskite and silicon subcell and shifted by their respective Jph.
For the perovskite, we additionally fitted the data with a single-diode model to display the J-V curve in
the whole range, which was otherwise not accessible during the EL measurement. To obtain the tandem
JVEL, the voltages of the subcells were summed up for each current density. The dashed line shows the
result. The reconstructed curve deviated from the electrically measured J-V curve under a solar
simulator. This is mainly because EL gave access only to the internal voltage, whereas an electrical J-V
curve displayed the current density versus external voltage (which is the internal voltage minus the
voltage lost at series resistances); more details can be found in the supplementary text. Hence, a high FF
(87.8%) of the JVEL can be regarded as the maximum achievable value for this particular tandem cell if
the electrodes and all charge selective layers would pose zero series resistance losses. This would give
a PCE of 31.7%, surpassing the theoretical PCE maximum of a silicon single cell (29.4%) (69). Thus,
this cell stack has the capacity to overcome the 30% barrier through technical optimization of the
contacts alone. However, by adjusting the mismatch conditions, even higher efficiencies are achievable.
To find the requirements for the highest efficiency, we fit the silicon subcell with a single-diode model.
We conducted SPICE simulations to sweep the photogenerated current densities in the subcell. The
single-diode models of the silicon and perovskite subcells were connected in series (schematically
shown in Figure S37a) and the cumulative current density was fixed to 39.3 mA cm-2 (as it is for
AM1.5G-equivalent illumination). Figure S37b shows the photovoltaic parameters as a function of the
mismatch (Jph,Si-Jph,Pero). As shown in a previous publication, the Voc is almost independent of the
mismatch, whereas the FF is affected by it (26). A minimum FF occurs when the Jph,Si is 0.7 mA cm-2
below the Jph,Pero. However, simultaneously the JSC is highest under this condition. Here, the highest
efficiency is 32.43% in a current matching situation.
15
Fig. 5 Luminescence subcell analysis of a tandem solar cell with Me-4PACz and LiF interlayer. (A) Absolute PL spectra of
the subcells recorded under 1-sun equivalent illumination. The exciting wavelength are 455 nm and 850 nm for the perovskite and
silicon subcell, respectively. Additionally, PL images, constructed of the integrated PL fluxes are shown. (B) Reconstructed J-V
curves calculated from injection-dependent electroluminescence measurements (open symbols) and shifting by the
photogenerated current density. Furthermore, the perovskite subcell is fitted with a single diode model (solid brown line). The
reconstructed tandem J-V (dashed line) was calculated by adding the voltages of the subcells for each current density. The J-V
measurement under simulated 1-sun illumination of this cell is shown as a solid red line. Furthermore, a photo of the tandem solar
cell at high injection current is shown. Due to a bandgap of 1.68 eV, the subcell emits light in the visible wavelength range and
thus, the emission is visible by eye and with a regular digital camera.
Conclusion
We have demonstrated monolithic perovskite/silicon tandem solar cells with a certified record power
conversion efficiency of 29.15%. We elucidated that the combination of efficient passivation at the hole-
selective interface and enhanced hole-extraction speed stabilize a perovskite absorber with tandem-
relevant bandgap of 1.68 eV. This was revealed by accelerated tests investigating light-induced phase
segregation via spot-illumination at 30-suns excitation intensity. Although the electron-selective C60
layer in solar cell devices limited the open-circuit voltage, the fill factor was limited by the hole-selective
interface. Improved fill factors and photostability were achieved by a new methyl-substituted, carbazole-
based self-assembled monolayer (Me-4PACz) that bonds to the transparent conductive oxide of the
perovskite cell. With intensity-dependent transient photoluminescence analysis we presented a method
to assess charge transfer effects that are relevant for device operation. The faster hole extraction was
linked to a low ideality factor of 1.26 for the perovskite subcell, while allowing a high VOC of up to
1.23 V. Fill factors of up to 84% were achieved, and a maximum pseudo-fill factor of 88% was measured
by intensity-dependent absolute PL (suns-PL) and suns-VOC measurements. A non-encapsulated tandem
cell with Me-4PACz retained 95.5% of its initial efficiency after 300 h of continuous maximum power
point tracking in ambient air, under precise control of the subcell photocurrents to match 1-sun-
equivalent conditions. Furthermore, we examined the subcell characteristics without the influence of
parasitic resistances by measuring injection-dependent electroluminescence, allowing us to reconstruct

16
the subcell-J-V curves. We thereby estimated that upon technical improvements a maximum efficiency
of 32.4% for the presented device stack is possible.
Materials and Methods
Single-junction perovskite solar cells were fabricated on glass/ITO substrates. First, the hole-selective
layer (PTAA, MeO-2PACz, 2PACz or Me-4PACz) was deposited by spin-coating followed by the one-
step spin-coating deposition of the perovskite precursor solution using the antisolvent method. The
precursor had a nominal concentration of 1.24 mol/l. Afterwards, layers of C60 and SnO2 were deposited
via thermal evaporation and atomic layer deposition. Finally, a layer of silver was deposited via thermal
evaporation.
To analyze the quasi-fermi-level splitting, glass/ITO/HTL/perovskite samples were fabricated. The
samples were illuminated from the perovskite site with a photon flux equivalent to 1-sun illumination.
Transient photoluminescence was measured by pulsed excitation with 660 nm wavelength and time-
correlated single photon counting. The fluence was set to 1-sun equivalent charge generation.
Suns-VOC was measured by illuminating solar cells with varying intensities. For each intensity the
stabilized open-circuit voltage was measured. Similarly, suns-PL is measured by illuminating the
indicated sample stacks with different intensities. For each intensity (corresponding to a “pseudo”
injection current) the quasi-fermi level splitting was calculated.
Tandem solar cells were fabricated by depositing the p-i-n perovskite top cell with various hole-selective
layers on a silicon heterojunction solar cell with a textured rear side and polished front side. J-V
measurements were conducted at simulated AM1.5G illumination in air at 25°C. For long term stability
measurements, a custom-built setup with an LED array emitting at 470 nm and 940 nm was designed.
This enabled a stable illumination at simulated AM1.5G-equivalent charge carrier generation conditions
of the solar cells, which were tracked in air at 25°C. For analyzing the subcells of the tandem solar cell
we measured hyperspectral absolute photoluminescence by illuminating the tandem cell with 450 nm
light for excitation of the perovskite subcell and an 850 nm wavelength source for the excitation of the
silicon subcell. To reconstruct the subcell J-V, absolute electroluminescence imaging was conducted at
scanned bias voltage.
A detailed description of the fabrication and measurement techniques can be found in the Supplementary
Materials.
Acknowledgements
Acknowledgements: The authors thank M. Gabernig, C. Ferber, T. Lußky, H. Heinz, C. Klimm and M.
Muske at Institute for silicon Photovoltaics (HZB), T. Hänel, T. Henschel, M. Zelt, H. Rhein, K. Meyer-
Stillrich and M. Hartig at PVcomB (HZB) for technical assistance. A.A.A. thanks Aboma Merdasa for
his expertise during construction of the steady-state PL setup. E.K. and S.A. thank Christian Wolff (Uni.
Potsdam) and Kai Brinkmann (Uni. Wuppertal) for fruitful discussion at the beginning of the project.
AM acknowledges Aida Drevilkauskaite for help with the synthesis of 4PACz and 6PACz materials.
Funding: Funding was provided by the German Federal Ministry for Education and Research (BMBF)
(grant no. 03SF0540) within the project “Materialforschung für die Energiewende”. Parts of this work
received funding by the BMWi funded project ProTandem (no. 0324288C). The authors acknowledge
the HyPerCells graduate school for support and the funding by the Helmholtz Association within the
HySPRINT Innovation lab project and TAPAS project. M.G., P.C., S.A., and D.N. acknowledge funding
from the Helmholtz Association via HI-SCORE (Helmholtz International Research School). The
research has partly received funding from the European Union's Horizon 2020 research and innovation
programme under grant agreement No. 763977 of the PerTPV project. A.M. and TM acknowledges
funding by the Research Council of Lithuania under grant agreement no. S‐MIP‐19‐5/SV3‐1079 of the
SAM project. M.J., G.M and M.T. thank Slovene Research Agency (ARRS) for funding through
17
research programs P2-0197 and J2-1727. M.S., D.N. and S.A. further acknowledge the Deutsche
Forschungsgemeinschaft (DFG, German Research Foundation) - project number 423749265 and
03EE1017C - SPP 2196 (SURPRISE and HIPSTER) for funding. J.A.S. thanks EPSRC and Prof. David
Lidzey for Ph.D. studentship funding via CDT-PV (EP/L01551X/1) and Erasmus+ for funding. Author
Contributions A.A.A., E.K., B.L., and S.A. planned the experiments, coordinated the work and
prepared the figures. Er.K., A.M. and T.M. designed and synthesized the Me-4PACz SAM and the
(Me-)nPACz series. A.A.A. and B.L. processed the single-junction cells and optimized the SAM
deposition. E.K. and B.L. processed the tandem cells. A.B.M.-V. processed the Si bottom cells. A.A.A.,
H.H. and J.A.M conducted and analyzed the PL experiments. J.A.M., A.A.A. and E.K. performed the
EL studies. H.H. recorded the Terahertz measurements and performed the data analysis. P.C., M.G. and
M.S. conducted the pseudo-J-V and FF-VOC loss analysis (intensity-dep. VOC and QFLS). D.M.
performed the photoelectron spectroscopy. J.A.S., D.S. and N.P. performed crystallographic analysis.
G.M., M.J., B.L. and E.K. designed and built the tandem aging setup and recorded the long-term MPP
tracks. S.A., V.G., M.S., T.U., T.M., C.G., R.S., M.T., La.K., A.A., D.N., B.S. and B.R. supervised the
projects. All authors contributed to data interpretation and manuscript writing. Competing interests:
HZB and KTU filed patents for the herein used SAM molecules and their use in tandem solar cells. Data
and materials availability: All data is available in the main text or the supplementary materials.
Supplementary Materials:
Materials, Processing and Methods
Figures S1-S43
Table S1-3
Supplementary text
References (70 - 85)
18
References
1. A. De Vos, Detailed balance limit of the efficiency of tandem solar cells. J. Phys. D. Appl.
Phys. 13, 839–846 (1980).
2. W. Shockley, H. J. Queisser, Detailed Balance Limit of Efficiency of p‐n Junction Solar Cells.
J. Appl. Phys. 32, 510–519 (1961).
3. S. E. Sofia, H. Wang, A. Bruno, J. L. Cruz-Campa, T. Buonassisi, I. M. Peters, Roadmap for
cost-effective, commercially-viable perovskite silicon tandems for the current and future PV
market. Sustain. Energy Fuels. 4, 852–862 (2020).
4. Z. Li, Y. Zhao, X. Wang, Y. Sun, Z. Zhao, Y. Li, H. Zhou, Q. Chen, Cost Analysis of
Perovskite Tandem Photovoltaics. Joule. 2, 1559–1572 (2018).
5. National Renewable Energy Laboratory, “Best Research-Cell Efficiency Chart” (2020),
(available at www.nrel.gov/pv/cell-efficiency.html).
6. T. Todorov, T. Gershon, O. Gunawan, Y. S. Lee, C. Sturdevant, L.-Y. Chang, S. Guha,
Monolithic Perovskite-CIGS Tandem Solar Cells via In Situ Band Gap Engineering. Adv.
Energy Mater. 5, 1500799 (2015).
7. A. Al-Ashouri, A. Magomedov, M. Roß, M. Jošt, M. Talaikis, G. Chistiakova, T. Bertram, J.
A. Márquez, E. Köhnen, E. Kasparavičius, S. Levcenco, L. Gil-Escrig, C. J. Hages, R.
Schlatmann, B. Rech, T. Malinauskas, T. Unold, C. A. Kaufmann, L. Korte, G. Niaura, V.
Getautis, S. Albrecht, Conformal monolayer contacts with lossless interfaces for perovskite
single junction and monolithic tandem solar cells. Energy Environ. Sci. 12, 3356–3369 (2019).
8. R. Lin, K. Xiao, Z. Qin, Q. Han, C. Zhang, M. Wei, M. I. Saidaminov, Y. Gao, J. Xu, M. Xiao,
A. Li, J. Zhu, E. H. Sargent, H. Tan, Monolithic all-perovskite tandem solar cells with 24.8%
efficiency exploiting comproportionation to suppress Sn(ii) oxidation in precursor ink. Nat.
Energy. 4, 864–873 (2019).
9. G. E. Eperon, T. Leijtens, K. A. Bush, R. Prasanna, T. Green, J. T.-W. Wang, D. P. McMeekin,
G. Volonakis, R. L. Milot, R. May, A. Palmstrom, D. J. Slotcavage, R. A. Belisle, J. B. Patel,
E. S. Parrott, R. J. Sutton, W. Ma, F. Moghadam, B. Conings, A. Babayigit, H.-G. Boyen, S.
Bent, F. Giustino, L. M. Herz, M. B. Johnston, M. D. McGehee, H. J. Snaith, Perovskite-
perovskite tandem photovoltaics with optimized band gaps. Science (80-. ). 354, 861–865
(2016).
10. D. Kim, H. J. Jung, I. J. Park, B. W. Larson, S. P. Dunfield, C. Xiao, J. Kim, J. Tong, P.
Boonmongkolras, S. G. Ji, F. Zhang, S. R. Pae, M. Kim, S. B. Kang, V. Dravid, J. J. Berry, J.
Y. Kim, K. Zhu, D. H. Kim, B. Shin, Efficient, stable silicon tandem cells enabled by anion-
engineered wide-bandgap perovskites. Science (80-. ). 368, 155–160 (2020).
11. J. Xu, C. C. Boyd, Z. J. Yu, A. F. Palmstrom, D. J. Witter, B. W. Larson, R. M. France, J.
Werner, S. P. Harvey, E. J. Wolf, W. Weigand, S. Manzoor, M. F. A. M. van Hest, J. J. Berry,
J. M. Luther, Z. C. Holman, M. D. McGehee, Triple-halide wide–band gap perovskites with
suppressed phase segregation for efficient tandems. Science (80-. ). 367, 1097–1104 (2020).
12. Y. Hou, E. Aydin, M. De Bastiani, C. Xiao, F. H. Isikgor, D.-J. Xue, B. Chen, H. Chen, B.
Bahrami, A. H. Chowdhury, A. Johnston, S.-W. Baek, Z. Huang, M. Wei, Y. Dong, J.
Troughton, R. Jalmood, A. J. Mirabelli, T. G. Allen, E. Van Kerschaver, M. I. Saidaminov, D.
Baran, Q. Qiao, K. Zhu, S. De Wolf, E. H. Sargent, Efficient tandem solar cells with solution-
processed perovskite on textured crystalline silicon. Science (80-. ). 367, 1135–1140 (2020).
13. B. Chen, Z. J. Yu, S. Manzoor, S. Wang, W. Weigand, Z. Yu, G. Yang, Z. Ni, X. Dai, Z. C.
Holman, J. Huang, Blade-Coated Perovskites on Textured Silicon for 26%-Efficient

19
Monolithic Perovskite/Silicon Tandem Solar Cells. Joule. 4, 850–864 (2020).
14. M. Jošt, L. Kegelmann, L. Korte, S. Albrecht, Monolithic Perovskite Tandem Solar Cells: A
Review of the Present Status and Advanced Characterization Methods Toward 30% Efficiency.
Adv. Energy Mater. 10, 1904102 (2020).
15. Y. Jiang, I. Almansouri, S. Huang, T. Young, Y. Li, Y. Peng, Q. Hou, L. Spiccia, U. Bach, Y.-
B. Cheng, M. A. Green, A. Ho-Baillie, Optical analysis of perovskite/silicon tandem solar
cells. J. Mater. Chem. C. 4, 5679–5689 (2016).
16. I. L. Braly, D. W. DeQuilettes, L. M. Pazos-Outón, S. Burke, M. E. Ziffer, D. S. Ginger, H. W.
Hillhouse, Hybrid perovskite films approaching the radiative limit with over 90%
photoluminescence quantum efficiency. Nat. Photonics. 12, 355–361 (2018).
17. D. W. deQuilettes, S. Koch, S. Burke, R. K. Paranji, A. J. Shropshire, M. E. Ziffer, D. S.
Ginger, Photoluminescence Lifetimes Exceeding 8 μs and Quantum Yields Exceeding 30% in
Hybrid Perovskite Thin Films by Ligand Passivation. ACS Energy Lett. 1, 438–444 (2016).
18. T. Kirchartz, J. A. Márquez, M. Stolterfoht, T. Unold, Photoluminescence‐Based
Characterization of Halide Perovskites for Photovoltaics. Adv. Energy Mater. 10, 1904134
(2020).
19. Z. Liu, L. Krückemeier, B. Krogmeier, B. Klingebiel, J. A. Márquez, S. Levcenko, S. Öz, S.
Mathur, U. Rau, T. Unold, T. Kirchartz, Open-Circuit Voltages Exceeding 1.26 V in Planar
Methylammonium Lead Iodide Perovskite Solar Cells. ACS Energy Lett. 4, 110–117 (2019).
20. P. Caprioglio, F. Zu, C. M. Wolff, J. A. Márquez Prieto, M. Stolterfoht, P. Becker, N. Koch, T.
Unold, B. Rech, S. Albrecht, D. Neher, High open circuit voltages in pin-type perovskite solar
cells through strontium addition. Sustain. Energy Fuels. 3, 550–563 (2019).
21. Q. Jiang, Y. Zhao, X. Zhang, X. Yang, Y. Chen, Z. Chu, Q. Ye, X. Li, Z. Yin, J. You, Surface
passivation of perovskite film for efficient solar cells. Nat. Photonics. 13, 460–466 (2019).
22. S. Yang, J. Dai, Z. Yu, Y. Shao, Y. Zhou, X. Xiao, X. C. Zeng, J. Huang, Tailoring Passivation
Molecular Structures for Extremely Small Open-Circuit Voltage Loss in Perovskite Solar Cells.
J. Am. Chem. Soc. 141, 5781–5787 (2019).
23. L. Krückemeier, U. Rau, M. Stolterfoht, T. Kirchartz, How to Report Record Open‐Circuit
Voltages in Lead‐Halide Perovskite Solar Cells. Adv. Energy Mater. 10, 1902573 (2020).
24. P. K. Nayak, S. Mahesh, H. J. Snaith, D. Cahen, Photovoltaic solar cell technologies: analysing
the state of the art. Nat. Rev. Mater. 4, 269–285 (2019).
25. A. Rajagopal, R. J. Stoddard, S. B. Jo, H. W. Hillhouse, A. K. Y. Jen, Overcoming the
Photovoltage Plateau in Large Bandgap Perovskite Photovoltaics. Nano Lett. 18, 3985–3993
(2018).
26. E. Köhnen, M. Jošt, A. B. Morales-Vilches, P. Tockhorn, A. Al-Ashouri, B. Macco, L.
Kegelmann, L. Korte, B. Rech, R. Schlatmann, B. Stannowski, S. Albrecht, Highly efficient
monolithic perovskite silicon tandem solar cells: analyzing the influence of current mismatch
on device performance. Sustain. Energy Fuels. 3, 1995–2005 (2019).
27. M. A. Green, E. D. Dunlop, J. Hohl-Ebinger, M. Yoshita, N. Kopidakis, A. W. Y. Ho-Baillie,
Solar cell efficiency tables (Version 55). Prog. Photovoltaics Res. Appl. 28, 3–15 (2020).
28. P. Caprioglio, C. M. Wolff, O. J. Sandberg, A. Armin, B. Rech, S. Albrecht, D. Neher, M.
Stolterfoht, On the Origin of the Ideality Factor in Perovskite Solar Cells. Adv. Energy Mater.
10, 2000502 (2020).
29. M. A. Green, A. W. Y. Ho-Baillie, Pushing to the Limit: Radiative Efficiencies of Recent
Mainstream and Emerging Solar Cells. ACS Energy Lett. 4, 1639–1644 (2019).

20
30. K. Jäger, L. Korte, B. Rech, S. Albrecht, Numerical optical optimization of monolithic planar
perovskite-silicon tandem solar cells with regular and inverted device architectures. Opt.
Express. 25, A473 (2017).
31. M. Jošt, E. Köhnen, A. B. Morales-Vilches, B. Lipovšek, K. Jäger, B. Macco, A. Al-Ashouri, J.
Krč, L. Korte, B. Rech, R. Schlatmann, M. Topič, B. Stannowski, S. Albrecht, Textured
interfaces in monolithic perovskite/silicon tandem solar cells: advanced light management for
improved efficiency and energy yield. Energy Environ. Sci. 11, 3511–3523 (2018).
32. T. Leijtens, K. A. Bush, R. Prasanna, M. D. McGehee, Opportunities and challenges for
tandem solar cells using metal halide perovskite semiconductors. Nat. Energy. 3, 828–838
(2018).
33. E. T. Hoke, D. J. Slotcavage, E. R. Dohner, A. R. Bowring, H. I. Karunadasa, M. D. McGehee,
Reversible photo-induced trap formation in mixed-halide hybrid perovskites for photovoltaics.
Chem. Sci. 6, 613–617 (2015).
34. D. J. Slotcavage, H. I. Karunadasa, M. D. McGehee, Light-Induced Phase Segregation in
Halide-Perovskite Absorbers. ACS Energy Lett. 1, 1199–1205 (2016).
35. S. Mahesh, J. M. Ball, R. D. J. Oliver, D. P. McMeekin, P. K. Nayak, M. B. Johnston, H. J.
Snaith, Revealing the origin of voltage loss in mixed-halide perovskite solar cells. Energy
Environ. Sci. 13, 258–267 (2020).
36. M. Saliba, T. Matsui, J.-Y. Seo, K. Domanski, J.-P. Correa-Baena, M. K. Nazeeruddin, S. M.
Zakeeruddin, W. Tress, A. Abate, A. Hagfeldt, M. Grätzel, Cesium-containing triple cation
perovskite solar cells: improved stability, reproducibility and high efficiency. Energy Environ.
Sci. 9, 1989–1997 (2016).
37. M. Stolterfoht, P. Caprioglio, C. M. Wolff, J. A. Márquez, J. Nordmann, S. Zhang, D.
Rothhardt, U. Hörmann, Y. Amir, A. Redinger, L. Kegelmann, F. Zu, S. Albrecht, N. Koch, T.
Kirchartz, M. Saliba, T. Unold, D. Neher, The impact of energy alignment and interfacial
recombination on the internal and external open-circuit voltage of perovskite solar cells.
Energy Environ. Sci. 12, 2778–2788 (2019).
38. D. Luo, W. Yang, Z. Wang, A. Sadhanala, Q. Hu, R. Su, R. Shivanna, G. F. Trindade, J. F.
Watts, Z. Xu, T. Liu, K. Chen, F. Ye, P. Wu, L. Zhao, J. Wu, Y. Tu, Y. Zhang, X. Yang, W.
Zhang, R. H. Friend, Q. Gong, H. J. Snaith, R. Zhu, Enhanced photovoltage for inverted planar
heterojunction perovskite solar cells. Science (80-. ). 360, 1442–1446 (2018).
39. Q. Wang, E. Mosconi, C. Wolff, J. Li, D. Neher, F. De Angelis, G. P. Suranna, R. Grisorio, A.
Abate, Rationalizing the Molecular Design of Hole‐Selective Contacts to Improve Charge
Extraction in Perovskite Solar Cells. Adv. Energy Mater. 9, 1900990 (2019).
40. C. Huang, W. Fu, C.-Z. Li, Z. Zhang, W. Qiu, M. Shi, P. Heremans, A. K. Y. Jen, H. Chen,
Dopant-Free Hole-Transporting Material with a C 3 h Symmetrical Truxene Core for Highly
Efficient Perovskite Solar Cells. J. Am. Chem. Soc. 138, 2528–2531 (2016).
41. A. Torres, L. G. C. Rego, Surface Effects and Adsorption of Methoxy Anchors on Hybrid Lead
Iodide Perovskites: Insights for Spiro-MeOTAD Attachment. J. Phys. Chem. C. 118, 26947–
26954 (2014).
42. M. Saliba, S. Orlandi, T. Matsui, S. Aghazada, M. Cavazzini, J.-P. Correa-Baena, P. Gao, R.
Scopelliti, E. Mosconi, K.-H. Dahmen, F. De Angelis, A. Abate, A. Hagfeldt, G. Pozzi, M.
Graetzel, M. K. Nazeeruddin, A molecularly engineered hole-transporting material for efficient
perovskite solar cells. Nat. Energy. 1, 15017 (2016).
43. Y. Lin, B. Chen, Y. Fang, J. Zhao, C. Bao, Z. Yu, Y. Deng, P. N. Rudd, Y. Yan, Y. Yuan, J.
Huang, Excess charge-carrier induced instability of hybrid perovskites. Nat. Commun. 9, 4981
(2018).
21
44. B. Chen, J. Song, X. Dai, Y. Liu, P. N. Rudd, X. Hong, J. Huang, Synergistic Effect of
Elevated Device Temperature and Excess Charge Carriers on the Rapid Light‐Induced
Degradation of Perovskite Solar Cells. Adv. Mater. 31, 1902413 (2019).
45. N. Phung, A. Al‐Ashouri, S. Meloni, A. Mattoni, S. Albrecht, E. L. Unger, A. Merdasa, A.
Abate, The Role of Grain Boundaries on Ionic Defect Migration in Metal Halide Perovskites.
Adv. Energy Mater. 10, 1903735 (2020).
46. B. Krogmeier, F. Staub, D. Grabowski, U. Rau, T. Kirchartz, Quantitative analysis of the
transient photoluminescence of CH 3 NH 3 PbI 3 /PC 61 BM heterojunctions by numerical
simulations. Sustain. Energy Fuels. 2, 1027–1034 (2018).
47. F. Staub, H. Hempel, J.-C. Hebig, J. Mock, U. W. Paetzold, U. Rau, T. Unold, T. Kirchartz,
Beyond Bulk Lifetimes: Insights into Lead Halide Perovskite Films from Time-Resolved
Photoluminescence. Phys. Rev. Appl. 6, 044017 (2016).
48. M. Krumrey, G. Ulm, High-accuracy detector calibration at the PTB four-crystal
monochromator beamline. Nucl. Instruments Methods Phys. Res. Sect. A Accel. Spectrometers,
Detect. Assoc. Equip. 467–468, 1175–1178 (2001).
49. D. Skroblin, A. Schavkan, M. Pflüger, N. Pilet, B. Lüthi, M. Krumrey, Vacuum-compatible
photon-counting hybrid pixel detector for wide-angle x-ray scattering, x-ray diffraction, and x-
ray reflectometry in the tender x-ray range. Rev. Sci. Instrum. 91, 023102 (2020).
50. K. A. Bush, A. F. Palmstrom, Z. J. Yu, M. Boccard, R. Cheacharoen, J. P. Mailoa, D. P.
McMeekin, R. L. Z. Z. Hoye, C. D. Bailie, T. Leijtens, I. M. Peters, M. C. Minichetti, N.
Rolston, R. Prasanna, S. Sofia, D. Harwood, W. Ma, F. Moghadam, H. J. Snaith, T. Buonassisi,
Z. C. Holman, S. F. Bent, M. D. McGehee, 23.6%-efficient monolithic perovskite/silicon
tandem solar cells with improved stability. Nat. Energy. 2, 17009 (2017).
51. J.-F. Guillemoles, T. Kirchartz, D. Cahen, U. Rau, Guide for the perplexed to the Shockley–
Queisser model for solar cells. Nat. Photonics. 13, 501–505 (2019).
52. J. Seo, S. Park, Y. Chan Kim, N. J. Jeon, J. H. Noh, S. C. Yoon, S. Il Seok, Benefits of very
thin PCBM and LiF layers for solution-processed p-i-n perovskite solar cells. Energy Environ.
Sci. 7, 2642–2646 (2014).
53. M. Stolterfoht, C. M. Wolff, J. A. Márquez, S. Zhang, C. J. Hages, D. Rothhardt, S. Albrecht,
P. L. Burn, P. Meredith, T. Unold, D. Neher, Visualization and suppression of interfacial
recombination for high-efficiency large-area pin perovskite solar cells. Nat. Energy. 3, 847–
854 (2018).
54. M. Stolterfoht, M. Grischek, P. Caprioglio, C. M. Wolff, E. Gutierrez‐Partida, F. Peña‐
Camargo, D. Rothhardt, S. Zhang, M. Raoufi, J. Wolansky, M. Abdi‐Jalebi, S. D. Stranks, S.
Albrecht, T. Kirchartz, D. Neher, How To Quantify the Efficiency Potential of Neat Perovskite
Films: Perovskite Semiconductors with an Implied Efficiency Exceeding 28%. Adv. Mater. 32,
2000080 (2020).
55. N. Tessler, Y. Vaynzof, Insights from Device Modeling of Perovskite Solar Cells. ACS Energy
Lett. 5, 1260–1270 (2020).
56. W. Wang, P. Chen, C. Chiang, T. Guo, C. Wu, S. Feng, Synergistic Reinforcement of Built‐In
Electric Fields for Highly Efficient and Stable Perovskite Photovoltaics. Adv. Funct. Mater. 30,
1909755 (2020).
57. B. Chen, S.-W. Baek, Y. Hou, E. Aydin, M. De Bastiani, B. Scheffel, A. Proppe, Z. Huang, M.
Wei, Y.-K. Wang, E.-H. Jung, T. G. Allen, E. Van Kerschaver, F. P. García de Arquer, M. I.
Saidaminov, S. Hoogland, S. De Wolf, E. H. Sargent, Enhanced optical path and electron
diffusion length enable high-efficiency perovskite tandems. Nat. Commun. 11, 1257 (2020).
58. R. Quintero-Bermudez, J. Kirman, D. Ma, E. H. Sargent, R. Quintero-Torres, Mechanisms of
22
LiF Interlayer Enhancements of Perovskite Light-Emitting Diodes. J. Phys. Chem. Lett. 11,
4213–4220 (2020).
59. Z. Li, C. Xiao, Y. Yang, S. P. Harvey, D. H. Kim, J. A. Christians, M. Yang, P. Schulz, S. U.
Nanayakkara, C.-S. Jiang, J. M. Luther, J. J. Berry, M. C. Beard, M. M. Al-Jassim, K. Zhu,
Extrinsic ion migration in perovskite solar cells. Energy Environ. Sci. 10, 1234–1242 (2017).
60. S.-M. Bang, S. S. Shin, N. J. Jeon, Y. Y. Kim, G. Kim, T.-Y. Yang, J. Seo, Defect-Tolerant
Sodium-Based Dopant in Charge Transport Layers for Highly Efficient and Stable Perovskite
Solar Cells. ACS Energy Lett. 5, 1198–1205 (2020).
61. S. N. Habisreutinger, T. Leijtens, G. E. Eperon, S. D. Stranks, R. J. Nicholas, H. J. Snaith,
Carbon Nanotube/Polymer Composites as a Highly Stable Hole Collection Layer in Perovskite
Solar Cells. Nano Lett. 14, 5561–5568 (2014).
62. F. Sahli, J. Werner, B. A. Kamino, M. Bräuninger, R. Monnard, B. Paviet-Salomon, L.
Barraud, L. Ding, J. J. Diaz Leon, D. Sacchetto, G. Cattaneo, M. Despeisse, M. Boccard, S.
Nicolay, Q. Jeangros, B. Niesen, C. Ballif, Fully textured monolithic perovskite/silicon tandem
solar cells with 25.2% power conversion efficiency. Nat. Mater. 17, 820–826 (2018).
63. M. Jošt, B. Lipovšek, B. Glažar, A. Al‐Ashouri, K. Brecl, G. Matič, A. Magomedov, V.
Getautis, M. Topič, S. Albrecht, Perovskite Solar Cells go Outdoors: Field Testing and
Temperature Effects on Energy Yield. Adv. Energy Mater. 10, 2000454 (2020).
64. T. Unold, L. Gütay, in Advanced Characterization Techniques for Thin Film Solar Cells
(Wiley-VCH Verlag GmbH & Co. KGaA, Weinheim, Germany, 2011), pp. 151–175.
65. S. Chen, L. Zhu, M. Yoshita, T. Mochizuki, C. Kim, H. Akiyama, M. Imaizumi, Y. Kanemitsu,
Thorough subcells diagnosis in a multi-junction solar cell via absolute electroluminescence-
efficiency measurements. Sci. Rep. 5, 7836 (2015).
66. D. Alonso-Alvarez, N. Ekins-Daukes, Photoluminescence-Based Current–Voltage
Characterization of Individual Subcells in Multijunction Devices. IEEE J. Photovoltaics. 6,
1004–1011 (2016).
67. S. Roensch, R. Hoheisel, F. Dimroth, A. W. Bett, Subcell I-V characteristic analysis of
GaInP/GaInAs/Ge solar cells using electroluminescence measurements. Appl. Phys. Lett. 98,
251113 (2011).
68. D. Hinken, K. Ramspeck, K. Bothe, B. Fischer, R. Brendel, Series resistance imaging of solar
cells by voltage dependent electroluminescence. Appl. Phys. Lett. 91, 182104 (2007).
69. A. Richter, M. Hermle, S. W. Glunz, Reassessment of the Limiting Efficiency for Crystalline
Silicon Solar Cells. IEEE J. Photovoltaics. 3, 1184–1191 (2013).
70. L. Mazzarella, Y. Lin, S. Kirner, A. B. Morales‐Vilches, L. Korte, S. Albrecht, E. Crossland,
B. Stannowski, C. Case, H. J. Snaith, R. Schlatmann, Infrared Light Management Using a
Nanocrystalline Silicon Oxide Interlayer in Monolithic Perovskite/Silicon Heterojunction
Tandem Solar Cells with Efficiency above 25%. Adv. Energy Mater. 9, 1803241 (2019).
71. U. Rau, Reciprocity relation between photovoltaic quantum efficiency and electroluminescent
emission of solar cells. Phys. Rev. B. 76, 085303 (2007).
72. H. Hempel, T. Unold, R. Eichberger, Measurement of charge carrier mobilities in thin films on
metal substrates by reflection time resolved terahertz spectroscopy. Opt. Express. 25, 17227
(2017).
73. M. Meusel, R. Adelhelm, F. Dimroth, A. W. Bett, W. Warta, Spectral mismatch correction and
spectrometric characterization of monolithic III-V multi-junction solar cells. Prog.
Photovoltaics Res. Appl. 10, 243–255 (2002).
74. G. Ashiotis, A. Deschildre, Z. Nawaz, J. P. Wright, D. Karkoulis, F. E. Picca, J. Kieffer, The

23
fast azimuthal integration Python library: pyFAI. J. Appl. Crystallogr. 48, 510–519 (2015).
75. Z. Ni, C. Bao, Y. Liu, Q. Jiang, W.-Q. Wu, S. Chen, X. Dai, B. Chen, B. Hartweg, Z. Yu, Z.
Holman, J. Huang, Resolving spatial and energetic distributions of trap states in metal halide
perovskite solar cells. Science (80-. ). 367, 1352–1358 (2020).
76. C. M. Wolff, F. Zu, A. Paulke, L. P. Toro, N. Koch, D. Neher, Reduced Interface-Mediated
Recombination for High Open-Circuit Voltages in CH 3 NH 3 PbI 3 Solar Cells. Adv. Mater.
29, 1700159 (2017).
77. H. Hempel, C. J. Hages, R. Eichberger, I. Repins, T. Unold, Minority and Majority Charge
Carrier Mobility in Cu2ZnSnSe4 revealed by Terahertz Spectroscopy. Sci. Rep. 8, 14476
(2018).
78. H. Hempel, A. Redinger, I. Repins, C. Moisan, G. Larramona, G. Dennler, M. Handwerg, S. F.
Fischer, R. Eichberger, T. Unold, Intragrain charge transport in kesterite thin films—Limits
arising from carrier localization. J. Appl. Phys. 120, 175302 (2016).
79. F. Peña-Camargo, P. Caprioglio, F. Zu, E. Gutierrez-Partida, C. M. Wolff, K. Brinkmann, S.
Albrecht, T. Riedl, N. Koch, D. Neher, M. Stolterfoht, Halide Segregation versus Interfacial
Recombination in Bromide-Rich Wide-Gap Perovskite Solar Cells. ACS Energy Lett. 5, 2728–
2736 (2020).
80. J. A. Bardecker, H. Ma, T. Kim, F. Huang, M. S. Liu, Y.-J. Cheng, G. Ting, A. K.-Y. Jen, Self-
assembled Electroactive Phosphonic Acids on ITO: Maximizing Hole-Injection in Polymer
Light-Emitting Diodes. Adv. Funct. Mater. 18, 3964–3971 (2008).
81. P. N. Dickerson, A. M. Hibberd, N. Oncel, S. L. Bernasek, Hydrogen-Bonding versus van der
Waals Interactions in Self-Assembled Monolayers of Substituted Isophthalic Acids. Langmuir.
26, 18155–18161 (2010).
82. N. Nerngchamnong, L. Yuan, D.-C. Qi, J. Li, D. Thompson, C. A. Nijhuis, The role of van der
Waals forces in the performance of molecular diodes. Nat. Nanotechnol. 8, 113–118 (2013).
83. R.-F. Dou, X.-C. Ma, L. Xi, H. L. Yip, K. Y. Wong, W. M. Lau, J.-F. Jia, Q.-K. Xue, W.-S.
Yang, H. Ma, A. K. Y. Jen, Self-Assembled Monolayers of Aromatic Thiols Stabilized by
Parallel-Displaced π−π Stacking Interactions. Langmuir. 22, 3049–3056 (2006).
84. M. Boccard, C. Ballif, Influence of the Subcell Properties on the Fill Factor of Two-Terminal
Perovskite–Silicon Tandem Solar Cells. ACS Energy Lett. 5, 1077–1082 (2020).
85. P. Caprioglio, M. Stolterfoht, C. M. Wolff, T. Unold, B. Rech, S. Albrecht, D. Neher, On the
Relation between the Open‐Circuit Voltage and Quasi‐Fermi Level Splitting in Efficient
Perovskite Solar Cells. Adv. Energy Mater. 9, 1901631 (2019).
24
Supplementary Materials
Contents
Materials and Methods .......................................................................................................................... 23
Ultraviolet photoelectron spectroscopy ................................................................................................. 30
Additional photoluminescence data ...................................................................................................... 31
Supplementary text: Amount of higher order recombination estimated from the TrPL transient.... 35
X-ray diffraction study .......................................................................................................................... 38
Additional single-junction device data .................................................................................................. 41
Additional data on tandem devices........................................................................................................ 46
Certification ...................................................................................................................................... 51
Supplementary text: Light sources for long term stability tests of tandem solar cells ..................... 55
Supplementary text: J-V reconstructed from EL measurements ...................................................... 57
Synthesis of the new SAMs ................................................................................................................... 59
Me-nPACz (n = 2,4,6) ...................................................................................................................... 60
nPACz (n = 2,4,6) ............................................................................................................................ 65
Materials and Methods
Materials for perovskite cell preparation
Anhydrous DMSO (dimethyl sulfoxide), anh. DMF (dimethylformamide), anh. Anisole, PTAA (poly
[bis (4-phenyl) (2,5,6-trimentlyphenyl) amine]) and lithium fluoride (purity ≥ 99.99 %) were purchased
from Sigma Aldrich. C60 (sublimed) was bought from CreaPhys GmbH. FAI (formamidinium iodide)
and MABr (methylammonium bromide) were purchased from Dyenamo. PbI2 and PbBr2 were bought
from TCI. CsI was purchased from abcr GmbH. The ceramic 2-inch IZO target was purchased from
FHR Anlagenbau GmbH. The SAMs MeO-2PACz and 2PACz were synthesized by TCI. The synthesis
of Me-4PACz and the (Me-)nPACz series by us is described in the synthesis section at the end of this
document. Ethanol (anh.) for the SAMs was bought from VWR (no difference was observed when using
Ethanol from other suppliers, independent of the water content).
Perovskite single-junction preparation
The perovskite solar cell has an inverted (p-i-n) planar structure and is deposited on ITO-covered glass
(Automated Research GmbH, both 7 Ohm/sq and 15 Ohm/sq sheet conductivities were used in this
study), which was cleaned with Mucasol (2% in DI-water, substrates were brushed), DI-water, acetone
and isopropanol, each for 15 minutes in an ultrasonic bath. Afterwards the surface was “activated” for
10-15 minutes in an UV-O3 cleaner (FHR UVOH 150 Lab), which is a crucial step before SAM
functionalization (for the tandem cells as well). The single-junction cell configuration is
ITO/HTL/Perovskite/(LiF)/C60/SnO2/Ag, where the HTL is PTAA, MeO-2PACz, 2PACz or Me-
4PACz. All the spin-coating layer deposition steps were conducted in a nitrogen atmosphere. The hole
transport material PTAA (2 mg ml-1 in toluene) was deposited using spin-coating (5000 rpm for 30 s,
5 s acceleration), followed by heating for 10 min at 100 °C. The rotation was reduced for the SAM-
solutions to 3000 rpm (used concentration of the SAM solutions = 1 mmol/l, or ~0.3 mg/ml). The
perovskite was prepared following the typical triple cation process. In short, 1.5 M nominal PbI2 and
PbBr2 in DMF:DMSO = 4:1 volume were first prepared as stock solutions (shaken overnight at 60 °C)
and then added to FAI and MABr with 9 % PbX2 excess, respectively (X = I or Br) (typical amounts
were 0.3 g FAI and 0.06 g of MABr). The so obtained FAPbI3 and MAPbBr3 were then mixed in 77:23
25
volume ratio to obtain the “double cation” perovskite. Finally, 5 vol-% of 1.5 M nominal CsI in DMSO
was added to the perovskite precursor (stock solution prepared one day before, typically ~50 mg
powder). 100 µl of perovskite solution was then spread on the substrate and spun using one step spin-
coating process (3500 for 35 s, 5 s acceleration). 10-13 s before the end of the program, 300 µl of Anisole
as the anti-solvent was dripped on the film. The films were then annealed at 100 °C for 15-30 min.
Afterwards, 20 nm of C60 was thermally evaporated at a rate of 0.15 Å s-1 onto the perovskite film.
Optionally, as indicated, a 1 nm-thick LiF interlayer was deposited between C60 and perovskite,
evaporated at a rate of 0.05 Å s-1, within the same vacuum run as the C60 layer. 20 nm of SnO2 were then
deposited by thermal ALD in an Arradiance GEMStar reactor. Tetrakis(dimethylamino)tin(IV)
(TDMASn) was used as the Sn precursor and was held at 60 °C in a stainless-steel container. Water was
used as oxidant, and was delivered from a stainless-steel container without active heating, whereas the
precursor delivery manifold was heated to 115 °C. For the deposition at 80 °C, the
TDMASn/purge1/H2O/purge2 times were 1s/10s/0.2s/15s with corresponding nitrogen flows of
30sccm/90sccm/90sccm/90sccm. With this, 140 cycles lead to 20 nm tin oxide. More details can be
found in a previous publication (26). We noticed a beneficial effect when letting the TDMASn bottle
cool down to room temperature when not in use. Finally, 100 nm Ag were deposited by thermal
evaporation at a rate of 1 Å s-1.
Silicon solar cell preparation
The silicon heterojunction (SHJ)-bottom cell was fabricated from a 260 µm thick, ~3 Ω cm-1 polished
FZ <100> n-type crystalline silicon (c-Si) wafer in a rear junction configuration. The front surface of
the wafer was left polished by capping with a PECVD deposited SiO2 prior to wet texturing to obtain
random pyramids with <111> facets. After removal of the capping in HF another final RCA clean and
HF dip (1 % dilution in water) were done and an approx. 5 nm thick, intrinsic (i) amorphous silicon
(a-Si:H) layer stack was grown on both sides of the c-Si wafer in order to passivate the c-Si surface. On
the textured rear-side, an approx. -5-nm thick, p-doped a-Si:H layer stack was deposited to form the hole
contact (junction). On the polished front-side, a 95-nm thick (20-nm thick for single-junction reference
cells), n-doped nanocrystalline silicon oxide layer (nc-SiOx:H) with a refractive index, n, of 2.7 at
633 nm was used as the electron contact of the SHJ bottom cell and the optical intermediate layer
between the top and the bottom cells (70). The a- and nc-Si layers were deposited with an Applied
Materials (AKT1600) plasma enhanced chemical vapor deposition (PECVD) cluster tool. In order to
contact the bottom cell a ZnO:Al/Ag layer stack was deposited on the textured rear-side and a 20 nm
(70-nm thick for single-junction references) thick ITO layer was deposited on the polished front-side on
top of the nc-SiOx:H interlayer. Both depositions were DC-sputtered in an in-line sputter tool from
Leybold Optics using Ar/O2 gas mixtures. For the ITO a tube target with 95/5 doping ratio and for the
AZO a tube target with 1% Al2O3 in ZnO was used. Both contact-layer stack of the silicon were
deposited using aligned shadow masks with an opening of 1.13 x 1.13 cm2 (2 x 2 cm2 for single-junction
reference). For single-junction reference cells with an aperture area of 2 x 2 cm2, an Ag grid was screen-
printed on top of the front ITO.
Preparation of tandem solar cells
The bottom cells were blown clean with N2 and UV-O3-treated for 15 minutes. The same HTL,
perovskite, (LiF), C60 and SnO2 deposition as described above was conducted on the silicon bottom
cells. Subsequently, 100 nm IZO (Roth&Rau MicroSys 200 PVD, ceramic target purchased from FHR
Anlagenbau GmbH) are deposited by sputtering. The 2-inch ceramic target consisted of 90 %wt. In2O3
and 10 %wt. ZnO. At a RF-power of 70 W the cells oscillated under the target to have a uniform
deposition. 0.2%vol O2 was added to the chamber. The previously optimized layer (26) has a mobility,
carrier density and resistivity of 43.5 cm2 V-1 s-1, 3.4∙1020 cm-3 and 4.2∙10-4 Ω cm, respectively. A
100 nm silver frame was thermally evaporated through a shadow mask to collect the charge carriers
without a need of grid fingers. Lastly, 100 nm LiF is evaporated as an antireflective coating by thermal

26
evaporation. The active area is defined by the metal frame and is slightly larger than 1 cm2. A photo and
schematic of a monolithic tandem solar cell is shown in Figure S25.
Luminescence spectroscopy techniques
Time-dependent steady-state photoluminescence
Time-dependent steady state absolute photoluminescence measurements were performed on a home-
built setup using an integrating sphere, where the samples were placed at the edge of the sphere. The PL
was collected with a fiber connected to a CCD-array spectrometer (Ocean Optics). The samples were
excited with a continuous-wave laser at 532 nm emission wavelength, a photon flux of ~1.2E16
photons/s and a spot size on the sample of 0.12 cm² (around 1-sun-equivalent excitation fluence,
calibrated with a certified silicon reference cell). The 30-suns case was realized by a focusing lens to
reduce the spot size to 0.4 mm². The spot size was measured by fitting a Gaussian curve to the beam
profile extracted from CCD imaging the laser spot. The 1-sun 0.4 mm² case was realized by a focusing
lens and appropriate ND filters. Non-absorbed laser light and emitted photoluminescence fluxes were
simultaneously detected by the spectrometer, of which the spectral sensitivity was calibrated using a
NIST-traceable halogen lamp. The spectral time evolutions of the perovskite films were recorded with
an integration time of 300 ms and delay of 2-3 s between each recording. Measurements were carried
out in air; the samples were measured promptly after they were taken out from the N2-filled glovebox.
Absolute PL and pseudo-J-Vs
Excitation for the PL imaging measurements was performed with a 520 nm CW laser (Insaneware)
through an optical fibre into an integrating sphere. The intensity of the laser was adjusted to a 1 sun
equivalent intensity by illuminating a 1 cm²-sized perovskite solar cell under short-circuit and matching
the current density to the JSC under the sun simulator (e.g. ~22.0 mA cm-2 at 100 mW cm-2, or 1.375x10²¹
photons m-2 s-1). A second optical fiber was used from the output of the integrating sphere to an Andor
SR393i-B spectrometer equipped with a silicon CCD camera (DU420A-BR-DD, iDus). The system was
calibrated by using a halogen lamp with known spectral irradiance, which was shone into to integrating
sphere. A spectral correction factor was established to match the spectral output of the detector to the
calibrated spectral irradiance of the lamp. The spectral photon density was obtained from the corrected
detector signal (spectral irradiance) by division through the photon energy (hf), and the photon numbers
of the excitation and emission were obtained from numerical integration using Matlab. In a last step,
three fluorescent test samples with high specified PLQY supplied from Hamamatsu Photonics where
measured where the specified value could be accurately reproduced within a small relative error of less
than 5%.
The samples were illuminated in the integrating sphere using the same 520 nm CW laser (Insaneware)
as described above. A continuously variable neutral density filter wheel (ThorLabs) was used to
attenuate the laser power to measure at different intensities which was monitored using an additional Si
photodetector. The samples were illuminated at a given intensity for a variable illumination time using
an electrical shutter. After an illumination time of 1 second, the PL spectra were recorded by averaging
30 spectra taken using a detector exposure time of 30 µs. The electrical shutter was then closed and the
filter wheel was moved to the next position and the steps were repeated. A custom-built Labview code
was written to automate the measurement, and a Matlab code to automate the data evaluation.
Pseudo-J-Vs
The pseudo-J-Vs were deduced from the intensity-dependent QFLS or VOC measurements as recently
demonstrated in ref. (54). This was done by calculating the dark-current density from the generated
current density at a given light intensity in equivalent suns. E.g. 1 sun corresponds to 22.0 mA cm-2, 1%
of a sun to 0.220 mA cm-2. The obtained dark current was then plotted against the measured QFLS or
27
VOC at the given light intensity to create a transport/series resistance-free dark J-V-curve. This curve was
then shifted to the JSC in the J-V-measurement to create the pseudo-J-V curve allowing to read of the
pseudo- (or implied) FF and VOC of the measured partial cell stack (e.g. the neat film, or
perovskite/transport layer junction) or the complete cell. We note, that the implied FF is only impacted
by the non-radiative (and radiative) recombination processes in the studied sample but not by charge
transport or resistive losses that are induced by the active layer or the transport layers, and resistances
(e.g. the ITO sheet resistance).
Intensity-dependent 𝑽𝐎𝐂 measurements
Steady-state intensity dependent 𝑉OC measurements were obtained with a 520 nm continuous wave laser
(Insaneware) providing a power of 1 W. A continuously variable neutral density filterwheel (ThorLabs)
was used to attenuate the laser power (up to OD 6). The light intensity was thereby simultaneously
measured with a silicon photodetector and a Keithley 485 to improve the accuracy of the measurement.
The measurement was performed by measuring the 𝑉OC after a 1 second illumination at a given light
intensity and then the 𝐽SC after 1 second illumination before the filterwheel rotated to the next position.
A custom-built LabView code was written to automate the measurement.
Transient photoluminescence
TrPL measurements were carried out in a home-built setup using 660 nm excitation laser light from a
supercontinuum light source (SuperK) with a 25-35 µm spot size. The samples were excited from the
glass side to avoid increased reflection stray light, however, no significant difference in decay times was
observed between excitation from both sides. We chose the longer wavelength excitation to avoid effects
of charge diffusion from a high to low carrier density region. The excitation pulse had a repetition rate
of 150 kHz and the PL emission was collected panchromatically through a photomultiplier and time-
correlated single photon counting technique. The fluence was controlled with a tuneable neutral density
filter and monitored with a power meter.
Absolute photo and electroluminescence imaging of tandems
Absolute PL imaging measurements were performed with two 450 nm LEDs for the perovskite subcell
and with an 850 nm LED for the excitation of the silicon subcell. The excitation intensities for both
measurements was set to 1.4 × 10²¹ photons m-2 s-1. The photoluminescence image detection was
performed with a charge-coupled device (CCD) camera (Allied Vision) for the perovskite subcell and
with an InGaAs based camera for the Si subcell. Both cameras were coupled with a liquid crystal tunable
filter unit. The systems were calibrated to absolute photon numbers.
Quantitative electroluminescence imaging was performed by sweeping a voltage between 1.4 and 2.0 V
with a 2 mV voltage step and 0.5 s dwell time. The dark current Jdark was recorded for the sweeps. To
avoid large data collection a luminescence image at every step for every subcell was recorded at the
maximum energy of the luminescence. The intensity of the images was scaled to absolute photon
numbers with a full hyperspectral image collected at a given injection. This results in a data set
containing the electroluminescence yield of each subcell (j) 𝑌𝐸𝐿𝑗
(𝐽𝑑𝑎𝑟𝑘) as a function of the injected
current 𝐽𝑑𝑎𝑟𝑘. The radiative current of every subcell 𝐽𝑟𝑎𝑑𝑗
is calculated by multiplying the 𝑌𝐸𝐿𝑗 (𝐽𝑑𝑎𝑟𝑘) by
the elementary charge. Finally, the voltage of the subcells 𝑉𝑗 is calculated with:
𝑉𝑗 = 𝑘𝑇 ln (𝐽𝑟𝑎𝑑
𝑗+𝐽0,𝑟𝑎𝑑
𝑗
𝐽0,𝑟𝑎𝑑𝑗 ).
Here, 𝐽0,𝑟𝑎𝑑𝑗
is calculated from the EQE of the individual subcells following the reciprocity theorem
(71):
𝐽0,𝑟𝑎𝑑𝑗
= 𝑞 ∫ 𝐸𝑄𝐸
𝑗
(𝐸)𝜙𝑏𝑏(𝐸)𝑑𝐸.

28
Terahertz-Probe (OPTP) spectroscopy
Optical-Pump Terahertz-Probe (OPTP) spectroscopy can measure the transient photo-excited sheet
conductivity ΔσS and sum mobility µ∑ = µe +µh of the electron mobility µe and the hole mobility µh. The
terahertz pulses are generated by optical rectification of 800 nm pulses in a ZnTe crystal. These terahertz
pulses are guided through the perovskite sample and the transmitted terahertz field T is measured by
electro-optical sampling in a second ZnTe crystal. Additionally, the perovskite samples can be photo-
excited by pump pulses with a wavelength of 400 nm and a pulse length of ≈150 fs. These charge carriers
alter the transmission of the terahertz probe pulse by ΔT, which is also detected. The derived pump-
induced change in THz transmission ΔT/T is analyzed by the thin-film approximation in equation (S5)
for the photo-excited sheet conductivity ΔσS, which is the integral of the induced photoconductivity Δσ
over the sample thickness d. The parameters are the speed of light c, the permittivity of the vacuum ε0,
and the terahertz refractive index of the substrates nsub, which is 1.95 for the used quartz glass substrate.
∆𝜎𝑠 = ∫ ∆𝜎𝑑𝑥𝑑
𝑥=0
= −𝜀0𝑐(1 + 𝑛𝑠𝑢𝑏)
∆𝑇𝑇
1 +∆𝑇𝑇
(1)
The transient of the photo-excited sheet conductivity is measured by scanning the delay of the pump
pulse by an optical delay line. In this case, the terahertz pulse is sampled at its maximum. Additionally,
the full terahertz pulse was scanned by a second delay line at a pump delay time of 10 ps. After both ΔT
and T are Fourier-transformed, the photo-excited sheet conductivity spectrum is derived by
Equation (1). The sum mobility spectrum is obtained by Equation (2) from the photo-excited sheet
conductivity, the flux of the pump beam of 7 x 10¹¹ photons/pulse/cm2, and the reflectance of the pump
beam at 400 nm of 25%. The quantum yield of exciton dissociation in such mixed halide perovskites is
approximately 1 at room temperature.
Σ𝜇 = 𝜇𝑒(𝑓, 𝑡) + 𝜇ℎ(𝑓, 𝑡) =∆𝜎𝑠
𝑞𝜑𝑝𝑢𝑚𝑝(1 − 𝑅) (2)
The gained sum mobility is a spectrum at the frequencies from 0.5 to 3 THz, which constitute the
terahertz probe pulse. The observed flat frequency-dependence in fig. 1 indicates no significant
difference between the measured terahertz mobilities and the DC-value, which is relevant for the device
operation or carrier diffusion.
Further details on the OPTP measurement can be found in (72).
Single junction solar cell characterization (Current-Voltage curves, EQE)
The J-V curves of single-junction cells were recorded in nitrogen atmosphere with a solar simulator
(Oriel LCS-100) and Keithley 2400 source-measure unit, controlled by a custom LabView program.
The intensity was calibrated to AM1.5G 1-sun-equivalent with a filtered KG3 Silicon reference solar
cell, calibrated by Fraunhofer ISE (spectral mismatch is around 0.997, within the measurement error,
thus no correction was applied). J-V scans were as performed in a 2-point-probe configuration. The
typical step size was 20 mV, with an integration time of 20 ms and settling time of 20 ms (250 mV/s).
The cells did not experience any preconditioning. Shunted or partially shunted devices (mostly due to
scratches and not perfectly clean substrates) were not considered in the analysis.
EQE spectra were recorded with an Oriel Instruments QEPVSI-b system with a Newport 300 W xenon
arc lamp, controlled by TracQ-Basic software. The system is calibrated using a Si reference cell with
known spectral response before every measurement. The electrical response of the device under test is
measured with a Stanford Research SR830 Lock-In amplifier (time constant of 0.3 s) and evaluated in
TracQ. The typical short-circuit current mismatch between integrated external quantum efficiency
(EQE) times AM1.5G irradiance and values from J-V scans is around 1% if the area of the cell precisely
known (considering shadowing through the mask during metal evaporation).
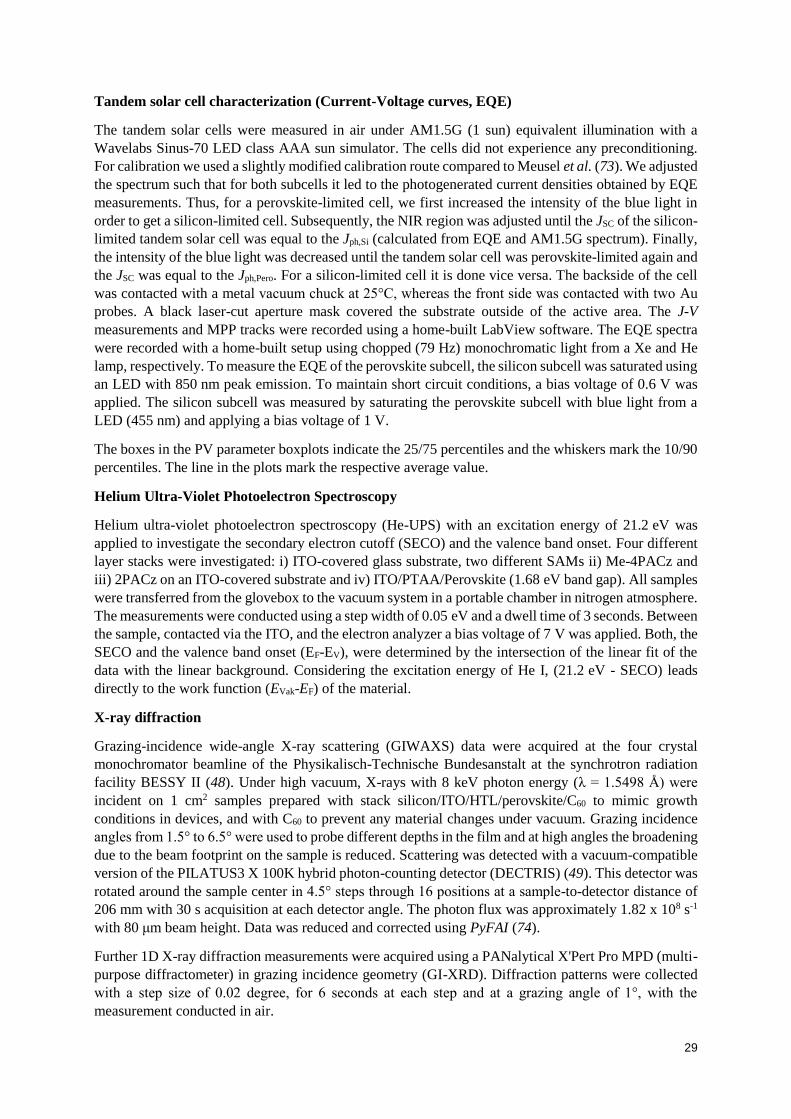
29
Tandem solar cell characterization (Current-Voltage curves, EQE)
The tandem solar cells were measured in air under AM1.5G (1 sun) equivalent illumination with a
Wavelabs Sinus-70 LED class AAA sun simulator. The cells did not experience any preconditioning.
For calibration we used a slightly modified calibration route compared to Meusel et al. (73). We adjusted
the spectrum such that for both subcells it led to the photogenerated current densities obtained by EQE
measurements. Thus, for a perovskite-limited cell, we first increased the intensity of the blue light in
order to get a silicon-limited cell. Subsequently, the NIR region was adjusted until the JSC of the silicon-
limited tandem solar cell was equal to the Jph,Si (calculated from EQE and AM1.5G spectrum). Finally,
the intensity of the blue light was decreased until the tandem solar cell was perovskite-limited again and
the JSC was equal to the Jph,Pero. For a silicon-limited cell it is done vice versa. The backside of the cell
was contacted with a metal vacuum chuck at 25°C, whereas the front side was contacted with two Au
probes. A black laser-cut aperture mask covered the substrate outside of the active area. The J-V
measurements and MPP tracks were recorded using a home-built LabView software. The EQE spectra
were recorded with a home-built setup using chopped (79 Hz) monochromatic light from a Xe and He
lamp, respectively. To measure the EQE of the perovskite subcell, the silicon subcell was saturated using
an LED with 850 nm peak emission. To maintain short circuit conditions, a bias voltage of 0.6 V was
applied. The silicon subcell was measured by saturating the perovskite subcell with blue light from a
LED (455 nm) and applying a bias voltage of 1 V.
The boxes in the PV parameter boxplots indicate the 25/75 percentiles and the whiskers mark the 10/90
percentiles. The line in the plots mark the respective average value.
Helium Ultra-Violet Photoelectron Spectroscopy
Helium ultra-violet photoelectron spectroscopy (He-UPS) with an excitation energy of 21.2 eV was
applied to investigate the secondary electron cutoff (SECO) and the valence band onset. Four different
layer stacks were investigated: i) ITO-covered glass substrate, two different SAMs ii) Me-4PACz and
iii) 2PACz on an ITO-covered substrate and iv) ITO/PTAA/Perovskite (1.68 eV band gap). All samples
were transferred from the glovebox to the vacuum system in a portable chamber in nitrogen atmosphere.
The measurements were conducted using a step width of 0.05 eV and a dwell time of 3 seconds. Between
the sample, contacted via the ITO, and the electron analyzer a bias voltage of 7 V was applied. Both, the
SECO and the valence band onset (EF-EV), were determined by the intersection of the linear fit of the
data with the linear background. Considering the excitation energy of He I, (21.2 eV - SECO) leads
directly to the work function (EVak-EF) of the material.
X-ray diffraction
Grazing-incidence wide-angle X-ray scattering (GIWAXS) data were acquired at the four crystal
monochromator beamline of the Physikalisch-Technische Bundesanstalt at the synchrotron radiation
facility BESSY II (48). Under high vacuum, X-rays with 8 keV photon energy (λ = 1.5498 Å) were
incident on 1 cm2 samples prepared with stack silicon/ITO/HTL/perovskite/C60 to mimic growth
conditions in devices, and with C60 to prevent any material changes under vacuum. Grazing incidence
angles from 1.5° to 6.5° were used to probe different depths in the film and at high angles the broadening
due to the beam footprint on the sample is reduced. Scattering was detected with a vacuum-compatible
version of the PILATUS3 X 100K hybrid photon-counting detector (DECTRIS) (49). This detector was
rotated around the sample center in 4.5° steps through 16 positions at a sample-to-detector distance of
206 mm with 30 s acquisition at each detector angle. The photon flux was approximately 1.82 x 10⁸ s-1
with 80 μm beam height. Data was reduced and corrected using PyFAI (74).
Further 1D X-ray diffraction measurements were acquired using a PANalytical X'Pert Pro MPD (multi-
purpose diffractometer) in grazing incidence geometry (GI-XRD). Diffraction patterns were collected
with a step size of 0.02 degree, for 6 seconds at each step and at a grazing angle of 1°, with the
measurement conducted in air.

30
Long term stability measurement
Monolithic tandem solar cells were tracked over 300 h at the maximum power point (MPP) with a self-
constructed ageing setup in collaboration with the University of Ljubljana (with them providing the
LED-array and measurement components). To guarantee homogenous illumination the LED-array
consists of 193 LEDs, 144 of which are blue LEDs and 49 are near-infrared LEDs with a wavelength of
470 nm and 940 nm, respectively. The normalized spectra are given in Figure S34. With an independent
tunability of both intensities via two potentiometers, the photocurrent of the top and bottom cell can be
adjusted to increase or decrease the current mismatch as intended. The bottom cell is electrically
connected to a copper block on the backside, whereas the top cell is connected with 2 pogo-pins. Under
ambient conditions (relative humidity of 30-40%, measured with a calibrated humidity tracker) the
measurement took place in a closed housing at a stable 25°C, while the cells were kept in place with a
diaphragm pump. While monitoring the current and voltage of each cell at MPP (using voltage
perturbation) the intensity of a blue and infrared reference diode was logged to account for any
drops/fluctuation of illumination.

31
Ultraviolet photoelectron spectroscopy
Figure S1 Energetic diagram comparing the alignment between perovskite valence band edge and the HOMO
levels of the studied hole-selective layers. A correlation is apparent between fill factor and how close the alignment between perovskite valence band edge and HOMO level of the hole-selective layers is; considering that PTAA has a low conductivity but significant thickness (~10 nm), which adds series resistance that influences the FF as well. The absorption onset in Figure S38 was used to estimate the “bandgap” of the SAMs. The data for PTAA is from ref. (7) (this and the following citations refer to the numbers of the main paper), measured at another UPS setup.
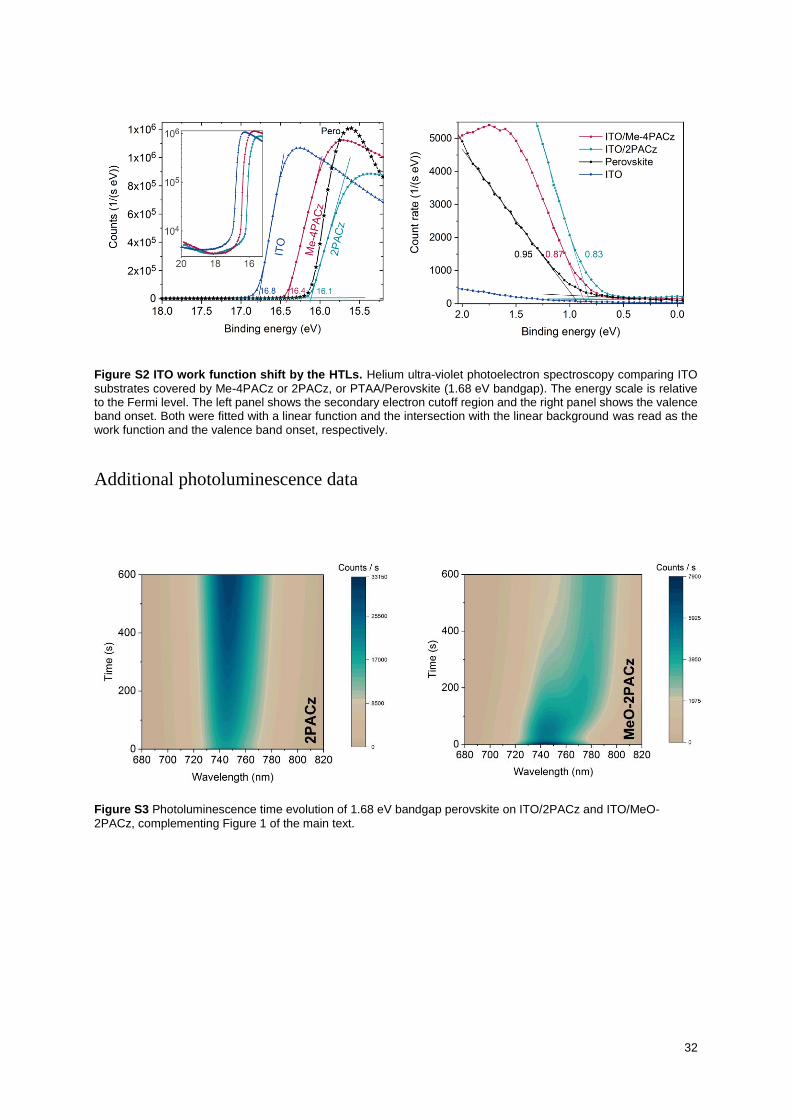
32
Figure S2 ITO work function shift by the HTLs. Helium ultra-violet photoelectron spectroscopy comparing ITO
substrates covered by Me-4PACz or 2PACz, or PTAA/Perovskite (1.68 eV bandgap). The energy scale is relative to the Fermi level. The left panel shows the secondary electron cutoff region and the right panel shows the valence band onset. Both were fitted with a linear function and the intersection with the linear background was read as the work function and the valence band onset, respectively.
Additional photoluminescence data
Figure S3 Photoluminescence time evolution of 1.68 eV bandgap perovskite on ITO/2PACz and ITO/MeO-
2PACz, complementing Figure 1 of the main text.
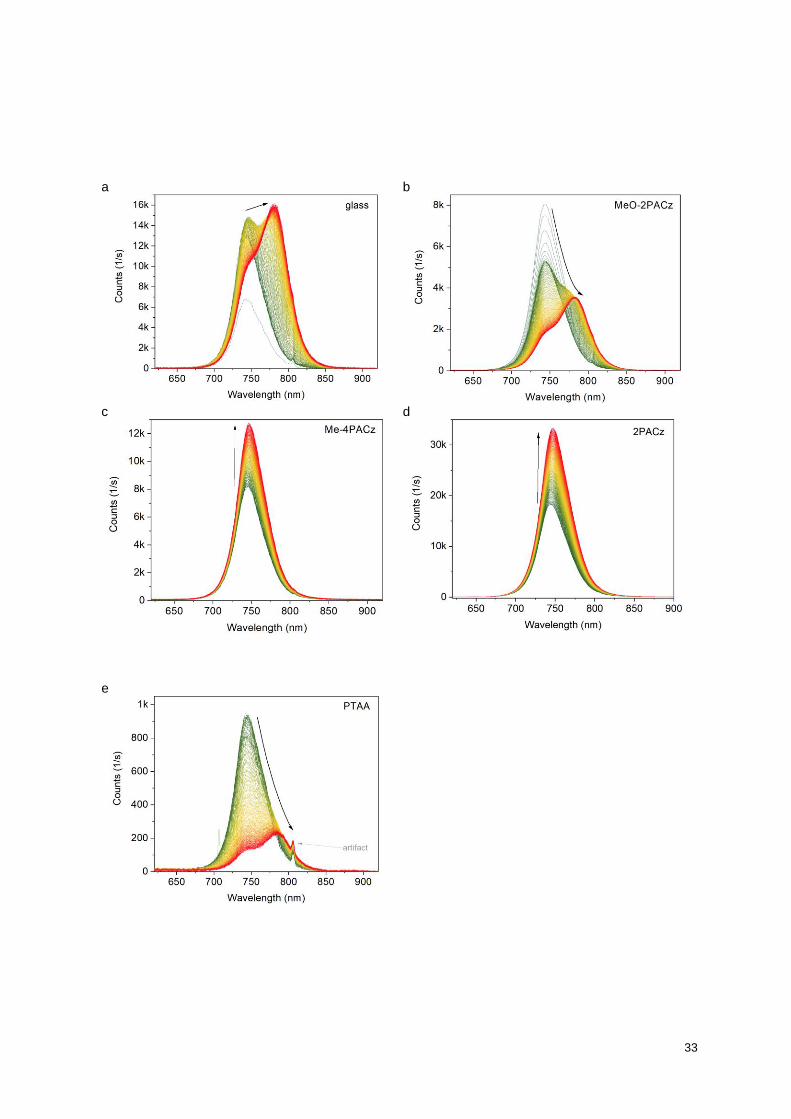
33
a
b
c
d
e

34
f
g
Figure S4 Photoluminescence spectra over time (10 min) under spot-illumination at 1-sun-equivalent excitation fluence. a-e show the spectra used for the plots Fig. 1 and Fig. S3. f-g show the spectra upon 30-suns fluence and
smaller spot illumination.
a
b
Figure S5 Photoluminescence spectra over time (10 min) of a perovskite film on ITO/MeO-2PACz. The same
sample was measured with two different spot sizes: 0.12 cm² (a) and 0.4 mm² (b), each at different positions on the sample – but the excitation fluence was kept the same by placing additional ND1+ND0.4 filters into the beam for the 0.4 mm² case. This demonstrates that a smaller spot, i.e. steeper charge carrier gradient and larger spot edge-to-area ratio, causes a quicker rise of PL of segregated low-bandgap regions (45) (which are more emissive than Br-rich phases). The same behavior was observed for all studied substrate/HTL configurations.

35
a
b
c
d
Figure S6 PL on a bare glass/ITO substrate (cleaned and O3-treated like the HTL-covered substrates). a, PL
evolution in the same experiment as for Figure S4, showing that the conductive substrate could mitigate charge accumulation and thus suppress a double-peak formation. However, due to the ITO being not hole-selective enough, it is not suitable for efficient device operation with the herein used perovskite (inset). b, TrPL transients on
a bare ITO/perovskite sample for three different excitation fluences. A mono-exponential fit to the 1-sun transient between 50 and 150 ns yielded a decay time of 70 ns. For comparison, the Me-4PACz transient as shown in the main text is included. c, Same experiment as in a, but with a smaller illumination spot size. d, same spot size as in
c, but with 10-times higher intensity.
Figure S7 Photoluminescence quantum yield under 85°C in air of perovskite films on Si substrates covered with
PTAA and Me-4PACz. The inset shows the non-normalized values. The samples were left on a hotplate in air (relative humidity 40-60 %) and cooled to room temperature before every PL measurement. The PLQY of the PTAA sample fell to almost background-noise level after 90 min. The PL was measured in air under 1-sun equivalent generation with spot illumination (532 nm excitation, 0.12 cm² spot size).

36
a
b
Figure S8 a, Fits to the TrPL transients shown in Figure 2 of the main text. The fits are triple-exponential functions
(no physical model, arbitrary choice to fit the data to help with the differential lifetime evaluation) with offsets and are used to compute the derivative of the transients (or differential lifetimes) to avoid high noise levels arising from differentiating the raw experimental data. b, Zoom-in to Fig. 2A of the main text.
Supplementary text: Amount of higher order recombination estimated from the TrPL transient
The ratio of higher-order to first-order recombination from the TrPL transients was extracted by first
fitting a mono-exponential function to the linear part in logarithmic scale and extrapolating it until t=0.
Thus, we could identify the part of the transient corresponding to higher order processes, including
radiative recombination (see Figure S10). Integrating the higher-order part of the transient and dividing
it by the total area under the transient gives the ratio. Doing this for all investigated generation conditions
yielded Figure 2C of the main text.
Figure S9 Charge generation regimes in TrPL. Maximum PL intensity for a series of excitation conditions. The
transition from linear to quadratic dependence marks the carrier concentration above the background concentration or at which radiative recombination dominates. Although above 1-sun-equivalent carrier generation, Me-4PACz and 2PACz are in this regime, the Me-4PACz transients still showed mostly mono-exponential decay (Figure S10).

37
Figure S10 TrPL transients at different excitation fluences of perovskite absorbers on quartz, 2PACz and Me-
4PACz. The red lines are linear fits to the mono-exponential tails of the transients. The area under the transients, the area under the linear fit and between linear fit and transient were used for the calculation of Figure 2C of the main text. Only the Me-4PACz transient shows little to no deviation from mono-exponential decay after the charge transfer process.
a
b
Figure S11 Speed of electron extraction into the C60 layer. a, Terahertz conductivity transients of perovskite
films on quartz glass covered by the electron-selective C60 layer. Notably, the decay is considerably slower when
the pump pulse hits the quartz side first. A fast decay is visible when the blue pump pulse hits the C60 side first
since the majority of charge carriers are excited at the C60-near perovskite surface and fast extraction to the C60
layer or non-radiative recombination occurs at/in the C60 layer (53, 75, 76). Assuming negligible non-radiative
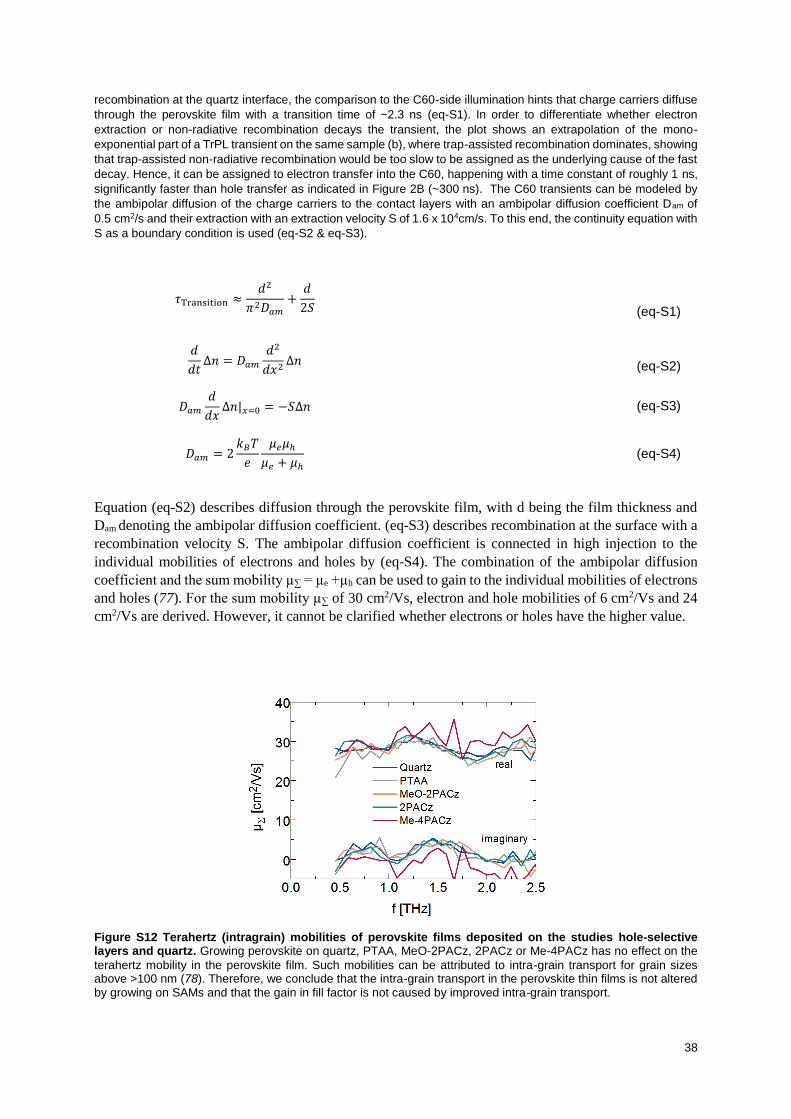
38
recombination at the quartz interface, the comparison to the C60-side illumination hints that charge carriers diffuse
through the perovskite film with a transition time of ~2.3 ns (eq-S1). In order to differentiate whether electron
extraction or non-radiative recombination decays the transient, the plot shows an extrapolation of the mono-
exponential part of a TrPL transient on the same sample (b), where trap-assisted recombination dominates, showing
that trap-assisted non-radiative recombination would be too slow to be assigned as the underlying cause of the fast
decay. Hence, it can be assigned to electron transfer into the C60, happening with a time constant of roughly 1 ns,
significantly faster than hole transfer as indicated in Figure 2B (~300 ns). The C60 transients can be modeled by
the ambipolar diffusion of the charge carriers to the contact layers with an ambipolar diffusion coefficient Dam of
0.5 cm2/s and their extraction with an extraction velocity S of 1.6 x 104cm/s. To this end, the continuity equation with
S as a boundary condition is used (eq-S2 & eq-S3).
𝜏Transition ≈𝑑2
𝜋2𝐷𝑎𝑚
+𝑑
2𝑆
(eq-S1)
𝑑
𝑑𝑡∆𝑛 = 𝐷𝑎𝑚
𝑑2
𝑑𝑥2∆𝑛 (eq-S2)
𝐷𝑎𝑚
𝑑
𝑑𝑥∆𝑛|𝑥=0 = −𝑆∆𝑛 (eq-S3)
𝐷𝑎𝑚 = 2𝑘𝐵𝑇
𝑒
𝜇𝑒𝜇ℎ
𝜇𝑒 + 𝜇ℎ
(eq-S4)
Equation (eq-S2) describes diffusion through the perovskite film, with d being the film thickness and
Dam denoting the ambipolar diffusion coefficient. (eq-S3) describes recombination at the surface with a
recombination velocity S. The ambipolar diffusion coefficient is connected in high injection to the
individual mobilities of electrons and holes by (eq-S4). The combination of the ambipolar diffusion
coefficient and the sum mobility µ∑ = µe +µh can be used to gain to the individual mobilities of electrons
and holes (77). For the sum mobility µ∑ of 30 cm2/Vs, electron and hole mobilities of 6 cm2/Vs and 24
cm2/Vs are derived. However, it cannot be clarified whether electrons or holes have the higher value.
Figure S12 Terahertz (intragrain) mobilities of perovskite films deposited on the studies hole-selective layers and quartz. Growing perovskite on quartz, PTAA, MeO-2PACz, 2PACz or Me-4PACz has no effect on the
terahertz mobility in the perovskite film. Such mobilities can be attributed to intra-grain transport for grain sizes above >100 nm (78). Therefore, we conclude that the intra-grain transport in the perovskite thin films is not altered by growing on SAMs and that the gain in fill factor is not caused by improved intra-grain transport.

39
X-ray diffraction study
Figure S13 Absence of an effect of HTL on perovskite crystal orientation. a, Combined GIWAXS detector images at a grazing incidence angle of 0.5° and b, X-ray diffraction patterns generated by azimuthal integration of
GIWAXS images acquired at 6.5° for perovskite grown on the four HTLs (with stack glass/ITO/HTL/Perovskite). Reflections from the pseudo-cubic perovskite are denoted by their Miller index and additional marked scattering features are reflections from ITO (#) and PbI₂ (*). Scattering data shown in part a) are uncorrected images with the
scale indicating the detector rotation about the sample.

40
Figure S14 a) Typical remapped 2D scattering intensity data (Me-4PACz shown), plotted as χ (azimuthal scattering
angle) vs. 2θ, with (100) and (110) perovskite reflections and PbI2 marked. b) Azimuthal intensity profiles showing orientation distribution for the radially integrated (100) and (110) scattering features and PbI2 for all samples. All data was acquired at a grazing incidence angle of 0.5°.

41
Figure S15 Grazing-incidence X-ray diffraction acquired with a rotating 1D detector (GI-XRD) at an incidence angle of 1°. Prior to measurement, samples were stored for ~2 weeks under N2 and measured in air, so may have undergone partial degradation. a, Diffraction patterns from the perovskite thin films with additional marked scattering
features from ITO (#) and PbI₂ (*). Here the PbI2 scattering intensity is exaggerated with respect to the perovskite
by the 1D detector geometry and out-of-plane texture of this phase, as observed in the GIWAXS measurements (Figure S13). b, Highlighted perovskite 200 reflection, showing shift and broadening of the scattering for the PTAA sample. c, Example Le Bail structural refinement of the Me-4PACz pattern with cubic Pm-3m perovskite, PbI2 and ITO phases present. d, Le Bail refined cubic perovskite lattice parameters and Pseudo-Voigt fitted full width at half
maximum (FWHM) of the 200 reflections shown in part b). The differences in peak broadening between SAMs and PTAA might be over-estimated due to possible degradation of the PTAA sample (increased PbI2 peak), which was less pronounced in the 1D scans extracted from the GIWAXS data.
28 28.5 29
No
rm.
inte
nsity
2θ (°)
200
10 20 30 40 50 60 70
Inte
nsity (
a.u
.)
2θ (°)
Data
Fit
Residual
Me-4PACz
6.245
6.25
6.255
6.26Lattic
e p
ara
mete
r (Å
)
PTA
A
2PACz
MeO
-2PACz
Me-
4PACz
0.3
0.32
0.34
0.36
0.38
0.4
0.42
0.44
200 F
WH
M (
°)
10 15 20 25 30 35 40 45 50
Inte
nsity (
a.u
.)
2θ (°)
PTAA
2PACz
MeO-2PACz
Me-4PACz
#
#
*
* *
a b
c d
FWHM

42
Additional single-junction device data
Figure S16 Comparison of experimentally achieved FF values of single-junction cells with different solar materials (27). The numbers inside the bars are the percentages with regard to the respective detailed balance
limit. For Silicon, the large Auger recombination rate reduces the ideality factor to below 1, thus higher FFs than the detailed balance limit are possible (69).
Figure S17 Influence of SAM washing on devices. Performance parameters of single-junction devices (without
LiF interlayer) in which the ITO substrate was washed with EtOH after Me-4PACz spin-coating or not. The absence of a difference is characteristic for SAM-covered ITO substrates and in line with our previous findings demonstrating with 2PACz that spin-coating of a dilute solution (~0.3 mg/ml) already yielded a substrate-covering monolayer (7).

43
Figure S18 Left: J-V curve of the champion single-junction cell based on Me-4PACz as the hole-selective layer and
LiF/C60/SnO2 on the electron-selective side, with the perovskite absorber bandgap being 1.68 eV. The inset shows a MPP track of that cell (spikes are from the unstable halogen lamp). Right: Representative EQE spectra of Me-4PACz and PTAA cells.
Figure S19 Difference in ideality factor from dark-J-V curves. Representative dark-J-V curves (left) of single-
junction cells (no LiF) and ideality factor extracted from a fit on the data, of which the inverse of the derivative of the logarithm, divided by the thermal energy (25.8 meV) is plotted on the right. In line with the previous findings, the lower ideality factor with Me-4PACz is also visible in the dark curve as a steeper slope of the dark current. However, the suns-Voc method as shown in the main text is the more accurate way of determining the value of the ideality factor.

44
Figure S20 Open-circuit voltages of perovskite solar cells (single-junctions) with the studied hole-selective layers, with and without LiF interlayer between the perovskite and C60 layer. The full VOC potential is only visible upon suppression of non-radiative recombination at the C60 interface, which we here demonstrated by an LiF interlayer. PTAA-based devices are limited by the PTAA interface to ~1.18 V (fitting to the QFLS of bare perovskite on PTAA).
Figure S21 Derivative of the external quantum efficiency of single-junction PSCs based on the compared hole-selective layers. The derivative, or inflection point (23), lies at 740 nm, the same wavelength as the PL peaks of
pristine perovskite films.
Figure S22 Addition to Figure 3D of the main text, showing the influence of LiF between perovskite and C60 on the
intensity-dependent PL measurements for determination of the pFF values. The passivation effect of LiF on the perovskite surface is only minor (20 meV gain in QFLS), hinting that the large gain in VOC by introduction of the LiF interlayer (see Figure S20) cannot be explained by surface passivation alone. We speculate that it might again be connected to differences in built-in potential across the full device and a hole-blocking nature of LiF (79).

45
Figure S23 Influence of aliphatic chain length with bare and methyl-substituted carbazole SAMs on perovskite single-junction performance (no LiF). Mainly the FF was affected (JSC values are likely slightly over-estimated, compared to EQE in Figure S18). The bottom panels show normalized J-V curves of the best-FF devices
of each variation. For larger lengths of the isolating, non-conjugated SAM part (aliphatic chains containing 4 and 6 hydrocarbon segments), the fill factor decreases due to higher series resistance and ideality factor. The hampered hole extraction lead to current-voltage hysteresis in n=6 devices. For the methyl-substituted SAM, the optimum FF was reached with a chain length of n=4, while for nPACz, the highest FF was enabled by n=2. Possibly, self-assembly of the bare carbazole SAM nPACz is stabilized by pi-pi interactions of the carbazole fragments, whereas for the Me-substituted SAM an interplay between steric repulsion between the methyl fragments and van der Waals interaction between the hydrocarbon chains controls the SAM ordering and thus interface quality (80–83). This might cause the different optimum aliphatic chain lengths for the two different SAM types. Further investigations are needed to clarify the exact role of molecular orientation and effective dipole moment.
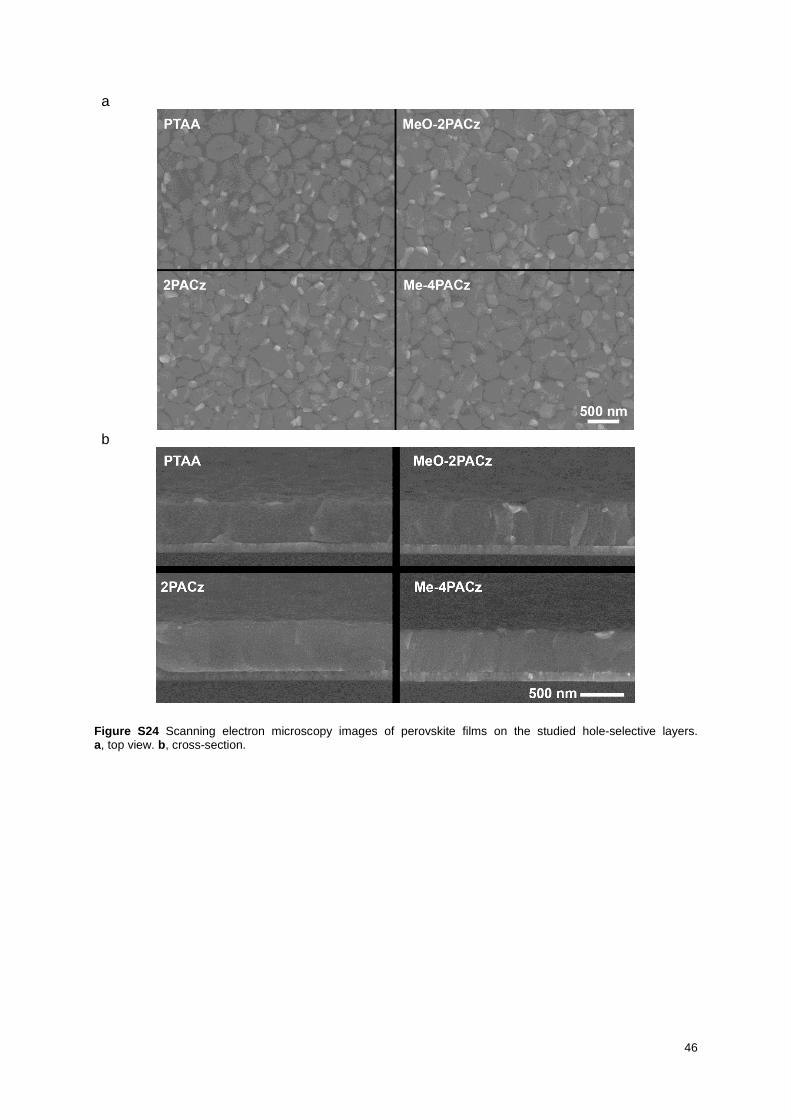
46
a
b
Figure S24 Scanning electron microscopy images of perovskite films on the studied hole-selective layers. a, top view. b, cross-section.
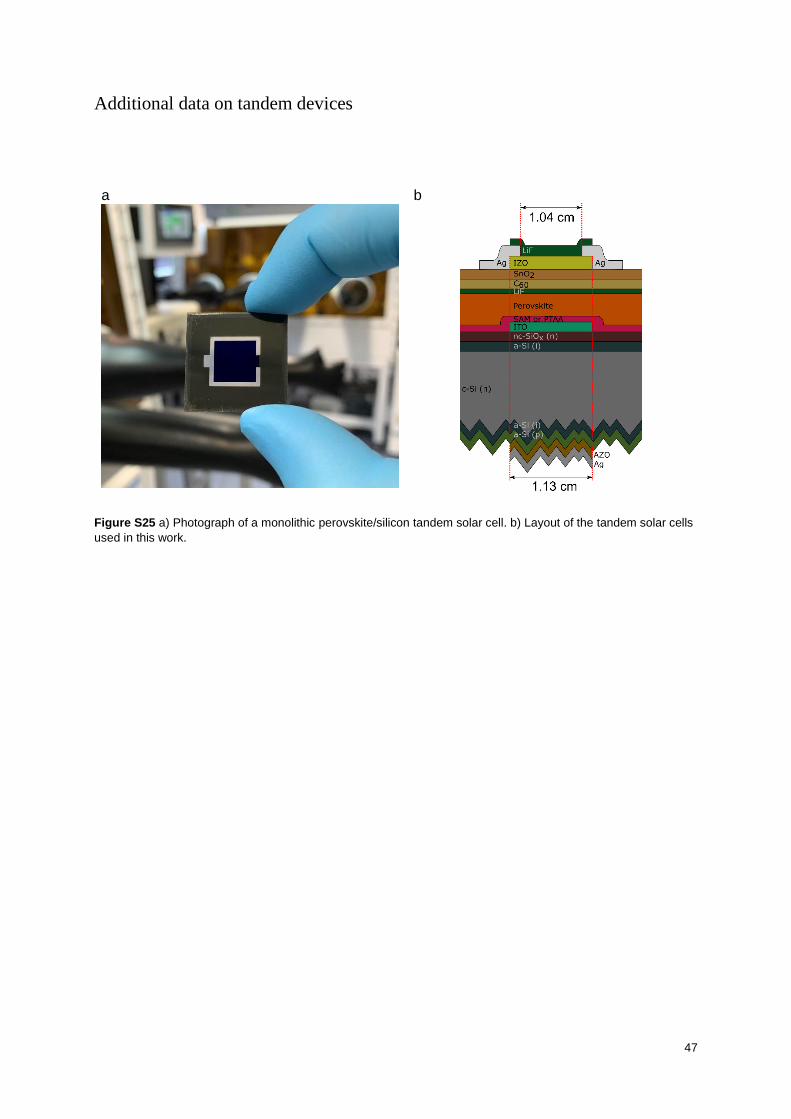
47
Additional data on tandem devices
a
b
Figure S25 a) Photograph of a monolithic perovskite/silicon tandem solar cell. b) Layout of the tandem solar cells
used in this work.

48
Figure S26 Tandem cell performance parameters from J-V curves under 1-sun equivalent illumination, comparing
the different hole-selective layers with and without a 1 nm LiF interlayer between C60 and perovskite. The arithmetic mean is given for each parameter and HTL.

49
Table S1 Subcell photogenerated current densities (Jph) values of the tandem cells with Me-4PACz presented in
Figure S26 showing that for almost all cells, the perovskite top cell was limiting. This table includes cells with and without LiF interlayer where EQE data was available.
Silicon Jph (mA/cm²)
Perovskite Jph (mA/cm²)
Mismatch: Jph,Silicon-Jph,Perovskite (mA/cm²)
19.87 19.42 0.45
19.63 19.39 0.24
20.18 19.58 0.6
19.94 19.51 0.43
20.2 19.51 0.69
20.22 19.52 0.7
19.89 19.05 0.84
20.18 19.41 0.77
20.73 18.76 1.97
20.6 18.7 1.9
20.47 18.98 1.49
19.94 19.24 0.7
19.56 19.31 0.25
19.38 19.41 -0.03
19.6 19.63 -0.03
Figure S27 J-V curves of the champion tandem solar cells with various HTLs. The parameters are given in Table
S2.

50
Table S2 Photovoltaic parameters of the champion cells using PTAA, MeO-2PACz, 2PACz and Me-4PACz as HTL.
Additionally, we distinguished between cells with and without LiF interlayer.
Configuration Direction Jsc in mA cm-2
Voc in V FF in % PCE in %
PTAA Jsc to Voc 19.19 1.85 75.6 26.79 PTAA Voc to Jsc 19.23 1.84 76.3 27.00
PTAA - LiF Jsc to Voc 18.94 1.88 75.10 26.67 PTAA - LiF Voc to Jsc 18.96 1.87 74.04 26.25
MeO-2PACz Jsc to Voc 19.57 1.88 78.07 28.60 MeO-2PACz Voc to Jsc 19.58 1.88 78.66 28.88
2PACz Jsc to Voc 19.55 1.85 75.73 27.36 2PACz Voc to Jsc 19.57 1.85 76.83 27.79
Me-4PACz Jsc to Voc 19.37 1.87 80.89 29.23 Me-4PACz Voc to Jsc 19.37 1.87 81.06 29.29
Me-4PACz – LiF (certified values)
Jsc to Voc 19.23 1.90 79.40 29.00
Me-4PACz – LiF (certified values)
Voc to Jsc 19.24 1.89
78.85
28.75
Figure S28 J-V of the monolithic perovskite silicon tandem solar cell with the new HTL Me-4PACz and LiF interlayer, showing a record VOC of 1.92 eV, featuring a 1.68 eV bandgap perovskite absorber.

51
Figure S29 J-V curves of a representative silicon single-junction reference cell measured under full 1-sun-
equivalent illumination and under filtered light, roughly as transmitted by a perovskite cell. As described in the
methods, instead of 95 nm nc-SiOx:H and 20 nm ITO on the front side (which becomes the recombination layer in
a tandem solar cell), this reference cell comprises 20 nm nc-SiOx:H and 70 nm ITO. To extract the charges from
the 2 x 2 cm2 active area, a screen-printed Ag grid is used.

52
Certification

53

54
Figure S30: Certification report from Fraunhofer ISE for a monolithic perovskite silicon tandem solar cell with Me-
4PACz as HTL and LiF interlayer.

55
Figure S31 J-V curve under 1-sun-equivalent illumination of the certified Me-4PACz+LiF tandem solar cell,
measured in-house, yielding almost the same results as the certified measurement shown in the main text.
Figure S32 External quantum efficiencies of the certified champion device in this publication (measured in-house)
and of the publication from Sahli et al. (62). The latter shows that the textured front side can increase the
photogenerated current density by reduced reflection. This led to a cumulative current density of 40.4 mA cm-2,
whereas the flat front side of this publication led to 39.59 mA cm-2. Additionally, the dashed lines show the reflection
(1-R) of the respective cell.

56
a
b
Figure S33 a) Comparison of champion monolithic perovskite silicon tandem solar cells (Me-4PACz) with and without LiF interlayer. The J-V of the cell with LiF interlayer was certified at Fraunhofer ISE. The higher Voc but lower FF for cells with LiF interlayer is clearly visible. b) 5 minutes MPP-track of the champion cell withouf LiF interlayer with an average value of 29.32%
Figure S34 Normalized spectra of the LEDs used for long term MPP-tracks of tandem solar cells. The spectra are
given by the manufacturer. For the MPP-tracks, the intensities were adjusted such that in the subcells the same charge carrier densities are generated as derived from the respective EQE measurements.
Supplementary text: Light sources for long term stability tests of tandem solar cells
Typically, low-class lamp spectra provide less NIR light and thus the photogenerated current density of
the silicon bottom cell will be reduced, leading potentially to a silicon-limited tandem solar cell. Silicon-
limited tandem solar cells would show higher stability as the degradation of the perovskite subcell barely
affects the performance of the tandem until a certain threshold is reached. Therefore, the subcell
limitation will also affect operational stability, depending on the degree of mismatch and type of
degradation. A detailed analysis of the influence of the subcell properties on the tandem solar cell is
given by Boccard and Ballif (84).

57
Table S3 Photogenerated current of tandem solar cells. The photogenerated current densities were extracted by
measuring the short circuit current under one or the other limitation. We assume that the short circuit current is equal to the photogenerated current of the limiting subcell. The limitation is artificially created by enhancing the sun simulator intensity in the spectral region that only the non-limiting cell absorbs (i.e., increased NIR intensity for perovskite limitation and increased blue intensity for silicon limitation).
Iph,Pero (mA) Iph,Si (mA)
PTAA LiF 18.88 20.05 Me-4PACz LiF 19.57 19.86 2PACz 19.04 19.5 Me-4PACz 20.10 20.06
Figure S35 MPP track of a tandem solar cell with Me-4PACz as HTL (without LiF interlayer). The cell was
illuminated with an AM1.5G spectrum (calibrated with a KG-3 filtered silicon reference cell, certified at Fraunhofer ISE). Following the procedure of Jost et al.(63), the cell was held for 15 minutes at 40 °C, 55 °C and 70 °C and for
20 minutes at 85 °C. Due to a technical issue, the sun simulator needed to be restarted. However, the cell was still exposed to the elevated temperature.

58
Figure S36 Injection dependent EL measurements of a monolithic tandem solar cell using Me-4PACz as HTL and
LiF interlayer. By applying a voltage to the solar cell, we inject a current, which flows through both subcells. From the EL measurement, we extract the QFLS at each injected current and can reconstruct a dark J-V.
Supplementary text: J-V reconstructed from EL measurements
When comparing the reconstructed J-V obtained from EL measurements (JVEL) to the J-V measured
under a solar simulator (JVSunsim), we first notice a slightly higher shunt resistance RSh for the JVEL,Tandem.
We attribute this to pinholes in the perovskite top cell (e.g., direct contact between C60 and ITO), which
are electrically active and lead to leakage currents in the JVSunsim. However, these pinholes are not visible
in the EL images due to limited camera resolution and pixel bleeding of the luminescence intensity.
Thus, the reconstructed perovskite subcell JVEL,Pero is a representation of a top cell processed under
perfect substrate and precursor cleanliness, pinhole-free wetting etc. Secondly, the reconstructed JVEL
curve does not feature any series resistance, because the EL gives access only to the internal voltage,
whereas an electrical J-V curve displays the current density versus external voltage. The external voltage
at a given current is smaller than the internal one for example due to voltage drops at series resistances
(85). Additionally, in the EL reconstruction, a larger current is flowing at the reconstructed VOC as
compared to the reconstructed VMPP, since 1-sun equivalent electrical current injection corresponds to
the reconstructed VOC. In contrast, under electrical J-V-sweeping, a higher net current flows at VMPP
compared to VOC. Since in a solar cell diode equation the series resistance appears in the product Rs × I,
the JVEL thus simulates a J-V curve under small net current flow.

59
a
b
Figure S37 a, Schematic of the SPICE simulation. For the top and bottom cell a single diode model is used consisting of a current source Jph, series resistance Rs, parallel resistance Rshunt and the diode. In this case, the Rs was set to 0. b, result of the simulation using the parameter extracted from the JVEL of the individual subcells. The Jph of the subcells were changed while maintaining a constant cumulative current density of 39.3 mA cm-2 as it is
the case for AM1.5G-equivalent illumination (calculated by EQE). Thus, the individual parameters are a function of the mismatch of the subcells. A FF minimum occurs at a mismatch of -0.7 mA cm-2, whereas it is simultaneously the point of maximum Jsc. Thus, a tradeoff needs to be done. Here, the maximum PCE of 32.43% is reached when both subcells have the same Jph (i.e. mismatch=0).
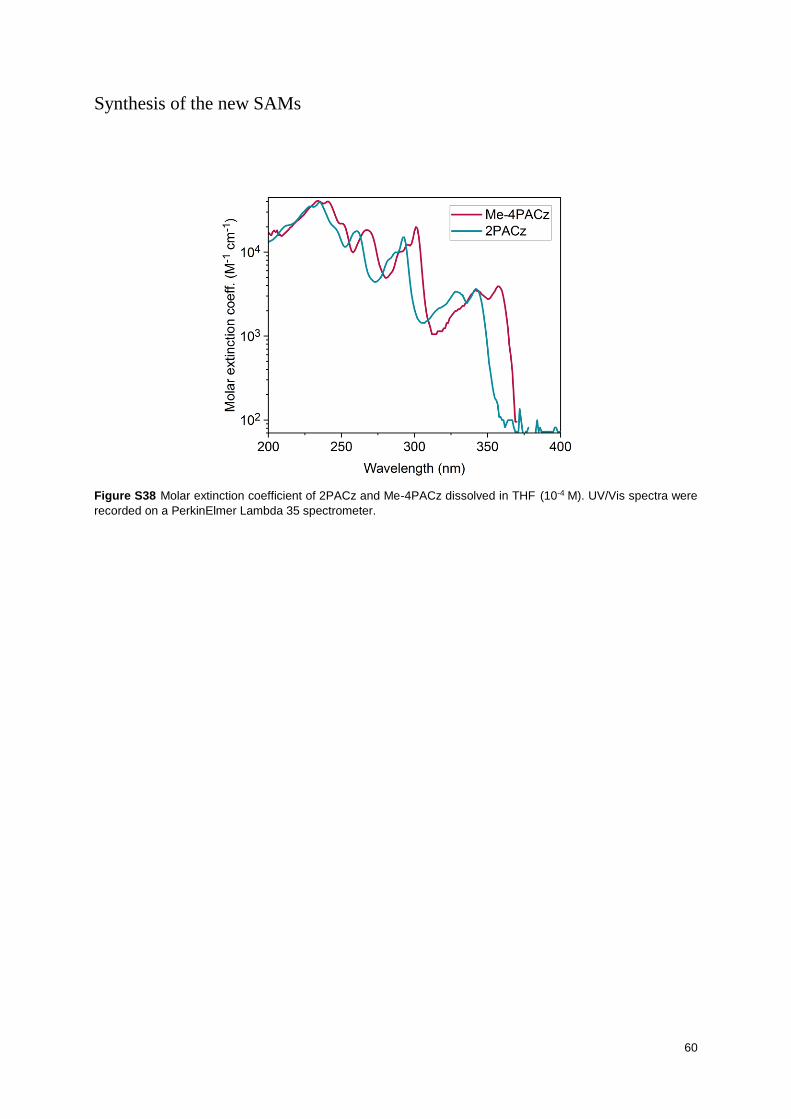
60
Synthesis of the new SAMs
Figure S38 Molar extinction coefficient of 2PACz and Me-4PACz dissolved in THF (10-4 M). UV/Vis spectra were
recorded on a PerkinElmer Lambda 35 spectrometer.
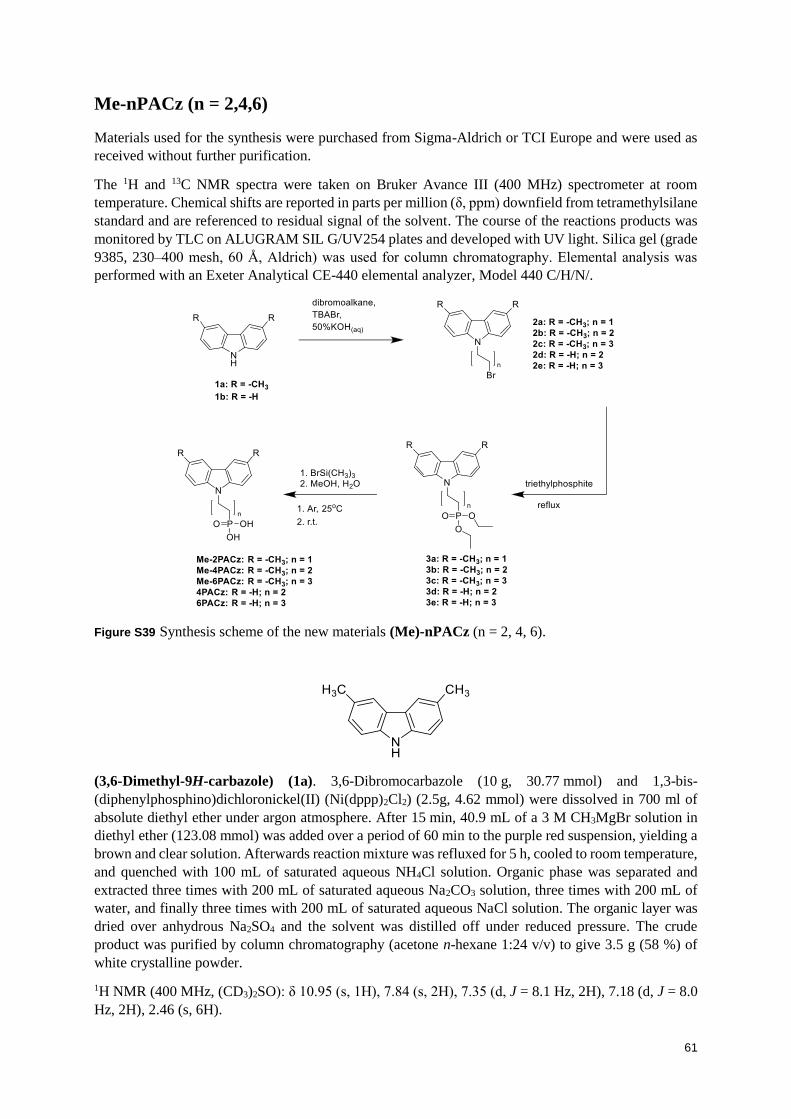
61
Me-nPACz (n = 2,4,6)
Materials used for the synthesis were purchased from Sigma-Aldrich or TCI Europe and were used as
received without further purification.
The 1H and 13C NMR spectra were taken on Bruker Avance III (400 MHz) spectrometer at room
temperature. Chemical shifts are reported in parts per million (δ, ppm) downfield from tetramethylsilane
standard and are referenced to residual signal of the solvent. The course of the reactions products was
monitored by TLC on ALUGRAM SIL G/UV254 plates and developed with UV light. Silica gel (grade
9385, 230–400 mesh, 60 Å, Aldrich) was used for column chromatography. Elemental analysis was
performed with an Exeter Analytical CE-440 elemental analyzer, Model 440 C/H/N/.
Figure S39 Synthesis scheme of the new materials (Me)-nPACz (n = 2, 4, 6).
(3,6-Dimethyl-9H-carbazole) (1a). 3,6-Dibromocarbazole (10 g, 30.77 mmol) and 1,3-bis-
(diphenylphosphino)dichloronickel(II) (Ni(dppp)2Cl2) (2.5g, 4.62 mmol) were dissolved in 700 ml of
absolute diethyl ether under argon atmosphere. After 15 min, 40.9 mL of a 3 M CH3MgBr solution in
diethyl ether (123.08 mmol) was added over a period of 60 min to the purple red suspension, yielding a
brown and clear solution. Afterwards reaction mixture was refluxed for 5 h, cooled to room temperature,
and quenched with 100 mL of saturated aqueous NH4Cl solution. Organic phase was separated and
extracted three times with 200 mL of saturated aqueous Na2CO3 solution, three times with 200 mL of
water, and finally three times with 200 mL of saturated aqueous NaCl solution. The organic layer was
dried over anhydrous Na2SO4 and the solvent was distilled off under reduced pressure. The crude
product was purified by column chromatography (acetone n-hexane 1:24 v/v) to give 3.5 g (58 %) of
white crystalline powder.
1H NMR (400 MHz, (CD3)2SO): δ 10.95 (s, 1H), 7.84 (s, 2H), 7.35 (d, J = 8.1 Hz, 2H), 7.18 (d, J = 8.0
Hz, 2H), 2.46 (s, 6H).
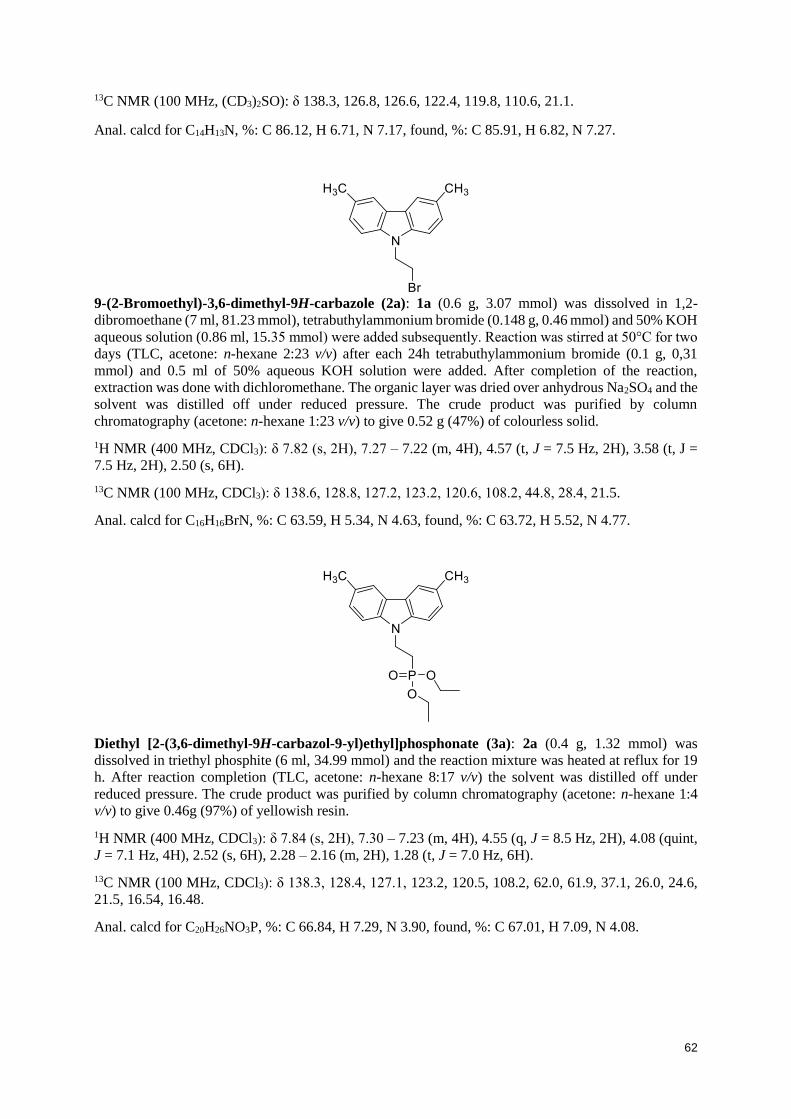
62
13C NMR (100 MHz, (CD3)2SO): δ 138.3, 126.8, 126.6, 122.4, 119.8, 110.6, 21.1.
Anal. calcd for C14H13N, %: C 86.12, H 6.71, N 7.17, found, %: C 85.91, H 6.82, N 7.27.
9-(2-Bromoethyl)-3,6-dimethyl-9H-carbazole (2a): 1a (0.6 g, 3.07 mmol) was dissolved in 1,2-
dibromoethane (7 ml, 81.23 mmol), tetrabuthylammonium bromide (0.148 g, 0.46 mmol) and 50% KOH
aqueous solution (0.86 ml, 15.35 mmol) were added subsequently. Reaction was stirred at 50°C for two
days (TLC, acetone: n-hexane 2:23 v/v) after each 24h tetrabuthylammonium bromide (0.1 g, 0,31
mmol) and 0.5 ml of 50% aqueous KOH solution were added. After completion of the reaction,
extraction was done with dichloromethane. The organic layer was dried over anhydrous Na2SO4 and the
solvent was distilled off under reduced pressure. The crude product was purified by column
chromatography (acetone: n-hexane 1:23 v/v) to give 0.52 g (47%) of colourless solid.
1H NMR (400 MHz, CDCl3): δ 7.82 (s, 2H), 7.27 – 7.22 (m, 4H), 4.57 (t, J = 7.5 Hz, 2H), 3.58 (t, J =
7.5 Hz, 2H), 2.50 (s, 6H).
13C NMR (100 MHz, CDCl3): δ 138.6, 128.8, 127.2, 123.2, 120.6, 108.2, 44.8, 28.4, 21.5.
Anal. calcd for C16H16BrN, %: C 63.59, H 5.34, N 4.63, found, %: C 63.72, H 5.52, N 4.77.
Diethyl [2-(3,6-dimethyl-9H-carbazol-9-yl)ethyl]phosphonate (3a): 2a (0.4 g, 1.32 mmol) was
dissolved in triethyl phosphite (6 ml, 34.99 mmol) and the reaction mixture was heated at reflux for 19
h. After reaction completion (TLC, acetone: n-hexane 8:17 v/v) the solvent was distilled off under
reduced pressure. The crude product was purified by column chromatography (acetone: n-hexane 1:4
v/v) to give 0.46g (97%) of yellowish resin.
1H NMR (400 MHz, CDCl3): δ 7.84 (s, 2H), 7.30 – 7.23 (m, 4H), 4.55 (q, J = 8.5 Hz, 2H), 4.08 (quint,
J = 7.1 Hz, 4H), 2.52 (s, 6H), 2.28 – 2.16 (m, 2H), 1.28 (t, J = 7.0 Hz, 6H).
13C NMR (100 MHz, CDCl3): δ 138.3, 128.4, 127.1, 123.2, 120.5, 108.2, 62.0, 61.9, 37.1, 26.0, 24.6,
21.5, 16.54, 16.48.
Anal. calcd for C20H26NO3P, %: C 66.84, H 7.29, N 3.90, found, %: C 67.01, H 7.09, N 4.08.
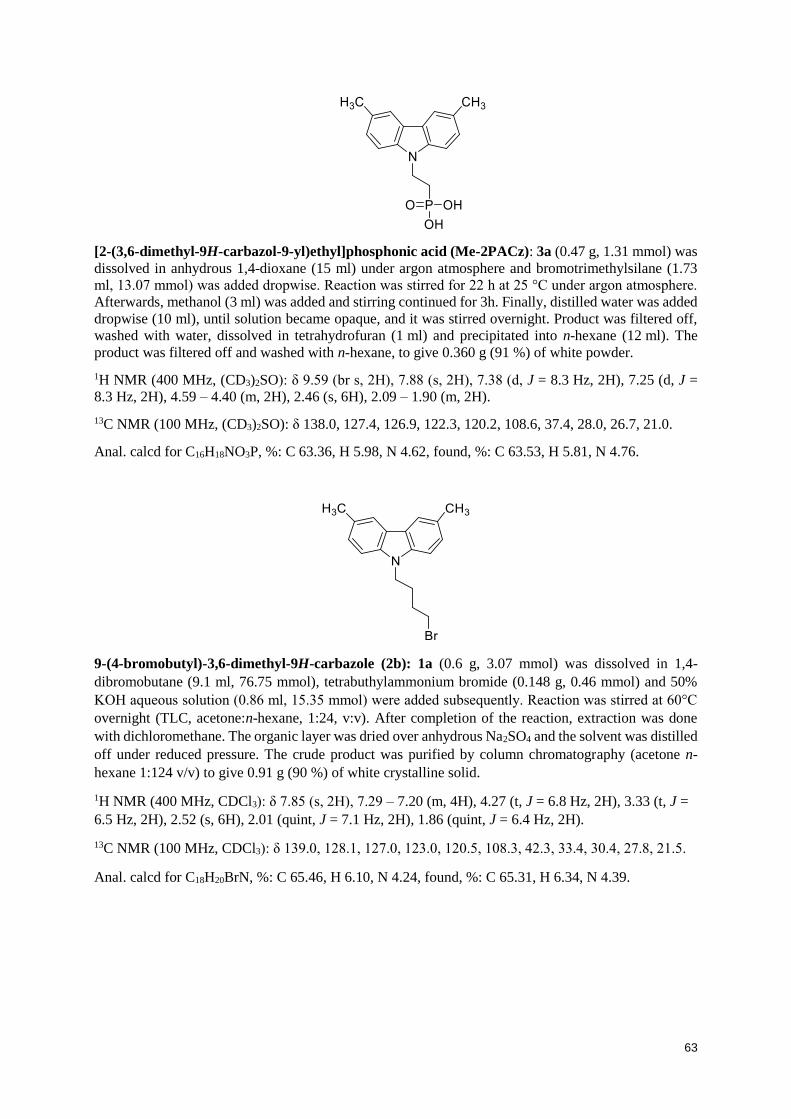
63
[2-(3,6-dimethyl-9H-carbazol-9-yl)ethyl]phosphonic acid (Me-2PACz): 3a (0.47 g, 1.31 mmol) was
dissolved in anhydrous 1,4-dioxane (15 ml) under argon atmosphere and bromotrimethylsilane (1.73
ml, 13.07 mmol) was added dropwise. Reaction was stirred for 22 h at 25 °C under argon atmosphere.
Afterwards, methanol (3 ml) was added and stirring continued for 3h. Finally, distilled water was added
dropwise (10 ml), until solution became opaque, and it was stirred overnight. Product was filtered off,
washed with water, dissolved in tetrahydrofuran (1 ml) and precipitated into n-hexane (12 ml). The
product was filtered off and washed with n-hexane, to give 0.360 g (91 %) of white powder.
1H NMR (400 MHz, (CD3)2SO): δ 9.59 (br s, 2H), 7.88 (s, 2H), 7.38 (d, J = 8.3 Hz, 2H), 7.25 (d, J =
8.3 Hz, 2H), 4.59 – 4.40 (m, 2H), 2.46 (s, 6H), 2.09 – 1.90 (m, 2H).
13C NMR (100 MHz, (CD3)2SO): δ 138.0, 127.4, 126.9, 122.3, 120.2, 108.6, 37.4, 28.0, 26.7, 21.0.
Anal. calcd for C16H18NO3P, %: C 63.36, H 5.98, N 4.62, found, %: C 63.53, H 5.81, N 4.76.
9-(4-bromobutyl)-3,6-dimethyl-9H-carbazole (2b): 1a (0.6 g, 3.07 mmol) was dissolved in 1,4-
dibromobutane (9.1 ml, 76.75 mmol), tetrabuthylammonium bromide (0.148 g, 0.46 mmol) and 50%
KOH aqueous solution (0.86 ml, 15.35 mmol) were added subsequently. Reaction was stirred at 60°C
overnight (TLC, acetone:n-hexane, 1:24, v:v). After completion of the reaction, extraction was done
with dichloromethane. The organic layer was dried over anhydrous Na2SO4 and the solvent was distilled
off under reduced pressure. The crude product was purified by column chromatography (acetone n-
hexane 1:124 v/v) to give 0.91 g (90 %) of white crystalline solid.
1H NMR (400 MHz, CDCl3): δ 7.85 (s, 2H), 7.29 – 7.20 (m, 4H), 4.27 (t, J = 6.8 Hz, 2H), 3.33 (t, J =
6.5 Hz, 2H), 2.52 (s, 6H), 2.01 (quint, J = 7.1 Hz, 2H), 1.86 (quint, J = 6.4 Hz, 2H).
13C NMR (100 MHz, CDCl3): δ 139.0, 128.1, 127.0, 123.0, 120.5, 108.3, 42.3, 33.4, 30.4, 27.8, 21.5.
Anal. calcd for C18H20BrN, %: C 65.46, H 6.10, N 4.24, found, %: C 65.31, H 6.34, N 4.39.

64
Diethyl [4-(3,6-dimethyl-9H-carbazol-9-yl)butyl]phosphonate (3b): 2b (0.8 g, 2.42 mmol) was
dissolved in triethyl phosphite (9 ml, 52.49 mmol) and the reaction mixture was heated at reflux
overnight. After reaction completion (TLC, acetone: n-hexane, 6:19, v:v) the solvent was distilled off
under reduced pressure. The crude product was purified by column chromatography (acetone/n-hexane
1:4 v/v) to give 0.89g (95%) of yellowish resin.
1H NMR (400 MHz, CDCl3): δ 7.84 (s, 2H), 7.25 – 7.22 (m, 4H), 4.24 (t, J = 7.0 Hz, 2H), 4.00 (quint,
J = 7.3 Hz, 4H), 2.51 (s, 6H), 1.93 (quint, J = 7.5 Hz, 2H), 1.75 – 1.58 (m, 4H), 1.24 (t, J = 7.0 Hz,
6H).
13C NMR (100 MHz, CDCl3): δ 139.0, 127.9, 126.9, 122.9, 120.4, 108.3, 61.62, 61.56, 42.6, 29.92,
29.77, 26.2, 24.8, 21.5, 20.54, 20.49, 16.53, 16.47.
Anal. calcd for C22H30NO3P, %: C 68.20, H 7.80, N 3.62, found, %: C 68.03, H 7.98, N 3.79.
[4-(3,6-dimethyl-9H-carbazol-9-yl)butyl]phosphonic acid (Me-4PACz): 3b (0.6 g, 1.55 mmol) was
dissolved in anhydrous 1,4-dioxane (20 ml) under argon atmosphere and bromotrimethylsilane (2.12
ml, 15.59 mmol) was added dropwise. Reaction was stirred for 22 h at 25oC under argon atmosphere.
Afterwards, methanol (3 ml) was added and stirring continued for 3h. Finally, distilled water was added
dropwise (15 ml), until solution became opaque, and it was stirred overnight. Product was filtered off,
washed with water, dissolved in tetrahydrofuran (1 ml) and precipitated into n-hexane (15 ml). The
product was filtered off and washed with n-hexane, to give 0.460 g (91 %) of white powder.
1H NMR (400 MHz, (CD3)2SO): δ 7.88 (s, 2H), 7.45 (d, J = 8.3 Hz, 2H), 7.23 (d, J = 8.3 Hz, 2H), 4.34
– 4.27 (m, 2H), 2.47 (s, 6H), 1.85 – 1.76 (m, 2H), 1.58 – 1.45 (m, 4H).
13C NMR (100 MHz, (CD3)2SO): δ 138.6, 127.0, 126.8, 122.0, 112.0, 109.0, 42.0, 29.71, 29.56, 28.1,
26.8, 21.1, 20.49, 20.45.
Anal. calcd for C18H22NO3P, %: C 65.25, H 6.69, N 4.23, found, %: C 65.38, H 6.51, N 4.29.

65
9-(6-Bromohexyl)-3,6-dimethyl-9H-carbazole (2c): 1a (0.6 g, 3.07 mmol) was dissolved in 1,6-
dibromohexane (9 ml, 58.51 mmol), tetrabuthylammonium bromide (0.148 g, 0.46 mmol) and 50%
KOH aqueous solution (0.86 ml, 15.35 mmol) were added subsequently. Reaction was stirred at 60°C
overnight (TLC, acetone: n-hexane 1:24 v/v). After completion of the reaction, extraction was done with
dichloromethane. The organic layer was dried over anhydrous Na2SO4 and the solvent was distilled off
under reduced pressure. The crude product was purified by column chromatography (acetone: n-hexane
1:249 v/v) to give 1.04 g (95 %) of colourless compound
1H NMR (400 MHz, CDCl3): δ 7.85 (s, 2H), 7.25 – 7.23 (m, 4H), 4.22 (t, J = 7.0 Hz), 3.32 (t, J = 6.7
Hz, 2H), 2.52 (s, 6H), 1.88 – 1.80 (m, 2H), 1.80 – 1.72 (m, 2H), 1.47 – 1.39 (m, 2H), 1.38 – 1.29 (m,
2H).
13C NMR (100 MHz, CDCl3): δ 139.1, 127.9, 126.9, 122.9, 120.4, 108.4, 43.0, 33.9, 32.7, 29.0, 28.1,
26.6, 21.5.
Anal. calcd for C20H24BrN, %: C 67.04, H 6.75, N 3.91, found, %: C 67.18, H 6.62, N 4.10.
Diethyl [6-(3,6-dimethyl-9H-carbazol-9-yl)hexyl]phosphonate (3c): 2c (1 g, 2.79 mmol) was
dissolved in triethyl phosphite (10 ml, 58.32 mmol) and the reaction mixture was heated at reflux
overnight. After reaction completion (TLC, acetone: n-hexane 6:19 v/v) the solvent was distilled off
under reduced pressure. The crude product was purified by column chromatography (acetone: n-hexane
4:21 v/v) to give 0.96g (82%) of yellowish resin.
1H NMR (400 MHz, CDCl3): δ 7.84 (s, 2H), 7.25 – 7.22 (m, 4H), 4.22 (t, J = 7.0 Hz, 2H), 4.10 – 3.99
(m, 4H), 2.52 (s, 6H), 1.82 (p, J = 7.0 Hz, 2H), 1.70 – 1.59 (m, 2H), 1.59 – 1.48 (m, 2H), 1.40 – 1.31
(m, 4H), 1.28 (t, J = 7.0 Hz, 6H).
13C NMR (100 MHz, CDCl3): δ 139.0, 127.8, 126.8, 122.8, 120.3, 108.3, 61.50, 61.44, 43.0, 30.52,
30.36, 28.9, 26.9, 26.4, 25.0, 22.45, 22.40, 21.5, 16.6, 16.5.
Anal. calcd for C24H34NO3P, %: C 69.37, H 8.25, N 3.37, found, %: C 69.56, H 8.13, N 3.50.
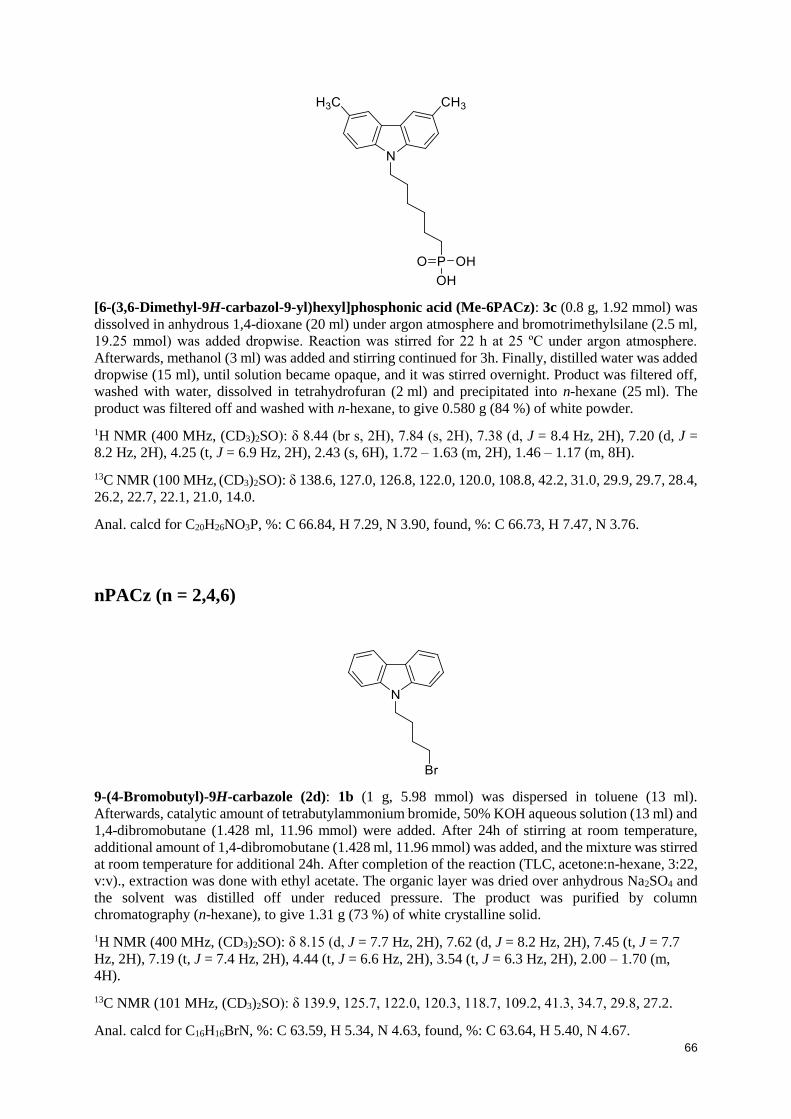
66
[6-(3,6-Dimethyl-9H-carbazol-9-yl)hexyl]phosphonic acid (Me-6PACz): 3c (0.8 g, 1.92 mmol) was
dissolved in anhydrous 1,4-dioxane (20 ml) under argon atmosphere and bromotrimethylsilane (2.5 ml,
19.25 mmol) was added dropwise. Reaction was stirred for 22 h at 25 ºC under argon atmosphere.
Afterwards, methanol (3 ml) was added and stirring continued for 3h. Finally, distilled water was added
dropwise (15 ml), until solution became opaque, and it was stirred overnight. Product was filtered off,
washed with water, dissolved in tetrahydrofuran (2 ml) and precipitated into n-hexane (25 ml). The
product was filtered off and washed with n-hexane, to give 0.580 g (84 %) of white powder.
1H NMR (400 MHz, (CD3)2SO): δ 8.44 (br s, 2H), 7.84 (s, 2H), 7.38 (d, J = 8.4 Hz, 2H), 7.20 (d, J =
8.2 Hz, 2H), 4.25 (t, J = 6.9 Hz, 2H), 2.43 (s, 6H), 1.72 – 1.63 (m, 2H), 1.46 – 1.17 (m, 8H).
13C NMR (100 MHz, (CD3)2SO): δ 138.6, 127.0, 126.8, 122.0, 120.0, 108.8, 42.2, 31.0, 29.9, 29.7, 28.4,
26.2, 22.7, 22.1, 21.0, 14.0.
Anal. calcd for C20H26NO3P, %: C 66.84, H 7.29, N 3.90, found, %: C 66.73, H 7.47, N 3.76.
nPACz (n = 2,4,6)
9-(4-Bromobutyl)-9H-carbazole (2d): 1b (1 g, 5.98 mmol) was dispersed in toluene (13 ml).
Afterwards, catalytic amount of tetrabutylammonium bromide, 50% KOH aqueous solution (13 ml) and
1,4-dibromobutane (1.428 ml, 11.96 mmol) were added. After 24h of stirring at room temperature,
additional amount of 1,4-dibromobutane (1.428 ml, 11.96 mmol) was added, and the mixture was stirred
at room temperature for additional 24h. After completion of the reaction (TLC, acetone:n-hexane, 3:22,
v:v)., extraction was done with ethyl acetate. The organic layer was dried over anhydrous Na2SO4 and
the solvent was distilled off under reduced pressure. The product was purified by column
chromatography (n-hexane), to give 1.31 g (73 %) of white crystalline solid.
1H NMR (400 MHz, (CD3)2SO): δ 8.15 (d, J = 7.7 Hz, 2H), 7.62 (d, J = 8.2 Hz, 2H), 7.45 (t, J = 7.7
Hz, 2H), 7.19 (t, J = 7.4 Hz, 2H), 4.44 (t, J = 6.6 Hz, 2H), 3.54 (t, J = 6.3 Hz, 2H), 2.00 – 1.70 (m,
4H).
13C NMR (101 MHz, (CD3)2SO): δ 139.9, 125.7, 122.0, 120.3, 118.7, 109.2, 41.3, 34.7, 29.8, 27.2.
Anal. calcd for C16H16BrN, %: C 63.59, H 5.34, N 4.63, found, %: C 63.64, H 5.40, N 4.67.
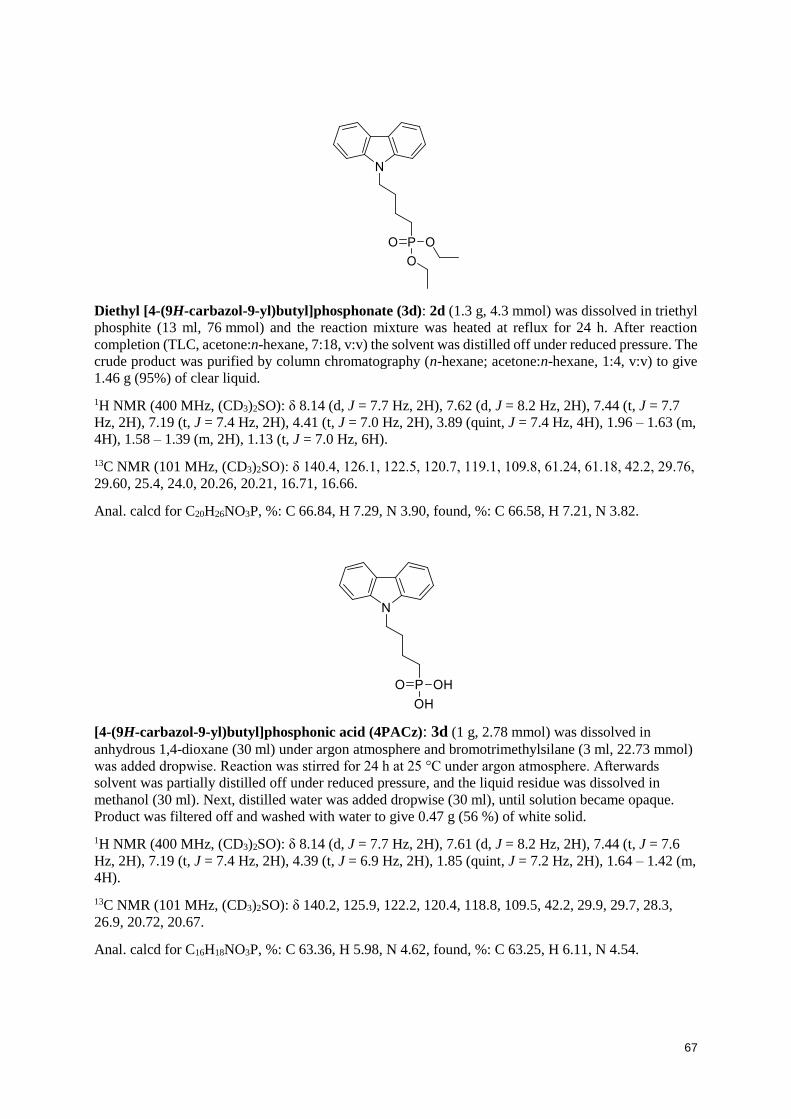
67
Diethyl [4-(9H-carbazol-9-yl)butyl]phosphonate (3d): 2d (1.3 g, 4.3 mmol) was dissolved in triethyl
phosphite (13 ml, 76 mmol) and the reaction mixture was heated at reflux for 24 h. After reaction
completion (TLC, acetone:n-hexane, 7:18, v:v) the solvent was distilled off under reduced pressure. The
crude product was purified by column chromatography (n-hexane; acetone:n-hexane, 1:4, v:v) to give
1.46 g (95%) of clear liquid.
1H NMR (400 MHz, (CD3)2SO): δ 8.14 (d, J = 7.7 Hz, 2H), 7.62 (d, J = 8.2 Hz, 2H), 7.44 (t, J = 7.7
Hz, 2H), 7.19 (t, J = 7.4 Hz, 2H), 4.41 (t, J = 7.0 Hz, 2H), 3.89 (quint, J = 7.4 Hz, 4H), 1.96 – 1.63 (m,
4H), 1.58 – 1.39 (m, 2H), 1.13 (t, J = 7.0 Hz, 6H).
13C NMR (101 MHz, (CD3)2SO): δ 140.4, 126.1, 122.5, 120.7, 119.1, 109.8, 61.24, 61.18, 42.2, 29.76,
29.60, 25.4, 24.0, 20.26, 20.21, 16.71, 16.66.
Anal. calcd for C20H26NO3P, %: C 66.84, H 7.29, N 3.90, found, %: C 66.58, H 7.21, N 3.82.
[4-(9H-carbazol-9-yl)butyl]phosphonic acid (4PACz): 3d (1 g, 2.78 mmol) was dissolved in
anhydrous 1,4-dioxane (30 ml) under argon atmosphere and bromotrimethylsilane (3 ml, 22.73 mmol)
was added dropwise. Reaction was stirred for 24 h at 25 °C under argon atmosphere. Afterwards
solvent was partially distilled off under reduced pressure, and the liquid residue was dissolved in
methanol (30 ml). Next, distilled water was added dropwise (30 ml), until solution became opaque.
Product was filtered off and washed with water to give 0.47 g (56 %) of white solid.
1H NMR (400 MHz, (CD3)2SO): δ 8.14 (d, J = 7.7 Hz, 2H), 7.61 (d, J = 8.2 Hz, 2H), 7.44 (t, J = 7.6
Hz, 2H), 7.19 (t, J = 7.4 Hz, 2H), 4.39 (t, J = 6.9 Hz, 2H), 1.85 (quint, J = 7.2 Hz, 2H), 1.64 – 1.42 (m,
4H).
13C NMR (101 MHz, (CD3)2SO): δ 140.2, 125.9, 122.2, 120.4, 118.8, 109.5, 42.2, 29.9, 29.7, 28.3,
26.9, 20.72, 20.67.
Anal. calcd for C16H18NO3P, %: C 63.36, H 5.98, N 4.62, found, %: C 63.25, H 6.11, N 4.54.

68
9-(6-bromohexyl)-9H-carbazole (2e): 1b (1 g, 5.98 mmol) was dispersed in toluene (13 ml).
Afterwards, catalytic amount of tetrabutylammonium bromide, 50% KOH aqueous solution (13 ml) and
1,6-dibromohexane (1.84 ml, 11.96 mmol) were added. After 24h of stirring at room temperature,
additional amount of 1,6-dibromohexane (1 ml, 6.5 mmol) was added, and the mixture was stirred at
room temperature for additional 24h. After completion of the reaction (TLC, acetone:n-hexane, 3:22,
v:v)., extraction was done with ethyl acetate. The organic layer was dried over anhydrous Na2SO4 and
the solvent was distilled off under reduced pressure. The product was purified using column
chromatography (n-hexane), to give 1.38 g (70 %) of white crystalline solid.
1H NMR (400 MHz, (CD3)2SO): δ 8.14 (d, J = 7.7 Hz, 2H), 7.59 (d, J = 8.2 Hz, 2H), 7.44 (t, J = 7.6
Hz, 2H), 7.19 (t, J = 7.4 Hz, 2H), 4.37 (t, J = 7.1 Hz, 2H), 3.46 (t, J = 6.6 Hz, 2H), 1.86 – 1.64 (m,
4H), 1.47 – 1.22 (m, 4H).
13C NMR (101 MHz, (CD3)2SO) δ 139.7, 125.4, 121.8, 120.0, 118.4, 109.0, 41.9, 34.8, 31.9, 28.1,
27.0, 25.4.
Anal. calcd for C18H20BrN, %: C 65.46, H 6.10, N 4.24, found, %: C 65.52, H 6.09, N 4.26.
diethyl [6-(9H-carbazol-9-yl)hexyl]phosphonate (3e): 2e (1.18 g, 3.59 mmol) was dissolved in triethyl
phosphite (12 ml, 69.98 mmol) and the reaction mixture was heated at reflux for 24 h. After reaction
completion (TLC, acetone:n-hexane, 7:18, v/v) the solvent was distilled off under reduced pressure. The
crude product was purified by column chromatography (n-hexane; acetone:n-hexane, 1:4, v/v), to give
1.39 g (99%) of clear yellowish liquid.
1H NMR (400 MHz, (CD3)2SO): δ 8.14 (d, J = 7.7 Hz, 2H), 7.59 (d, J = 8.2 Hz, 2H), 7.44 (t, J = 7.6
Hz, 2H), 7.19 (t, J = 7.4 Hz, 2H), 4.38 (t, J = 7.0 Hz, 2H), 4.07 – 3.94 (m, 4H), 1.79 – 1.57 (m, 6H),
1.43 – 1.23 (m, 10H).
13C NMR (101 MHz, (CD3)2SO): δ 140.0, 125.6, 122.0, 120.2, 118.6, 109.2, 60.73, 60.67, 42.1, 29.43,
29.27, 28.2, 25.9, 25.0, 23.6, 21.95, 21.90, 16.30, 16.24.
Anal. calcd for C22H30NO3P, %: C 68.20, H 7.80, N 3.62, found, %: C 68.33, H 7.84, N 3.68.
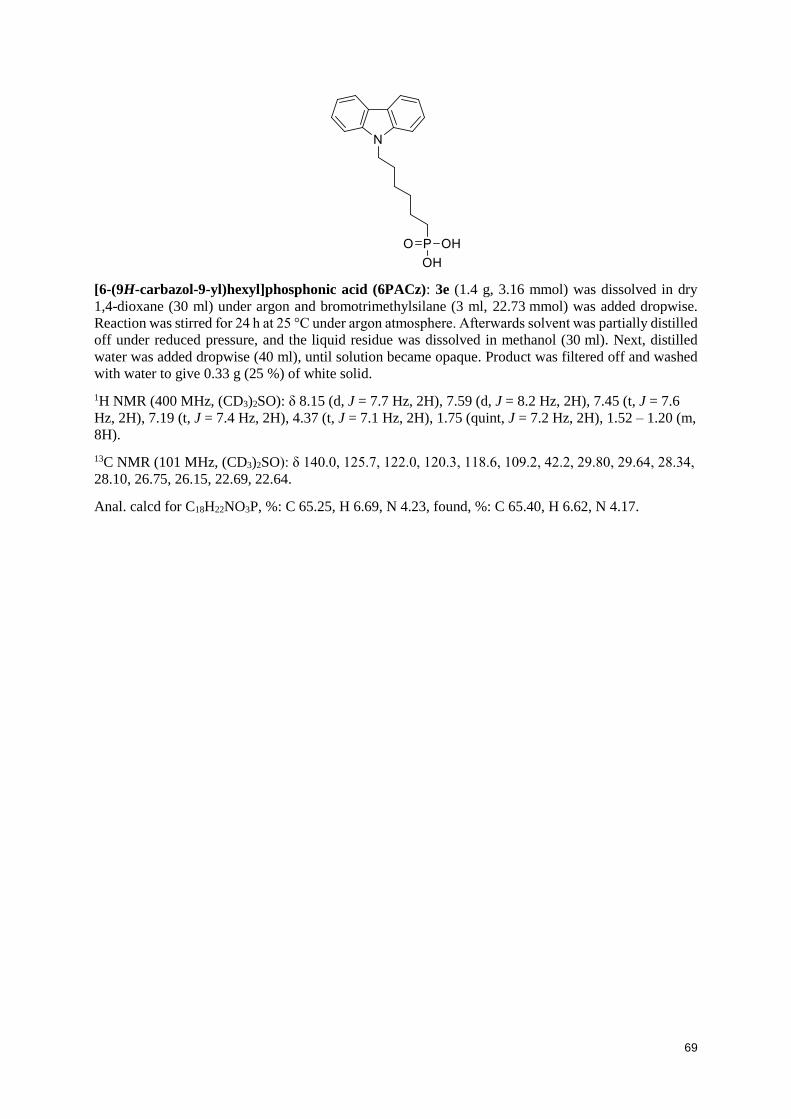
69
[6-(9H-carbazol-9-yl)hexyl]phosphonic acid (6PACz): 3e (1.4 g, 3.16 mmol) was dissolved in dry
1,4-dioxane (30 ml) under argon and bromotrimethylsilane (3 ml, 22.73 mmol) was added dropwise.
Reaction was stirred for 24 h at 25 °C under argon atmosphere. Afterwards solvent was partially distilled
off under reduced pressure, and the liquid residue was dissolved in methanol (30 ml). Next, distilled
water was added dropwise (40 ml), until solution became opaque. Product was filtered off and washed
with water to give 0.33 g (25 %) of white solid.
1H NMR (400 MHz, (CD3)2SO): δ 8.15 (d, J = 7.7 Hz, 2H), 7.59 (d, J = 8.2 Hz, 2H), 7.45 (t, J = 7.6
Hz, 2H), 7.19 (t, J = 7.4 Hz, 2H), 4.37 (t, J = 7.1 Hz, 2H), 1.75 (quint, J = 7.2 Hz, 2H), 1.52 – 1.20 (m,
8H).
13C NMR (101 MHz, (CD3)2SO): δ 140.0, 125.7, 122.0, 120.3, 118.6, 109.2, 42.2, 29.80, 29.64, 28.34,
28.10, 26.75, 26.15, 22.69, 22.64.
Anal. calcd for C18H22NO3P, %: C 65.25, H 6.69, N 4.23, found, %: C 65.40, H 6.62, N 4.17.