montara well release monitoring study s4a · page iii montara well release monitoring study s4a...
TRANSCRIPT

Assessment of Effects on Timor Sea FishFinal RepoRt
15 November 2011
Montara Well ReleaseMonitoring Study S4A –

Page ii
Montara Well Release Monitoring Study S4A // Assessment of Effects on Timor Sea Fish
Page iii
Montara Well Release Monitoring Study S4A // Assessment of Effects on Timor Sea Fish
Summary of Results• Biopsies were collected on a total of 181 fish sampled during Phase I (November
2009), on 262 fish during Phase II (March 2010), and on 338 fish in Phase III (November 2010) with the majority of specimens being goldband snapper, red emperor, rainbow runner and Spanish mackerel.
• For each species, all individuals were in good physical condition at all sites, suggesting good health status.
• Results from Phase I indicated that in the short-term, fish were exposed to, and metabolised petroleum hydrocarbons, however no consistent adverse effects on fish health or on their reproductive activity were detected.
• In Phase II, continuing exposure to petroleum hydrocarbons was evidenced by elevated liver detoxification enzymes and PAH biliary metabolites in three out of four species collected close to the rig; in addition, red emperor collected close to the West Atlas had enlarged livers and elevated oxidative DNA damage.
• Phase III established that biomarkers of fish health showed a trend towards a return to reference levels with often, but not always, comparable biomarker levels in fish collected from reference and impacted sites.
• Liver integrity was preserved at all times, for all four species of fish collected.
• No reproductive impairment or structural alteration of gonadal tissues were observed in any of the species, up to a year following the end of the well release.
• Multivariate analysis suggests that overall differences between sites across all biomarkers were influenced mainly by biomarkers of exposure to petroleum hydrocarbons. Further, these analyses suggest that as the time post-release increases, the overall biomarker signals from different sites appear to converge.
• Overall, the fish collected initially showed evidence of exposure to petroleum hydrocarbons at sites close to the West Atlas drilling rig, increased liver size and occasionally, increased oxidative DNA damage in Phase I and II of the monitoring. While at some sites differences in biomarker levels were still observed one year after the end of the well release (Phase III), the magnitude of the differences had reduced relative to earlier samplings, suggesting a partial, ongoing trend toward a return to normal biochemistry/physiology following exposure to petroleum hydrocarbons.
Page iv
Montara Well Release Monitoring Study S4A // Assessment of Effects on Timor Sea Fish
PrefaceThis report was prepared by Drs Marthe Monique Gagnon and Christopher Rawson from the Department
of Environment and Agriculture, Curtin University. The data referred to herein were collected from aboard
the FV Megan M on three occasions, with a first field collection from 5th to 9th November 2009 (Phase I), a
second collection from 4th to 18th March 2010 (Phase II), and a Phase III collection which took place on 9th to
30th November 2010. All biomarker analyses were conducted in the Aquatic Toxicology laboratories in the
Department of Environment and Agriculture at Curtin University.
AcknowledgementsSpecial thanks to Grant Barker, captain of the FV Megan M and to the crew (Shane Ross, Beau Pieterman,
Mitch Seelander and Matt Badart) for their assistance in the collection of fish samples. Thanks to Leif Cooper
for assistance in the collection of sediment samples. The technical assistance of Tomoe Ota is sincerely
thanked for the preparation of the histological slides of gonad tissues.
Document HistoryRev Date Authors Comments
A 5 May 2011 MM GagnonCA Rawson
Initial Draft for comment to PTTEPAA
B 15 Sept 2011 MM GagnonCA Rawson
Draft II following comments from SEER and PPR
C 8 Oct 2011 MM GagnonCA Rawson
Draft III following comments from Robin Wright PTTEPAA
D 10 Oct 2011 MM GagnonCA Rawson
Final Formal Version
For further information contact:Associate Professor Marthe Monique Gagnon
Department of Environment and Agriculture
Curtin University
GPO Box U1987
Perth, Western Australia, 6845
Tel.: (08) 9266 3723
Email: [email protected]
Recommended Citation:Gagnon M.M., Rawson C., 2011. Montara Well Release, Monitoring Study S4A – Assessment of Effects on
Timor Sea Fish. Curtin University, Perth, Australia. 208 pages.
Disclaimer:The views contained in this report are those of the authors and do not necessarily reflect the views of
PTTEPAA, SEWPaC or any other party.
ISBN 978-0-9872223-0-5

Page v
Montara Well Release Monitoring Study S4A // Assessment of Effects on Timor Sea Fish
Executive Summary
The Montara well release that occurred in the Timor Sea in 2009 discharged an
estimated 23,000 barrels of oil and gas condensate in a high biodiversity marine
environment, raising immediate concerns of economic, political and environmental
significance. Of economic relevance are the short – and long-term impacts of the
discharge on commercial fisheries, with the Northern Demersal Scale Fisheries
exploiting stocks of goldband snapper (Pristipomoides multidens) and red emperor
(Lutjanus sebae) in this area. Albeit to a lesser extent, rainbow runner (Elegatis
bipinnulata) and narrow-barred Spanish mackerel (Scomberomorus commerson)
are also fished recreationally in this environment. The well release occurred during
the lead-up to the active reproductive season for these species.
Page vi
Montara Well Release Monitoring Study S4A // Assessment of Effects on Timor Sea Fish
The well release was controlled after seventy-
four days after which a scientific team of
ecotoxicologists was assigned to sample the
commercially important fish species and evaluate
the impacts of the hydrocarbon release on fish
health. The FV Megan M commercial fishing boat
was chartered in November 2009 for the first
collection of biopsies on pelagic and demersal
fish. In this first Phase of the study (Phase I),
biopsies were collected on 145 demersal and 36
pelagic fish respectively. A second field collection
occurred in March 2010, four months following
the end of the well release. In the second Phase
of the study (Phase II), biopsies were collected on
202 demersal and 60 pelagic fishes. Finally, a third
sampling (Phase III) was conducted in November
2010, 12 months after the incident. During Phase
III, 315 demersal and 23 pelagic fish were captured
and sampled for biopsy collections. Biopsies were
used to evaluate the short and long-term impacts
of exposure to petroleum hydrocarbons on fish
health, by the determination of physiological
indices and biochemical markers (biomarkers).
The selected physiological indices were the
condition factor, liver somatic index and the
gonado-somatic index. Biochemical markers
measured included liver detoxification activity,
biliary polycyclic aromatic hydrocarbon (PAH)
metabolites, liver integrity measured by serum
sorbitol dehydrogenase activity (SDH), oxidative
DNA damage and histological examination of
the gonads.
Results from Phase I indicated that in the short-
term, fish were exposed to, and metabolised,
petroleum hydrocarbons however, no consistent
adverse effects on fish health or on their
reproductive activity were detected. The
physiology of the fish was not affected by exposure
to the hydrocarbon release, (i.e. the condition
factor (fattiness) of the fish) and the liver and
gonad sizes relative to their body weight were
similar in fish collected within the impacted zone
and in fish collected in reference areas. Similarly,
liver integrity was maintained in fish from all areas,
liver detoxification activity was similar at all sites,
and there was no evidence of increased oxidative
DNA damage at study sites near the West Atlas
drilling rig. Histological examination of the gonads
revealed no abnormalities immediately following
the control of the well release.
Phase II investigated possible effects of exposure
on fish health four months after the cessation
of the hydrocarbon leak. In the longer term
(4 months following the end of the well release),
red emperor captured within 20 NM from the rig
exhibited altered physiological indices such as
larger liver size relative to body size, and higher
condition factor, relative to the fish from reference
areas. Female rainbow runner and male goldband
snapper captured in the vicinity of the West Atlas
rig had reduced gonad weight relative to body
weight. Confirmation of ongoing exposure to PAHs
was measured in demersal fish captured within 20
NM from the rig, as evidenced by high PAH biliary
metabolites and high liver detoxification activity in
these fish, relative to those collected in reference
areas. While liver integrity was not compromised
in any species, red emperor captured 20 NM from
the rig had higher DNA damage than those fish
originating from reference zones. Gonad histology
did not identify reproductive abnormalities in any
on the fish species.
The final phase of the study, Phase III study,
was conducted 12 months following the end
of the well release and sampled 338 fish from
3 impacted and 5 reference sites. For all fish
species collected during Phase III, the condition
factor from fish originating from the reference and
impacted sites was comparable, indicating that
all fish were in similar physical condition. Some
variations were observed in liver size relative to
body size in goldband snapper and red emperor,
however these variations were modest and not
consistent throughout impacted and reference
areas. Similarly, the gonad size relative to body
size showed some inter-site variability in male
red emperor and female goldband snapper
however no consistent pattern emerged. The
onset of reproductive activities in these species
is likely the main factor associated with these
variations. One year following the end of the spill,
no reproductive impacts could be detected in any
of the fish species as histological examination
of structural gonadal tissues revealed the
absence of abnormalities or pathologies. The liver
detoxification activity in goldband snapper and
red emperor collected within 20 NM from the rig
has returned towards reference levels, with the
exception of fish of these two species collected at
a single impacted site (Heywood shoal) located
53 NM south-west of the rig which appeared to
have continuing high liver detoxification activity.
Page vii
Montara Well Release Monitoring Study S4A // Assessment of Effects on Timor Sea Fish
It is possible that a natural seepage occurs in
the area, as one year after the spill fish collected
from other impacted locations do not exhibit
similar high liver detoxification activities. All fish
originating at the impacted sites, including those
with high detoxification activity, had levels of PAH
metabolites in their biliary secretions which were
comparable to those of fish collected at reference
sites. Liver integrity in all fish species appeared
to be intact. Oxidative DNA damage, which was
previously found to be elevated in fish captured in
close proximity of the well release, had returned to
reference levels for all fish species, at all sites.
The results of a multivariate analysis indicates
that over the entire sampling period, there were
significant differences between impacted sites
reference sites and that these differences were
mostly due to the levels of PAH metabolites in the
bile of the fish. Through time the impacted and
non-impacted areas tended to converge towards a
similar overall biomarker signal. This finding points
to a reduction in the differences between the
sites and, to a reduction in exposure to petroleum
hydrocarbons at the “impacted” sites.
Overall, shortly following the control of the well
release, fish captured in the oil-impacted area
exhibited evidence of exposure to petroleum
hydrocarbons and were showing, in the short
term, very limited adverse health impacts. The
investigation conducted four months after the
spill revealed continuing exposure to petroleum
hydrocarbons in demersal species captured
close to the rig, with associated alterations to
physiological indices consistent with chronic
exposure to petroleum compounds. The survey
conducted twelve months after the incident
showed return towards reference levels of
physiological and biochemical markers in fish
captured close to the rig location. A small
number of fish from one site however, returned
some results that suggest exposure to natural or
released hydrocarbons. Histological morphology of
male and female gonads remained unaltered in all
fish species from all locations.
Environmental factors such as the warm water
temperatures found in the Timor Sea would favour
weathering processes and biodegradation of the
light Montara oil. Monitoring fish health at impacted
and reference locations has demonstrated that fish
were initially exposed to petroleum hydrocarbons,
however, evidence of exposure and effects have
significantly reduced one year following the end
of the Montara well release. The reduced inter-
site biomarker variability observed suggests an
ongoing return towards reference levels.

Page viii
Montara Well Release Monitoring Study S4A // Assessment of Effects on Timor Sea Fish
Executive Summary .........................................................................................................................................................v
Background...................................................................................................................................................................... 1
Toxicological Concepts .......................................................................................................................................... 2
Physiological Parameters ..............................................................................................................................2
Biochemical Markers (Biomarkers) ..............................................................................................................3
Liver Detoxification Enzymes ........................................................................................................................3
Biliary Metabolites..........................................................................................................................................3
Sorbitol Dehydrogenase (SDH).....................................................................................................................4
Oxidative DNA Damage .................................................................................................................................4
Project Aims ..................................................................................................................................................................... 5
Sampling Timeline – Phase I ......................................................................................................................................... 7
Sampling Timeline – Phase II ........................................................................................................................................ 9
Sampling Timeline – Phase III ......................................................................................................................................11
Sampling Sites ................................................................................................................................................................13
Field Methodology .........................................................................................................................................................17
Fish Sampling .........................................................................................................................................................17
Morphology .............................................................................................................................................................19
Biopsies Collected .................................................................................................................................................19
Additional Sampling ...............................................................................................................................................19
Muscle Samples ...........................................................................................................................................19
Stomach/Intestinal Contents ......................................................................................................................20
Floating Material Samples ...........................................................................................................................22
Water Samples .............................................................................................................................................22
Sediment Samples .......................................................................................................................................22
Laboratory Methods ..................................................................................................................................................... 23
Physiological Parameters ..................................................................................................................................... 23
Liver Detoxification Enzymes (EROD Activity) ................................................................................................... 23
Biliary Metabolites .................................................................................................................................................24
Sorbitol Dehydrogenase (SDH) Activity ...............................................................................................................24
Oxidative DNA Damage (Serum 8-oxo-dG Concentration) ..............................................................................24
Gonad Histology ....................................................................................................................................................24
Statistical Analyses ................................................................................................................................................25
Table of Contents
Page ix
Montara Well Release Monitoring Study S4A // Assessment of Effects on Timor Sea Fish
Results and Interpretation ............................................................................................................................................27
Sampling Summary ...............................................................................................................................................27
Diversity .........................................................................................................................................................27
Biopsy Collection .........................................................................................................................................29
General Fish Health .....................................................................................................................................31
Physiological Parameters ......................................................................................................................................31
Condition Factor ...........................................................................................................................................31
Liver Somatic Index (LSI) .............................................................................................................................34
Gonado-somatic Index (GSI) ......................................................................................................................36
Gonad Histology ...........................................................................................................................................41
Biochemical Parameters ...................................................................................................................................... 48
Liver Detoxification Enzymes ......................................................................................................................48
Biliary Metabolites........................................................................................................................................51
Sorbitol Dehydrogenase (SDH) Activity .....................................................................................................58
Oxidative DNA Damage (Serum 8-oxo-dG Concentration) ....................................................................61
Multivariate Analysis ............................................................................................................................................. 64
Conclusions ....................................................................................................................................................................67
References ......................................................................................................................................................................71
Appendix A – Statistical Results Phase I ...................................................................................................................73
Appendix B – Statistical Results Phase II .................................................................................................................81
Appendix C – Statistical Results Phase III ............................................................................................................... 89
Appendix D – Results of Floating Material Analysis ................................................................................................97
Appendix E – Results of Water Samples Analysis ................................................................................................109
(Phase I and Phase II) ..........................................................................................................................................109
Appendix F – Results of Sediment Analysis ...........................................................................................................145
(Phase III) ...............................................................................................................................................................145

Page x
Montara Well Release Monitoring Study S4A // Assessment of Effects on Timor Sea Fish
List of FiguresFigure 1. Map showing the location of the West Atlas drilling rig and the sampling sites. Concentric rings represent 20, 80 and 150 NM from the platform. Sites 1, 2, 3 and 4 were designated as impacted sites and Sites 5 and 6 were designated as reference sites in Phase I sampling. Site 7 is located at Scott Reef. Surface samples are plankton net trawls collecting observed floating material. .............................. 14
Figure 2. Method of demersal fish capture. Baited steel fish trap prior to deployment. In picture: Matthew Badart (left) and Beau Pieterman (right). ..................................................................................................... 18
Figure 3. Left: flow-through live tank used to preserve the fish in good condition following capture; right: fish were initially measured and weighed prior to sacrifice. ........................................................................... 18
Figure 4. Left: blood collection from the caudal artery on a goldband snapper; right: bile collection using a 1 mL syringe. ..................................................................................................................................................... 19
Figure 5. Parasitic cysts adhering to the stomach of a Spanish mackerel (top), and flat worm attached to the liver of a goldband snapper (bottom)................................................................................................................ 31
Figure 6. Condition factor of goldband snapper captured at study sites in the Timor Sea in November 2009, March 2010 and November 2011. “Impacted” sites are in red and “reference” sites are in green. X denotes that no fish of this species were examined from this site. Numbers in columns denote the number of fish included in the analysis. Different letters above the columns denote significant difference (a = 0.05). ...................................................................................................................................................... 32
Figure 7. Condition factor of red emperor captured at study sites in the Timor Sea in November 2009, March 2010 and November 2011. “Impacted” sites are in red and “reference” sites are in green. X denotes that no fish of this species were examined from this site. Numbers in columns denote the number of fish included in the analysis. Different letters above the columns denote significant difference (a = 0.05). ...................................................................................................................................................... 32
Figure 8. Condition factor of rainbow runner captured at study sites in the Timor Sea in November 2009, March 2010 and November 2011. “Impacted” sites are in red and “reference” sites are in green. X denotes that no fish of this species were examined from this site. Numbers in columns denote the number of fish included in the analysis. Different letters above the columns denote significant difference (a = 0.05). ...................................................................................................................................................... 33
Figure 9. Condition factor of Spanish mackerel captured at study sites in the Timor Sea in November 2009, March 2010 and November 2011. “Impacted” sites are in red and “reference” sites are in green. X denotes that no fish of this species were examined from this site. Numbers in columns denote the number of fish included in the analysis. Different letters above the columns denote significant difference (a = 0.05). ...................................................................................................................................................... 33
Figure 10. Liver somatic index of goldband snapper captured at study sites in the Timor Sea in November 2009, March 2010 and November 2011. “Impacted” sites are in red and “reference” sites are in green. X denotes that no fish of this species were examined from this site. Numbers in columns denote the number of fish included in the analysis. Different letters above the columns denote significant difference (a = 0.05). ................................................................................................................................... 34
Figure 11. Liver somatic index of red emperor captured at study sites in the Timor Sea in November 2009, March 2010 and November 2011. “Impacted” sites are in red and “reference” sites are in green. X denotes that no fish of this species were examined from this site. Numbers in columns denote the number of fish included in the analysis. Different letters above the columns denote significant difference (a = 0.05). ...................................................................................................................................................... 35
Figure 12. Liver somatic index of rainbow runner captured at study sites in the Timor Sea in November 2009, March 2010 and November 2011. “Impacted” sites are in red and “reference” sites are in green. X denotes that no fish of this species were examined from this site. Numbers in columns denote the number of fish included in the analysis. Different letters above the columns denote significant difference (a = 0.05). ...................................................................................................................................................... 35
Figure 13. Liver somatic index of Spanish mackerel captured at study sites in the Timor Sea in November 2009, March 2010 and November 2011. “Impacted” sites are in red and “reference” sites are in green. X denotes that no fish of this species were examined from this site. Numbers in columns denote the number of fish included in the analysis. Different letters above the columns denote significant difference (a = 0.05). ................................................................................................................................... 36
Page xi
Montara Well Release Monitoring Study S4A // Assessment of Effects on Timor Sea Fish
Figure 14. Gonado-somatic index of male goldband snapper captured at study sites in the Timor Sea in November 2009, March 2010 and November 2010. “Impacted” sites are in red and “reference” sites are in green. X denotes that no fish of this species were examined from this site. Numbers in columns denote the number of fish included in the analysis. Different letters above the columns denote significant difference (a = 0.05). ................................................................................................................................... 37
Figure 15. Gonado-somatic index of male red emperor captured at study sites in the Timor Sea in November 2009, March 2010 and November 2010. “Impacted” sites are in red and “reference” sites are in green. X denotes that no fish of this species were examined from this site. Numbers in columns denote the number of fish included in the analysis. Different letters above the columns denote significant difference (a = 0.05). ................................................................................................................................... 37
Figure 16. Gonado-somatic index of male rainbow runner captured at study sites in the Timor Sea in November 2009, March 2010 and November 2010. “Impacted” sites are in red and “reference” sites are in green. X denotes that no fish of this species were examined from this site. Numbers in columns denote the number of fish included in the analysis. Different letters above the columns denote significant difference (a = 0.05). ................................................................................................................................... 38
Figure 17. Gonado-somatic index of male Spanish mackerel captured at study sites in the Timor Sea in November 2009, March 2010 and November 2010. “Impacted” sites are in red and “reference” sites are in green. X denotes that no fish of this species were examined from this site. Numbers in columns denote the number of fish included in the analysis. Different letters above the columns denote significant difference (a = 0.05). ................................................................................................................................... 38
Figure 18. Gonado-somatic index of female goldband snapper captured at study sites in the Timor Sea in November 2009, March 2010 and November 2010. “Impacted” sites are in red and “reference” sites are in green. X denotes that no fish of this species were examined from this site. Numbers in columns denote the number of fish included in the analysis. Different letters above the columns denote significant difference (a = 0.05). ................................................................................................................................... 39
Figure 19. Gonado-somatic index of female red emperor captured at study sites in the Timor Sea in November 2009, March 2010 and November 2010. “Impacted” sites are in red and “reference” sites are in green. X denotes that no fish of this species were examined from this site. Numbers in columns denote the number of fish included in the analysis. Different letters above the columns denote significant difference (a = 0.05). ................................................................................................................................... 40
Figure 20. Gonado-somatic index of female rainbow runner captured at study sites in the Timor Sea in November 2009, March 2010 and November 2010. “Impacted” sites are in red and “reference” sites are in green. X denotes that no fish of this species were examined from this site. Numbers in columns denote the number of fish included in the analysis. Different letters above the columns denote significant difference (a = 0.05). ................................................................................................................................... 40
Figure 21. Gonado-somatic index of female Spanish mackerel captured at study sites in the Timor Sea in November 2009, March 2010 and November 2010. “Impacted” sites are in red and “reference” sites are in green. X denotes that no fish of this species were examined from this site. Numbers in columns denote the number of fish included in the analysis. Different letters above the columns denote significant difference (a = 0.05). ................................................................................................................................... 41
Figure 22. Stained (haematoxylin-eosin) slides of gonadal tissue of female goldband snapper collected from reference areas (left) and impacted areas (right) in the Timor Sea in March 2010. ....................................... 42
Figure 23. Stained (haematoxylin-eosin) slides of gonadal tissue of male goldband snapper collected from reference areas (left) and impacted areas (right) in the Timor Sea in March 2010 ........................................ 43
Figure 24. Stained (haematoxylin-eosin) slides of gonadal tissue of female rainbow runner collected from reference areas (left) and impacted areas (right) in the Timor Sea in March 2010 ........................................ 44
Figure 25. Stained (haematoxylin-eosin) slides of gonadal tissue of male rainbow runner collected from reference areas (left) and impacted areas (right) in the Timor Sea in March 2010. ................................................ 45
Figure 26. Stained (haematoxylin-eosin) slides of gonadal tissue of female red emperor collected from reference areas (left) and impacted areas (right) in the Timor Sea in March 2010. ................................................ 46
Figure 27. Stained (haematoxylin-eosin) slides of gonadal tissue of male red emperor collected from reference areas (left) and impacted areas (right) in the Timor Sea in March 2010. ................................................ 47
Page xii
Montara Well Release Monitoring Study S4A // Assessment of Effects on Timor Sea Fish
Figure 28. EROD activity (pmol/ mg protein/ min) in goldband snapper captured at study sites in the Timor Sea in November 2009, March 2010 and November 2010. “Impacted” sites are in red and “reference” sites are in green. X denotes that no fish of this species were examined from this site. Numbers in columns denote the number of fish included in the analysis. Different letters above the columns denote significant difference (a = 0.05). ...................................................................................................... 49
Figure 29. EROD activity (pmol/ mg protein/ min) in red emperor captured at study sites in the Timor Sea in November 2009, March 2010 and November 2010. “Impacted” sites are in red and “reference” sites are in green. X denotes that no fish of this species were examined from this site. Numbers in columns denote the number of fish included in the analysis. Different letters above the columns denote significant difference (a = 0.05). ................................................................................................................................... 50
Figure 30. EROD activity (pmol/ mg protein/ min) in rainbow runner captured at study sites in the Timor Sea in November 2009, March 2010 and November 2010. “Impacted” sites are in red and “reference” sites are in green. X denotes that no fish of this species were examined from this site. Numbers in columns denote the number of fish included in the analysis. Different letters above the columns denote significant difference (a = 0.05). ................................................................................................................................... 50
Figure 31. EROD activity (pmol/ mg protein/ min) in Spanish mackerel captured at study sites in the Timor Sea in November 2009, March 2010 and November 2010. “Impacted” sites are in red and “reference” sites are in green. X denotes that no fish of this species were examined from this site. Numbers in columns denote the number of fish included in the analysis. Different letters above the columns denote significant difference (a = 0.05). ...................................................................................................... 51
Figure 32. Naphthalene type metabolite concentrations in the bile of goldband snapper captured at study sites in the Timor Sea in November 2009, March 2010 and November 2010. “Impacted” sites are in red and “reference” sites are in green. X denotes that no fish of this species were examined from this site. Numbers in columns denote the number of fish included in the analysis. Different letters above the columns denote significant difference (a = 0.05). ...................................................................................................... 52
Figure 33. Naphthalene type metabolite concentrations in the bile of red emperor captured at study sites in the Timor Sea in November 2009, March 2010 and November 2010. “Impacted” sites are in red and “reference” sites are in green. X denotes that no fish of this species were examined from this site. Numbers in columns denote the number of fish included in the analysis. Different letters above the columns denote significant difference (a = 0.05). ...................................................................................................... 53
Figure 34. Naphthalene type metabolite concentrations in the bile of rainbow runner captured at study sites in the Timor Sea in November 2009, March 2010 and November 2010. “Impacted” sites are in red and “reference” sites are in green. X denotes that no fish of this species were examined from this site. Numbers in columns denote the number of fish included in the analysis. Different letters above the columns denote significant difference (a = 0.05). ...................................................................................................... 53
Figure 35. Naphthalene type metabolite concentrations in the bile of Spanish mackerel captured at study sites in the Timor Sea in November 2009, March 2010 and November 2010. “Impacted” sites are in red and “reference” sites are in green. X denotes that no fish of this species were examined from this site. Numbers in columns denote the number of fish included in the analysis. Different letters above the columns denote significant difference (a = 0.05). ...................................................................................................... 54
Figure 36. Pyrene type metabolite concentrations in the bile of goldband snapper captured at study sites in the Timor Sea in November 2009, March 2010 and November 2010. “Impacted” sites are in red and “reference” sites are in green. X denotes that no fish of this species were examined from this site. Numbers in columns denote the number of fish included in the analysis. Different letters above the columns denote significant difference (a = 0.05). ...................................................................................................... 54
Figure 37. Pyrene type metabolite concentrations in the bile of red emperor captured at study sites in the Timor Sea in November 2009, March 2010 and November 2010. “Impacted” sites are in red and “reference” sites are in green. X denotes that no fish of this species were examined from this site. Numbers in columns denote the number of fish included in the analysis. Different letters above the columns denote significant difference (a = 0.05). ...................................................................................................... 55
Figure 38. Pyrene type metabolite concentrations in the bile of rainbow runner captured at study sites in the Timor Sea in November 2009, March 2010 and November 2010. “Impacted” sites are in red and “reference” sites are in green. X denotes that no fish of this species were examined from this site. Numbers in columns denote the number of fish included in the analysis. Different letters above the columns denote significant difference (a = 0.05). ...................................................................................................... 55

Page xiii
Montara Well Release Monitoring Study S4A // Assessment of Effects on Timor Sea Fish
Figure 39. Pyrene type metabolite concentrations in the bile of Spanish mackerel captured at study sites in the Timor Sea in November 2009, March 2010 and November 2010. “Impacted” sites are in red and “reference” sites are in green. X denotes that no fish of this species were examined from this site. Numbers in columns denote the number of fish included in the analysis. Different letters above the columns denote significant difference (a = 0.05). ...................................................................................................... 56
Figure 40. Benzo(a)pyrene type metabolite concentrations in the bile of goldband snapper captured at study sites in the Timor Sea in November 2009, March 2010 and November 2010. “Impacted” sites are in red and “reference” sites are in green. X denotes that no fish of this species were examined from this site. Numbers in columns denote the number of fish included in the analysis. Different letters above the columns denote significant difference (a = 0.05). ...................................................................................................... 56
Figure 41. Benzo(a)pyrene type metabolite concentrations in the bile of red emperor captured at study sites in the Timor Sea in November 2009, March 2010 and November 2010. “Impacted” sites are in red and “reference” sites are in green. X denotes that no fish of this species were examined from this site. Numbers in columns denote the number of fish included in the analysis. Different letters above the columns denote significant difference (a = 0.05). ...................................................................................................... 57
Figure 42. Benzo(a)pyrene type metabolite concentrations in the bile of rainbow runner captured at study sites in the Timor Sea in November 2009, March 2010 and November 2010. “Impacted” sites are in red and “reference” sites are in green. X denotes that no fish of this species were examined from this site. Numbers in columns denote the number of fish included in the analysis. Different letters above the columns denote significant difference (a = 0.05). ...................................................................................................... 57
Figure 43. Benzo(a)pyrene type metabolite concentrations in the bile of Spanish mackerel captured at study sites in the Timor Sea in November 2009, March 2010 and November 2010. “Impacted” sites are in red and “reference” sites are in green. X denotes that no fish of this species were examined from this site. Numbers in columns denote the number of fish included in the analysis. Different letters above the columns denote significant difference (a = 0.05). ...................................................................................................... 58
Figure 44. SDH activity in goldband snapper captured at study sites in the Timor Sea in November 2009, March 2010 and November 2010. “Impacted” sites are in red and “reference” sites are in green. X denotes that no fish of this species were examined from this site. Numbers in columns denote the number of fish included in the analysis. Different letters above the columns denote significant difference (a = 0.05). ...................................................................................................................................................... 59
Figure 45. SDH activity in red emperor captured at study sites in the Timor Sea in November 2009, March 2010 and November 2010. “Impacted” sites are in red and “reference” sites are in green. X denotes that no fish of this species were examined from this site. Numbers in columns denote the number of fish included in the analysis. Different letters above the columns denote significant difference (a = 0.05). ...................................................................................................................................................... 59
Figure 46. SDH activity in rainbow runner captured at study sites in the Timor Sea in November 2009, March 2010 and November 2010. “Impacted” sites are in red and “reference” sites are in green. X denotes that no fish of this species were examined from this site. Numbers in columns denote the number of fish included in the analysis. Different letters above the columns denote significant difference (a = 0.05). ...................................................................................................................................................... 60
Figure 47. SDH activity in Spanish mackerel captured at study sites in the Timor Sea in November 2009, March 2010 and November 2010. “Impacted” sites are in red and “reference” sites are in green. X denotes that no fish of this species were examined from this site. Numbers in columns denote the number of fish included in the analysis. Different letters above the columns denote significant difference (a = 0.05). ...................................................................................................................................................... 60
Figure 48. Oxidative DNA damage in goldband snapper captured at study sites in the Timor Sea in November 2009, March 2010 and November 2010. “Impacted” sites are in red and “reference” sites are in green. X denotes that no fish of this species were examined from this site. Numbers in columns denote the number of fish included in the analysis. Different letters above the columns denote significant difference (a = 0.05). ................................................................................................................................... 62
Figure 49. Oxidative DNA damage in red emperor captured at study sites in the Timor Sea in November 2009, March 2010 and November 2010. “Impacted” sites are in red and “reference” sites are in green. X denotes that no fish of this species were examined from this site. Numbers in columns denote the number of fish included in the analysis. Different letters above the columns denote significant difference (a = 0.05). ................................................................................................................................... 62
Page xiv
Montara Well Release Monitoring Study S4A // Assessment of Effects on Timor Sea Fish
Figure 50. Oxidative DNA damage in rainbow runner captured at study sites in the Timor Sea in November 2009, March 2010 and November 2010. “Impacted” sites are in red and “reference” sites are in green. X denotes that no fish of this species were examined from this site. Numbers in columns denote the number of fish included in the analysis. Different letters above the columns denote significant difference (a = 0.05). ................................................................................................................................... 63
Figure 51. Oxidative DNA damage in Spanish mackerel captured at study sites in the Timor Sea in November 2009, March 2010 and November 2010. “Impacted” sites are in red and “reference” sites are in green. X denotes that no fish of this species were examined from this site. Numbers in columns denote the number of fish included in the analysis. Different letters above the columns denote significant difference (a = 0.05). ................................................................................................................................... 63
Figure 52. PCA on normalised data for combined biomarkers across study sites for goldband snapper. Top: Phase I, Middle: Phase II, Bottom Phase III. Insert histogram represents cumulative contribution of PCs used in the analysis. Insert matrix shows significant differences between sites as identified by analysis of similarity (ANOSIM) Euclidean distance. ..................................................................................................................................... 65
Figure 53. PCA on normalised data for combined biomarkers across study sites for red emperor. Top: Phase I, Middle: Phase II, Bottom Phase III. Insert histogram represents cumulative contribution of PCs used in the analysis. Insert matrix shows significant differences between sites as identified by analysis of similarity (ANOSIM) Euclidean distance. ................................................................................................................ 66
Page xv
Montara Well Release Monitoring Study S4A // Assessment of Effects on Timor Sea Fish
List of TablesTable 1. Classification of physiological indices and biomarkers included in this study into indicators of exposure or effect. ........................................................................................................................................................... 3
Table 2. Details of S4A Phase II sampling sites. ........................................................................................................ 15
Table 3. Numbers of demersal fish from which stomach/intestine content and muscle for TPH analyses were collected during Phase I of the study. ................................................................................................................ 20
Table 4. Numbers of pelagic fish from which stomach/intestine content and muscle for TPH analyses were collected during Phase I of the study. ................................................................................................................ 20
Table 5. Numbers of demersal fish from which stomach/intestine content and muscle for TPH analyses and taint assessment were collected during Phase II of the study.......................................................................... 21
Table 6. Numbers of pelagic fish from which stomach/intestine content and muscle for TPH analyses and taint assessment were collected during Phase II of the study.......................................................................... 21
Table 7. Numbers of demersal fish from which stomach/intestine content and muscle for TPH analyses and taint assessment were collected during Phase III of the study......................................................................... 21
Table 8. Numbers of pelagic fish from which stomach/intestine content and muscle for TPH analyses and taint assessment were collected during Phase III of the study......................................................................... 22
Table 9. Diversity and number of each pelagic and demersal taxon captured during the November 2009 Phase I sampling effort. ....................................................................................................................................... 28
Table 10. Diversity and number of each taxon captured in demersal traps during the March 2010 sampling effort. .............................................................................................................................................................. 28
Table 11. Numbers of demersal fishes from which measurements and/or biopsies (serum, bile, liver and gonad samples) were collected for analysis during Phase I of the study. .............................................................. 29
Table 12. Numbers of pelagic fishes from which measurements and/or biopsies (serum, bile, liver and gonad samples) were collected for analysis during Phase I of the study. .............................................................. 29
Table 13. Numbers of demersal fishes from which measurements and/or biopsies (serum, bile, liver and gonad samples) were collected for analysis during Phase II of the study. ...................................................... 29
Table 14. Numbers of pelagic fishes from which measurements and/or biopsies (serum, bile, liver and gonad samples) were collected for analysis during Phase II of the study. ............................................................. 30
Table 15. Numbers of demersal fishes from which measurements and/or biopsies (serum, bile, liver and gonad samples) were collected for analysis during Phase III of the study. ..................................................... 30
Table 16. Numbers of pelagic fishes from which measurements and/or biopsies (serum, bile, liver and gonad samples) were collected for analysis during Phase III of the study. ............................................................ 30

Page xvi
Montara Well Release Monitoring Study S4A // Assessment of Effects on Timor Sea Fish
Page 1
Montara Well Release Monitoring Study S4A // Assessment of Effects on Timor Sea Fish
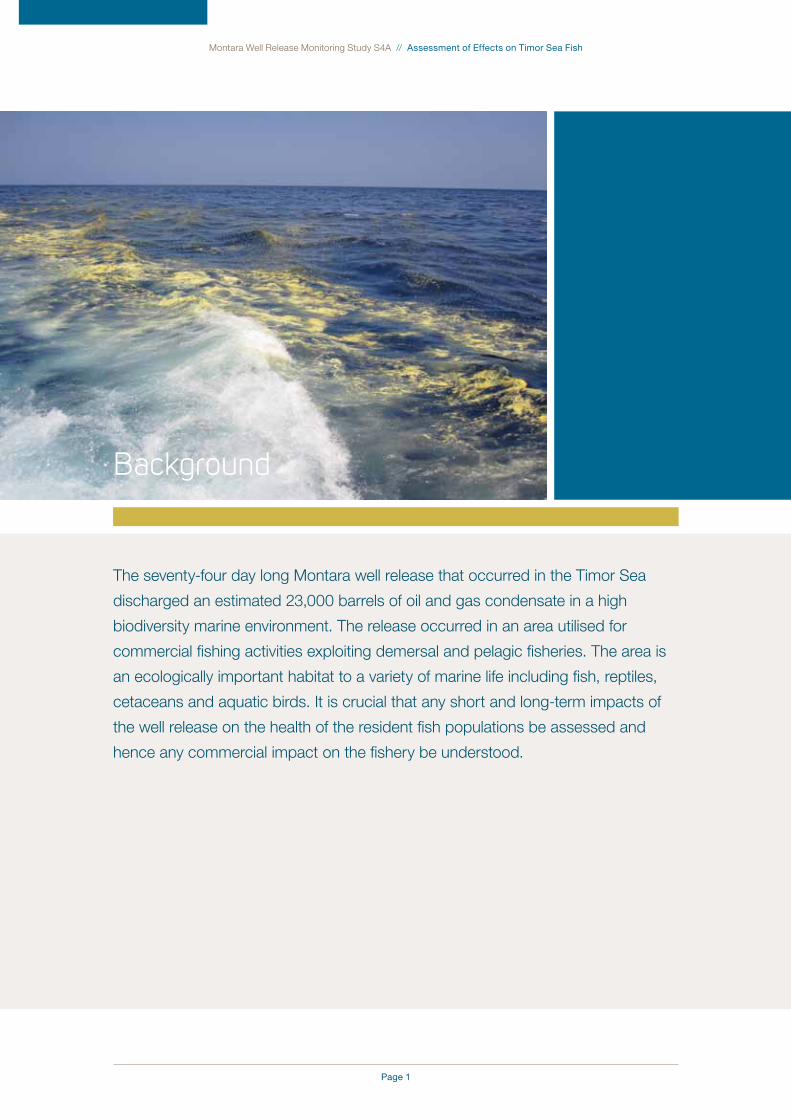
The seventy-four day long Montara well release that occurred in the Timor Sea
discharged an estimated 23,000 barrels of oil and gas condensate in a high
biodiversity marine environment. The release occurred in an area utilised for
commercial fishing activities exploiting demersal and pelagic fisheries. The area is
an ecologically important habitat to a variety of marine life including fish, reptiles,
cetaceans and aquatic birds. It is crucial that any short and long-term impacts of
the well release on the health of the resident fish populations be assessed and
hence any commercial impact on the fishery be understood.
Background
Page 2
Montara Well Release Monitoring Study S4A // Assessment of Effects on Timor Sea Fish
The presence of petroleum hydrocarbons in
the receiving marine environment or in the
food chain does not, by itself, indicate injurious
effects. In addition, deleterious effects on
populations are often difficult to detect in feral
organisms as many biologically relevant effects
tend to manifest themselves only after chronic,
sustained exposure to contaminants (van der
Oost et al., 2003). Because contaminant effects
initially occur at the molecular level, it is relevant
to use molecular, biochemical and histological
markers of exposure and effects as early warning
indicators of environmental harm. With sustained
exposure, effects at biochemical and cellular
levels will translate in effects at higher levels of
biological organisation. It is therefore pertinent
to complement biochemical and cellular markers
with physiological indices that will vary with
chronic, sustained exposure. No single biomarker
can provide a comprehensive assessment of the
health status of a fish population however, a suite
of biomarkers will inform on the exposure and
effects induced by the sustained assimilation of
contaminants by marine organisms.
Biomarkers of exposure and effect are currently the
most relevant and reliable tools for the assessment
of fish health. Biomarkers are measurements in
body fluids, cells or tissues indicating biochemical
or cellular modifications due to the presence of
toxicants. These include measuring the metabolites
of polycyclic aromatic hydrocarbons (PAHs) in
the bile of the fish (since PAHs are generally not
accumulated in fish muscle: van der Oost et al.,
2003; Meador et al., 1995), estimating the amount
of DNA damage that has occurred, measuring
the activity of liver detoxification enzymes, and
measuring liver integrity and cellular damage. In
addition, histological examination of the gonads
can give important information on whether the
reproductive state of the animal has been altered
as a result of exposure to the contaminants. Finally,
physiological parameters such as condition factor,
liver somatic index, and gonado-somatic index will
inform on the potential alteration of organs following
chronic exposure to petroleum hydrocarbons.
The measurement of a suite of biomarkers of fish
health is necessary as no single biomarker can
provide comprehensive information on the health
status of an organism. Amongst the biomarkers
listed above, it has been demonstrated that the
measurement of liver detoxification enzymes, of PAH
biliary metabolites, and of genotoxic parameters
such as DNA damage are currently the most
valuable and informative tools to in the evaluation of
environmental impacts (van der Oost et al., 2003).
Toxicological ConceptsAs higher organisms, fish integrate the direct and indirect effects of contaminant exposure and environmental variations. Their long life span, relative to most invertebrates, allows the integration of various natural and induced pressures, which reflects the integrated biological response and compensation mechanisms.
As no one single biological parameter can inform on the overall health status of an organism, a suite of biological parameters have to be measured. In this study on the health of fish potentially impacted by the Montara well release, a suite of physiological and biochemical parameters have been determined at different levels of biological organisation. Physiological parameters such as liver enlargement are usually associated with chronic exposure to bioavailable contaminants, while biochemical responses originating at the subcellular levels are used as sensitive early-warning indicators of toxicity.
Physiological ParametersAt the organism level, sustained (i.e. chronic) exposure can potentially results in modification of physiology, such as the lost or accumulation of lipid reserves, or hypo-/hypertrophy of specific organs. Simple physiological measurement of weight as related to the length of a fish provides a Condition Factor (CF), and can inform of the ‘fattiness’ of the fish. A low CF has been related in many laboratory and field studies to chronic chemical stress imposed on a fish.
Liver is a very plastic tissue and when an organism is assimilating and metabolising contaminants, the liver becomes enlarged in response to the increased metabolic demand imposed by the contaminants to metabolise. Consequently, the weight of the liver as a proportion of the total weight of the fish provides a Liver Somatic Index (LSI). A high LSI is often observed in relation to chronic exposure of fish to bioavailable contaminants.
Exposure to contaminants often results in a reduced ability of an individual to successfully reproduce, by inhibiting gonadal development, by affecting behaviour or via other mechanisms. A simple measure signifying normal or impaired gonadal development is the gonado-somatic index (GSI) calculated using the weight of the gonad as a proportion of the total weight of the fish. Similar GSI in fish exposed to contaminants, relative to fish collected in reference zones, is a first indication that gonad development is proceeding normally. It is prudent however, to complement this physiological index with histology of the gonads.
Page 3
Montara Well Release Monitoring Study S4A // Assessment of Effects on Timor Sea Fish
Histological examination of gonadal tissue can
provide important information on the reproductive
status of a fish. Where contamination occurs it
is possible that malformations can be observed
histologically, particularly where there is disruption
to the normal steroidal hormone function. Possible
malformations include the presence of female
tissue in a male gonad (or vice versa), halted
gamete production or delayed reproduction
as energy resources might be redirected to
contaminant metabolism in the stressed animal.
Biochemical Markers (Biomarkers)The use of biomonitoring methods in the
management of chemical pollution has several
advantages over chemical monitoring, as chemical
determination alone is not indicative of possible
adverse effects on an organism. To measure
biologically significant alterations related to
bioavailable chemicals, biochemical markers
(biomarkers) are measured in various organs.
Biomarkers measured in fish represent the best
tool available today to measure environmental
impacts related to industrial discharges to
the aquatic environment (van der Oost et al.,
2003), leading to the incorporation of biomarker
measurements in several large-scale monitoring
programmes such as NOAA’s National Status and
Trends Program and the North Sea Task Force
Monitoring Plan (Collier et al., 1995; Lam and Gray,
2003; van der Oost et al., 2003).
Biomarkers of exposure indicate that the organism
has been exposed to contaminants, but detection
of exposure is not necessarily related to adverse
biological consequences. Biomarkers of effect
are, however, indicators of biological responses
translating into pathological conditions for the
organisms.
The suite of biomarkers selected for the
present study were selected for their relevance
to petroleum exposure and are recognised
internationally as the most valuable fish biomarkers
for environmental risk assessment (van der Oost
et al., 2003). These biomarkers are:
Liver Detoxification EnzymesLiver detoxification enzymes are part of a
detoxification system found in most animals.
This enzymatic detoxification system has evolved
because organisms have had to deal with foreign
compounds since life began on Earth. Liver
detoxification enzymes are present with relatively
low activity in all animals; however, if the organism is
exposed to bioavailable xenobiotics, the enzymatic
activity increases significantly to enhance the
degradation through oxidation and clearance of the
offending chemicals. The enzymatic activity is highly
induced within days of exposure, and usually returns
to baseline levels within days (4 to 7 days) following
the disappearance of the contaminant source
(Gagnon and Holdway, 2000). In fish, detoxification
enzymatic activity is measured in the liver.
Of the large family of enzymes, ethoxyresorufin-O-
deethylase (EROD) activity is the most commonly
used enzyme to measure detoxification by the
liver. EROD activity is a biomarker of exposure
to xenobiotics.
Biliary MetabolitesSince the elimination of PAHs is generally very
efficient in fish, no long-term bioaccumulation
of these compounds has generally been
demonstrated. PAH tissue levels are, therefore, not
indicative of the levels to which the animals were
exposed and cannot be used as bioaccumulation
markers for exposure assessment (van der Oost
et al., 2003).
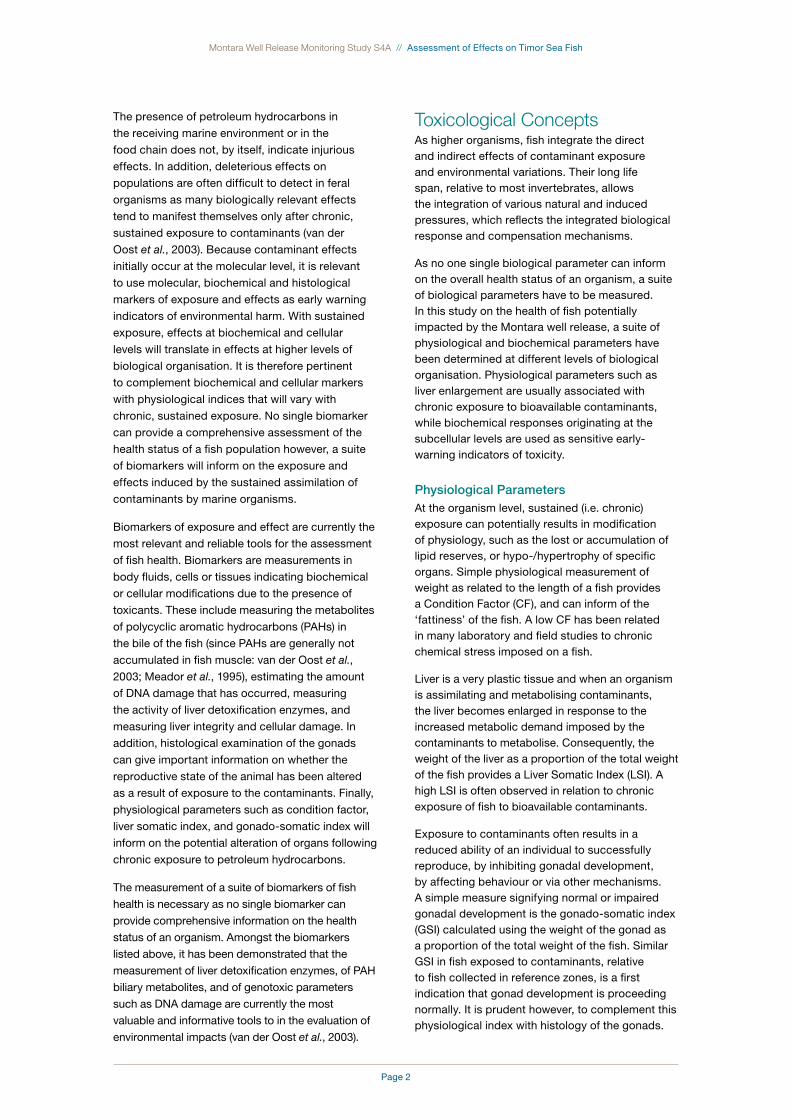
table 1. Classification of physiological indices and biomarkers included in this study into indicators of exposure or effect.
Indication
Parameter Organ Exposure Effect
Physiological Indices Condition Factor (CF) Body X
Liver Somatic Index (LSI) Liver X
Gonado-Somatic Index (GSI) Gonad X
Gonad Histology Gonad X
Biomarkers EROD activity Liver X
Biliary Metabolites Bile X
Sorbitol Dehydrogenase (SDH) activity
Liver X
Oxidative DNA damage Body1 X
1 Although oxidative DNA damage was measured in the bloodstream it can reflect damage that occurred in any organ of the body.
Page 4
Montara Well Release Monitoring Study S4A // Assessment of Effects on Timor Sea Fish
In order to assess the exposure of fish to
petroleum hydrocarbons, it is more appropriate
to determine PAH metabolite levels in the biliary
secretions, as PAH metabolites can accumulate in
the bile at levels 1000-fold more concentrated than
in the surrounding waters (Hellou and Payne, 1987;
Meador et al., 1995).
PAH bile metabolites result from the metabolism
of multi-ring compounds by the liver enzymes.
By metabolising PAHs to make them water-
soluble e.g. blood soluble, PAH metabolites are
re-directed to the biliary secretions for eventual
elimination out of the body via the intestinal route,
avoiding accumulation of these compounds in the
body. The appearance of metabolites in the bile is
slightly delayed relative to EROD activity induction;
therefore, the presence of biliary metabolites
reveals exposure of fish which occurred in the past
weeks (1-2 weeks; Gagnon and Holdway, 2000).
By collecting the biliary secretions, biliary PAH
metabolites can be quantified and their presence
can confirm exposure to petroleum hydrocarbons.
This biomarker is considered as an extremely
sensitive marker of exposure to petroleum
compounds.
Sorbitol Dehydrogenase (SDH)In the liver, sorbitol dehydrogenase (SDH) is
involved in the conversion of fructose to sorbitol.
Normally, SDH concentration is negligible in
the bloodstream, but its detection in the serum
indicates that hepatocytes have experienced
chemical injury causing cellular death and
consequently, the cytoplasmic content of liver cells
has been released to the bloodstream.
The detection of SDH activity in the bloodstream
is, therefore, a biomarker of effect. Fish livers with
cellular injuries related to xenobiotic exposure are
less capable of performing metabolic activities such
as contaminant processing (Holdway et al., 1994).
SDH activity is not affected by conditions such as
reproductive status which often are confounding
factors in the interpretation of other biomarkers.
Under xenobiotic stress an increase in SDH can be
identified in 3-7 days and can be maintained at an
increased level for a prolonged period.
Oxidative DNA DamageOxidative DNA damage is the result of the formation
of reactive oxygen species (ROS) in the body of
an animal which can be increased under exposure
to certain contaminants including metals and
PAHs (Valavanidis et al., 2009). These ROS are
able to react with particular DNA bases forming
adducts which can be removed by natural repair
mechanisms. However, where the amount of
oxidative damage done to the DNA exceeds the
capacity of natural repair mechanisms damaged
DNA molecules may lose the ability to trigger the
synthesis of functional enzymes, proteins and
hormones, affecting the entire homeostasy of the
organism and potentially challenging reproduction
and long term survival of an animal (Cooke et al.,
2003). Where an oxidative adduct is formed at
a particular base (guanine) the concentration
of the excretion of the excised adduct (8-oxo-
deoxyguanosine or 8-oxo-dG) can be measured as
a representation of the oxidative damage to DNA
which has occurred. Oxidative DNA damage is
classified as a biomarker of effect as it represents a
biologically relevant adverse effect on the organism.

Page 5
Montara Well Release Monitoring Study S4A // Assessment of Effects on Timor Sea Fish
• To describe any exposure of the commercially important Timor Sea demersal
and pelagic fishes to petroleum hydrocarbons.
• To evaluate if fish health, including reproductive health, is affected by exposure
to petroleum hydrocarbons.
• To investigate temporal variations in the biological responses of fish to
petroleum hydrocarbons following the control of the Montara well release.
Project Aims

Page 6
Montara Well Release Monitoring Study S4A // Assessment of Effects on Timor Sea Fish
Page 7
Montara Well Release Monitoring Study S4A // Assessment of Effects on Timor Sea Fish
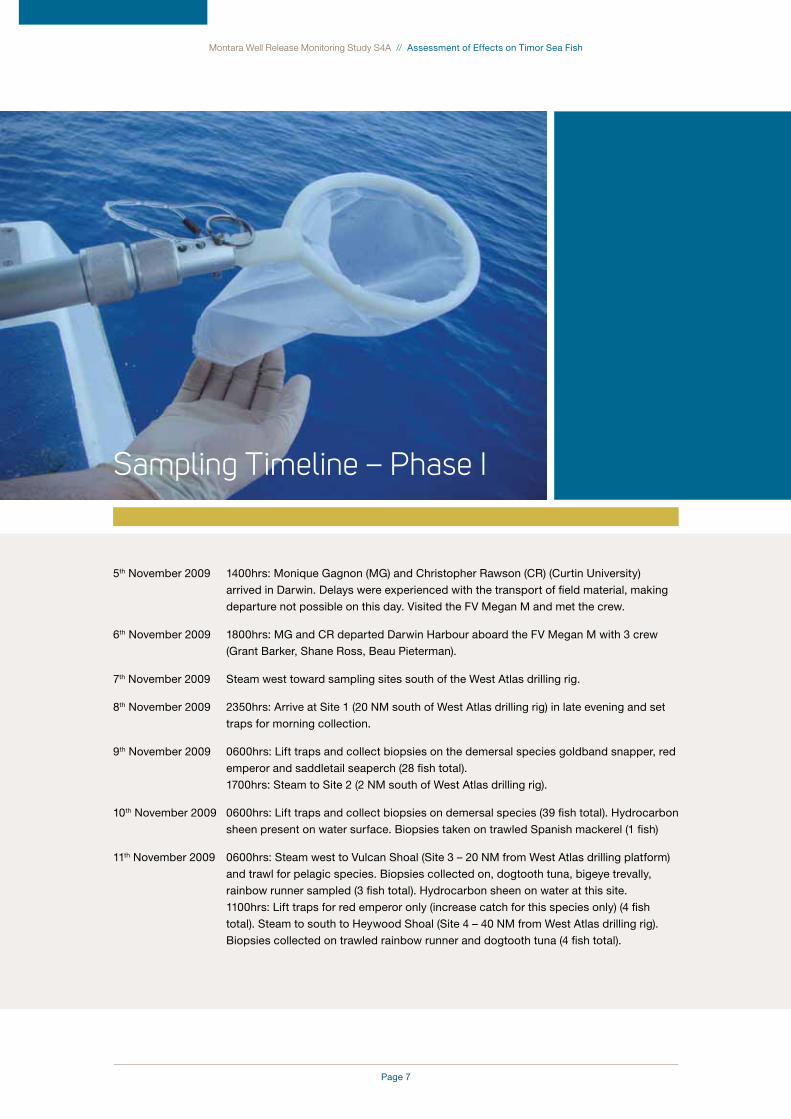
5th November 2009 1400hrs: Monique Gagnon (MG) and Christopher Rawson (CR) (Curtin University)
arrived in Darwin. Delays were experienced with the transport of field material, making
departure not possible on this day. Visited the FV Megan M and met the crew.
6th November 2009 1800hrs: MG and CR departed Darwin Harbour aboard the FV Megan M with 3 crew
(Grant Barker, Shane Ross, Beau Pieterman).
7th November 2009 Steam west toward sampling sites south of the West Atlas drilling rig.
8th November 2009 2350hrs: Arrive at Site 1 (20 NM south of West Atlas drilling rig) in late evening and set
traps for morning collection.
9th November 2009 0600hrs: Lift traps and collect biopsies on the demersal species goldband snapper, red
emperor and saddletail seaperch (28 fish total).
1700hrs: Steam to Site 2 (2 NM south of West Atlas drilling rig).
10th November 2009 0600hrs: Lift traps and collect biopsies on demersal species (39 fish total). Hydrocarbon
sheen present on water surface. Biopsies taken on trawled Spanish mackerel (1 fish)
11th November 2009 0600hrs: Steam west to Vulcan Shoal (Site 3 – 20 NM from West Atlas drilling platform)
and trawl for pelagic species. Biopsies collected on, dogtooth tuna, bigeye trevally,
rainbow runner sampled (3 fish total). Hydrocarbon sheen on water at this site.
1100hrs: Lift traps for red emperor only (increase catch for this species only) (4 fish
total). Steam to south to Heywood Shoal (Site 4 – 40 NM from West Atlas drilling rig).
Biopsies collected on trawled rainbow runner and dogtooth tuna (4 fish total).
Sampling Timeline – Phase I

Page 8
Montara Well Release Monitoring Study S4A // Assessment of Effects on Timor Sea Fish
12th November 2009 0600hrs: Trawl for pelagic species at Heywood Shoal (Site 4). Biopsies collected on
rainbow runner, Spanish mackerel and dogtooth tuna (13 fish total).
1200hrs: Traps lifted near Heywood Shoal (Site 4.1) and water samples taken. Biopsies
collected on Saddletail seaperch and red emperor (21 fish total).
Observations around Heywood Shoal of suspended brown particles and white to yellow
floating wax. Steam south to reference area around Browse Island.
Trawl for pelagics. Biopsies collected on rainbow runner (2 fish total).
13th November 2009 0630hrs: Traps set 6NM south-west of Browse Island and demersal samples taken on
goldband snapper and red emperor only (39 fish total).
1600hrs: Trawl for pelagic around Browse Island. Biopsies collected on rainbow runner
(1 fish total).
14th November 2009 0700hrs: Traps set for red emperor at 6 NM south-west of Browse Island. Biopsies
collected on red emperor (11 fish total).
Stream north to Echuca Shoal.
15th November 2009 0600hrs: Trawl for pelagics at Echuca Shoal (Site 6). Biopsies collected on rainbow
runner, narrow-barred Spanish mackerel, dogtooth tuna (11 fish total).
1300hrs: Traps set for additional red emperor. Biopsies collected on 2 red emperor.
16th November 2009 0630hrs: Trawl for pelagic at Echuca Shoal. Biopsies collected on rainbow runner and
Spanish mackerel (2 fish total).
0730hrs: Trap set for additional red emperor (1 fish total).
0930hrs: Steam north toward Site 1 and Site 2 for additional sampling.
2230hrs: Steam toward Darwin.
17th November 2009 Steaming toward Darwin.
18th November 2009 Steaming toward Darwin.
19th November 2009 0500hrs: Arrive Darwin Harbour.
1800hrs: Disembark FV Megan M.
Page 9
Montara Well Release Monitoring Study S4A // Assessment of Effects on Timor Sea Fish
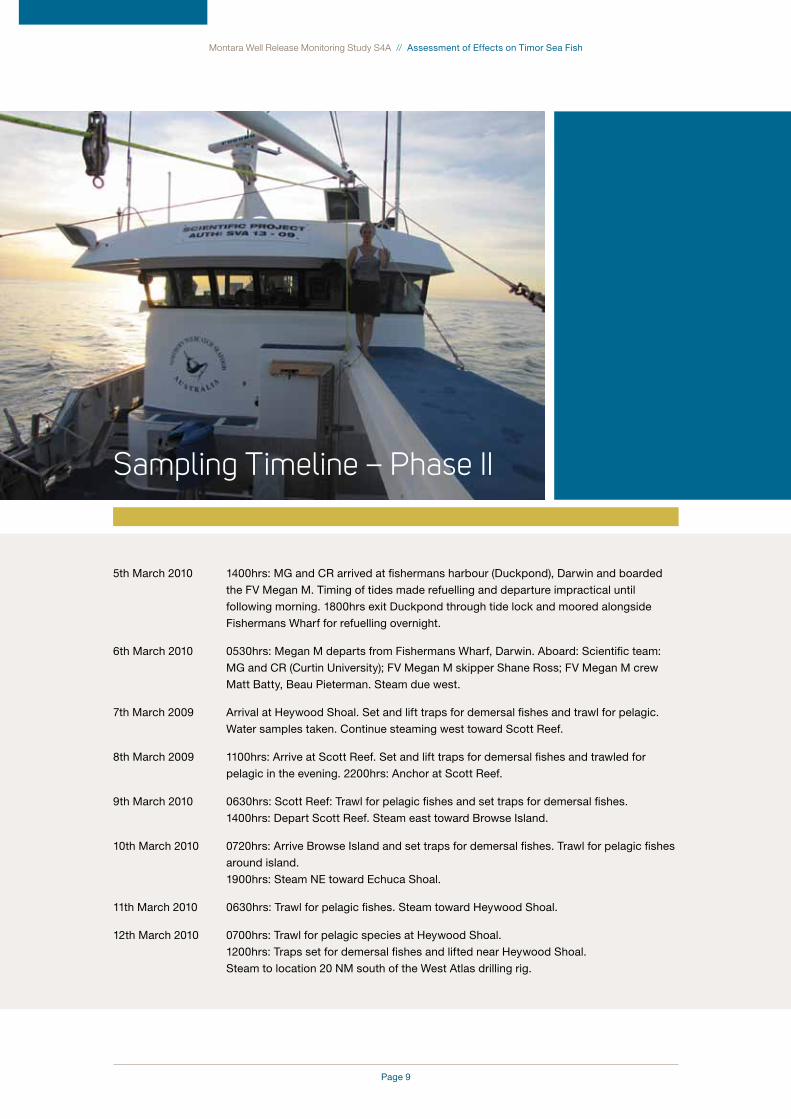
5th March 2010 1400hrs: MG and CR arrived at fishermans harbour (Duckpond), Darwin and boarded
the FV Megan M. Timing of tides made refuelling and departure impractical until
following morning. 1800hrs exit Duckpond through tide lock and moored alongside
Fishermans Wharf for refuelling overnight.
6th March 2010 0530hrs: Megan M departs from Fishermans Wharf, Darwin. Aboard: Scientific team:
MG and CR (Curtin University); FV Megan M skipper Shane Ross; FV Megan M crew
Matt Batty, Beau Pieterman. Steam due west.
7th March 2009 Arrival at Heywood Shoal. Set and lift traps for demersal fishes and trawl for pelagic.
Water samples taken. Continue steaming west toward Scott Reef.
8th March 2009 1100hrs: Arrive at Scott Reef. Set and lift traps for demersal fishes and trawled for
pelagic in the evening. 2200hrs: Anchor at Scott Reef.
9th March 2010 0630hrs: Scott Reef: Trawl for pelagic fishes and set traps for demersal fishes.
1400hrs: Depart Scott Reef. Steam east toward Browse Island.
10th March 2010 0720hrs: Arrive Browse Island and set traps for demersal fishes. Trawl for pelagic fishes
around island.
1900hrs: Steam NE toward Echuca Shoal.
11th March 2010 0630hrs: Trawl for pelagic fishes. Steam toward Heywood Shoal.
12th March 2010 0700hrs: Trawl for pelagic species at Heywood Shoal.
1200hrs: Traps set for demersal fishes and lifted near Heywood Shoal.
Steam to location 20 NM south of the West Atlas drilling rig.
Sampling Timeline – Phase II

Page 10
Montara Well Release Monitoring Study S4A // Assessment of Effects on Timor Sea Fish
13th March 2010 0630hrs: Traps set for demersal fishes 20 NM south of the West Atlas drilling platform.
1930hrs: Anchor 2NM from West Atlas rig.
14th March 2010 0700hrs: Traps set for demersal fishes at 0.5 – 2 NM from the West Atlas drilling rig.
15th March 2010 0600hrs: Traps set for demersal fishes and lifted. Completion of scientific collection.
1700hrs: Steam east toward Darwin.
16th March 2010 Steaming toward Darwin.
17th March 2010 Steaming toward Darwin.
2200hrs: Arrive Darwin.
18th March 2010 Enter Duckpond through tide lock and disembark FV Megan M.

Page 11
Montara Well Release Monitoring Study S4A // Assessment of Effects on Timor Sea Fish
7th November 2010 1300hrs: MG and CR (Curtin University) arrive in Darwin from Perth. 1350hrs: L. Cooper
arrives Darwin from Melbourne via Alice Springs. Travel to Duckpond to meet crew
(Shane Ross, Matt Badart, Mitch Seelander, Leif Cooper) of FV Megan M. Due to
mechanical alterations to Megan M departure is delayed.
8th November 2010 Due to mechanical alterations to Megan M departure is further delayed.
9th November 2010 1930hrs: Departure from Darwin harbour aboard Megan M.
10th November 2010 Steam west toward study sites.
11th November 2010 0200hrs: Arrive Site 8. 0700hrs begin trapping for fish sampling at Site 8. This site is in
the same location as a site sampled by WA fisheries in Jan 2010 (Study S4B). This site
was designated as Site 1 in study S4B. Steamed to next sampling site.
2200hrs: Arrived at Site 9.
12th November 2010 0700hrs: begin trapping for fish sampling at Site 9. This site is in the same location as a
site sampled by WA fisheries in Jan 2010 (Study S4B). This site was designated as Site
2 in study S4B.
1800hrs biopsy work completed and steam to next sampling site. Arrived 2300hrs.
13th November 2010 0700hrs – 1800 hrs: Grid sediment sampling around West Atlas drilling rig by Leeder
Consulting.
14th November 2010 0700hrs – 1800 hrs: Grid sediment sampling around West Atlas drilling rig by Leeder
Consulting.
Sampling Timeline – Phase III

Page 12
Montara Well Release Monitoring Study S4A // Assessment of Effects on Timor Sea Fish
15th November 2010 0700hrs – 1100 hrs: Grid sediment sampling around West Atlas drilling rig by Leeder
Consulting. :
0900hrs: set traps for fish sampling at site 2. Fish biopsy collection (Site 2). Steamed to
Site 1. 1800hrs: arrive Site 1.
16th November 2010 0700hrs: set traps for fish sampling (Site 1). Biopsy collection for demersal fish at this
site. 1700hrs: fish biopsy collection completed. Steam south toward Heywood Shoal.
17th November 2010 0200hrs: arrive Heywood Shoal. 0600hrs: commence trawling for pelagic fishes (Site 4).
1800hrs: anchor and line fish for demersals.
18th November 2010 0700hrs: set traps for demersal fish sampling at site 4 (Heywood Shoal). Biopsy
collection from demersal fish (Site 4). Steam toward Echuca Shoal.
19th November 2010 0100hrs: Arrive at Echuca Shoal. 0600hrs commence trawling for pelagic fishes. Biopsy
collection (Site 6) 1900hrs: steam toward Broome for refuel and crew changeover.
20th November 2010 Steam toward Broome.
21th November 2010 0930hrs: Arrive Broome and take on fuel and stores. Crew change Grant Barker
embarks, Mitchell Seelander, Leif Cooper disembark.
2030hrs: depart Broome. Steam toward Scott Reef.
22th November 2010 Steam toward Scott Reef.
23th November 2010 0300hrs: Arrive Scott Reef (Site 7). 0600hrs: Traps set for demersal fishes. 0700hrs:
Commence trawling for pelagic fish. Biopsy collection Site 7. 1900hrs anchor at
Scott Reef.
24th November 2010 0600hrs traps set for demersal fishes.
0700hrs Commence trawling for pelagic fishes. Collection of biopsies throughout the
day as fish are captured.
1800 depart Scott Reef and steam toward Browse Island.
25th November 2010 0400hrs: Arrive Browse Island (Site 5).
0700hrs set traps for demersal fishes. Biopsy collection from demersal fish (Site 5).
Steam toward Echuca Shoal.
26th November 2010 0100hrs: arrive at Echuca shoal (Site 6). 0600hrs commence trawling for pelagic fishes.
Biopsy collection (Site 6). Steam toward Heywood Shoal.
2300hrs: arrive Heywood Shoal.
27th November 2010 0600hrs: commence trawling for pelagic fishes. Biopsy collection (Site 4). Steam toward
the West Atlas rig (Site 2).
28th November 2010 0400hrs: arrive Site 2. 0600hrs set traps for demersal fish collection. Biopsy collection
(Site 2). 1200hrs: Steam toward Site 1 (20 NM from rig).
1400hrs set traps for demersal fish collection. Simultaneous biopsy collection at Site 1.
2340hrs. Completion of biopsy collection. Steam toward Darwin.
29th November 2010 Steam toward Darwin.
30th November 2010 Steam toward Darwin. 2300 hrs: arrive Darwin.
1st December 2010 Disembark FV Megan M.
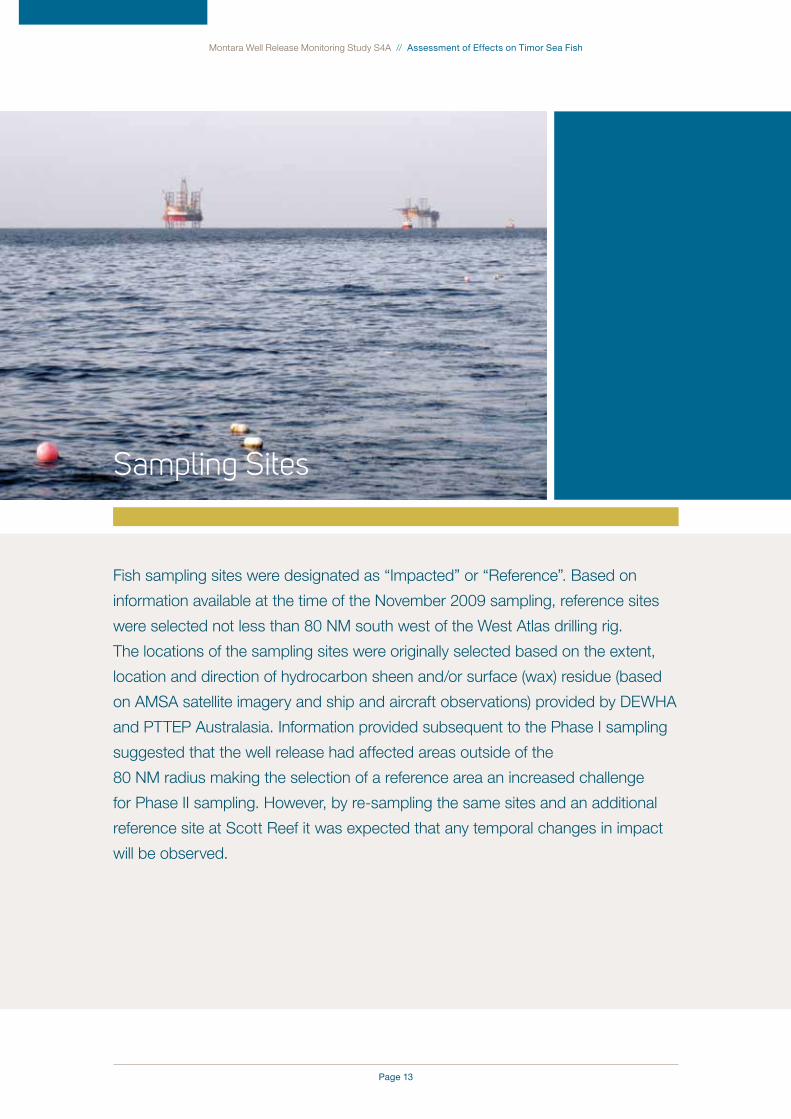
Page 13
Montara Well Release Monitoring Study S4A // Assessment of Effects on Timor Sea Fish
Fish sampling sites were designated as “Impacted” or “Reference”. Based on
information available at the time of the November 2009 sampling, reference sites
were selected not less than 80 NM south west of the West Atlas drilling rig.
The locations of the sampling sites were originally selected based on the extent,
location and direction of hydrocarbon sheen and/or surface (wax) residue (based
on AMSA satellite imagery and ship and aircraft observations) provided by DEWHA
and PTTEP Australasia. Information provided subsequent to the Phase I sampling
suggested that the well release had affected areas outside of the
80 NM radius making the selection of a reference area an increased challenge
for Phase II sampling. However, by re-sampling the same sites and an additional
reference site at Scott Reef it was expected that any temporal changes in impact
will be observed.
Sampling Sites

Page 14
Montara Well Release Monitoring Study S4A // Assessment of Effects on Timor Sea Fish
Between the Phase I and II sampling events a
collection of red emperor and goldband snapper
was made by WA Fisheries in a parallel study as
part of the Montara Monitoring Program. This
study utilised two of the impacted sites sampled
during Phases I and II of Study S4A (Sites 1 and
2) and selected 2 reference sites 75 and 54 NM to
the north-east of the West Atlas drilling rig (Sites
8 and 9 respectively). These additional sites were
therefore added to the sampling program for Study
S4A Phase III. These sites were within 80 NM of
the rig but had been previously designated as
reference by the Department of Fisheries Western
Australia so remained “reference” sites for these
studies. Site 3 was not re-sampled during Phase
II and Phase III due to the lack of habitat for the
target species and consequently, the absence of
fish at this site.!
!
Figure 1. Map showing the location of the West Atlas drilling rig and the sampling sites. Concentric rings represent 20, 80 and 150 NM from the platform. Sites 1, 2, 3 and 4 were designated as impacted sites and Sites 5 and 6 were designated as reference sites in Phase I sampling. Site 7 is located at Scott Reef. Surface samples are plankton net trawls collecting observed floating material.
Figure 1. Map showing the location of the West Atlas drilling rig and the sampling sites. Concentric rings represent 20, 80 and 150 NM from the platform. Sites 1, 2, 3 and 4 were designated as impacted sites and Sites 5 and 6 were designated as reference sites in Phase I sampling. Site 7 is located at Scott Reef. Surface samples are plankton net trawls collecting observed floating material.
Further, sites were selected based on water depth
(shallow reef <30m, or deep sea > 70m) and sea
floor structure (hard or soft bottom) which allowed
for the reasonable expectation of consistency of
catch diversity and number of fish. Sites 1, 2, 3 and
4 were located within the impacted area, Sites 5
and 6 were located within the reference area and
Site 7 was located at Scott Reef (also a reference
site). Sites 1, 2 were deep sea sites where
demersal fishes were targeted and Sites 3, 4, and
6 were shallow reef sites where pelagic fishes were
targeted. Site 5 incorporated shallow reef around
Browse Island and a nearby deep sea site.
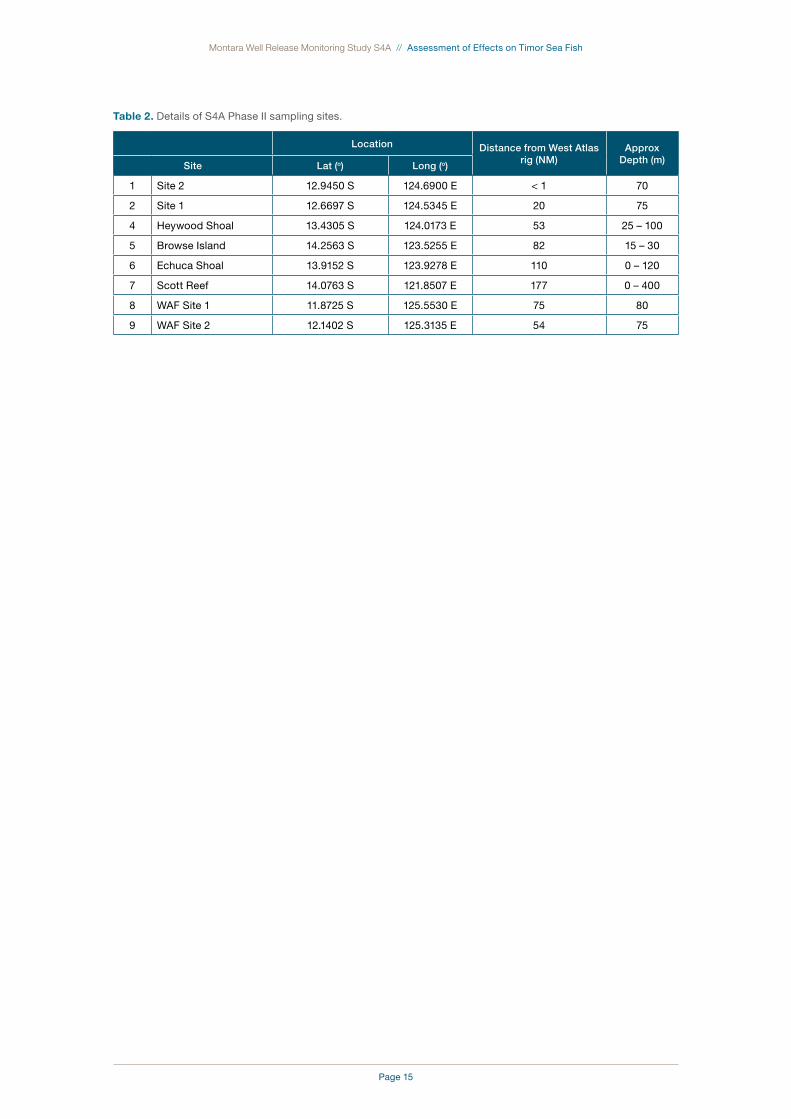
Page 15
Montara Well Release Monitoring Study S4A // Assessment of Effects on Timor Sea Fish
table 2. Details of S4A Phase II sampling sites.
Location Distance from West Atlas rig (NM)
Approx Depth (m)
Site Lat (o) Long (o)
1 Site 2 12.9450 S 124.6900 E < 1 70
2 Site 1 12.6697 S 124.5345 E 20 75
4 Heywood Shoal 13.4305 S 124.0173 E 53 25 – 100
5 Browse Island 14.2563 S 123.5255 E 82 15 – 30
6 Echuca Shoal 13.9152 S 123.9278 E 110 0 – 120
7 Scott Reef 14.0763 S 121.8507 E 177 0 – 400
8 WAF Site 1 11.8725 S 125.5530 E 75 80
9 WAF Site 2 12.1402 S 125.3135 E 54 75

Page 16
Montara Well Release Monitoring Study S4A // Assessment of Effects on Timor Sea Fish

Page 17
Montara Well Release Monitoring Study S4A // Assessment of Effects on Timor Sea Fish
Fish SamplingThe methods of fish capture were similar in all phases of the investigation. Demersal
fishes were collected from 70-120m depth using baited stainless steel fish traps
(sampling at Scott Reef was at around 40m since the reef has no suitable fishing
grounds at the above preferred depth). The traps were dropped at the sampling
locations and left for between 1 and 12 hours. Two demersal species were
targeted: goldband snapper (Pristipomoides multidens) and red emperor (Lutjanus
sebae). The depth and bottom characteristics at Scott Reef were not suitable
habitat for these species and none were collected in the traps set at this site.
The predominant species captured at this site was the longnose emperor (Lethrinus
olivaceus). Biopsies were therefore collected on this species at this site but not
analysed as this species has not been captured at other sites. Pelagic fishes
were captured by trawling 3 single lure lines behind the fishing vessel travelling at
low speed across shallow (< 20 m) shoals. It was hoped that Spanish mackerel
(Scomberomorus commerson) could be used as a bioindicator but, given the low
number of individuals collected, it was decided to focus on the rainbow runner
(Elegatis bipinnulata) which was captured in larger numbers. Despite the low
number of individuals captured during the various sampling phases, results for both
Spanish mackerel and rainbow runner are presented in this report.
Field Methodology

Page 18
Montara Well Release Monitoring Study S4A // Assessment of Effects on Timor Sea Fish
Figure 2. Method of demersal fish capture. Baited steel fish trap prior to deployment. In picture: Matthew Badart (left) and Beau Pieterman (right).
Figure 3. Left: flow-through live tank used to preserve the fish in good condition following capture; right: fish were initially measured and weighed prior to sacrifice.
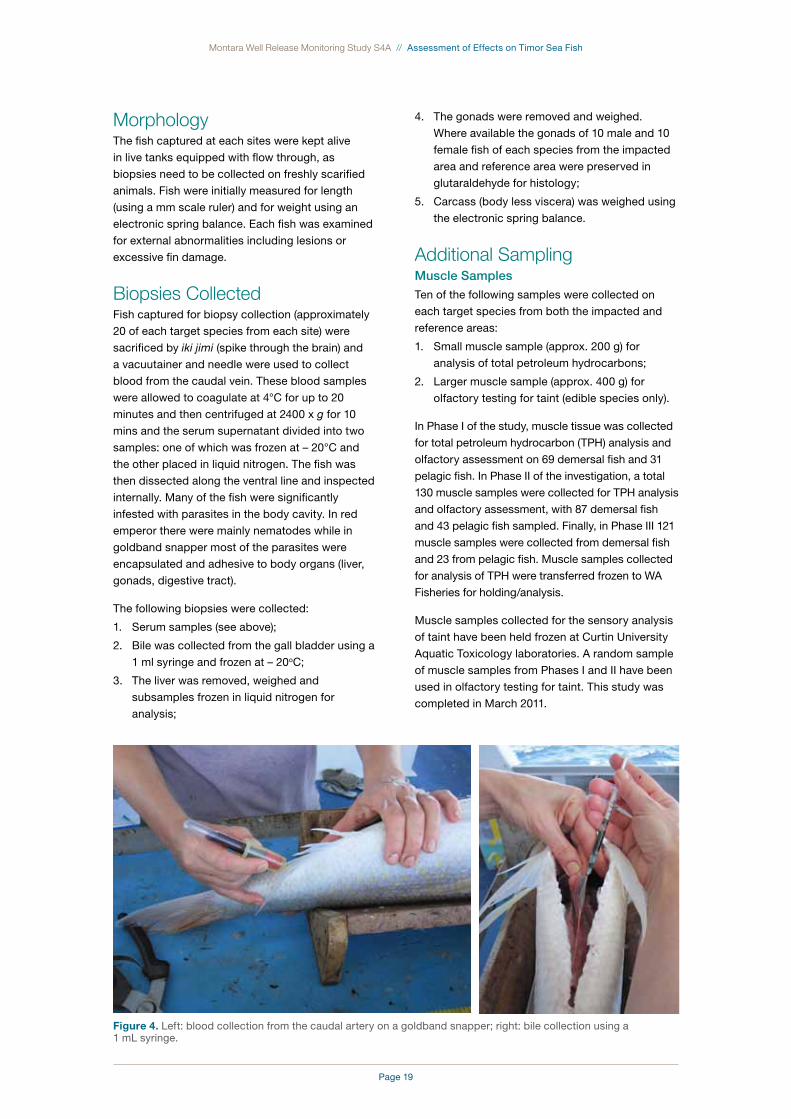
Page 19
Montara Well Release Monitoring Study S4A // Assessment of Effects on Timor Sea Fish
MorphologyThe fish captured at each sites were kept alive
in live tanks equipped with flow through, as
biopsies need to be collected on freshly scarified
animals. Fish were initially measured for length
(using a mm scale ruler) and for weight using an
electronic spring balance. Each fish was examined
for external abnormalities including lesions or
excessive fin damage.
Biopsies CollectedFish captured for biopsy collection (approximately
20 of each target species from each site) were
sacrificed by iki jimi (spike through the brain) and
a vacuutainer and needle were used to collect
blood from the caudal vein. These blood samples
were allowed to coagulate at 4°C for up to 20
minutes and then centrifuged at 2400 x g for 10
mins and the serum supernatant divided into two
samples: one of which was frozen at – 20°C and
the other placed in liquid nitrogen. The fish was
then dissected along the ventral line and inspected
internally. Many of the fish were significantly
infested with parasites in the body cavity. In red
emperor there were mainly nematodes while in
goldband snapper most of the parasites were
encapsulated and adhesive to body organs (liver,
gonads, digestive tract).
The following biopsies were collected:
1. Serum samples (see above);
2. Bile was collected from the gall bladder using a
1 ml syringe and frozen at – 20oC;
3. The liver was removed, weighed and
subsamples frozen in liquid nitrogen for
analysis;
4. The gonads were removed and weighed.
Where available the gonads of 10 male and 10
female fish of each species from the impacted
area and reference area were preserved in
glutaraldehyde for histology;
5. Carcass (body less viscera) was weighed using
the electronic spring balance.
Additional SamplingMuscle SamplesTen of the following samples were collected on
each target species from both the impacted and
reference areas:
1. Small muscle sample (approx. 200 g) for
analysis of total petroleum hydrocarbons;
2. Larger muscle sample (approx. 400 g) for
olfactory testing for taint (edible species only).
In Phase I of the study, muscle tissue was collected
for total petroleum hydrocarbon (TPH) analysis and
olfactory assessment on 69 demersal fish and 31
pelagic fish. In Phase II of the investigation, a total
130 muscle samples were collected for TPH analysis
and olfactory assessment, with 87 demersal fish
and 43 pelagic fish sampled. Finally, in Phase III 121
muscle samples were collected from demersal fish
and 23 from pelagic fish. Muscle samples collected
for analysis of TPH were transferred frozen to WA
Fisheries for holding/analysis.
Muscle samples collected for the sensory analysis
of taint have been held frozen at Curtin University
Aquatic Toxicology laboratories. A random sample
of muscle samples from Phases I and II have been
used in olfactory testing for taint. This study was
completed in March 2011.
Figure 4. Left: blood collection from the caudal artery on a goldband snapper; right: bile collection using a 1 mL syringe.
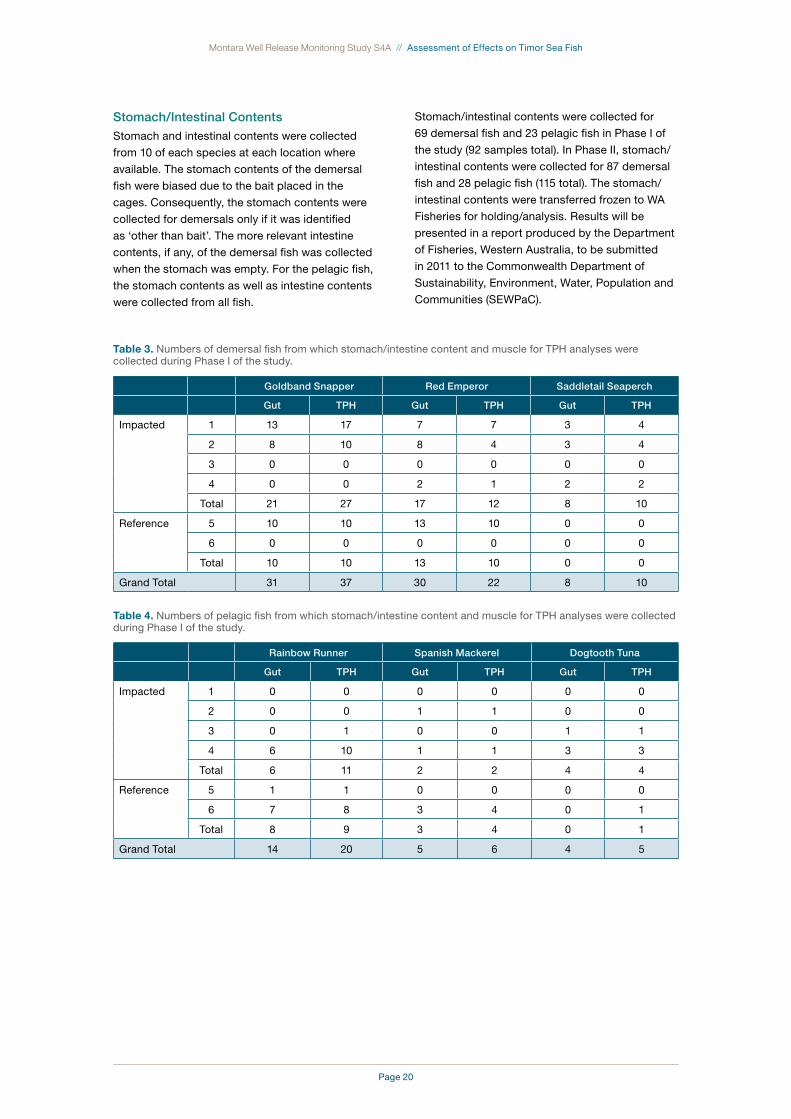
Page 20
Montara Well Release Monitoring Study S4A // Assessment of Effects on Timor Sea Fish
Stomach/Intestinal ContentsStomach and intestinal contents were collected
from 10 of each species at each location where
available. The stomach contents of the demersal
fish were biased due to the bait placed in the
cages. Consequently, the stomach contents were
collected for demersals only if it was identified
as ‘other than bait’. The more relevant intestine
contents, if any, of the demersal fish was collected
when the stomach was empty. For the pelagic fish,
the stomach contents as well as intestine contents
were collected from all fish.
Stomach/intestinal contents were collected for
69 demersal fish and 23 pelagic fish in Phase I of
the study (92 samples total). In Phase II, stomach/
intestinal contents were collected for 87 demersal
fish and 28 pelagic fish (115 total). The stomach/
intestinal contents were transferred frozen to WA
Fisheries for holding/analysis. Results will be
presented in a report produced by the Department
of Fisheries, Western Australia, to be submitted
in 2011 to the Commonwealth Department of
Sustainability, Environment, Water, Population and
Communities (SEWPaC).
table 3. Numbers of demersal fish from which stomach/intestine content and muscle for TPH analyses were collected during Phase I of the study.
Goldband Snapper Red Emperor Saddletail Seaperch
Gut TPH Gut TPH Gut TPH
Impacted 1 13 17 7 7 3 4
2 8 10 8 4 3 4
3 0 0 0 0 0 0
4 0 0 2 1 2 2
Total 21 27 17 12 8 10
Reference 5 10 10 13 10 0 0
6 0 0 0 0 0 0
Total 10 10 13 10 0 0
Grand Total 31 37 30 22 8 10
table 4. Numbers of pelagic fish from which stomach/intestine content and muscle for TPH analyses were collected during Phase I of the study.
Rainbow Runner Spanish Mackerel Dogtooth Tuna
Gut TPH Gut TPH Gut TPH
Impacted 1 0 0 0 0 0 0
2 0 0 1 1 0 0
3 0 1 0 0 1 1
4 6 10 1 1 3 3
Total 6 11 2 2 4 4
Reference 5 1 1 0 0 0 0
6 7 8 3 4 0 1
Total 8 9 3 4 0 1
Grand Total 14 20 5 6 4 5
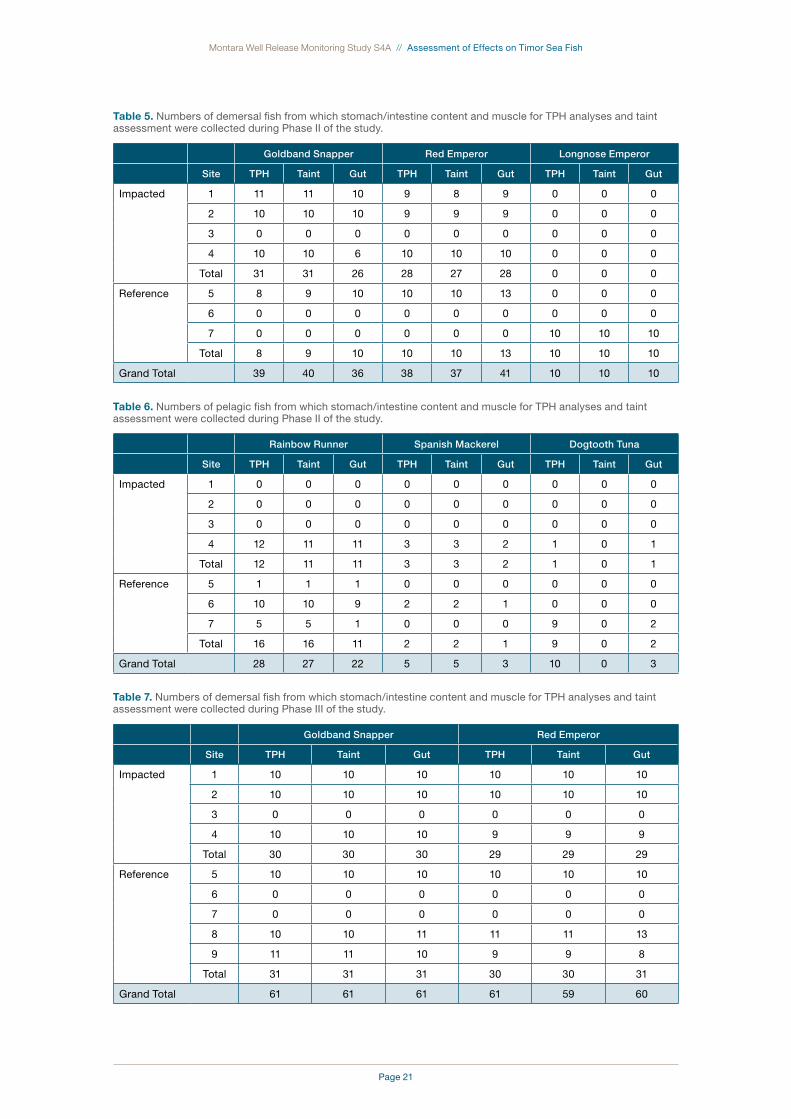
Page 21
Montara Well Release Monitoring Study S4A // Assessment of Effects on Timor Sea Fish
table 5. Numbers of demersal fish from which stomach/intestine content and muscle for TPH analyses and taint assessment were collected during Phase II of the study.
Goldband Snapper Red Emperor Longnose Emperor
Site TPH Taint Gut TPH Taint Gut TPH Taint Gut
Impacted 1 11 11 10 9 8 9 0 0 0
2 10 10 10 9 9 9 0 0 0
3 0 0 0 0 0 0 0 0 0
4 10 10 6 10 10 10 0 0 0
Total 31 31 26 28 27 28 0 0 0
Reference 5 8 9 10 10 10 13 0 0 0
6 0 0 0 0 0 0 0 0 0
7 0 0 0 0 0 0 10 10 10
Total 8 9 10 10 10 13 10 10 10
Grand Total 39 40 36 38 37 41 10 10 10
table 6. Numbers of pelagic fish from which stomach/intestine content and muscle for TPH analyses and taint assessment were collected during Phase II of the study.
Rainbow Runner Spanish Mackerel Dogtooth Tuna
Site TPH Taint Gut TPH Taint Gut TPH Taint Gut
Impacted 1 0 0 0 0 0 0 0 0 0
2 0 0 0 0 0 0 0 0 0
3 0 0 0 0 0 0 0 0 0
4 12 11 11 3 3 2 1 0 1
Total 12 11 11 3 3 2 1 0 1
Reference 5 1 1 1 0 0 0 0 0 0
6 10 10 9 2 2 1 0 0 0
7 5 5 1 0 0 0 9 0 2
Total 16 16 11 2 2 1 9 0 2
Grand Total 28 27 22 5 5 3 10 0 3
table 7. Numbers of demersal fish from which stomach/intestine content and muscle for TPH analyses and taint assessment were collected during Phase III of the study.
Goldband Snapper Red Emperor
Site TPH Taint Gut TPH Taint Gut
Impacted 1 10 10 10 10 10 10
2 10 10 10 10 10 10
3 0 0 0 0 0 0
4 10 10 10 9 9 9
Total 30 30 30 29 29 29
Reference 5 10 10 10 10 10 10
6 0 0 0 0 0 0
7 0 0 0 0 0 0
8 10 10 11 11 11 13
9 11 11 10 9 9 8
Total 31 31 31 30 30 31
Grand Total 61 61 61 61 59 60

Page 22
Montara Well Release Monitoring Study S4A // Assessment of Effects on Timor Sea Fish
table 8. Numbers of pelagic fish from which stomach/intestine content and muscle for TPH analyses and taint assessment were collected during Phase III of the study.
Rainbow Runner Spanish Mackerel
Site TPH Taint Gut TPH Taint Gut
Impacted 1 0 0 0 0 0 0
2 0 0 0 0 0 0
3 0 0 0 0 0 0
4 3 3 3 13 13 10
Total 3 3 3 13 13 10
Reference 5 0 0 0 0 0 0
6 0 0 0 4 4 3
7 3 3 3 0 0 0
8 0 0 0 0 0 0
9 0 0 0 0 0 0
Total 3 3 3 4 4 3
Grand Total 6 6 6 17 17 17
Floating Material SamplesThe presence of floating residues possibly related
to oil weathering has been reported, and concerns
were raised that the fish may mistakenly confuse
the residues for food. Floating material was sighted
and collected only in Phase III. Floating material
was collected using the preferred method of a
Teflon net attached to a long sampling pole and
preserved for analysis. Samples of floating material
collected were frozen and transported to Leeder
Consulting, Melbourne.
Traces of fatty acids found in some floating
material samples, and these fatty acids have been
identified as being of biogenic origin. In November
2009, two samples returned positive identification
of weathered crude oil. No hydrocarbons of
petroleum origin were identified in other samples.
Results are presented in Appendix E.
Water SamplesWater samples were collected at each of the fish
collection sites and whenever surface residues
were observed during Phase I and Phase II and sent
to Leeder Consulting (Melbourne). Collections were
made using a stainless steel bomb sampler (a van
Dorne type sampling device necessary for water
analysis if the presence of petroleum hydrocarbons
is suspected) at the surface and at depths of 1, 3,
5, 10, and 15 m. No petroleum hydrocarbons have
been identified in any of the samples. Results are
presented in Appendix E.
Sediment SamplesSediment was collected during Phase III using
standard dredge grab sampling techniques.
Surface sediment samples were collected over a
2km x 2km grid covering an 8-km radius around
the location of the West Atlas rig. Sediment grabs
were also collected at each of the locations where
fish sampling occur. A small (3 kg) dredge sampler
was lowered on a rope until it hit the bottom
where a spring loaded trigger mechanism closed
the mouth of the dredge. The winch on board
the Megan M was used to raise the dredge onto
the boat where the dredge was opened and the
contents removed into a rinsed glass sample jar.
These jars were refrigerated prior to transport for
analysis. Hydrocarbons of petroleum origin could
not be found in any of the 57 sediment samples
collected. Results are presented in Appendix F.

Page 23
Montara Well Release Monitoring Study S4A // Assessment of Effects on Timor Sea Fish
Physiological ParametersThe condition factor (k) of the fish was calculated as:
k = x 106Wg
Lf3
where Wg is the gutted weight of the fish and Lf is
the fork length. Condition factor gives an indication
of the health status, or ‘fattiness’ of the animal.
The liver somatic index (LSI) was calculated as:
LSI = x 100WL
Wg
where WL is the liver weight, and gives an indication
of the size of the liver relative to the body size.
Similarly the gonado-somatic index (GSI) was
calculated as:
GSI = x 100WG
Wg
where WG is the weight of the gonad. GSI is a
measure of the fish’s reproductive investment.
Laboratory Methods
Liver Detoxification Enzymes (EROD Activity)In the laboratory, a liver homogenate is
centrifuged to isolate the microsomes containing
the detoxification enzymes. These microsomes
are then required to metabolise a model
contaminant: ethoxyresorufin. The enzyme
metabolising ethoxyresorufin is therefore
named ‘ethoxyresorufin-O-deethylase’ (EROD).
The metabolism of ethoxyresorufin by EROD
enzyme activity results in a fluorescent product,
resorufin, which can be measured by fluorimetry
at excitation wavelength 530 nm and emission
wavelength 585 nm (Hodson et al., 1991). A higher
fluorescence indicates an increased abundance
of enzyme that results from the fish assimilating
and metabolising high levels of contaminants.
The enzyme activity is reported by unit of
protein in the isolated microsome fraction, which
normalizes the data according to the protein
density in the liver tissue.
Page 24
Montara Well Release Monitoring Study S4A // Assessment of Effects on Timor Sea Fish
Biliary MetabolitesAfter being processed by liver detoxification
enzymes, metabolites are predominantly
eliminated via the bile. However, the bile turnover
and by consequence the concentration of
biliary metabolites is influenced by food intake.
Therefore, this biomarker is relevant for recent
(weeks) exposure to xenobiotics. The bile of
the fish was collected using a 1 ml syringe, and
immediately frozen in liquid nitrogen until biliary
metabolites determination by fixed-wavelength
fluorescence (FF) measurement (Lin et al., 1996).
The method is semi-quantitative, and reports
metabolised PAHs as ‘type of metabolites’. The
expression ‘type of metabolites’ refers to the
various aromatic compounds, most occurring
as conjugated metabolites of PAHs, that are
measured in the bile at naphthalene-, pyrene-,
or benzo(a)pyrene – (B(a)P-) specific excitation/
emission wavelengths. Fluorescent readings were
performed for naphthalene-type metabolites at
excitation/emission 290/335 nm using 1-naphthol
(Sigma) as a reference standard. For pyrene-
type metabolites and B(a)P-type metabolites,
readings were made using 1-hydroxy pyrene
(1-OH pyrene) as a reference standard at 340/380
nm and 380/430 nm for pyrene – and B(a)P-type
metabolites, respectively. Naphthalene-type
metabolites are reported in mg of 1-naphthol
fluorescence units equivalent per mg biliary
protein, and pyrene – and B(a)P-type metabolites
are reported in µg of 1-OH pyrene fluorescence
units equivalent per mg biliary protein. Therefore,
the biliary metabolite levels observed represent
fluorescence-equivalents of PAH metabolites used
as standard.
Sorbitol Dehydrogenase (SDH) ActivityA blood collection was performed via the caudal
artery using a vacuutainer. The blood was allowed
to clot on ice for 15 minutes after which it was
centrifuged in a refrigerated centrifuge at 3000 g for
10 minutes. The serum was immediately collected
and frozen at – 80°C until analysis of SDH activity.
The quantitation of SDH activity was determined by
the reduction in light absorbance at 340 nm over
time. SDH activity is reported in milli-International
Units (mIU), with one U of an enzyme being defined
as the amount of this enzyme which will convert
1 µmol of substrate to product, per minute.
Oxidative DNA Damage (Serum 8-oxo-dG Concentration)The concentration of the oxidative stress
biomarker 8-oxo-7,8-dihydro-2’-deoxyguanosine
(8-oxo-dG) in the serum samples was measured
using a commercially available enzyme linked
immunosorbent assay (ELISA) kit (Trevigen). Briefly,
serum samples were diluted (1:5) with the diluent
supplied with the kit and a supplied 8-oxo-dG
standard was diluted to create a standard curve
(0.94 – 60 ng L-1). These were added to a 96 well
microplate which was pre-coated with 8-oxo-dG
with an 8-oxo-dG monoclonal antibody. After 1
hour incubation the plate was washed 6 times
(Bio-Rad plate washer) and a secondary antibody
(horseradish peroxidase conjugate) was introduced.
After a further 1 hour incubation the plate was
again washed (6 times) and the plate developed
with a trimethylbenzine (TMB) substrate and the
absorbance (450 nm) was measured (Bio-Rad plate
reader) after addition of an acidic stop solution.
The intensity of the colour was inversely related to
the amount of 8-oxo-dG in the sample or standard.
These were standardised against the protein
content of each serum sample (Lowry et al., 1951).
Gonad HistologyPreserved (glutaraldehyde) male and female
gonads were washed and transferred to a 50%
ethanol solution for longer term storage. The
samples sectioned into 10 mm cross-sections
which were further dehydrated by progressively
increasing the ethanol concentration over four
hours. They were then cleared in xylene for a
further three hours before embedding in paraffin
wax overnight. These samples were placed in
paraffin wax blocks for sectioning (5 µm) using
a microtome. These sections were fixed to
glass slides and gently heated overnight prior to
staining. The slides were stained (Haematoxylin
– Eosin) using standard methods (Lillie, 1965).
This differential staining procedure allows the
identification of relevant structures in the tissues
(particularly nuclei and membranes) and the
identification of any abnormalities. In gonad tissue
it also allows the classification of gametes at
different stages of development.

Page 25
Montara Well Release Monitoring Study S4A // Assessment of Effects on Timor Sea Fish
Statistical AnalysesFor each variable measured, descriptive statistics
including average and standard errors about the
mean were generated using the program SPSS
ver. 17.0. Physiological parameters condition factor
(CF), liver somatic index (LSI) and gonado-somatic
index (GSI) as well as biomarker levels were
compared between sites using a one-way analysis
of variance (ANOVA) after verification of normal
data distribution and homoscedasticity. Post-hoc
test Tukey’s-b was applied to identify specific site
differences, if relevant. For all statistical tests, a
significance level alpha (a) of 0.05 was applied.
In order to visualise overall trends in data across all
biomarkers multivariate techniques were employed.
Biomarkers selected for these analyses were
SDH, oxidative DNA damage, condition factor,
LSI, naphthalene metabolites, pyrene metabolites,
benzo(a)pyrene metabolites and EROD activity.
GSI was not included as it is inherently bimodal
(male and female modes) and therefore unsuitable.
Data for each biomarker were normalised and
a similarity matrix constructed using Euclidean
distance. An analysis of similarity (ANOSIM)
was used to detect differences between the
sites and pairwise permutation tests conducted
to evaluate where differences lay. Principal
Components Analysis (PCA) was used to evaluate
the importance of each biomarker in defining the
differences between sites (maximum 5 PC) and to
visualise the overall trends in the biomarker data.
The analyses were split between sampling times
and species as inherent, expected differences
were likely to bias the results of the analysis
and lead to incorrect interpretation. Multivariate
analyses were conducted using Primer v6.

Page 26
Montara Well Release Monitoring Study S4A // Assessment of Effects on Timor Sea Fish
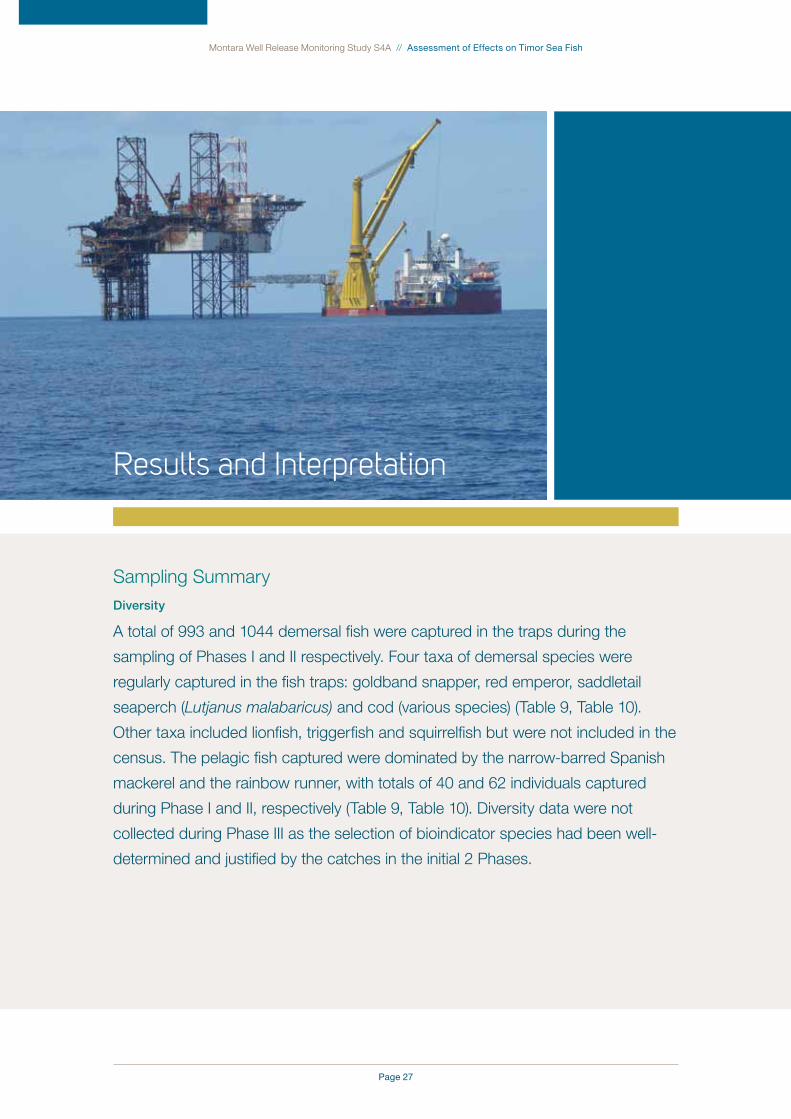
Page 27
Montara Well Release Monitoring Study S4A // Assessment of Effects on Timor Sea Fish
Sampling SummaryDiversity
A total of 993 and 1044 demersal fish were captured in the traps during the
sampling of Phases I and II respectively. Four taxa of demersal species were
regularly captured in the fish traps: goldband snapper, red emperor, saddletail
seaperch (Lutjanus malabaricus) and cod (various species) (Table 9, Table 10).
Other taxa included lionfish, triggerfish and squirrelfish but were not included in the
census. The pelagic fish captured were dominated by the narrow-barred Spanish
mackerel and the rainbow runner, with totals of 40 and 62 individuals captured
during Phase I and II, respectively (Table 9, Table 10). Diversity data were not
collected during Phase III as the selection of bioindicator species had been well-
determined and justified by the catches in the initial 2 Phases.
Results and Interpretation

Page 28
Montara Well Release Monitoring Study S4A // Assessment of Effects on Timor Sea Fish
table 9. Diversity and number of each pelagic and demersal taxon captured during the November 2009 Phase I sampling effort.
Demersal Species Pelagic Species
SiteG
old
ban
d S
nap
per
Red
Em
per
or
Sad
dle
tail
Sea
per
ch
Co
d
Oth
er
Sp
anis
h M
acke
rel
Rai
nb
ow
Ru
nn
er
Do
gto
oth
Tu
na
Wah
oo
Gia
nt
Trev
ally
Tota
l
Impacted 1 146 6 29 0 0 0 0 0 0 0 181
2 133 25 49 19 2 1 0 0 0 0 229
3 0 0 0 0 0 1 1 1 0 0 3
4 100 24 43 8 0 1 13 3 0 0 192
Total 379 55 121 27 2 3 14 4 0 0 605
Reference 5 115 20 169 43 21 0 3 0 1 0 372
6 0 1 0 0 0 4 8 1 1 1 16
Total 115 21 169 43 21 4 11 1 2 1 388
Grand Total 494 76 290 70 23 7 25 5 2 1 993
table 10. Diversity and number of each taxon captured in demersal traps during the March 2010 sampling effort.
Go
ldb
and
Sn
app
er
Red
Em
per
or
Sad
dle
tail
Sea
per
ch
Pad
dle
tail
Lo
ng
no
se E
mp
ero
r
Co
d
Sp
ang
led
Em
per
or
Var
ieg
ated
Em
per
or
Co
ral T
rou
t
Red
Bas
s
Sh
ark
Tota
l
Impacted 1 118 48 3 0 0 44 26 0 4 0 0 243
2 113 23 14 0 0 4 0 0 2 0 0 156
3 0 0 0 0 0 0 0 0 0 0 0 0
4 80 82 16 0 0 30 50 0 0 0 0 258
Total 311 153 33 0 0 78 76 0 6 0 0 657
Reference 5 83 25 63 0 0 6 23 0 0 0 0 200
6 0 0 0 0 0 0 0 0 0 0 0 0
7 0 0 0 81 44 6 0 23 9 22 2 187
Total 83 25 63 81 44 12 23 23 9 22 2 387
Grand Total 394 178 96 81 44 90 99 23 15 22 2 1044
Note: Wahoo: Acanthocybium solandri; Crocodile longtom: Tylosurus crocrodilus; Yellowfin tuna: Thunnus albacares; Shark mackerel: Grammatorcynus bicarinayus; Red bass: Lutjanus bohar.
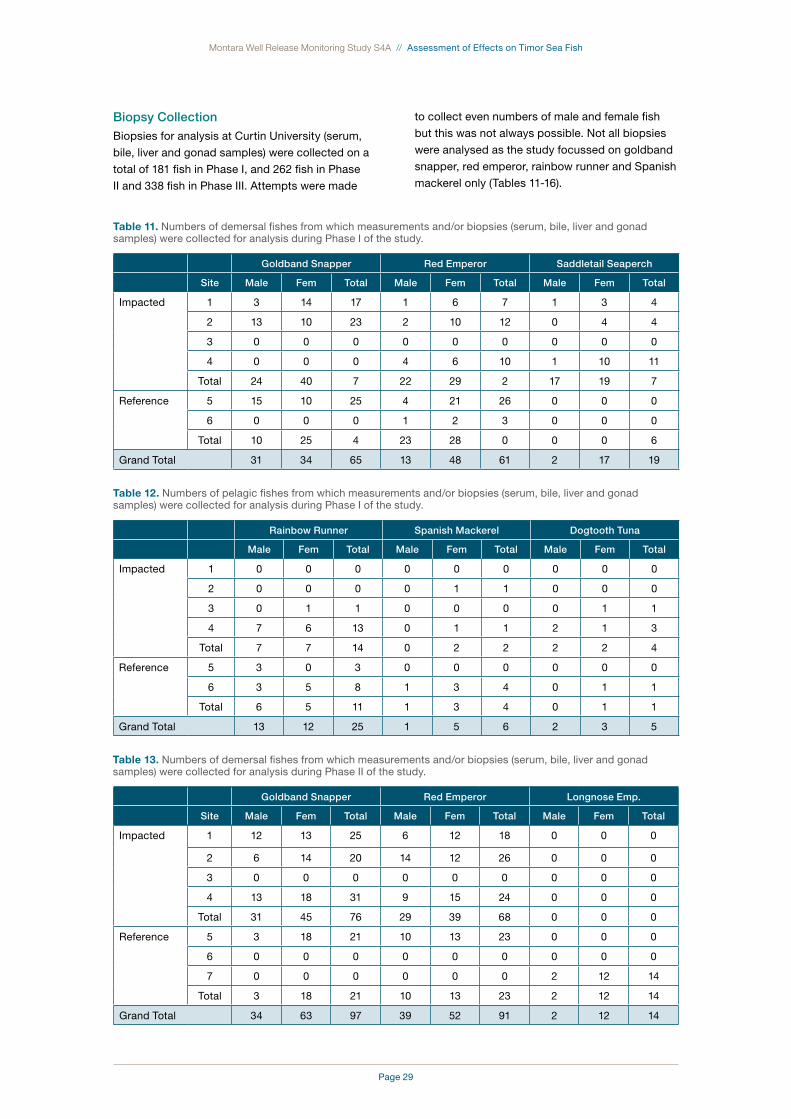
Page 29
Montara Well Release Monitoring Study S4A // Assessment of Effects on Timor Sea Fish
Biopsy CollectionBiopsies for analysis at Curtin University (serum,
bile, liver and gonad samples) were collected on a
total of 181 fish in Phase I, and 262 fish in Phase
II and 338 fish in Phase III. Attempts were made
to collect even numbers of male and female fish
but this was not always possible. Not all biopsies
were analysed as the study focussed on goldband
snapper, red emperor, rainbow runner and Spanish
mackerel only (Tables 11-16).
table 11. Numbers of demersal fishes from which measurements and/or biopsies (serum, bile, liver and gonad samples) were collected for analysis during Phase I of the study.
Goldband Snapper Red Emperor Saddletail Seaperch
Site Male Fem Total Male Fem Total Male Fem Total
Impacted 1 3 14 17 1 6 7 1 3 4
2 13 10 23 2 10 12 0 4 4
3 0 0 0 0 0 0 0 0 0
4 0 0 0 4 6 10 1 10 11
Total 24 40 7 22 29 2 17 19 7
Reference 5 15 10 25 4 21 26 0 0 0
6 0 0 0 1 2 3 0 0 0
Total 10 25 4 23 28 0 0 0 6
Grand Total 31 34 65 13 48 61 2 17 19
table 12. Numbers of pelagic fishes from which measurements and/or biopsies (serum, bile, liver and gonad samples) were collected for analysis during Phase I of the study.
Rainbow Runner Spanish Mackerel Dogtooth Tuna
Male Fem Total Male Fem Total Male Fem Total
Impacted 1 0 0 0 0 0 0 0 0 0
2 0 0 0 0 1 1 0 0 0
3 0 1 1 0 0 0 0 1 1
4 7 6 13 0 1 1 2 1 3
Total 7 7 14 0 2 2 2 2 4
Reference 5 3 0 3 0 0 0 0 0 0
6 3 5 8 1 3 4 0 1 1
Total 6 5 11 1 3 4 0 1 1
Grand Total 13 12 25 1 5 6 2 3 5
table 13. Numbers of demersal fishes from which measurements and/or biopsies (serum, bile, liver and gonad samples) were collected for analysis during Phase II of the study.
Goldband Snapper Red Emperor Longnose Emp.
Site Male Fem Total Male Fem Total Male Fem Total
Impacted 1 12 13 25 6 12 18 0 0 0
2 6 14 20 14 12 26 0 0 0
3 0 0 0 0 0 0 0 0 0
4 13 18 31 9 15 24 0 0 0
Total 31 45 76 29 39 68 0 0 0
Reference 5 3 18 21 10 13 23 0 0 0
6 0 0 0 0 0 0 0 0 0
7 0 0 0 0 0 0 2 12 14
Total 3 18 21 10 13 23 2 12 14
Grand Total 34 63 97 39 52 91 2 12 14
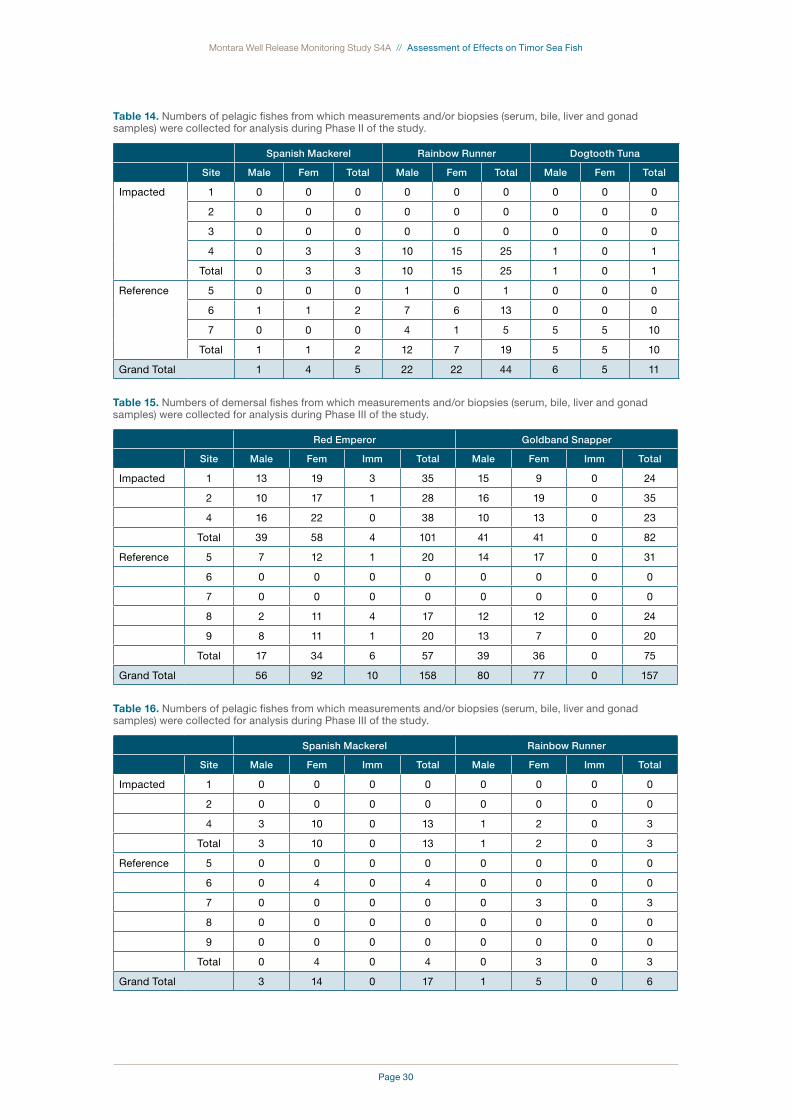
Page 30
Montara Well Release Monitoring Study S4A // Assessment of Effects on Timor Sea Fish
table 14. Numbers of pelagic fishes from which measurements and/or biopsies (serum, bile, liver and gonad samples) were collected for analysis during Phase II of the study.
Spanish Mackerel Rainbow Runner Dogtooth Tuna
Site Male Fem Total Male Fem Total Male Fem Total
Impacted 1 0 0 0 0 0 0 0 0 0
2 0 0 0 0 0 0 0 0 0
3 0 0 0 0 0 0 0 0 0
4 0 3 3 10 15 25 1 0 1
Total 0 3 3 10 15 25 1 0 1
Reference 5 0 0 0 1 0 1 0 0 0
6 1 1 2 7 6 13 0 0 0
7 0 0 0 4 1 5 5 5 10
Total 1 1 2 12 7 19 5 5 10
Grand Total 1 4 5 22 22 44 6 5 11
table 15. Numbers of demersal fishes from which measurements and/or biopsies (serum, bile, liver and gonad samples) were collected for analysis during Phase III of the study.
Red Emperor Goldband Snapper
Site Male Fem Imm Total Male Fem Imm Total
Impacted 1 13 19 3 35 15 9 0 24
2 10 17 1 28 16 19 0 35
4 16 22 0 38 10 13 0 23
Total 39 58 4 101 41 41 0 82
Reference 5 7 12 1 20 14 17 0 31
6 0 0 0 0 0 0 0 0
7 0 0 0 0 0 0 0 0
8 2 11 4 17 12 12 0 24
9 8 11 1 20 13 7 0 20
Total 17 34 6 57 39 36 0 75
Grand Total 56 92 10 158 80 77 0 157
table 16. Numbers of pelagic fishes from which measurements and/or biopsies (serum, bile, liver and gonad samples) were collected for analysis during Phase III of the study.
Spanish Mackerel Rainbow Runner
Site Male Fem Imm Total Male Fem Imm Total
Impacted 1 0 0 0 0 0 0 0 0
2 0 0 0 0 0 0 0 0
4 3 10 0 13 1 2 0 3
Total 3 10 0 13 1 2 0 3
Reference 5 0 0 0 0 0 0 0 0
6 0 4 0 4 0 0 0 0
7 0 0 0 0 0 3 0 3
8 0 0 0 0 0 0 0 0
9 0 0 0 0 0 0 0 0
Total 0 4 0 4 0 3 0 3
Grand Total 3 14 0 17 1 5 0 6
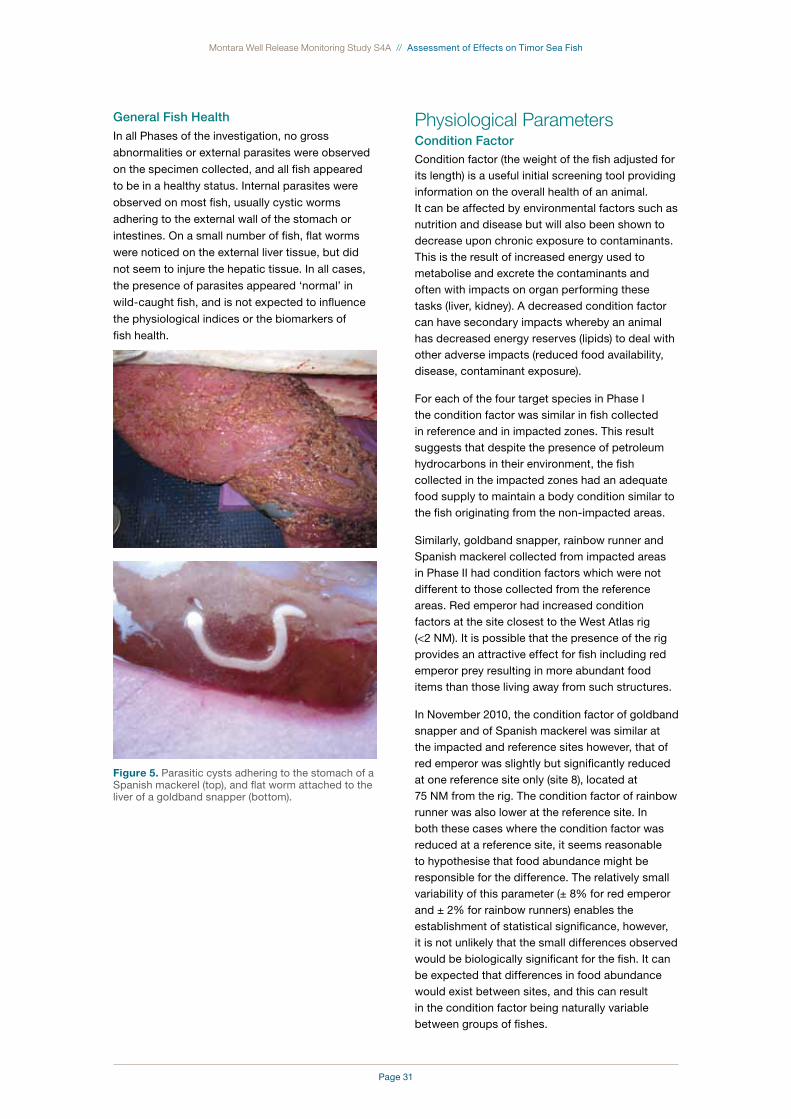
Page 31
Montara Well Release Monitoring Study S4A // Assessment of Effects on Timor Sea Fish
General Fish HealthIn all Phases of the investigation, no gross
abnormalities or external parasites were observed
on the specimen collected, and all fish appeared
to be in a healthy status. Internal parasites were
observed on most fish, usually cystic worms
adhering to the external wall of the stomach or
intestines. On a small number of fish, flat worms
were noticed on the external liver tissue, but did
not seem to injure the hepatic tissue. In all cases,
the presence of parasites appeared ‘normal’ in
wild-caught fish, and is not expected to influence
the physiological indices or the biomarkers of
fish health.
Figure 5. Parasitic cysts adhering to the stomach of a Spanish mackerel (top), and flat worm attached to the liver of a goldband snapper (bottom).
Physiological ParametersCondition FactorCondition factor (the weight of the fish adjusted for its length) is a useful initial screening tool providing information on the overall health of an animal. It can be affected by environmental factors such as nutrition and disease but will also been shown to decrease upon chronic exposure to contaminants. This is the result of increased energy used to metabolise and excrete the contaminants and often with impacts on organ performing these tasks (liver, kidney). A decreased condition factor can have secondary impacts whereby an animal has decreased energy reserves (lipids) to deal with other adverse impacts (reduced food availability, disease, contaminant exposure).
For each of the four target species in Phase I the condition factor was similar in fish collected in reference and in impacted zones. This result suggests that despite the presence of petroleum hydrocarbons in their environment, the fish collected in the impacted zones had an adequate food supply to maintain a body condition similar to the fish originating from the non-impacted areas.
Similarly, goldband snapper, rainbow runner and Spanish mackerel collected from impacted areas in Phase II had condition factors which were not different to those collected from the reference areas. Red emperor had increased condition factors at the site closest to the West Atlas rig (<2 NM). It is possible that the presence of the rig provides an attractive effect for fish including red emperor prey resulting in more abundant food items than those living away from such structures.
In November 2010, the condition factor of goldband snapper and of Spanish mackerel was similar at the impacted and reference sites however, that of red emperor was slightly but significantly reduced at one reference site only (site 8), located at 75 NM from the rig. The condition factor of rainbow runner was also lower at the reference site. In both these cases where the condition factor was reduced at a reference site, it seems reasonable to hypothesise that food abundance might be responsible for the difference. The relatively small variability of this parameter (± 8% for red emperor and ± 2% for rainbow runners) enables the establishment of statistical significance, however, it is not unlikely that the small differences observed would be biologically significant for the fish. It can be expected that differences in food abundance would exist between sites, and this can result in the condition factor being naturally variable between groups of fishes.

Page 32
Montara Well Release Monitoring Study S4A // Assessment of Effects on Timor Sea Fish
Condition factor is a general indicator if fish health
and might be reduced in situations where the
impacts of contaminants is extreme, reducing
the availability of food of impairing the food
consumption by the fish. Although condition factor
is neither contaminant-specific nor very sensitive
to short-term contamination events, it does provide
information on the general condition of the fish and
is considered a valuable initial screening tool in
evaluation of pollutant impacts (Van der Oost
et al., 2003).
Overall, no biologically significant reduction in
condition factor, in any of the fish species, was
consistently observed for up to a year following
the end of the Montara well release.
Figure 6. Condition factor of goldband snapper captured at study sites in the Timor Sea in November 2009, March 2010 and November 2011. “Impacted” sites are in red and “reference” sites are in green. X denotes that no fish of this species were examined from this site. Numbers in columns denote the number of fish included in the analysis. Different letters above the columns denote significant difference (a = 0.05).
Figure 7. Condition factor of red emperor captured at study sites in the Timor Sea in November 2009, March 2010 and November 2011. “Impacted” sites are in red and “reference” sites are in green. X denotes that no fish of this species were examined from this site. Numbers in columns denote the number of fish included in the analysis. Different letters above the columns denote significant difference (a = 0.05).
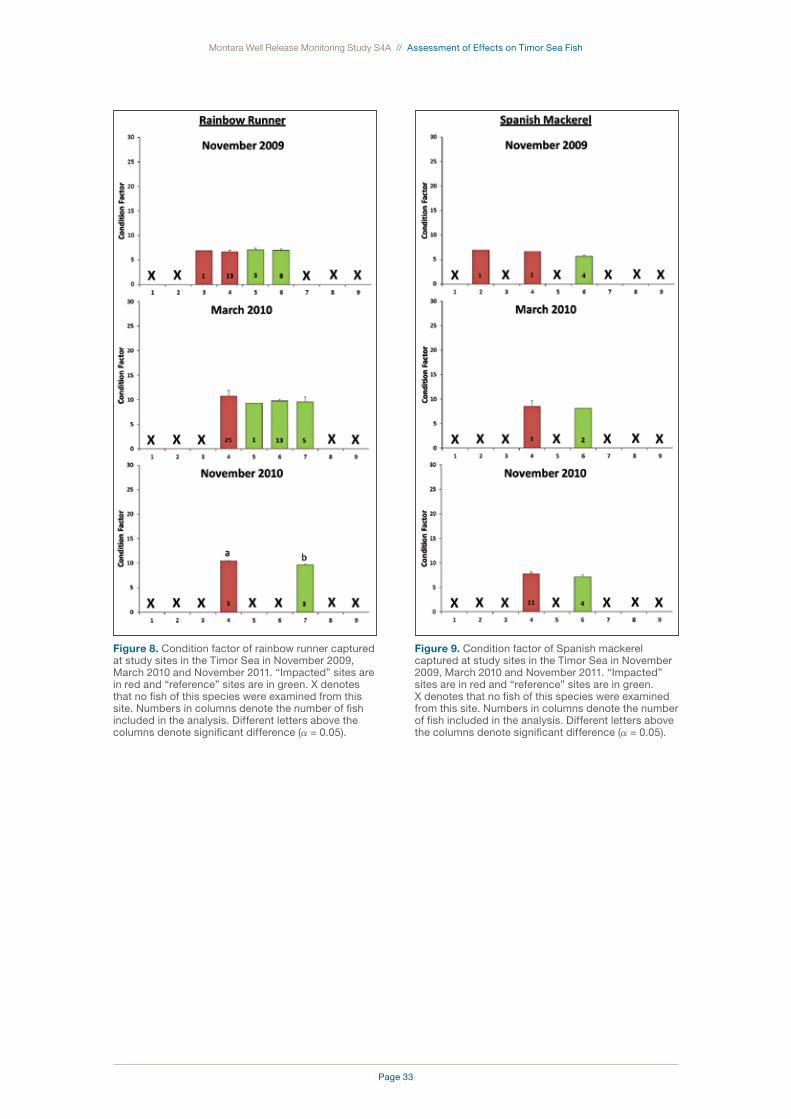
Page 33
Montara Well Release Monitoring Study S4A // Assessment of Effects on Timor Sea Fish
Figure 8. Condition factor of rainbow runner captured at study sites in the Timor Sea in November 2009, March 2010 and November 2011. “Impacted” sites are in red and “reference” sites are in green. X denotes that no fish of this species were examined from this site. Numbers in columns denote the number of fish included in the analysis. Different letters above the columns denote significant difference (a = 0.05).
Figure 9. Condition factor of Spanish mackerel captured at study sites in the Timor Sea in November 2009, March 2010 and November 2011. “Impacted” sites are in red and “reference” sites are in green. X denotes that no fish of this species were examined from this site. Numbers in columns denote the number of fish included in the analysis. Different letters above the columns denote significant difference (a = 0.05).
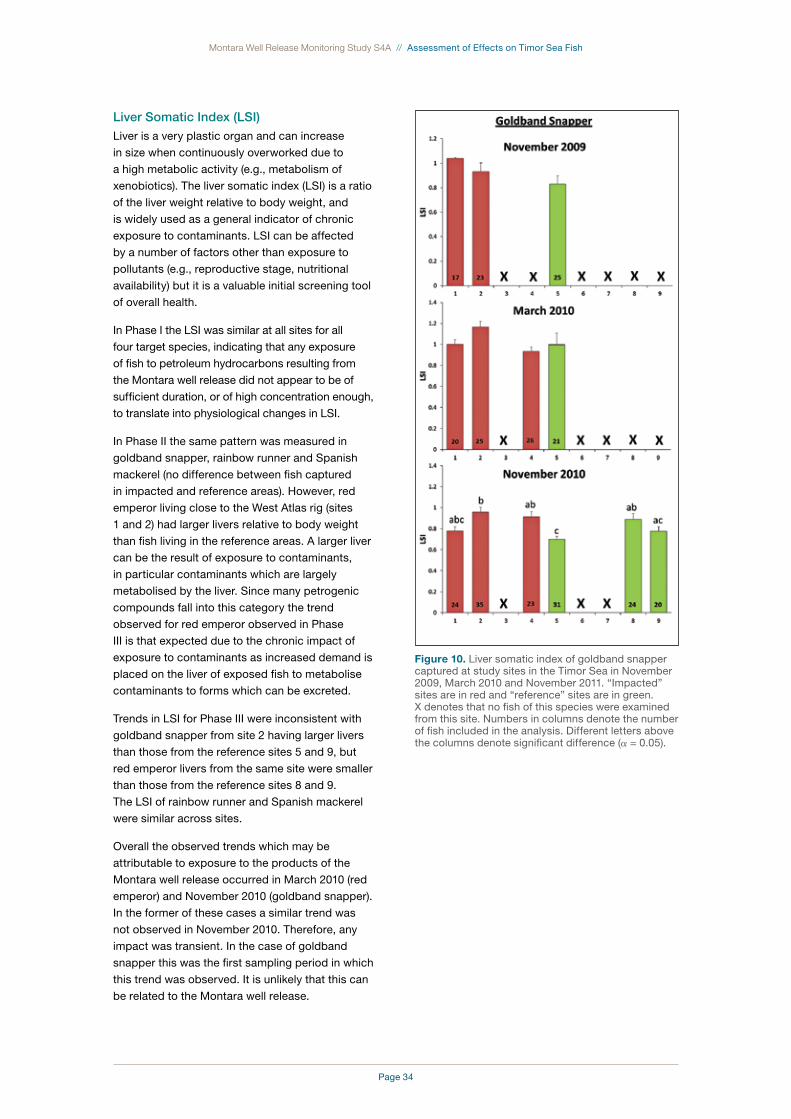
Page 34
Montara Well Release Monitoring Study S4A // Assessment of Effects on Timor Sea Fish
Liver Somatic Index (LSI)Liver is a very plastic organ and can increase
in size when continuously overworked due to
a high metabolic activity (e.g., metabolism of
xenobiotics). The liver somatic index (LSI) is a ratio
of the liver weight relative to body weight, and
is widely used as a general indicator of chronic
exposure to contaminants. LSI can be affected
by a number of factors other than exposure to
pollutants (e.g., reproductive stage, nutritional
availability) but it is a valuable initial screening tool
of overall health.
In Phase I the LSI was similar at all sites for all
four target species, indicating that any exposure
of fish to petroleum hydrocarbons resulting from
the Montara well release did not appear to be of
sufficient duration, or of high concentration enough,
to translate into physiological changes in LSI.
In Phase II the same pattern was measured in
goldband snapper, rainbow runner and Spanish
mackerel (no difference between fish captured
in impacted and reference areas). However, red
emperor living close to the West Atlas rig (sites
1 and 2) had larger livers relative to body weight
than fish living in the reference areas. A larger liver
can be the result of exposure to contaminants,
in particular contaminants which are largely
metabolised by the liver. Since many petrogenic
compounds fall into this category the trend
observed for red emperor observed in Phase
III is that expected due to the chronic impact of
exposure to contaminants as increased demand is
placed on the liver of exposed fish to metabolise
contaminants to forms which can be excreted.
Trends in LSI for Phase III were inconsistent with
goldband snapper from site 2 having larger livers
than those from the reference sites 5 and 9, but
red emperor livers from the same site were smaller
than those from the reference sites 8 and 9.
The LSI of rainbow runner and Spanish mackerel
were similar across sites.
Overall the observed trends which may be
attributable to exposure to the products of the
Montara well release occurred in March 2010 (red
emperor) and November 2010 (goldband snapper).
In the former of these cases a similar trend was
not observed in November 2010. Therefore, any
impact was transient. In the case of goldband
snapper this was the first sampling period in which
this trend was observed. It is unlikely that this can
be related to the Montara well release.
Figure 10. Liver somatic index of goldband snapper captured at study sites in the Timor Sea in November 2009, March 2010 and November 2011. “Impacted” sites are in red and “reference” sites are in green. X denotes that no fish of this species were examined from this site. Numbers in columns denote the number of fish included in the analysis. Different letters above the columns denote significant difference (a = 0.05).
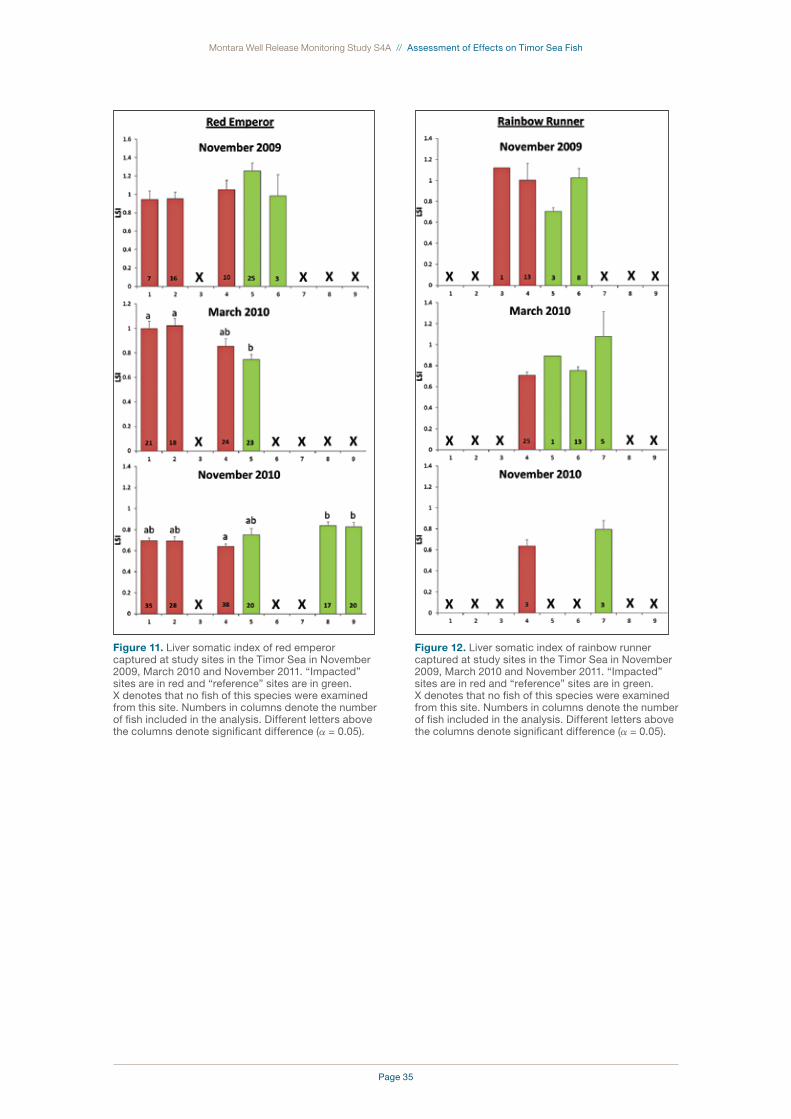
Page 35
Montara Well Release Monitoring Study S4A // Assessment of Effects on Timor Sea Fish
Figure 11. Liver somatic index of red emperor captured at study sites in the Timor Sea in November 2009, March 2010 and November 2011. “Impacted” sites are in red and “reference” sites are in green. X denotes that no fish of this species were examined from this site. Numbers in columns denote the number of fish included in the analysis. Different letters above the columns denote significant difference (a = 0.05).
Figure 12. Liver somatic index of rainbow runner captured at study sites in the Timor Sea in November 2009, March 2010 and November 2011. “Impacted” sites are in red and “reference” sites are in green. X denotes that no fish of this species were examined from this site. Numbers in columns denote the number of fish included in the analysis. Different letters above the columns denote significant difference (a = 0.05).

Page 36
Montara Well Release Monitoring Study S4A // Assessment of Effects on Timor Sea Fish
Figure 13. Liver somatic index of Spanish mackerel captured at study sites in the Timor Sea in November 2009, March 2010 and November 2011. “Impacted” sites are in red and “reference” sites are in green. X denotes that no fish of this species were examined from this site. Numbers in columns denote the number of fish included in the analysis. Different letters above the columns denote significant difference (a = 0.05).
Gonado-somatic Index (GSI)The GSI (ratio of the gonad weight to the body
weight) provides an indication of the reproductive
status of a fish. The GSI increases immediately
prior to spawning and remains high through the
reproductive season before decreasing as spawning
ceases. When chronically or acutely exposed to
contamination, reproduction is often one of the first
parameters to be affected in adult fish.
Male
In November 2009 (Phase I) male fish of each
of the four target species collected in the
hydrocarbon-affected zone, had similar GSI to fish
collected in the reference zone, suggesting that
gonad development had proceeded at a similar
rate. No gonad resorption or other abnormalities
were observed in any of the specimens obtained.
It was therefore concluded after Phase I that
exposure to any hydrocarbons released from the
Montara incident had not affected male gonadal
development of the fish collected and examined.
In Phase II, there was again no statistical difference
in male GSI in rainbow runner between impacted
and reference areas (no statistical analysis was
run on Spanish mackerel in Phase III as only one
male was collected from each of the impacted and
reference sites. In Phase III no males of either of
these species were collected at the impacted sites
so no comparison is possible.
Male goldband snapper had significantly lower
GSI within 20 NM of the West Atlas rig than those
fish captured in the reference area in Phase III.
While the timing of reproduction varies between
populations based on environmental conditions,
it is possible that the difference measured here
indicates a decrease in metabolic resources
allocated to reproduction as a result of increase
resources allocated to dealing with contamination,
or simply a natural temporal variation in spawning
activity between populations. Either way, the GSI
measured in male goldband snapper in November
2010 (Phase III) was similar across all sites.
Indicating that the effect was not on-going and,
importantly, was not present during the onset of
the reproductive period.
Male red emperor collected in the impacted area in
November 2010 had lower GSI than those collected
in at the non-impacted Site 5. This trend is similar
to a non-significant trend noted in the March 2010
sampling period. It is possible that this is an impact
of the Montara well release which is apparent at
the beginning of the following reproductive season
(Phase III).
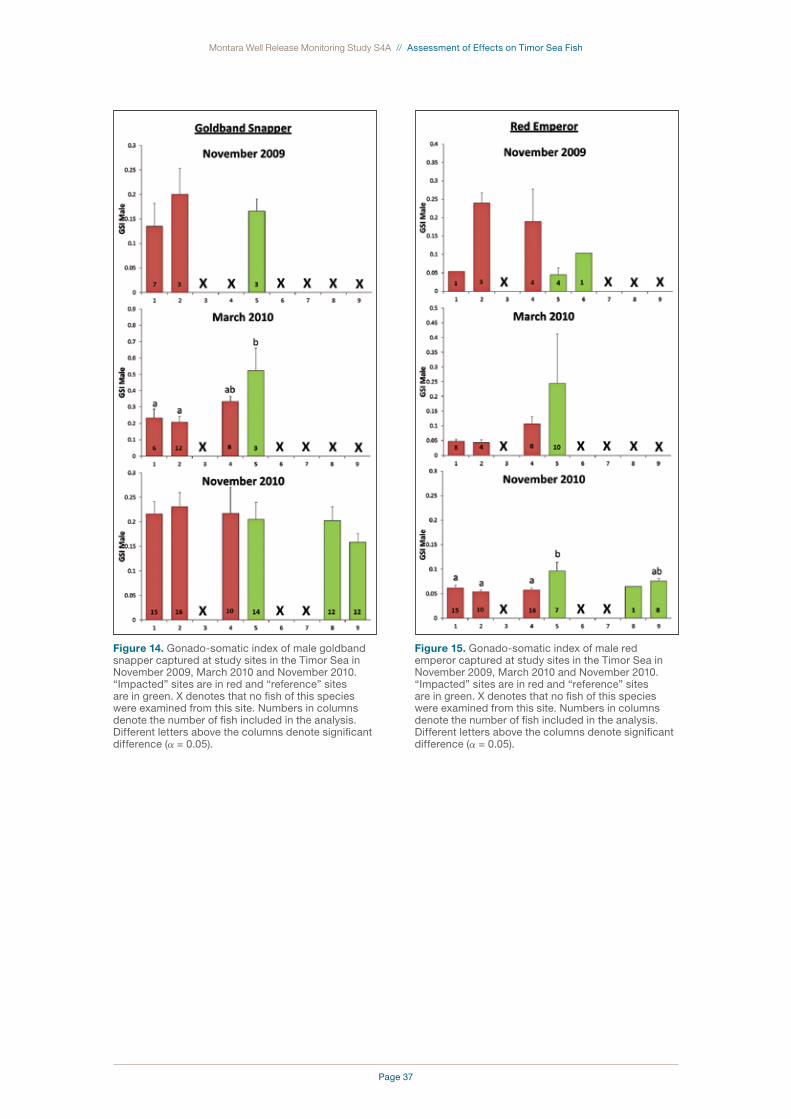
Page 37
Montara Well Release Monitoring Study S4A // Assessment of Effects on Timor Sea Fish
Figure 14. Gonado-somatic index of male goldband snapper captured at study sites in the Timor Sea in November 2009, March 2010 and November 2010. “Impacted” sites are in red and “reference” sites are in green. X denotes that no fish of this species were examined from this site. Numbers in columns denote the number of fish included in the analysis. Different letters above the columns denote significant difference (a = 0.05).
Figure 15. Gonado-somatic index of male red emperor captured at study sites in the Timor Sea in November 2009, March 2010 and November 2010. “Impacted” sites are in red and “reference” sites are in green. X denotes that no fish of this species were examined from this site. Numbers in columns denote the number of fish included in the analysis. Different letters above the columns denote significant difference (a = 0.05).
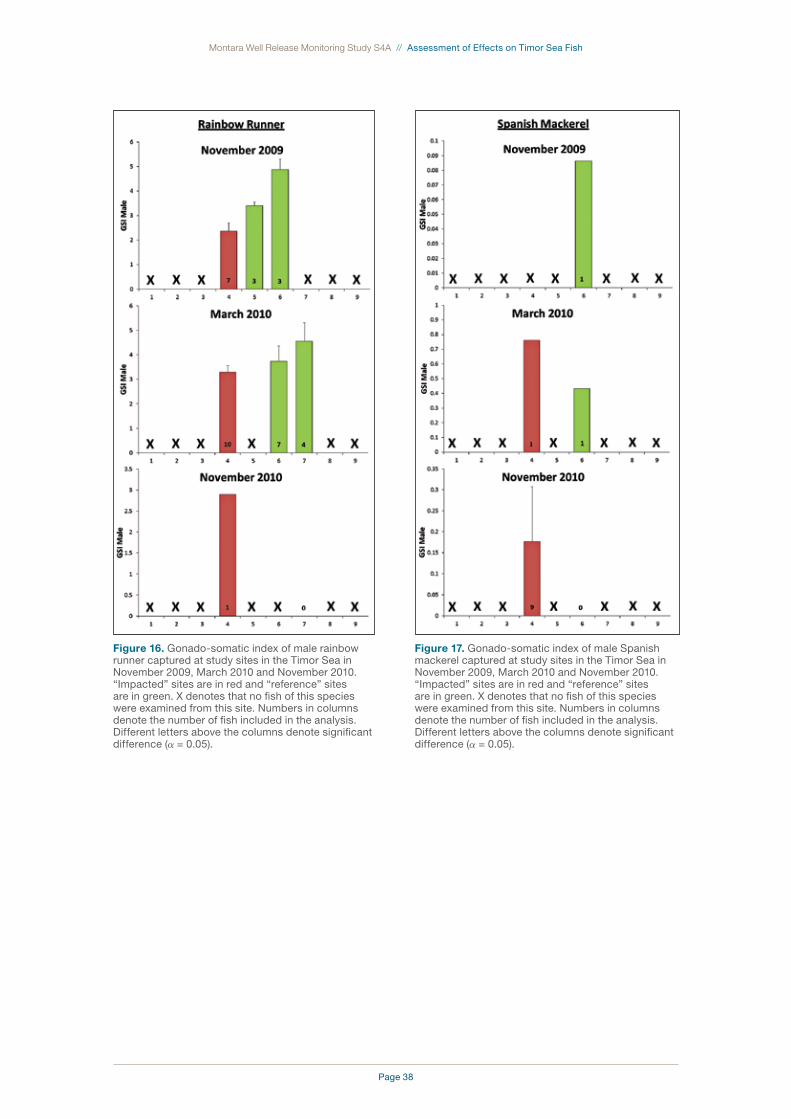
Page 38
Montara Well Release Monitoring Study S4A // Assessment of Effects on Timor Sea Fish
Figure 16. Gonado-somatic index of male rainbow runner captured at study sites in the Timor Sea in November 2009, March 2010 and November 2010. “Impacted” sites are in red and “reference” sites are in green. X denotes that no fish of this species were examined from this site. Numbers in columns denote the number of fish included in the analysis. Different letters above the columns denote significant difference (a = 0.05).
Figure 17. Gonado-somatic index of male Spanish mackerel captured at study sites in the Timor Sea in November 2009, March 2010 and November 2010. “Impacted” sites are in red and “reference” sites are in green. X denotes that no fish of this species were examined from this site. Numbers in columns denote the number of fish included in the analysis. Different letters above the columns denote significant difference (a = 0.05).
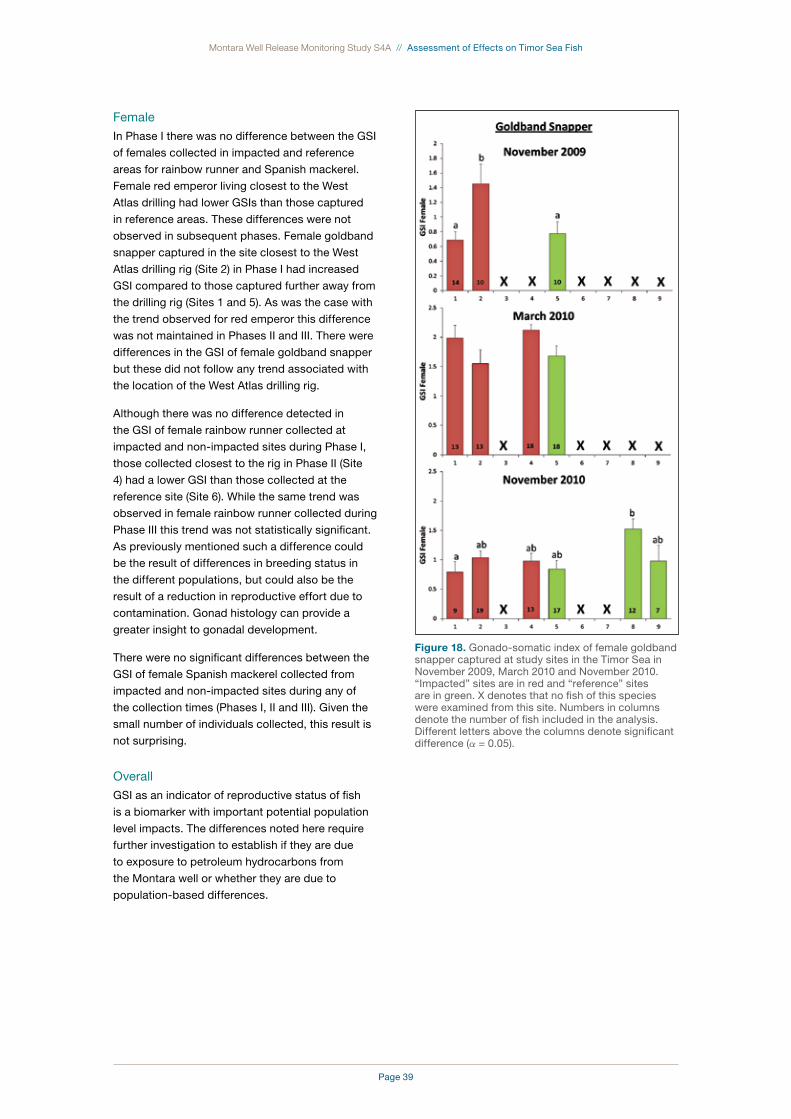
Page 39
Montara Well Release Monitoring Study S4A // Assessment of Effects on Timor Sea Fish
Female
In Phase I there was no difference between the GSI
of females collected in impacted and reference
areas for rainbow runner and Spanish mackerel.
Female red emperor living closest to the West
Atlas drilling had lower GSIs than those captured
in reference areas. These differences were not
observed in subsequent phases. Female goldband
snapper captured in the site closest to the West
Atlas drilling rig (Site 2) in Phase I had increased
GSI compared to those captured further away from
the drilling rig (Sites 1 and 5). As was the case with
the trend observed for red emperor this difference
was not maintained in Phases II and III. There were
differences in the GSI of female goldband snapper
but these did not follow any trend associated with
the location of the West Atlas drilling rig.
Although there was no difference detected in
the GSI of female rainbow runner collected at
impacted and non-impacted sites during Phase I,
those collected closest to the rig in Phase II (Site
4) had a lower GSI than those collected at the
reference site (Site 6). While the same trend was
observed in female rainbow runner collected during
Phase III this trend was not statistically significant.
As previously mentioned such a difference could
be the result of differences in breeding status in
the different populations, but could also be the
result of a reduction in reproductive effort due to
contamination. Gonad histology can provide a
greater insight to gonadal development.
There were no significant differences between the
GSI of female Spanish mackerel collected from
impacted and non-impacted sites during any of
the collection times (Phases I, II and III). Given the
small number of individuals collected, this result is
not surprising.
Overall
GSI as an indicator of reproductive status of fish
is a biomarker with important potential population
level impacts. The differences noted here require
further investigation to establish if they are due
to exposure to petroleum hydrocarbons from
the Montara well or whether they are due to
population-based differences.
Figure 18. Gonado-somatic index of female goldband snapper captured at study sites in the Timor Sea in November 2009, March 2010 and November 2010. “Impacted” sites are in red and “reference” sites are in green. X denotes that no fish of this species were examined from this site. Numbers in columns denote the number of fish included in the analysis. Different letters above the columns denote significant difference (a = 0.05).

Page 40
Montara Well Release Monitoring Study S4A // Assessment of Effects on Timor Sea Fish
Figure 19. Gonado-somatic index of female red emperor captured at study sites in the Timor Sea in November 2009, March 2010 and November 2010. “Impacted” sites are in red and “reference” sites are in green. X denotes that no fish of this species were examined from this site. Numbers in columns denote the number of fish included in the analysis. Different letters above the columns denote significant difference (a = 0.05).
Figure 20. Gonado-somatic index of female rainbow runner captured at study sites in the Timor Sea in November 2009, March 2010 and November 2010. “Impacted” sites are in red and “reference” sites are in green. X denotes that no fish of this species were examined from this site. Numbers in columns denote the number of fish included in the analysis. Different letters above the columns denote significant difference (a = 0.05).

Page 41
Montara Well Release Monitoring Study S4A // Assessment of Effects on Timor Sea Fish
Figure 21. Gonado-somatic index of female Spanish mackerel captured at study sites in the Timor Sea in November 2009, March 2010 and November 2010. “Impacted” sites are in red and “reference” sites are in green. X denotes that no fish of this species were examined from this site. Numbers in columns denote the number of fish included in the analysis. Different letters above the columns denote significant difference (a = 0.05).
Gonad HistologyHistological examination gonadal tissue can
provide information on the reproductive state of an
animal and reveal pathologies which may otherwise
go undetected (Bjerregaard et al., 2006). Such
examinations can be either quantitative (usually
expressed as proportional distribution of different
gamete developmental stage) or qualitative (based
on visual examination only). Below is a qualitative
histological analysis of gonadal tissue on collected
fish in Phase I and II of this study.
Male
In Phase I it was noted that male fish of all four
target species had mature spermatazoa visible
in the efferent duct indicating that the fish were
either spawning or that spawning was close to
commencing and that the gonad also contained
developing gametes of a variety of stages. In male
rainbow runner and Spanish mackerel gonads
mature spermatozoa within wide seminiferous
tubules made up the bulk of the organ indicating a
high reproductive output at the time of sampling.
In red emperor and goldband snapper there was
a greater proportion of primary and secondary
spermatgonia evident toward the periphery
suggesting that these species were probably early
in their reproductive season.
In Phase II the gonad of the male rainbow
runner, again had very high numbers of mature
spermatazoa in the efferent duct indicating that
this species was still actively spawning. Male
goldband snapper had mature sperm in the
efferent duct but appeared to have reduced
numbers of developing spermatagonia indicating
that it was toward the end of the reproductive
season. Although the male red emperor had
increased GSI (see above) histological analysis
indicated that their gonad still contained mature
spermatazoa.
Female
The ovaries of the female fish of each species
in Phase I contained fully developed oocytes
suggesting that the animals were reproductively
fit and either preparing to spawn or in the process
of spawning. In each species the majority of the
ovary was made up of Stage III oocytes, with a
smaller proportion of Stage IV and V oocytes
present toward the periphery. In Phase II rainbow
runner ovaries appeared to contain a slightly higher
proportion of Stage IV and V oocytes than those in
Phase I and there were no obvious differences in
gonadal structure between the gonads of females
from impacted and reference areas.
Female goldband snapper sampled in Phase I
had a small proportion of stage IV oocytes and
even fewer stage V oocytes. In Phase II both stage
IV and V oocytes were much more common in
goldband snapper ovaries suggesting that these
fish were either actively reproducing or had recently
completed their reproductive season. Based on
visual analysis the ovaries collected from impacted
and reference areas were histologically similar.
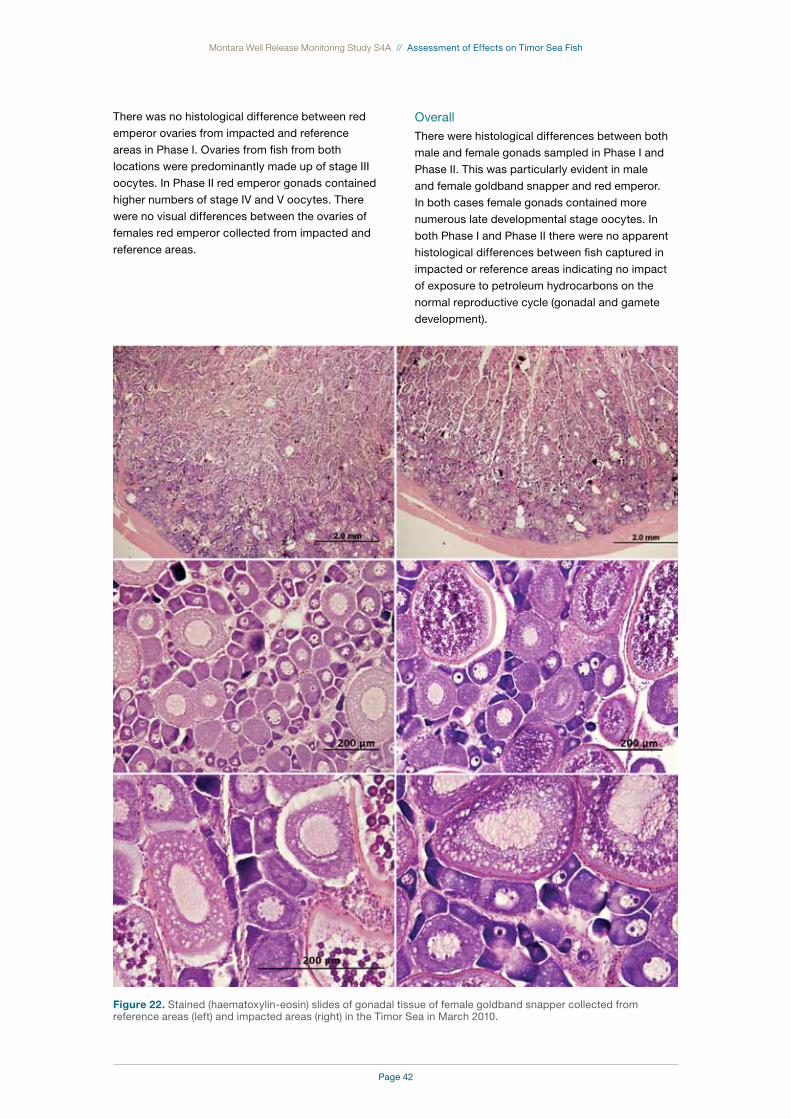
Page 42
Montara Well Release Monitoring Study S4A // Assessment of Effects on Timor Sea Fish
There was no histological difference between red
emperor ovaries from impacted and reference
areas in Phase I. Ovaries from fish from both
locations were predominantly made up of stage III
oocytes. In Phase II red emperor gonads contained
higher numbers of stage IV and V oocytes. There
were no visual differences between the ovaries of
females red emperor collected from impacted and
reference areas.
Overall
There were histological differences between both
male and female gonads sampled in Phase I and
Phase II. This was particularly evident in male
and female goldband snapper and red emperor.
In both cases female gonads contained more
numerous late developmental stage oocytes. In
both Phase I and Phase II there were no apparent
histological differences between fish captured in
impacted or reference areas indicating no impact
of exposure to petroleum hydrocarbons on the
normal reproductive cycle (gonadal and gamete
development).
Figure 22. Stained (haematoxylin-eosin) slides of gonadal tissue of female goldband snapper collected from reference areas (left) and impacted areas (right) in the Timor Sea in March 2010.
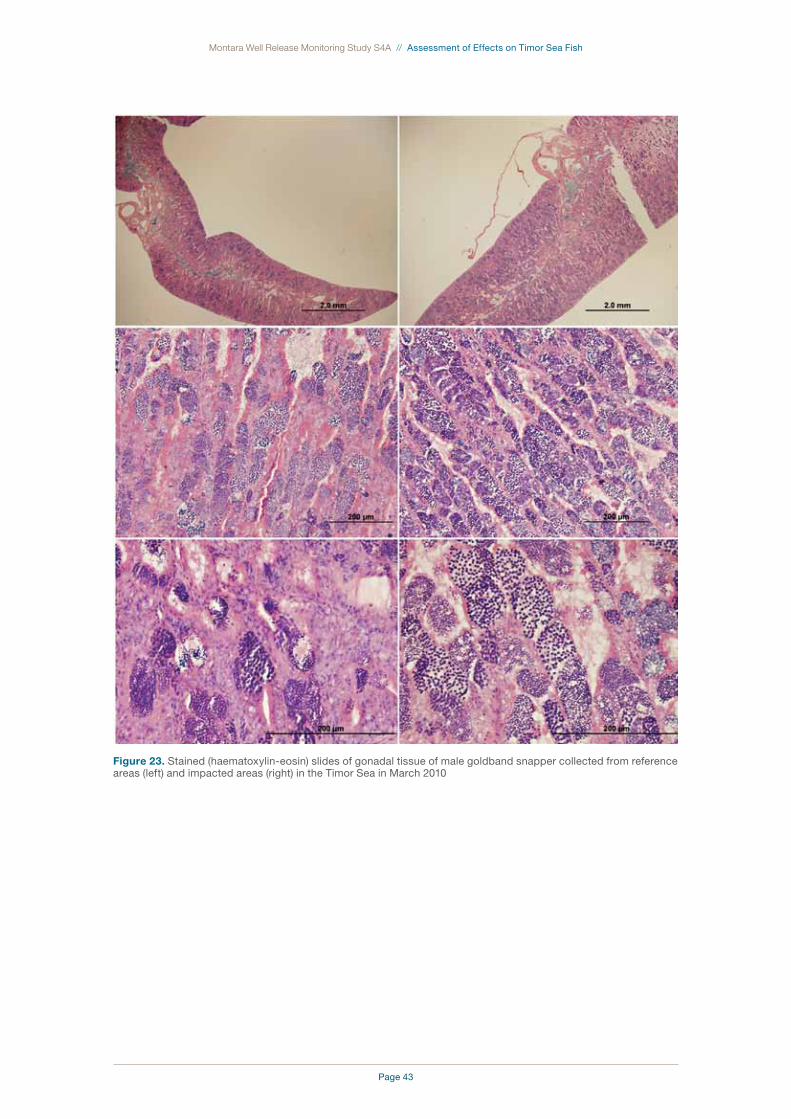
Page 43
Montara Well Release Monitoring Study S4A // Assessment of Effects on Timor Sea Fish
Figure 23. Stained (haematoxylin-eosin) slides of gonadal tissue of male goldband snapper collected from reference areas (left) and impacted areas (right) in the Timor Sea in March 2010

Page 44
Montara Well Release Monitoring Study S4A // Assessment of Effects on Timor Sea Fish
Figure 24. Stained (haematoxylin-eosin) slides of gonadal tissue of female rainbow runner collected from reference areas (left) and impacted areas (right) in the Timor Sea in March 2010

Page 45
Montara Well Release Monitoring Study S4A // Assessment of Effects on Timor Sea Fish
Figure 25. Stained (haematoxylin-eosin) slides of gonadal tissue of male rainbow runner collected from reference areas (left) and impacted areas (right) in the Timor Sea in March 2010.

Page 46
Montara Well Release Monitoring Study S4A // Assessment of Effects on Timor Sea Fish
Figure 26. Stained (haematoxylin-eosin) slides of gonadal tissue of female red emperor collected from reference areas (left) and impacted areas (right) in the Timor Sea in March 2010.
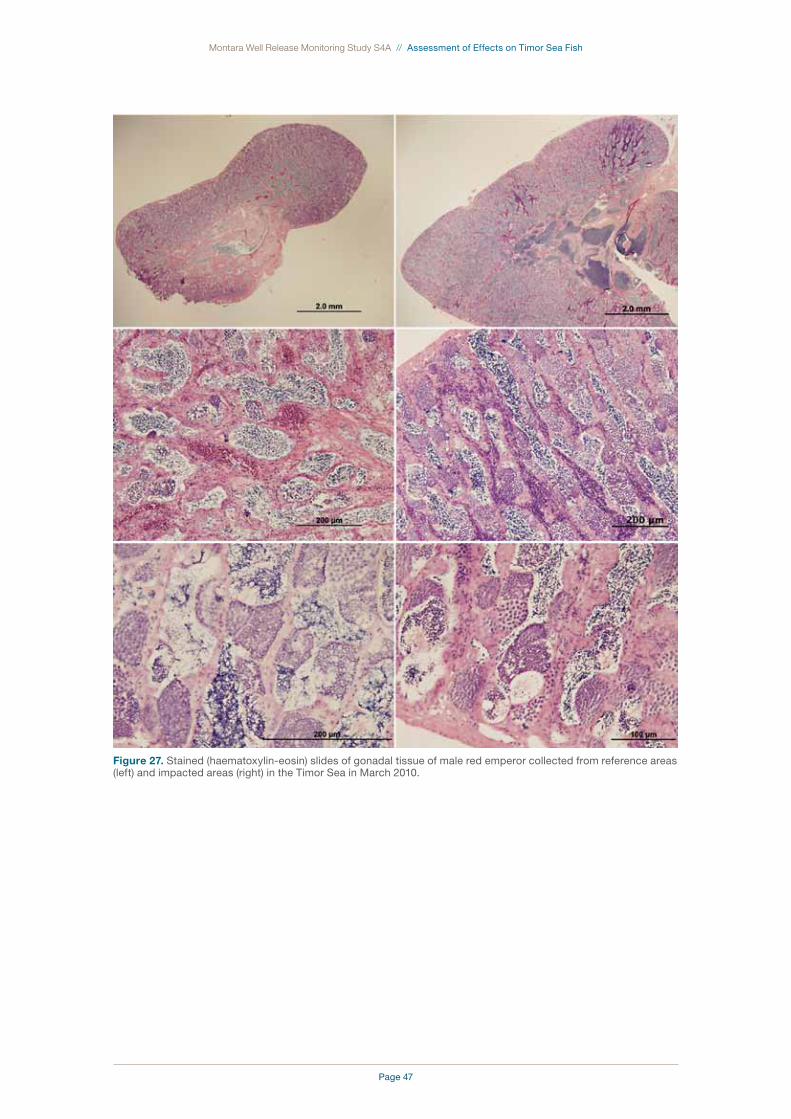
Page 47
Montara Well Release Monitoring Study S4A // Assessment of Effects on Timor Sea Fish
Figure 27. Stained (haematoxylin-eosin) slides of gonadal tissue of male red emperor collected from reference areas (left) and impacted areas (right) in the Timor Sea in March 2010.
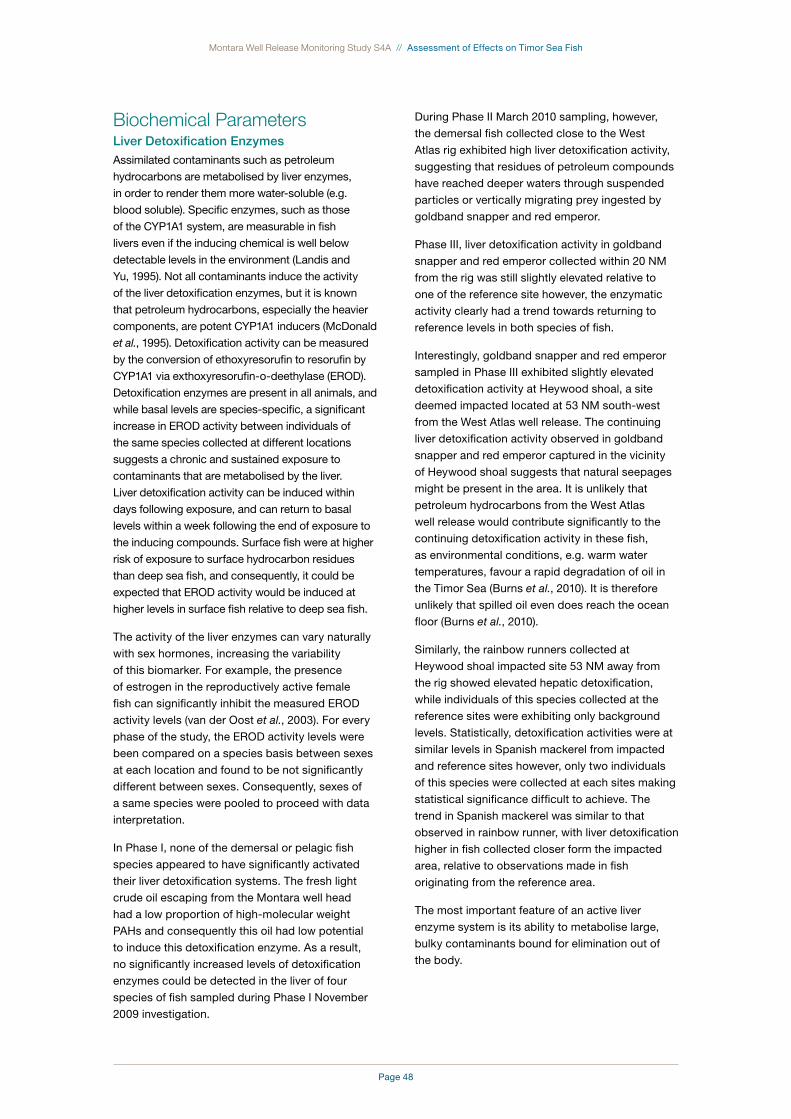
Page 48
Montara Well Release Monitoring Study S4A // Assessment of Effects on Timor Sea Fish
Biochemical ParametersLiver Detoxification EnzymesAssimilated contaminants such as petroleum
hydrocarbons are metabolised by liver enzymes,
in order to render them more water-soluble (e.g.
blood soluble). Specific enzymes, such as those
of the CYP1A1 system, are measurable in fish
livers even if the inducing chemical is well below
detectable levels in the environment (Landis and
Yu, 1995). Not all contaminants induce the activity
of the liver detoxification enzymes, but it is known
that petroleum hydrocarbons, especially the heavier
components, are potent CYP1A1 inducers (McDonald
et al., 1995). Detoxification activity can be measured
by the conversion of ethoxyresorufin to resorufin by
CYP1A1 via exthoxyresorufin-o-deethylase (EROD).
Detoxification enzymes are present in all animals, and
while basal levels are species-specific, a significant
increase in EROD activity between individuals of
the same species collected at different locations
suggests a chronic and sustained exposure to
contaminants that are metabolised by the liver.
Liver detoxification activity can be induced within
days following exposure, and can return to basal
levels within a week following the end of exposure to
the inducing compounds. Surface fish were at higher
risk of exposure to surface hydrocarbon residues
than deep sea fish, and consequently, it could be
expected that EROD activity would be induced at
higher levels in surface fish relative to deep sea fish.
The activity of the liver enzymes can vary naturally
with sex hormones, increasing the variability
of this biomarker. For example, the presence
of estrogen in the reproductively active female
fish can significantly inhibit the measured EROD
activity levels (van der Oost et al., 2003). For every
phase of the study, the EROD activity levels were
been compared on a species basis between sexes
at each location and found to be not significantly
different between sexes. Consequently, sexes of
a same species were pooled to proceed with data
interpretation.
In Phase I, none of the demersal or pelagic fish
species appeared to have significantly activated
their liver detoxification systems. The fresh light
crude oil escaping from the Montara well head
had a low proportion of high-molecular weight
PAHs and consequently this oil had low potential
to induce this detoxification enzyme. As a result,
no significantly increased levels of detoxification
enzymes could be detected in the liver of four
species of fish sampled during Phase I November
2009 investigation.
During Phase II March 2010 sampling, however,
the demersal fish collected close to the West
Atlas rig exhibited high liver detoxification activity,
suggesting that residues of petroleum compounds
have reached deeper waters through suspended
particles or vertically migrating prey ingested by
goldband snapper and red emperor.
Phase III, liver detoxification activity in goldband
snapper and red emperor collected within 20 NM
from the rig was still slightly elevated relative to
one of the reference site however, the enzymatic
activity clearly had a trend towards returning to
reference levels in both species of fish.
Interestingly, goldband snapper and red emperor
sampled in Phase III exhibited slightly elevated
detoxification activity at Heywood shoal, a site
deemed impacted located at 53 NM south-west
from the West Atlas well release. The continuing
liver detoxification activity observed in goldband
snapper and red emperor captured in the vicinity
of Heywood shoal suggests that natural seepages
might be present in the area. It is unlikely that
petroleum hydrocarbons from the West Atlas
well release would contribute significantly to the
continuing detoxification activity in these fish,
as environmental conditions, e.g. warm water
temperatures, favour a rapid degradation of oil in
the Timor Sea (Burns et al., 2010). It is therefore
unlikely that spilled oil even does reach the ocean
floor (Burns et al., 2010).
Similarly, the rainbow runners collected at
Heywood shoal impacted site 53 NM away from
the rig showed elevated hepatic detoxification,
while individuals of this species collected at the
reference sites were exhibiting only background
levels. Statistically, detoxification activities were at
similar levels in Spanish mackerel from impacted
and reference sites however, only two individuals
of this species were collected at each sites making
statistical significance difficult to achieve. The
trend in Spanish mackerel was similar to that
observed in rainbow runner, with liver detoxification
higher in fish collected closer form the impacted
area, relative to observations made in fish
originating from the reference area.
The most important feature of an active liver
enzyme system is its ability to metabolise large,
bulky contaminants bound for elimination out of
the body.

Page 49
Montara Well Release Monitoring Study S4A // Assessment of Effects on Timor Sea Fish
These enzymes initiate the elimination process by
transforming lipophilic xenobiotics into more water-
soluble compounds which are then directed to the
biliary secretion via the bloodstream. Occasionally,
metabolism of PAHs creates reactive metabolites
that are highly toxic, mutagenic to carcinogenic
(van der Oost et al., 2003). The oxidative
metabolism of PAHs, for instance, proceeds via
highly electrophilic intermediates, some of which
bind covalently to cellular macromolecules such as
DNA (van der Oost et al., 2003).
While a higher level of liver detoxification system
confirms continuing exposure to contaminants
in fish captured closer to the rig, it does not
confirm that adverse effects have occurred in
these individuals. Liver detoxification activity is
a biomarker of exposure to contaminants and
confirms uptake and processing of xenobiotics.
In order to assess potential effects related to the
metabolism of xenobiotics, it is relevant to measure
complementary biomarkers such as DNA damage.
During acute exposure of fish to aquatic
contaminants, EROD activity can be induced
several fold relative to the reference levels. While
EROD activity for other species such as trout is
recognised to be highly inducible, e.g. at least
10-fold higher relative to control fish (Whyte et al.,
2000), most fish species can only be induced at
much lower x-fold when subjected to continuous
exposure to contaminants. In the present study,
a maximum of two-fold induction was observed
at any time between gold-band snapper and red
emperor from reference and impacted sites. The
EROD activity levels were, however, of the same
order of magnitude as those observed in another
study conducted in the Timor Sea. Codi-King
et al., (2005) measured EROD activity levels in
gold-spotted trevally (Carangoides fulvoguttatus)
and the bar-cheeked coral trout (Plectropomus
maculatus) and found, for reference and produced
formation water-exposed fish, similar EROD activity
levels to those reported in the present study.
Comparatively, a three-year fish health monitoring
program conducted following the 2002 Prestige
oil spill that occurred off the north-west coast
of Spain established that only after two to three
years did the fish biomarker levels, including EROD
activity, returned to baseline levels (Martinez-
Gomez et al., 2009). Of particular concern to both
the Prestige and Montara spills is the release in
the marine environment of polycyclic aromatic
hydrocarbons (PAHs), as the parent compounds
as well as their metabolites can exhibit mutagenic
and/or carcinogenic potential, as well as induce
EROD activity. The Prestige oil involved a heavy
fuel oil (M-100) of different composition to the
Montara oil, however both crude oils had a low
presence of high molecular weight polycyclic
aromatic hydrocarbons (PAHs) (Alzaga et al., 2004).
Figure 28. EROD activity (pmol/ mg protein/ min) in goldband snapper captured at study sites in the Timor Sea in November 2009, March 2010 and November 2010. “Impacted” sites are in red and “reference” sites are in green. X denotes that no fish of this species were examined from this site. Numbers in columns denote the number of fish included in the analysis. Different letters above the columns denote significant difference (a = 0.05).

Page 50
Montara Well Release Monitoring Study S4A // Assessment of Effects on Timor Sea Fish
Figure 29. EROD activity (pmol/ mg protein/ min) in red emperor captured at study sites in the Timor Sea in November 2009, March 2010 and November 2010. “Impacted” sites are in red and “reference” sites are in green. X denotes that no fish of this species were examined from this site. Numbers in columns denote the number of fish included in the analysis. Different letters above the columns denote significant difference (a = 0.05).
Figure 30. EROD activity (pmol/ mg protein/ min) in rainbow runner captured at study sites in the Timor Sea in November 2009, March 2010 and November 2010. “Impacted” sites are in red and “reference” sites are in green. X denotes that no fish of this species were examined from this site. Numbers in columns denote the number of fish included in the analysis. Different letters above the columns denote significant difference (a = 0.05).
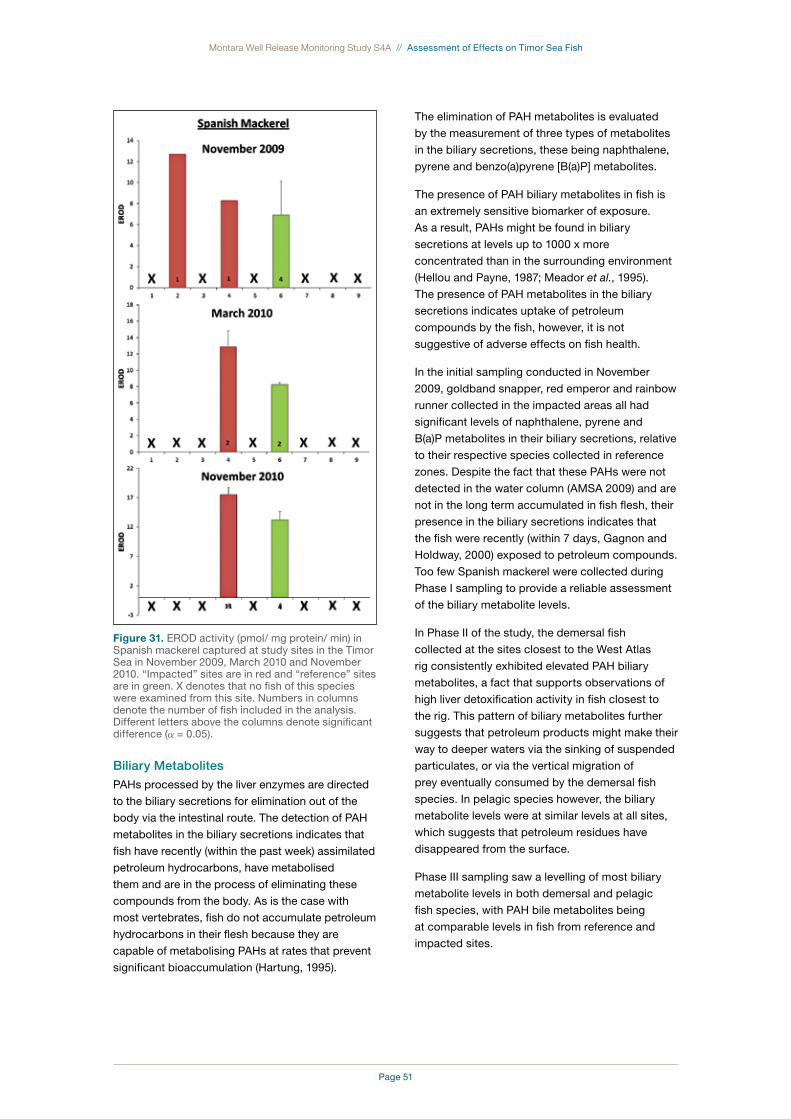
Page 51
Montara Well Release Monitoring Study S4A // Assessment of Effects on Timor Sea Fish
Figure 31. EROD activity (pmol/ mg protein/ min) in Spanish mackerel captured at study sites in the Timor Sea in November 2009, March 2010 and November 2010. “Impacted” sites are in red and “reference” sites are in green. X denotes that no fish of this species were examined from this site. Numbers in columns denote the number of fish included in the analysis. Different letters above the columns denote significant difference (a = 0.05).
Biliary MetabolitesPAHs processed by the liver enzymes are directed
to the biliary secretions for elimination out of the
body via the intestinal route. The detection of PAH
metabolites in the biliary secretions indicates that
fish have recently (within the past week) assimilated
petroleum hydrocarbons, have metabolised
them and are in the process of eliminating these
compounds from the body. As is the case with
most vertebrates, fish do not accumulate petroleum
hydrocarbons in their flesh because they are
capable of metabolising PAHs at rates that prevent
significant bioaccumulation (Hartung, 1995).
The elimination of PAH metabolites is evaluated
by the measurement of three types of metabolites
in the biliary secretions, these being naphthalene,
pyrene and benzo(a)pyrene [B(a)P] metabolites.
The presence of PAH biliary metabolites in fish is
an extremely sensitive biomarker of exposure.
As a result, PAHs might be found in biliary
secretions at levels up to 1000 x more
concentrated than in the surrounding environment
(Hellou and Payne, 1987; Meador et al., 1995).
The presence of PAH metabolites in the biliary
secretions indicates uptake of petroleum
compounds by the fish, however, it is not
suggestive of adverse effects on fish health.
In the initial sampling conducted in November
2009, goldband snapper, red emperor and rainbow
runner collected in the impacted areas all had
significant levels of naphthalene, pyrene and
B(a)P metabolites in their biliary secretions, relative
to their respective species collected in reference
zones. Despite the fact that these PAHs were not
detected in the water column (AMSA 2009) and are
not in the long term accumulated in fish flesh, their
presence in the biliary secretions indicates that
the fish were recently (within 7 days, Gagnon and
Holdway, 2000) exposed to petroleum compounds.
Too few Spanish mackerel were collected during
Phase I sampling to provide a reliable assessment
of the biliary metabolite levels.
In Phase II of the study, the demersal fish
collected at the sites closest to the West Atlas
rig consistently exhibited elevated PAH biliary
metabolites, a fact that supports observations of
high liver detoxification activity in fish closest to
the rig. This pattern of biliary metabolites further
suggests that petroleum products might make their
way to deeper waters via the sinking of suspended
particulates, or via the vertical migration of
prey eventually consumed by the demersal fish
species. In pelagic species however, the biliary
metabolite levels were at similar levels at all sites,
which suggests that petroleum residues have
disappeared from the surface.
Phase III sampling saw a levelling of most biliary
metabolite levels in both demersal and pelagic
fish species, with PAH bile metabolites being
at comparable levels in fish from reference and
impacted sites.
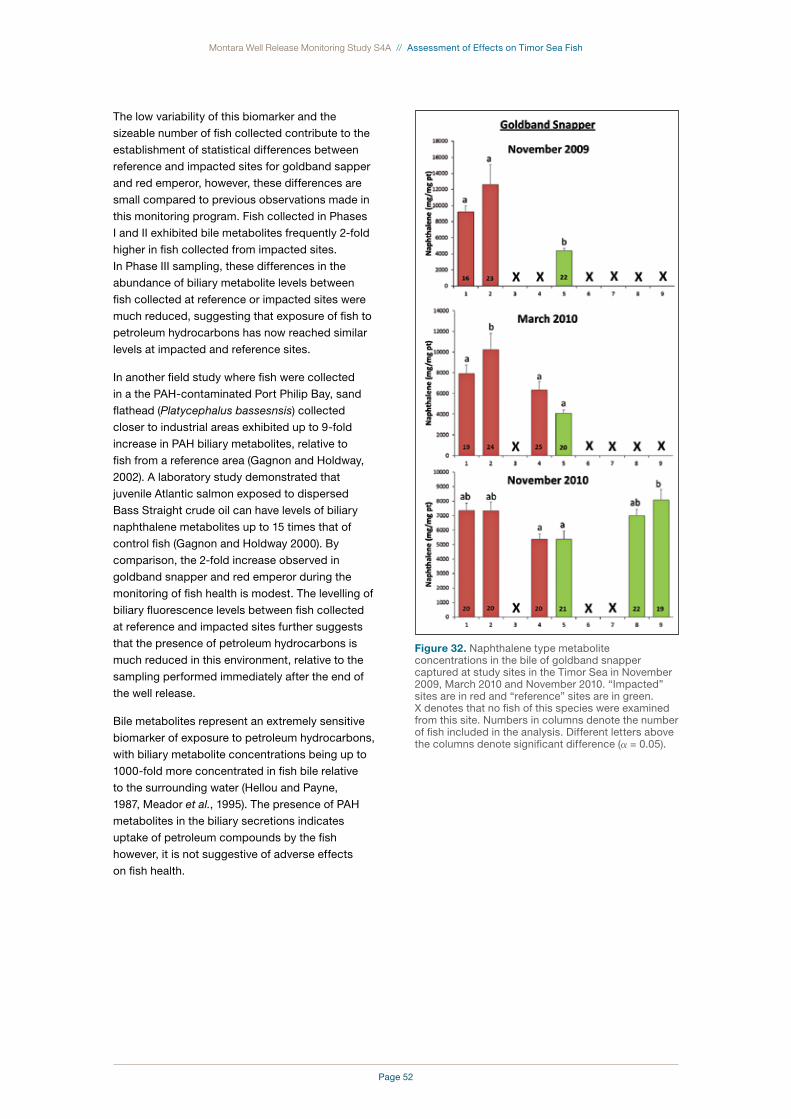
Page 52
Montara Well Release Monitoring Study S4A // Assessment of Effects on Timor Sea Fish
The low variability of this biomarker and the
sizeable number of fish collected contribute to the
establishment of statistical differences between
reference and impacted sites for goldband sapper
and red emperor, however, these differences are
small compared to previous observations made in
this monitoring program. Fish collected in Phases
I and II exhibited bile metabolites frequently 2-fold
higher in fish collected from impacted sites.
In Phase III sampling, these differences in the
abundance of biliary metabolite levels between
fish collected at reference or impacted sites were
much reduced, suggesting that exposure of fish to
petroleum hydrocarbons has now reached similar
levels at impacted and reference sites.
In another field study where fish were collected
in a the PAH-contaminated Port Philip Bay, sand
flathead (Platycephalus bassesnsis) collected
closer to industrial areas exhibited up to 9-fold
increase in PAH biliary metabolites, relative to
fish from a reference area (Gagnon and Holdway,
2002). A laboratory study demonstrated that
juvenile Atlantic salmon exposed to dispersed
Bass Straight crude oil can have levels of biliary
naphthalene metabolites up to 15 times that of
control fish (Gagnon and Holdway 2000). By
comparison, the 2-fold increase observed in
goldband snapper and red emperor during the
monitoring of fish health is modest. The levelling of
biliary fluorescence levels between fish collected
at reference and impacted sites further suggests
that the presence of petroleum hydrocarbons is
much reduced in this environment, relative to the
sampling performed immediately after the end of
the well release.
Bile metabolites represent an extremely sensitive
biomarker of exposure to petroleum hydrocarbons,
with biliary metabolite concentrations being up to
1000-fold more concentrated in fish bile relative
to the surrounding water (Hellou and Payne,
1987, Meador et al., 1995). The presence of PAH
metabolites in the biliary secretions indicates
uptake of petroleum compounds by the fish
however, it is not suggestive of adverse effects
on fish health.
Figure 32. Naphthalene type metabolite concentrations in the bile of goldband snapper captured at study sites in the Timor Sea in November 2009, March 2010 and November 2010. “Impacted” sites are in red and “reference” sites are in green. X denotes that no fish of this species were examined from this site. Numbers in columns denote the number of fish included in the analysis. Different letters above the columns denote significant difference (a = 0.05).
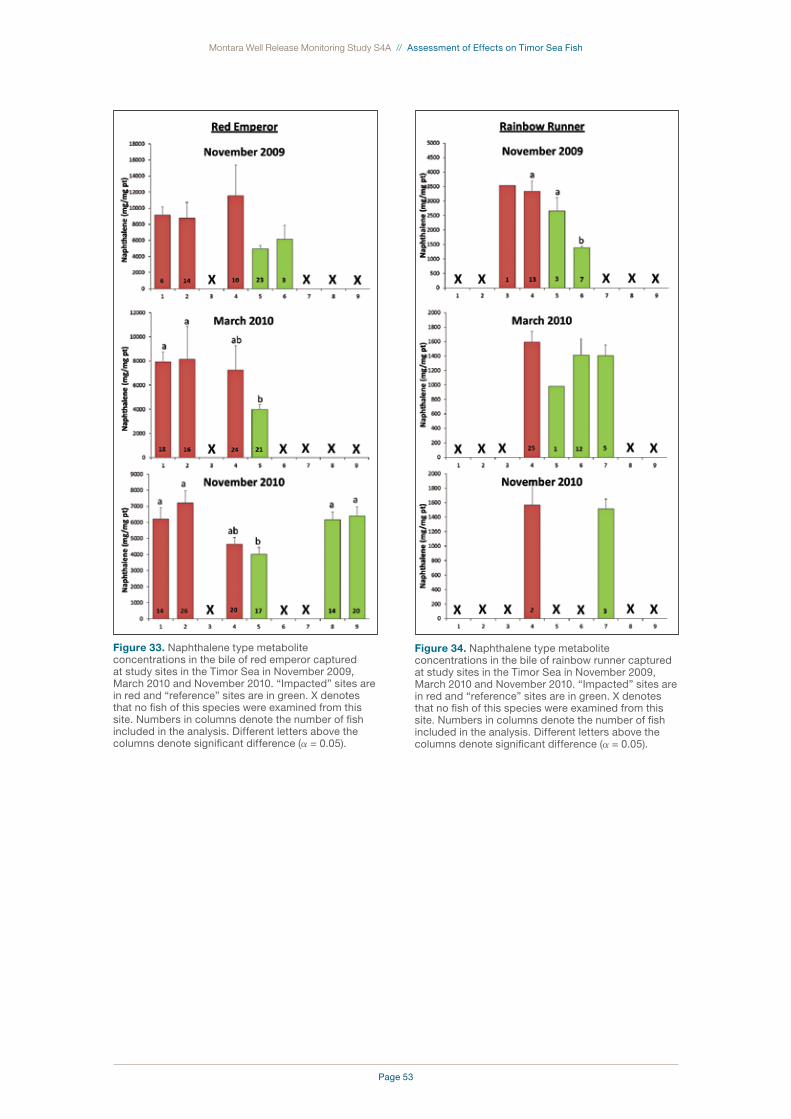
Page 53
Montara Well Release Monitoring Study S4A // Assessment of Effects on Timor Sea Fish
Figure 33. Naphthalene type metabolite concentrations in the bile of red emperor captured at study sites in the Timor Sea in November 2009, March 2010 and November 2010. “Impacted” sites are in red and “reference” sites are in green. X denotes that no fish of this species were examined from this site. Numbers in columns denote the number of fish included in the analysis. Different letters above the columns denote significant difference (a = 0.05).
Figure 34. Naphthalene type metabolite concentrations in the bile of rainbow runner captured at study sites in the Timor Sea in November 2009, March 2010 and November 2010. “Impacted” sites are in red and “reference” sites are in green. X denotes that no fish of this species were examined from this site. Numbers in columns denote the number of fish included in the analysis. Different letters above the columns denote significant difference (a = 0.05).
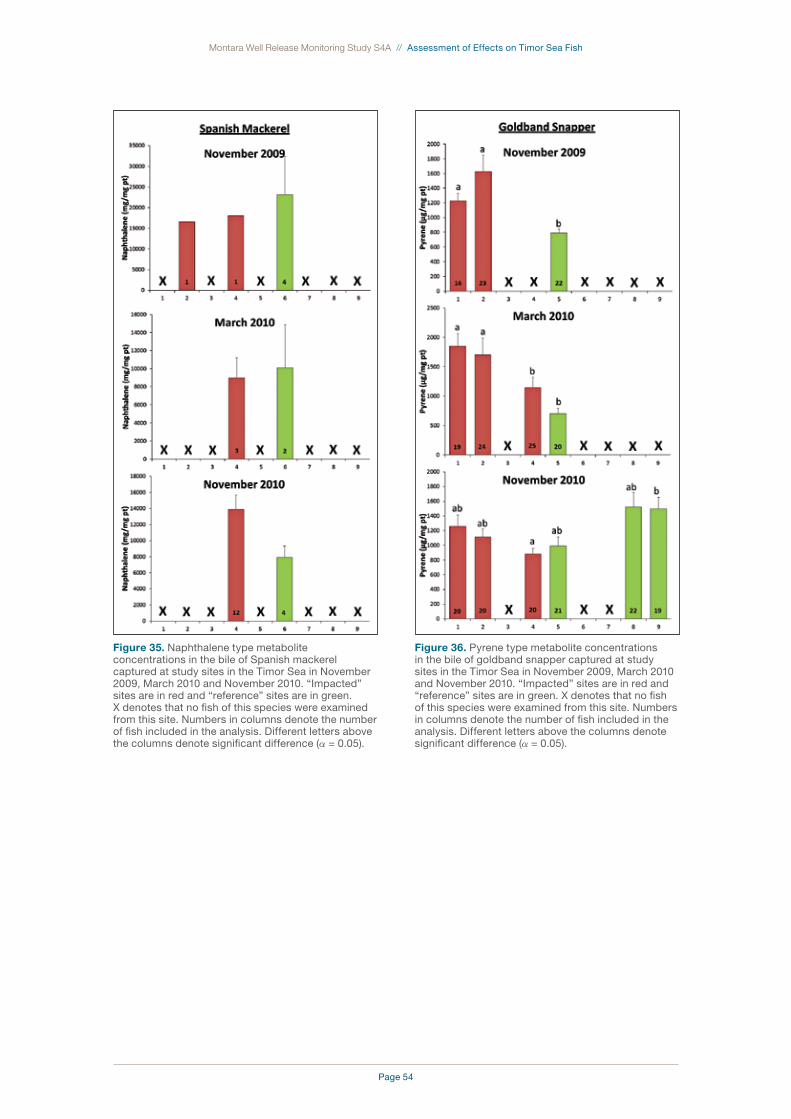
Page 54
Montara Well Release Monitoring Study S4A // Assessment of Effects on Timor Sea Fish
Figure 35. Naphthalene type metabolite concentrations in the bile of Spanish mackerel captured at study sites in the Timor Sea in November 2009, March 2010 and November 2010. “Impacted” sites are in red and “reference” sites are in green. X denotes that no fish of this species were examined from this site. Numbers in columns denote the number of fish included in the analysis. Different letters above the columns denote significant difference (a = 0.05).
Figure 36. Pyrene type metabolite concentrations in the bile of goldband snapper captured at study sites in the Timor Sea in November 2009, March 2010 and November 2010. “Impacted” sites are in red and “reference” sites are in green. X denotes that no fish of this species were examined from this site. Numbers in columns denote the number of fish included in the analysis. Different letters above the columns denote significant difference (a = 0.05).
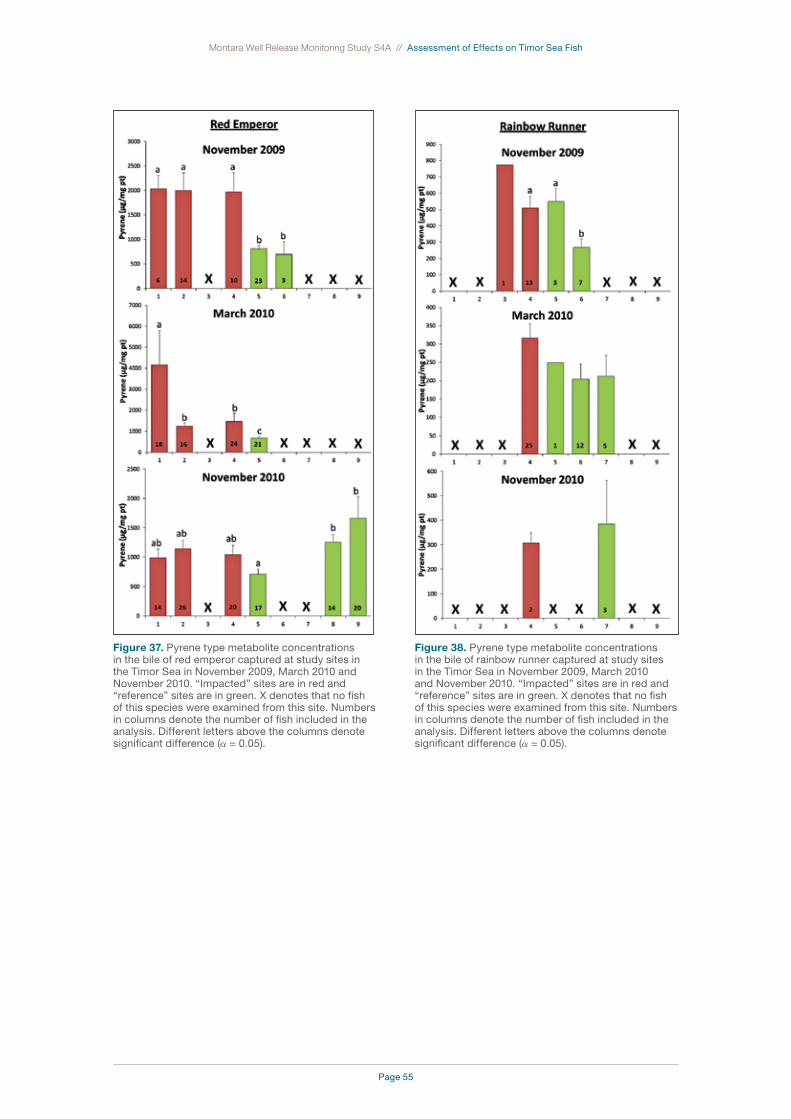
Page 55
Montara Well Release Monitoring Study S4A // Assessment of Effects on Timor Sea Fish
Figure 37. Pyrene type metabolite concentrations in the bile of red emperor captured at study sites in the Timor Sea in November 2009, March 2010 and November 2010. “Impacted” sites are in red and “reference” sites are in green. X denotes that no fish of this species were examined from this site. Numbers in columns denote the number of fish included in the analysis. Different letters above the columns denote significant difference (a = 0.05).
Figure 38. Pyrene type metabolite concentrations in the bile of rainbow runner captured at study sites in the Timor Sea in November 2009, March 2010 and November 2010. “Impacted” sites are in red and “reference” sites are in green. X denotes that no fish of this species were examined from this site. Numbers in columns denote the number of fish included in the analysis. Different letters above the columns denote significant difference (a = 0.05).

Page 56
Montara Well Release Monitoring Study S4A // Assessment of Effects on Timor Sea Fish
Figure 39. Pyrene type metabolite concentrations in the bile of Spanish mackerel captured at study sites in the Timor Sea in November 2009, March 2010 and November 2010. “Impacted” sites are in red and “reference” sites are in green. X denotes that no fish of this species were examined from this site. Numbers in columns denote the number of fish included in the analysis. Different letters above the columns denote significant difference (a = 0.05).
Figure 40. Benzo(a)pyrene type metabolite concentrations in the bile of goldband snapper captured at study sites in the Timor Sea in November 2009, March 2010 and November 2010. “Impacted” sites are in red and “reference” sites are in green. X denotes that no fish of this species were examined from this site. Numbers in columns denote the number of fish included in the analysis. Different letters above the columns denote significant difference (a = 0.05).
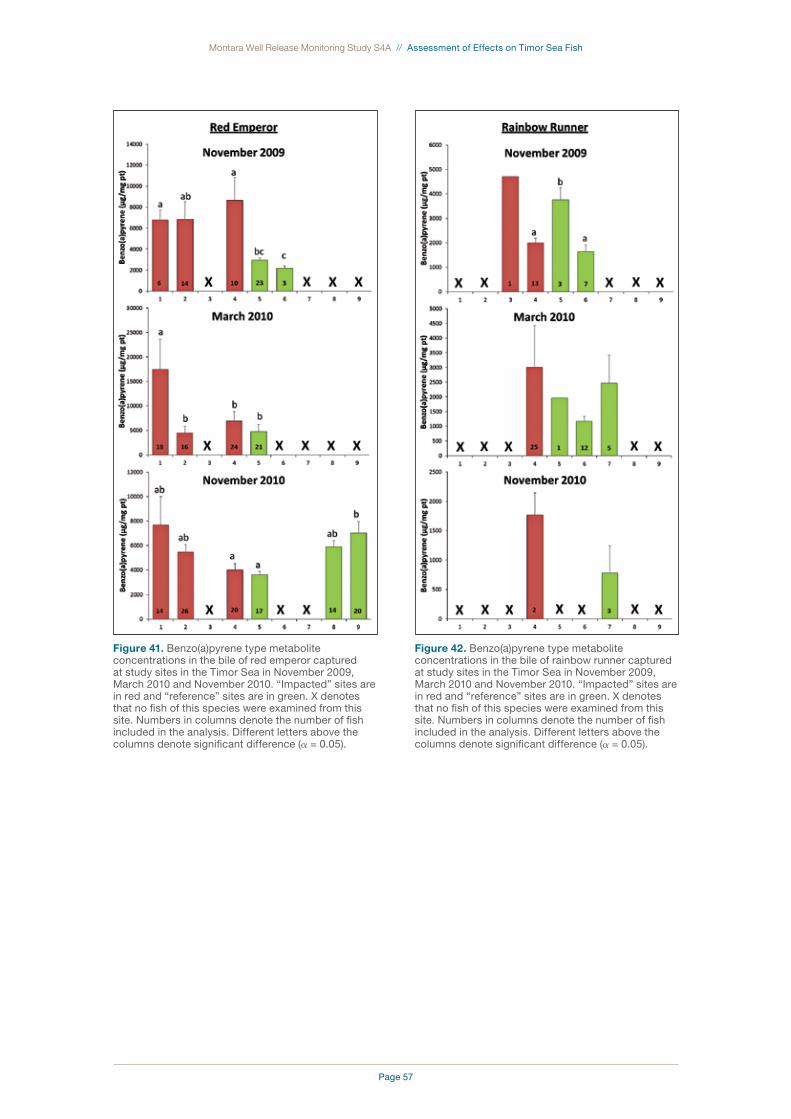
Page 57
Montara Well Release Monitoring Study S4A // Assessment of Effects on Timor Sea Fish
Figure 41. Benzo(a)pyrene type metabolite concentrations in the bile of red emperor captured at study sites in the Timor Sea in November 2009, March 2010 and November 2010. “Impacted” sites are in red and “reference” sites are in green. X denotes that no fish of this species were examined from this site. Numbers in columns denote the number of fish included in the analysis. Different letters above the columns denote significant difference (a = 0.05).
Figure 42. Benzo(a)pyrene type metabolite concentrations in the bile of rainbow runner captured at study sites in the Timor Sea in November 2009, March 2010 and November 2010. “Impacted” sites are in red and “reference” sites are in green. X denotes that no fish of this species were examined from this site. Numbers in columns denote the number of fish included in the analysis. Different letters above the columns denote significant difference (a = 0.05).
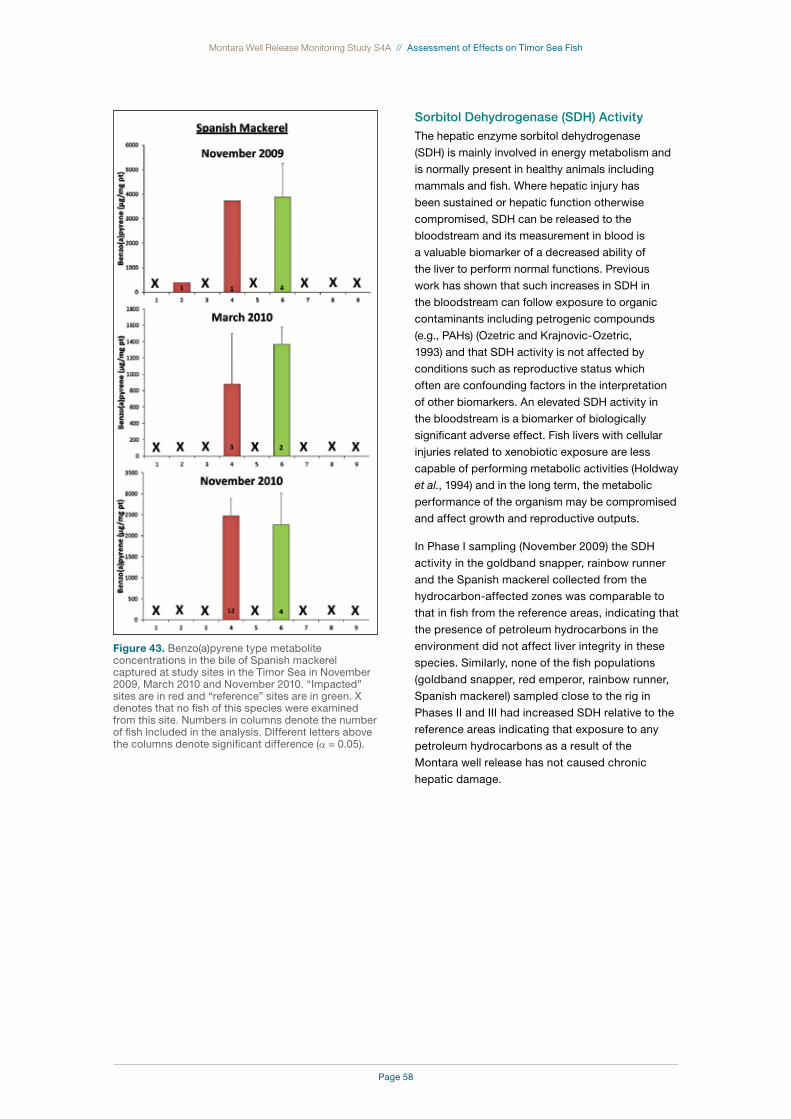
Page 58
Montara Well Release Monitoring Study S4A // Assessment of Effects on Timor Sea Fish
Figure 43. Benzo(a)pyrene type metabolite concentrations in the bile of Spanish mackerel captured at study sites in the Timor Sea in November 2009, March 2010 and November 2010. “Impacted” sites are in red and “reference” sites are in green. X denotes that no fish of this species were examined from this site. Numbers in columns denote the number of fish included in the analysis. Different letters above the columns denote significant difference (a = 0.05).
Sorbitol Dehydrogenase (SDH) ActivityThe hepatic enzyme sorbitol dehydrogenase
(SDH) is mainly involved in energy metabolism and
is normally present in healthy animals including
mammals and fish. Where hepatic injury has
been sustained or hepatic function otherwise
compromised, SDH can be released to the
bloodstream and its measurement in blood is
a valuable biomarker of a decreased ability of
the liver to perform normal functions. Previous
work has shown that such increases in SDH in
the bloodstream can follow exposure to organic
contaminants including petrogenic compounds
(e.g., PAHs) (Ozetric and Krajnovic-Ozetric,
1993) and that SDH activity is not affected by
conditions such as reproductive status which
often are confounding factors in the interpretation
of other biomarkers. An elevated SDH activity in
the bloodstream is a biomarker of biologically
significant adverse effect. Fish livers with cellular
injuries related to xenobiotic exposure are less
capable of performing metabolic activities (Holdway
et al., 1994) and in the long term, the metabolic
performance of the organism may be compromised
and affect growth and reproductive outputs.
In Phase I sampling (November 2009) the SDH
activity in the goldband snapper, rainbow runner
and the Spanish mackerel collected from the
hydrocarbon-affected zones was comparable to
that in fish from the reference areas, indicating that
the presence of petroleum hydrocarbons in the
environment did not affect liver integrity in these
species. Similarly, none of the fish populations
(goldband snapper, red emperor, rainbow runner,
Spanish mackerel) sampled close to the rig in
Phases II and III had increased SDH relative to the
reference areas indicating that exposure to any
petroleum hydrocarbons as a result of the
Montara well release has not caused chronic
hepatic damage.
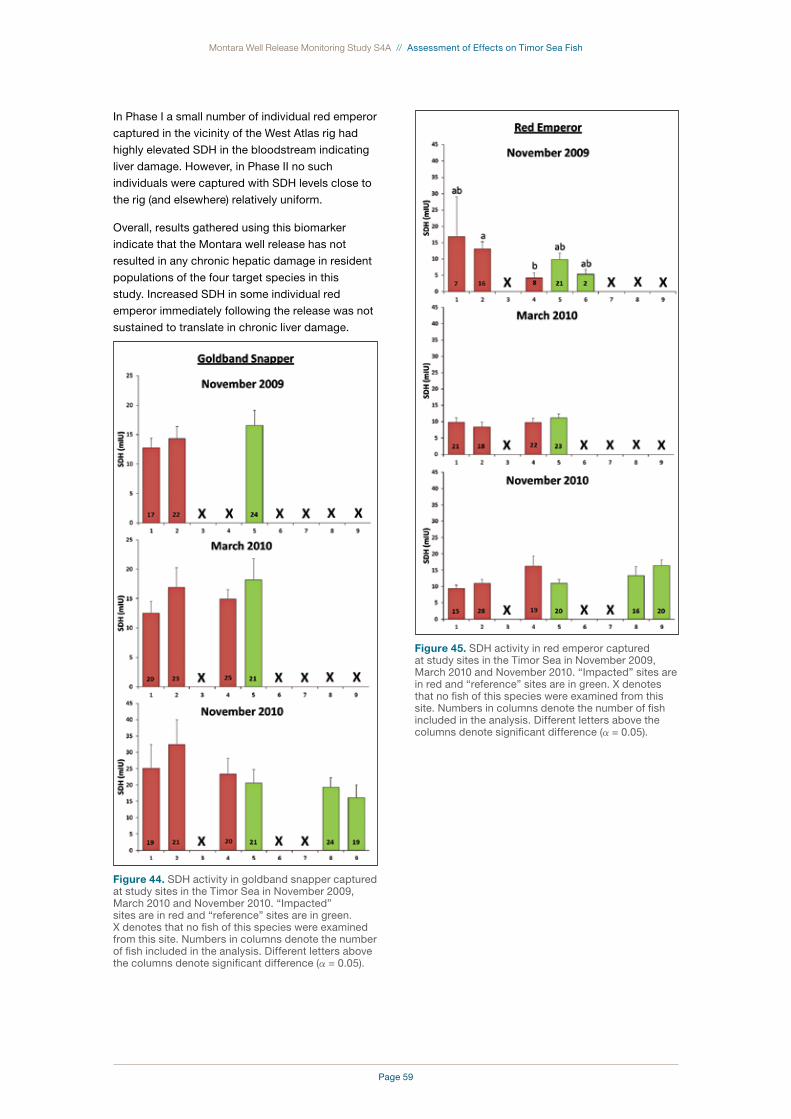
Page 59
Montara Well Release Monitoring Study S4A // Assessment of Effects on Timor Sea Fish
In Phase I a small number of individual red emperor
captured in the vicinity of the West Atlas rig had
highly elevated SDH in the bloodstream indicating
liver damage. However, in Phase II no such
individuals were captured with SDH levels close to
the rig (and elsewhere) relatively uniform.
Overall, results gathered using this biomarker
indicate that the Montara well release has not
resulted in any chronic hepatic damage in resident
populations of the four target species in this
study. Increased SDH in some individual red
emperor immediately following the release was not
sustained to translate in chronic liver damage.
Figure 44. SDH activity in goldband snapper captured at study sites in the Timor Sea in November 2009, March 2010 and November 2010. “Impacted” sites are in red and “reference” sites are in green. X denotes that no fish of this species were examined from this site. Numbers in columns denote the number of fish included in the analysis. Different letters above the columns denote significant difference (a = 0.05).
Figure 45. SDH activity in red emperor captured at study sites in the Timor Sea in November 2009, March 2010 and November 2010. “Impacted” sites are in red and “reference” sites are in green. X denotes that no fish of this species were examined from this site. Numbers in columns denote the number of fish included in the analysis. Different letters above the columns denote significant difference (a = 0.05).
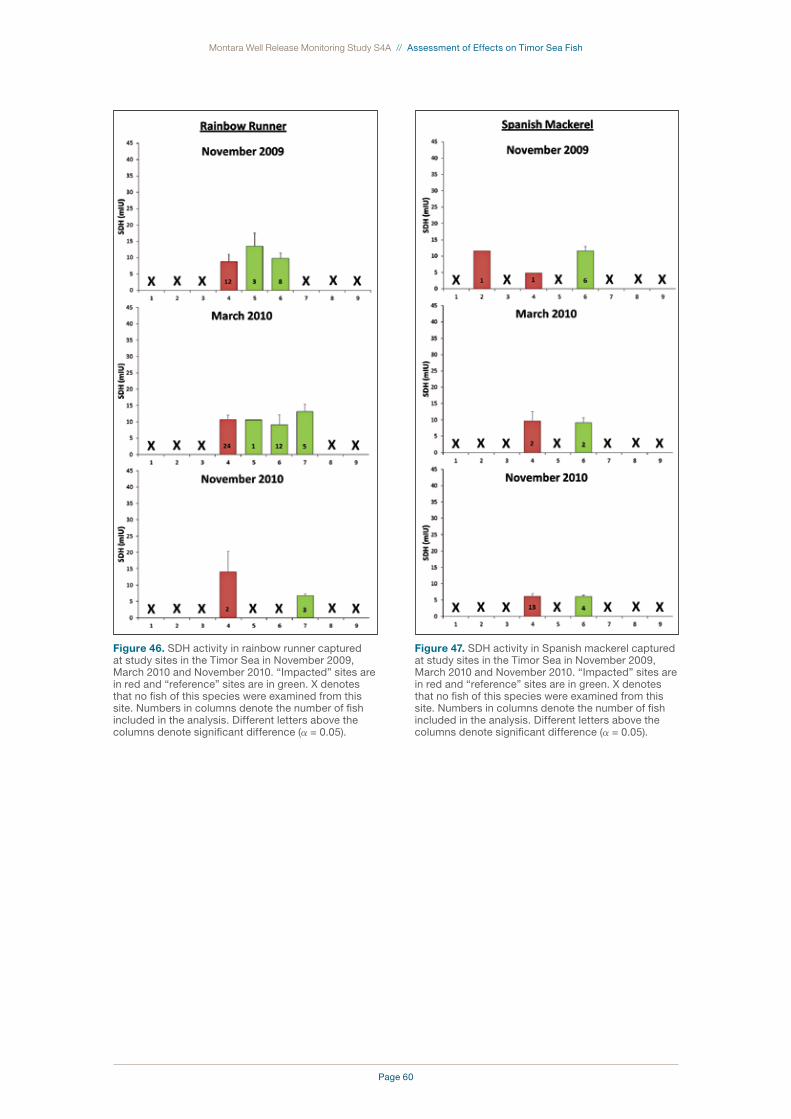
Page 60
Montara Well Release Monitoring Study S4A // Assessment of Effects on Timor Sea Fish
Figure 46. SDH activity in rainbow runner captured at study sites in the Timor Sea in November 2009, March 2010 and November 2010. “Impacted” sites are in red and “reference” sites are in green. X denotes that no fish of this species were examined from this site. Numbers in columns denote the number of fish included in the analysis. Different letters above the columns denote significant difference (a = 0.05).
Figure 47. SDH activity in Spanish mackerel captured at study sites in the Timor Sea in November 2009, March 2010 and November 2010. “Impacted” sites are in red and “reference” sites are in green. X denotes that no fish of this species were examined from this site. Numbers in columns denote the number of fish included in the analysis. Different letters above the columns denote significant difference (a = 0.05).
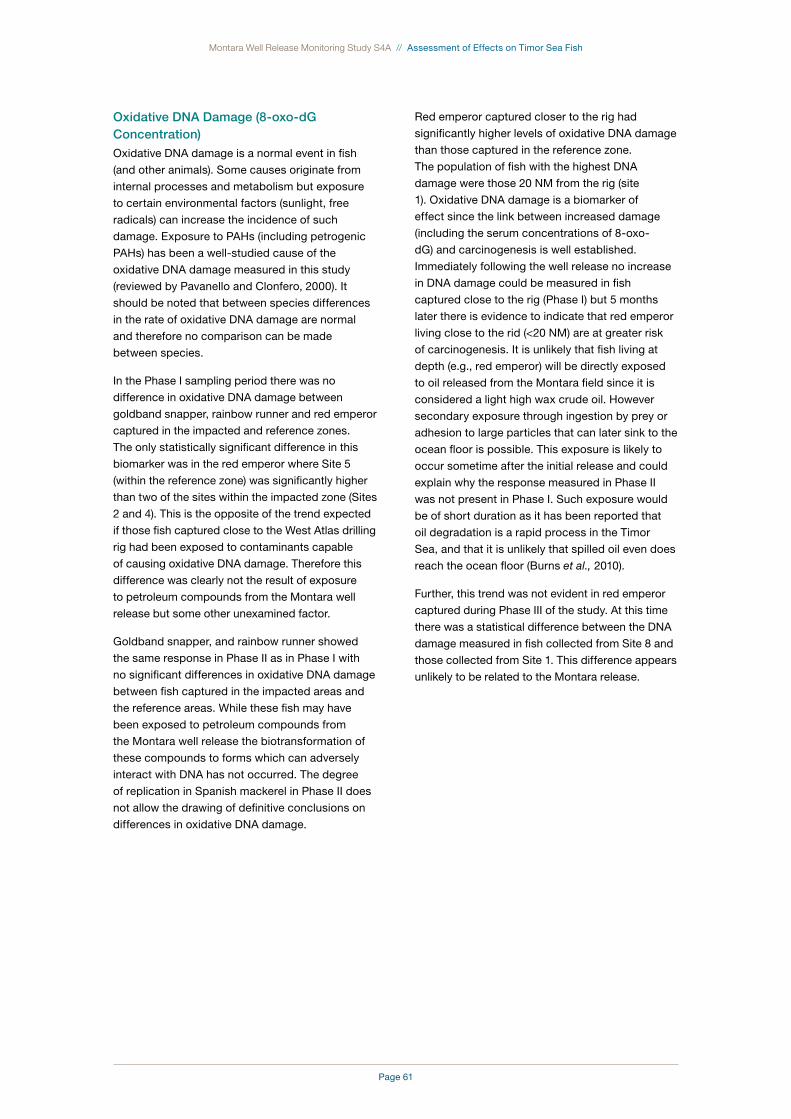
Page 61
Montara Well Release Monitoring Study S4A // Assessment of Effects on Timor Sea Fish
Oxidative DNA Damage (8-oxo-dG Concentration)Oxidative DNA damage is a normal event in fish
(and other animals). Some causes originate from
internal processes and metabolism but exposure
to certain environmental factors (sunlight, free
radicals) can increase the incidence of such
damage. Exposure to PAHs (including petrogenic
PAHs) has been a well-studied cause of the
oxidative DNA damage measured in this study
(reviewed by Pavanello and Clonfero, 2000). It
should be noted that between species differences
in the rate of oxidative DNA damage are normal
and therefore no comparison can be made
between species.
In the Phase I sampling period there was no
difference in oxidative DNA damage between
goldband snapper, rainbow runner and red emperor
captured in the impacted and reference zones.
The only statistically significant difference in this
biomarker was in the red emperor where Site 5
(within the reference zone) was significantly higher
than two of the sites within the impacted zone (Sites
2 and 4). This is the opposite of the trend expected
if those fish captured close to the West Atlas drilling
rig had been exposed to contaminants capable
of causing oxidative DNA damage. Therefore this
difference was clearly not the result of exposure
to petroleum compounds from the Montara well
release but some other unexamined factor.
Goldband snapper, and rainbow runner showed
the same response in Phase II as in Phase I with
no significant differences in oxidative DNA damage
between fish captured in the impacted areas and
the reference areas. While these fish may have
been exposed to petroleum compounds from
the Montara well release the biotransformation of
these compounds to forms which can adversely
interact with DNA has not occurred. The degree
of replication in Spanish mackerel in Phase II does
not allow the drawing of definitive conclusions on
differences in oxidative DNA damage.
Red emperor captured closer to the rig had
significantly higher levels of oxidative DNA damage
than those captured in the reference zone.
The population of fish with the highest DNA
damage were those 20 NM from the rig (site
1). Oxidative DNA damage is a biomarker of
effect since the link between increased damage
(including the serum concentrations of 8-oxo-
dG) and carcinogenesis is well established.
Immediately following the well release no increase
in DNA damage could be measured in fish
captured close to the rig (Phase I) but 5 months
later there is evidence to indicate that red emperor
living close to the rid (<20 NM) are at greater risk
of carcinogenesis. It is unlikely that fish living at
depth (e.g., red emperor) will be directly exposed
to oil released from the Montara field since it is
considered a light high wax crude oil. However
secondary exposure through ingestion by prey or
adhesion to large particles that can later sink to the
ocean floor is possible. This exposure is likely to
occur sometime after the initial release and could
explain why the response measured in Phase II
was not present in Phase I. Such exposure would
be of short duration as it has been reported that
oil degradation is a rapid process in the Timor
Sea, and that it is unlikely that spilled oil even does
reach the ocean floor (Burns et al., 2010).
Further, this trend was not evident in red emperor
captured during Phase III of the study. At this time
there was a statistical difference between the DNA
damage measured in fish collected from Site 8 and
those collected from Site 1. This difference appears
unlikely to be related to the Montara release.
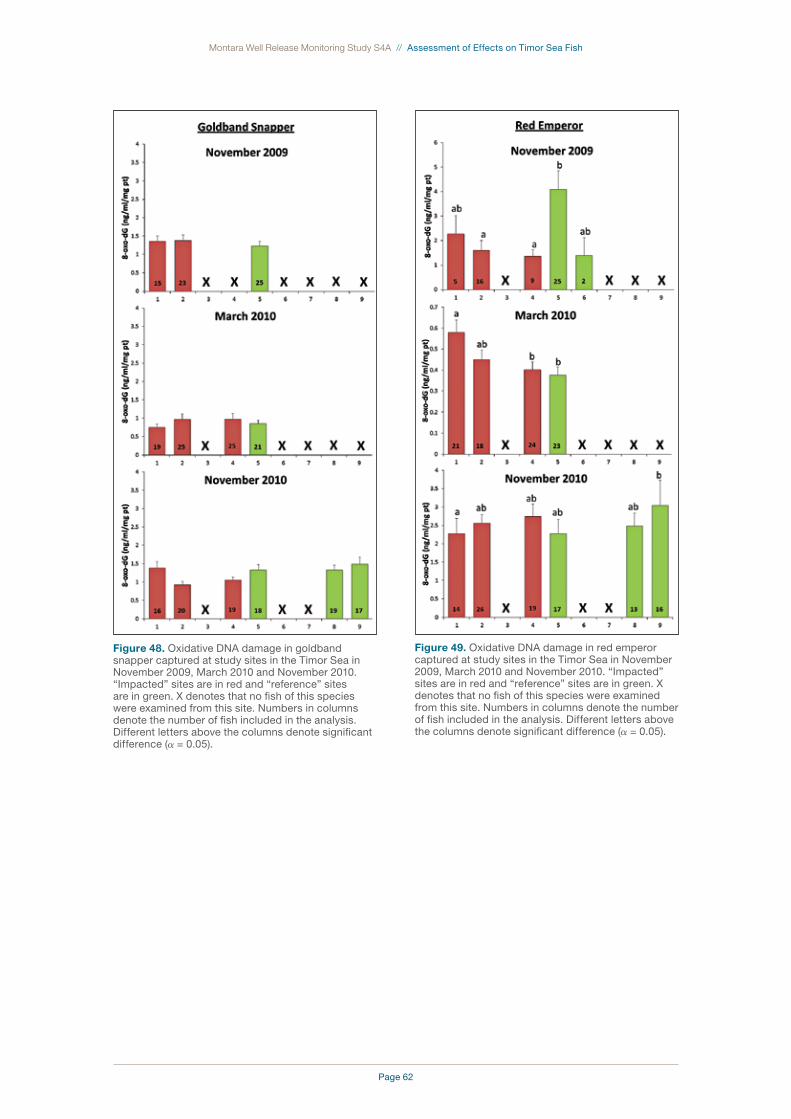
Page 62
Montara Well Release Monitoring Study S4A // Assessment of Effects on Timor Sea Fish
Figure 48. Oxidative DNA damage in goldband snapper captured at study sites in the Timor Sea in November 2009, March 2010 and November 2010. “Impacted” sites are in red and “reference” sites are in green. X denotes that no fish of this species were examined from this site. Numbers in columns denote the number of fish included in the analysis. Different letters above the columns denote significant difference (a = 0.05).
Figure 49. Oxidative DNA damage in red emperor captured at study sites in the Timor Sea in November 2009, March 2010 and November 2010. “Impacted” sites are in red and “reference” sites are in green. X denotes that no fish of this species were examined from this site. Numbers in columns denote the number of fish included in the analysis. Different letters above the columns denote significant difference (a = 0.05).
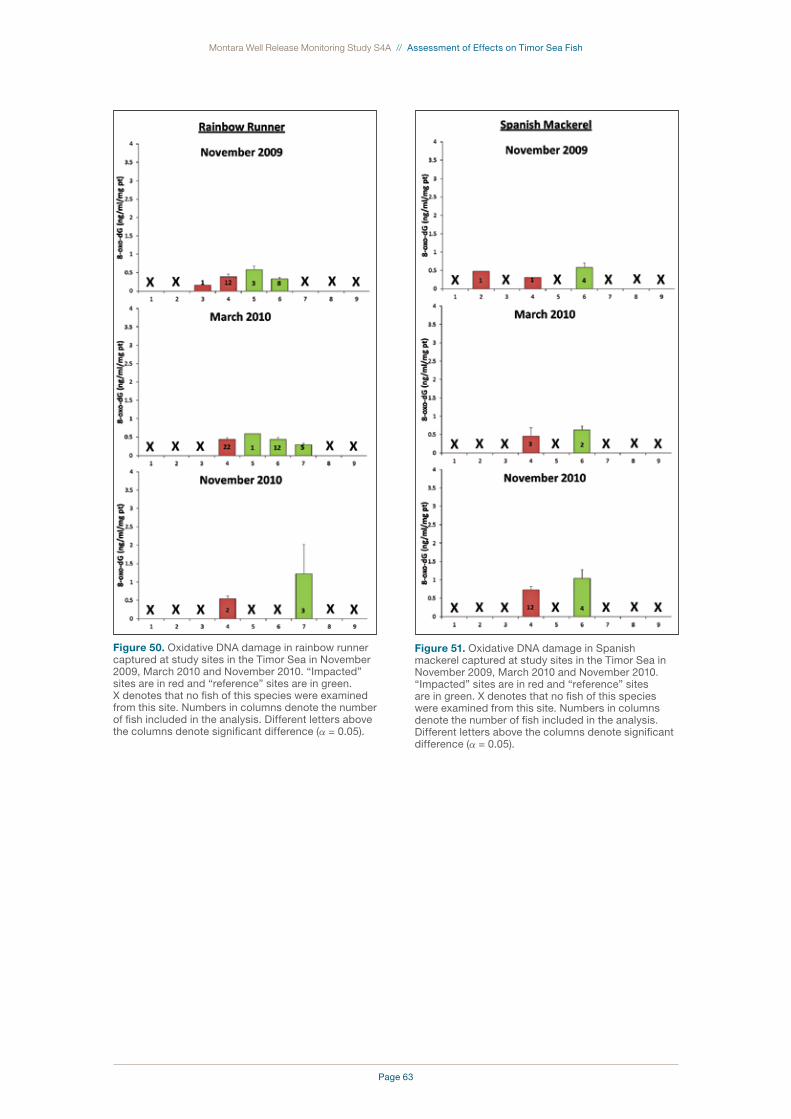
Page 63
Montara Well Release Monitoring Study S4A // Assessment of Effects on Timor Sea Fish
Figure 50. Oxidative DNA damage in rainbow runner captured at study sites in the Timor Sea in November 2009, March 2010 and November 2010. “Impacted” sites are in red and “reference” sites are in green. X denotes that no fish of this species were examined from this site. Numbers in columns denote the number of fish included in the analysis. Different letters above the columns denote significant difference (a = 0.05).
Figure 51. Oxidative DNA damage in Spanish mackerel captured at study sites in the Timor Sea in November 2009, March 2010 and November 2010. “Impacted” sites are in red and “reference” sites are in green. X denotes that no fish of this species were examined from this site. Numbers in columns denote the number of fish included in the analysis. Different letters above the columns denote significant difference (a = 0.05).
Page 64
Montara Well Release Monitoring Study S4A // Assessment of Effects on Timor Sea Fish
Multivariate AnalysisMultivariate analysis is a powerful tool for visualising and explaining overall trends across a number of variables. In this case, these variables were the key measured biomarkers measured in the study (SDH, oxidative DNA damage, condition factor, LSI, naphthalene metabolites, pyrene metabolites and benzo(a)pyrene metabolites and EROD activity). Only the results for goldband snapper and red emperor are discussed as the low catch rate of pelagic species reduced the efficacy of the analysis.
In Phase I there were overall significant differences between goldband snapper captured at the impacted sites (site 1 and site 2) and the reference site (site 5) (ANOSIM). Principal Components Analysis (PCA) showed that these differences were along a component (PC1) which was strongly explained by pyrene and benzo(a)pyrene metabolites and to a lesser extent by naphthalene metabolites. The two impacted sites were separated from the reference site by increasing levels of these biomarkers. Other biomarkers contributed little to this separation between sites. In phase III there was a similar trend in separation of sites along an axis explained by all bile metabolites and there was a significant difference between each of the impacted sites and the reference site when all biomarkers were considered together (ANOSIM). In Phase III there were a greater number of statistical differences between the sites (ANOSIM) separation of sites was greater (e.g., the impacted sites 1 and 2 were considered different whereas in Phases I and II they were considered statistically similar). A PCA of this data indicates that there appeared to be a decreased separation of individual animals and collectively by collection site along an axis strongly explained by increasing levels of bile metabolites.
Similar trends were found when the results for the biomarkers measured in red emperor were analysed using these techniques. In Phase I, the reference site (site 5) was found to be statistically different to the other sites in the analysis (ANOSIM). A PCA including the same biomarkers as above indicated a separation of these sites along PC1 which was influenced by the bile metabolite measures. In Phase II the differences between the reference site (site 5) and the 2 impacted sites located nearest the West Atlas drilling rig (sites 1 and 2) remained but there was no difference between the impacted site 4 and this reference site. As with goldband snapper there was an increase in the reported differences between sites (ANOSIM) in Phase III and PCA indicated that this was mostly along PC1 which was explained mostly by differences in bile metabolite measures.
Despite, the PCA plot suggests an increasing overlap of individuals from different sites indicating a convergence of the overall biomarker signal.
These analyses indicate that the measurement of bile metabolites is the most sensitive of these biomarkers in identifying differences between fish captured at different study sites in the Timor Sea. If fish were exposed to a single pulse of hydrocarbons from the Montara well release it would be expected that the separation between sites due to increases in levels of these metabolites would decrease through time. The sequential PCA plots for both goldband snapper and red emperor indicate that this may broadly be the case with increasing overlap between individuals from the different study sites through time.
It should be noted that the observed increased in statistical difference between the sites may be due to the increased power in these tests to detect a statistical difference associated with increasing replication. Care must be taken in interpreting the results on ANOSIM with increased replication. The algorithms associated with this analysis mean that increased replication could eventually lead to biologically irrelevant statistical differences being reported.
Care should also be taken in attributing cause and effect based on the above analyses. There are number of factors which could contribute to variation between individuals and populations which have not been included in this analysis. The most important of these is location (latitude). In Phase I, both goldband snapper and red emperor showed a neat separation between the impacted sites 1 and 2 (grouped together by ANOSIM) and the reference site 5. Site 5 is located approximately 80 NM south of site 1 and 60 NM south of site 2, It is possible that the variation noted in the analysis is simply a latitudinal gradient. It is also possible that the differences could be due to continued exposure to hydrocarbons from natural sea floor seeps which are known to occur in the area (Burns et al., 2010) or that if the study were to extend to sites at lower latitudes that a continued increase in measured bile metabolites would be observed beyond the site of the Montara well release. Finally, it is also possible that despite the continuing trend towards convergence observed through time, that the inter-site differences observed might be largely due to natural variations between fish populations. These results suggest that the fish at the different sites express the biomarkers differently and that the bile metabolites are the most sensitive biomarker in detecting this difference. The PCA suggests that the differences between sites are decreasing through time.
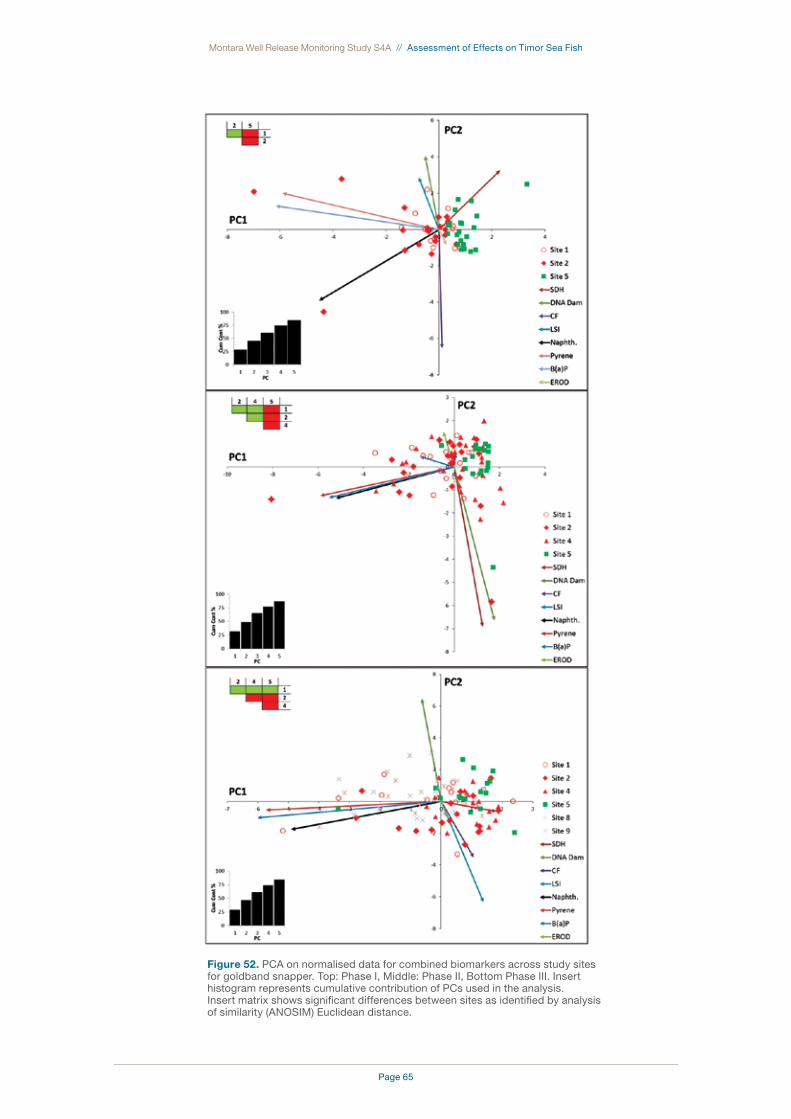
Page 65
Montara Well Release Monitoring Study S4A // Assessment of Effects on Timor Sea Fish
Figure 52. PCA on normalised data for combined biomarkers across study sites for goldband snapper. Top: Phase I, Middle: Phase II, Bottom Phase III. Insert histogram represents cumulative contribution of PCs used in the analysis. Insert matrix shows significant differences between sites as identified by analysis of similarity (ANOSIM) Euclidean distance.
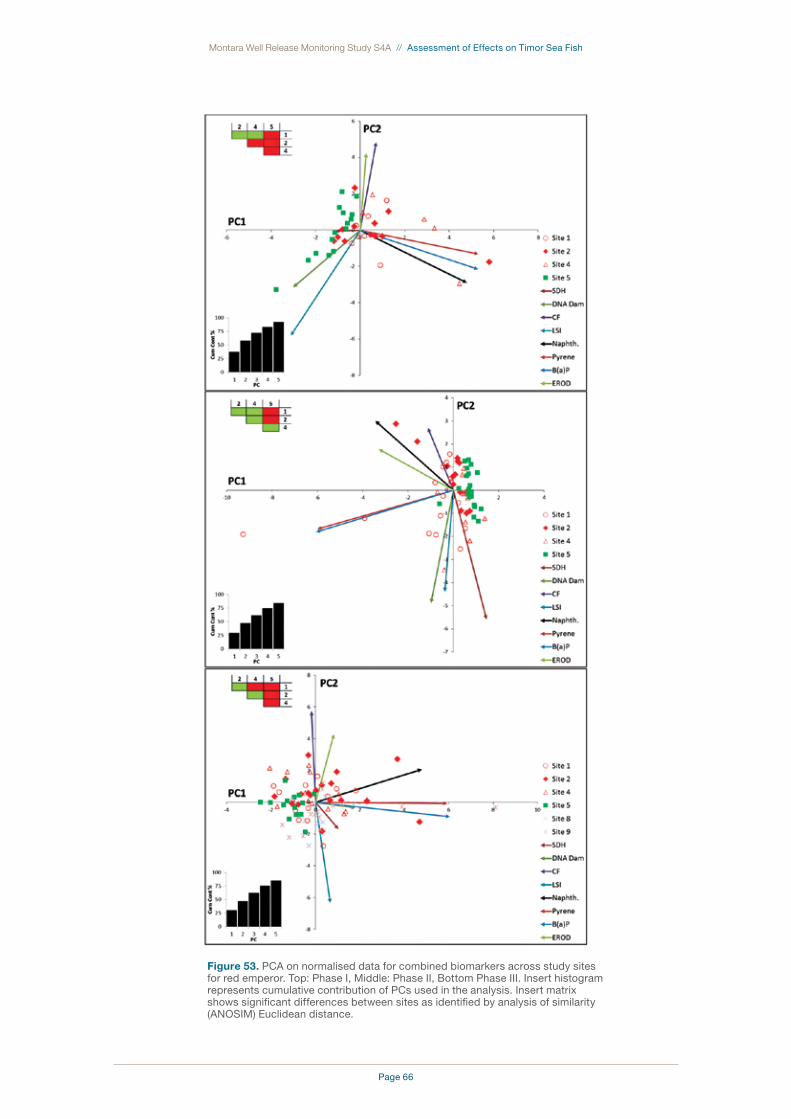
Page 66
Montara Well Release Monitoring Study S4A // Assessment of Effects on Timor Sea Fish
Figure 53. PCA on normalised data for combined biomarkers across study sites for red emperor. Top: Phase I, Middle: Phase II, Bottom Phase III. Insert histogram represents cumulative contribution of PCs used in the analysis. Insert matrix shows significant differences between sites as identified by analysis of similarity (ANOSIM) Euclidean distance.

Page 67
Montara Well Release Monitoring Study S4A // Assessment of Effects on Timor Sea Fish
The Montara well release that occurred in August 2009 released an estimated
23,000 barrels of oil and gas condensate in the Timor Sea over seventy-four days,
and caused immediate concerns regarding the adverse impacts on commercial
fisheries. To assess the potential impacts of hydrocarbon exposure on fish health,
an investigation was undertaken to collected biopsies on two demersal and two
pelagic fish species found in the impacted areas of the Timor Sea, and compare
observations to those made in reference, non-impacted areas. The investigation
evaluated fish health using physiological indices, reproductive histology, and
biochemical markers on goldband snapper, red emperor, rainbow runner and
Spanish mackerel. Biopsies were collected immediately after the end of the well
release in November 2009 (Phase I), and again four months after the end of the
spill in March 2010 (Phase II) and a year after the well release in November 2010
(Phase III) on a total of 781 fish.
Conclusions

Page 68
Montara Well Release Monitoring Study S4A // Assessment of Effects on Timor Sea Fish
The initial Phase I investigation revealed that
exposure of surface and deep sea fish to petroleum
hydrocarbons had occurred, but no ill effects could
be identified consistently in any of the selected
fish species. Phase I results showed that although
uptake of petroleum hydrocarbons by the fish was
confirmed by high biliary PAH metabolite contents
fish were in good physical condition; physiological
indices CF, LSI and GSI were unchanged following
exposure to petroleum hydrocarbons; no alteration
of gonadal development could be detected by
histological examination; liver detoxification and
liver integrity were unchanged; and DNA integrity
was not compromised in hydrocarbon fish of all
species. Overall, Phase I confirmed exposure to
petroleum hydrocarbons, but limited ill effects
could be detected in a small number of individual
fish only, and no consistent adverse effects of
exposure on fish health could be detected within
two weeks following the end of the well release.
Phase II of the study investigated possible
chronic effects related to the release of petroleum
hydrocarbons in the marine environment. Four
months following the end of the well release,
evidences of continuing uptake of petroleum
hydrocarbons was still apparent in fish collected
within 20 NM from the West Atlas rig. Results
from Phase II indicated that, relative to reference
areas, fish collected in the hydrocarbon-affected
zones remained in good physical condition, with
red emperor showing a higher CF in fish captured
closest to the rig; red emperor collected closest to
the rig also had larger livers, while other species
had unchanged liver size; male goldband snapper
and female rainbow runner captured close to the
rig had smaller gonad size relative to body weight
while other species showed no inter-site difference;
no alteration of gonadal development could be
detected by histological examination in all species;
red emperor, goldband snapper and rainbow
runner collected in the impacted zones had
elevated liver detoxification activity; liver integrity
was unchanged in all fish species; Oxidative DNA
damage was unchanged in goldband snapper and
rainbow runner, but was increased in red emperor
collected within 20 NM from the rig. Overall,
Phase II confirmed continuing exposure to, and
metabolism of, petroleum hydrocarbons, especially
in goldband snapper and red emperor collected
closest to the rig. Biologically relevant effects
persisted four months following the end of the well
release, with higher than expected condition factor,
liver size and oxidative DNA damage levels in red
emperor collected closest to the rig.
The biomarker results from Phase III indicate that
the effects which may be related to exposure to
petroleum hydrocarbons were reduced compared
to the previous sampling periods. There were
variations in the physiological indices condition
factor, LSI and GSI, particularly in goldband
snapper and red emperor from the different study
sites, but in general the trends did not suggest any
link with the location of the West Atlas drilling rig.
The only results which could potentially be related
to exposure to petroleum hydrocarbons was the
GSI of male red emperor which was reduced at
the impacted sites compared to the reference
site. Similarly, there were no trends in the levels
of serum SDH, oxidative DNA damage or EROD
activity which could be related an exposure to
petroleum hydrocarbons originating from the
Montara well head. Phases I and II of this study
noted higher levels of PAH metabolites in the bile
of fish captured at sites close to the West Atlas
drilling rig than in those captured at reference sites.
Overall, in Phase III this trend was not apparent
with fish from these impacted sites exhibiting
similar levels of PAH metabolites as those from
reference sites. This suggests a reduction in the
exposure of these fish to petroleum hydrocarbons
relative to those captured in previous phases of
this study.
The results of a multivariate analysis which
included data for all biomarkers measured in
goldband snapper and red emperor (except GSI)
indicates that during Phases I and II there were
significant differences between each impacted
site (Sites 1 and 2) and the reference site (Site 5)
and that this difference was mostly due to the
levels of PAH metabolites in the bile of the fish. In
Phase III dissimilarities between the sites were still
present and the contribution of PAH metabolites
to these differences was still strong. However, the
differences between impacted and non-impacted
sites were not as well defined, with the impacted
and non-impacted areas tending to converge
towards a similar overall biomarker signal. This
finding points to a reduction in the differences
between the sites and, given the importance
of PAH metabolites in these differences, to a
reduction in exposure to petroleum hydrocarbons
at the impacted sites.
Page 69
Montara Well Release Monitoring Study S4A // Assessment of Effects on Timor Sea Fish
The oil which was released from the Montara
well head was very light and had a low content
of high molecular weight PAHs. The high wax
content of the oil released from the Montara
well head possibly formed a buoyant waxy
residue upon weathering, which could be
consumed by animals and result in the entry of
petroleum hydrocarbons into the food chain.
While vertebrates can metabolise petroleum
hydrocarbons quite efficiently, invertebrates have
very limited metabolism potential and could be the
link between surface waxy residues and deep sea
fish. It is also likely that suspended particulates
with adhering petroleum compounds would
eventually settle to the sea floor and represent a
temporary source of petroleum compounds for fish
captured closest to the rig. It has been suggested
that environmental conditions in the Timor Sea,
e.g. warm water temperatures, favour a rapid
degradation of oil making it unlikely that
spilled oil does reach the ocean floor (Burns
et al., 2010). Corroborating this postulate is the
intensive sediment sampling conducted around
the rig in 2010, which failed to find any petroleum
hydrocarbons in this environment (Appendix F).
Phase II of the investigation demonstrated that
chronic effects can be seen more clearly in red
emperor than in other species, which might relate
to the long lifespan and biology of this species.
It is not known if the effects observed in individual
red emperor have the potential to translate into
population-level effects but since no gross
pathologies and no reproductive impairments
were observed in adult fish, population-level
effects appear unlikely. When considering the long
term effects of the Montara well release on fish
populations, it is important to consider that the
Timor Sea goldband snapper and red emperor
populations are commercially harvested, which
can create significant population level effects
non-related to the well release. In this context
where multiple stakeholders operate in a common
environment, potential effects on fish populations
can be additive, interactive or synergistic. It is
therefore difficult to isolate the effect of individual
activities on fish populations.
Eventually, the petroleum hydrocarbons released
during the Montara incident will be dissipated
and degraded in the marine environment and will
no longer be detectable in the fish living close
to the rig, at which time biomarkers of exposure
and biomarkers of biologically relevant effects
will be similar in impacted and reference zones.
From previous similar situations worldwide, no
links have been established to relate directly the
observed effects on individuals to population level
impacts. Future monitoring in the surrounding of
the Montara oil fields will confirm whether the trend
towards convergence of the biomarker signal of
impacted and non-impacted sites continues.
In addition, future sampling of demersal fish
collected in the area will provide a baseline for
evaluating the environmental impacts, if any,
once petroleum production has commenced at
this location.

Page 70
Montara Well Release Monitoring Study S4A // Assessment of Effects on Timor Sea Fish
Page 71
Montara Well Release Monitoring Study S4A // Assessment of Effects on Timor Sea Fish
References
AMSA [Australian Maritime Safety Authority], 2009. Montara Well Release Timor Sea: Operational Monitoring
Study O2 Monitoring of Oil Character, Fate and Effects Report 02 Water Quality Report 2. 14th December
2009. Available at: http://www.amsa.gov.au/marine_environment_protection/national_plan/Reports-Fact_
Sheets-Brochures/
Bjerregaard L.B., Madsen A.H., Korsgaard B., Bjerregaard P., 2006. Gonad histology and vitellogenin
concentrations in brown trout (Salmo trutta) from Danish streams impacted by sewage effluent. Earth Environ.
Sci. 5: 315-327.
Burns K. A., Brinkman D. L., Brunskill G. J., Volk H., Wasmund K., Zagorskis I., 2010. Fluxes and fate of
petroleum hydrocarbons in the Timor Sea ecosystem with special reference to active hydrocarbon seepage.
Mar. Chem. 118: 140-155.
Codi-King S., Johnson J. E., Haasch M. L., Ryan D. A. J., Ahokas, J. T., Burns, K. A., 2005. Summary results
from a pilot study conducted around an oil production platform on the northwest Shelf of Australia. Mar. Poll.
Bull. 50: 1163-1172.
Collier T.K., Anulacion B.F., Stein J.E., Goksoyr A., Varanasi U., 1995. A field evaluation of cytochrome P4501A
as a biomarker of contaminant exposure in three species of flatfish. Environ. Toxicol. Chem. 14:143-152.
Cooke S.S., Evans M.D., Dizdaroglu M., Lunec J., 2003. Oxidative DNA damage: mechanisms, mutation, and
disease. The FASEB Journal 17, 1195-1214.
French B.L., Reichert W.L., Hom T., Nishimoto M., Sanborn H.R., Stein J.E., 1996. Accumulation and
dose-response of hepatic DNA adducts in English sole (Pleuronectes vetulus) exposed to a gradient of
contaminated sediments. Aquat. Toxicol. 36: 1-16.
Page 72
Montara Well Release Monitoring Study S4A // Assessment of Effects on Timor Sea Fish
Gagnon M.M., Holdway D.A., 2000. EROD
Induction and Biliary Metabolite Excretion
Following Exposure to the Water Accommodated
Fraction of Crude Oil and to Chemically Dispersed
Crude Oil. Arch. Environ. Contam. Toxicol. 38:
70-77.
Gagnon M.M., Holdway D.A., 2002. EROD
induction, serum SDH and PAH biliary metabolites
in sand flathead (Platycephalus bassensis)
collected in Port Philip Bay, Australia. Mar. Poll.
Bull. 44: 230-237.
Hartung R., 1995. Assessment of the potential for
long-term toxicological effects of the Exxon Valdez
oil spill on birds and animals. IN: Exxon Valdez oil
spill: Fate and Effects in Alaskan waters, ASTM,
pp. 693-725.
Hellou, J., Payne, J.F., 1987. Assessment of
contamination of fish by water-soluble fractions
of petroleum: a role for bile metabolites. Environ.
Toxicol. Chem. 6: 857-862.
Hodson P.V., Kleopper-Sams P.J., Munkittrick
K.R., Lockhart W.L., Metner D.A., Luxon P.L.,
Smith I.R., Gagnon M.M., Servos M, Payne J.F.,
1991. Protocols for measuring mixed function
oxygenases of fish liver. Can. Tech. Rep. Fish.
Aquat. Sci. No 1829, 51 pages.
Holdway D.A., Brennan S.E., Ahokas J.T., 1994.
Use of hepatic MFO and blood enzyme biomarkers
in sand flathead (Platycephalus bassensis) as
indicators of pollution in Port Phillip Bay, Australia.
Mar. Pollut. Bull. 26: 683-695.
Lam P.K.S., Gray J.S., 2003. The use of biomarkers
in environmental monitoring programmes. Mar.
Pollut. Bull. 46: 182-186.
Landis G., Yu M.H., 1995. Introduction to
environmental toxicology: impacts of chemicals
upon ecological systems. Lewis, Boca Raton,
Florida.
Lillie R.D., 1965. Histopathologic Techniques and
Practical Histochemistry, 3rd edition, McGraw-Hill
Book Co., New York
Lin E.L.C., Cormier S.M., Torsella J.A., 1996.
Fish biliary polycyclic aromatic hydrocarbon
metabolites estimated by fixed-wavelength
fluorescence: comparison with HPLC-fluorescent
detection. Ecotoxicol. Environ. Saf. 35: 16-23.
Lowry O.H., Rosebrough N.J., Farr A.L., Randall
R.J., 1951. Protein measurement with the Folin
reagent. J. Biol. Chem. 193: 265-275.
Maccubbin AE. 1994. DNA adduct analysis in
fish: laboratory and field studies. IN: Malins DC,
Ostrander GK (Eds). Aquatic Toxicology; molecular,
Biochemical and Cellular Perspectives. Lewis
Publishers, CRC Press, pp. 267-294.
Martinez-Gomez C., Fernandez B., Valdes J.,
Campillo J. A., Benedicto J., Sanchez F., Vethaak
A. D., 2009. Evaluation of three-year monitoring
with biomarkers in fish following the Prestige oil
spill (N Spain). Chemosphere. 74: 613-620.
Meador JP, Stein JE, Reichert WL, Varanasi U.
1995. Bioaccumulation of polycyclic aromatic
hydrocarbons by marine organisms. Rev. Environ.
Contam. Toxicol. 143:79-165.
McDonald S. J., Kennicutt II, M. C., Liu H., Safe
S. H., 1995. Assessing aromatic hydrocarbon
exposure in Antarctic fish captured near Palmer
and McMurdo Stations, Antarctica. Arch. Environ.
Contam. Toxicol. 29: 232-240.
Ozetric B. and Krajjnovic-Ozetric M., 1993.
Plasma sorbitol dehydrogenase, glutamate
dehydrogenase, and alkaline phosphatase as
potential indicators of liver intoxication in grey
mullet (Mugil auratus Risso). Bull. Environ. Toxicol.
50: 586-592.
Pavanello S., Clonfero E., 2000. Biological
indicators of genotoxic risk and metabolic
polymorphisms. Mut. Res. 463: 285-308.
Stein J.E., Reichert W.L., French B., Varanasi U.,
1993. 32P-Postlabeling analysis of DNA adduct
formation and persistence in English sole exposed
to benzo[a]pyrene and 7H-dibenzo[c,g]carbazole.
Chem.-Biol. Interact. 88: 55-69.
Valavanidis A., Vlachoogianni T., Fiotakis C., 2009.
8-hydroxy-2’-deoxyguanosine (8-OHdG): a critical
biomarker of oxidative stress and carcinogenesis.
J. Environ. Sci. Health C 27: 120-139.
Van der Oost R., Beyer J., Vermeulen N.P.E.,
2003. Fish bioaccumulation and biomarker in
environmental risk assessment: a review. Environ.
Toxicol. Pharmacol. 13: 57-149.

Page 73
Montara Well Release Monitoring Study S4A // Assessment of Effects on Timor Sea Fish
Appendix A – Statistical Results Phase I
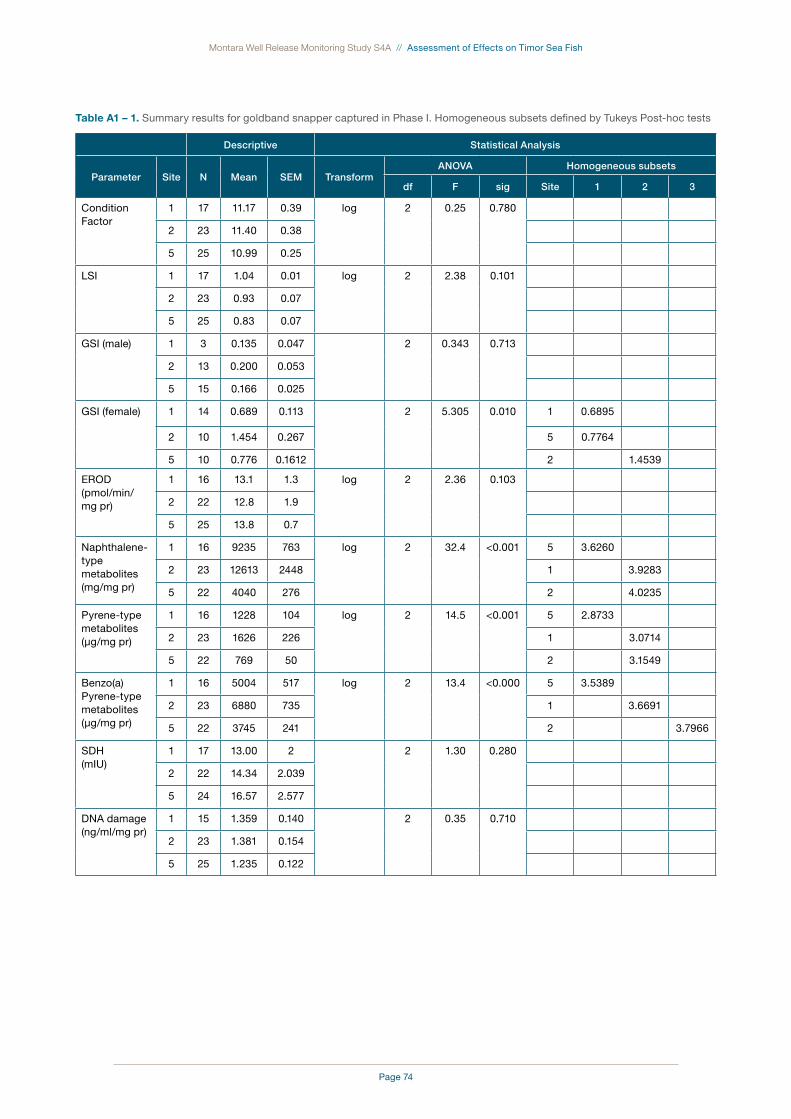
Page 74
Montara Well Release Monitoring Study S4A // Assessment of Effects on Timor Sea Fish
table a1 – 1. Summary results for goldband snapper captured in Phase I. Homogeneous subsets defined by Tukeys Post-hoc tests
Descriptive Statistical Analysis
Parameter Site N Mean SEM TransformANOVA Homogeneous subsets
df F sig Site 1 2 3
Condition Factor
1 17 11.17 0.39 log 2 0.25 0.780
2 23 11.40 0.38
5 25 10.99 0.25
LSI 1 17 1.04 0.01 log 2 2.38 0.101
2 23 0.93 0.07
5 25 0.83 0.07
GSI (male) 1 3 0.135 0.047 2 0.343 0.713
2 13 0.200 0.053
5 15 0.166 0.025
GSI (female) 1 14 0.689 0.113 2 5.305 0.010 1 0.6895
2 10 1.454 0.267 5 0.7764
5 10 0.776 0.1612 2 1.4539
EROD(pmol/min/mg pr)
1 16 13.1 1.3 log 2 2.36 0.103
2 22 12.8 1.9
5 25 13.8 0.7
Naphthalene-type metabolites(mg/mg pr)
1 16 9235 763 log 2 32.4 <0.001 5 3.6260
2 23 12613 2448 1 3.9283
5 22 4040 276 2 4.0235
Pyrene-type metabolites(µg/mg pr)
1 16 1228 104 log 2 14.5 <0.001 5 2.8733
2 23 1626 226 1 3.0714
5 22 769 50 2 3.1549
Benzo(a)Pyrene-type metabolites(µg/mg pr)
1 16 5004 517 log 2 13.4 <0.000 5 3.5389
2 23 6880 735 1 3.6691
5 22 3745 241 2 3.7966
SDH(mIU)
1 17 13.00 2 2 1.30 0.280
2 22 14.34 2.039
5 24 16.57 2.577
DNA damage(ng/ml/mg pr)
1 15 1.359 0.140 2 0.35 0.710
2 23 1.381 0.154
5 25 1.235 0.122
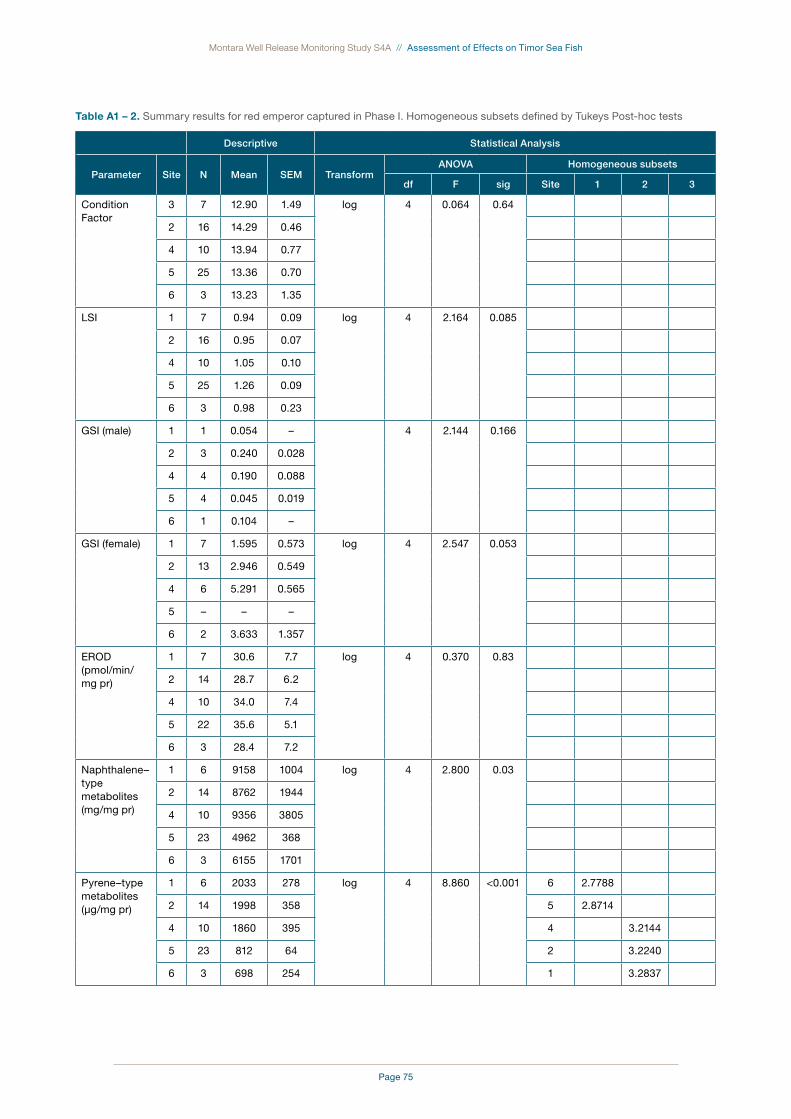
Page 75
Montara Well Release Monitoring Study S4A // Assessment of Effects on Timor Sea Fish
table a1 – 2. Summary results for red emperor captured in Phase I. Homogeneous subsets defined by Tukeys Post-hoc tests
Descriptive Statistical Analysis
Parameter Site N Mean SEM TransformANOVA Homogeneous subsets
df F sig Site 1 2 3
Condition Factor
3 7 12.90 1.49 log 4 0.064 0.64
2 16 14.29 0.46
4 10 13.94 0.77
5 25 13.36 0.70
6 3 13.23 1.35
LSI 1 7 0.94 0.09 log 4 2.164 0.085
2 16 0.95 0.07
4 10 1.05 0.10
5 25 1.26 0.09
6 3 0.98 0.23
GSI (male) 1 1 0.054 – 4 2.144 0.166
2 3 0.240 0.028
4 4 0.190 0.088
5 4 0.045 0.019
6 1 0.104 –
GSI (female) 1 7 1.595 0.573 log 4 2.547 0.053
2 13 2.946 0.549
4 6 5.291 0.565
5 – – –
6 2 3.633 1.357
EROD(pmol/min/mg pr)
1 7 30.6 7.7 log 4 0.370 0.83
2 14 28.7 6.2
4 10 34.0 7.4
5 22 35.6 5.1
6 3 28.4 7.2
Naphthalene–type metabolites(mg/mg pr)
1 6 9158 1004 log 4 2.800 0.03
2 14 8762 1944
4 10 9356 3805
5 23 4962 368
6 3 6155 1701
Pyrene–type metabolites(µg/mg pr)
1 6 2033 278 log 4 8.860 <0.001 6 2.7788
2 14 1998 358 5 2.8714
4 10 1860 395 4 3.2144
5 23 812 64 2 3.2240
6 3 698 254 1 3.2837

Page 76
Montara Well Release Monitoring Study S4A // Assessment of Effects on Timor Sea Fish
Descriptive Statistical Analysis
Parameter Site N Mean SEM TransformANOVA Homogeneous subsets
df F sig Site 1 2 3
Benzo(a)Pyrene–type metabolites(µg/mg pr)
1 6 6765 974 log 4 6.530 <0.001 6 3.3342
2 14 6847 1675 5 3.4396 3.4396
4 10 7876 2206 2 3.7245 3.7245
5 23 2941 204 4 3.7948
6 3 2182 223 1 3.8101
SDH(mIU)*
1 7 16.88 12.122 log 4 3.672 0.011 4 0.4198
2 16 13.14 2.111 1 0.7810 0.7810
4 8 4.18 1.588 6 0.7880 0.7880
5 21 9.85 1.929 5 0.8161 0.8161
6 2 5.31 1.447 2 1.0636
DNA damage(ng/ml/mg pr)
1 5 2.27 0.751
2 16 1.60 0.408
4 9 1.37 0.264 0.190†
5 25 4.09 0.757
6 2 1.39 0.725
* Tukeys post-hoc tests did not detect significant differences so the less conservative Bonferonni post-hoc tests used
† Non-parametric (Kruskal-Wallis) tests run due to variance heteroscedascity.
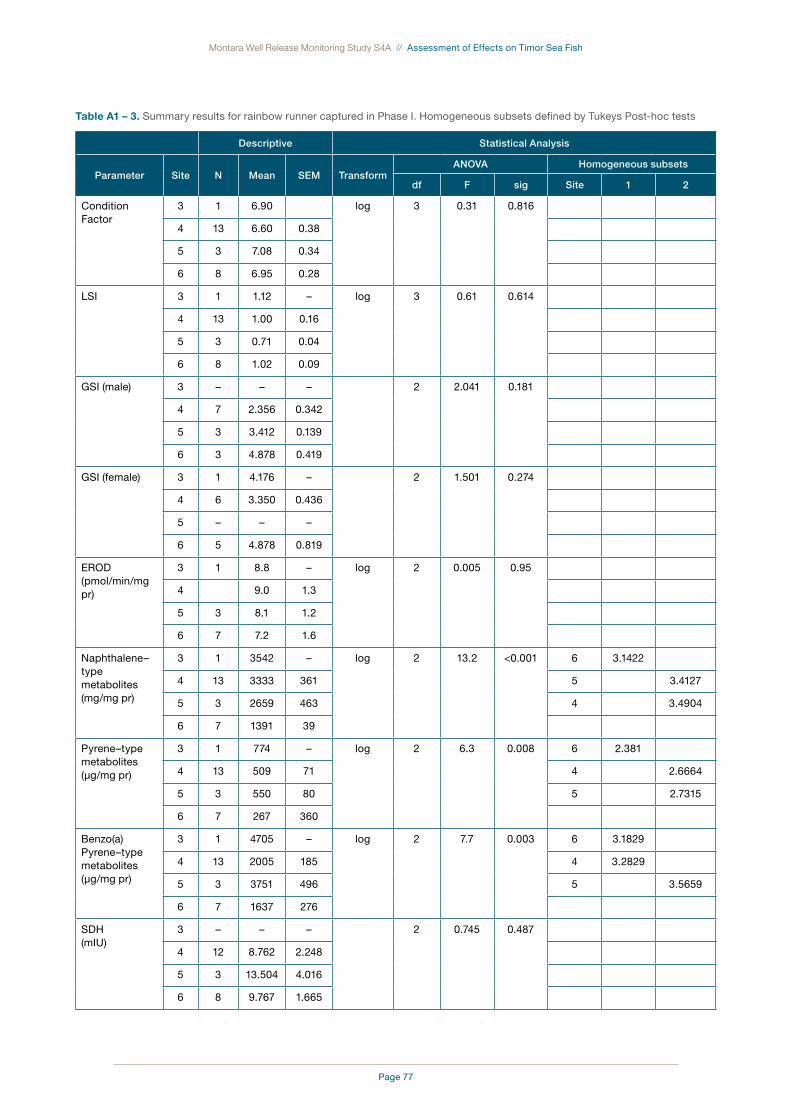
Page 77
Montara Well Release Monitoring Study S4A // Assessment of Effects on Timor Sea Fish
table a1 – 3. Summary results for rainbow runner captured in Phase I. Homogeneous subsets defined by Tukeys Post-hoc tests
Descriptive Statistical Analysis
Parameter Site N Mean SEM TransformANOVA Homogeneous subsets
df F sig Site 1 2
Condition Factor
3 1 6.90 log 3 0.31 0.816
4 13 6.60 0.38
5 3 7.08 0.34
6 8 6.95 0.28
LSI 3 1 1.12 – log 3 0.61 0.614
4 13 1.00 0.16
5 3 0.71 0.04
6 8 1.02 0.09
GSI (male) 3 – – – 2 2.041 0.181
4 7 2.356 0.342
5 3 3.412 0.139
6 3 4.878 0.419
GSI (female) 3 1 4.176 – 2 1.501 0.274
4 6 3.350 0.436
5 – – –
6 5 4.878 0.819
EROD(pmol/min/mg pr)
3 1 8.8 – log 2 0.005 0.95
4 9.0 1.3
5 3 8.1 1.2
6 7 7.2 1.6
Naphthalene–type metabolites(mg/mg pr)
3 1 3542 – log 2 13.2 <0.001 6 3.1422
4 13 3333 361 5 3.4127
5 3 2659 463 4 3.4904
6 7 1391 39
Pyrene–type metabolites(µg/mg pr)
3 1 774 – log 2 6.3 0.008 6 2.381
4 13 509 71 4 2.6664
5 3 550 80 5 2.7315
6 7 267 360
Benzo(a)Pyrene–type metabolites(µg/mg pr)
3 1 4705 – log 2 7.7 0.003 6 3.1829
4 13 2005 185 4 3.2829
5 3 3751 496 5 3.5659
6 7 1637 276
SDH(mIU)
3 – – – 2 0.745 0.487
4 12 8.762 2.248
5 3 13.504 4.016
6 8 9.767 1.665
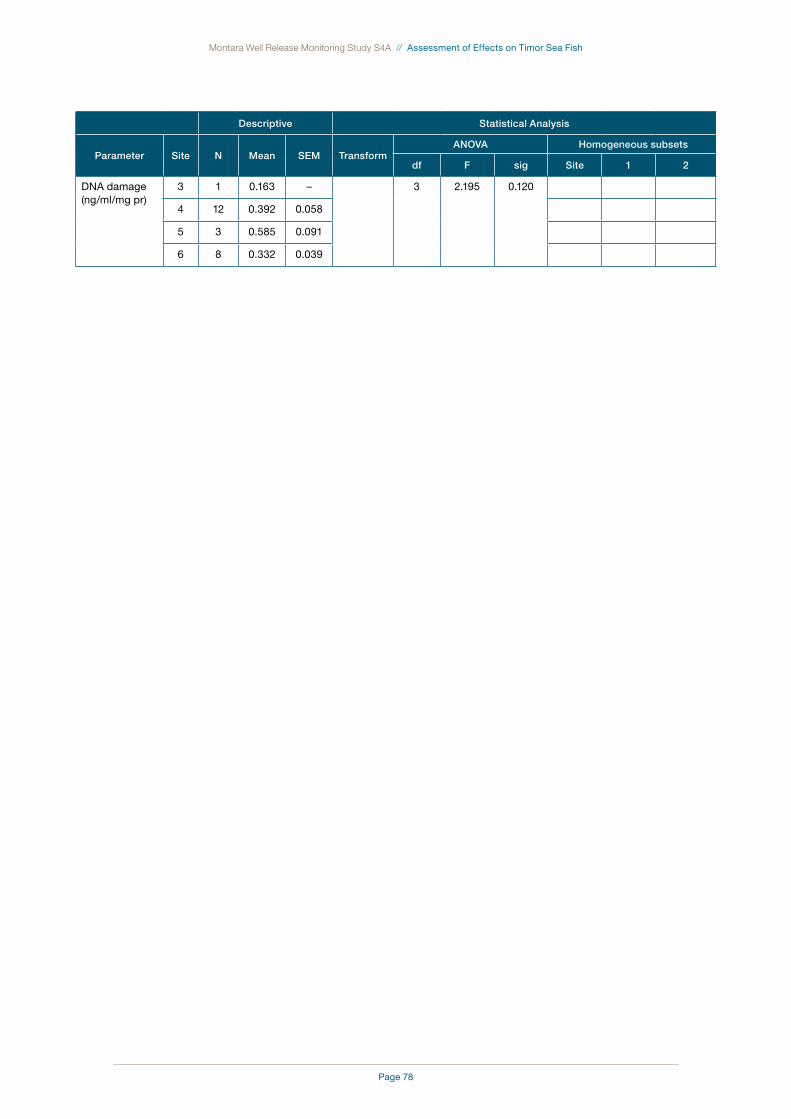
Page 78
Montara Well Release Monitoring Study S4A // Assessment of Effects on Timor Sea Fish
Descriptive Statistical Analysis
Parameter Site N Mean SEM TransformANOVA Homogeneous subsets
df F sig Site 1 2
DNA damage(ng/ml/mg pr)
3 1 0.163 – 3 2.195 0.120
4 12 0.392 0.058
5 3 0.585 0.091
6 8 0.332 0.039
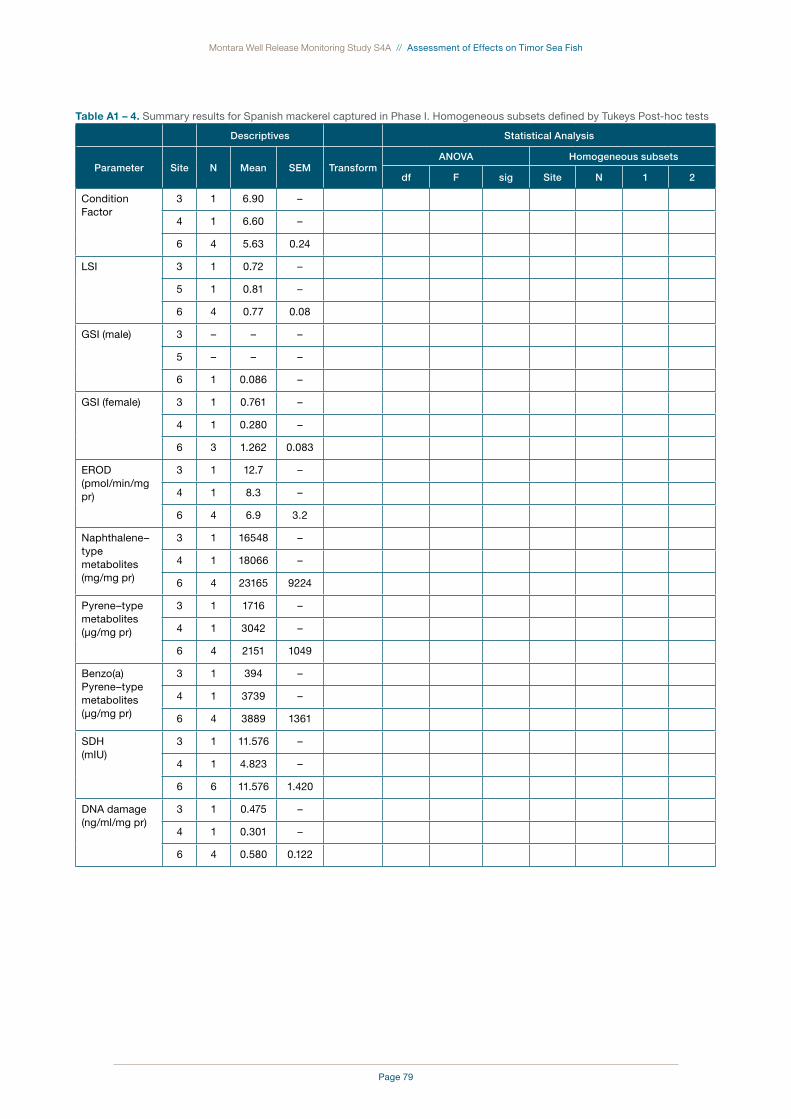
Page 79
Montara Well Release Monitoring Study S4A // Assessment of Effects on Timor Sea Fish
table a1 – 4. Summary results for Spanish mackerel captured in Phase I. Homogeneous subsets defined by Tukeys Post-hoc tests
Descriptives Statistical Analysis
Parameter Site N Mean SEM TransformANOVA Homogeneous subsets
df F sig Site N 1 2
Condition Factor
3 1 6.90 –
4 1 6.60 –
6 4 5.63 0.24
LSI 3 1 0.72 –
5 1 0.81 –
6 4 0.77 0.08
GSI (male) 3 – – –
5 – – –
6 1 0.086 –
GSI (female) 3 1 0.761 –
4 1 0.280 –
6 3 1.262 0.083
EROD(pmol/min/mg pr)
3 1 12.7 –
4 1 8.3 –
6 4 6.9 3.2
Naphthalene–type metabolites(mg/mg pr)
3 1 16548 –
4 1 18066 –
6 4 23165 9224
Pyrene–type metabolites(µg/mg pr)
3 1 1716 –
4 1 3042 –
6 4 2151 1049
Benzo(a)Pyrene–type metabolites(µg/mg pr)
3 1 394 –
4 1 3739 –
6 4 3889 1361
SDH(mIU)
3 1 11.576 –
4 1 4.823 –
6 6 11.576 1.420
DNA damage(ng/ml/mg pr)
3 1 0.475 –
4 1 0.301 –
6 4 0.580 0.122

Page 80
Montara Well Release Monitoring Study S4A // Assessment of Effects on Timor Sea Fish

Page 81
Montara Well Release Monitoring Study S4A // Assessment of Effects on Timor Sea Fish
Appendix B – Statistical Results Phase II
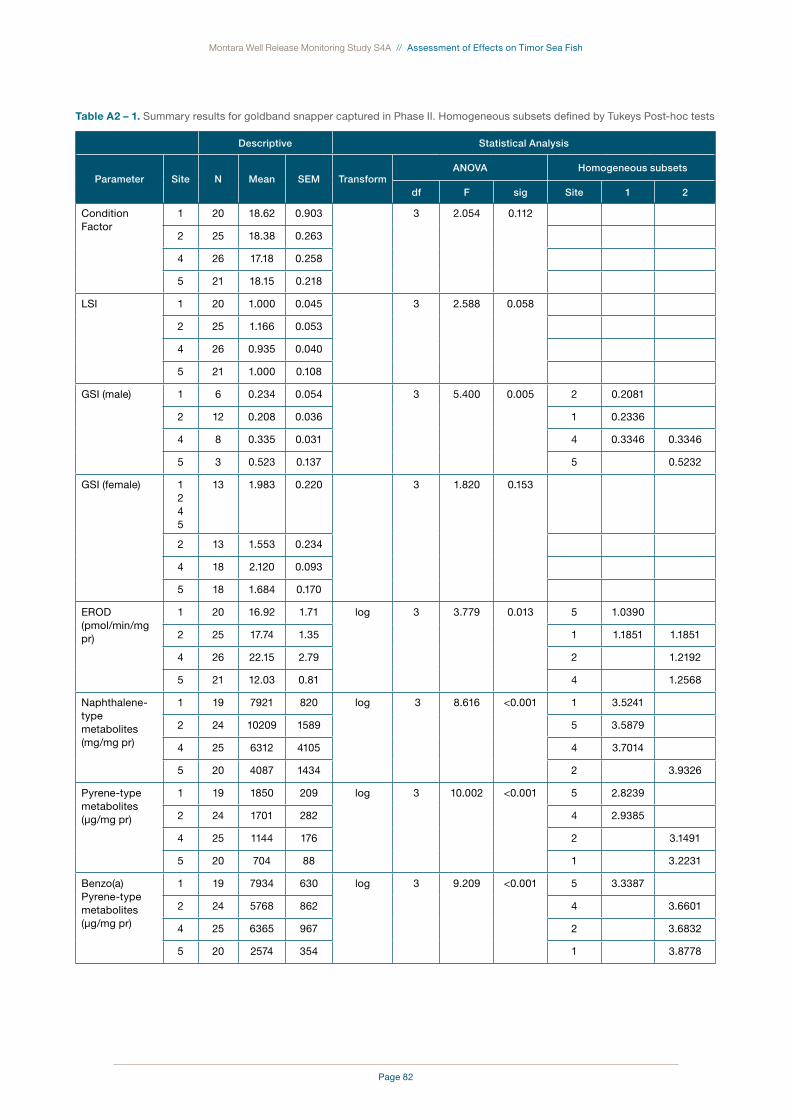
Page 82
Montara Well Release Monitoring Study S4A // Assessment of Effects on Timor Sea Fish
table a2 – 1. Summary results for goldband snapper captured in Phase II. Homogeneous subsets defined by Tukeys Post-hoc tests
Descriptive Statistical Analysis
Parameter Site N Mean SEM TransformANOVA Homogeneous subsets
df F sig Site 1 2
Condition Factor
1 20 18.62 0.903 3 2.054 0.112
2 25 18.38 0.263
4 26 17.18 0.258
5 21 18.15 0.218
LSI 1 20 1.000 0.045 3 2.588 0.058
2 25 1.166 0.053
4 26 0.935 0.040
5 21 1.000 0.108
GSI (male) 1 6 0.234 0.054 3 5.400 0.005 2 0.2081
2 12 0.208 0.036 1 0.2336
4 8 0.335 0.031 4 0.3346 0.3346
5 3 0.523 0.137 5 0.5232
GSI (female) 1245
13 1.983 0.220 3 1.820 0.153
2 13 1.553 0.234
4 18 2.120 0.093
5 18 1.684 0.170
EROD(pmol/min/mg pr)
1 20 16.92 1.71 log 3 3.779 0.013 5 1.0390
2 25 17.74 1.35 1 1.1851 1.1851
4 26 22.15 2.79 2 1.2192
5 21 12.03 0.81 4 1.2568
Naphthalene-type metabolites(mg/mg pr)
1 19 7921 820 log 3 8.616 <0.001 1 3.5241
2 24 10209 1589 5 3.5879
4 25 6312 4105 4 3.7014
5 20 4087 1434 2 3.9326
Pyrene-type metabolites(µg/mg pr)
1 19 1850 209 log 3 10.002 <0.001 5 2.8239
2 24 1701 282 4 2.9385
4 25 1144 176 2 3.1491
5 20 704 88 1 3.2231
Benzo(a)Pyrene-type metabolites(µg/mg pr)
1 19 7934 630 log 3 9.209 <0.001 5 3.3387
2 24 5768 862 4 3.6601
4 25 6365 967 2 3.6832
5 20 2574 354 1 3.8778
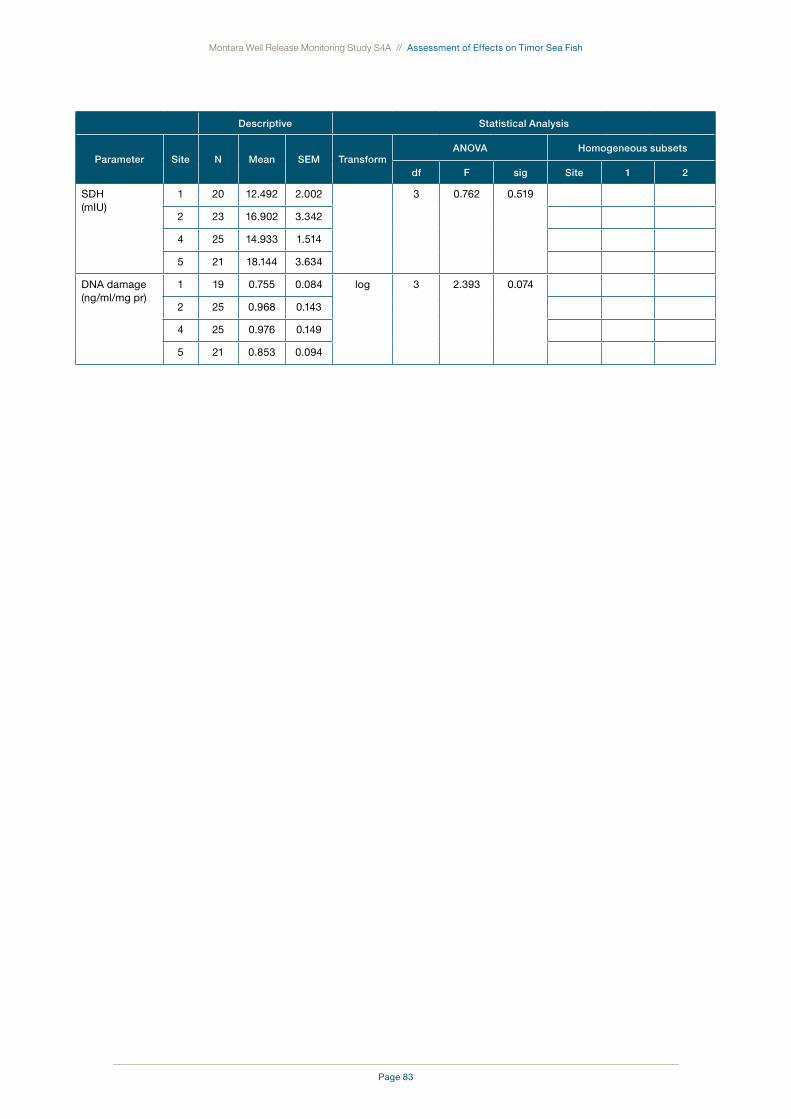
Page 83
Montara Well Release Monitoring Study S4A // Assessment of Effects on Timor Sea Fish
Descriptive Statistical Analysis
Parameter Site N Mean SEM TransformANOVA Homogeneous subsets
df F sig Site 1 2
SDH(mIU)
1 20 12.492 2.002 3 0.762 0.519
2 23 16.902 3.342
4 25 14.933 1.514
5 21 18.144 3.634
DNA damage(ng/ml/mg pr)
1 19 0.755 0.084 log 3 2.393 0.074
2 25 0.968 0.143
4 25 0.976 0.149
5 21 0.853 0.094
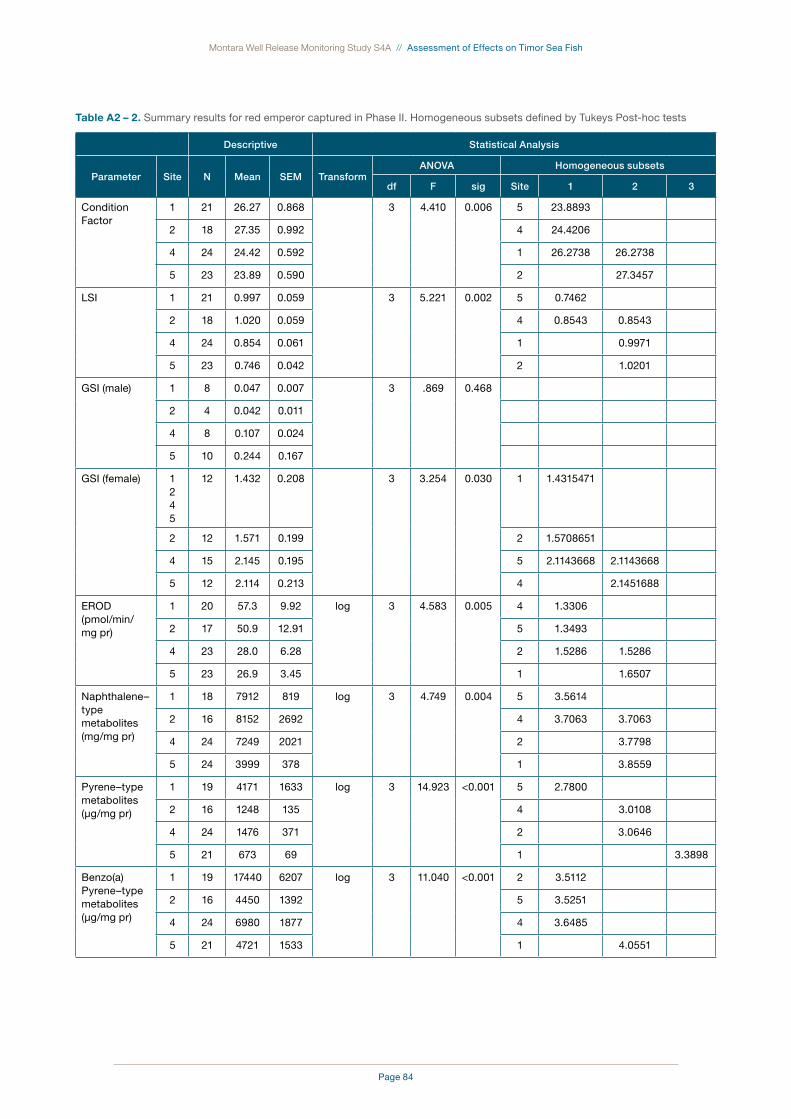
Page 84
Montara Well Release Monitoring Study S4A // Assessment of Effects on Timor Sea Fish
table a2 – 2. Summary results for red emperor captured in Phase II. Homogeneous subsets defined by Tukeys Post-hoc tests
Descriptive Statistical Analysis
Parameter Site N Mean SEM TransformANOVA Homogeneous subsets
df F sig Site 1 2 3
Condition Factor
1 21 26.27 0.868 3 4.410 0.006 5 23.8893
2 18 27.35 0.992 4 24.4206
4 24 24.42 0.592 1 26.2738 26.2738
5 23 23.89 0.590 2 27.3457
LSI 1 21 0.997 0.059 3 5.221 0.002 5 0.7462
2 18 1.020 0.059 4 0.8543 0.8543
4 24 0.854 0.061 1 0.9971
5 23 0.746 0.042 2 1.0201
GSI (male) 1 8 0.047 0.007 3 .869 0.468
2 4 0.042 0.011
4 8 0.107 0.024
5 10 0.244 0.167
GSI (female) 1245
12 1.432 0.208 3 3.254 0.030 1 1.4315471
2 12 1.571 0.199 2 1.5708651
4 15 2.145 0.195 5 2.1143668 2.1143668
5 12 2.114 0.213 4 2.1451688
EROD(pmol/min/mg pr)
1 20 57.3 9.92 log 3 4.583 0.005 4 1.3306
2 17 50.9 12.91 5 1.3493
4 23 28.0 6.28 2 1.5286 1.5286
5 23 26.9 3.45 1 1.6507
Naphthalene–type metabolites(mg/mg pr)
1 18 7912 819 log 3 4.749 0.004 5 3.5614
2 16 8152 2692 4 3.7063 3.7063
4 24 7249 2021 2 3.7798
5 24 3999 378 1 3.8559
Pyrene–type metabolites(µg/mg pr)
1 19 4171 1633 log 3 14.923 <0.001 5 2.7800
2 16 1248 135 4 3.0108
4 24 1476 371 2 3.0646
5 21 673 69 1 3.3898
Benzo(a)Pyrene–type metabolites(µg/mg pr)
1 19 17440 6207 log 3 11.040 <0.001 2 3.5112
2 16 4450 1392 5 3.5251
4 24 6980 1877 4 3.6485
5 21 4721 1533 1 4.0551

Page 85
Montara Well Release Monitoring Study S4A // Assessment of Effects on Timor Sea Fish
Descriptive Statistical Analysis
Parameter Site N Mean SEM TransformANOVA Homogeneous subsets
df F sig Site 1 2 3
SDH(mIU)
1 21 9.830 1.450 3 0.667 0.575
2 18 8.412 1.483
4 22 9.734 1.370
5 23 11.198 1.211
DNA damage(ng/ml/mg pr)
1 21 0.578 0.061 3 3.844 0.013 5 1.5958
2 18 0.450 0.046 4 1.7918
4 24 0.401 0.038 2 2.1180
5 23 0.376 0.039 1 3.6944
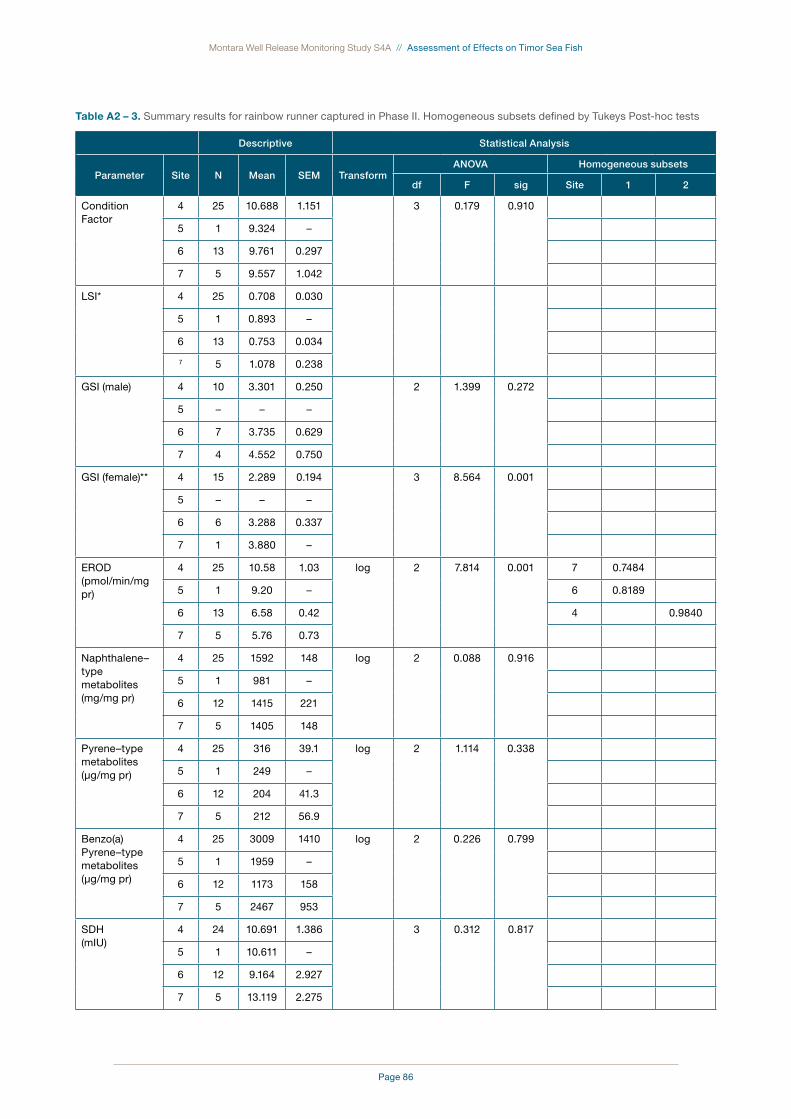
Page 86
Montara Well Release Monitoring Study S4A // Assessment of Effects on Timor Sea Fish
table a2 – 3. Summary results for rainbow runner captured in Phase II. Homogeneous subsets defined by Tukeys Post-hoc tests
Descriptive Statistical Analysis
Parameter Site N Mean SEM TransformANOVA Homogeneous subsets
df F sig Site 1 2
Condition Factor
4 25 10.688 1.151 3 0.179 0.910
5 1 9.324 –
6 13 9.761 0.297
7 5 9.557 1.042
LSI* 4 25 0.708 0.030
5 1 0.893 –
6 13 0.753 0.034
7 5 1.078 0.238
GSI (male) 4 10 3.301 0.250 2 1.399 0.272
5 – – –
6 7 3.735 0.629
7 4 4.552 0.750
GSI (female)** 4 15 2.289 0.194 3 8.564 0.001
5 – – –
6 6 3.288 0.337
7 1 3.880 –
EROD(pmol/min/mg pr)
4 25 10.58 1.03 log 2 7.814 0.001 7 0.7484
5 1 9.20 – 6 0.8189
6 13 6.58 0.42 4 0.9840
7 5 5.76 0.73
Naphthalene–type metabolites(mg/mg pr)
4 25 1592 148 log 2 0.088 0.916
5 1 981 –
6 12 1415 221
7 5 1405 148
Pyrene–type metabolites(µg/mg pr)
4 25 316 39.1 log 2 1.114 0.338
5 1 249 –
6 12 204 41.3
7 5 212 56.9
Benzo(a)Pyrene–type metabolites(µg/mg pr)
4 25 3009 1410 log 2 0.226 0.799
5 1 1959 –
6 12 1173 158
7 5 2467 953
SDH(mIU)
4 24 10.691 1.386 3 0.312 0.817
5 1 10.611 –
6 12 9.164 2.927
7 5 13.119 2.275

Page 87
Montara Well Release Monitoring Study S4A // Assessment of Effects on Timor Sea Fish
Descriptive Statistical Analysis
Parameter Site N Mean SEM TransformANOVA Homogeneous subsets
df F sig Site 1 2
DNA damage(ng/ml/mg pr)
4 22 0.438 0.044 3 1.183 0.330
5 1 0.589 –
6 12 0.441 0.049
7 5 0.292 0.039
*non-parametric no sig diff between sites, **no post-hoc as fewer than 3 groups.
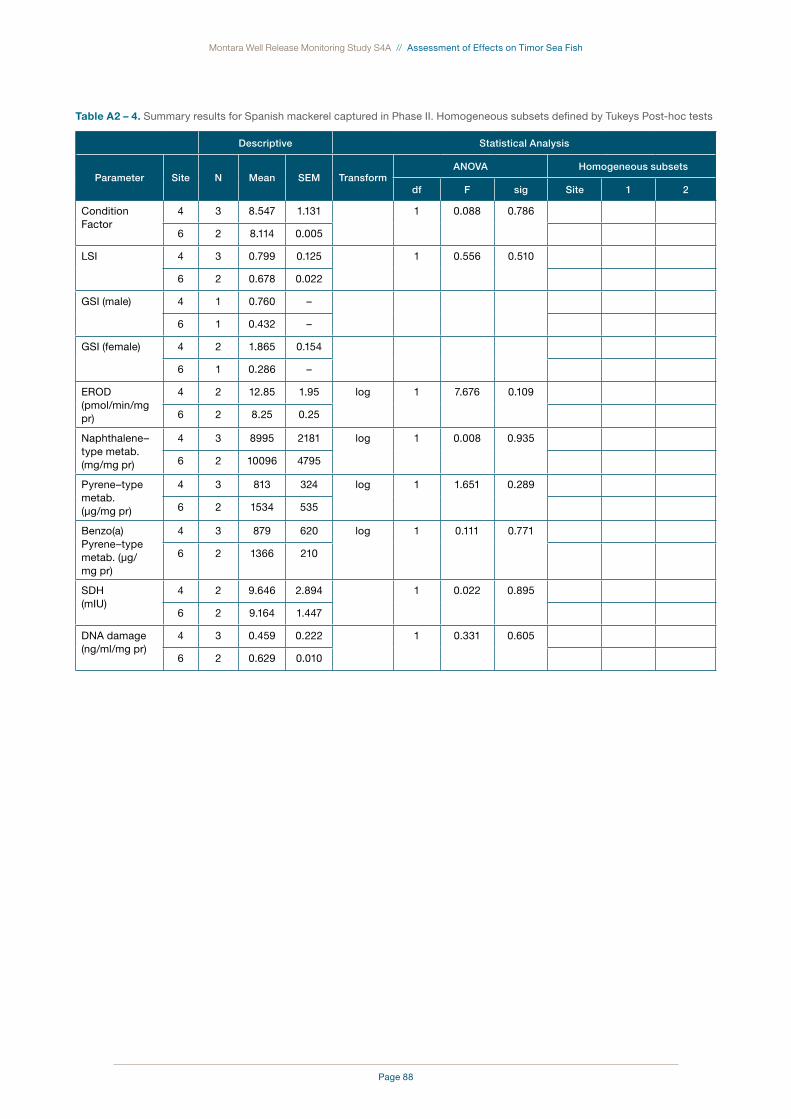
Page 88
Montara Well Release Monitoring Study S4A // Assessment of Effects on Timor Sea Fish
table a2 – 4. Summary results for Spanish mackerel captured in Phase II. Homogeneous subsets defined by Tukeys Post-hoc tests
Descriptive Statistical Analysis
Parameter Site N Mean SEM TransformANOVA Homogeneous subsets
df F sig Site 1 2
Condition Factor
4 3 8.547 1.131 1 0.088 0.786
6 2 8.114 0.005
LSI 4 3 0.799 0.125 1 0.556 0.510
6 2 0.678 0.022
GSI (male) 4 1 0.760 –
6 1 0.432 –
GSI (female) 4 2 1.865 0.154
6 1 0.286 –
EROD(pmol/min/mg pr)
4 2 12.85 1.95 log 1 7.676 0.109
6 2 8.25 0.25
Naphthalene–type metab. (mg/mg pr)
4 3 8995 2181 log 1 0.008 0.935
6 2 10096 4795
Pyrene–type metab.(µg/mg pr)
4 3 813 324 log 1 1.651 0.289
6 2 1534 535
Benzo(a)Pyrene–type metab. (µg/mg pr)
4 3 879 620 log 1 0.111 0.771
6 2 1366 210
SDH(mIU)
4 2 9.646 2.894 1 0.022 0.895
6 2 9.164 1.447
DNA damage(ng/ml/mg pr)
4 3 0.459 0.222 1 0.331 0.605
6 2 0.629 0.010

Page 89
Montara Well Release Monitoring Study S4A // Assessment of Effects on Timor Sea Fish
Appendix C – Statistical Results Phase III
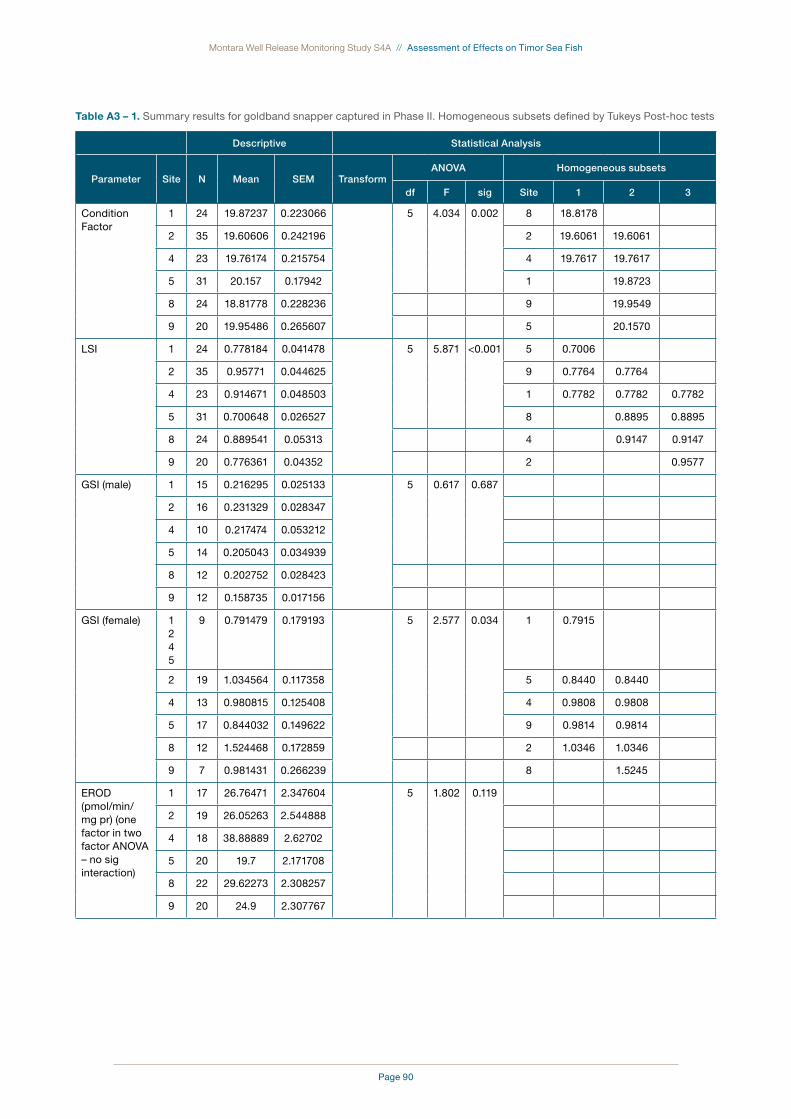
Page 90
Montara Well Release Monitoring Study S4A // Assessment of Effects on Timor Sea Fish
table a3 – 1. Summary results for goldband snapper captured in Phase II. Homogeneous subsets defined by Tukeys Post-hoc tests
Descriptive Statistical Analysis
Parameter Site N Mean SEM TransformANOVA Homogeneous subsets
df F sig Site 1 2 3
Condition Factor
1 24 19.87237 0.223066 5 4.034 0.002 8 18.8178
2 35 19.60606 0.242196 2 19.6061 19.6061
4 23 19.76174 0.215754 4 19.7617 19.7617
5 31 20.157 0.17942 1 19.8723
8 24 18.81778 0.228236 9 19.9549
9 20 19.95486 0.265607 5 20.1570
LSI 1 24 0.778184 0.041478 5 5.871 <0.001 5 0.7006
2 35 0.95771 0.044625 9 0.7764 0.7764
4 23 0.914671 0.048503 1 0.7782 0.7782 0.7782
5 31 0.700648 0.026527 8 0.8895 0.8895
8 24 0.889541 0.05313 4 0.9147 0.9147
9 20 0.776361 0.04352 2 0.9577
GSI (male) 1 15 0.216295 0.025133 5 0.617 0.687
2 16 0.231329 0.028347
4 10 0.217474 0.053212
5 14 0.205043 0.034939
8 12 0.202752 0.028423
9 12 0.158735 0.017156
GSI (female) 1245
9 0.791479 0.179193 5 2.577 0.034 1 0.7915
2 19 1.034564 0.117358 5 0.8440 0.8440
4 13 0.980815 0.125408 4 0.9808 0.9808
5 17 0.844032 0.149622 9 0.9814 0.9814
8 12 1.524468 0.172859 2 1.0346 1.0346
9 7 0.981431 0.266239 8 1.5245
EROD(pmol/min/mg pr) (one factor in two factor ANOVA – no sig interaction)
1 17 26.76471 2.347604 5 1.802 0.119
2 19 26.05263 2.544888
4 18 38.88889 2.62702
5 20 19.7 2.171708
8 22 29.62273 2.308257
9 20 24.9 2.307767

Page 91
Montara Well Release Monitoring Study S4A // Assessment of Effects on Timor Sea Fish
Descriptive Statistical Analysis
Parameter Site N Mean SEM TransformANOVA Homogeneous subsets
df F sig Site 1 2 3
Naphthalene-type metabolites(mg/mg pr)
1 20 7354.35 498.1729 5 4.285 0.001 5 5353.9
2 20 7337.85 605.0693 4 5356.1
4 20 5356.05 388.6615 8 7015.5 7015.5
5 21 5353.905 584.8158 2 7337.9 7337.9
8 22 7015.5 413.5523 1 7354.4 7354.4
9 19 8071.684 732.2138 9 8071.7
Pyrene-type metabolites(µg/mg pr)
1 20 1257.8 154.4212 log 5 3.003 0.013 4 2.9181
2 20 1111.7 111.4335 5 2.9422 2.9422
4 20 883.2 77.82601 2 3.0029 3.0029
5 21 995.5238 118.8884 1 3.0524 3.0524
8 22 1519.182 197.8415 8 3.1014 3.1014
9 19 1496.263 157.9369 9 3.1246
Benzo(a)Pyrene-type metabolites(µg/mg pr) (post-hocs based on non-logged data – logged tukeys says no diff)
1 20 7902.25 1254.462 log 5 3.465 0.006 5 4948.0
2 20 5744.25 562.7884 4 5130.8 5130.8
4 20 4947.95 290.1948 2 5744.3 5744.3
5 21 5130.81 594.8676 8 6933.7 6933.7
8 22 6933.682 532.4972 9 7106.6 7106.6
9 19 7106.579 634.9854 1 7902.3
SDH(mIU)
1 19 25.11036 7.254186 5 0.268 0.930
2 21 32.39631 7.513514
4 20 23.37097 4.77476
5 21 20.59908 4.057786
8 24 19.27419 2.934565
9 19 16.09508 3.902118
DNA damage(ng/ml/mg pr)
1 16 1.379798 0.176707 5 2.408 0.041 Post-hocs don’t identify differences. Closest is difference
between sites 2 and 9
2 20 0.918831 0.090075
4 19 1.049659 0.089261
5 18 1.324223 0.151047
8 19 1.321676 0.137129
9 17 1.483769 0.194482

Page 92
Montara Well Release Monitoring Study S4A // Assessment of Effects on Timor Sea Fish
table a3 – 2. Summary results for red emperor captured in Phase II. Homogeneous subsets defined by Tukeys Post-hoc tests
Descriptive Statistical Analysis
Parameter Site N Mean SEM TransformANOVA Homogeneous subsets
df F sig Site 1 2 3
Condition Factor
1 21 26.27 0.868 – – 0.016 8 24.6035
(Kruskal Wallis)
2 18 27.35 0.992 9 26.5190
4 24 24.42 0.592 4 26.6281
5 23 23.89 0.590 5 26.8341
8 2 27.3021
9 1 27.4421
LSI 1 35 0.695416 0.025804 5 4.178 0.001 4 0.2125
2 27 0.692718 0.041936 2 0.2254 0.2254
4 38 0.639996 0.026737 1 0.2277 0.2277
5 20 0.751942 0.058157 5 0.2386 0.2386
8 16 0.841975 0.033926 9 0.2594
9 20 0.827585 0.044922 8 0.2642
GSI (male) 1 15 0.061459 0.006254 – – 0.027 2 0.0537
(Kruskal–Wallis)
2 10 0.053705 0.003056 4 0.0575
4 16 0.057471 0.004225 1 0.0615
5 7 0.096787 0.017271 9 0.0756 0.0756
8 1 0.065156 5 0.0968
9 8 0.075572 0.005066
GSI (female) 1245
19 1.483892 0.221404 5 0.768 0.576
2 17 1.251865 0.132502
4 22 1.566428 0.465634
5 12 2.012885 0.409285
8 11 1.552402 0.163472
9 11 2.085371 0.301213
EROD(pmol/min/mg pr) (results on one factor in two factor ANOVA. No sig interaction but males > females)
1 15 55.4 5.664257 5 2.141 0.067
2 23 76.48696 13.25446
4 17 84.35294 9.938761
5 20 37.145 1.889047
8 16 54.7875 3.33189
9 20 48.22 4.186115
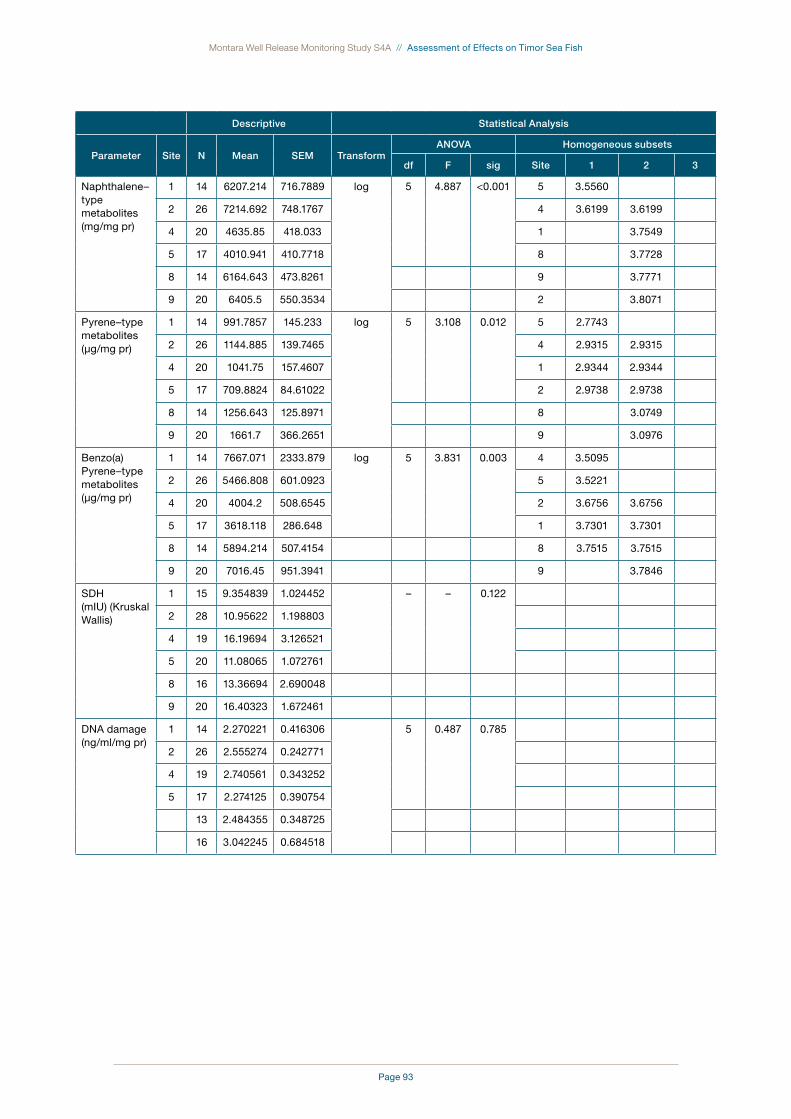
Page 93
Montara Well Release Monitoring Study S4A // Assessment of Effects on Timor Sea Fish
Descriptive Statistical Analysis
Parameter Site N Mean SEM TransformANOVA Homogeneous subsets
df F sig Site 1 2 3
Naphthalene–type metabolites(mg/mg pr)
1 14 6207.214 716.7889 log 5 4.887 <0.001 5 3.5560
2 26 7214.692 748.1767 4 3.6199 3.6199
4 20 4635.85 418.033 1 3.7549
5 17 4010.941 410.7718 8 3.7728
8 14 6164.643 473.8261 9 3.7771
9 20 6405.5 550.3534 2 3.8071
Pyrene–type metabolites(µg/mg pr)
1 14 991.7857 145.233 log 5 3.108 0.012 5 2.7743
2 26 1144.885 139.7465 4 2.9315 2.9315
4 20 1041.75 157.4607 1 2.9344 2.9344
5 17 709.8824 84.61022 2 2.9738 2.9738
8 14 1256.643 125.8971 8 3.0749
9 20 1661.7 366.2651 9 3.0976
Benzo(a)Pyrene–type metabolites(µg/mg pr)
1 14 7667.071 2333.879 log 5 3.831 0.003 4 3.5095
2 26 5466.808 601.0923 5 3.5221
4 20 4004.2 508.6545 2 3.6756 3.6756
5 17 3618.118 286.648 1 3.7301 3.7301
8 14 5894.214 507.4154 8 3.7515 3.7515
9 20 7016.45 951.3941 9 3.7846
SDH(mIU) (Kruskal Wallis)
1 15 9.354839 1.024452 – – 0.122
2 28 10.95622 1.198803
4 19 16.19694 3.126521
5 20 11.08065 1.072761
8 16 13.36694 2.690048
9 20 16.40323 1.672461
DNA damage(ng/ml/mg pr)
1 14 2.270221 0.416306 5 0.487 0.785
2 26 2.555274 0.242771
4 19 2.740561 0.343252
5 17 2.274125 0.390754
13 2.484355 0.348725
16 3.042245 0.684518
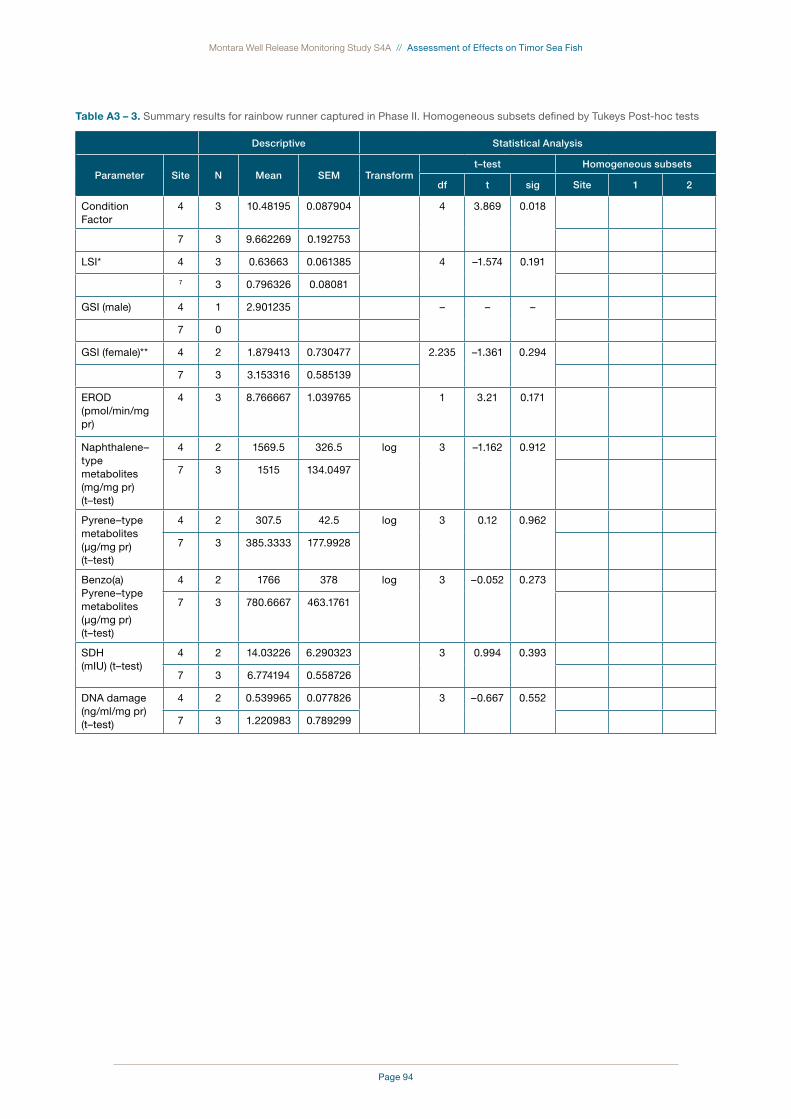
Page 94
Montara Well Release Monitoring Study S4A // Assessment of Effects on Timor Sea Fish
table a3 – 3. Summary results for rainbow runner captured in Phase II. Homogeneous subsets defined by Tukeys Post-hoc tests
Descriptive Statistical Analysis
Parameter Site N Mean SEM Transformt–test Homogeneous subsets
df t sig Site 1 2
Condition Factor
4 3 10.48195 0.087904 4 3.869 0.018
7 3 9.662269 0.192753
LSI* 4 3 0.63663 0.061385 4 –1.574 0.191
7 3 0.796326 0.08081
GSI (male) 4 1 2.901235 – – –
7 0
GSI (female)** 4 2 1.879413 0.730477 2.235 –1.361 0.294
7 3 3.153316 0.585139
EROD(pmol/min/mg pr)
4 3 8.766667 1.039765 1 3.21 0.171
Naphthalene–type metabolites(mg/mg pr) (t–test)
4 2 1569.5 326.5 log 3 –1.162 0.912
7 3 1515 134.0497
Pyrene–type metabolites(µg/mg pr) (t–test)
4 2 307.5 42.5 log 3 0.12 0.962
7 3 385.3333 177.9928
Benzo(a)Pyrene–type metabolites(µg/mg pr) (t–test)
4 2 1766 378 log 3 –0.052 0.273
7 3 780.6667 463.1761
SDH(mIU) (t–test)
4 2 14.03226 6.290323 3 0.994 0.393
7 3 6.774194 0.558726
DNA damage(ng/ml/mg pr) (t–test)
4 2 0.539965 0.077826 3 –0.667 0.552
7 3 1.220983 0.789299
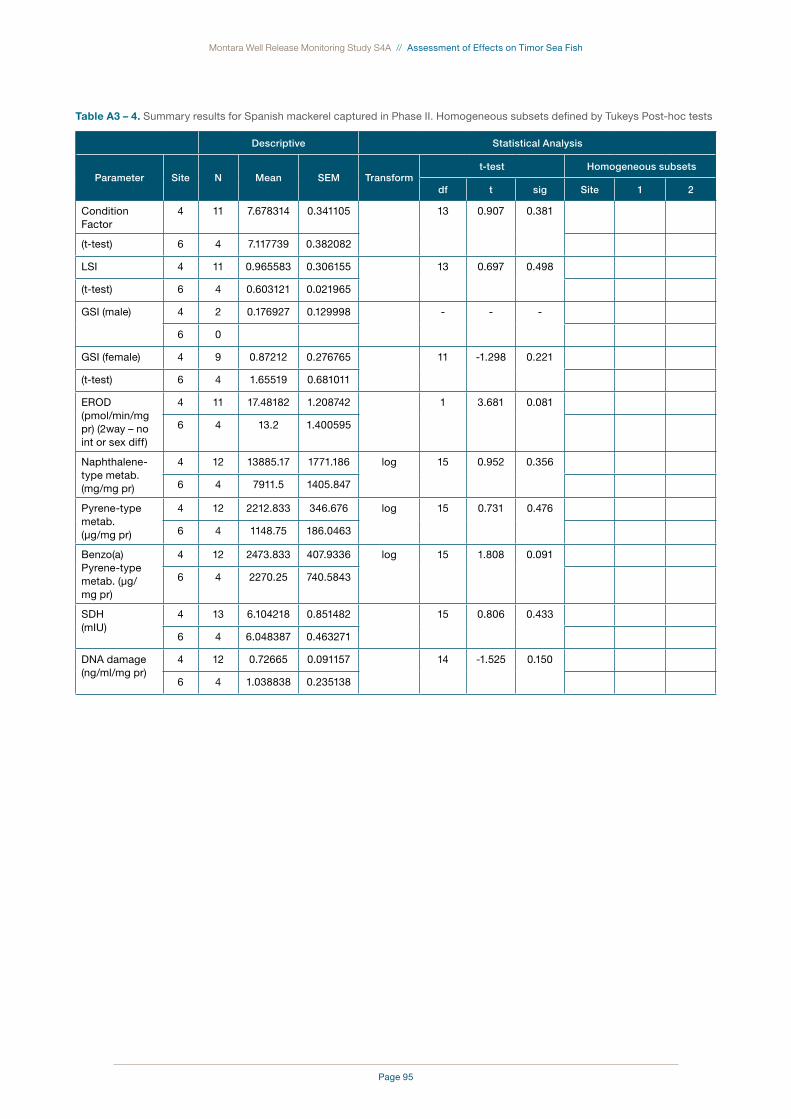
Page 95
Montara Well Release Monitoring Study S4A // Assessment of Effects on Timor Sea Fish
table a3 – 4. Summary results for Spanish mackerel captured in Phase II. Homogeneous subsets defined by Tukeys Post-hoc tests
Descriptive Statistical Analysis
Parameter Site N Mean SEM Transformt-test Homogeneous subsets
df t sig Site 1 2
Condition Factor
4 11 7.678314 0.341105 13 0.907 0.381
(t-test) 6 4 7.117739 0.382082
LSI 4 11 0.965583 0.306155 13 0.697 0.498
(t-test) 6 4 0.603121 0.021965
GSI (male) 4 2 0.176927 0.129998 - - -
6 0
GSI (female) 4 9 0.87212 0.276765 11 -1.298 0.221
(t-test) 6 4 1.65519 0.681011
EROD(pmol/min/mg pr) (2way – no int or sex diff)
4 11 17.48182 1.208742 1 3.681 0.081
6 4 13.2 1.400595
Naphthalene-type metab. (mg/mg pr)
4 12 13885.17 1771.186 log 15 0.952 0.356
6 4 7911.5 1405.847
Pyrene-type metab.(µg/mg pr)
4 12 2212.833 346.676 log 15 0.731 0.476
6 4 1148.75 186.0463
Benzo(a)Pyrene-type metab. (µg/mg pr)
4 12 2473.833 407.9336 log 15 1.808 0.091
6 4 2270.25 740.5843
SDH(mIU)
4 13 6.104218 0.851482 15 0.806 0.433
6 4 6.048387 0.463271
DNA damage(ng/ml/mg pr)
4 12 0.72665 0.091157 14 -1.525 0.150
6 4 1.038838 0.235138

Page 96
Montara Well Release Monitoring Study S4A // Assessment of Effects on Timor Sea Fish

Page 97
Montara Well Release Monitoring Study S4A // Assessment of Effects on Timor Sea Fish
Appendix D – Results of Floating Material Analysis

Page 98
LEEDER CONSULTING
Chartered Chemists
A.B.N. 540 864 910 094 - 5, 18 Redland DriveMitcham, Vic, 3132Telephone: (03) 9874 1988Fax: (03) 9874 1933
162 Colins StreetWest PerthWestern Australia 6005Attention: Eleanor Stoney
SAMPLES:
DATE RECEIVED:
DATE COMMENCED:
METHODS:
RESULTS: Please refer to attached pages for results.
REPORTED BY:
Level 1
24-Nov-2010
Three samples were received for analysis
23-Dec-2010
CERTIFICATE OF ANALYSIS
Adam Atkinson
See Attached Results
Laboratory Manager
Note: No petroleum hydrocarbons were detected in any of the samples.
Note: Results are based on samples as received at Leeder Consulting's laboratories
PTTEP Australasia
14-Jan-2011REPORT NUMBER:
Site/Client Ref: M101702AWest Atlas
NATA Accredited Laboratory Number: 14429
This Document is issued in accordance withNATA's accreditation requirements
Accredited for compliance with ISO/IEC 17025.
Page 1 of 3

Page 99
(I) RESULTS
LEEDER CONSULTING
Report N°: M101702A
Matrix: Sheen
Method: MA-28 Product Identification
Analyte Name PQL
Client ID
Leeder ID
nd Some fatty acids Some fatty acidsProduct Identification
Site 1-2
2010021819
Site 1-1
2010021818
Site 4Heywood Shoal
2010021817
Matrix: Sheen
Method: MA-28 Product Identification
Analyte Name PQL
Client ID
Leeder ID
ndProduct Identification
Blank
Method
2010021821
Page 2 of 3
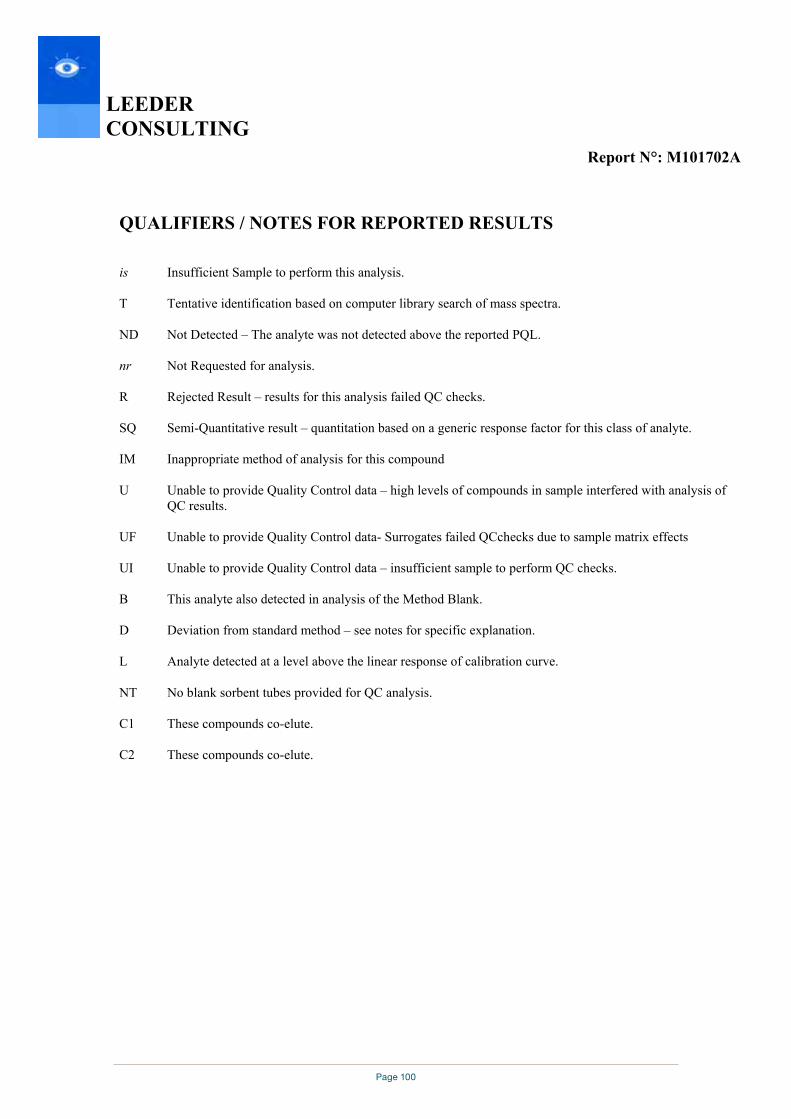
Page 100
LEEDER CONSULTING
Report N°: M101702A
QUALIFIERS / NOTES FOR REPORTED RESULTS
is Insufficient Sample to perform this analysis.
T Tentative identification based on computer library search of mass spectra.
ND Not Detected – The analyte was not detected above the reported PQL.
nr Not Requested for analysis.
R Rejected Result – results for this analysis failed QC checks.
SQ Semi-Quantitative result – quantitation based on a generic response factor for this class of analyte.
IM Inappropriate method of analysis for this compound
U Unable to provide Quality Control data – high levels of compounds in sample interfered with analysis of QC results.
UF Unable to provide Quality Control data- Surrogates failed QCchecks due to sample matrix effects
UI Unable to provide Quality Control data – insufficient sample to perform QC checks.
B This analyte also detected in analysis of the Method Blank.
D Deviation from standard method – see notes for specific explanation.
L Analyte detected at a level above the linear response of calibration curve.
NT No blank sorbent tubes provided for QC analysis.
C1 These compounds co-elute.
C2 These compounds co-elute.
Page 3 of 3

Page 101
LEEDER CONSULTING
APPENDIX ONE.
CHAIN OF CUSTODY DOCUMENT

Page 102
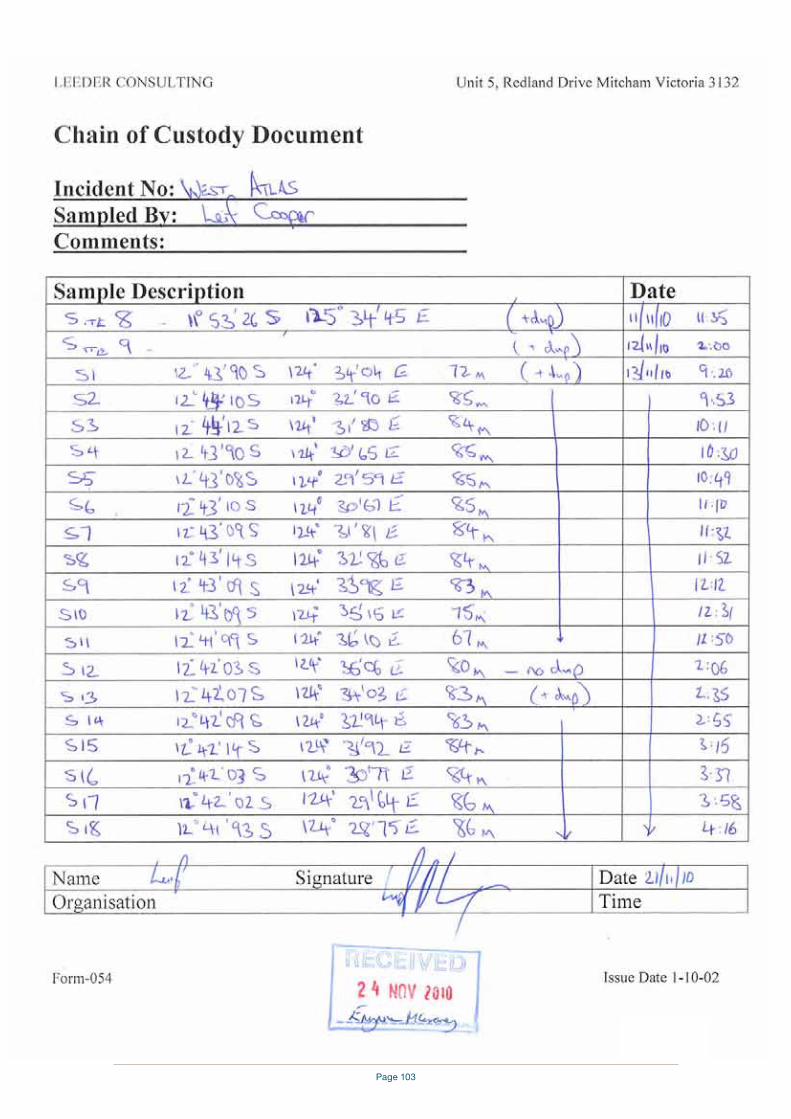
Page 103
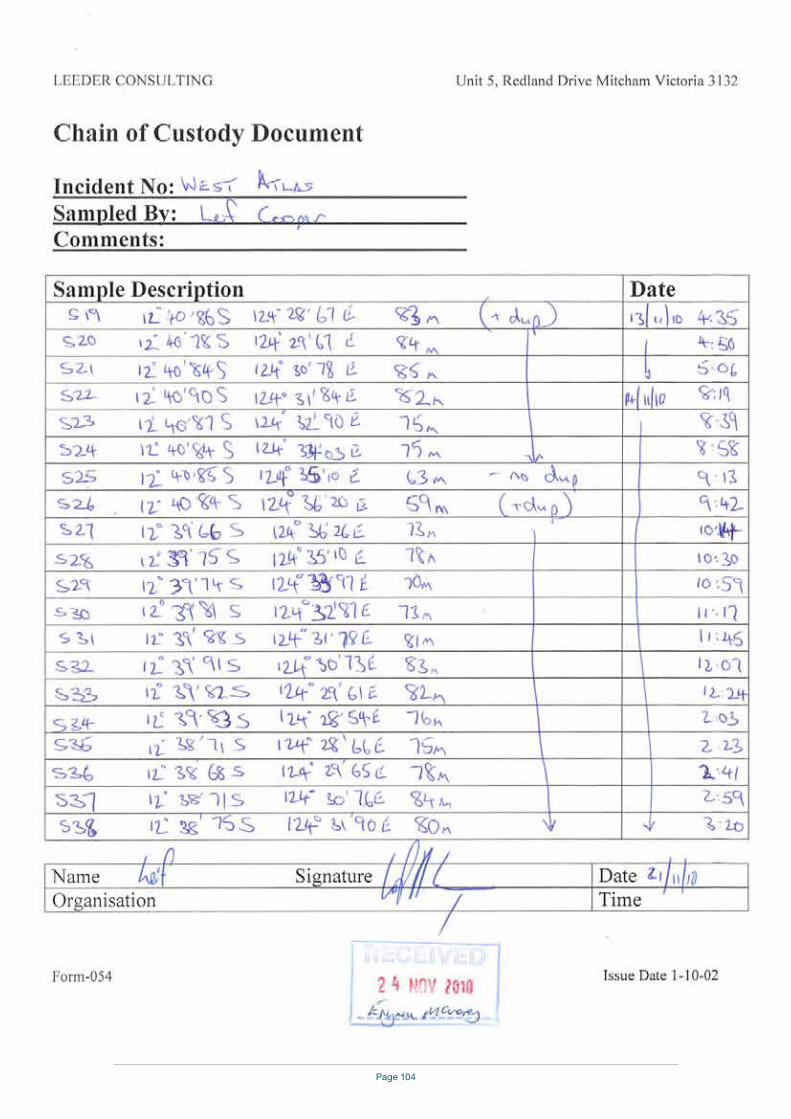
Page 104
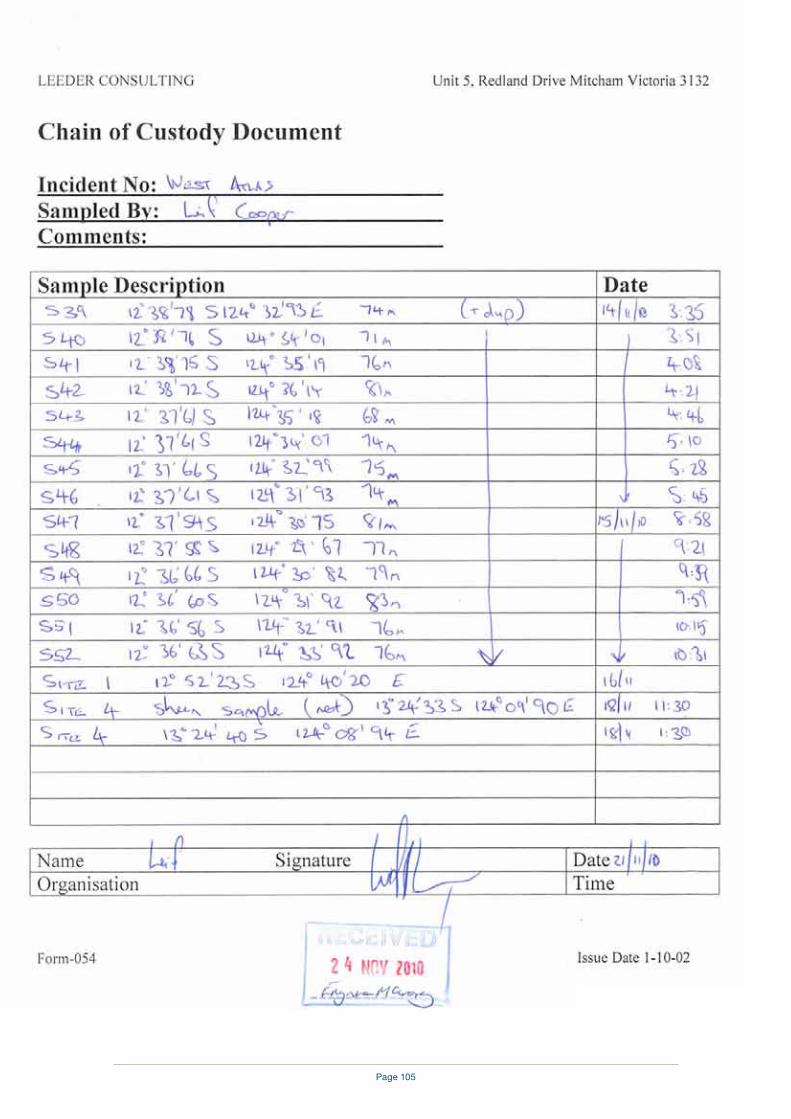
Page 105
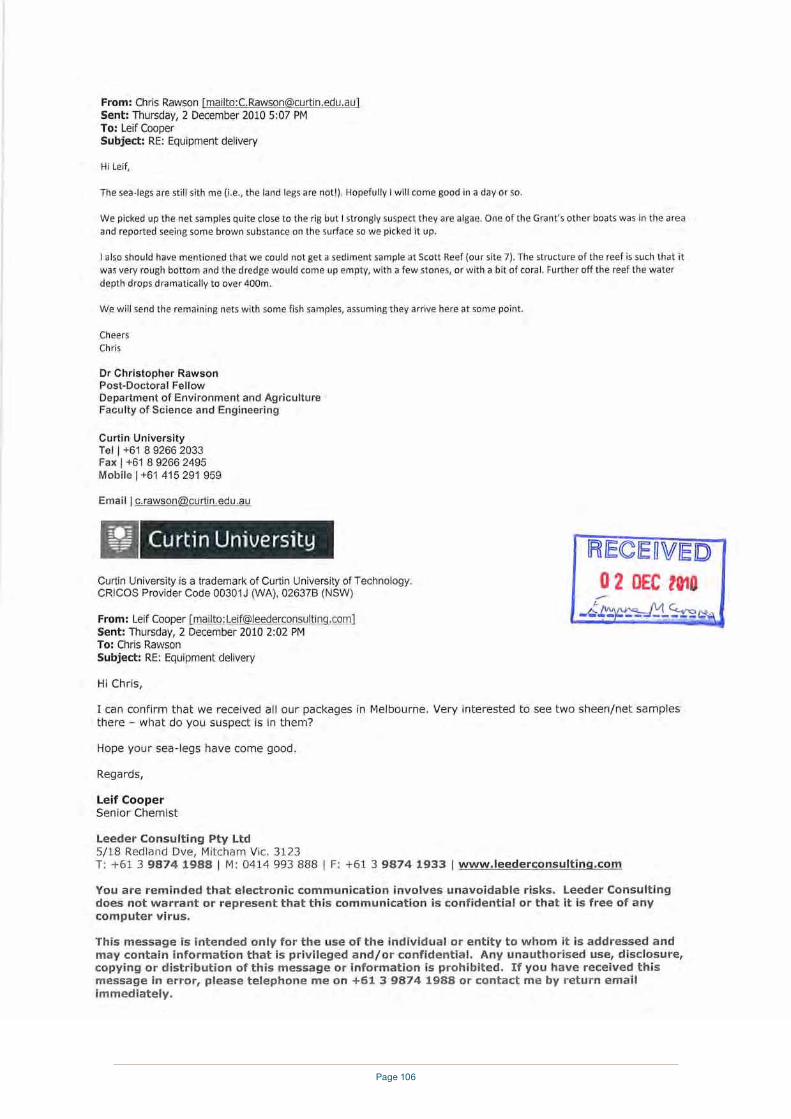
Page 106
Page 107
Report No: M101702A
LEEDERCONSULTING
APPENDIX TWO
TOTAL ION CHROMATOGRAMS
4.00 6.00 8.00 10.00 12.00 14.00 16.00
500000
1000000
1500000
2000000
2500000
3000000
3500000
4000000
4500000
5000000
5500000
6000000
6500000
7000000
7500000
8000000
8500000
9000000
9500000
Time-->
Abundance
TIC: SV_021.D\data.ms
Site 4 – Heywood ShoalLeeder ID: 2010021817
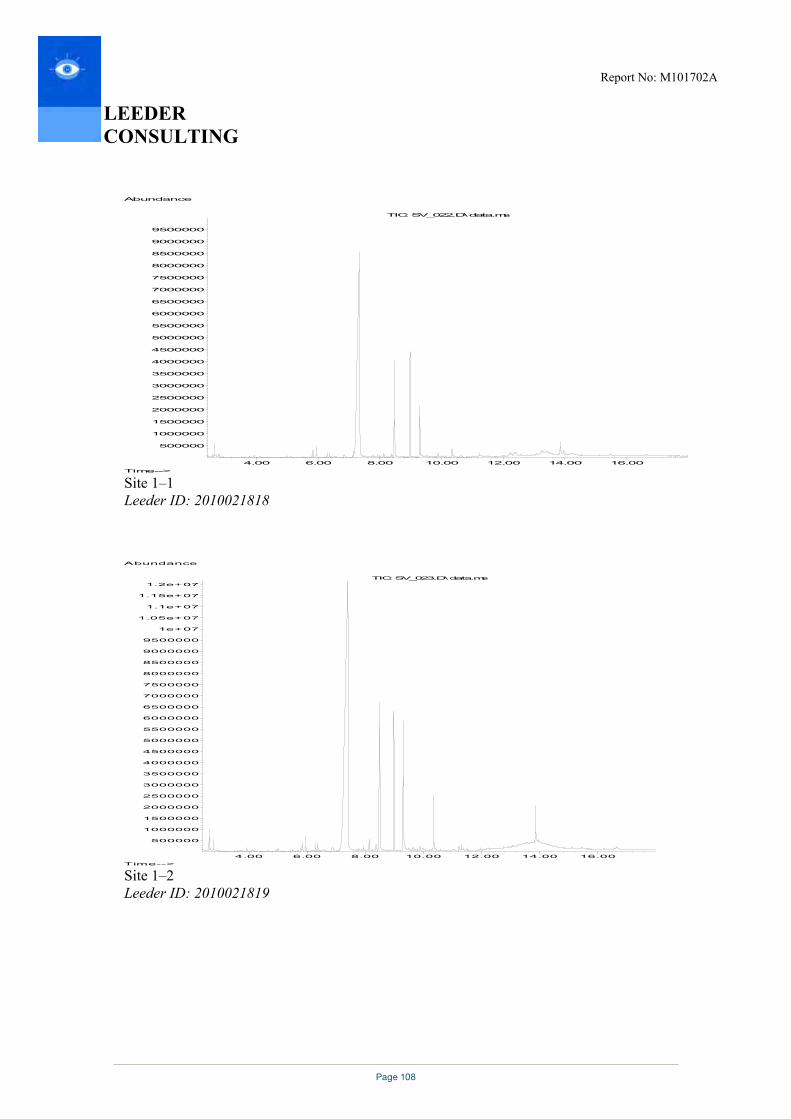
Page 108
Report No: M101702A
LEEDERCONSULTING
4.00 6.00 8.00 10.00 12.00 14.00 16.00
500000
1000000
1500000
2000000
2500000
3000000
3500000
4000000
4500000
5000000
5500000
6000000
6500000
7000000
7500000
8000000
8500000
9000000
9500000
Time-->
Abundance
TIC: SV_022.D\data.ms
Site 1–1 Leeder ID: 2010021818
4.00 6.00 8.00 10.00 12.00 14.00 16.00
500000
1000000
1500000
2000000
2500000
3000000
3500000
4000000
4500000
5000000
5500000
6000000
6500000
7000000
7500000
8000000
8500000
9000000
9500000
1e+07
1.05e+07
1.1e+07
1.15e+07
1.2e+07
Time-->
Abundance
TIC: SV_023.D\data.ms
Site 1–2 Leeder ID: 2010021819

Page 109
Montara Well Release Monitoring Study S4A // Assessment of Effects on Timor Sea Fish
Appendix E – Results of Water Samples Analysis (Phase I and Phase II)

Page 110
A.B.N. 54 086 491 009 4-5, 18 Redland Drive Mitcham, Victoria AUSTRALIA, 3132 Telephone +61 3 9874 1988 Fax +61 3 9874 1933
Page 1 of 7
LEEDER CONSULTING LEEDER
CONSULTING Chartered Chemists & Toxicologists 4th December 2009 Australian Maritime Safety Authority REPORT No: M091766 GPO Box 2181 Site/Client Ref: West Atlas Canberra, ACT 2601 Attn: Paul Nelson
CERTIFICATE OF ANALYSIS
SAMPLES: Fifty-two samples were received for analysis DATE RECEIVED: 20-Nov-2009 DATE COMMENCED: 20-Nov-2009 METHODS: See Attached Results RESULTS: Please refer to attached pages for results Note: Results are based on samples as received at Leeder Consulting’s Laboratories Report By:
Leif Cooper Senior Chemist This report has been prepared in accordance with the quality system of Leeder Consulting Pty. Ltd and may not be reproduced except in full.
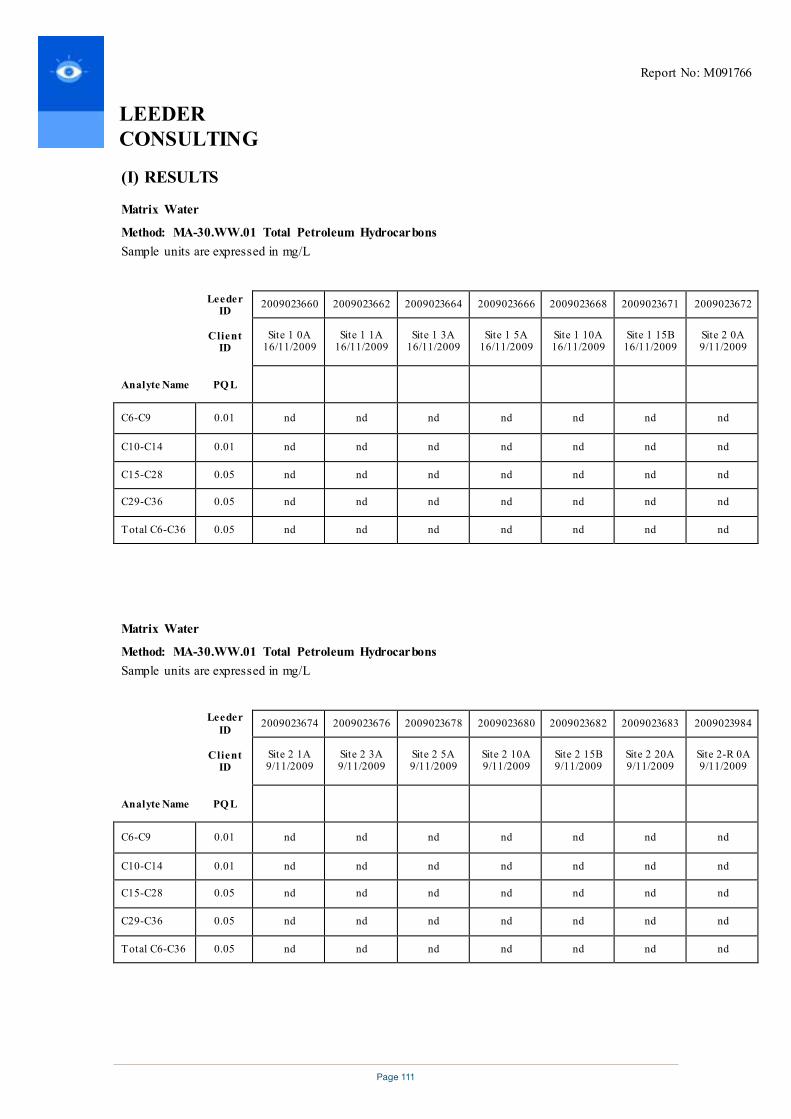
Page 111
Report No: M091766
Page 2 of 7
LEEDER CONSULTING LEEDER
CONSULTING (I) RESULTS
Matrix Water
Method: MA-30.WW.01 Total Petroleum Hydrocarbons Sample units are expressed in mg/L
Leeder ID 2009023660 2009023662 2009023664 2009023666 2009023668 2009023671 2009023672
Client ID
Site 1 0A 16/11/2009
Site 1 1A 16/11/2009
Site 1 3A 16/11/2009
Site 1 5A 16/11/2009
Site 1 10A 16/11/2009
Site 1 15B 16/11/2009
Site 2 0A 9/11/2009
Analyte Name PQ L
C6-C9 0.01 nd nd nd nd nd nd nd
C10-C14 0.01 nd nd nd nd nd nd nd
C15-C28 0.05 nd nd nd nd nd nd nd
C29-C36 0.05 nd nd nd nd nd nd nd
Total C6-C36 0.05 nd nd nd nd nd nd nd
Matrix Water
Method: MA-30.WW.01 Total Petroleum Hydrocarbons Sample units are expressed in mg/L
Leeder ID 2009023674 2009023676 2009023678 2009023680 2009023682 2009023683 2009023984
Client ID
Site 2 1A 9/11/2009
Site 2 3A 9/11/2009
Site 2 5A 9/11/2009
Site 2 10A 9/11/2009
Site 2 15B 9/11/2009
Site 2 20A 9/11/2009
Site 2-R 0A 9/11/2009
Analyte Name PQ L
C6-C9 0.01 nd nd nd nd nd nd nd
C10-C14 0.01 nd nd nd nd nd nd nd
C15-C28 0.05 nd nd nd nd nd nd nd
C29-C36 0.05 nd nd nd nd nd nd nd
Total C6-C36 0.05 nd nd nd nd nd nd nd

Page 112
Report No: M091766
Page 3 of 7
LEEDER CONSULTING LEEDER
CONSULTING (I) RESULTS
Matrix Water
Method: MA-30.WW.01 Total Petroleum Hydrocarbons Sample units are expressed in mg/L
Leeder ID 2009023686 2009023688 2009023690 2009023692 2009023694 2009023696 2009023698
Client ID Site 2-R 1A Site 2-R 3A
19/11/2009 Site 2-R 5A 19/11/2009
Site 2-R 10A 19/11/2009
Site 2-R 15A 19/11/2009
Site 3 0A 11/11/2009
Site 3 1A 11/11/2009
Analyte Name PQ L
C6-C9 0.01 nd nd nd nd nd nd nd
C10-C14 0.01 nd nd nd nd nd nd nd
C15-C28 0.05 nd nd nd nd nd nd nd
C29-C36 0.05 nd nd nd nd nd nd nd
Total C6-C36 0.05 nd nd nd nd nd nd nd
Matrix Water
Method: MA-30.WW.01 Total Petroleum Hydrocarbons Sample units are expressed in mg/L
Leeder ID 2009023698 2009023700 2009023702 2009023704 2009023706 2009023708 2009023710
Client ID
Site 3 1A 11/11/2009
Site 3 3A 11/11/2009
Site 3 5A 11/11/2009
Site 3 10A 11/11/2009
Site 3 15A 11/11/2009
Site 4 0A 12/11/2009
Site 4 1A 12/11/2009
Analyte Name PQ L
C6-C9 0.01 nd nd nd nd nd nd nd
C10-C14 0.01 nd nd nd nd nd nd nd
C15-C28 0.05 nd nd nd nd nd nd nd
C29-C36 0.05 nd nd nd nd nd nd nd
Total C6-C36 0.05 nd nd nd nd nd nd nd
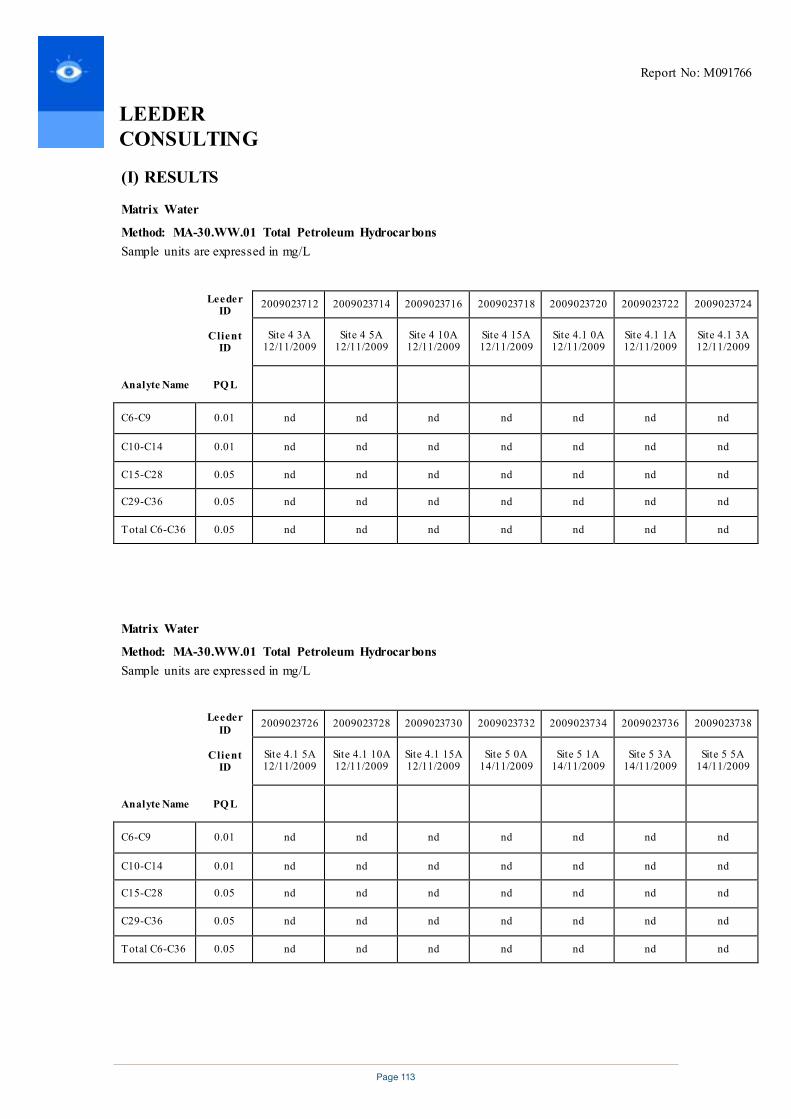
Page 113
Report No: M091766
Page 4 of 7
LEEDER CONSULTING LEEDER
CONSULTING (I) RESULTS
Matrix Water
Method: MA-30.WW.01 Total Petroleum Hydrocarbons Sample units are expressed in mg/L
Leeder ID 2009023712 2009023714 2009023716 2009023718 2009023720 2009023722 2009023724
Client ID
Site 4 3A 12/11/2009
Site 4 5A 12/11/2009
Site 4 10A 12/11/2009
Site 4 15A 12/11/2009
Site 4.1 0A 12/11/2009
Site 4.1 1A 12/11/2009
Site 4.1 3A 12/11/2009
Analyte Name PQ L
C6-C9 0.01 nd nd nd nd nd nd nd
C10-C14 0.01 nd nd nd nd nd nd nd
C15-C28 0.05 nd nd nd nd nd nd nd
C29-C36 0.05 nd nd nd nd nd nd nd
Total C6-C36 0.05 nd nd nd nd nd nd nd
Matrix Water
Method: MA-30.WW.01 Total Petroleum Hydrocarbons Sample units are expressed in mg/L
Leeder ID 2009023726 2009023728 2009023730 2009023732 2009023734 2009023736 2009023738
Client ID
Site 4.1 5A 12/11/2009
Site 4.1 10A 12/11/2009
Site 4.1 15A 12/11/2009
Site 5 0A 14/11/2009
Site 5 1A 14/11/2009
Site 5 3A 14/11/2009
Site 5 5A 14/11/2009
Analyte Name PQ L
C6-C9 0.01 nd nd nd nd nd nd nd
C10-C14 0.01 nd nd nd nd nd nd nd
C15-C28 0.05 nd nd nd nd nd nd nd
C29-C36 0.05 nd nd nd nd nd nd nd
Total C6-C36 0.05 nd nd nd nd nd nd nd
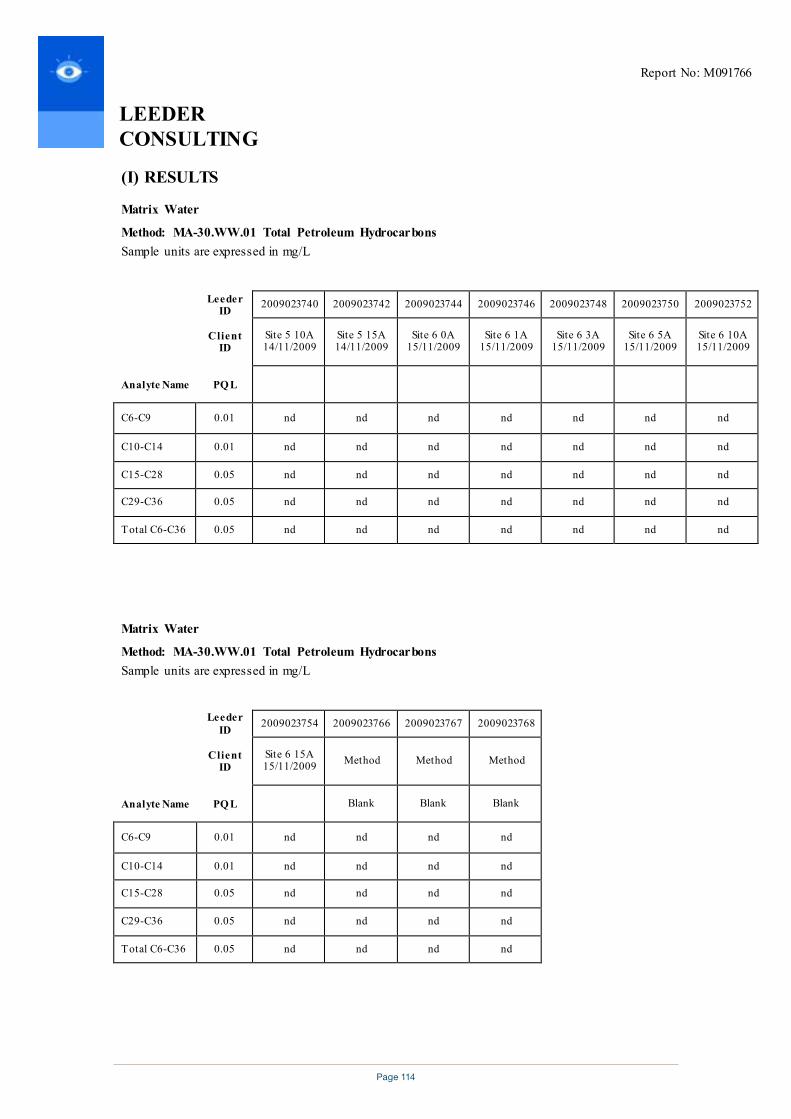
Page 114
Report No: M091766
Page 5 of 7
LEEDER CONSULTING LEEDER
CONSULTING (I) RESULTS
Matrix Water
Method: MA-30.WW.01 Total Petroleum Hydrocarbons Sample units are expressed in mg/L
Leeder ID 2009023740 2009023742 2009023744 2009023746 2009023748 2009023750 2009023752
Client ID
Site 5 10A 14/11/2009
Site 5 15A 14/11/2009
Site 6 0A 15/11/2009
Site 6 1A 15/11/2009
Site 6 3A 15/11/2009
Site 6 5A 15/11/2009
Site 6 10A 15/11/2009
Analyte Name PQ L
C6-C9 0.01 nd nd nd nd nd nd nd
C10-C14 0.01 nd nd nd nd nd nd nd
C15-C28 0.05 nd nd nd nd nd nd nd
C29-C36 0.05 nd nd nd nd nd nd nd
Total C6-C36 0.05 nd nd nd nd nd nd nd
Matrix Water
Method: MA-30.WW.01 Total Petroleum Hydrocarbons Sample units are expressed in mg/L
Leeder ID 2009023754 2009023766 2009023767 2009023768
Client ID
Site 6 15A 15/11/2009 Method Method Method
Analyte Name PQ L Blank Blank Blank
C6-C9 0.01 nd nd nd nd
C10-C14 0.01 nd nd nd nd
C15-C28 0.05 nd nd nd nd
C29-C36 0.05 nd nd nd nd
Total C6-C36 0.05 nd nd nd nd
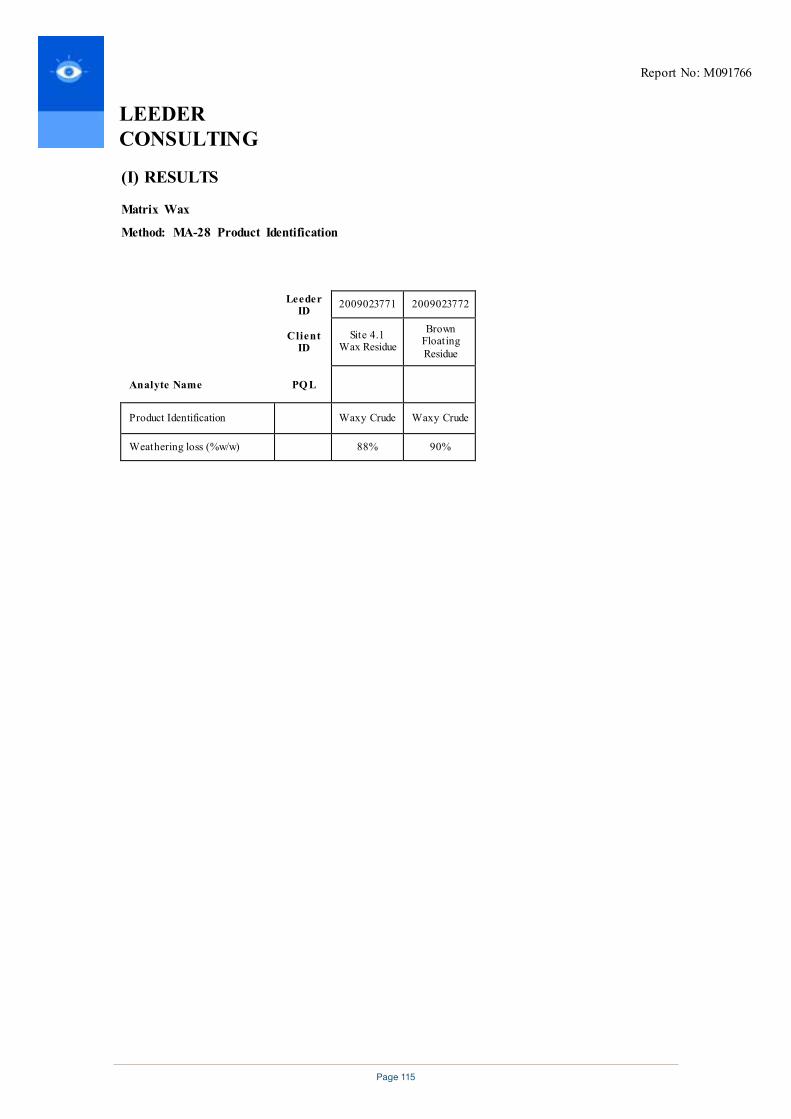
Page 115
Report No: M091766
Page 6 of 7
LEEDER CONSULTING LEEDER
CONSULTING (I) RESULTS
Matrix Wax
Method: MA-28 Product Identification
Leeder ID 2009023771 2009023772
Client ID
Site 4.1 Wax Residue
Brown Floating Residue
Analyte Name PQ L
Product Identification Waxy Crude Waxy Crude
Weathering loss (%w/w) 88% 90%
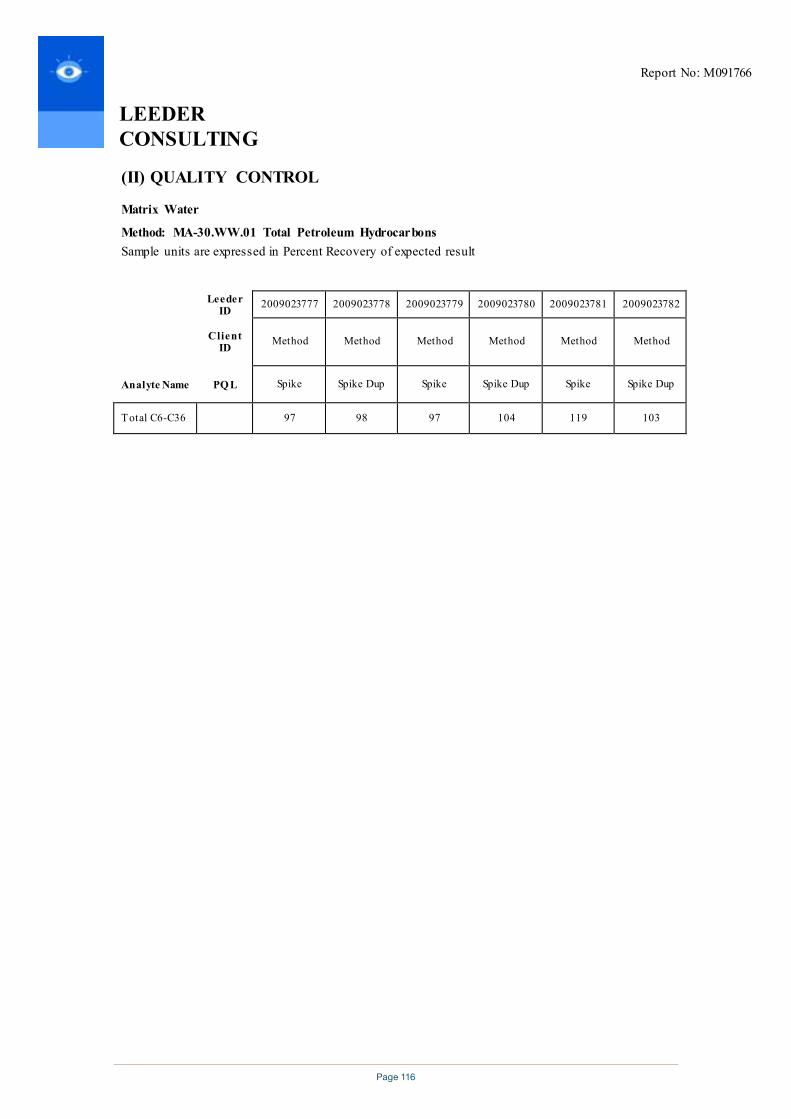
Page 116
Report No: M091766
Page 7 of 7
LEEDER CONSULTING LEEDER
CONSULTING (II) QUALITY CONTROL
Matrix Water
Method: MA-30.WW.01 Total Petroleum Hydrocarbons Sample units are expressed in Percent Recovery of expected result
Leeder ID 2009023777 2009023778 2009023779 2009023780 2009023781 2009023782
Client ID Method Method Method Method Method Method
Analyte Name PQ L Spike Spike Dup Spike Spike Dup Spike Spike Dup
Total C6-C36 97 98 97 104 119 103

Page 117
Report No: M091766
LEEDER CONSULTING LEEDER
CONSULTING
APPENDIX ONE
CHAIN OF CUSTODY
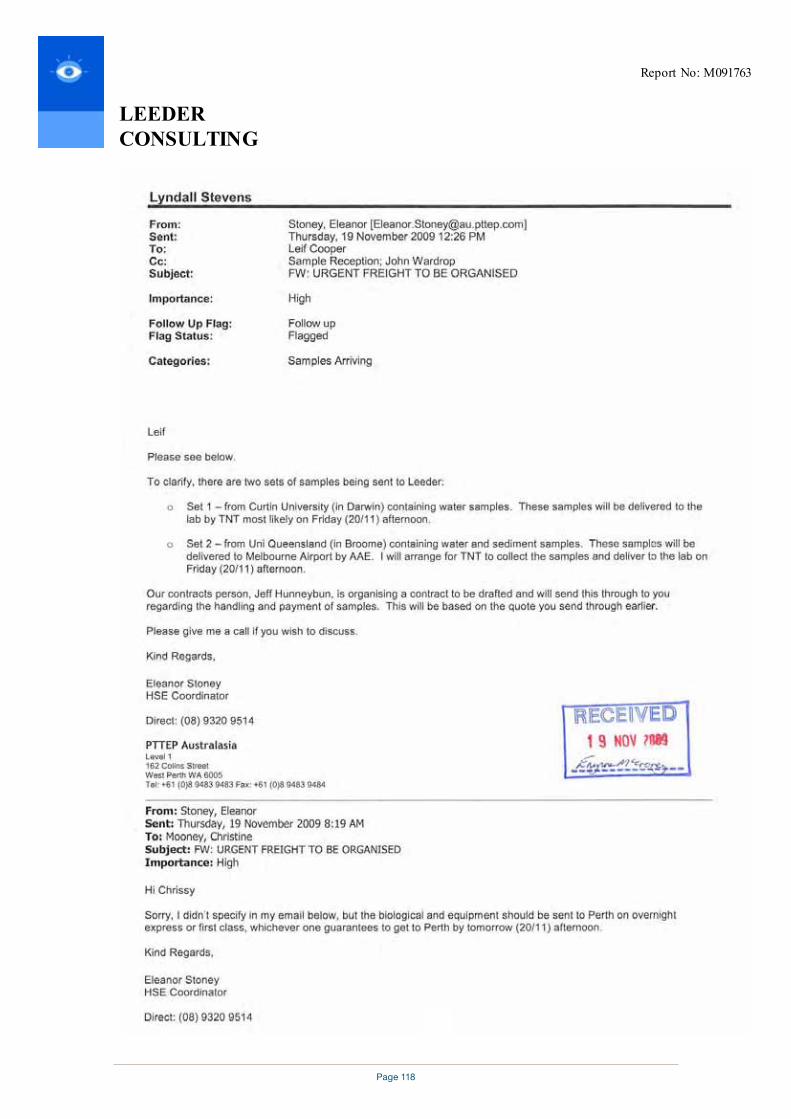
Page 118
Report No: M091763
LEEDER CONSULTING LEEDER
CONSULTING
Page 119
Report No: M091763
LEEDER CONSULTING LEEDER
CONSULTING

Page 120
Report No: M091763
LEEDER CONSULTING LEEDER
CONSULTING
Page 121
LEEDER CONSULTING
Chartered Chemists
A.B.N. 540 864 910 094 - 5, 18 Redland DriveMitcham, Vic, 3132Telephone: (03) 9874 1988Fax: (03) 9874 1933
162 Colins StreetWest PerthWestern Australia 6005Attention: Eleanor Stoney
SAMPLES:
DATE RECEIVED:
DATE COMMENCED:
METHODS:
RESULTS: Please refer to attached pages for results.
REPORTED BY:
Level 1
19-Mar-2010
Thirty-four samples were received for analysis
22-Mar-2010
This report replaces previous report dated 29-Mar-2010CERTIFICATE OF ANALYSIS
Adam Atkinson
See Attached Results
Laboratory Manager
Note: Results are based on samples as received at Leeder Consulting's laboratories
PTTEP Australasia
25-May-2010REPORT NUMBER:
Site/Client Ref: M100344R1Montara S4A Phase II
NATA Accredited Laboratory Number: 14429
This Document is issued in accordance withNATA's accreditation requirements
Accredited for compliance with ISO/IEC 17025.
Page 1 of 23
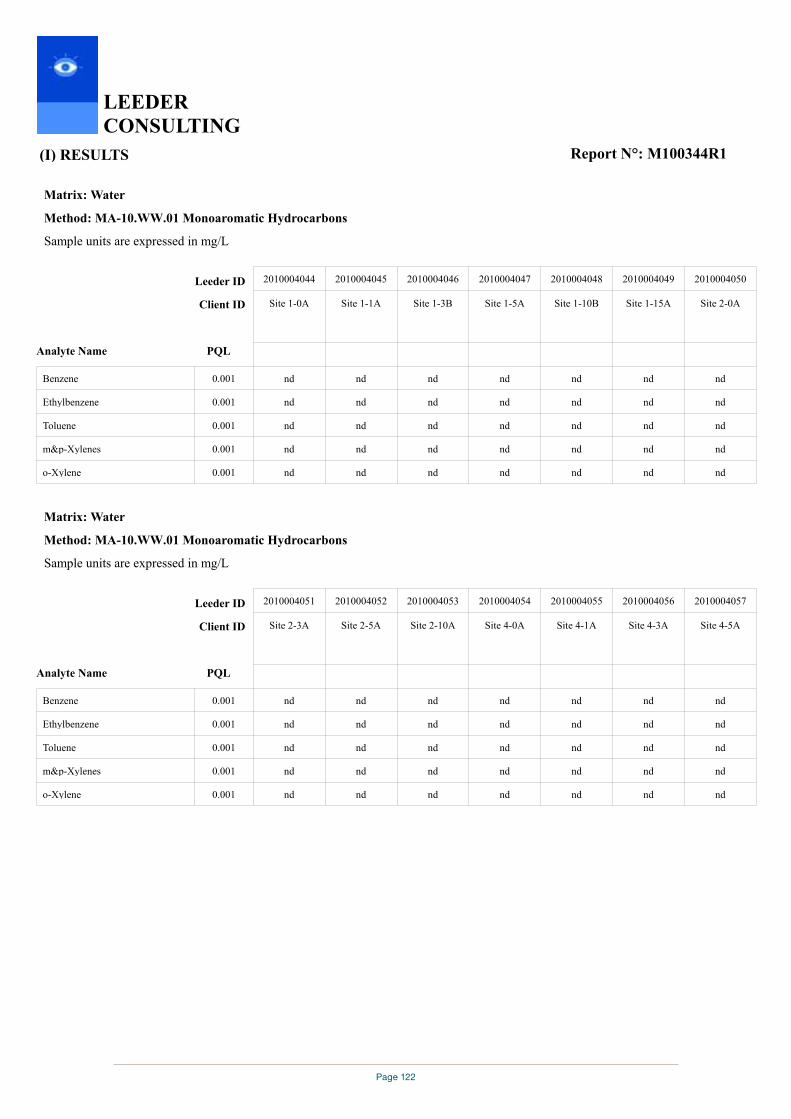
Page 122
(I) RESULTS
LEEDER CONSULTING
Report N°: M100344R1
Matrix: Water
Method: MA-10.WW.01 Monoaromatic Hydrocarbons
Sample units are expressed in mg/L
Analyte Name PQL
Client ID
Leeder ID
nd
nd
nd
nd
nd
nd
nd
nd
nd
nd
nd
nd
nd
nd
nd
nd
nd
nd
nd
nd
nd
nd
nd
nd
nd
nd
nd
nd
nd
nd
nd
nd
nd
nd
nd0.001o-Xylene
0.001m&p-Xylenes
0.001Toluene
0.001Ethylbenzene
0.001Benzene
Site 2-0A
2010004050
Site 1-15A
2010004049
Site 1-10B
2010004048
Site 1-5A
2010004047
Site 1-3B
2010004046
Site 1-1A
2010004045
Site 1-0A
2010004044
Matrix: Water
Method: MA-10.WW.01 Monoaromatic Hydrocarbons
Sample units are expressed in mg/L
Analyte Name PQL
Client ID
Leeder ID
nd
nd
nd
nd
nd
nd
nd
nd
nd
nd
nd
nd
nd
nd
nd
nd
nd
nd
nd
nd
nd
nd
nd
nd
nd
nd
nd
nd
nd
nd
nd
nd
nd
nd
nd0.001o-Xylene
0.001m&p-Xylenes
0.001Toluene
0.001Ethylbenzene
0.001Benzene
Site 4-5A
2010004057
Site 4-3A
2010004056
Site 4-1A
2010004055
Site 4-0A
2010004054
Site 2-10A
2010004053
Site 2-5A
2010004052
Site 2-3A
2010004051
Page 2 of 23
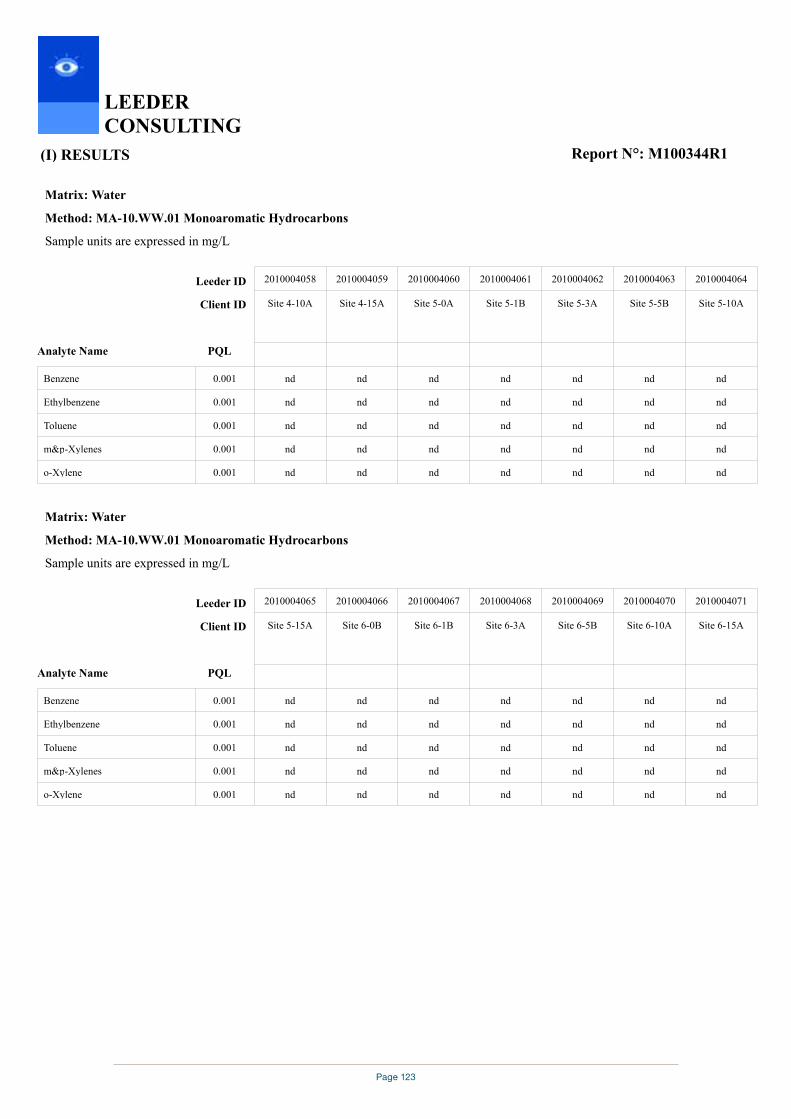
Page 123
(I) RESULTS
LEEDER CONSULTING
Report N°: M100344R1
Matrix: Water
Method: MA-10.WW.01 Monoaromatic Hydrocarbons
Sample units are expressed in mg/L
Analyte Name PQL
Client ID
Leeder ID
nd
nd
nd
nd
nd
nd
nd
nd
nd
nd
nd
nd
nd
nd
nd
nd
nd
nd
nd
nd
nd
nd
nd
nd
nd
nd
nd
nd
nd
nd
nd
nd
nd
nd
nd0.001o-Xylene
0.001m&p-Xylenes
0.001Toluene
0.001Ethylbenzene
0.001Benzene
Site 5-10A
2010004064
Site 5-5B
2010004063
Site 5-3A
2010004062
Site 5-1B
2010004061
Site 5-0A
2010004060
Site 4-15A
2010004059
Site 4-10A
2010004058
Matrix: Water
Method: MA-10.WW.01 Monoaromatic Hydrocarbons
Sample units are expressed in mg/L
Analyte Name PQL
Client ID
Leeder ID
nd
nd
nd
nd
nd
nd
nd
nd
nd
nd
nd
nd
nd
nd
nd
nd
nd
nd
nd
nd
nd
nd
nd
nd
nd
nd
nd
nd
nd
nd
nd
nd
nd
nd
nd0.001o-Xylene
0.001m&p-Xylenes
0.001Toluene
0.001Ethylbenzene
0.001Benzene
Site 6-15A
2010004071
Site 6-10A
2010004070
Site 6-5B
2010004069
Site 6-3A
2010004068
Site 6-1B
2010004067
Site 6-0B
2010004066
Site 5-15A
2010004065
Page 3 of 23

Page 124
(I) RESULTS
LEEDER CONSULTING
Report N°: M100344R1
Matrix: Water
Method: MA-10.WW.01 Monoaromatic Hydrocarbons
Sample units are expressed in mg/L
Analyte Name PQL
Client ID
Leeder ID
nd
nd
nd
nd
nd
nd
nd
nd
nd
nd
nd
nd
nd
nd
nd
nd
nd
nd
nd
nd
nd
nd
nd
nd
nd
nd
nd
nd
nd
nd0.001o-Xylene
0.001m&p-Xylenes
0.001Toluene
0.001Ethylbenzene
0.001Benzene
Site 7-15A
2010004077
Site 7-10A
2010004076
Site 7-5A
2010004075
Site 7-3A
2010004074
Site 7-1A
2010004073
Site 7-0A
2010004072
Matrix: Water
Method: MA-10.WW.01 Monoaromatic Hydrocarbons
Sample units are expressed in mg/L
Analyte Name PQL
Client ID
Leeder ID
nd
nd
nd
nd
nd
nd
nd
nd
nd
nd
nd
nd
nd
nd
nd0.001o-Xylene
0.001m&p-Xylenes
0.001Toluene
0.001Ethylbenzene
0.001Benzene
Blank
Method
2010004126
Blank
Method
2010004125
Blank
Method
2010004124
Page 4 of 23

Page 125
(I) RESULTS
LEEDER CONSULTING
Report N°: M100344R1
Matrix: Water
Method: MA-30.WW.01 Total Petroleum Hydrocarbons
Sample units are expressed in mg/L
Analyte Name PQL
Client ID
Leeder ID
nd
nd
nd
nd
nd
nd
nd
nd
nd
nd
nd
nd
nd
nd
nd
nd
nd
nd
nd
nd
nd
nd
nd
nd
nd
nd
nd
nd
nd
nd
nd
nd
nd
nd
nd0.05Total C6-C36
0.05C29-C36
0.05C15-C28
0.01C10-C14
0.01C6-C9
Site 2-0A
2010004050
Site 1-15A
2010004049
Site 1-10B
2010004048
Site 1-5A
2010004047
Site 1-3B
2010004046
Site 1-1A
2010004045
Site 1-0A
2010004044
Matrix: Water
Method: MA-30.WW.01 Total Petroleum Hydrocarbons
Sample units are expressed in mg/L
Analyte Name PQL
Client ID
Leeder ID
nd
nd
nd
nd
nd
nd
nd
nd
nd
nd
nd
nd
nd
nd
nd
nd
nd
0.39
nd
0.39
nd
nd
0.13
nd
0.13
nd
nd
nd
nd
nd
nd
nd
nd
nd
nd0.05Total C6-C36
0.05C29-C36
0.05C15-C28
0.01C10-C14
0.01C6-C9
Site 4-5A
2010004057
Site 4-3A
2010004056
Site 4-1A
2010004055
Site 4-0A
2010004054
Site 2-10A
2010004053
Site 2-5A
2010004052
Site 2-3A
2010004051
Page 5 of 23

Page 126
(I) RESULTS
LEEDER CONSULTING
Report N°: M100344R1
Matrix: Water
Method: MA-30.WW.01 Total Petroleum Hydrocarbons
Sample units are expressed in mg/L
Analyte Name PQL
Client ID
Leeder ID
nd
nd
nd
nd
nd
nd
nd
nd
nd
nd
nd
nd
nd
nd
nd
nd
nd
nd
nd
nd
nd
nd
nd
nd
nd
nd
nd
nd
nd
nd
nd
nd
nd
nd
nd0.05Total C6-C36
0.05C29-C36
0.05C15-C28
0.01C10-C14
0.01C6-C9
Site 5-10A
2010004064
Site 5-5B
2010004063
Site 5-3A
2010004062
Site 5-1B
2010004061
Site 5-0A
2010004060
Site 4-15A
2010004059
Site 4-10A
2010004058
Matrix: Water
Method: MA-30.WW.01 Total Petroleum Hydrocarbons
Sample units are expressed in mg/L
Analyte Name PQL
Client ID
Leeder ID
nd
nd
nd
nd
nd
nd
nd
nd
nd
nd
nd
nd
nd
nd
nd
nd
nd
nd
nd
nd
nd
nd
nd
nd
nd
nd
nd
nd
nd
nd
nd
nd
nd
nd
nd0.05Total C6-C36
0.05C29-C36
0.05C15-C28
0.01C10-C14
0.01C6-C9
Site 6-15A
2010004071
Site 6-10A
2010004070
Site 6-5B
2010004069
Site 6-3A
2010004068
Site 6-1B
2010004067
Site 6-0B
2010004066
Site 5-15A
2010004065
Page 6 of 23

Page 127
(I) RESULTS
LEEDER CONSULTING
Report N°: M100344R1
Matrix: Water
Method: MA-30.WW.01 Total Petroleum Hydrocarbons
Sample units are expressed in mg/L
Analyte Name PQL
Client ID
Leeder ID
nd
nd
nd
nd
nd
nd
nd
nd
nd
nd
nd
nd
nd
nd
nd
nd
nd
nd
nd
nd
nd
nd
nd
nd
nd
nd
nd
nd
nd
nd0.05Total C6-C36
0.05C29-C36
0.05C15-C28
0.01C10-C14
0.01C6-C9
Site 7-15A
2010004077
Site 7-10A
2010004076
Site 7-5A
2010004075
Site 7-3A
2010004074
Site 7-1A
2010004073
Site 7-0A
2010004072
Matrix: Water
Method: MA-30.WW.01 Total Petroleum Hydrocarbons
Sample units are expressed in mg/L
Analyte Name PQL
Client ID
Leeder ID
nd
nd
nd
nd
nd
nd
nd
nd
nd
nd0.05Total C6-C36
0.05C29-C36
0.05C15-C28
0.01C10-C14
0.01C6-C9
Blank
Method
2010004125
Blank
Method
2010004124
Page 7 of 23

Page 128
(I) RESULTS
LEEDER CONSULTING
Report N°: M100344R1
Matrix: Water
Method: MA-72.WW.01 Polynuclear Aromatic Hydrocarbons
Sample units are expressed in mg/L
Analyte Name PQL
Client ID
Leeder ID
nd
nd
nd
nd
nd
nd
nd
nd
nd
nd
nd
nd
nd
nd
nd
nd
nd
nd
nd
nd
nd
nd
nd
nd
nd
nd
nd
nd
nd
nd
nd
nd
nd
nd
nd
nd
nd
nd
nd
nd
nd
nd
nd
nd
nd
nd
nd
nd
nd
nd
nd
nd
nd
nd
nd
nd
nd
nd
nd
nd
nd
nd
nd
nd
nd
nd
nd
nd
nd
nd
nd
nd
nd
nd
nd
nd
nd
nd
nd
nd
nd
nd
nd
nd
nd
nd
nd
nd
nd
nd
nd
nd
nd
nd
nd
nd
nd
nd
nd
nd
nd
nd
nd
nd
nd
nd
nd
nd
nd
nd
nd
nd
nd
nd
nd
nd
nd
nd
nd
nd
nd
nd
nd
nd
nd
nd0.001Pyrene
0.001Phenanthrene
0.001Naphthalene
0.0013-Methylcholanthrene
0.001Indeno (1,2,3-cd) pyrene
0.001Fluorene
0.001Fluoranthene
0.0017,12-Dimethylbenz(a)anthracene
0.001Dibenz (ah) anthracene
0.001Chrysene
0.001Benzo (k) fluoranthene
0.001Benzo (ghi) perylene
0.001Benzo (b) fluoranthene
0.001Benzo (a) pyrene
0.001Benzo(a)anthracene
0.001Anthracene
0.001Acenaphthylene
0.001Acenaphthene
Site 2-0A
2010004050
Site 1-15A
2010004049
Site 1-10B
2010004048
Site 1-5A
2010004047
Site 1-3B
2010004046
Site 1-1A
2010004045
Site 1-0A
2010004044
Page 8 of 23
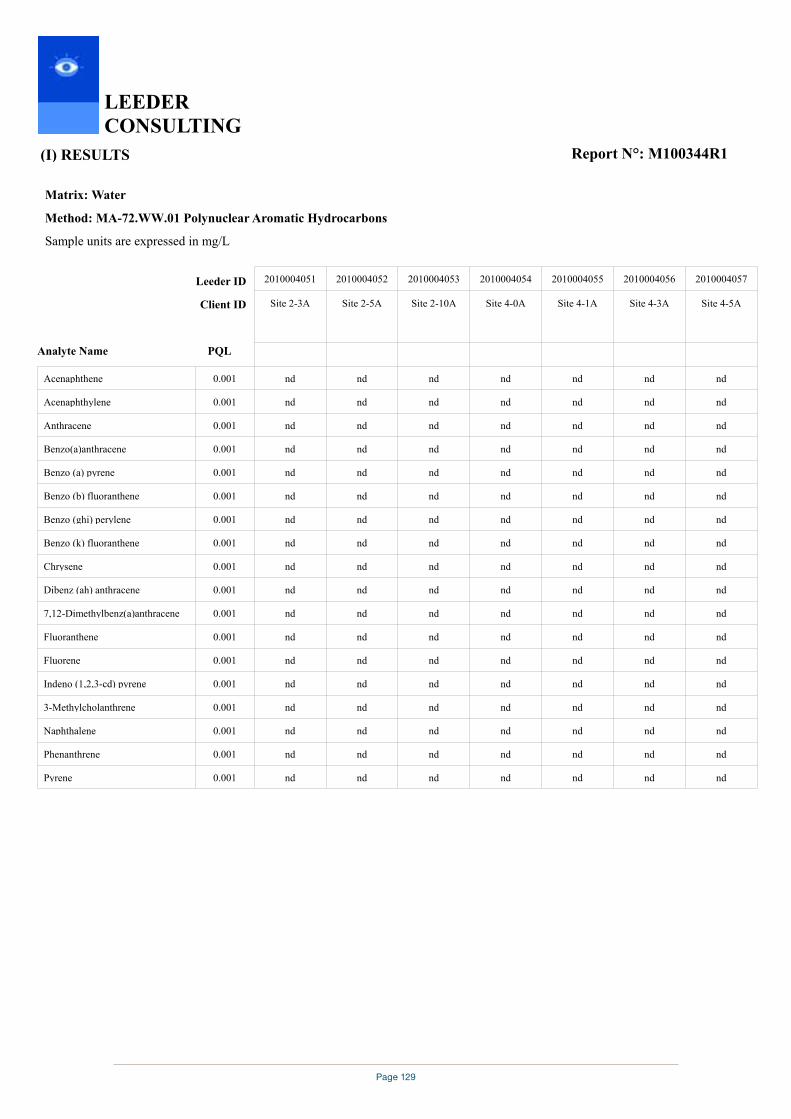
Page 129
(I) RESULTS
LEEDER CONSULTING
Report N°: M100344R1
Matrix: Water
Method: MA-72.WW.01 Polynuclear Aromatic Hydrocarbons
Sample units are expressed in mg/L
Analyte Name PQL
Client ID
Leeder ID
nd
nd
nd
nd
nd
nd
nd
nd
nd
nd
nd
nd
nd
nd
nd
nd
nd
nd
nd
nd
nd
nd
nd
nd
nd
nd
nd
nd
nd
nd
nd
nd
nd
nd
nd
nd
nd
nd
nd
nd
nd
nd
nd
nd
nd
nd
nd
nd
nd
nd
nd
nd
nd
nd
nd
nd
nd
nd
nd
nd
nd
nd
nd
nd
nd
nd
nd
nd
nd
nd
nd
nd
nd
nd
nd
nd
nd
nd
nd
nd
nd
nd
nd
nd
nd
nd
nd
nd
nd
nd
nd
nd
nd
nd
nd
nd
nd
nd
nd
nd
nd
nd
nd
nd
nd
nd
nd
nd
nd
nd
nd
nd
nd
nd
nd
nd
nd
nd
nd
nd
nd
nd
nd
nd
nd
nd0.001Pyrene
0.001Phenanthrene
0.001Naphthalene
0.0013-Methylcholanthrene
0.001Indeno (1,2,3-cd) pyrene
0.001Fluorene
0.001Fluoranthene
0.0017,12-Dimethylbenz(a)anthracene
0.001Dibenz (ah) anthracene
0.001Chrysene
0.001Benzo (k) fluoranthene
0.001Benzo (ghi) perylene
0.001Benzo (b) fluoranthene
0.001Benzo (a) pyrene
0.001Benzo(a)anthracene
0.001Anthracene
0.001Acenaphthylene
0.001Acenaphthene
Site 4-5A
2010004057
Site 4-3A
2010004056
Site 4-1A
2010004055
Site 4-0A
2010004054
Site 2-10A
2010004053
Site 2-5A
2010004052
Site 2-3A
2010004051
Page 9 of 23
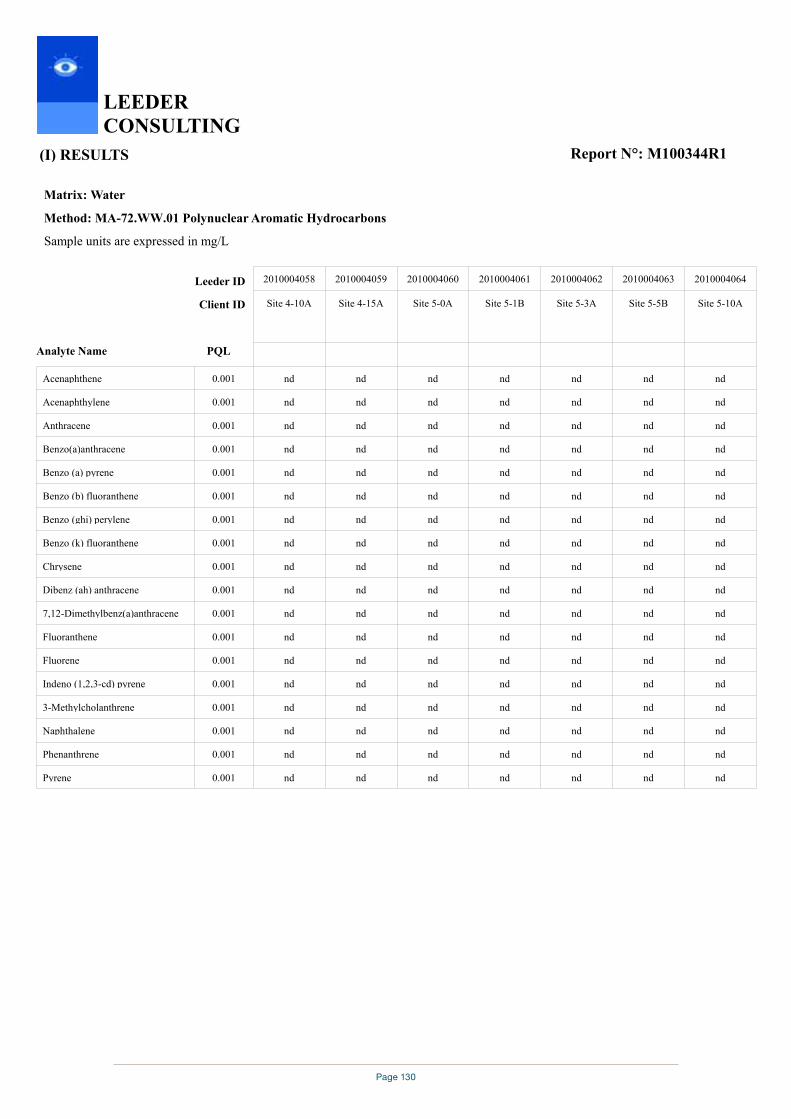
Page 130
(I) RESULTS
LEEDER CONSULTING
Report N°: M100344R1
Matrix: Water
Method: MA-72.WW.01 Polynuclear Aromatic Hydrocarbons
Sample units are expressed in mg/L
Analyte Name PQL
Client ID
Leeder ID
nd
nd
nd
nd
nd
nd
nd
nd
nd
nd
nd
nd
nd
nd
nd
nd
nd
nd
nd
nd
nd
nd
nd
nd
nd
nd
nd
nd
nd
nd
nd
nd
nd
nd
nd
nd
nd
nd
nd
nd
nd
nd
nd
nd
nd
nd
nd
nd
nd
nd
nd
nd
nd
nd
nd
nd
nd
nd
nd
nd
nd
nd
nd
nd
nd
nd
nd
nd
nd
nd
nd
nd
nd
nd
nd
nd
nd
nd
nd
nd
nd
nd
nd
nd
nd
nd
nd
nd
nd
nd
nd
nd
nd
nd
nd
nd
nd
nd
nd
nd
nd
nd
nd
nd
nd
nd
nd
nd
nd
nd
nd
nd
nd
nd
nd
nd
nd
nd
nd
nd
nd
nd
nd
nd
nd
nd0.001Pyrene
0.001Phenanthrene
0.001Naphthalene
0.0013-Methylcholanthrene
0.001Indeno (1,2,3-cd) pyrene
0.001Fluorene
0.001Fluoranthene
0.0017,12-Dimethylbenz(a)anthracene
0.001Dibenz (ah) anthracene
0.001Chrysene
0.001Benzo (k) fluoranthene
0.001Benzo (ghi) perylene
0.001Benzo (b) fluoranthene
0.001Benzo (a) pyrene
0.001Benzo(a)anthracene
0.001Anthracene
0.001Acenaphthylene
0.001Acenaphthene
Site 5-10A
2010004064
Site 5-5B
2010004063
Site 5-3A
2010004062
Site 5-1B
2010004061
Site 5-0A
2010004060
Site 4-15A
2010004059
Site 4-10A
2010004058
Page 10 of 23

Page 131
(I) RESULTS
LEEDER CONSULTING
Report N°: M100344R1
Matrix: Water
Method: MA-72.WW.01 Polynuclear Aromatic Hydrocarbons
Sample units are expressed in mg/L
Analyte Name PQL
Client ID
Leeder ID
nd
nd
nd
nd
nd
nd
nd
nd
nd
nd
nd
nd
nd
nd
nd
nd
nd
nd
nd
nd
nd
nd
nd
nd
nd
nd
nd
nd
nd
nd
nd
nd
nd
nd
nd
nd
nd
nd
nd
nd
nd
nd
nd
nd
nd
nd
nd
nd
nd
nd
nd
nd
nd
nd
nd
nd
nd
nd
nd
nd
nd
nd
nd
nd
nd
nd
nd
nd
nd
nd
nd
nd
nd
nd
nd
nd
nd
nd
nd
nd
nd
nd
nd
nd
nd
nd
nd
nd
nd
nd
nd
nd
nd
nd
nd
nd
nd
nd
nd
nd
nd
nd
nd
nd
nd
nd
nd
nd
nd
nd
nd
nd
nd
nd
nd
nd
nd
nd
nd
nd
nd
nd
nd
nd
nd
nd0.001Pyrene
0.001Phenanthrene
0.001Naphthalene
0.0013-Methylcholanthrene
0.001Indeno (1,2,3-cd) pyrene
0.001Fluorene
0.001Fluoranthene
0.0017,12-Dimethylbenz(a)anthracene
0.001Dibenz (ah) anthracene
0.001Chrysene
0.001Benzo (k) fluoranthene
0.001Benzo (ghi) perylene
0.001Benzo (b) fluoranthene
0.001Benzo (a) pyrene
0.001Benzo(a)anthracene
0.001Anthracene
0.001Acenaphthylene
0.001Acenaphthene
Site 6-15A
2010004071
Site 6-10A
2010004070
Site 6-5B
2010004069
Site 6-3A
2010004068
Site 6-1B
2010004067
Site 6-0B
2010004066
Site 5-15A
2010004065
Page 11 of 23

Page 132
(I) RESULTS
LEEDER CONSULTING
Report N°: M100344R1
Matrix: Water
Method: MA-72.WW.01 Polynuclear Aromatic Hydrocarbons
Sample units are expressed in mg/L
Analyte Name PQL
Client ID
Leeder ID
nd
nd
nd
nd
nd
nd
nd
nd
nd
nd
nd
nd
nd
nd
nd
nd
nd
nd
nd
nd
nd
nd
nd
nd
nd
nd
nd
nd
nd
nd
nd
nd
nd
nd
nd
nd
nd
nd
nd
nd
nd
nd
nd
nd
nd
nd
nd
nd
nd
nd
nd
nd
nd
nd
nd
nd
nd
nd
nd
nd
nd
nd
nd
nd
nd
nd
nd
nd
nd
nd
nd
nd
nd
nd
nd
nd
nd
nd
nd
nd
nd
nd
nd
nd
nd
nd
nd
nd
nd
nd
nd
nd
nd
nd
nd
nd
nd
nd
nd
nd
nd
nd
nd
nd
nd
nd
nd
nd0.001Pyrene
0.001Phenanthrene
0.001Naphthalene
0.0013-Methylcholanthrene
0.001Indeno (1,2,3-cd) pyrene
0.001Fluorene
0.001Fluoranthene
0.0017,12-Dimethylbenz(a)anthracene
0.001Dibenz (ah) anthracene
0.001Chrysene
0.001Benzo (k) fluoranthene
0.001Benzo (ghi) perylene
0.001Benzo (b) fluoranthene
0.001Benzo (a) pyrene
0.001Benzo(a)anthracene
0.001Anthracene
0.001Acenaphthylene
0.001Acenaphthene
Site 7-15A
2010004077
Site 7-10A
2010004076
Site 7-5A
2010004075
Site 7-3A
2010004074
Site 7-1A
2010004073
Site 7-0A
2010004072
Page 12 of 23
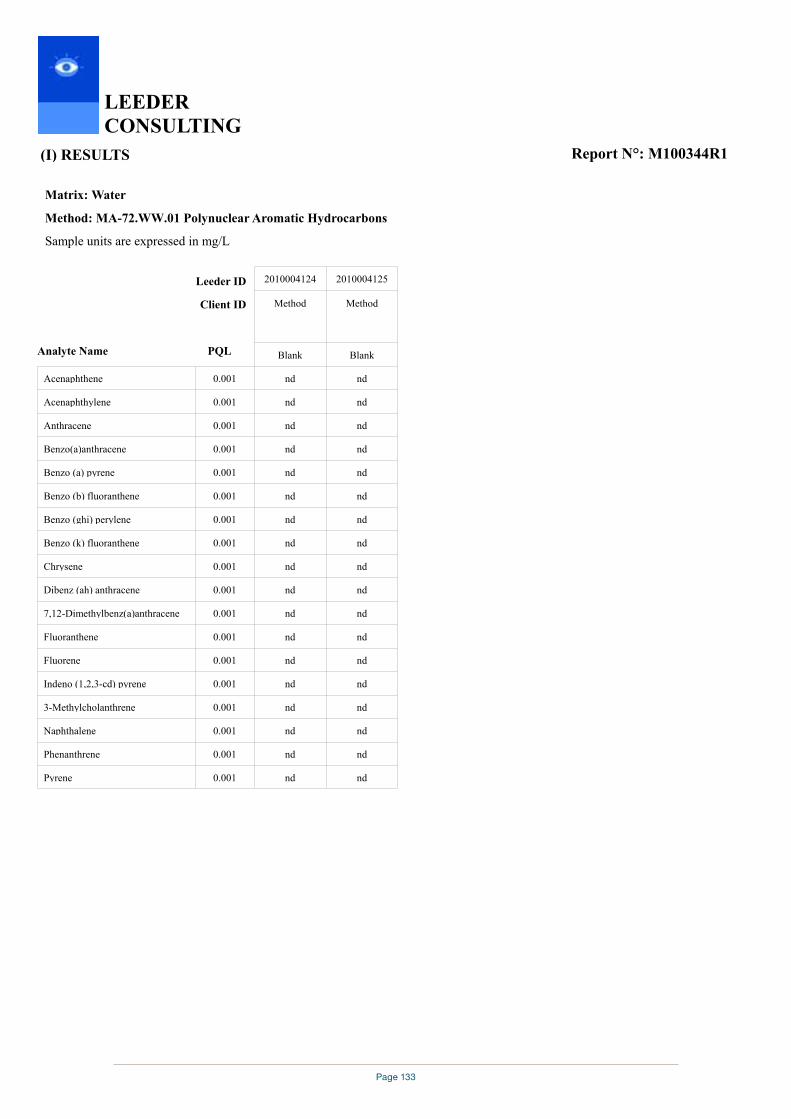
Page 133
(I) RESULTS
LEEDER CONSULTING
Report N°: M100344R1
Matrix: Water
Method: MA-72.WW.01 Polynuclear Aromatic Hydrocarbons
Sample units are expressed in mg/L
Analyte Name PQL
Client ID
Leeder ID
nd
nd
nd
nd
nd
nd
nd
nd
nd
nd
nd
nd
nd
nd
nd
nd
nd
nd
nd
nd
nd
nd
nd
nd
nd
nd
nd
nd
nd
nd
nd
nd
nd
nd
nd
nd0.001Pyrene
0.001Phenanthrene
0.001Naphthalene
0.0013-Methylcholanthrene
0.001Indeno (1,2,3-cd) pyrene
0.001Fluorene
0.001Fluoranthene
0.0017,12-Dimethylbenz(a)anthracene
0.001Dibenz (ah) anthracene
0.001Chrysene
0.001Benzo (k) fluoranthene
0.001Benzo (ghi) perylene
0.001Benzo (b) fluoranthene
0.001Benzo (a) pyrene
0.001Benzo(a)anthracene
0.001Anthracene
0.001Acenaphthylene
0.001Acenaphthene
Blank
Method
2010004125
Blank
Method
2010004124
Page 13 of 23
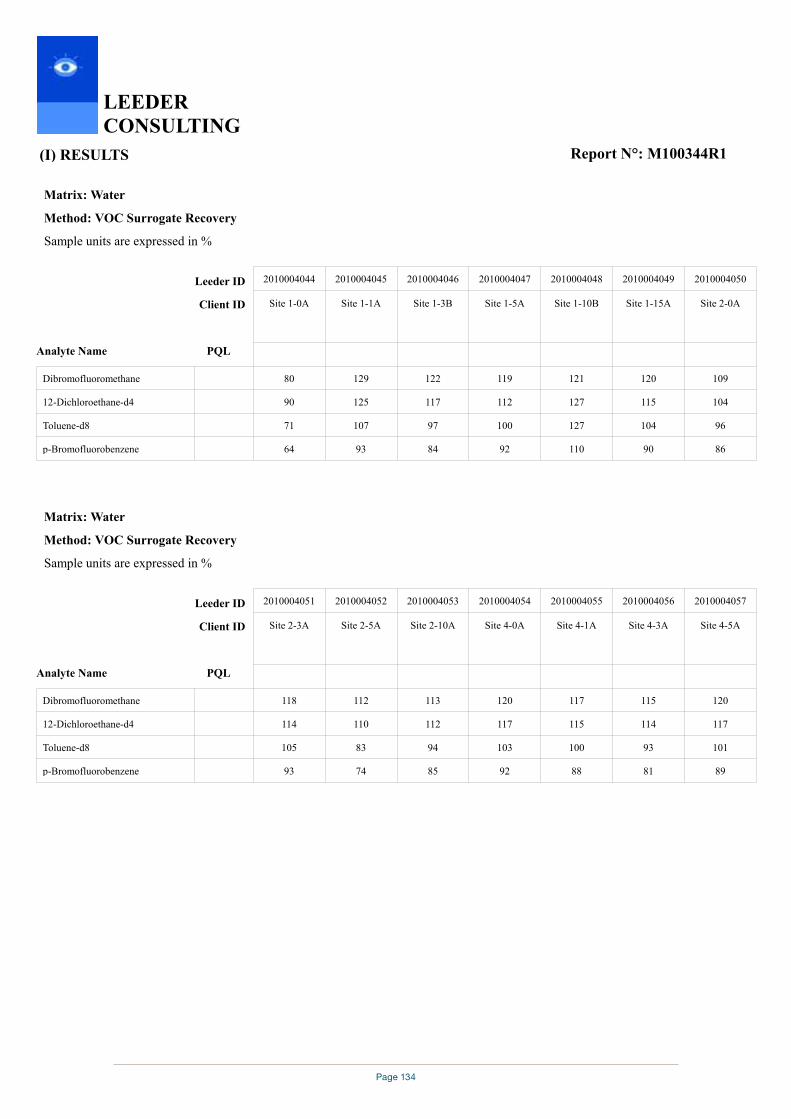
Page 134
(I) RESULTS
LEEDER CONSULTING
Report N°: M100344R1
Matrix: Water
Method: VOC Surrogate Recovery
Sample units are expressed in %
Analyte Name PQL
Client ID
Leeder ID
80
90
71
64
129
125
107
93
122
117
97
84
119
112
100
92
121
127
127
110
120
115
104
90
109
104
96
86p-Bromofluorobenzene
Toluene-d8
12-Dichloroethane-d4
Dibromofluoromethane
Site 2-0A
2010004050
Site 1-15A
2010004049
Site 1-10B
2010004048
Site 1-5A
2010004047
Site 1-3B
2010004046
Site 1-1A
2010004045
Site 1-0A
2010004044
Matrix: Water
Method: VOC Surrogate Recovery
Sample units are expressed in %
Analyte Name PQL
Client ID
Leeder ID
118
114
105
93
112
110
83
74
113
112
94
85
120
117
103
92
117
115
100
88
115
114
93
81
120
117
101
89p-Bromofluorobenzene
Toluene-d8
12-Dichloroethane-d4
Dibromofluoromethane
Site 4-5A
2010004057
Site 4-3A
2010004056
Site 4-1A
2010004055
Site 4-0A
2010004054
Site 2-10A
2010004053
Site 2-5A
2010004052
Site 2-3A
2010004051
Page 14 of 23

Page 135
(I) RESULTS
LEEDER CONSULTING
Report N°: M100344R1
Matrix: Water
Method: VOC Surrogate Recovery
Sample units are expressed in %
Analyte Name PQL
Client ID
Leeder ID
120
116
103
91
120
117
100
85
117
115
98
85
119
118
99
86
109
109
95
86
118
118
97
87
114
114
92
83p-Bromofluorobenzene
Toluene-d8
12-Dichloroethane-d4
Dibromofluoromethane
Site 5-10A
2010004064
Site 5-5B
2010004063
Site 5-3A
2010004062
Site 5-1B
2010004061
Site 5-0A
2010004060
Site 4-15A
2010004059
Site 4-10A
2010004058
Matrix: Water
Method: VOC Surrogate Recovery
Sample units are expressed in %
Analyte Name PQL
Client ID
Leeder ID
108
107
95
80
117
119
89
79
117
117
103
93
116
119
92
84
108
113
86
77
103
111
72
62
112
119
84
72p-Bromofluorobenzene
Toluene-d8
12-Dichloroethane-d4
Dibromofluoromethane
Site 6-15A
2010004071
Site 6-10A
2010004070
Site 6-5B
2010004069
Site 6-3A
2010004068
Site 6-1B
2010004067
Site 6-0B
2010004066
Site 5-15A
2010004065
Page 15 of 23
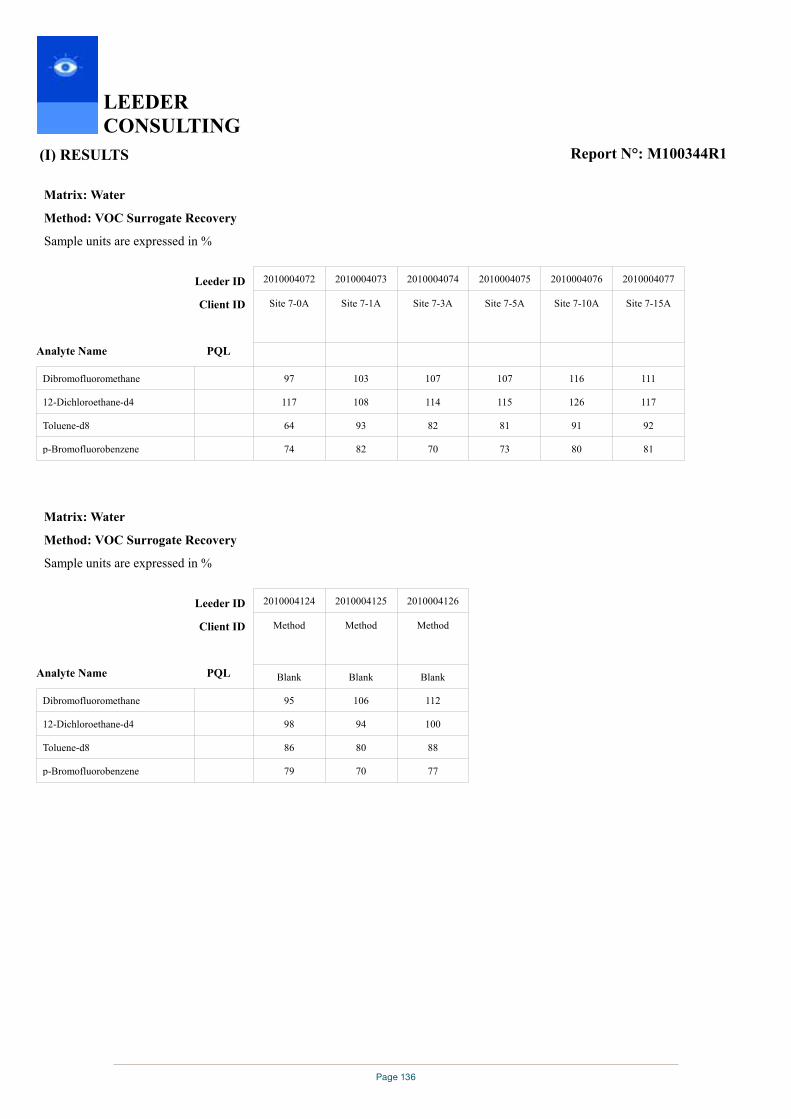
Page 136
(I) RESULTS
LEEDER CONSULTING
Report N°: M100344R1
Matrix: Water
Method: VOC Surrogate Recovery
Sample units are expressed in %
Analyte Name PQL
Client ID
Leeder ID
97
117
64
74
103
108
93
82
107
114
82
70
107
115
81
73
116
126
91
80
111
117
92
81p-Bromofluorobenzene
Toluene-d8
12-Dichloroethane-d4
Dibromofluoromethane
Site 7-15A
2010004077
Site 7-10A
2010004076
Site 7-5A
2010004075
Site 7-3A
2010004074
Site 7-1A
2010004073
Site 7-0A
2010004072
Matrix: Water
Method: VOC Surrogate Recovery
Sample units are expressed in %
Analyte Name PQL
Client ID
Leeder ID
95
98
86
79
106
94
80
70
112
100
88
77p-Bromofluorobenzene
Toluene-d8
12-Dichloroethane-d4
Dibromofluoromethane
Blank
Method
2010004126
Blank
Method
2010004125
Blank
Method
2010004124
Page 16 of 23
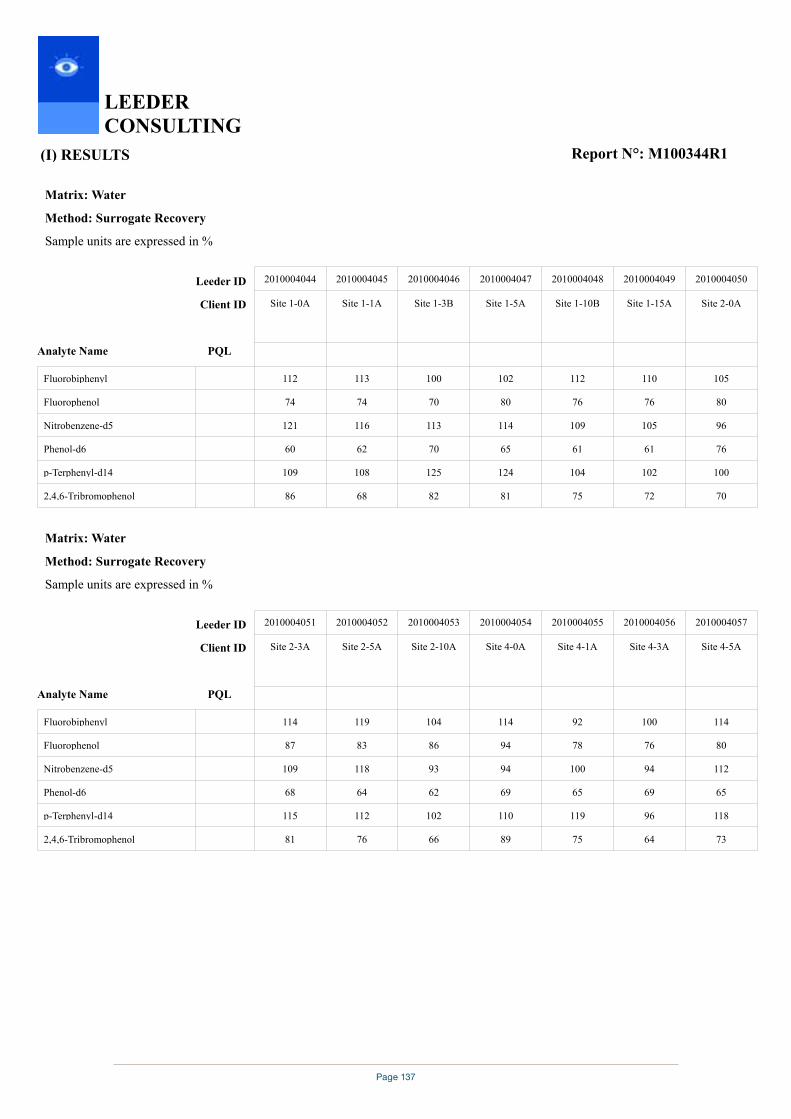
Page 137
(I) RESULTS
LEEDER CONSULTING
Report N°: M100344R1
Matrix: Water
Method: Surrogate Recovery
Sample units are expressed in %
Analyte Name PQL
Client ID
Leeder ID
112
74
121
60
109
86
113
74
116
62
108
68
100
70
113
70
125
82
102
80
114
65
124
81
112
76
109
61
104
75
110
76
105
61
102
72
105
80
96
76
100
702,4,6-Tribromophenol
p-Terphenyl-d14
Phenol-d6
Nitrobenzene-d5
Fluorophenol
Fluorobiphenyl
Site 2-0A
2010004050
Site 1-15A
2010004049
Site 1-10B
2010004048
Site 1-5A
2010004047
Site 1-3B
2010004046
Site 1-1A
2010004045
Site 1-0A
2010004044
Matrix: Water
Method: Surrogate Recovery
Sample units are expressed in %
Analyte Name PQL
Client ID
Leeder ID
114
87
109
68
115
81
119
83
118
64
112
76
104
86
93
62
102
66
114
94
94
69
110
89
92
78
100
65
119
75
100
76
94
69
96
64
114
80
112
65
118
732,4,6-Tribromophenol
p-Terphenyl-d14
Phenol-d6
Nitrobenzene-d5
Fluorophenol
Fluorobiphenyl
Site 4-5A
2010004057
Site 4-3A
2010004056
Site 4-1A
2010004055
Site 4-0A
2010004054
Site 2-10A
2010004053
Site 2-5A
2010004052
Site 2-3A
2010004051
Page 17 of 23

Page 138
(I) RESULTS
LEEDER CONSULTING
Report N°: M100344R1
Matrix: Water
Method: Surrogate Recovery
Sample units are expressed in %
Analyte Name PQL
Client ID
Leeder ID
121
78
116
60
107
80
111
70
95
62
120
69
114
78
120
60
116
84
108
77
113
61
105
86
114
83
118
63
122
76
106
76
87
61
113
68
112
69
101
60
108
702,4,6-Tribromophenol
p-Terphenyl-d14
Phenol-d6
Nitrobenzene-d5
Fluorophenol
Fluorobiphenyl
Site 5-10A
2010004064
Site 5-5B
2010004063
Site 5-3A
2010004062
Site 5-1B
2010004061
Site 5-0A
2010004060
Site 4-15A
2010004059
Site 4-10A
2010004058
Matrix: Water
Method: Surrogate Recovery
Sample units are expressed in %
Analyte Name PQL
Client ID
Leeder ID
114
72
102
72
114
77
99
69
103
61
101
71
106
68
96
60
113
70
111
74
104
62
117
76
120
71
111
63
108
80
112
78
100
62
126
81
123
74
107
61
123
912,4,6-Tribromophenol
p-Terphenyl-d14
Phenol-d6
Nitrobenzene-d5
Fluorophenol
Fluorobiphenyl
Site 6-15A
2010004071
Site 6-10A
2010004070
Site 6-5B
2010004069
Site 6-3A
2010004068
Site 6-1B
2010004067
Site 6-0B
2010004066
Site 5-15A
2010004065
Page 18 of 23
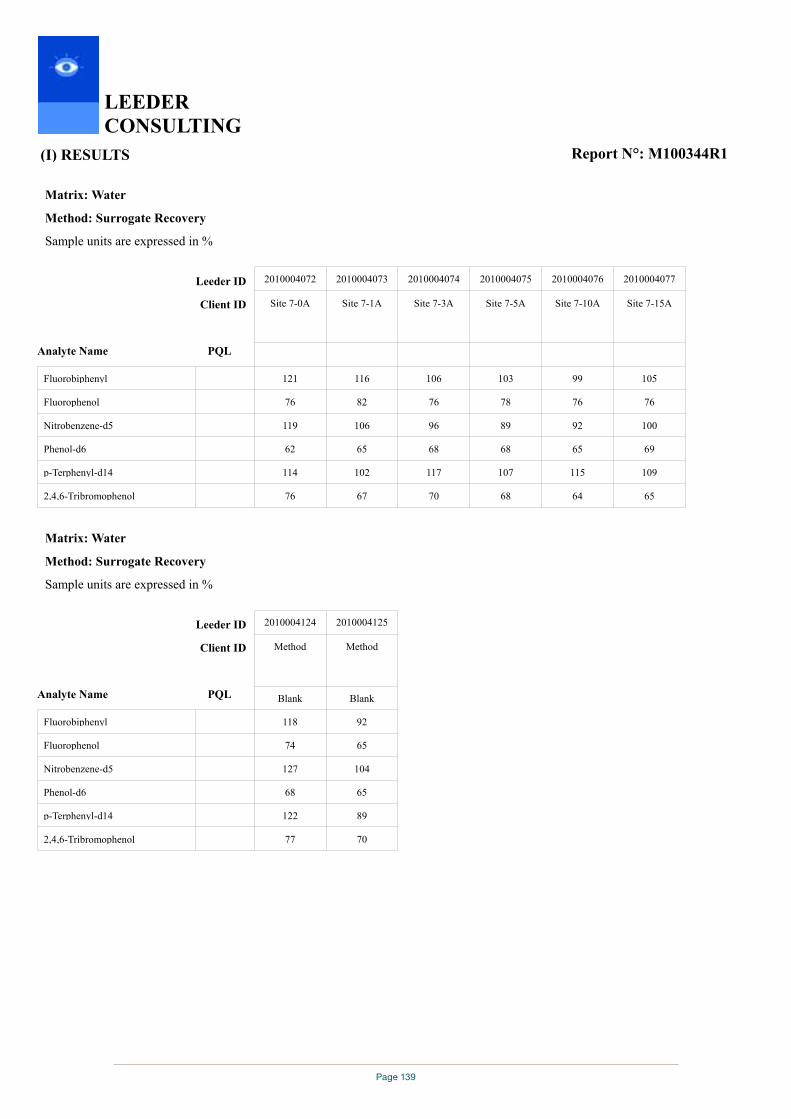
Page 139
(I) RESULTS
LEEDER CONSULTING
Report N°: M100344R1
Matrix: Water
Method: Surrogate Recovery
Sample units are expressed in %
Analyte Name PQL
Client ID
Leeder ID
121
76
119
62
114
76
116
82
106
65
102
67
106
76
96
68
117
70
103
78
89
68
107
68
99
76
92
65
115
64
105
76
100
69
109
652,4,6-Tribromophenol
p-Terphenyl-d14
Phenol-d6
Nitrobenzene-d5
Fluorophenol
Fluorobiphenyl
Site 7-15A
2010004077
Site 7-10A
2010004076
Site 7-5A
2010004075
Site 7-3A
2010004074
Site 7-1A
2010004073
Site 7-0A
2010004072
Matrix: Water
Method: Surrogate Recovery
Sample units are expressed in %
Analyte Name PQL
Client ID
Leeder ID
118
74
127
68
122
77
92
65
104
65
89
702,4,6-Tribromophenol
p-Terphenyl-d14
Phenol-d6
Nitrobenzene-d5
Fluorophenol
Fluorobiphenyl
Blank
Method
2010004125
Blank
Method
2010004124
Page 19 of 23
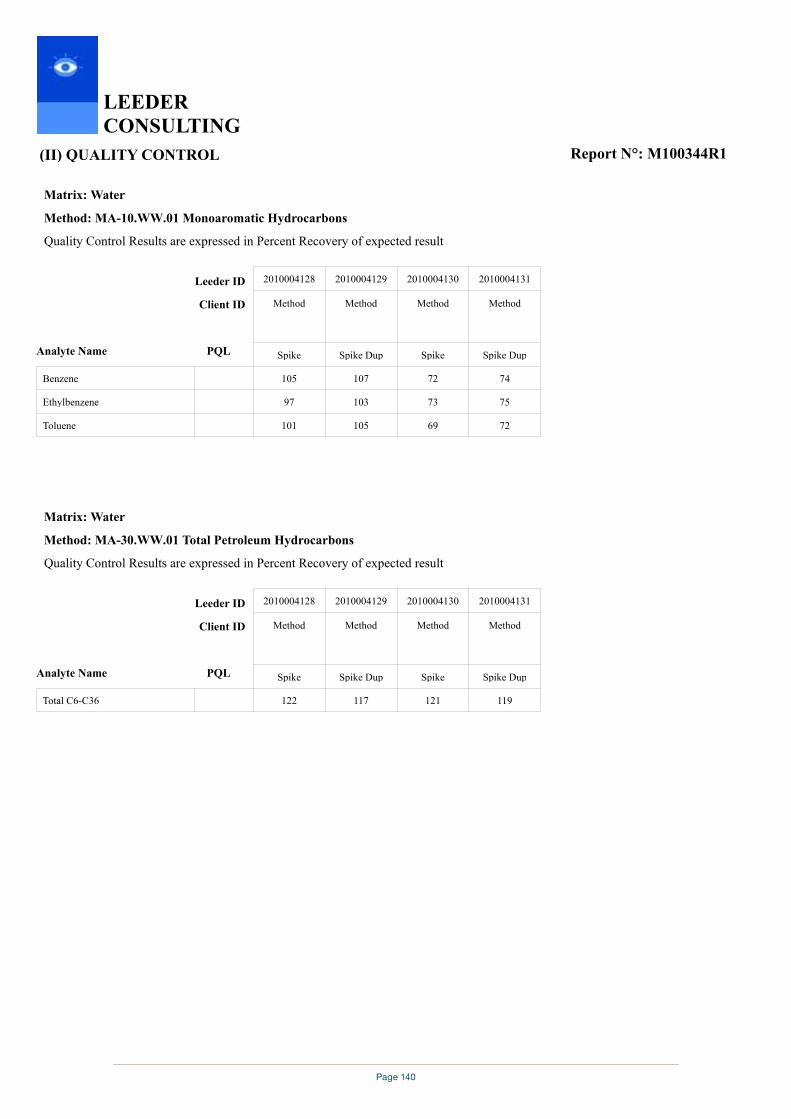
Page 140
(II) QUALITY CONTROL
LEEDER CONSULTING
Report N°: M100344R1
Matrix: Water
Method: MA-10.WW.01 Monoaromatic Hydrocarbons
Quality Control Results are expressed in Percent Recovery of expected result
Analyte Name PQL
Client ID
Leeder ID
105
97
101
107
103
105
72
73
69
74
75
72Toluene
Ethylbenzene
Benzene
Spike Dup
Method
2010004131
Spike
Method
2010004130
Spike Dup
Method
2010004129
Spike
Method
2010004128
Matrix: Water
Method: MA-30.WW.01 Total Petroleum Hydrocarbons
Quality Control Results are expressed in Percent Recovery of expected result
Analyte Name PQL
Client ID
Leeder ID
122 117 121 119Total C6-C36
Spike Dup
Method
2010004131
Spike
Method
2010004130
Spike Dup
Method
2010004129
Spike
Method
2010004128
Page 20 of 23
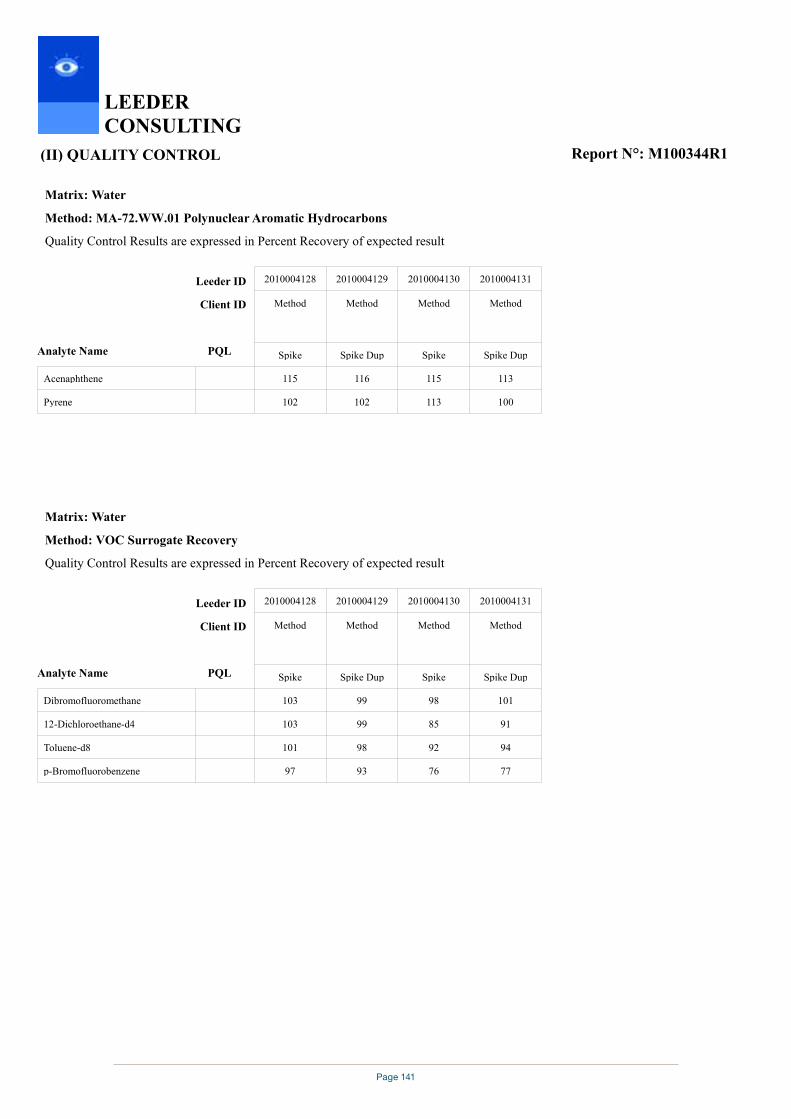
Page 141
(II) QUALITY CONTROL
LEEDER CONSULTING
Report N°: M100344R1
Matrix: Water
Method: MA-72.WW.01 Polynuclear Aromatic Hydrocarbons
Quality Control Results are expressed in Percent Recovery of expected result
Analyte Name PQL
Client ID
Leeder ID
115
102
116
102
115
113
113
100Pyrene
Acenaphthene
Spike Dup
Method
2010004131
Spike
Method
2010004130
Spike Dup
Method
2010004129
Spike
Method
2010004128
Matrix: Water
Method: VOC Surrogate Recovery
Quality Control Results are expressed in Percent Recovery of expected result
Analyte Name PQL
Client ID
Leeder ID
103
103
101
97
99
99
98
93
98
85
92
76
101
91
94
77p-Bromofluorobenzene
Toluene-d8
12-Dichloroethane-d4
Dibromofluoromethane
Spike Dup
Method
2010004131
Spike
Method
2010004130
Spike Dup
Method
2010004129
Spike
Method
2010004128
Page 21 of 23
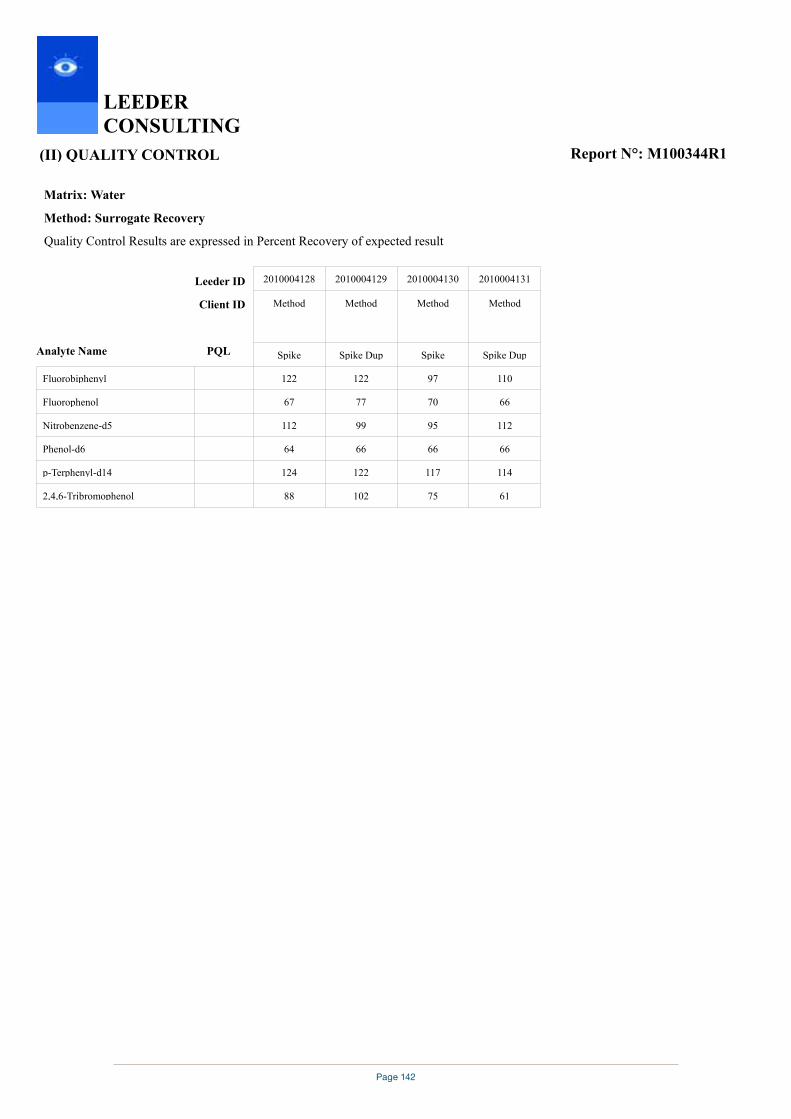
Page 142
(II) QUALITY CONTROL
LEEDER CONSULTING
Report N°: M100344R1
Matrix: Water
Method: Surrogate Recovery
Quality Control Results are expressed in Percent Recovery of expected result
Analyte Name PQL
Client ID
Leeder ID
122
67
112
64
124
88
122
77
99
66
122
102
97
70
95
66
117
75
110
66
112
66
114
612,4,6-Tribromophenol
p-Terphenyl-d14
Phenol-d6
Nitrobenzene-d5
Fluorophenol
Fluorobiphenyl
Spike Dup
Method
2010004131
Spike
Method
2010004130
Spike Dup
Method
2010004129
Spike
Method
2010004128
Page 22 of 23
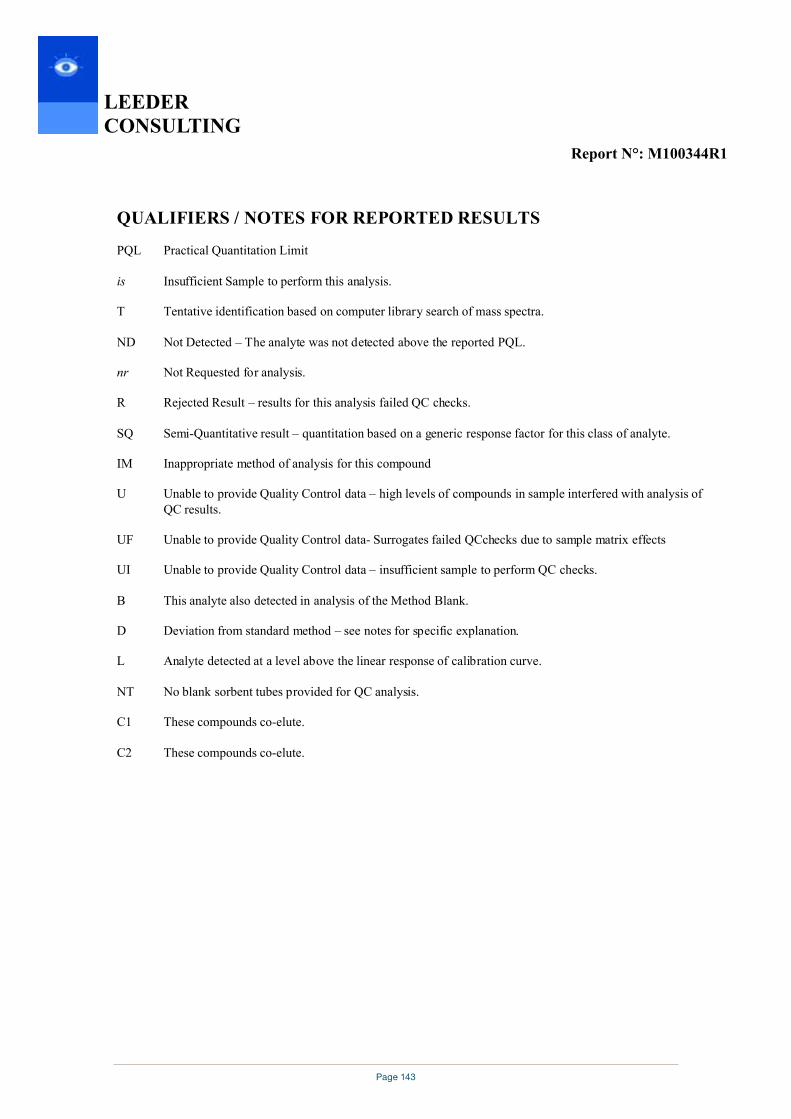
Page 143
LEEDER CONSULTING
Report N°: M100344R1
QUALIFIERS / NOTES FOR REPORTED RESULTS
PQL Practical Quantitation Limit
is Insufficient Sample to perform this analysis.
T Tentative identification based on computer library search of mass spectra.
ND Not Detected – The analyte was not detected above the reported PQL.
nr Not Requested for analysis.
R Rejected Result – results for this analysis failed QC checks.
SQ Semi-Quantitative result – quantitation based on a generic response factor for this class of analyte.
IM Inappropriate method of analysis for this compound
U Unable to provide Quality Control data – high levels of compounds in sample interfered with analysis of QC results.
UF Unable to provide Quality Control data- Surrogates failed QCchecks due to sample matrix effects
UI Unable to provide Quality Control data – insufficient sample to perform QC checks.
B This analyte also detected in analysis of the Method Blank.
D Deviation from standard method – see notes for specific explanation.
L Analyte detected at a level above the linear response of calibration curve.
NT No blank sorbent tubes provided for QC analysis.
C1 These compounds co-elute.
C2 These compounds co-elute.
Page 23 of 23

Page 144
LEEDER CONSULTING
APPENDIX ONE.
CHAIN OF CUSTODY DOCUMENT

Page 145
Montara Well Release Monitoring Study S4A // Assessment of Effects on Timor Sea Fish
Appendix F – Results of Sediment Analysis(Phase III)
Page 146
LEEDER CONSULTING
Chartered Chemists
A.B.N. 540 864 910 094 - 5, 18 Redland DriveMitcham, Vic, 3132Telephone: (03) 9874 1988Fax: (03) 9874 1933
162 Colins StreetWest PerthWestern Australia 6005Attention: Eleanor Stoney
SAMPLES:
DATE RECEIVED:
DATE COMMENCED:
METHODS:
RESULTS: Please refer to attached pages for results.
REPORTED BY:
Level 1
24-Nov-2010
Fifty-seven samples were received for analysis
7-Dec-2010
CERTIFICATE OF ANALYSIS
Adam Atkinson
See Attached Results
Laboratory Manager
Note: Results are based on samples as received at Leeder Consulting's laboratories
PTTEP Australasia
15-Dec-2010REPORT NUMBER:
Site/Client Ref: M101702West Atlas
NATA Accredited Laboratory Number: 14429
This Document is issued in accordance withNATA's accreditation requirements
Accredited for compliance with ISO/IEC 17025.
Page 1 of 41
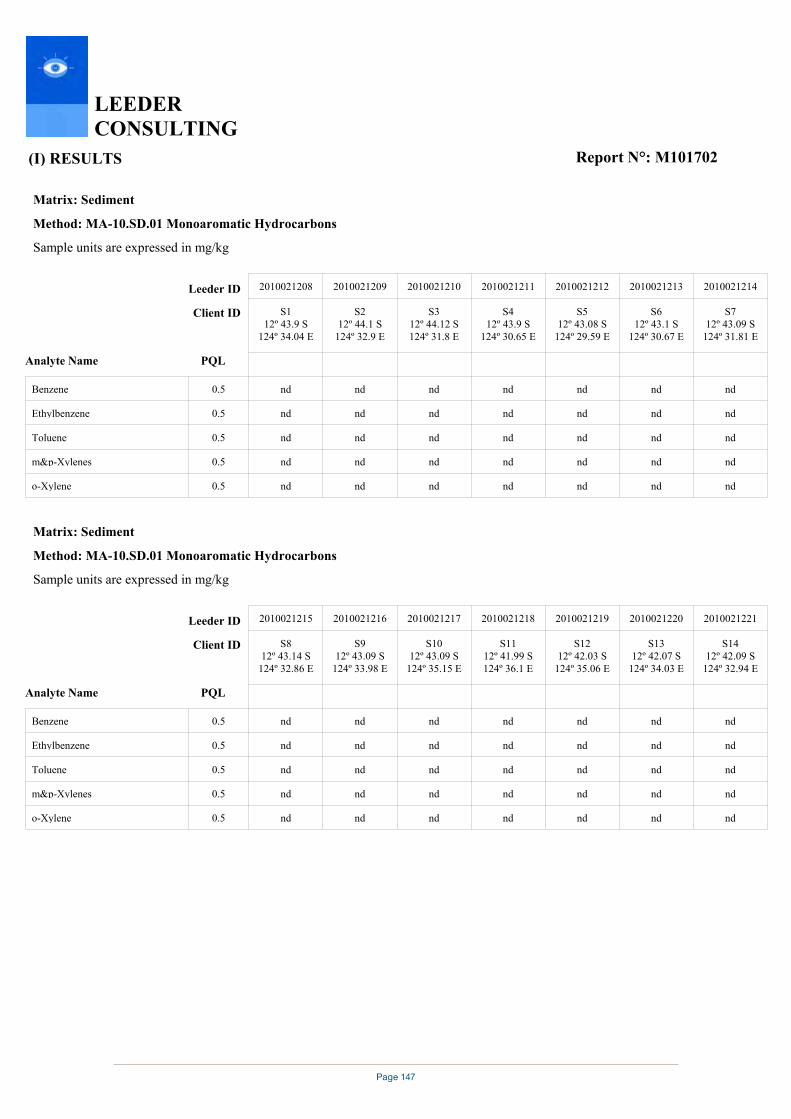
Page 147
(I) RESULTS
LEEDER CONSULTING
Report N°: M101702
Matrix: Sediment
Method: MA-10.SD.01 Monoaromatic Hydrocarbons
Sample units are expressed in mg/kg
Analyte Name PQL
Client ID
Leeder ID
nd
nd
nd
nd
nd
nd
nd
nd
nd
nd
nd
nd
nd
nd
nd
nd
nd
nd
nd
nd
nd
nd
nd
nd
nd
nd
nd
nd
nd
nd
nd
nd
nd
nd
nd0.5o-Xylene
0.5m&p-Xylenes
0.5Toluene
0.5Ethylbenzene
0.5Benzene
S712º 43.09 S
124º 31.81 E
2010021214
S612º 43.1 S
124º 30.67 E
2010021213
S512º 43.08 S
124º 29.59 E
2010021212
S412º 43.9 S
124º 30.65 E
2010021211
S312º 44.12 S124º 31.8 E
2010021210
S212º 44.1 S
124º 32.9 E
2010021209
S112º 43.9 S
124º 34.04 E
2010021208
Matrix: Sediment
Method: MA-10.SD.01 Monoaromatic Hydrocarbons
Sample units are expressed in mg/kg
Analyte Name PQL
Client ID
Leeder ID
nd
nd
nd
nd
nd
nd
nd
nd
nd
nd
nd
nd
nd
nd
nd
nd
nd
nd
nd
nd
nd
nd
nd
nd
nd
nd
nd
nd
nd
nd
nd
nd
nd
nd
nd0.5o-Xylene
0.5m&p-Xylenes
0.5Toluene
0.5Ethylbenzene
0.5Benzene
S1412º 42.09 S
124º 32.94 E
2010021221
S1312º 42.07 S
124º 34.03 E
2010021220
S1212º 42.03 S
124º 35.06 E
2010021219
S1112º 41.99 S124º 36.1 E
2010021218
S1012º 43.09 S
124º 35.15 E
2010021217
S912º 43.09 S
124º 33.98 E
2010021216
S812º 43.14 S
124º 32.86 E
2010021215
Page 2 of 41
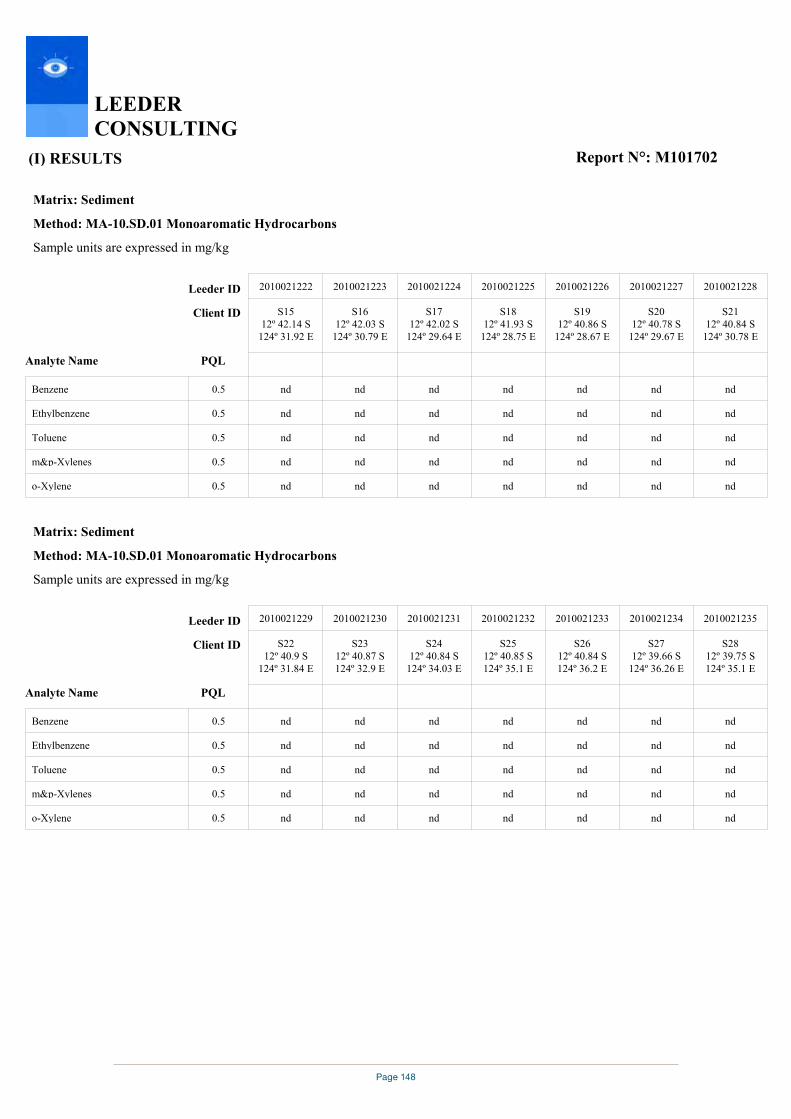
Page 148
(I) RESULTS
LEEDER CONSULTING
Report N°: M101702
Matrix: Sediment
Method: MA-10.SD.01 Monoaromatic Hydrocarbons
Sample units are expressed in mg/kg
Analyte Name PQL
Client ID
Leeder ID
nd
nd
nd
nd
nd
nd
nd
nd
nd
nd
nd
nd
nd
nd
nd
nd
nd
nd
nd
nd
nd
nd
nd
nd
nd
nd
nd
nd
nd
nd
nd
nd
nd
nd
nd0.5o-Xylene
0.5m&p-Xylenes
0.5Toluene
0.5Ethylbenzene
0.5Benzene
S2112º 40.84 S
124º 30.78 E
2010021228
S2012º 40.78 S
124º 29.67 E
2010021227
S1912º 40.86 S
124º 28.67 E
2010021226
S1812º 41.93 S
124º 28.75 E
2010021225
S1712º 42.02 S
124º 29.64 E
2010021224
S1612º 42.03 S
124º 30.79 E
2010021223
S1512º 42.14 S
124º 31.92 E
2010021222
Matrix: Sediment
Method: MA-10.SD.01 Monoaromatic Hydrocarbons
Sample units are expressed in mg/kg
Analyte Name PQL
Client ID
Leeder ID
nd
nd
nd
nd
nd
nd
nd
nd
nd
nd
nd
nd
nd
nd
nd
nd
nd
nd
nd
nd
nd
nd
nd
nd
nd
nd
nd
nd
nd
nd
nd
nd
nd
nd
nd0.5o-Xylene
0.5m&p-Xylenes
0.5Toluene
0.5Ethylbenzene
0.5Benzene
S2812º 39.75 S124º 35.1 E
2010021235
S2712º 39.66 S
124º 36.26 E
2010021234
S2612º 40.84 S124º 36.2 E
2010021233
S2512º 40.85 S124º 35.1 E
2010021232
S2412º 40.84 S
124º 34.03 E
2010021231
S2312º 40.87 S124º 32.9 E
2010021230
S2212º 40.9 S
124º 31.84 E
2010021229
Page 3 of 41

Page 149
(I) RESULTS
LEEDER CONSULTING
Report N°: M101702
Matrix: Sediment
Method: MA-10.SD.01 Monoaromatic Hydrocarbons
Sample units are expressed in mg/kg
Analyte Name PQL
Client ID
Leeder ID
nd
nd
nd
nd
nd
nd
nd
nd
nd
nd
nd
nd
nd
nd
nd
nd
nd
nd
nd
nd
nd
nd
nd
nd
nd
nd
nd
nd
nd
nd
nd
nd
nd
nd
nd0.5o-Xylene
0.5m&p-Xylenes
0.5Toluene
0.5Ethylbenzene
0.5Benzene
S3512º 38.71 S
124º 28.66 E
2010021242
S3412º 39.83 S
124º 28.54 E
2010021241
S3312º 39.82 S
124º 29.61 E
2010021240
S3212º 39.91 S
124º 30.73 E
2010021239
S3112º 39.88 S
124º 31.78 E
2010021238
S3012º 39.81 S
124º 32.87 E
2010021237
S2912º 39.74 S
124º 33.97 E
2010021236
Matrix: Sediment
Method: MA-10.SD.01 Monoaromatic Hydrocarbons
Sample units are expressed in mg/kg
Analyte Name PQL
Client ID
Leeder ID
nd
nd
nd
nd
nd
nd
nd
nd
nd
nd
nd
nd
nd
nd
nd
nd
nd
nd
nd
nd
nd
nd
nd
nd
nd
nd
nd
nd
nd
nd
nd
nd
nd
nd
nd0.5o-Xylene
0.5m&p-Xylenes
0.5Toluene
0.5Ethylbenzene
0.5Benzene
S4212º 38.72 S
124º 36.14 E
2010021249
S4112º 38.75 S
124º 35.19 E
2010021248
S4012º 38.76 S
124º 34.01 E
2010021247
S3912º 38.78 S
124º 32.93 E
2010021246
S3812º 38.75 S124º 31.9 E
2010021245
S3712º 38.71 S
124º 30.76 E
2010021244
S3612º 38.68 S
124º 29.65 E
2010021243
Page 4 of 41
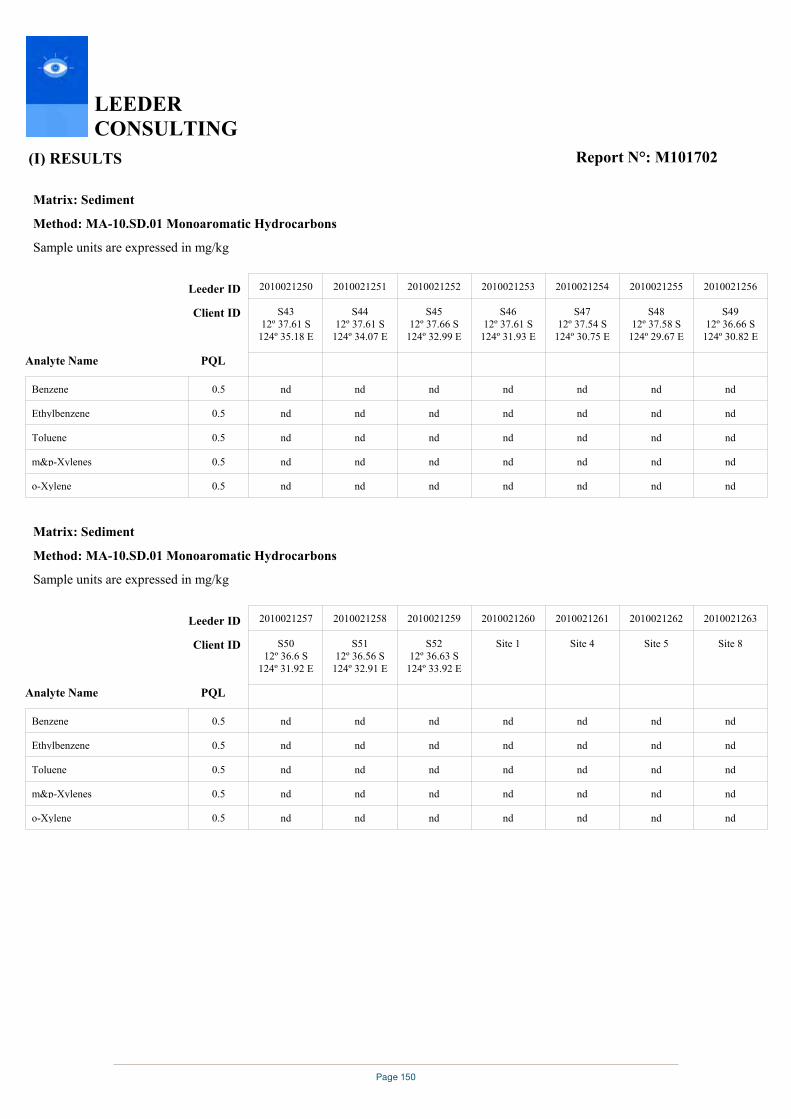
Page 150
(I) RESULTS
LEEDER CONSULTING
Report N°: M101702
Matrix: Sediment
Method: MA-10.SD.01 Monoaromatic Hydrocarbons
Sample units are expressed in mg/kg
Analyte Name PQL
Client ID
Leeder ID
nd
nd
nd
nd
nd
nd
nd
nd
nd
nd
nd
nd
nd
nd
nd
nd
nd
nd
nd
nd
nd
nd
nd
nd
nd
nd
nd
nd
nd
nd
nd
nd
nd
nd
nd0.5o-Xylene
0.5m&p-Xylenes
0.5Toluene
0.5Ethylbenzene
0.5Benzene
S4912º 36.66 S
124º 30.82 E
2010021256
S4812º 37.58 S
124º 29.67 E
2010021255
S4712º 37.54 S
124º 30.75 E
2010021254
S4612º 37.61 S
124º 31.93 E
2010021253
S4512º 37.66 S
124º 32.99 E
2010021252
S4412º 37.61 S
124º 34.07 E
2010021251
S4312º 37.61 S
124º 35.18 E
2010021250
Matrix: Sediment
Method: MA-10.SD.01 Monoaromatic Hydrocarbons
Sample units are expressed in mg/kg
Analyte Name PQL
Client ID
Leeder ID
nd
nd
nd
nd
nd
nd
nd
nd
nd
nd
nd
nd
nd
nd
nd
nd
nd
nd
nd
nd
nd
nd
nd
nd
nd
nd
nd
nd
nd
nd
nd
nd
nd
nd
nd0.5o-Xylene
0.5m&p-Xylenes
0.5Toluene
0.5Ethylbenzene
0.5Benzene
Site 8
2010021263
Site 5
2010021262
Site 4
2010021261
Site 1
2010021260
S5212º 36.63 S
124º 33.92 E
2010021259
S5112º 36.56 S
124º 32.91 E
2010021258
S5012º 36.6 S
124º 31.92 E
2010021257
Page 5 of 41
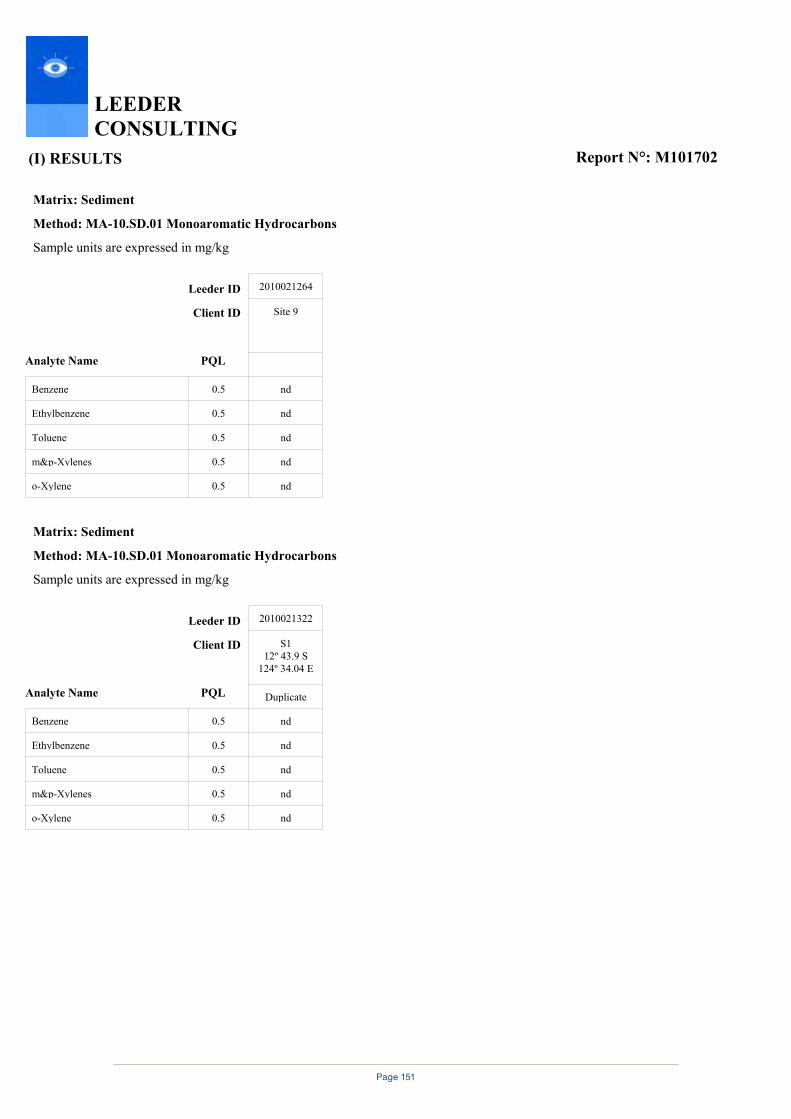
Page 151
(I) RESULTS
LEEDER CONSULTING
Report N°: M101702
Matrix: Sediment
Method: MA-10.SD.01 Monoaromatic Hydrocarbons
Sample units are expressed in mg/kg
Analyte Name PQL
Client ID
Leeder ID
nd
nd
nd
nd
nd0.5o-Xylene
0.5m&p-Xylenes
0.5Toluene
0.5Ethylbenzene
0.5Benzene
Site 9
2010021264
Matrix: Sediment
Method: MA-10.SD.01 Monoaromatic Hydrocarbons
Sample units are expressed in mg/kg
Analyte Name PQL
Client ID
Leeder ID
nd
nd
nd
nd
nd0.5o-Xylene
0.5m&p-Xylenes
0.5Toluene
0.5Ethylbenzene
0.5Benzene
Duplicate
S112º 43.9 S
124º 34.04 E
2010021322
Page 6 of 41

Page 152
(I) RESULTS
LEEDER CONSULTING
Report N°: M101702
Matrix: Sediment
Method: MA-10.SD.01 Monoaromatic Hydrocarbons
Sample units are expressed in mg/kg
Analyte Name PQL
Client ID
Leeder ID
nd
nd
nd
nd
nd
nd
nd
nd
nd
nd
nd
nd
nd
nd
nd
nd
nd
nd
nd
nd
nd
nd
nd
nd
nd
nd
nd
nd
nd
nd
nd
nd
nd
nd
nd0.5o-Xylene
0.5m&p-Xylenes
0.5Toluene
0.5Ethylbenzene
0.5Benzene
Blank
Method
2010021808
Blank
Method
2010021807
Duplicate
S5112º 36.56 S
124º 32.91 E
2010021806
Duplicate
S4112º 38.75 S
124º 35.19 E
2010021805
Duplicate
S3112º 39.88 S
124º 31.78 E
2010021325
Duplicate
S2112º 40.84 S
124º 30.78 E
2010021324
Duplicate
S1112º 41.99 S124º 36.1 E
2010021323
Matrix: Sediment
Method: MA-10.SD.01 Monoaromatic Hydrocarbons
Sample units are expressed in mg/kg
Analyte Name PQL
Client ID
Leeder ID
nd
nd
nd
nd
nd0.5o-Xylene
0.5m&p-Xylenes
0.5Toluene
0.5Ethylbenzene
0.5Benzene
Blank
Method
2010021809
Page 7 of 41
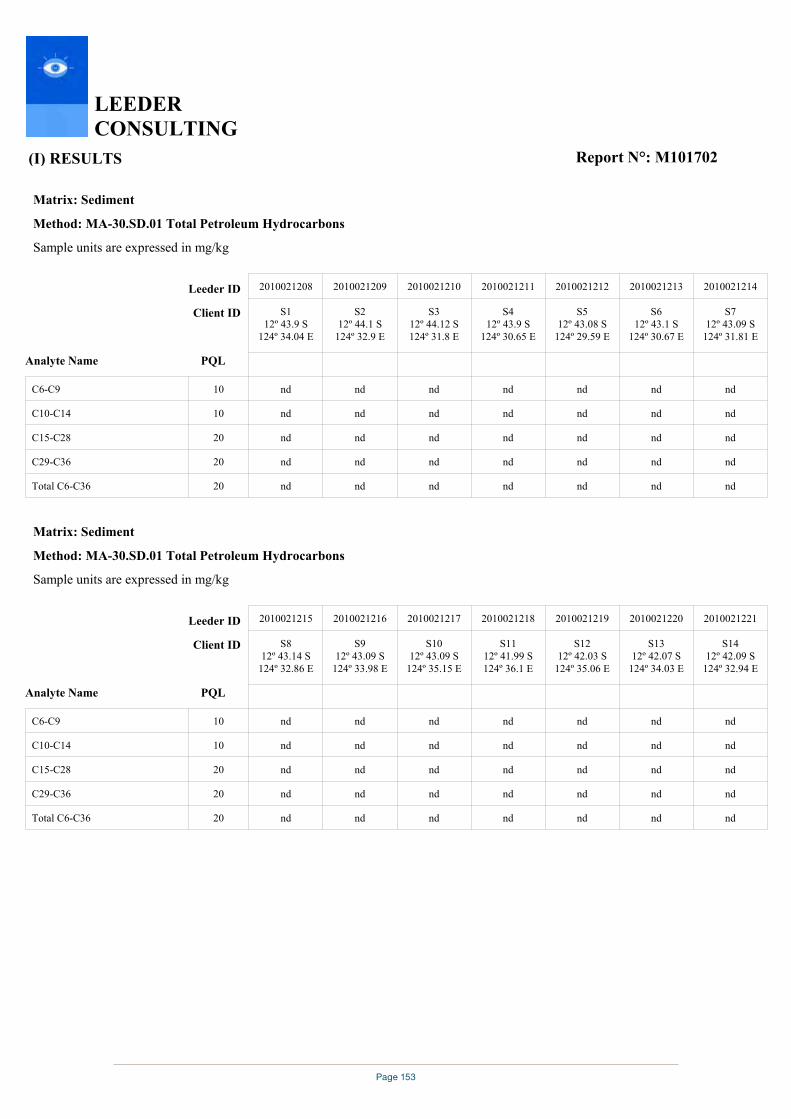
Page 153
(I) RESULTS
LEEDER CONSULTING
Report N°: M101702
Matrix: Sediment
Method: MA-30.SD.01 Total Petroleum Hydrocarbons
Sample units are expressed in mg/kg
Analyte Name PQL
Client ID
Leeder ID
nd
nd
nd
nd
nd
nd
nd
nd
nd
nd
nd
nd
nd
nd
nd
nd
nd
nd
nd
nd
nd
nd
nd
nd
nd
nd
nd
nd
nd
nd
nd
nd
nd
nd
nd20Total C6-C36
20C29-C36
20C15-C28
10C10-C14
10C6-C9
S712º 43.09 S
124º 31.81 E
2010021214
S612º 43.1 S
124º 30.67 E
2010021213
S512º 43.08 S
124º 29.59 E
2010021212
S412º 43.9 S
124º 30.65 E
2010021211
S312º 44.12 S124º 31.8 E
2010021210
S212º 44.1 S
124º 32.9 E
2010021209
S112º 43.9 S
124º 34.04 E
2010021208
Matrix: Sediment
Method: MA-30.SD.01 Total Petroleum Hydrocarbons
Sample units are expressed in mg/kg
Analyte Name PQL
Client ID
Leeder ID
nd
nd
nd
nd
nd
nd
nd
nd
nd
nd
nd
nd
nd
nd
nd
nd
nd
nd
nd
nd
nd
nd
nd
nd
nd
nd
nd
nd
nd
nd
nd
nd
nd
nd
nd20Total C6-C36
20C29-C36
20C15-C28
10C10-C14
10C6-C9
S1412º 42.09 S
124º 32.94 E
2010021221
S1312º 42.07 S
124º 34.03 E
2010021220
S1212º 42.03 S
124º 35.06 E
2010021219
S1112º 41.99 S124º 36.1 E
2010021218
S1012º 43.09 S
124º 35.15 E
2010021217
S912º 43.09 S
124º 33.98 E
2010021216
S812º 43.14 S
124º 32.86 E
2010021215
Page 8 of 41

Page 154
(I) RESULTS
LEEDER CONSULTING
Report N°: M101702
Matrix: Sediment
Method: MA-30.SD.01 Total Petroleum Hydrocarbons
Sample units are expressed in mg/kg
Analyte Name PQL
Client ID
Leeder ID
nd
nd
nd
nd
nd
nd
nd
nd
nd
nd
nd
nd
nd
nd
nd
nd
nd
nd
nd
nd
nd
nd
nd
nd
nd
nd
nd
nd
nd
nd
nd
nd
nd
nd
nd20Total C6-C36
20C29-C36
20C15-C28
10C10-C14
10C6-C9
S2112º 40.84 S
124º 30.78 E
2010021228
S2012º 40.78 S
124º 29.67 E
2010021227
S1912º 40.86 S
124º 28.67 E
2010021226
S1812º 41.93 S
124º 28.75 E
2010021225
S1712º 42.02 S
124º 29.64 E
2010021224
S1612º 42.03 S
124º 30.79 E
2010021223
S1512º 42.14 S
124º 31.92 E
2010021222
Matrix: Sediment
Method: MA-30.SD.01 Total Petroleum Hydrocarbons
Sample units are expressed in mg/kg
Analyte Name PQL
Client ID
Leeder ID
nd
nd
nd
nd
nd
nd
nd
nd
nd
nd
nd
nd
nd
nd
nd
nd
nd
nd
nd
nd
nd
nd
nd
nd
nd
nd
nd
nd
nd
nd
nd
nd
nd
nd
nd20Total C6-C36
20C29-C36
20C15-C28
10C10-C14
10C6-C9
S2812º 39.75 S124º 35.1 E
2010021235
S2712º 39.66 S
124º 36.26 E
2010021234
S2612º 40.84 S124º 36.2 E
2010021233
S2512º 40.85 S124º 35.1 E
2010021232
S2412º 40.84 S
124º 34.03 E
2010021231
S2312º 40.87 S124º 32.9 E
2010021230
S2212º 40.9 S
124º 31.84 E
2010021229
Page 9 of 41
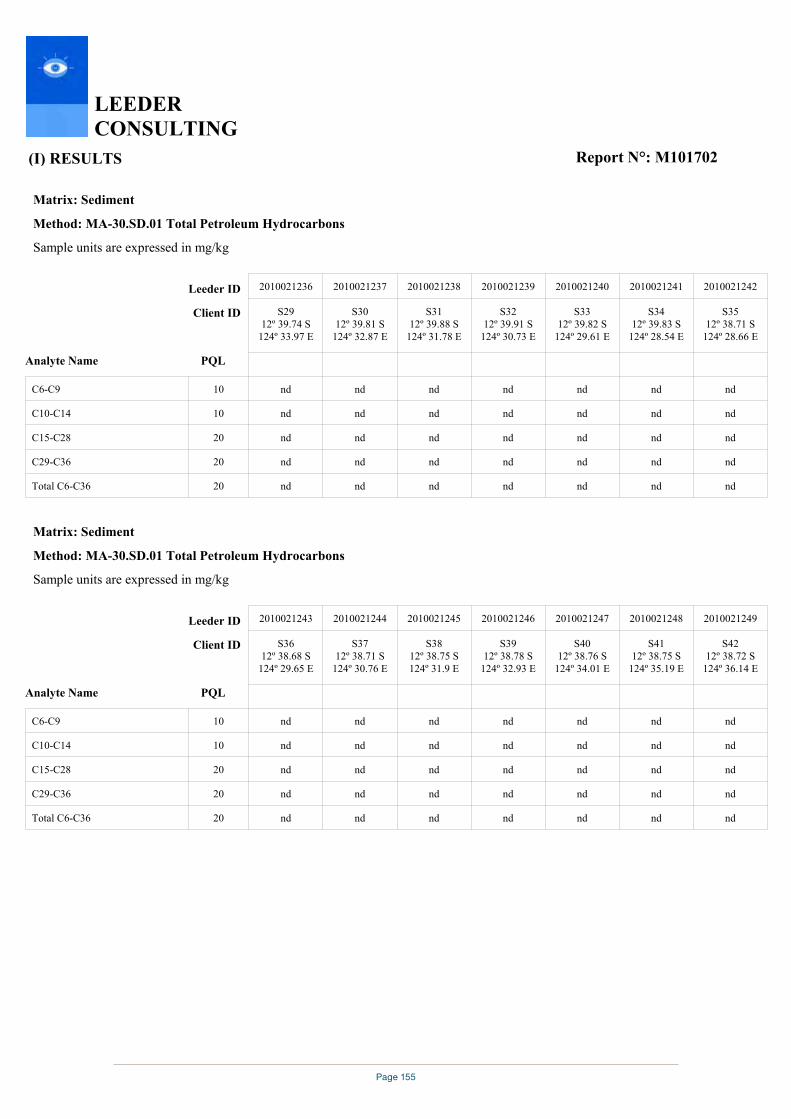
Page 155
(I) RESULTS
LEEDER CONSULTING
Report N°: M101702
Matrix: Sediment
Method: MA-30.SD.01 Total Petroleum Hydrocarbons
Sample units are expressed in mg/kg
Analyte Name PQL
Client ID
Leeder ID
nd
nd
nd
nd
nd
nd
nd
nd
nd
nd
nd
nd
nd
nd
nd
nd
nd
nd
nd
nd
nd
nd
nd
nd
nd
nd
nd
nd
nd
nd
nd
nd
nd
nd
nd20Total C6-C36
20C29-C36
20C15-C28
10C10-C14
10C6-C9
S3512º 38.71 S
124º 28.66 E
2010021242
S3412º 39.83 S
124º 28.54 E
2010021241
S3312º 39.82 S
124º 29.61 E
2010021240
S3212º 39.91 S
124º 30.73 E
2010021239
S3112º 39.88 S
124º 31.78 E
2010021238
S3012º 39.81 S
124º 32.87 E
2010021237
S2912º 39.74 S
124º 33.97 E
2010021236
Matrix: Sediment
Method: MA-30.SD.01 Total Petroleum Hydrocarbons
Sample units are expressed in mg/kg
Analyte Name PQL
Client ID
Leeder ID
nd
nd
nd
nd
nd
nd
nd
nd
nd
nd
nd
nd
nd
nd
nd
nd
nd
nd
nd
nd
nd
nd
nd
nd
nd
nd
nd
nd
nd
nd
nd
nd
nd
nd
nd20Total C6-C36
20C29-C36
20C15-C28
10C10-C14
10C6-C9
S4212º 38.72 S
124º 36.14 E
2010021249
S4112º 38.75 S
124º 35.19 E
2010021248
S4012º 38.76 S
124º 34.01 E
2010021247
S3912º 38.78 S
124º 32.93 E
2010021246
S3812º 38.75 S124º 31.9 E
2010021245
S3712º 38.71 S
124º 30.76 E
2010021244
S3612º 38.68 S
124º 29.65 E
2010021243
Page 10 of 41

Page 156
(I) RESULTS
LEEDER CONSULTING
Report N°: M101702
Matrix: Sediment
Method: MA-30.SD.01 Total Petroleum Hydrocarbons
Sample units are expressed in mg/kg
Analyte Name PQL
Client ID
Leeder ID
nd
nd
nd
nd
nd
nd
nd
nd
nd
nd
nd
nd
nd
nd
nd
nd
nd
nd
nd
nd
nd
nd
nd
nd
nd
nd
nd
nd
nd
nd
nd
nd
nd
nd
nd20Total C6-C36
20C29-C36
20C15-C28
10C10-C14
10C6-C9
S4912º 36.66 S
124º 30.82 E
2010021256
S4812º 37.58 S
124º 29.67 E
2010021255
S4712º 37.54 S
124º 30.75 E
2010021254
S4612º 37.61 S
124º 31.93 E
2010021253
S4512º 37.66 S
124º 32.99 E
2010021252
S4412º 37.61 S
124º 34.07 E
2010021251
S4312º 37.61 S
124º 35.18 E
2010021250
Matrix: Sediment
Method: MA-30.SD.01 Total Petroleum Hydrocarbons
Sample units are expressed in mg/kg
Analyte Name PQL
Client ID
Leeder ID
nd
nd
nd
nd
nd
nd
nd
nd
nd
nd
nd
nd
nd
nd
nd
nd
nd
nd
nd
nd
nd
nd
nd
nd
nd
nd
nd
nd
nd
nd
nd
nd
nd
nd
nd20Total C6-C36
20C29-C36
20C15-C28
10C10-C14
10C6-C9
Site 8
2010021263
Site 5
2010021262
Site 4
2010021261
Site 1
2010021260
S5212º 36.63 S
124º 33.92 E
2010021259
S5112º 36.56 S
124º 32.91 E
2010021258
S5012º 36.6 S
124º 31.92 E
2010021257
Page 11 of 41

Page 157
(I) RESULTS
LEEDER CONSULTING
Report N°: M101702
Matrix: Sediment
Method: MA-30.SD.01 Total Petroleum Hydrocarbons
Sample units are expressed in mg/kg
Analyte Name PQL
Client ID
Leeder ID
nd
nd
nd
nd
nd20Total C6-C36
20C29-C36
20C15-C28
10C10-C14
10C6-C9
Site 9
2010021264
Matrix: Sediment
Method: MA-30.SD.01 Total Petroleum Hydrocarbons
Sample units are expressed in mg/kg
Analyte Name PQL
Client ID
Leeder ID
nd
nd
nd
nd
nd20Total C6-C36
20C29-C36
20C15-C28
10C10-C14
10C6-C9
Duplicate
S112º 43.9 S
124º 34.04 E
2010021322
Page 12 of 41
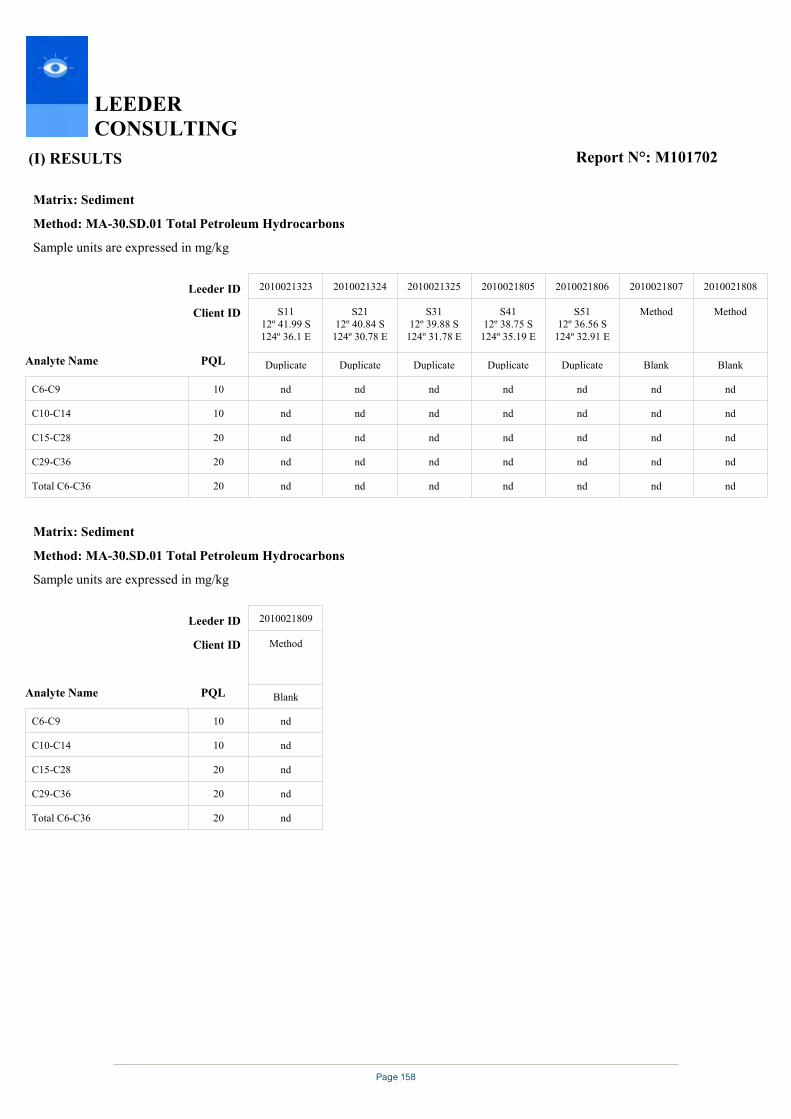
Page 158
(I) RESULTS
LEEDER CONSULTING
Report N°: M101702
Matrix: Sediment
Method: MA-30.SD.01 Total Petroleum Hydrocarbons
Sample units are expressed in mg/kg
Analyte Name PQL
Client ID
Leeder ID
nd
nd
nd
nd
nd
nd
nd
nd
nd
nd
nd
nd
nd
nd
nd
nd
nd
nd
nd
nd
nd
nd
nd
nd
nd
nd
nd
nd
nd
nd
nd
nd
nd
nd
nd20Total C6-C36
20C29-C36
20C15-C28
10C10-C14
10C6-C9
Blank
Method
2010021808
Blank
Method
2010021807
Duplicate
S5112º 36.56 S
124º 32.91 E
2010021806
Duplicate
S4112º 38.75 S
124º 35.19 E
2010021805
Duplicate
S3112º 39.88 S
124º 31.78 E
2010021325
Duplicate
S2112º 40.84 S
124º 30.78 E
2010021324
Duplicate
S1112º 41.99 S124º 36.1 E
2010021323
Matrix: Sediment
Method: MA-30.SD.01 Total Petroleum Hydrocarbons
Sample units are expressed in mg/kg
Analyte Name PQL
Client ID
Leeder ID
nd
nd
nd
nd
nd20Total C6-C36
20C29-C36
20C15-C28
10C10-C14
10C6-C9
Blank
Method
2010021809
Page 13 of 41

Page 159
(I) RESULTS
LEEDER CONSULTING
Report N°: M101702
Matrix: Sediment
Method: MA-72.SD.01 Polynuclear Aromatic Hydrocarbons
Sample units are expressed in mg/kg
Analyte Name PQL
Client ID
Leeder ID
nd
nd
nd
nd
nd
nd
nd
nd
nd
nd
nd
nd
nd
nd
nd
nd
nd
nd
nd
nd
nd
nd
nd
nd
nd
nd
nd
nd
nd
nd
nd
nd
nd
nd
nd
nd
nd
nd
nd
nd
nd
nd
nd
nd
nd
nd
nd
nd
nd
nd
nd
nd
nd
nd
nd
nd
nd
nd
nd
nd
nd
nd
nd
nd
nd
nd
nd
nd
nd
nd
nd
nd
nd
nd
nd
nd
nd
nd
nd
nd
nd
nd
nd
nd
nd
nd
nd
nd
nd
nd
nd
nd
nd
nd
nd
nd
nd
nd
nd
nd
nd
nd
nd
nd
nd
nd
nd
nd
nd
nd
nd
nd
nd
nd
nd
nd
nd
nd
nd
nd
nd
nd
nd
nd
nd
nd0.5Pyrene
0.5Phenanthrene
0.5Naphthalene
0.53-Methylcholanthrene
0.5Indeno (1,2,3-cd) pyrene
0.5Fluorene
0.5Fluoranthene
0.57,12-Dimethylbenz(a)anthracene
0.5Dibenz (ah) anthracene
0.5Chrysene
0.5Benzo (k) fluoranthene
0.5Benzo (ghi) perylene
0.5Benzo (b) fluoranthene
0.5Benzo (a) pyrene
0.5Benzo(a)anthracene
0.5Anthracene
0.5Acenaphthylene
0.5Acenaphthene
S712º 43.09 S
124º 31.81 E
2010021214
S612º 43.1 S
124º 30.67 E
2010021213
S512º 43.08 S
124º 29.59 E
2010021212
S412º 43.9 S
124º 30.65 E
2010021211
S312º 44.12 S124º 31.8 E
2010021210
S212º 44.1 S
124º 32.9 E
2010021209
S112º 43.9 S
124º 34.04 E
2010021208
Page 14 of 41

Page 160
(I) RESULTS
LEEDER CONSULTING
Report N°: M101702
Matrix: Sediment
Method: MA-72.SD.01 Polynuclear Aromatic Hydrocarbons
Sample units are expressed in mg/kg
Analyte Name PQL
Client ID
Leeder ID
nd
nd
nd
nd
nd
nd
nd
nd
nd
nd
nd
nd
nd
nd
nd
nd
nd
nd
nd
nd
nd
nd
nd
nd
nd
nd
nd
nd
nd
nd
nd
nd
nd
nd
nd
nd
nd
nd
nd
nd
nd
nd
nd
nd
nd
nd
nd
nd
nd
nd
nd
nd
nd
nd
nd
nd
nd
nd
nd
nd
nd
nd
nd
nd
nd
nd
nd
nd
nd
nd
nd
nd
nd
nd
nd
nd
nd
nd
nd
nd
nd
nd
nd
nd
nd
nd
nd
nd
nd
nd
nd
nd
nd
nd
nd
nd
nd
nd
nd
nd
nd
nd
nd
nd
nd
nd
nd
nd
nd
nd
nd
nd
nd
nd
nd
nd
nd
nd
nd
nd
nd
nd
nd
nd
nd
nd0.5Pyrene
0.5Phenanthrene
0.5Naphthalene
0.53-Methylcholanthrene
0.5Indeno (1,2,3-cd) pyrene
0.5Fluorene
0.5Fluoranthene
0.57,12-Dimethylbenz(a)anthracene
0.5Dibenz (ah) anthracene
0.5Chrysene
0.5Benzo (k) fluoranthene
0.5Benzo (ghi) perylene
0.5Benzo (b) fluoranthene
0.5Benzo (a) pyrene
0.5Benzo(a)anthracene
0.5Anthracene
0.5Acenaphthylene
0.5Acenaphthene
S1412º 42.09 S
124º 32.94 E
2010021221
S1312º 42.07 S
124º 34.03 E
2010021220
S1212º 42.03 S
124º 35.06 E
2010021219
S1112º 41.99 S124º 36.1 E
2010021218
S1012º 43.09 S
124º 35.15 E
2010021217
S912º 43.09 S
124º 33.98 E
2010021216
S812º 43.14 S
124º 32.86 E
2010021215
Page 15 of 41

Page 161
(I) RESULTS
LEEDER CONSULTING
Report N°: M101702
Matrix: Sediment
Method: MA-72.SD.01 Polynuclear Aromatic Hydrocarbons
Sample units are expressed in mg/kg
Analyte Name PQL
Client ID
Leeder ID
nd
nd
nd
nd
nd
nd
nd
nd
nd
nd
nd
nd
nd
nd
nd
nd
nd
nd
nd
nd
nd
nd
nd
nd
nd
nd
nd
nd
nd
nd
nd
nd
nd
nd
nd
nd
nd
nd
nd
nd
nd
nd
nd
nd
nd
nd
nd
nd
nd
nd
nd
nd
nd
nd
nd
nd
nd
nd
nd
nd
nd
nd
nd
nd
nd
nd
nd
nd
nd
nd
nd
nd
nd
nd
nd
nd
nd
nd
nd
nd
nd
nd
nd
nd
nd
nd
nd
nd
nd
nd
nd
nd
nd
nd
nd
nd
nd
nd
nd
nd
nd
nd
nd
nd
nd
nd
nd
nd
nd
nd
nd
nd
nd
nd
nd
nd
nd
nd
nd
nd
nd
nd
nd
nd
nd
nd0.5Pyrene
0.5Phenanthrene
0.5Naphthalene
0.53-Methylcholanthrene
0.5Indeno (1,2,3-cd) pyrene
0.5Fluorene
0.5Fluoranthene
0.57,12-Dimethylbenz(a)anthracene
0.5Dibenz (ah) anthracene
0.5Chrysene
0.5Benzo (k) fluoranthene
0.5Benzo (ghi) perylene
0.5Benzo (b) fluoranthene
0.5Benzo (a) pyrene
0.5Benzo(a)anthracene
0.5Anthracene
0.5Acenaphthylene
0.5Acenaphthene
S2112º 40.84 S
124º 30.78 E
2010021228
S2012º 40.78 S
124º 29.67 E
2010021227
S1912º 40.86 S
124º 28.67 E
2010021226
S1812º 41.93 S
124º 28.75 E
2010021225
S1712º 42.02 S
124º 29.64 E
2010021224
S1612º 42.03 S
124º 30.79 E
2010021223
S1512º 42.14 S
124º 31.92 E
2010021222
Page 16 of 41

Page 162
(I) RESULTS
LEEDER CONSULTING
Report N°: M101702
Matrix: Sediment
Method: MA-72.SD.01 Polynuclear Aromatic Hydrocarbons
Sample units are expressed in mg/kg
Analyte Name PQL
Client ID
Leeder ID
nd
nd
nd
nd
nd
nd
nd
nd
nd
nd
nd
nd
nd
nd
nd
nd
nd
nd
nd
nd
nd
nd
nd
nd
nd
nd
nd
nd
nd
nd
nd
nd
nd
nd
nd
nd
nd
nd
nd
nd
nd
nd
nd
nd
nd
nd
nd
nd
nd
nd
nd
nd
nd
nd
nd
nd
nd
nd
nd
nd
nd
nd
nd
nd
nd
nd
nd
nd
nd
nd
nd
nd
nd
nd
nd
nd
nd
nd
nd
nd
nd
nd
nd
nd
nd
nd
nd
nd
nd
nd
nd
nd
nd
nd
nd
nd
nd
nd
nd
nd
nd
nd
nd
nd
nd
nd
nd
nd
nd
nd
nd
nd
nd
nd
nd
nd
nd
nd
nd
nd
nd
nd
nd
nd
nd
nd0.5Pyrene
0.5Phenanthrene
0.5Naphthalene
0.53-Methylcholanthrene
0.5Indeno (1,2,3-cd) pyrene
0.5Fluorene
0.5Fluoranthene
0.57,12-Dimethylbenz(a)anthracene
0.5Dibenz (ah) anthracene
0.5Chrysene
0.5Benzo (k) fluoranthene
0.5Benzo (ghi) perylene
0.5Benzo (b) fluoranthene
0.5Benzo (a) pyrene
0.5Benzo(a)anthracene
0.5Anthracene
0.5Acenaphthylene
0.5Acenaphthene
S2812º 39.75 S124º 35.1 E
2010021235
S2712º 39.66 S
124º 36.26 E
2010021234
S2612º 40.84 S124º 36.2 E
2010021233
S2512º 40.85 S124º 35.1 E
2010021232
S2412º 40.84 S
124º 34.03 E
2010021231
S2312º 40.87 S124º 32.9 E
2010021230
S2212º 40.9 S
124º 31.84 E
2010021229
Page 17 of 41
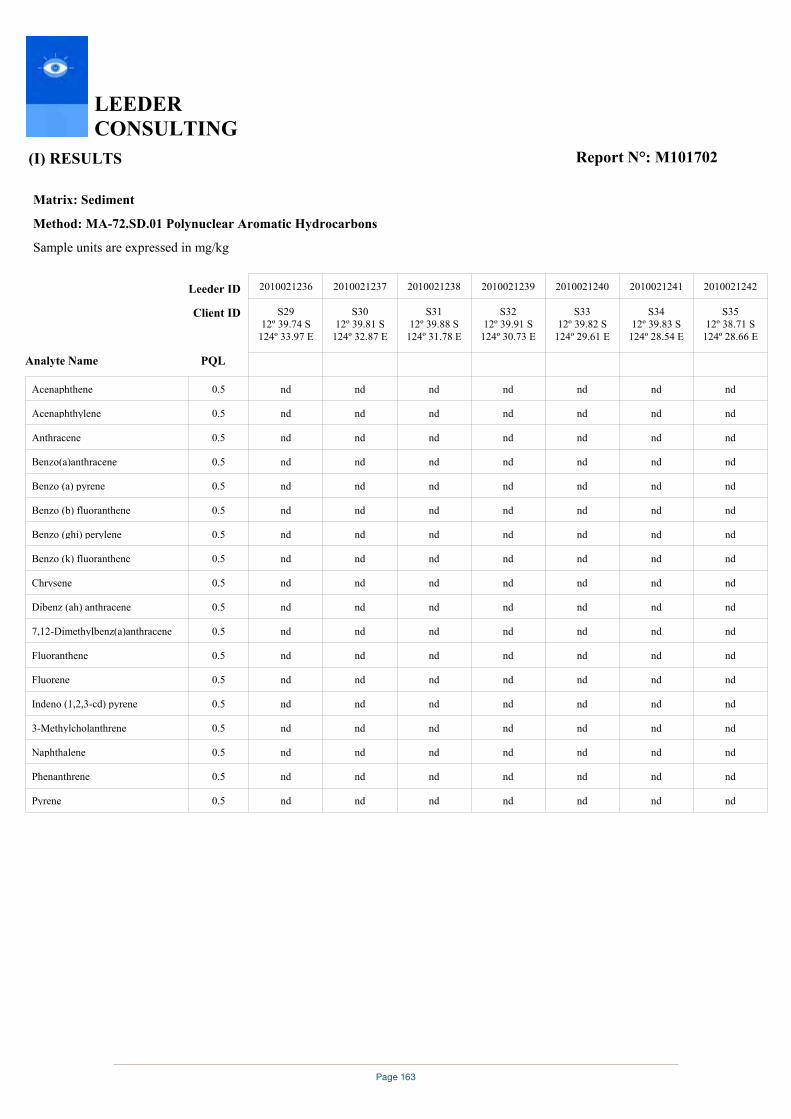
Page 163
(I) RESULTS
LEEDER CONSULTING
Report N°: M101702
Matrix: Sediment
Method: MA-72.SD.01 Polynuclear Aromatic Hydrocarbons
Sample units are expressed in mg/kg
Analyte Name PQL
Client ID
Leeder ID
nd
nd
nd
nd
nd
nd
nd
nd
nd
nd
nd
nd
nd
nd
nd
nd
nd
nd
nd
nd
nd
nd
nd
nd
nd
nd
nd
nd
nd
nd
nd
nd
nd
nd
nd
nd
nd
nd
nd
nd
nd
nd
nd
nd
nd
nd
nd
nd
nd
nd
nd
nd
nd
nd
nd
nd
nd
nd
nd
nd
nd
nd
nd
nd
nd
nd
nd
nd
nd
nd
nd
nd
nd
nd
nd
nd
nd
nd
nd
nd
nd
nd
nd
nd
nd
nd
nd
nd
nd
nd
nd
nd
nd
nd
nd
nd
nd
nd
nd
nd
nd
nd
nd
nd
nd
nd
nd
nd
nd
nd
nd
nd
nd
nd
nd
nd
nd
nd
nd
nd
nd
nd
nd
nd
nd
nd0.5Pyrene
0.5Phenanthrene
0.5Naphthalene
0.53-Methylcholanthrene
0.5Indeno (1,2,3-cd) pyrene
0.5Fluorene
0.5Fluoranthene
0.57,12-Dimethylbenz(a)anthracene
0.5Dibenz (ah) anthracene
0.5Chrysene
0.5Benzo (k) fluoranthene
0.5Benzo (ghi) perylene
0.5Benzo (b) fluoranthene
0.5Benzo (a) pyrene
0.5Benzo(a)anthracene
0.5Anthracene
0.5Acenaphthylene
0.5Acenaphthene
S3512º 38.71 S
124º 28.66 E
2010021242
S3412º 39.83 S
124º 28.54 E
2010021241
S3312º 39.82 S
124º 29.61 E
2010021240
S3212º 39.91 S
124º 30.73 E
2010021239
S3112º 39.88 S
124º 31.78 E
2010021238
S3012º 39.81 S
124º 32.87 E
2010021237
S2912º 39.74 S
124º 33.97 E
2010021236
Page 18 of 41
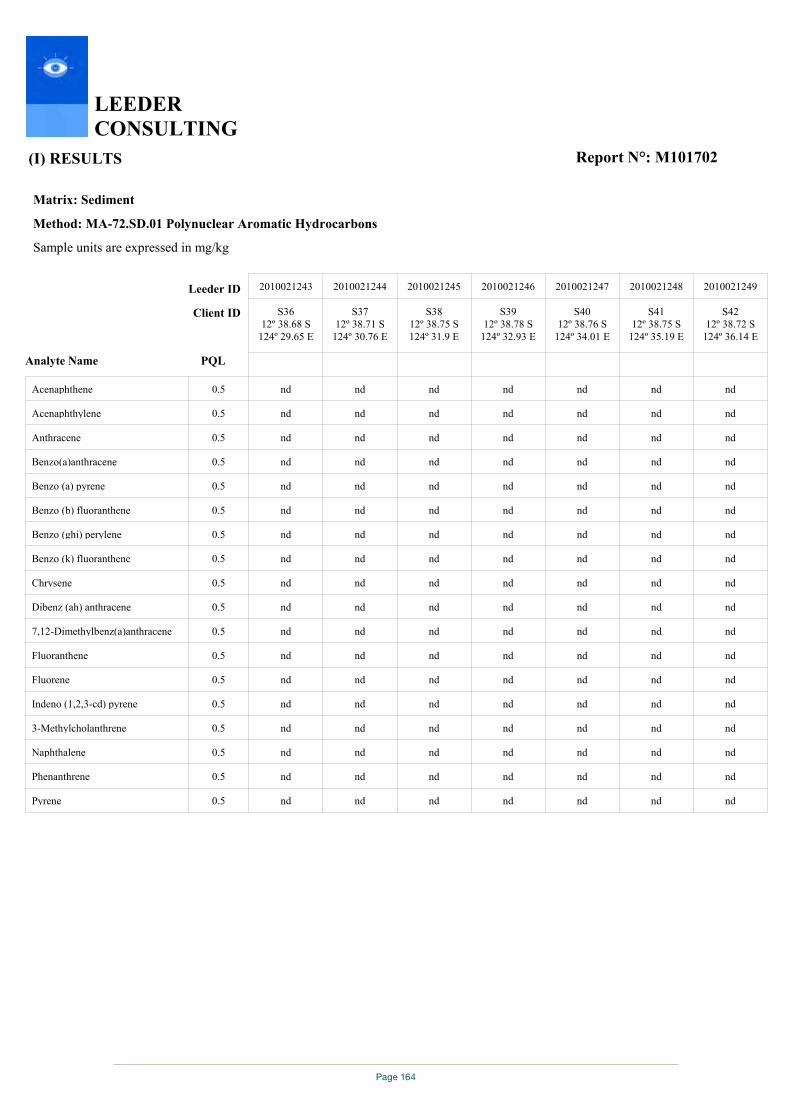
Page 164
(I) RESULTS
LEEDER CONSULTING
Report N°: M101702
Matrix: Sediment
Method: MA-72.SD.01 Polynuclear Aromatic Hydrocarbons
Sample units are expressed in mg/kg
Analyte Name PQL
Client ID
Leeder ID
nd
nd
nd
nd
nd
nd
nd
nd
nd
nd
nd
nd
nd
nd
nd
nd
nd
nd
nd
nd
nd
nd
nd
nd
nd
nd
nd
nd
nd
nd
nd
nd
nd
nd
nd
nd
nd
nd
nd
nd
nd
nd
nd
nd
nd
nd
nd
nd
nd
nd
nd
nd
nd
nd
nd
nd
nd
nd
nd
nd
nd
nd
nd
nd
nd
nd
nd
nd
nd
nd
nd
nd
nd
nd
nd
nd
nd
nd
nd
nd
nd
nd
nd
nd
nd
nd
nd
nd
nd
nd
nd
nd
nd
nd
nd
nd
nd
nd
nd
nd
nd
nd
nd
nd
nd
nd
nd
nd
nd
nd
nd
nd
nd
nd
nd
nd
nd
nd
nd
nd
nd
nd
nd
nd
nd
nd0.5Pyrene
0.5Phenanthrene
0.5Naphthalene
0.53-Methylcholanthrene
0.5Indeno (1,2,3-cd) pyrene
0.5Fluorene
0.5Fluoranthene
0.57,12-Dimethylbenz(a)anthracene
0.5Dibenz (ah) anthracene
0.5Chrysene
0.5Benzo (k) fluoranthene
0.5Benzo (ghi) perylene
0.5Benzo (b) fluoranthene
0.5Benzo (a) pyrene
0.5Benzo(a)anthracene
0.5Anthracene
0.5Acenaphthylene
0.5Acenaphthene
S4212º 38.72 S
124º 36.14 E
2010021249
S4112º 38.75 S
124º 35.19 E
2010021248
S4012º 38.76 S
124º 34.01 E
2010021247
S3912º 38.78 S
124º 32.93 E
2010021246
S3812º 38.75 S124º 31.9 E
2010021245
S3712º 38.71 S
124º 30.76 E
2010021244
S3612º 38.68 S
124º 29.65 E
2010021243
Page 19 of 41

Page 165
(I) RESULTS
LEEDER CONSULTING
Report N°: M101702
Matrix: Sediment
Method: MA-72.SD.01 Polynuclear Aromatic Hydrocarbons
Sample units are expressed in mg/kg
Analyte Name PQL
Client ID
Leeder ID
nd
nd
nd
nd
nd
nd
nd
nd
nd
nd
nd
nd
nd
nd
nd
nd
nd
nd
nd
nd
nd
nd
nd
nd
nd
nd
nd
nd
nd
nd
nd
nd
nd
nd
nd
nd
nd
nd
nd
nd
nd
nd
nd
nd
nd
nd
nd
nd
nd
nd
nd
nd
nd
nd
nd
nd
nd
nd
nd
nd
nd
nd
nd
nd
nd
nd
nd
nd
nd
nd
nd
nd
nd
nd
nd
nd
nd
nd
nd
nd
nd
nd
nd
nd
nd
nd
nd
nd
nd
nd
nd
nd
nd
nd
nd
nd
nd
nd
nd
nd
nd
nd
nd
nd
nd
nd
nd
nd
nd
nd
nd
nd
nd
nd
nd
nd
nd
nd
nd
nd
nd
nd
nd
nd
nd
nd0.5Pyrene
0.5Phenanthrene
0.5Naphthalene
0.53-Methylcholanthrene
0.5Indeno (1,2,3-cd) pyrene
0.5Fluorene
0.5Fluoranthene
0.57,12-Dimethylbenz(a)anthracene
0.5Dibenz (ah) anthracene
0.5Chrysene
0.5Benzo (k) fluoranthene
0.5Benzo (ghi) perylene
0.5Benzo (b) fluoranthene
0.5Benzo (a) pyrene
0.5Benzo(a)anthracene
0.5Anthracene
0.5Acenaphthylene
0.5Acenaphthene
S4912º 36.66 S
124º 30.82 E
2010021256
S4812º 37.58 S
124º 29.67 E
2010021255
S4712º 37.54 S
124º 30.75 E
2010021254
S4612º 37.61 S
124º 31.93 E
2010021253
S4512º 37.66 S
124º 32.99 E
2010021252
S4412º 37.61 S
124º 34.07 E
2010021251
S4312º 37.61 S
124º 35.18 E
2010021250
Page 20 of 41
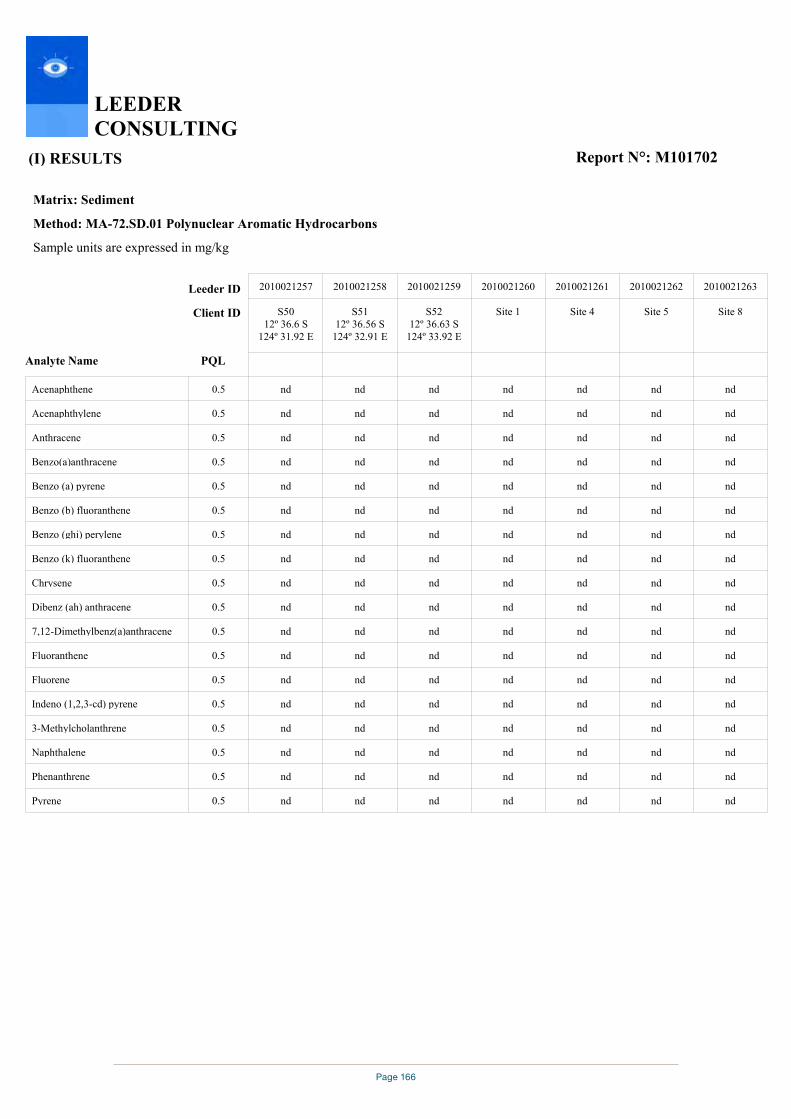
Page 166
(I) RESULTS
LEEDER CONSULTING
Report N°: M101702
Matrix: Sediment
Method: MA-72.SD.01 Polynuclear Aromatic Hydrocarbons
Sample units are expressed in mg/kg
Analyte Name PQL
Client ID
Leeder ID
nd
nd
nd
nd
nd
nd
nd
nd
nd
nd
nd
nd
nd
nd
nd
nd
nd
nd
nd
nd
nd
nd
nd
nd
nd
nd
nd
nd
nd
nd
nd
nd
nd
nd
nd
nd
nd
nd
nd
nd
nd
nd
nd
nd
nd
nd
nd
nd
nd
nd
nd
nd
nd
nd
nd
nd
nd
nd
nd
nd
nd
nd
nd
nd
nd
nd
nd
nd
nd
nd
nd
nd
nd
nd
nd
nd
nd
nd
nd
nd
nd
nd
nd
nd
nd
nd
nd
nd
nd
nd
nd
nd
nd
nd
nd
nd
nd
nd
nd
nd
nd
nd
nd
nd
nd
nd
nd
nd
nd
nd
nd
nd
nd
nd
nd
nd
nd
nd
nd
nd
nd
nd
nd
nd
nd
nd0.5Pyrene
0.5Phenanthrene
0.5Naphthalene
0.53-Methylcholanthrene
0.5Indeno (1,2,3-cd) pyrene
0.5Fluorene
0.5Fluoranthene
0.57,12-Dimethylbenz(a)anthracene
0.5Dibenz (ah) anthracene
0.5Chrysene
0.5Benzo (k) fluoranthene
0.5Benzo (ghi) perylene
0.5Benzo (b) fluoranthene
0.5Benzo (a) pyrene
0.5Benzo(a)anthracene
0.5Anthracene
0.5Acenaphthylene
0.5Acenaphthene
Site 8
2010021263
Site 5
2010021262
Site 4
2010021261
Site 1
2010021260
S5212º 36.63 S
124º 33.92 E
2010021259
S5112º 36.56 S
124º 32.91 E
2010021258
S5012º 36.6 S
124º 31.92 E
2010021257
Page 21 of 41

Page 167
(I) RESULTS
LEEDER CONSULTING
Report N°: M101702
Matrix: Sediment
Method: MA-72.SD.01 Polynuclear Aromatic Hydrocarbons
Sample units are expressed in mg/kg
Analyte Name PQL
Client ID
Leeder ID
nd
nd
nd
nd
nd
nd
nd
nd
nd
nd
nd
nd
nd
nd
nd
nd
nd
nd0.5Pyrene
0.5Phenanthrene
0.5Naphthalene
0.53-Methylcholanthrene
0.5Indeno (1,2,3-cd) pyrene
0.5Fluorene
0.5Fluoranthene
0.57,12-Dimethylbenz(a)anthracene
0.5Dibenz (ah) anthracene
0.5Chrysene
0.5Benzo (k) fluoranthene
0.5Benzo (ghi) perylene
0.5Benzo (b) fluoranthene
0.5Benzo (a) pyrene
0.5Benzo(a)anthracene
0.5Anthracene
0.5Acenaphthylene
0.5Acenaphthene
Site 9
2010021264
Page 22 of 41
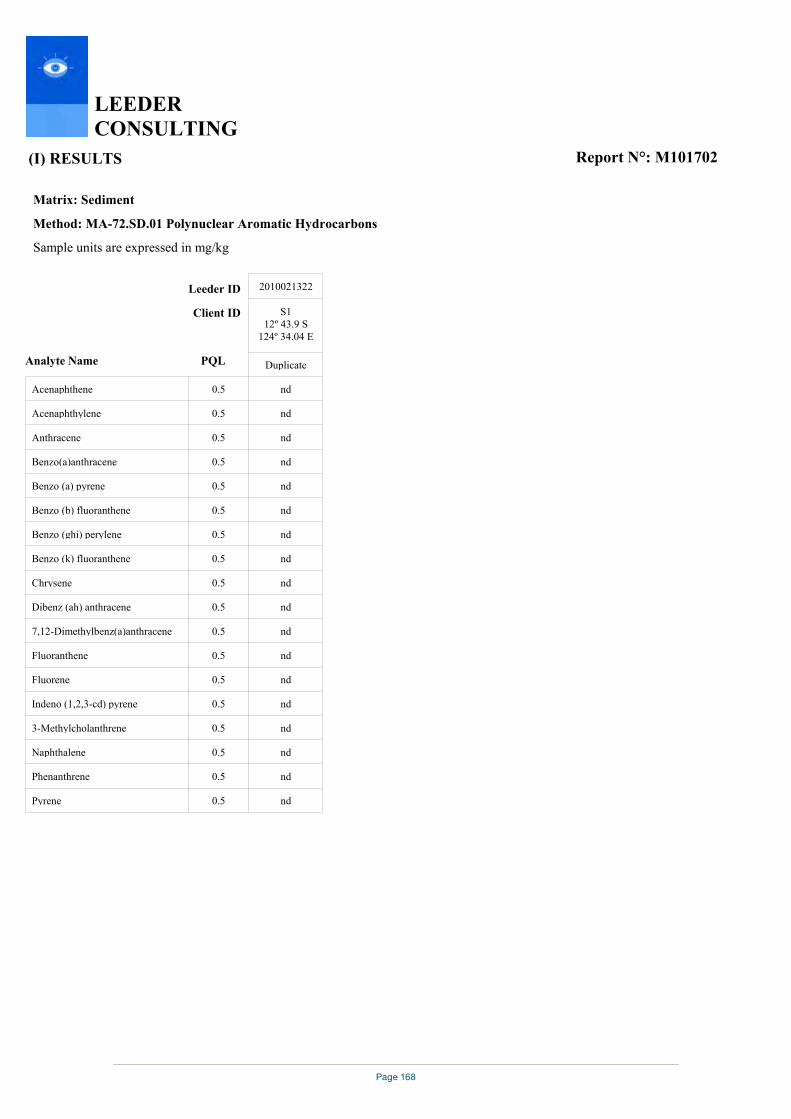
Page 168
(I) RESULTS
LEEDER CONSULTING
Report N°: M101702
Matrix: Sediment
Method: MA-72.SD.01 Polynuclear Aromatic Hydrocarbons
Sample units are expressed in mg/kg
Analyte Name PQL
Client ID
Leeder ID
nd
nd
nd
nd
nd
nd
nd
nd
nd
nd
nd
nd
nd
nd
nd
nd
nd
nd0.5Pyrene
0.5Phenanthrene
0.5Naphthalene
0.53-Methylcholanthrene
0.5Indeno (1,2,3-cd) pyrene
0.5Fluorene
0.5Fluoranthene
0.57,12-Dimethylbenz(a)anthracene
0.5Dibenz (ah) anthracene
0.5Chrysene
0.5Benzo (k) fluoranthene
0.5Benzo (ghi) perylene
0.5Benzo (b) fluoranthene
0.5Benzo (a) pyrene
0.5Benzo(a)anthracene
0.5Anthracene
0.5Acenaphthylene
0.5Acenaphthene
Duplicate
S112º 43.9 S
124º 34.04 E
2010021322
Page 23 of 41

Page 169
(I) RESULTS
LEEDER CONSULTING
Report N°: M101702
Matrix: Sediment
Method: MA-72.SD.01 Polynuclear Aromatic Hydrocarbons
Sample units are expressed in mg/kg
Analyte Name PQL
Client ID
Leeder ID
nd
nd
nd
nd
nd
nd
nd
nd
nd
nd
nd
nd
nd
nd
nd
nd
nd
nd
nd
nd
nd
nd
nd
nd
nd
nd
nd
nd
nd
nd
nd
nd
nd
nd
nd
nd
nd
nd
nd
nd
nd
nd
nd
nd
nd
nd
nd
nd
nd
nd
nd
nd
nd
nd
nd
nd
nd
nd
nd
nd
nd
nd
nd
nd
nd
nd
nd
nd
nd
nd
nd
nd
nd
nd
nd
nd
nd
nd
nd
nd
nd
nd
nd
nd
nd
nd
nd
nd
nd
nd
nd
nd
nd
nd
nd
nd
nd
nd
nd
nd
nd
nd
nd
nd
nd
nd
nd
nd
nd
nd
nd
nd
nd
nd
nd
nd
nd
nd
nd
nd
nd
nd
nd
nd
nd
nd0.5Pyrene
0.5Phenanthrene
0.5Naphthalene
0.53-Methylcholanthrene
0.5Indeno (1,2,3-cd) pyrene
0.5Fluorene
0.5Fluoranthene
0.57,12-Dimethylbenz(a)anthracene
0.5Dibenz (ah) anthracene
0.5Chrysene
0.5Benzo (k) fluoranthene
0.5Benzo (ghi) perylene
0.5Benzo (b) fluoranthene
0.5Benzo (a) pyrene
0.5Benzo(a)anthracene
0.5Anthracene
0.5Acenaphthylene
0.5Acenaphthene
Blank
Method
2010021808
Blank
Method
2010021807
Duplicate
S5112º 36.56 S
124º 32.91 E
2010021806
Duplicate
S4112º 38.75 S
124º 35.19 E
2010021805
Duplicate
S3112º 39.88 S
124º 31.78 E
2010021325
Duplicate
S2112º 40.84 S
124º 30.78 E
2010021324
Duplicate
S1112º 41.99 S124º 36.1 E
2010021323
Page 24 of 41
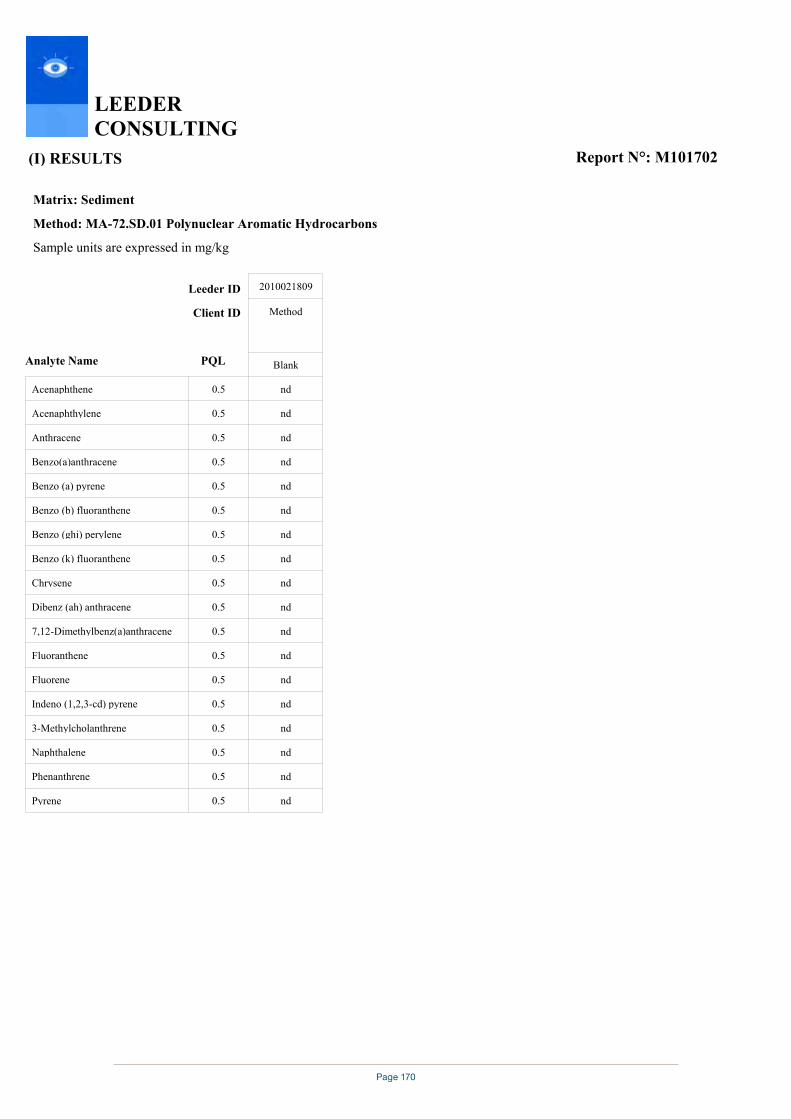
Page 170
(I) RESULTS
LEEDER CONSULTING
Report N°: M101702
Matrix: Sediment
Method: MA-72.SD.01 Polynuclear Aromatic Hydrocarbons
Sample units are expressed in mg/kg
Analyte Name PQL
Client ID
Leeder ID
nd
nd
nd
nd
nd
nd
nd
nd
nd
nd
nd
nd
nd
nd
nd
nd
nd
nd0.5Pyrene
0.5Phenanthrene
0.5Naphthalene
0.53-Methylcholanthrene
0.5Indeno (1,2,3-cd) pyrene
0.5Fluorene
0.5Fluoranthene
0.57,12-Dimethylbenz(a)anthracene
0.5Dibenz (ah) anthracene
0.5Chrysene
0.5Benzo (k) fluoranthene
0.5Benzo (ghi) perylene
0.5Benzo (b) fluoranthene
0.5Benzo (a) pyrene
0.5Benzo(a)anthracene
0.5Anthracene
0.5Acenaphthylene
0.5Acenaphthene
Blank
Method
2010021809
Page 25 of 41
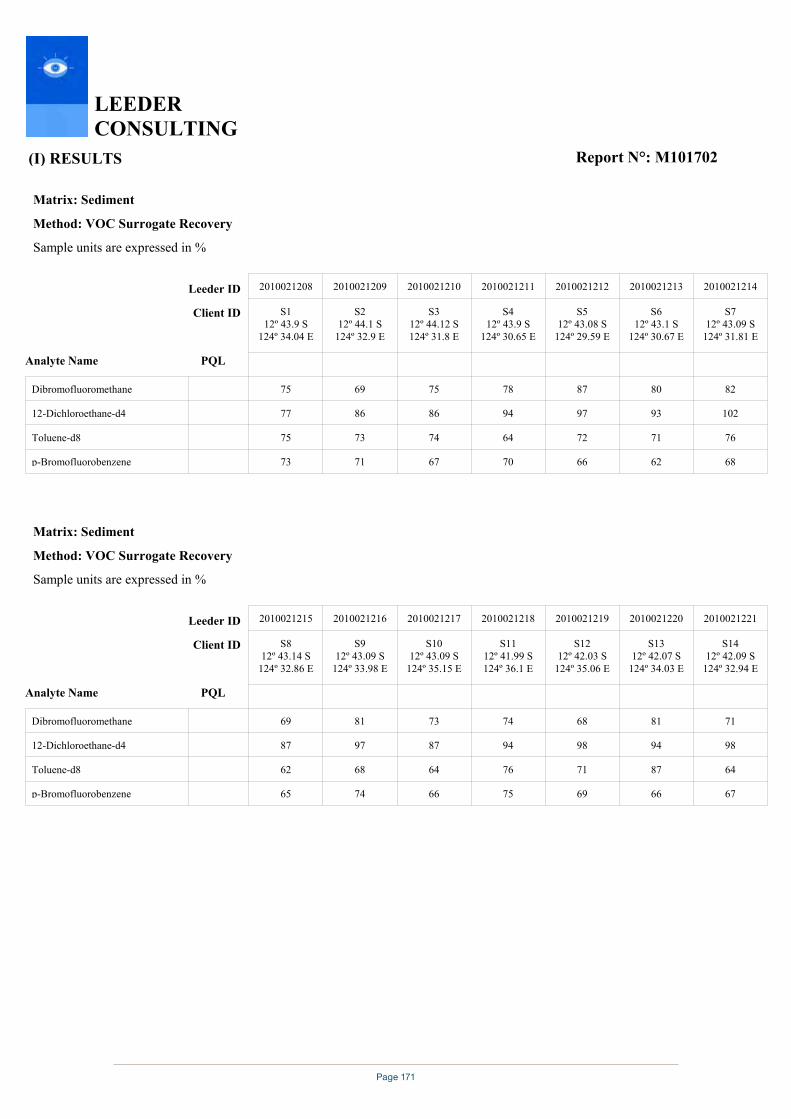
Page 171
(I) RESULTS
LEEDER CONSULTING
Report N°: M101702
Matrix: Sediment
Method: VOC Surrogate Recovery
Sample units are expressed in %
Analyte Name PQL
Client ID
Leeder ID
75
77
75
73
69
86
73
71
75
86
74
67
78
94
64
70
87
97
72
66
80
93
71
62
82
102
76
68p-Bromofluorobenzene
Toluene-d8
12-Dichloroethane-d4
Dibromofluoromethane
S712º 43.09 S
124º 31.81 E
2010021214
S612º 43.1 S
124º 30.67 E
2010021213
S512º 43.08 S
124º 29.59 E
2010021212
S412º 43.9 S
124º 30.65 E
2010021211
S312º 44.12 S124º 31.8 E
2010021210
S212º 44.1 S
124º 32.9 E
2010021209
S112º 43.9 S
124º 34.04 E
2010021208
Matrix: Sediment
Method: VOC Surrogate Recovery
Sample units are expressed in %
Analyte Name PQL
Client ID
Leeder ID
69
87
62
65
81
97
68
74
73
87
64
66
74
94
76
75
68
98
71
69
81
94
87
66
71
98
64
67p-Bromofluorobenzene
Toluene-d8
12-Dichloroethane-d4
Dibromofluoromethane
S1412º 42.09 S
124º 32.94 E
2010021221
S1312º 42.07 S
124º 34.03 E
2010021220
S1212º 42.03 S
124º 35.06 E
2010021219
S1112º 41.99 S124º 36.1 E
2010021218
S1012º 43.09 S
124º 35.15 E
2010021217
S912º 43.09 S
124º 33.98 E
2010021216
S812º 43.14 S
124º 32.86 E
2010021215
Page 26 of 41

Page 172
(I) RESULTS
LEEDER CONSULTING
Report N°: M101702
Matrix: Sediment
Method: VOC Surrogate Recovery
Sample units are expressed in %
Analyte Name PQL
Client ID
Leeder ID
75
88
64
72
78
88
62
62
79
90
68
69
80
98
74
72
81
100
66
70
75
87
74
67
84
105
70
72p-Bromofluorobenzene
Toluene-d8
12-Dichloroethane-d4
Dibromofluoromethane
S2112º 40.84 S
124º 30.78 E
2010021228
S2012º 40.78 S
124º 29.67 E
2010021227
S1912º 40.86 S
124º 28.67 E
2010021226
S1812º 41.93 S
124º 28.75 E
2010021225
S1712º 42.02 S
124º 29.64 E
2010021224
S1612º 42.03 S
124º 30.79 E
2010021223
S1512º 42.14 S
124º 31.92 E
2010021222
Matrix: Sediment
Method: VOC Surrogate Recovery
Sample units are expressed in %
Analyte Name PQL
Client ID
Leeder ID
68
95
73
66
63
74
76
74
75
95
69
74
72
85
67
65
69
91
70
66
71
92
69
71
71
88
70
67p-Bromofluorobenzene
Toluene-d8
12-Dichloroethane-d4
Dibromofluoromethane
S2812º 39.75 S124º 35.1 E
2010021235
S2712º 39.66 S
124º 36.26 E
2010021234
S2612º 40.84 S124º 36.2 E
2010021233
S2512º 40.85 S124º 35.1 E
2010021232
S2412º 40.84 S
124º 34.03 E
2010021231
S2312º 40.87 S124º 32.9 E
2010021230
S2212º 40.9 S
124º 31.84 E
2010021229
Page 27 of 41

Page 173
(I) RESULTS
LEEDER CONSULTING
Report N°: M101702
Matrix: Sediment
Method: VOC Surrogate Recovery
Sample units are expressed in %
Analyte Name PQL
Client ID
Leeder ID
75
93
73
70
81
108
76
70
66
90
64
65
80
106
82
72
82
104
68
63
79
101
70
63
72
100
66
65p-Bromofluorobenzene
Toluene-d8
12-Dichloroethane-d4
Dibromofluoromethane
S3512º 38.71 S
124º 28.66 E
2010021242
S3412º 39.83 S
124º 28.54 E
2010021241
S3312º 39.82 S
124º 29.61 E
2010021240
S3212º 39.91 S
124º 30.73 E
2010021239
S3112º 39.88 S
124º 31.78 E
2010021238
S3012º 39.81 S
124º 32.87 E
2010021237
S2912º 39.74 S
124º 33.97 E
2010021236
Matrix: Sediment
Method: VOC Surrogate Recovery
Sample units are expressed in %
Analyte Name PQL
Client ID
Leeder ID
87
118
69
66
72
101
70
64
81
105
65
66
80
106
66
73
66
78
66
67
79
108
77
78
77
99
73
69p-Bromofluorobenzene
Toluene-d8
12-Dichloroethane-d4
Dibromofluoromethane
S4212º 38.72 S
124º 36.14 E
2010021249
S4112º 38.75 S
124º 35.19 E
2010021248
S4012º 38.76 S
124º 34.01 E
2010021247
S3912º 38.78 S
124º 32.93 E
2010021246
S3812º 38.75 S124º 31.9 E
2010021245
S3712º 38.71 S
124º 30.76 E
2010021244
S3612º 38.68 S
124º 29.65 E
2010021243
Page 28 of 41
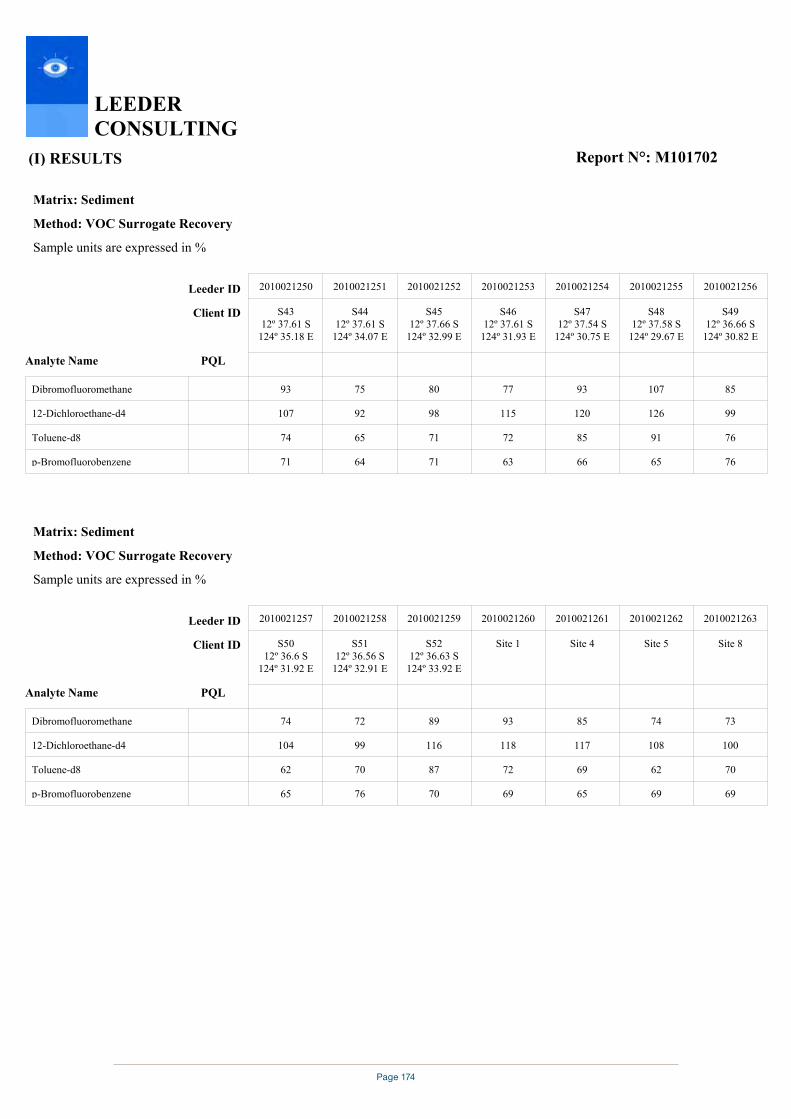
Page 174
(I) RESULTS
LEEDER CONSULTING
Report N°: M101702
Matrix: Sediment
Method: VOC Surrogate Recovery
Sample units are expressed in %
Analyte Name PQL
Client ID
Leeder ID
93
107
74
71
75
92
65
64
80
98
71
71
77
115
72
63
93
120
85
66
107
126
91
65
85
99
76
76p-Bromofluorobenzene
Toluene-d8
12-Dichloroethane-d4
Dibromofluoromethane
S4912º 36.66 S
124º 30.82 E
2010021256
S4812º 37.58 S
124º 29.67 E
2010021255
S4712º 37.54 S
124º 30.75 E
2010021254
S4612º 37.61 S
124º 31.93 E
2010021253
S4512º 37.66 S
124º 32.99 E
2010021252
S4412º 37.61 S
124º 34.07 E
2010021251
S4312º 37.61 S
124º 35.18 E
2010021250
Matrix: Sediment
Method: VOC Surrogate Recovery
Sample units are expressed in %
Analyte Name PQL
Client ID
Leeder ID
74
104
62
65
72
99
70
76
89
116
87
70
93
118
72
69
85
117
69
65
74
108
62
69
73
100
70
69p-Bromofluorobenzene
Toluene-d8
12-Dichloroethane-d4
Dibromofluoromethane
Site 8
2010021263
Site 5
2010021262
Site 4
2010021261
Site 1
2010021260
S5212º 36.63 S
124º 33.92 E
2010021259
S5112º 36.56 S
124º 32.91 E
2010021258
S5012º 36.6 S
124º 31.92 E
2010021257
Page 29 of 41

Page 175
(I) RESULTS
LEEDER CONSULTING
Report N°: M101702
Matrix: Sediment
Method: VOC Surrogate Recovery
Sample units are expressed in %
Analyte Name PQL
Client ID
Leeder ID
99
93
72
64p-Bromofluorobenzene
Toluene-d8
12-Dichloroethane-d4
Dibromofluoromethane
Site 9
2010021264
Matrix: Sediment
Method: VOC Surrogate Recovery
Sample units are expressed in %
Analyte Name PQL
Client ID
Leeder ID
79
88
71
79p-Bromofluorobenzene
Toluene-d8
12-Dichloroethane-d4
Dibromofluoromethane
Duplicate
S112º 43.9 S
124º 34.04 E
2010021322
Page 30 of 41

Page 176
(I) RESULTS
LEEDER CONSULTING
Report N°: M101702
Matrix: Sediment
Method: VOC Surrogate Recovery
Sample units are expressed in %
Analyte Name PQL
Client ID
Leeder ID
77
101
66
65
71
92
65
67
67
90
66
68
74
96
69
67
93
124
85
85
76
77
77
73
103
107
83
74p-Bromofluorobenzene
Toluene-d8
12-Dichloroethane-d4
Dibromofluoromethane
Blank
Method
2010021808
Blank
Method
2010021807
Duplicate
S5112º 36.56 S
124º 32.91 E
2010021806
Duplicate
S4112º 38.75 S
124º 35.19 E
2010021805
Duplicate
S3112º 39.88 S
124º 31.78 E
2010021325
Duplicate
S2112º 40.84 S
124º 30.78 E
2010021324
Duplicate
S1112º 41.99 S124º 36.1 E
2010021323
Matrix: Sediment
Method: VOC Surrogate Recovery
Sample units are expressed in %
Analyte Name PQL
Client ID
Leeder ID
78
90
69
77p-Bromofluorobenzene
Toluene-d8
12-Dichloroethane-d4
Dibromofluoromethane
Blank
Method
2010021809
Page 31 of 41

Page 177
(I) RESULTS
LEEDER CONSULTING
Report N°: M101702
Matrix: Sediment
Method: Surrogate Recovery
Sample units are expressed in %
Analyte Name PQL
Client ID
Leeder ID
110
125
104
106
114
91
92
83
87
95
90
100
81
85
91
96
97
87
90
97
79
83
71
75
79
99
107
88
94
104
88
92
76
83
94p-Terphenyl-d14
Phenol-d6
Nitrobenzene-d5
Fluorophenol
Fluorobiphenyl
S712º 43.09 S
124º 31.81 E
2010021214
S612º 43.1 S
124º 30.67 E
2010021213
S512º 43.08 S
124º 29.59 E
2010021212
S412º 43.9 S
124º 30.65 E
2010021211
S312º 44.12 S124º 31.8 E
2010021210
S212º 44.1 S
124º 32.9 E
2010021209
S112º 43.9 S
124º 34.04 E
2010021208
Matrix: Sediment
Method: Surrogate Recovery
Sample units are expressed in %
Analyte Name PQL
Client ID
Leeder ID
76
78
68
71
78
77
85
66
72
79
85
97
75
81
90
71
79
60
65
72
67
74
65
62
70
75
79
66
71
78
70
79
63
66
73p-Terphenyl-d14
Phenol-d6
Nitrobenzene-d5
Fluorophenol
Fluorobiphenyl
S1412º 42.09 S
124º 32.94 E
2010021221
S1312º 42.07 S
124º 34.03 E
2010021220
S1212º 42.03 S
124º 35.06 E
2010021219
S1112º 41.99 S124º 36.1 E
2010021218
S1012º 43.09 S
124º 35.15 E
2010021217
S912º 43.09 S
124º 33.98 E
2010021216
S812º 43.14 S
124º 32.86 E
2010021215
Page 32 of 41

Page 178
(I) RESULTS
LEEDER CONSULTING
Report N°: M101702
Matrix: Sediment
Method: Surrogate Recovery
Sample units are expressed in %
Analyte Name PQL
Client ID
Leeder ID
77
79
66
70
77
77
78
65
71
77
71
72
61
64
69
77
85
65
71
77
75
83
63
70
76
78
89
68
74
88
66
79
63
67
61p-Terphenyl-d14
Phenol-d6
Nitrobenzene-d5
Fluorophenol
Fluorobiphenyl
S2112º 40.84 S
124º 30.78 E
2010021228
S2012º 40.78 S
124º 29.67 E
2010021227
S1912º 40.86 S
124º 28.67 E
2010021226
S1812º 41.93 S
124º 28.75 E
2010021225
S1712º 42.02 S
124º 29.64 E
2010021224
S1612º 42.03 S
124º 30.79 E
2010021223
S1512º 42.14 S
124º 31.92 E
2010021222
Matrix: Sediment
Method: Surrogate Recovery
Sample units are expressed in %
Analyte Name PQL
Client ID
Leeder ID
63
76
62
66
71
79
94
67
79
81
77
96
67
83
82
101
107
92
93
103
63
67
66
62
76
66
89
62
67
67
67
68
68
63
72p-Terphenyl-d14
Phenol-d6
Nitrobenzene-d5
Fluorophenol
Fluorobiphenyl
S2812º 39.75 S124º 35.1 E
2010021235
S2712º 39.66 S
124º 36.26 E
2010021234
S2612º 40.84 S124º 36.2 E
2010021233
S2512º 40.85 S124º 35.1 E
2010021232
S2412º 40.84 S
124º 34.03 E
2010021231
S2312º 40.87 S124º 32.9 E
2010021230
S2212º 40.9 S
124º 31.84 E
2010021229
Page 33 of 41
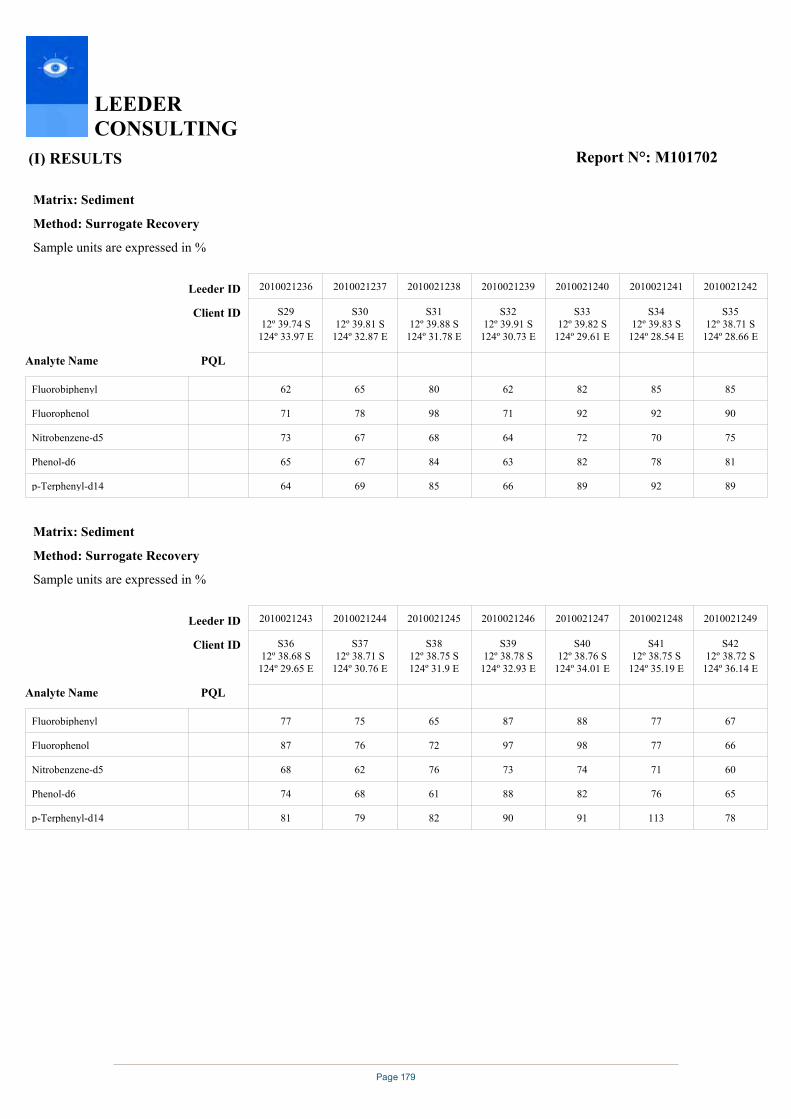
Page 179
(I) RESULTS
LEEDER CONSULTING
Report N°: M101702
Matrix: Sediment
Method: Surrogate Recovery
Sample units are expressed in %
Analyte Name PQL
Client ID
Leeder ID
62
71
73
65
64
65
78
67
67
69
80
98
68
84
85
62
71
64
63
66
82
92
72
82
89
85
92
70
78
92
85
90
75
81
89p-Terphenyl-d14
Phenol-d6
Nitrobenzene-d5
Fluorophenol
Fluorobiphenyl
S3512º 38.71 S
124º 28.66 E
2010021242
S3412º 39.83 S
124º 28.54 E
2010021241
S3312º 39.82 S
124º 29.61 E
2010021240
S3212º 39.91 S
124º 30.73 E
2010021239
S3112º 39.88 S
124º 31.78 E
2010021238
S3012º 39.81 S
124º 32.87 E
2010021237
S2912º 39.74 S
124º 33.97 E
2010021236
Matrix: Sediment
Method: Surrogate Recovery
Sample units are expressed in %
Analyte Name PQL
Client ID
Leeder ID
77
87
68
74
81
75
76
62
68
79
65
72
76
61
82
87
97
73
88
90
88
98
74
82
91
77
77
71
76
113
67
66
60
65
78p-Terphenyl-d14
Phenol-d6
Nitrobenzene-d5
Fluorophenol
Fluorobiphenyl
S4212º 38.72 S
124º 36.14 E
2010021249
S4112º 38.75 S
124º 35.19 E
2010021248
S4012º 38.76 S
124º 34.01 E
2010021247
S3912º 38.78 S
124º 32.93 E
2010021246
S3812º 38.75 S124º 31.9 E
2010021245
S3712º 38.71 S
124º 30.76 E
2010021244
S3612º 38.68 S
124º 29.65 E
2010021243
Page 34 of 41

Page 180
(I) RESULTS
LEEDER CONSULTING
Report N°: M101702
Matrix: Sediment
Method: Surrogate Recovery
Sample units are expressed in %
Analyte Name PQL
Client ID
Leeder ID
82
78
74
78
89
78
76
71
75
85
79
76
72
76
86
73
67
65
69
81
75
72
70
73
76
70
61
63
60
97
83
77
74
77
90p-Terphenyl-d14
Phenol-d6
Nitrobenzene-d5
Fluorophenol
Fluorobiphenyl
S4912º 36.66 S
124º 30.82 E
2010021256
S4812º 37.58 S
124º 29.67 E
2010021255
S4712º 37.54 S
124º 30.75 E
2010021254
S4612º 37.61 S
124º 31.93 E
2010021253
S4512º 37.66 S
124º 32.99 E
2010021252
S4412º 37.61 S
124º 34.07 E
2010021251
S4312º 37.61 S
124º 35.18 E
2010021250
Matrix: Sediment
Method: Surrogate Recovery
Sample units are expressed in %
Analyte Name PQL
Client ID
Leeder ID
86
76
71
77
109
69
64
61
65
77
74
70
66
69
91
76
72
66
70
93
67
71
60
70
77
71
61
62
60
74
91
83
79
82
109p-Terphenyl-d14
Phenol-d6
Nitrobenzene-d5
Fluorophenol
Fluorobiphenyl
Site 8
2010021263
Site 5
2010021262
Site 4
2010021261
Site 1
2010021260
S5212º 36.63 S
124º 33.92 E
2010021259
S5112º 36.56 S
124º 32.91 E
2010021258
S5012º 36.6 S
124º 31.92 E
2010021257
Page 35 of 41

Page 181
(I) RESULTS
LEEDER CONSULTING
Report N°: M101702
Matrix: Sediment
Method: Surrogate Recovery
Sample units are expressed in %
Analyte Name PQL
Client ID
Leeder ID
70
65
62
64
106p-Terphenyl-d14
Phenol-d6
Nitrobenzene-d5
Fluorophenol
Fluorobiphenyl
Site 9
2010021264
Matrix: Sediment
Method: Surrogate Recovery
Sample units are expressed in %
Analyte Name PQL
Client ID
Leeder ID
92
95
86
87
91p-Terphenyl-d14
Phenol-d6
Nitrobenzene-d5
Fluorophenol
Fluorobiphenyl
Duplicate
S112º 43.9 S
124º 34.04 E
2010021322
Page 36 of 41
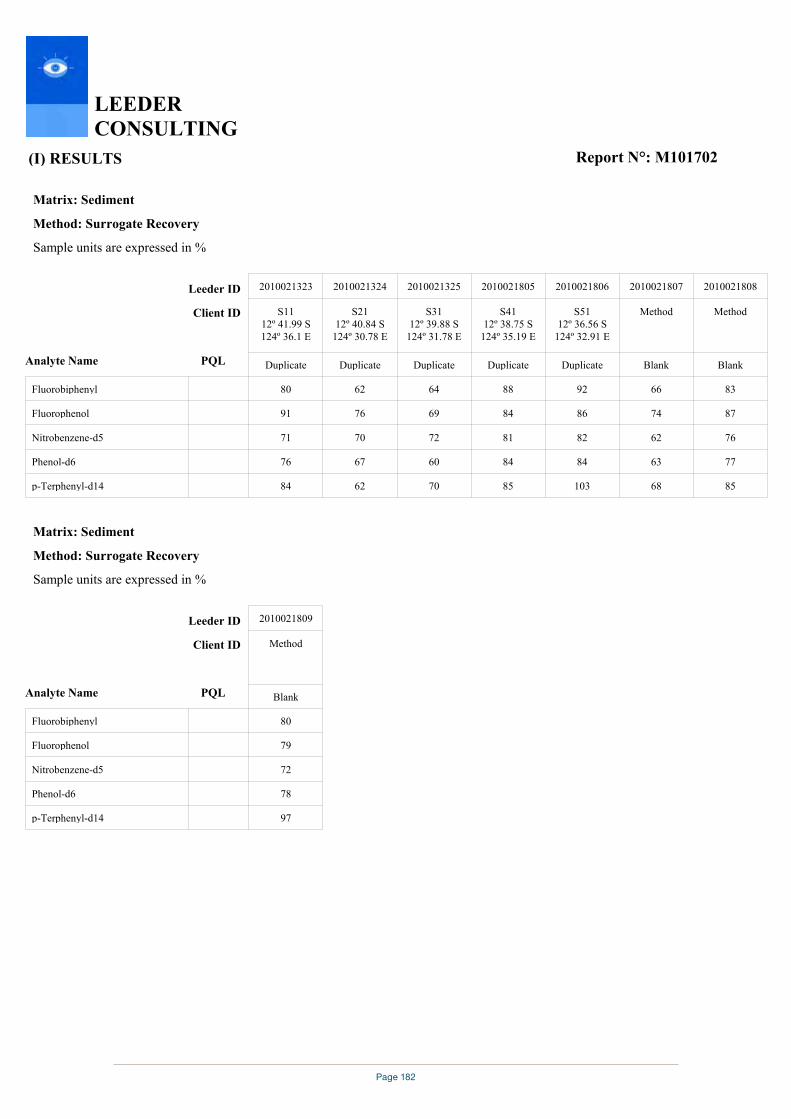
Page 182
(I) RESULTS
LEEDER CONSULTING
Report N°: M101702
Matrix: Sediment
Method: Surrogate Recovery
Sample units are expressed in %
Analyte Name PQL
Client ID
Leeder ID
80
91
71
76
84
62
76
70
67
62
64
69
72
60
70
88
84
81
84
85
92
86
82
84
103
66
74
62
63
68
83
87
76
77
85p-Terphenyl-d14
Phenol-d6
Nitrobenzene-d5
Fluorophenol
Fluorobiphenyl
Blank
Method
2010021808
Blank
Method
2010021807
Duplicate
S5112º 36.56 S
124º 32.91 E
2010021806
Duplicate
S4112º 38.75 S
124º 35.19 E
2010021805
Duplicate
S3112º 39.88 S
124º 31.78 E
2010021325
Duplicate
S2112º 40.84 S
124º 30.78 E
2010021324
Duplicate
S1112º 41.99 S124º 36.1 E
2010021323
Matrix: Sediment
Method: Surrogate Recovery
Sample units are expressed in %
Analyte Name PQL
Client ID
Leeder ID
80
79
72
78
97p-Terphenyl-d14
Phenol-d6
Nitrobenzene-d5
Fluorophenol
Fluorobiphenyl
Blank
Method
2010021809
Page 37 of 41

Page 183
(II) QUALITY CONTROL
LEEDER CONSULTING
Report N°: M101702
Matrix: Sediment
Method: MA-10.SD.01 Monoaromatic Hydrocarbons
Quality Control Results are expressed in Percent Recovery of expected result
Analyte Name PQL
Client ID
Leeder ID
79
86
83
82
79
98
75
80
109
83
76
96
90
96
74
83
101
78Toluene
Ethylbenzene
Benzene
Spike Dup
S4112º 38.75 S
124º 35.19 E
2010023118
Spike
S4112º 38.75 S
124º 35.19 E
2010023117
Spike Dup
S2112º 40.84 S
124º 30.78 E
2010023116
Spike
S2112º 40.84 S
124º 30.78 E
2010023115
Spike Dup
S112º 43.9 S
124º 34.04 E
2010021811
Spike
S112º 43.9 S
124º 34.04 E
2010021810
Matrix: Sediment
Method: MA-30.SD.01 Total Petroleum Hydrocarbons
Quality Control Results are expressed in Percent Recovery of expected result
Analyte Name PQL
Client ID
Leeder ID
109 90 95 111 92 110Total C6-C36
Spike Dup
S4112º 38.75 S
124º 35.19 E
2010023118
Spike
S4112º 38.75 S
124º 35.19 E
2010023117
Spike Dup
S2112º 40.84 S
124º 30.78 E
2010023116
Spike
S2112º 40.84 S
124º 30.78 E
2010023115
Spike Dup
S112º 43.9 S
124º 34.04 E
2010021811
Spike
S112º 43.9 S
124º 34.04 E
2010021810
Page 38 of 41
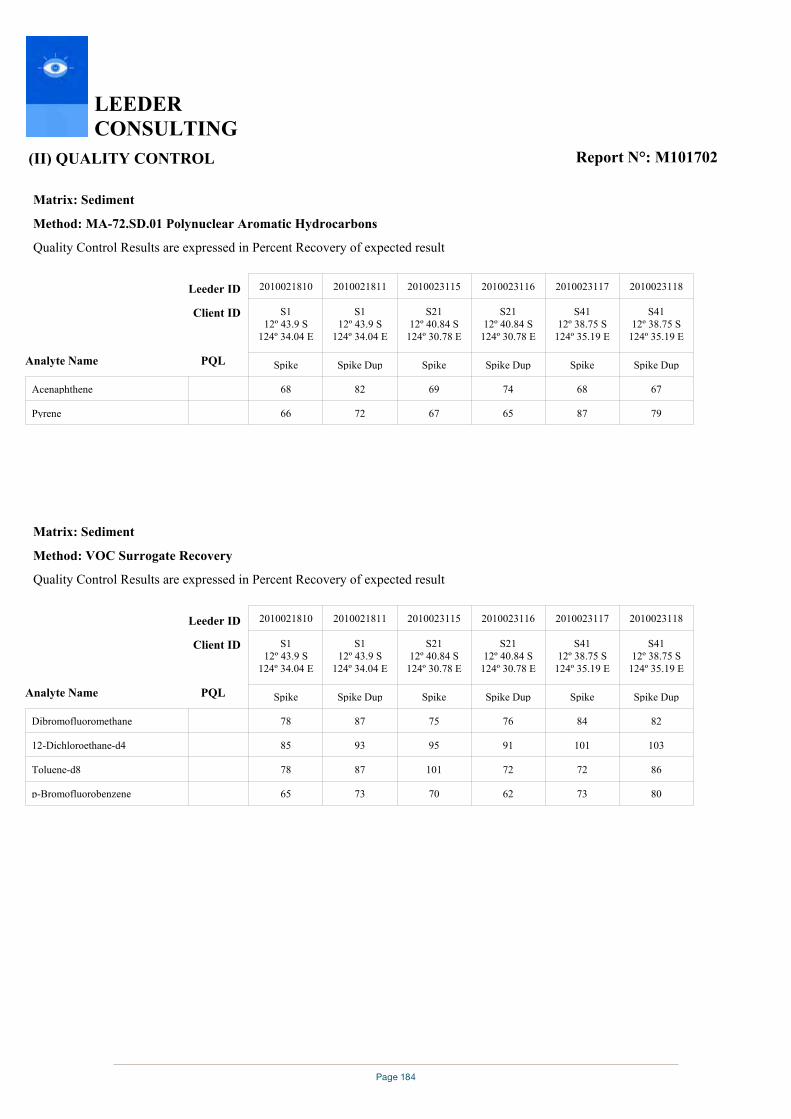
Page 184
(II) QUALITY CONTROL
LEEDER CONSULTING
Report N°: M101702
Matrix: Sediment
Method: MA-72.SD.01 Polynuclear Aromatic Hydrocarbons
Quality Control Results are expressed in Percent Recovery of expected result
Analyte Name PQL
Client ID
Leeder ID
68
66
82
72
69
67
74
65
68
87
67
79Pyrene
Acenaphthene
Spike Dup
S4112º 38.75 S
124º 35.19 E
2010023118
Spike
S4112º 38.75 S
124º 35.19 E
2010023117
Spike Dup
S2112º 40.84 S
124º 30.78 E
2010023116
Spike
S2112º 40.84 S
124º 30.78 E
2010023115
Spike Dup
S112º 43.9 S
124º 34.04 E
2010021811
Spike
S112º 43.9 S
124º 34.04 E
2010021810
Matrix: Sediment
Method: VOC Surrogate Recovery
Quality Control Results are expressed in Percent Recovery of expected result
Analyte Name PQL
Client ID
Leeder ID
78
85
78
65
87
93
87
73
75
95
101
70
76
91
72
62
84
101
72
73
82
103
86
80p-Bromofluorobenzene
Toluene-d8
12-Dichloroethane-d4
Dibromofluoromethane
Spike Dup
S4112º 38.75 S
124º 35.19 E
2010023118
Spike
S4112º 38.75 S
124º 35.19 E
2010023117
Spike Dup
S2112º 40.84 S
124º 30.78 E
2010023116
Spike
S2112º 40.84 S
124º 30.78 E
2010023115
Spike Dup
S112º 43.9 S
124º 34.04 E
2010021811
Spike
S112º 43.9 S
124º 34.04 E
2010021810
Page 39 of 41
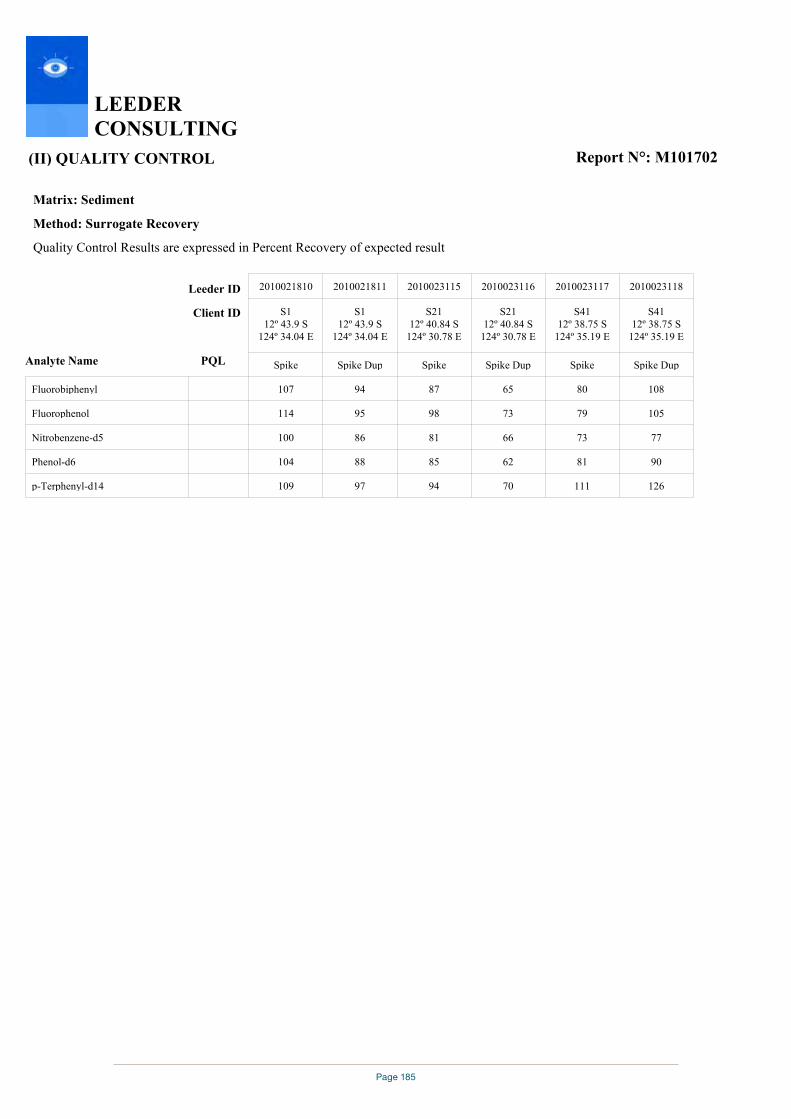
Page 185
(II) QUALITY CONTROL
LEEDER CONSULTING
Report N°: M101702
Matrix: Sediment
Method: Surrogate Recovery
Quality Control Results are expressed in Percent Recovery of expected result
Analyte Name PQL
Client ID
Leeder ID
107
114
100
104
109
94
95
86
88
97
87
98
81
85
94
65
73
66
62
70
80
79
73
81
111
108
105
77
90
126p-Terphenyl-d14
Phenol-d6
Nitrobenzene-d5
Fluorophenol
Fluorobiphenyl
Spike Dup
S4112º 38.75 S
124º 35.19 E
2010023118
Spike
S4112º 38.75 S
124º 35.19 E
2010023117
Spike Dup
S2112º 40.84 S
124º 30.78 E
2010023116
Spike
S2112º 40.84 S
124º 30.78 E
2010023115
Spike Dup
S112º 43.9 S
124º 34.04 E
2010021811
Spike
S112º 43.9 S
124º 34.04 E
2010021810
Page 40 of 41
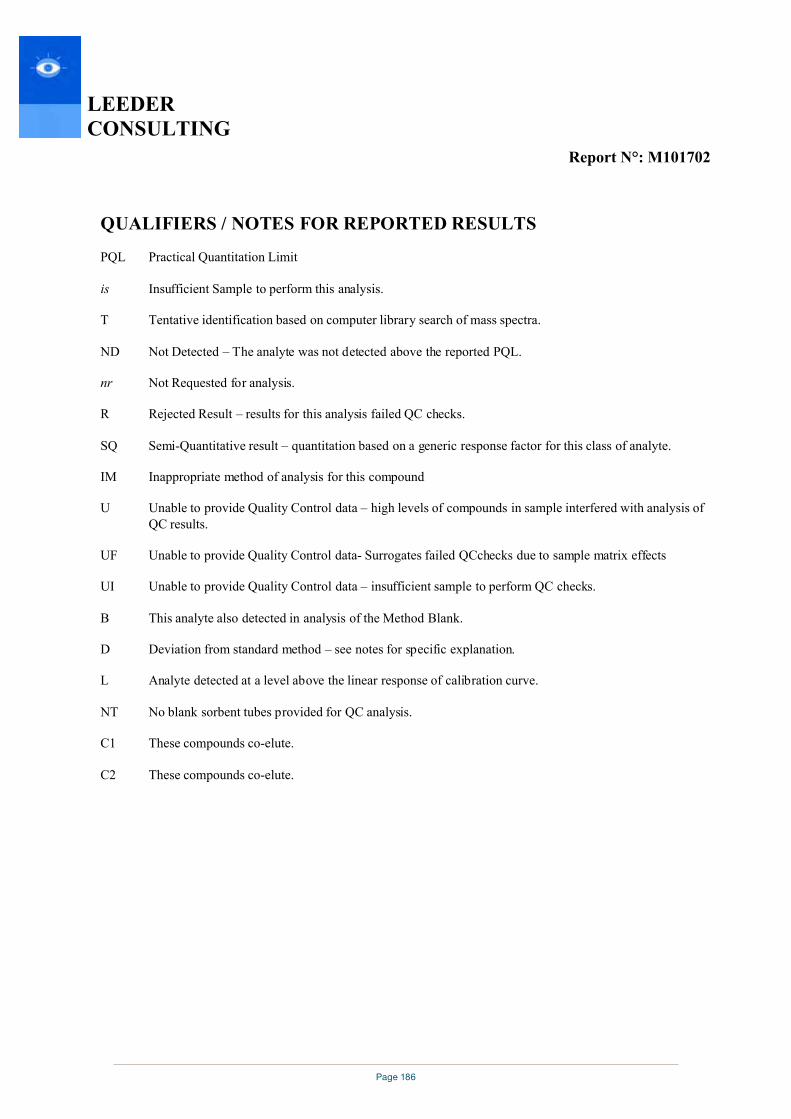
Page 186
LEEDER CONSULTING
Report N°: M101702
QUALIFIERS / NOTES FOR REPORTED RESULTS
PQL Practical Quantitation Limit
is Insufficient Sample to perform this analysis.
T Tentative identification based on computer library search of mass spectra.
ND Not Detected – The analyte was not detected above the reported PQL.
nr Not Requested for analysis.
R Rejected Result – results for this analysis failed QC checks.
SQ Semi-Quantitative result – quantitation based on a generic response factor for this class of analyte.
IM Inappropriate method of analysis for this compound
U Unable to provide Quality Control data – high levels of compounds in sample interfered with analysis of QC results.
UF Unable to provide Quality Control data- Surrogates failed QCchecks due to sample matrix effects
UI Unable to provide Quality Control data – insufficient sample to perform QC checks.
B This analyte also detected in analysis of the Method Blank.
D Deviation from standard method – see notes for specific explanation.
L Analyte detected at a level above the linear response of calibration curve.
NT No blank sorbent tubes provided for QC analysis.
C1 These compounds co-elute.
C2 These compounds co-elute.
Page 41 of 41

Page 187
LEEDER CONSULTING
APPENDIX ONE.
CHAIN OF CUSTODY DOCUMENT

Page 188
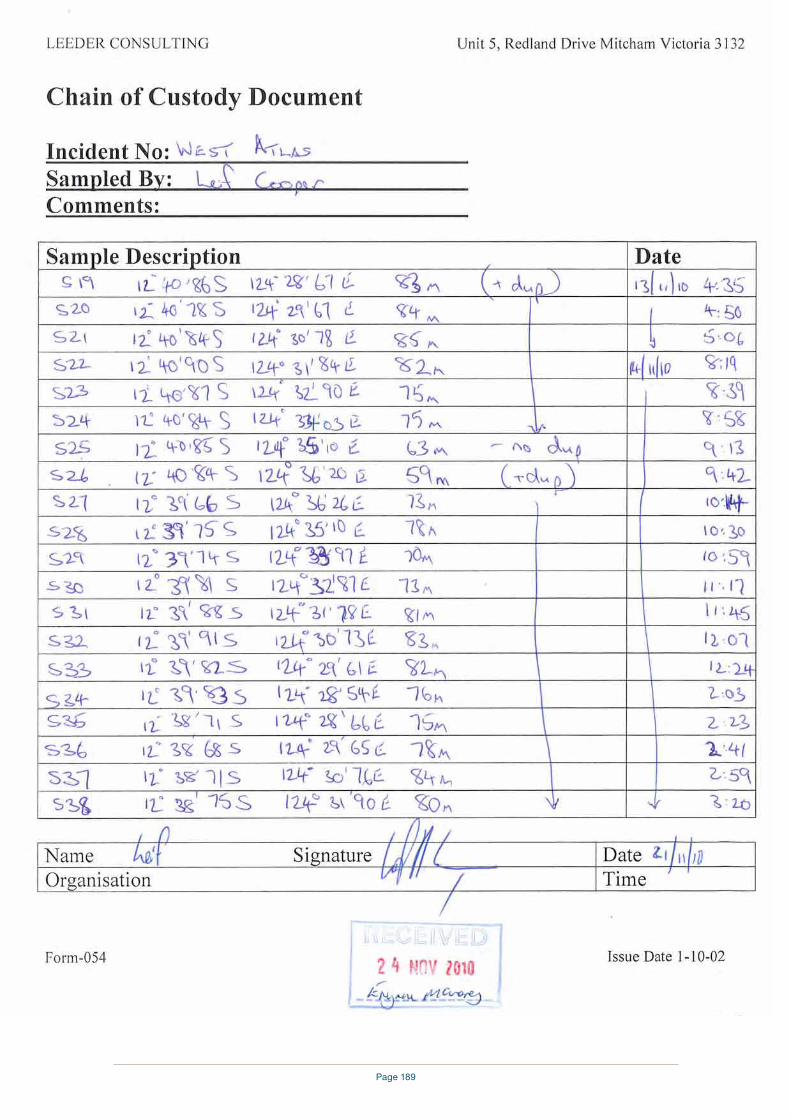
Page 189
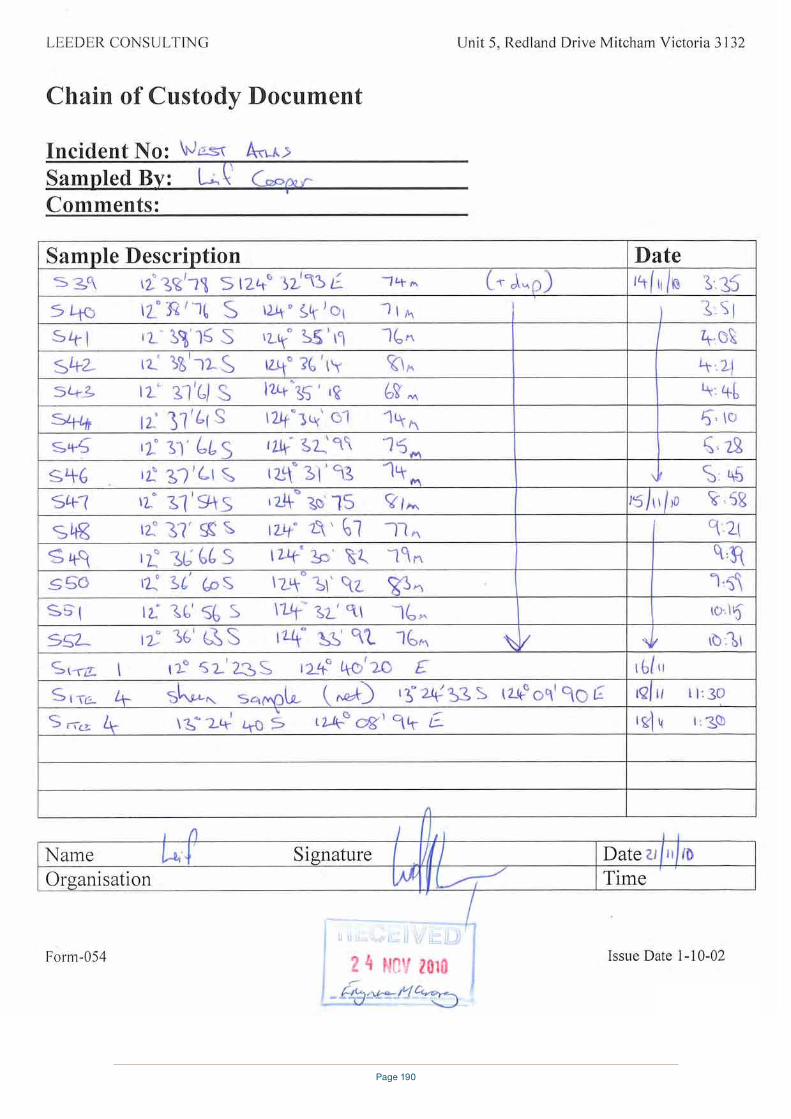
Page 190
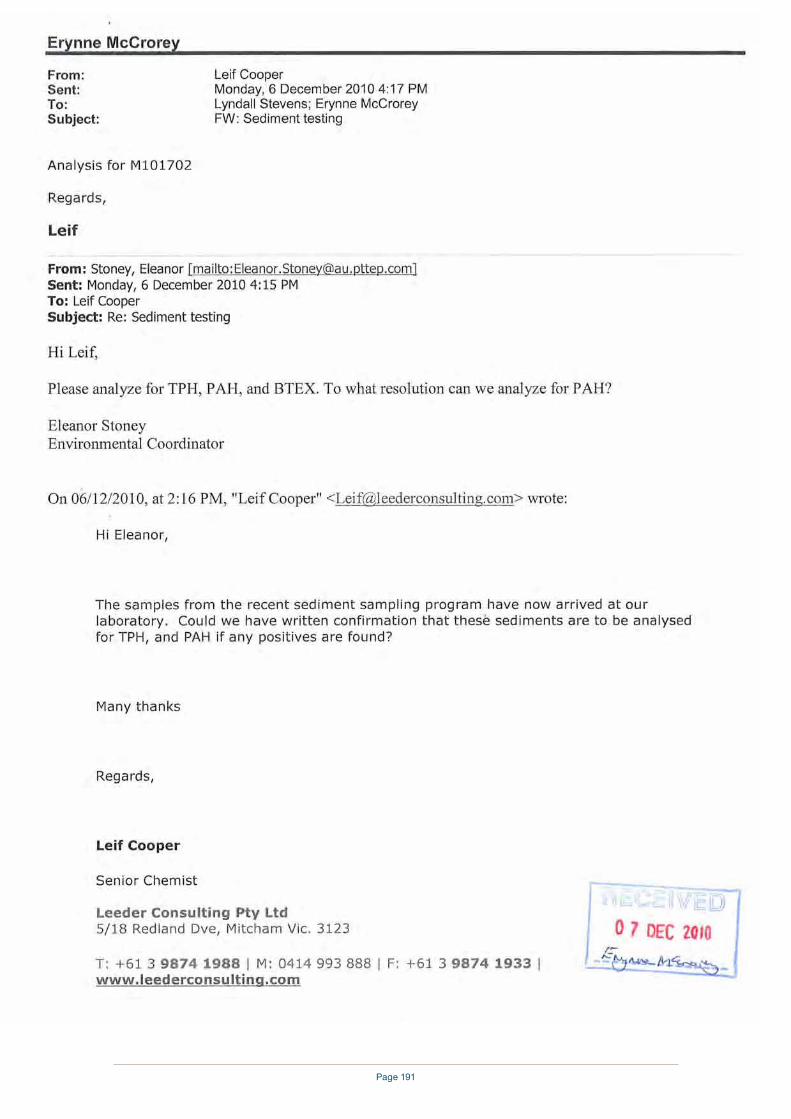
Page 191