monte carlo simulation of pt-al thin j film diffusion · physical vapour deposition ... monte carlo...
TRANSCRIPT
Journal
Paper
Introduction
The concept of utilizing platinum, and theother platinum group metals as alloys andalloying constituents has been shown toenhance the oxidation and corrosion resistanceproperties of nickel-based super alloys. Forthis reason platinum-enriched and platinum-based alloys are being studied and developedfor certain industrial and aerospaceapplications2. This is done by increasingefforts to tailor alloys with specificcombinations of properties. These alloys havemuch to offer in industrial applications wherecorrosion resistance in high temperatureenvironments is an important materialsselection criterion. Application fields such ascoal conversion and combustion, combustionand the petrochemical areas, suggest potentialcandidates. For this reason the study of thediffusion process that governs a Pt-basedbinary alloy (in a thin film system) isinvestigated. The aim of this study is toprovide a better understanding of this processthrough computer simulations in order todesign alloys with specific combinations ofproperties.
Theory
The regular solution model is a statisticalmodel which is based on the following threeassumptions:
➤ Atoms are randomly distributed overpositions in a three-dimensional lattice
➤ No vacancies exist➤ The energy of the system may be
expressed as the sum of pairwiseinteractions between neighbouringatoms.
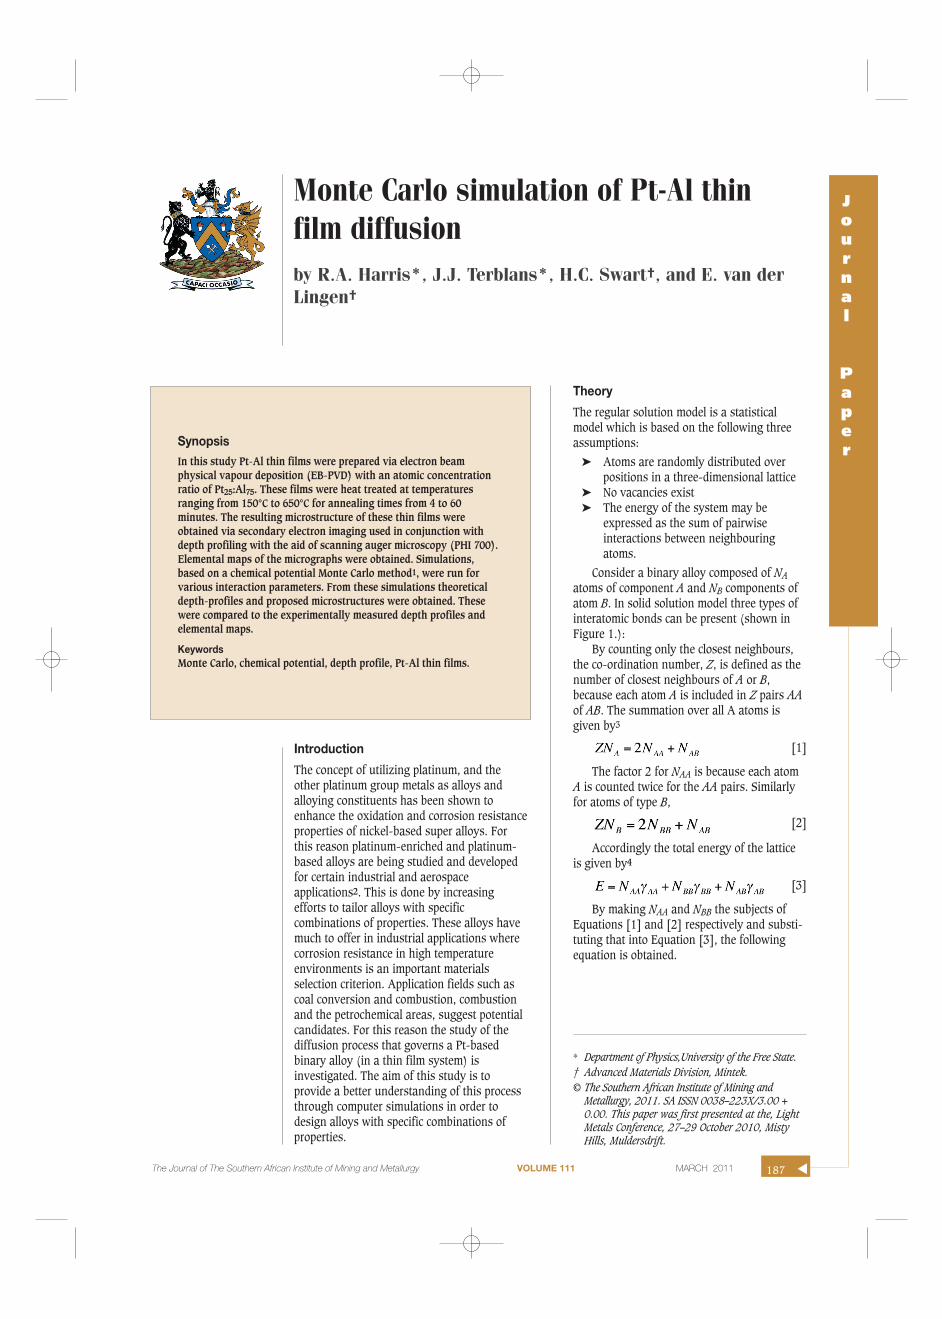
Consider a binary alloy composed of NAatoms of component A and NB components ofatom B. In solid solution model three types ofinteratomic bonds can be present (shown inFigure 1.):
By counting only the closest neighbours,the co-ordination number, Z, is defined as thenumber of closest neighbours of A or B,because each atom A is included in Z pairs AAof AB. The summation over all A atoms isgiven by3
[1]
The factor 2 for NAA is because each atomA is counted twice for the AA pairs. Similarlyfor atoms of type B,
[2]
Accordingly the total energy of the latticeis given by4
[3]
By making NAA and NBB the subjects ofEquations [1] and [2] respectively and substi-tuting that into Equation [3], the followingequation is obtained.
Monte Carlo simulation of Pt-Al thinfilm diffusionby R.A. Harris*, J.J. Terblans*, H.C. Swart†, and E. van derLingen†
SynopsisIn this study Pt-Al thin films were prepared via electron beamphysical vapour deposition (EB-PVD) with an atomic concentrationratio of Pt25:Al75. These films were heat treated at temperaturesranging from 150°C to 650°C for annealing times from 4 to 60minutes. The resulting microstructure of these thin films wereobtained via secondary electron imaging used in conjunction withdepth profiling with the aid of scanning auger microscopy (PHI 700).Elemental maps of the micrographs were obtained. Simulations,based on a chemical potential Monte Carlo method1, were run forvarious interaction parameters. From these simulations theoreticaldepth-profiles and proposed microstructures were obtained. Thesewere compared to the experimentally measured depth profiles andelemental maps.
KeywordsMonte Carlo, chemical potential, depth profile, Pt-Al thin films.
* Department of Physics,University of the Free State.† Advanced Materials Division, Mintek.© The Southern African Institute of Mining and
Metallurgy, 2011. SA ISSN 0038–223X/3.00 +0.00. This paper was first presented at the, LightMetals Conference, 27–29 October 2010, MistyHills, Muldersdrift.
187The Journal of The Southern African Institute of Mining and Metallurgy VOLUME 111 MARCH 2011 ▲
Monte Carlo simulation of Pt-Al thin film diffusion
[4]
Through Equation [4] it is seen that the expression 12
ZNA represents the total number of AA pairs in the pure
solution of A before any mixing with component B. The
expression 12
ZNAγAA therefore represents the total energy
EA of the NA atoms of component A before mixing5. The sameargument holds for element B. The expression for the totalenergy may thus be written as:
[5]
If a parameter ωAB is defined as the difference betweenthe A-B bond energy and the average of the A-A and B-Bbond energies then an expression
[6]
can be derived.This can be expressed in terms of the molar Gibbs free
energy of a binary system
[7]
with GP the Gibbs free energy for phase p, nip the number of
moles of species i in phase p, and μip the chemical potential of
species i in phase p. By minimizing this energy, the latticestate at equilibrium can be calculated and simulated byallowing for diffusion from initial, high energy state to final,low energy state. The detail of the Monte Carlo technique hasalready been published elsewhere1.
Experimental setup
Pt-Al thin films (Pt25:Al75) were prepared using electronbeam-physical vapour deposition. These films were heattreated with temperatures ranging from 150°C to 650°C. Thiswas done for annealing times ranging from 4 to 60 minutes.Elemental maps and depth profiles were obtained with a PHI700 nanoprobe. Simulations were run using the abovementioned model applied in a Monte Carlo technique1 byusing temperatures of 150°C to 650°C and compositions of Pt25 at.% and Al 75 at.% as input parameters. Theoreticaldepth-profiles and microstructures, in the form of elementalmaps where obtained from the simulations.
Results and discussion
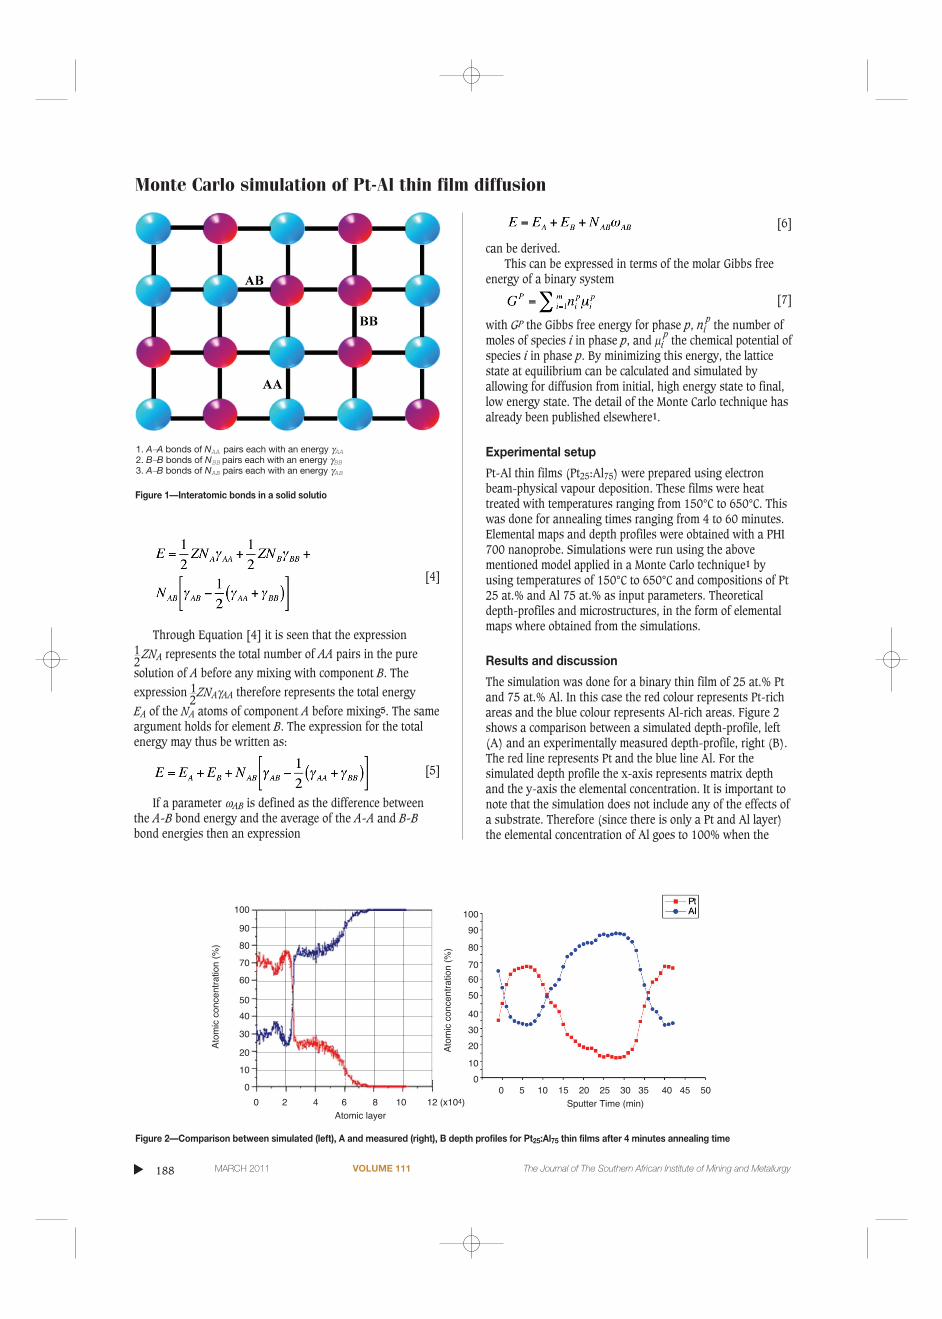
The simulation was done for a binary thin film of 25 at.% Ptand 75 at.% Al. In this case the red colour represents Pt-richareas and the blue colour represents Al-rich areas. Figure 2shows a comparison between a simulated depth-profile, left(A) and an experimentally measured depth-profile, right (B).The red line represents Pt and the blue line Al. For thesimulated depth profile the x-axis represents matrix depthand the y-axis the elemental concentration. It is important tonote that the simulation does not include any of the effects ofa substrate. Therefore (since there is only a Pt and Al layer)the elemental concentration of Al goes to 100% when the
▲
188 MARCH 2011 VOLUME 111 The Journal of The Southern African Institute of Mining and Metallurgy
Figure 1—Interatomic bonds in a solid solutio
1. A—A bonds of NAA pairs each with an energy γAA2. B—B bonds of NBB pairs each with an energy γBB3. A—B bonds of NAB pairs each with an energy γAB
Figure 2—Comparison between simulated (left), A and measured (right), B depth profiles for Pt25:Al75 thin films after 4 minutes annealing time
100
90
80
70
60
50
40
30
20
10
0
0 2 4 6 8 10 12 (x104)Atomic layer
Ato
mic
con
cent
ratio
n (%
)
100
90
80
70
60
50
40
30
20
10
00 5 10 15 20 25 30 35 40 45 50
Sputter Time (min)
Ato
mic
con
cent
ratio
n (%
)
depth-profile at the bottom of the matrix is calculated.Likewise the Pt concentration goes to 0% when the depth-profile at the bottom of the matrix is calculated. By comparingthe general shape of the predicted depth-profile with themeasured one, it is noteworthy that although the predictedand measured results do not correlate perfectly, a similartrend can clearly be seen. In both cases (the simulation andthe experiment) the top Pt layer has a concentration of about70 at.%. Thereafter it crosses over to about 25 to 20 at.%. Pt.At this point in the thin-film system the Al concentration hasincreased to about 75 to 80 at.%. It should be stressed thatthis is not an absolute comparison but rather the generaltrend of the depth-profile.
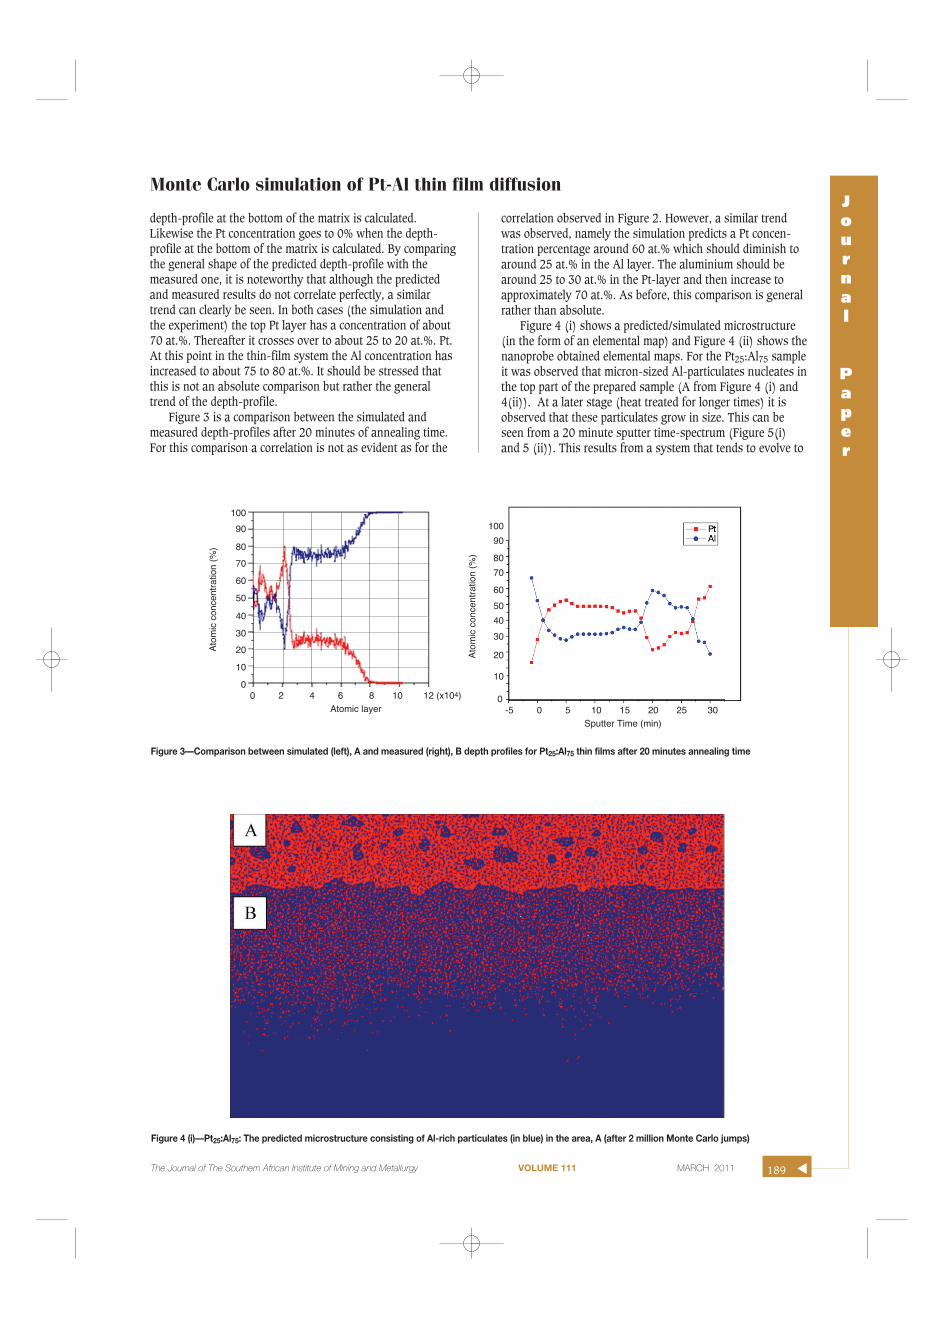
Figure 3 is a comparison between the simulated andmeasured depth-profiles after 20 minutes of annealing time.For this comparison a correlation is not as evident as for the
correlation observed in Figure 2. However, a similar trendwas observed, namely the simulation predicts a Pt concen-tration percentage around 60 at.% which should diminish toaround 25 at.% in the Al layer. The aluminium should bearound 25 to 30 at.% in the Pt-layer and then increase toapproximately 70 at.%. As before, this comparison is generalrather than absolute.
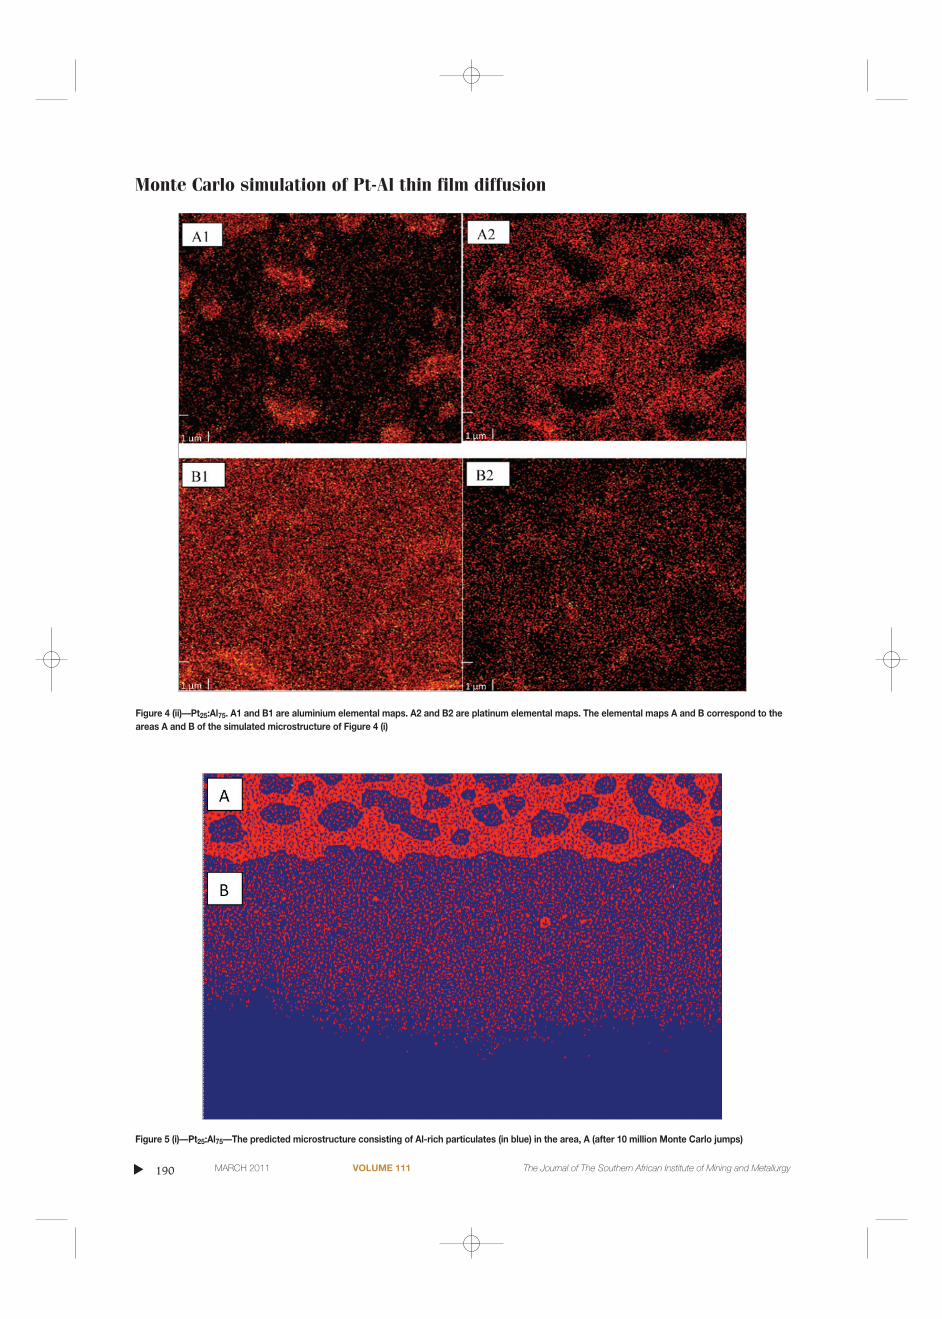
Figure 4 (i) shows a predicted/simulated microstructure(in the form of an elemental map) and Figure 4 (ii) shows thenanoprobe obtained elemental maps. For the Pt25:Al75 sampleit was observed that micron-sized Al-particulates nucleates inthe top part of the prepared sample (A from Figure 4 (i) and4(ii)). At a later stage (heat treated for longer times) it isobserved that these particulates grow in size. This can beseen from a 20 minute sputter time-spectrum (Figure 5(i)and 5 (ii)). This results from a system that tends to evolve to
Monte Carlo simulation of Pt-Al thin film diffusionJournal
Paper
189The Journal of The Southern African Institute of Mining and Metallurgy VOLUME 111 MARCH 2011 ▲
Figure 3—Comparison between simulated (left), A and measured (right), B depth profiles for Pt25:Al75 thin films after 20 minutes annealing time
Figure 4 (i)—Pt25:Al75: The predicted microstructure consisting of Al-rich particulates (in blue) in the area, A (after 2 million Monte Carlo jumps)
100
90
80
70
60
50
40
30
20
10
00 2 4 6 8 10 12 (x104)
Atomic layer
Ato
mic
con
cent
ratio
n (%
)
100
90
80
70
60
50
40
30
20
10
0-5 0 5 10 15 20 25 30
Sputter Time (min)
Ato
mic
con
cent
ratio
n (%
)
Monte Carlo simulation of Pt-Al thin film diffusion
▲
190 MARCH 2011 VOLUME 111 The Journal of The Southern African Institute of Mining and Metallurgy
Figure 5 (i)—Pt25:Al75—The predicted microstructure consisting of Al-rich particulates (in blue) in the area, A (after 10 million Monte Carlo jumps)
Figure 4 (ii)—Pt25:Al75. A1 and B1 are aluminium elemental maps. A2 and B2 are platinum elemental maps. The elemental maps A and B correspond to theareas A and B of the simulated microstructure of Figure 4 (i)
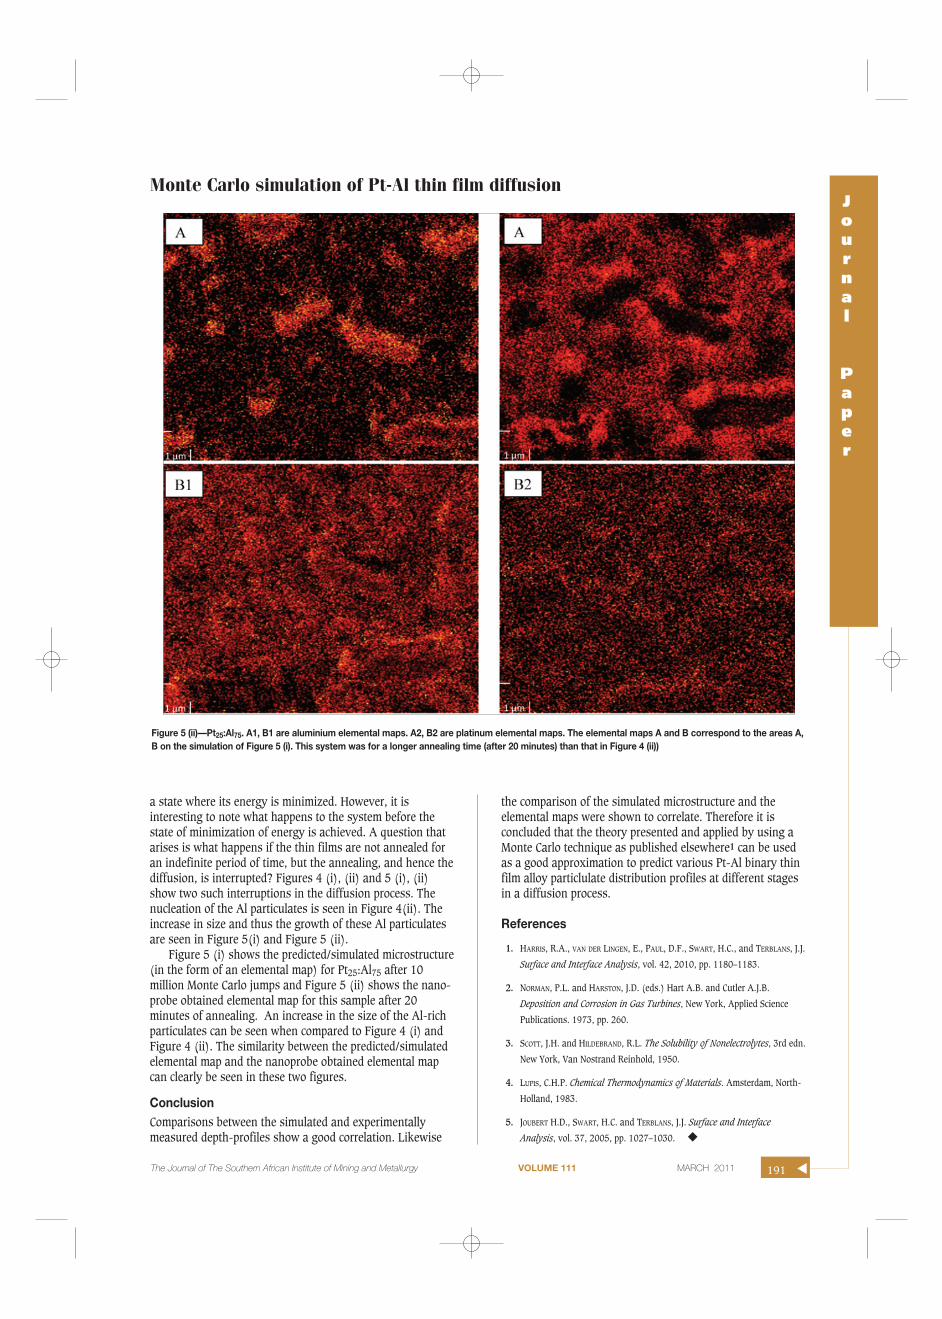
a state where its energy is minimized. However, it isinteresting to note what happens to the system before thestate of minimization of energy is achieved. A question thatarises is what happens if the thin films are not annealed foran indefinite period of time, but the annealing, and hence thediffusion, is interrupted? Figures 4 (i), (ii) and 5 (i), (ii)show two such interruptions in the diffusion process. Thenucleation of the Al particulates is seen in Figure 4(ii). Theincrease in size and thus the growth of these Al particulatesare seen in Figure 5(i) and Figure 5 (ii).
Figure 5 (i) shows the predicted/simulated microstructure(in the form of an elemental map) for Pt25:Al75 after 10million Monte Carlo jumps and Figure 5 (ii) shows the nano-probe obtained elemental map for this sample after 20minutes of annealing. An increase in the size of the Al-richparticulates can be seen when compared to Figure 4 (i) andFigure 4 (ii). The similarity between the predicted/simulatedelemental map and the nanoprobe obtained elemental mapcan clearly be seen in these two figures.
ConclusionComparisons between the simulated and experimentallymeasured depth-profiles show a good correlation. Likewise
the comparison of the simulated microstructure and theelemental maps were shown to correlate. Therefore it isconcluded that the theory presented and applied by using aMonte Carlo technique as published elsewhere1 can be usedas a good approximation to predict various Pt-Al binary thinfilm alloy particlulate distribution profiles at different stagesin a diffusion process.
References
1. HARRIS, R.A., VAN DER LINGEN, E., PAUL, D.F., SWART, H.C., and TERBLANS, J.J.
Surface and Interface Analysis, vol. 42, 2010, pp. 1180–1183.
2. NORMAN, P.L. and HARSTON, J.D. (eds.) Hart A.B. and Cutler A.J.B.
Deposition and Corrosion in Gas Turbines, New York, Applied Science
Publications. 1973, pp. 260.
3. SCOTT, J.H. and HILDEBRAND, R.L. The Solubility of Nonelectrolytes, 3rd edn.
New York, Van Nostrand Reinhold, 1950.
4. LUPIS, C.H.P. Chemical Thermodynamics of Materials. Amsterdam, North-
Holland, 1983.
5. JOUBERT H.D., SWART, H.C. and TERBLANS, J.J. Surface and Interface
Analysis, vol. 37, 2005, pp. 1027–1030. ◆
Monte Carlo simulation of Pt-Al thin film diffusionJournal
Paper
The Journal of The Southern African Institute of Mining and Metallurgy VOLUME 111 MARCH 2011 191 ▲
Figure 5 (ii)—Pt25:Al75. A1, B1 are aluminium elemental maps. A2, B2 are platinum elemental maps. The elemental maps A and B correspond to the areas A,B on the simulation of Figure 5 (i). This system was for a longer annealing time (after 20 minutes) than that in Figure 4 (ii))