monthly report of river and flood conditions april 2020
TRANSCRIPT
NWS FORM E-5 U.S. DEPARTMENT OF COMMERCE HYDROLOGIC SERVICE AREA (HSA) (11-88) NATIONAL OCEANIC AND ATMOSPHERIC ADMINISTRATION
(PRES. by NWS Instruction 10-924) NATIONAL WEATHER SERVICE Tulsa, Oklahoma (TSA) REPORT FOR:
MONTHLY REPORT OF RIVER AND FLOOD CONDITIONS MONTH YEAR
April 2020 SIGNATURE
TO: Hydrometeorological Information Center, W/OH2 Steven F. Piltz NOAA / National Weather Service (Meteorologist-in-Charge)
1325 East West Highway, Room 7230 Silver Spring, MD 20910-3283 DATE
May 4, 2020 When no flooding occurs, include miscellaneous river conditions, such as significant rises, record low stages, ice conditions, snow cover, droughts, and hydrologic products issued (NWS Instruction 10-924) An “X” in the box indicates no flood stages were reached in this Hydrologic Service Area (HSA) during the month above.
It was a typical April this year, with severe thunderstorms, tornadoes, and flooding. Some minor river flooding occurred during April 2020. Overall, temperatures were near to below normal, with some areas receiving below normal rainfall and others receiving above normal rainfall. Normal precipitation for the month of April ranges from 3.1 inches in Pawnee County to 4.7 inches in Latimer County. The Ozark region of northwest Arkansas averages 4.3 inches for the month. This report, past E-5 reports, and monthly hydrology and climatology summaries can be found at http://www.weather.gov/tsa/hydro-monthly-summary.
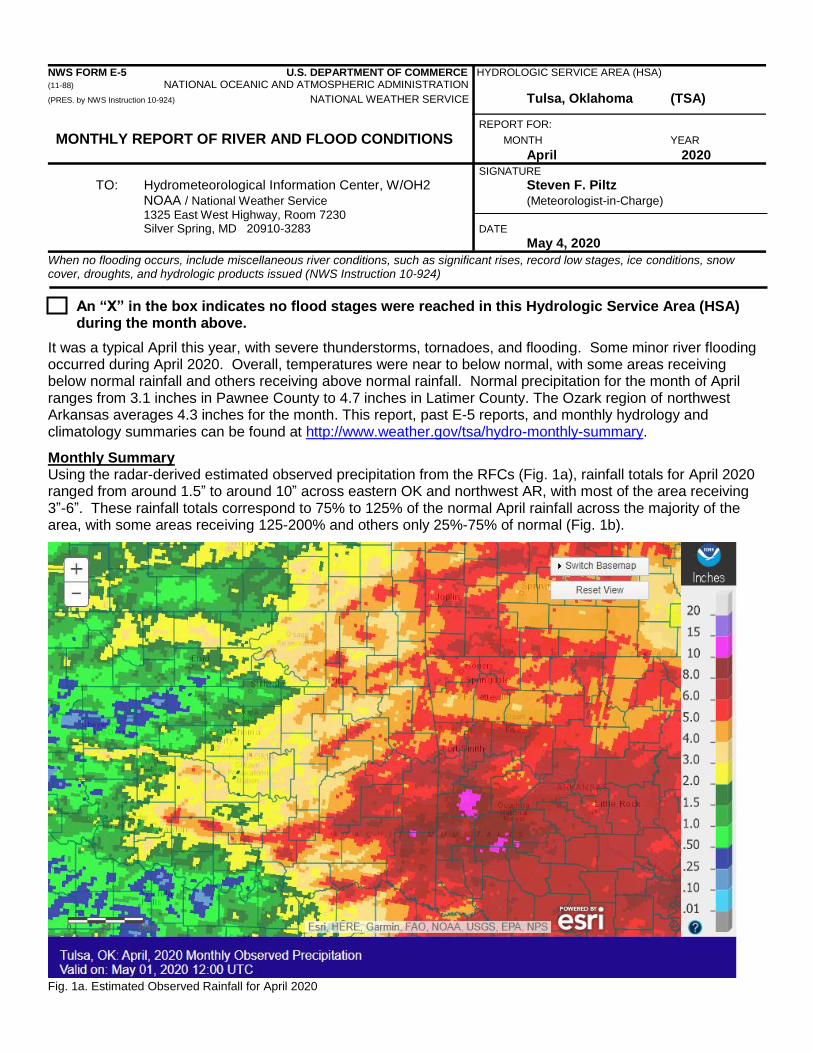
Monthly Summary Using the radar-derived estimated observed precipitation from the RFCs (Fig. 1a), rainfall totals for April 2020 ranged from around 1.5” to around 10” across eastern OK and northwest AR, with most of the area receiving 3”-6”. These rainfall totals correspond to 75% to 125% of the normal April rainfall across the majority of the area, with some areas receiving 125-200% and others only 25%-75% of normal (Fig. 1b).
Fig. 1a. Estimated Observed Rainfall for April 2020

Fig. 1b. Estimated % of Normal Rainfall for April 2020
In Tulsa, OK, April 2020 ranked as the 41st coldest April (59.3°F, tied 1982, 1968; since records began in 1905), the 43rd wettest April (4.91”; since records began in 1888), and the 5th snowiest April (Trace, tied 18 other years; since records began in 1900). Fort Smith, AR had the 30th coldest April (59.8°F, tied 1996, 1935, 1898; since records began in 1883) and the 29th wettest April (6.46”; since records began in 1883). Fayetteville, AR had the 32nd coldest (57.1°F, tied 1968), the 36th wettest and driest (4.00”), and the 3rd snowiest (Trace) April since records began in 1950.
Some of the larger precipitation reports (in inches) for April 2020 included: Clayton, OK (meso) 9.01 Greenwood 1.4W, AR (coco) 7.47 Charleston 1.7E, AR (coco) 7.26 Riverdale 4.2E, AR (coco) 6.93 Wilburton, OK (meso) 6.88 Hindsville 10NNE, AR (coop) 6.52 Fort Smith, AR (ASOS) 6.46 Van Buren 0.7SSE, AR (coco) 6.42 Ozark, AR (coop) 6.41
Some of the lowest precipitation reports (in inches) for April 2020 included:
Oilton, OK (meso) 1.78 Burbank, OK (meso) 2.52 Pawnee, OK (meso) 2.58 Eufaula, OK (meso) 3.02 Porter, OK (meso) 3.07 Foraker, OK (meso) 3.24 Haskell, OK (meso) 3.42 Okemah, OK (meso) 3.45 Bixby, OK (meso) 3.52
According to statistics from the Oklahoma Climatological Survey (OCS) Mesonet: Rank since
1921
April 2020
Spring-to-Date
(Mar 1 – Apr 30)
Last 90 Days
(Feb 1 – Apr 30)
Year-to-Date
(Jan 1 – Apr 30)
Water Year-to-Date
(Oct 1 – Apr 30)
Last 180 Days
(Nov 3 – Apr 30)
Last 365 Days (May 2, 2019 – Apr 30, 2020)
Northeast OK
46th wettest
16th wettest
15th wettest
8th
wettest
6th
wettest
9th
wettest
1st
wettest
East Central OK
43rd wettest
10th
wettest
11th wettest
6th
wettest
4th
wettest
8th
wettest
3rd
wettest
Southeast OK
28th wettest
12th wettest
12th wettest
7th
wettest
5th
wettest
17th wettest
4th
wettest
Statewide 36th
driest 21st
wettest 20th
wettest 12th
wettest 13th
wettest 19th
wettest 2nd
wettest


Reservoirs
According to the USACE, most of the lakes in the HSA were utilizing a little more than 3% of their flood control pools as of 5/01/2020: Beaver Lake 91%, Tenkiller Lake 7%, Ft. Gibson Lake 11%, Eufaula Lake 8%, Oologah Lake 11%, Copan Lake 7%, Kaw Lake 4%, Keystone Lake 4%, Grand Lake 23%, Skiatook Lake 6%, Hugo Lake 4%, and Sardis Lake 5%.

Drought According to the U.S. Drought Monitor (USDM) from April 28, 2020 (Figs. 2, 3), eastern OK and northwest AR were drought free.
Fig. 2. Drought Monitor for Oklahoma
Fig. 3. Drought Monitor for Arkansas

Outlooks The Climate Prediction Center (CPC) outlook for May 2020 (issued April 30, 2020) indicates an equal chance for above, near, and below normal temperatures across far northeast OK and far northwest AR and a slightly enhanced chance for above normal temperatures across the remainder of eastern OK and west central AR. This outlook also indicates an enhanced chance for above median precipitation across all of eastern OK and northwest AR. This outlook takes into account dynamical model guidance, the weeks 3-4 outlook, and current soil moisture. From CPC, “dynamical model forecasts are in excellent agreement for this time of year and feature a high amplitude ridge (trough) over western (eastern) North America during the first two weeks of May. This highly amplified ridge aloft increases chances of above normal temperatures throughout the West extending to the central and southern Great Plains. The slightly elevated chances of above normal precipitation, centered across the Ozarks to the middle Mississippi Valley, is associated with predicted rainfall at the beginning of the month.” For the 3-month period May-June-July 2020, CPC is forecasting an enhanced chance for above normal temperatures and above median precipitation across all of northeast OK and northwest AR (outlook issued April 16, 2020). This outlook is based on both statistical and dynamical forecast tools and decadal timescale climate trends. According to CPC, the combined effect of the ocean-atmosphere system is consistent with ENSO neutral conditions. The forecast is for ENSO neutral conditions to continue through Autumn 2020.
Summary of Heavy Precipitation Events Daily quality-controlled rainfall maps can be found at: http://water.weather.gov/precip/index.php?location_type=wfo&location_name=tsa Elevated instability, ahead of a cold front, resulted in isolated showers and thunderstorms across southeast OK and west central AR during the afternoon and evening hours of the 2nd. By midnight, warm air advection increased over the region, and additional showers and thunderstorms developed over east central and southeast OK and northwest and west central AR. This activity slowly shifted east through the overnight and early morning hours, exiting the area a little after sunrise on the 3rd. Rainfall totals were highest across east central OK, west central AR, and portions of northwest AR, where around 0.50” to around 2.5” were observed (Fig. 4). This rainfall resulted in minor flooding along the Poteau River near Panama and the Arkansas River at Van Buren and at Ozark L&D (see preliminary hydrographs at the end of this report and the E3 Report for details). The strong arctic cold front continued to move southeast across the area during the day on the 3rd. Additional showers and thunderstorms developed both ahead of and behind the front around sunrise, and this activity continued through mid-evening. Temperatures in Osage County fell below freezing, where some post-frontal freezing drizzle occurred. Additional rainfall amounts ranged from around 0.25” to near 1” (Fig. 5). A cutoff low over the desert Southwest was slowly making its way east, ahead of a longwave trough, on the 11th. During the afternoon hours, showers and thunderstorms moved north out of TX into southeast OK and west central AR. By early evening, additional storms moved east out of south central OK into southeast OK and west central AR. This activity impacted locations along and south of I-40 through mid-evening, before expanding further north. A more intense line of showers and thunderstorms moved east out of central OK just before midnight. The line moved quickly east across eastern OK and northwest AR, mainly southeast of I-44, before exiting the area by 4 am on the 12th. Rainfall totals ranged from around 0.50” to around 1.5” (Fig. 6). The main trough then dropped into the Plains, with widespread convection across southern OK and central TX. These storms moved northeast into eastern OK and northwest AR around sunrise on the 12th and exited the area by noon. A cold front then moved southeast into the region, with showers and thunderstorms developing along it during the early afternoon. These storms formed a line, which then continued eastward across much of eastern OK and western AR through the mid-evening hours. Once again, around 0.50” to around 1.5” of rain fell near and southeast of I-44 (Fig. 7). The two days of rain resulted in rises along some rivers, with minor flooding occurring along the Poteau River near Panama (see preliminary hydrographs at the end of this report and the E3 Report for details). Scattered showers and thunderstorms moved across northeast OK and northwest AR during the morning of the 19th within an area of warm air advection. During the afternoon, thunderstorms developed over southeast OK and west central AR in the vicinity of a surface low and attendant warm front. These storms quickly moved southeast of the area, coming to an end by late afternoon. While most places that saw rain received around 0.25” or less, areas of far southeast OK and west central AR received 0.50” to around 1.50” of rain (Fig. 8).

Fig. 4. 24-hour Estimated Observed Rainfall ending at 7am CDT 4/03/2020.
Fig. 5. 24-hour Estimated Observed Rainfall ending at 7am CDT 4/04/2020.

Fig. 6. 24-hour Estimated Observed Rainfall ending at 7am CDT 4/12/2020.
Fig. 7. 24-hour Estimated Observed Rainfall ending at 7am CDT 4/13/2020.

Fig. 8. 24-hour Estimated Observed Rainfall ending at 7am CDT 4/20/2020.
Fig. 9. 24-hour Estimated Observed Rainfall ending at 7am CDT 4/22/2020.

Fig. 10. OK Mesonet (values) and NWS RFC rainfall estimate (image) 24-hour rainfall ending at 7:35 am CDT 4/22/2020.
Fig. 11. OK Mesonet (values) and NWS RFC rainfall estimate (image) 24-hour rainfall ending at 9:35 pm CDT 4/22/2020.

Fig. 12. 24-hour Estimated Observed Rainfall ending at 7am CDT 4/23/2020.
Fig. 13. 24-hour Estimated Observed Rainfall ending at 7am CDT 4/28/2020.

Fig. 14. OK Mesonet (values) and NWS RFC rainfall estimate (image) 24-hour rainfall ending at 10:00 am CDT 4/28/2020.
Fig. 15. 24-hour Estimated Observed Rainfall ending at 7am CDT 4/29/2020.

Fig. 16. OK Mesonet (values) and NWS RFC rainfall estimate (image) 24-hour rainfall ending at 8:15 am CDT 4/29/2020. A potent and compact potential vorticity maximum moved out of northern NM late on the 21st and continued to track eastward across OK and AR on the 22nd. A thunderstorm complex developed to the west and began to move into southeast OK just before midnight of the 22nd. This activity became widespread over southeast OK and west central AR through the overnight hours and ended from west to east by sunrise. Rainfall totals were around 0.50” to around 2” south of I-40 (Figs. 9, 10). As the upper-level vorticity maximum approached, at the surface, low pressure developed over western OK, which then progressed east through the day and into northwest AR by late on the 22nd. In the pre-dawn hours of the 22nd, another complex of storms developed over northern OK, arriving in northeast OK around sunrise. These storms continued to develop and expand in coverage across eastern OK and northwest AR through the morning and afternoon due to forcing from warm air advection and warm frontogenesis. Heavy rain occurred, especially over Osage County, with the OK Mesonet recording a little over 1” of rain in an hour at some locations. To the south of the surface low, a Pacific front and dryline swept across southern OK through the day, arriving in eastern OK by early evening. Scattered storms continued along and near the boundary, eventually turning into a line of storms across northeast OK and northwest AR and scattered storms across southeast OK and west central AR. This activity moved east of the area by late evening. A few isolated showers impacted northeast OK and northwest AR during the overnight hours. Rainfall totals ranged from around 0.50” to around 3” (Figs. 11, 12). Once again, the rain from these numerous rounds of storms caused area rivers to rise. However, only the Poteau River near Panama reached minor flood stage (see preliminary hydrographs at the end of this report and the E3 Report for details). High-based showers and isolated thunderstorms moved across northeast OK and northwest AR through the morning hours of the 27th as a compact vorticity maximum moved across central KS. An enhanced band of thunderstorms developed mid- to late-morning over northeast OK. This activity moved east across northeast OK and northwest AR during the afternoon and early evening hours before shifting east of the area. Rainfall totals were overall light, with most affected areas receiving a few hundredths of an inch to around 0.25” of rain. However, higher totals of 0.50” to 2” occurred in far northeast OK (Figs. 13, 14). Low-level moisture increased on the 28th as a shortwave trough dropped quickly southeast during the day. A cold front stretched from northwest OK through northeast KS by mid-afternoon, with a surface low developing over north central to southwest OK. A dryline extended south from the surface low into TX, while a warm front

was located from the triple point though southeast OK. During the late afternoon hours, thunderstorms developed rapidly from central OK through northeast OK to southeast KS and quickly became severe. As the cold front surged, these storms rapidly formed into a line and moved southeast across eastern OK and western AR through the evening hours. An EF1 tornado occurred in Pushmataha County (see https://arcg.is/WOfzC0 for more information). The line of storms exited the area by midnight. Most of eastern OK and western AR received 0.50” to 1.5” of rain, with pockets of 1.5” to near 2.5” (Figs. 15, 16). Area rivers saw big rises from this rain, but all remained within their banks. Written by:
Nicole McGavock Service Hydrologist WFO Tulsa
Products issued in April 2020: *CWYO2 became a daily river forecast point September 7, 2016 *MLBA4 and OZGA4 transferred to NWS Tulsa HSA February 5, 2014 *Mixed case River Flood products began July 31, 2013 1 Flash Flood Warnings (FFW) 0 Flash Flood Statements (FFS) 1 Flash/Areal Flood Watches (FFA) (2 Watch FFA CON/EXT/EXA/EXB/CAN) 6 Urban and Small Stream Advisories (FLS) 0 Areal Flood Warnings (FLW) 0 Areal Flood Statements (FLS) 7 River Flood Warnings (FLW) (includes category increases) 67 River Flood Statements (FLS)
5 River Flood Advisories (FLS) (23 Advisory FLS CON/EXT/CAN) 0 River Flood Watches (FFA) (0 Watch FFA CON/EXT/CAN) 0 River Statements (RVS) 0 Hydrologic Outlooks (ESF) 0 Drought Information Statements (DGT)
Preliminary Hydrographs:


