moose hunting in finland management of a heavily …
TRANSCRIPT
MOOSE HUNTING IN FINLAND
— MANAGEMENT OF A HEAVILY
HARVESTED POPULATION
Anne Luoma
Integrative Ecology Unit Division of Population Biology
Department of Ecology and SystematicsUniversity of Helsinki
Finland
Academic dissertation
To be presented, with permission of the Faculty of Science of theUniversity of Helsinki, for public criticism in the lecture hall 2 ofViikki Info Centre (Viikinkaari 11) on November 15th 2002 at 12
o’clock noon
Helsinki 2002
2 Luoma
© Anne Luoma (chapter 0)
© Finnish Zoological and Botanical Publishing Board (chapter I)
© Wildlife Biology (chapter VI)
© authors (chapters II, III, IV, V, VII)
Author’s address:
Integrative Ecology UnitDepartment of Ecology and SystematicsDivision of Population BiologyP.O. Box 65(Viikinkaari 1)FIN-00014 University of Helsinkie-mail: [email protected]
ISBN 952-91-5188-8 (Printed)ISBN 952-10-0748-6 (PDF)http://ethesis.helsinki.fi
Helsinki 2002Oy Edita Ab
Moose hunting in Finland 3
Moose hunting in Finland — management of a heavily
harvested population
Anne Luoma
This thesis is based on the following articles which are referredto in the text by their Roman numerals:
I Lehtonen, A. 1998. Managing moose, Alces alces,population in Finland: hunting virtual animals. — AnnalesZoologici Fennici 35: 173-179.
II Luoma, A., Nygrén, T., Ruusila, V., Ranta, E. & Kaitala, V.2002. Dynamics of a heavily harvested moose populationin Finland. — Manuscript.
III Kaitala, V., Ranta, E., Luoma, A., Nygrén, T. & Ruusila, V.2002. Bulls, cows and calves, elements of mooseharvesting. — Manuscript.
IV Ranta, E., Luoma, A. & Kaitala, V. 2002. Spatial-temporalsynchrony in harvested moose population in Finland. —Manuscript.
V Ranta, E., Luoma, A., Kaitala, V. & Nygrén, T. 2002. Mooseharvesting in Finland. — Manuscript.
VI Luoma, A., Ranta, E. & Kaitala, V. 2001. Moose Alces alceshunting in Finland – an ecological risk analysis. — WildlifeBiology 7: 181-187.
VII Luoma, A., Ranta, E. & Kaitala, V. 2002. Significance oflandscape structure on moose population management.— Manuscript.
4 Luoma
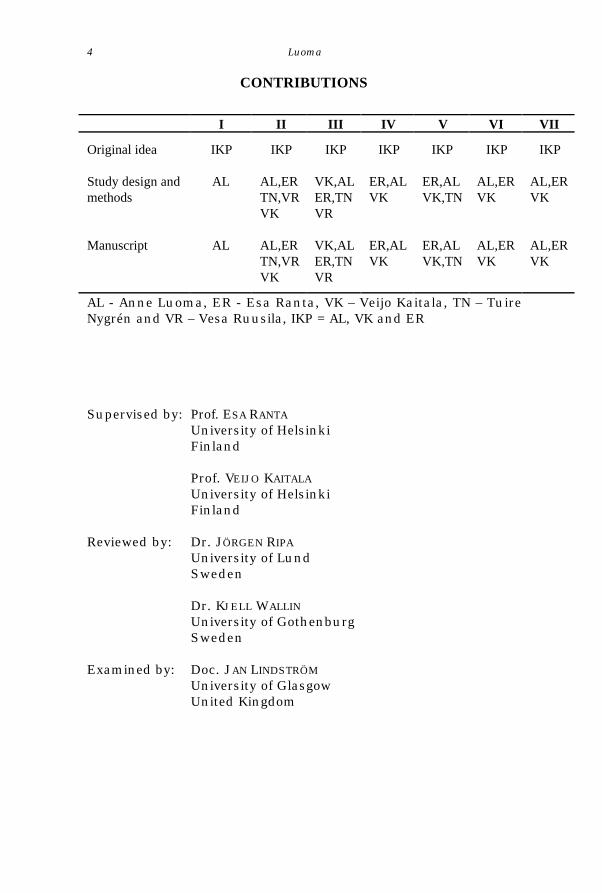
CONTRIBUTIONS
I II III IV V VI VII
Original idea IKP IKP IKP IKP IKP IKP IKP
Study design andmethods
AL AL,ERTN,VRVK
VK,ALER,TNVR
ER,ALVK
ER,ALVK,TN
AL,ERVK
AL,ERVK
Manuscript AL AL,ERTN,VRVK
VK,ALER,TNVR
ER,ALVK
ER,ALVK,TN
AL,ERVK
AL,ERVK
AL - Anne Luoma, ER - Esa Ranta, VK – Veijo Kaitala, TN – TuireNygrén and VR – Vesa Ruusila, IKP = AL, VK and ER
Supervised by: Prof. ESA RANTA
University of HelsinkiFinland
Prof. VEIJO KAITALA
University of HelsinkiFinland
Reviewed by: Dr. JÖRGEN RIPA
University of LundSweden
Dr. KJELL WALLIN
University of GothenburgSweden
Examined by: Doc. JAN LINDSTRÖM
University of GlasgowUnited Kingdom
Moose hunting in Finland 5
MOOSE HUNTING IN FINLAND- MANAGEMENT OF A HEAVILY HARVESTED POPULATION
Moose in Finland – now and before
In 2001 the winter population size of moose (Alces alces L.)was approximately 120 000 animals in Finland (Ruusila et al.2002). At the same year 66 951 individuals were killed in theharvest (hunting statistics of Hunters' Central Organization) andthe meat value of those animals was 40 million euros. These areconvincing evidences that moose is the most important gameanimal in Finland and that harvest plays major role in moosepopulation dynamics. Due to the importance of moose, itspopulation size has been monitored for decades. There are someestimations of moose population size even from the beginning ofthe 1900’s (Nygrén 1984, 1987, I). The organised collection ofmoose data was initiated in 1970’s (Nygrén 1984, Nygrén &Pesonen 1993). However, regardless of a long data series onmoose population size and other population parameters, manyfeatures of the dynamics of the Finnish moose population haveremained unknown.
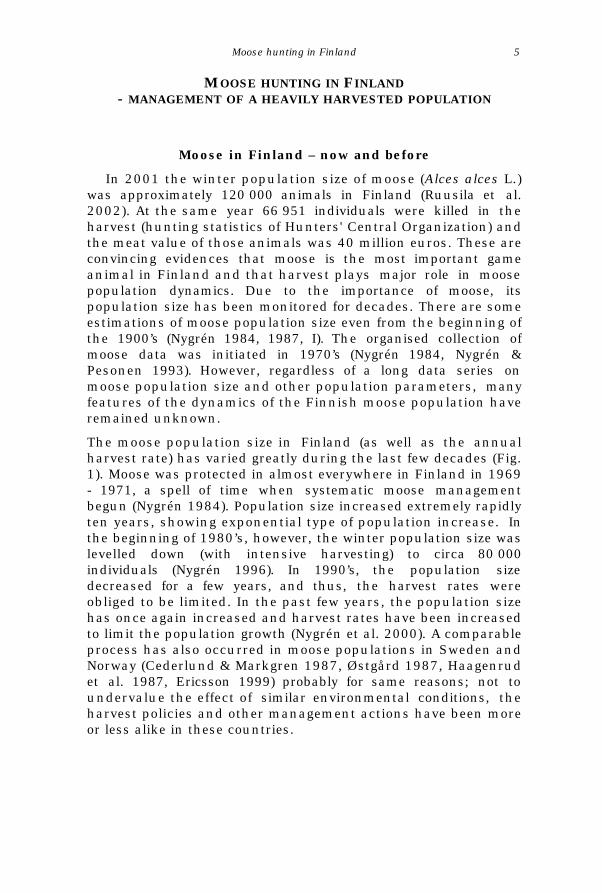
The moose population size in Finland (as well as the annualharvest rate) has varied greatly during the last few decades (Fig.1). Moose was protected in almost everywhere in Finland in 1969- 1971, a spell of time when systematic moose managementbegun (Nygrén 1984). Population size increased extremely rapidlyten years, showing exponential type of population increase. Inthe beginning of 1980’s, however, the winter population size waslevelled down (with intensive harvesting) to circa 80 000individuals (Nygrén 1996). In 1990’s, the population sizedecreased for a few years, and thus, the harvest rates wereobliged to be limited. In the past few years, the population sizehas once again increased and harvest rates have been increasedto limit the population growth (Nygrén et al. 2000). A comparableprocess has also occurred in moose populations in Sweden andNorway (Cederlund & Markgren 1987, Østgård 1987, Haagenrudet al. 1987, Ericsson 1999) probably for same reasons; not toundervalue the effect of similar environmental conditions, theharvest policies and other management actions have been moreor less alike in these countries.
6 Luoma
Fig. 1. Changes in moose winter population size and harvest in Finlandduring 1930 - 2000 (for more of the subject, see, e.g., Nygrén 1984,1987, 1996).
The aims of moose population management has varied from verylow hunting rates, or even protection, to let the population sizeto increase (like in the beginning of 1970’s and in 1990’s), to veryintensive harvesting to limit the population growth and tominimize damages caused by moose (like in mid 1980’s and in lastfew years). A general goal of the management actions has beenstable moose population size with relatively high reproductionrate, which would ensure high harvest rates. The populationdensities are supposed to be approximately 2 - 5 moose/10km2
(Nygrén et al. 1999). These densities are attained in most parts ofFinland, but locally there are large differences (e.g., Ruusila et al.2002).
To reach the management goals, the main commission is tounderstand the basic population dynamics of moose, and thefactors influencing them. If the main features of populationgrowth are discovered we would be able to predict the moosepopulation size in the coming years. A most important challengeis that harvesting has a major impact on the moose populationsize and its sex and age structures. Selective hunting changesthe ratio of bulls and cows (Nygrén & Pesonen 1993). Because thetrend has been towards harvesting low reproductive animals andsaving older, and thus more reproductive cows (Nygrén 1983,Nygrén 1997, Ericsson et al. 2001), the implemented harvest
Moose hunting in Finland 7
changes the age-structure of population (Nygrén 1987). A similarmanagement strategy to increase the reproduction rate is usedalso in Sweden (Cederlund & Markgren 1987, Ericsson 1999). Dueto harvest affecting not only the population size but also itsstructure, it is not an easy task to find suitable harvest strategiesmaintaining population sizes and sex and age structures stable.
The data
Finnish Game and Fisheries Research Institute (FGFRI) hascollected data about moose population in 1974 - 2000throughout Finland. The data used here is from twelve gamemanagement districts (covering circa 2/3 of the area of Finland).The data of 27 years consist of harvest (harvest statistics) andsome population parameters, such as sex ratio, reproductionrate, and estimation of autumn population size (based on mooseobservation data collected annually during the hunting season).Most of the original data are presented in chapter II.
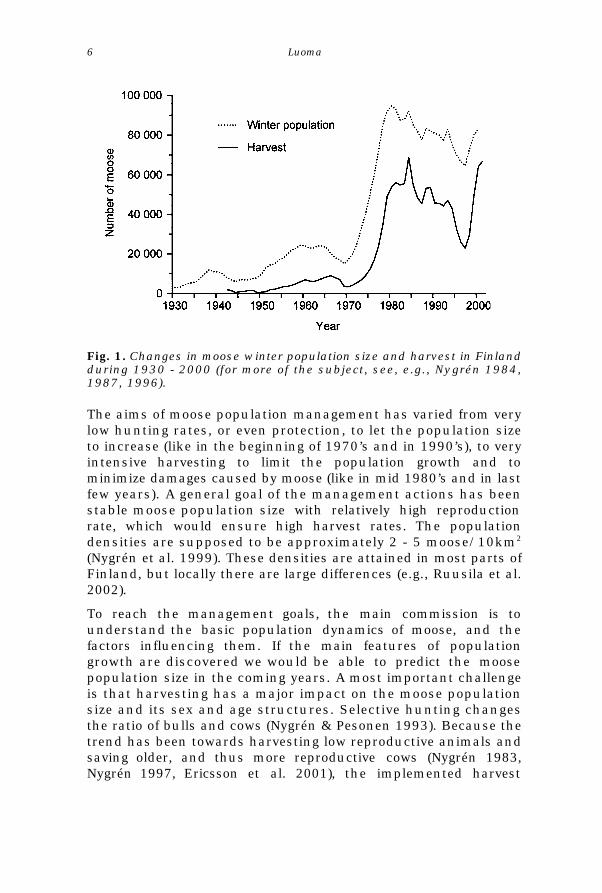
The FGFRI mastered data collection and assessment on thewinter herd size is from 1974 - 1996 (Fig. 2). They have used thecensus results, hunters’ observation data, as well as harveststatistics to get the best possible estimation about winter herdsize (this was done by T. Nygrén and M. Pesonen). During thistime period the Finnish moose population have been harvestedby using the harvest rates based on the accurate estimationsabout demand of harvest and restriction moose population size.Beginning with 1997 the census method of winter populationsize has somewhat changed and Hunters’ Central Organizationtook over the responsibility of collecting the data and keeping therecords of winter population size. Also, there are some changeshow the data are treated to calculate sex ratio and the numberof calves produced by cows (Fig. 2). The data previous to 1985 ismodified afterwards to correspond to later data (done by T.Nygrén and M. Pesonen), i.e., to represent the population beforeannual harvest, but due to some lacking information the dataperiods are not identical. No changes have taken place incollection of harvest data, cows, bulls and calves killed annuallyin the autumn harvest. In the chapters (II - V) the moose data aretreated assuming that changes in data amassing (Fig. 2) wouldnot have any major influence on the conclusions drawn. As thisis not so self-evident, I’ll next repeat the relevant analysessplitting the data into different parts (Fig. 2). The results for theperiod 1974 - 2000 will be taken as the reference point.
8 Luoma
Harvest
Winter herd size
Sex ratioReproduction rate
1974 1985 1996 2000
FGFRI
Hunters1997
modified data 1986
Year
FGFRI
FGFRIFGFRI
Fig. 2. The Finnish moose data, 1974 - 2000. Annual harvest data arecollected with a matching way during the whole study period. Collectionand reporting of the winter population data were done by the FGFRI forthe period 1974 - 1996. Since 1997 response of the census washanded to the Hunter’s Central Organization in Finland. This shift mayhave introduced some changes in data collecting and pre-processingprocedure. For sex ratio and reproductive rate the data for 1974 -1985 are pre-processed slightly differently as for 1986 - 2000 beforereporting them. (This data is from Nygrén et al. 1999, 2000). Sketchdrawn after discussion with T. Nygrén.
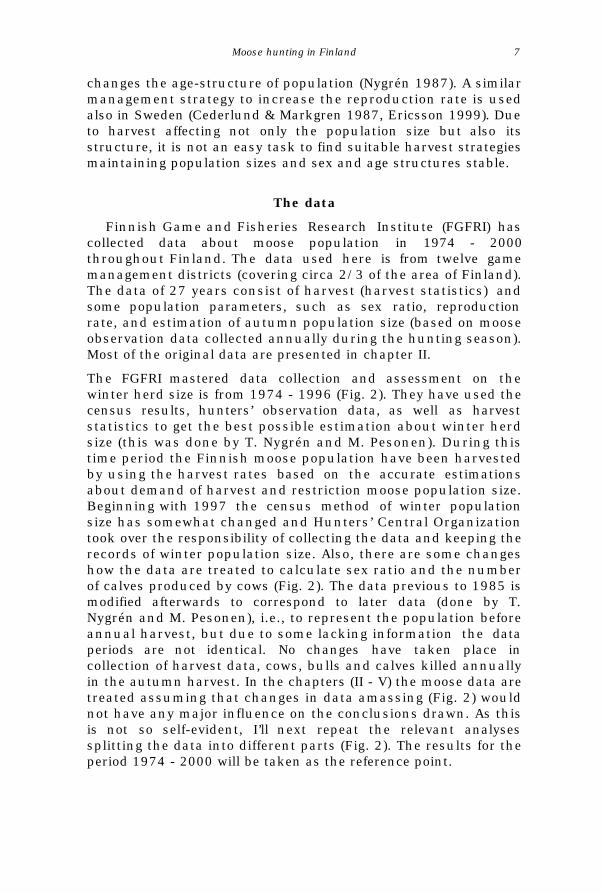
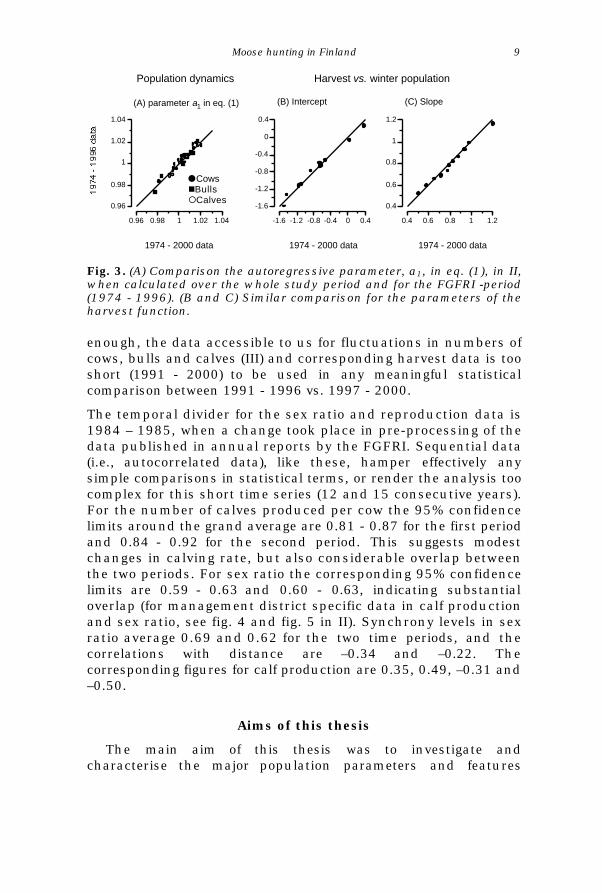
Hunters’ Central Organization in Finland has been responsible ofcollecting and reporting the winter numbers of moose during thepast few years, 1997 - 2000 (Fig. 2). An obvious question thenbecomes: Is this shift in responsibilities visible in any way in thedata? I’ll address the question in two steps. First, in II first orderautoregressive time series process, AR(1), is fitted to the entiredata. When the autoregressive coefficients, a1, for cows, bulls andcalves in different management districts (table 1 in II), based on1974 - 2000 data, are compared against those calculatedexcluding the years 1997 - 2000, the outcome is almost identical(Fig. 3A). This lends support for the conclusion that the finalyears do not have any substantial influence of the conclusionsdrawn form the data on fluctuations in numbers of cows, bullsand calves in the 12 management districts.
Harvest data have been collected with a similar mannerthroughout the entire study period. However due to the 1997shift, I calculated the harvest function parameters for the entireperiod (fig. 7 in II) and for the truncated period. The outcome israther clear-cut, the intercepts (Fig. 3B) and slopes (Fig. 3C) arealmost indistinguishable for the two time periods. Unfortunate
Moose hunting in Finland 9
0.96
0.98
1
1.02
1.04
0.96 0.98 1 1.02 1.04
1974 - 2000 data
(A) parameter a1 in eq. (1)
-1.6
-1.2
-0.8
-0.4
0
0.4
-1.6 -1.2 -0.8 -0.4 0 0.4
0.4
0.6
0.8
1
1.2
0.4 0.6 0.8 1 1.2
(B) Intercept (C) Slope
Harvest vs. winter population
1974 - 2000 data 1974 - 2000 data
Population dynamics
Fig. 3. (A) Comparison the autoregressive parameter, a1, in eq. (1), in II,when calculated over the whole study period and for the FGFRI -period(1974 - 1996). (B and C) Similar comparison for the parameters of theharvest function.
enough, the data accessible to us for fluctuations in numbers ofcows, bulls and calves (III) and corresponding harvest data is tooshort (1991 - 2000) to be used in any meaningful statisticalcomparison between 1991 - 1996 vs. 1997 - 2000.
The temporal divider for the sex ratio and reproduction data is1984 – 1985, when a change took place in pre-processing of thedata published in annual reports by the FGFRI. Sequential data(i.e., autocorrelated data), like these, hamper effectively anysimple comparisons in statistical terms, or render the analysis toocomplex for this short time series (12 and 15 consecutive years).For the number of calves produced per cow the 95% confidencelimits around the grand average are 0.81 - 0.87 for the first periodand 0.84 - 0.92 for the second period. This suggests modestchanges in calving rate, but also considerable overlap betweenthe two periods. For sex ratio the corresponding 95% confidencelimits are 0.59 - 0.63 and 0.60 - 0.63, indicating substantialoverlap (for management district specific data in calf productionand sex ratio, see fig. 4 and fig. 5 in II). Synchrony levels in sexratio average 0.69 and 0.62 for the two time periods, and thecorrelations with distance are –0.34 and –0.22. Thecorresponding figures for calf production are 0.35, 0.49, –0.31 and–0.50.
Aims of this thesis
The main aim of this thesis was to investigate andcharacterise the major population parameters and features
lCowsnBulls¡Calves
10 Luoma
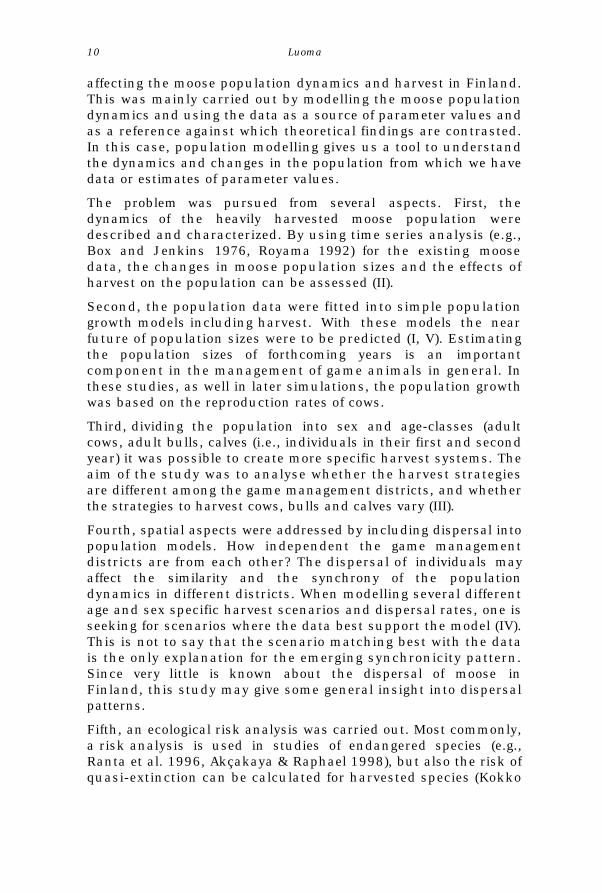
affecting the moose population dynamics and harvest in Finland.This was mainly carried out by modelling the moose populationdynamics and using the data as a source of parameter values andas a reference against which theoretical findings are contrasted.In this case, population modelling gives us a tool to understandthe dynamics and changes in the population from which we havedata or estimates of parameter values.
The problem was pursued from several aspects. First, thedynamics of the heavily harvested moose population weredescribed and characterized. By using time series analysis (e.g.,Box and Jenkins 1976, Royama 1992) for the existing moosedata, the changes in moose population sizes and the effects ofharvest on the population can be assessed (II).
Second, the population data were fitted into simple populationgrowth models including harvest. With these models the nearfuture of population sizes were to be predicted (I, V). Estimatingthe population sizes of forthcoming years is an importantcomponent in the management of game animals in general. Inthese studies, as well in later simulations, the population growthwas based on the reproduction rates of cows.
Third, dividing the population into sex and age-classes (adultcows, adult bulls, calves (i.e., individuals in their first and secondyear) it was possible to create more specific harvest systems. Theaim of the study was to analyse whether the harvest strategiesare different among the game management districts, and whetherthe strategies to harvest cows, bulls and calves vary (III).
Fourth, spatial aspects were addressed by including dispersal intopopulation models. How independent the game managementdistricts are from each other? The dispersal of individuals mayaffect the similarity and the synchrony of the populationdynamics in different districts. When modelling several differentage and sex specific harvest scenarios and dispersal rates, one isseeking for scenarios where the data best support the model (IV).This is not to say that the scenario matching best with the datais the only explanation for the emerging synchronicity pattern.Since very little is known about the dispersal of moose inFinland, this study may give some general insight into dispersalpatterns.
Fifth, an ecological risk analysis was carried out. Most commonly,a risk analysis is used in studies of endangered species (e.g.,Ranta et al. 1996, Akçakaya & Raphael 1998), but also the risk ofquasi-extinction can be calculated for harvested species (Kokko
Moose hunting in Finland 11
et al. 1997). For Finnish moose population assessing risk ofpopulation decline due to harvesting is relevant as the resultssuggest what kind of harvesting scenario can be the most feasiblein maintaining current population (VI). When connecting thedispersal into the risk analysis and comparing the risks ofpopulation decline in different landscapes the effect of dispersalbarriers can be illustrated (VII).
Main results
Fluctuations in population size and harvesting
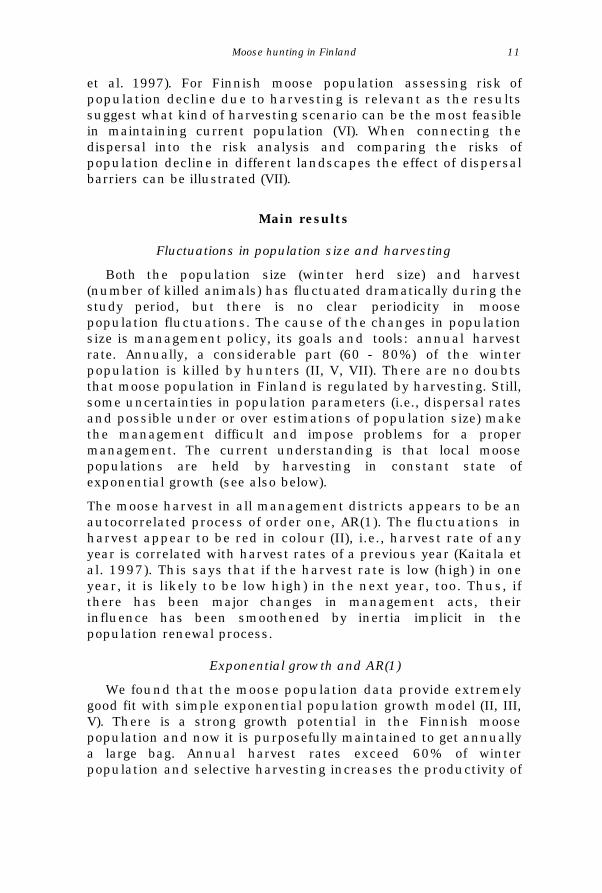
Both the population size (winter herd size) and harvest(number of killed animals) has fluctuated dramatically during thestudy period, but there is no clear periodicity in moosepopulation fluctuations. The cause of the changes in populationsize is management policy, its goals and tools: annual harvestrate. Annually, a considerable part (60 - 80%) of the winterpopulation is killed by hunters (II, V, VII). There are no doubtsthat moose population in Finland is regulated by harvesting. Still,some uncertainties in population parameters (i.e., dispersal ratesand possible under or over estimations of population size) makethe management difficult and impose problems for a propermanagement. The current understanding is that local moosepopulations are held by harvesting in constant state ofexponential growth (see also below).
The moose harvest in all management districts appears to be anautocorrelated process of order one, AR(1). The fluctuations inharvest appear to be red in colour (II), i.e., harvest rate of anyyear is correlated with harvest rates of a previous year (Kaitala etal. 1997). This says that if the harvest rate is low (high) in oneyear, it is likely to be low high) in the next year, too. Thus, ifthere has been major changes in management acts, theirinfluence has been smoothened by inertia implicit in thepopulation renewal process.
Exponential growth and AR(1)
We found that the moose population data provide extremelygood fit with simple exponential population growth model (II, III,V). There is a strong growth potential in the Finnish moosepopulation and now it is purposefully maintained to get annuallya large bag. Annual harvest rates exceed 60% of winterpopulation and selective harvesting increases the productivity of
12 Luoma
the population. A most interesting observation is that evidencefor density dependence in influencing moose population renewalis hard to detect unambiguously at the current moose densities(II, V). High harvest rates, which follow the increases of moosepopulation, seem to neutralise the effect of density dependence.
The winter population size is an autoregressive process of orderone (AR(1)) in all districts (II, V). This means that the winter herdsize of a particular year is dependent only on the population sizeof the previous year. This is an unexpected result since moose isa long living animal (e.g., Peterson 1977, Wolfe 1977, Ballard et al.1991, Solberg et al. 2000, Ericsson & Wallin 2001). Thus, longerdelays in the feedback process would have been expected. Theintensive harvest dominates changes in moose population size,and it may also bring out the AR(1) process. Also, annual harvestrates (V) and reproduction rates in most of the districts (II) areAR(1) processes, and thus, the population renewal process has amemory of only one year.
Predicting the population size
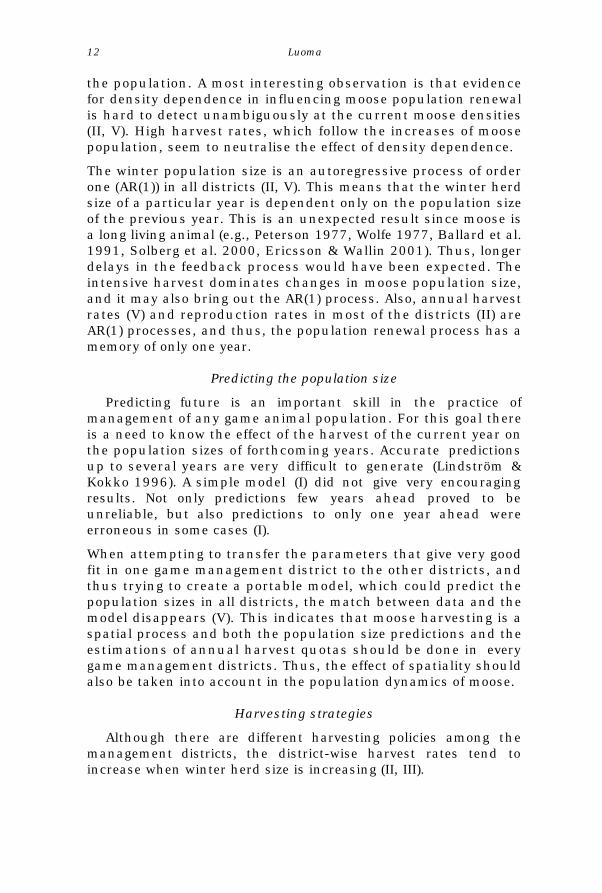
Predicting future is an important skill in the practice ofmanagement of any game animal population. For this goal thereis a need to know the effect of the harvest of the current year onthe population sizes of forthcoming years. Accurate predictionsup to several years are very difficult to generate (Lindström &Kokko 1996). A simple model (I) did not give very encouragingresults. Not only predictions few years ahead proved to beunreliable, but also predictions to only one year ahead wereerroneous in some cases (I).
When attempting to transfer the parameters that give very goodfit in one game management district to the other districts, andthus trying to create a portable model, which could predict thepopulation sizes in all districts, the match between data and themodel disappears (V). This indicates that moose harvesting is aspatial process and both the population size predictions and theestimations of annual harvest quotas should be done in everygame management districts. Thus, the effect of spatiality shouldalso be taken into account in the population dynamics of moose.
Harvesting strategies
Although there are different harvesting policies among themanagement districts, the district-wise harvest rates tend toincrease when winter herd size is increasing (II, III).
Moose hunting in Finland 13
Winter herd size
(A) (B)
COWS
BULLS
CALVES
(C)
COWS
BULLS
CALVES
Harvest scenarios for moose hunting
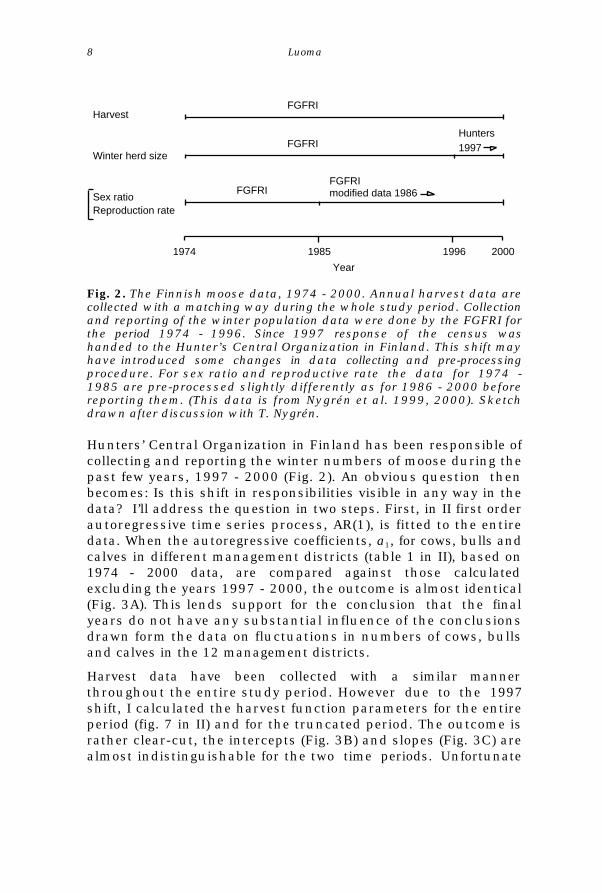
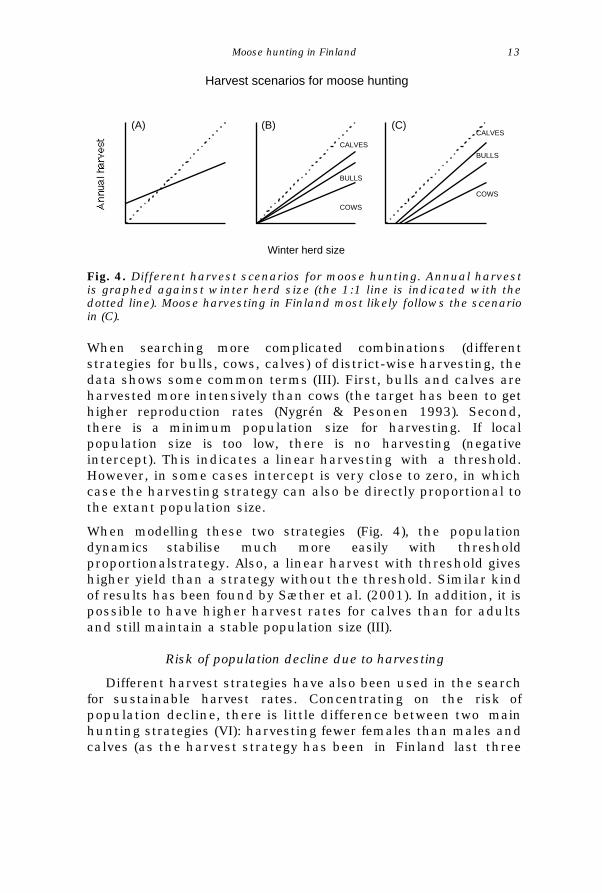
Fig. 4. Different harvest scenarios for moose hunting. Annual harvestis graphed against winter herd size (the 1:1 line is indicated with thedotted line). Moose harvesting in Finland most likely follows the scenarioin (C).
When searching more complicated combinations (differentstrategies for bulls, cows, calves) of district-wise harvesting, thedata shows some common terms (III). First, bulls and calves areharvested more intensively than cows (the target has been to gethigher reproduction rates (Nygrén & Pesonen 1993). Second,there is a minimum population size for harvesting. If localpopulation size is too low, there is no harvesting (negativeintercept). This indicates a linear harvesting with a threshold.However, in some cases intercept is very close to zero, in whichcase the harvesting strategy can also be directly proportional tothe extant population size.
When modelling these two strategies (Fig. 4), the populationdynamics stabilise much more easily with thresholdproportionalstrategy. Also, a linear harvest with threshold giveshigher yield than a strategy without the threshold. Similar kindof results has been found by Sæther et al. (2001). In addition, it ispossible to have higher harvest rates for calves than for adultsand still maintain a stable population size (III).
Risk of population decline due to harvesting
Different harvest strategies have also been used in the searchfor sustainable harvest rates. Concentrating on the risk ofpopulation decline, there is little difference between two mainhunting strategies (VI): harvesting fewer females than males andcalves (as the harvest strategy has been in Finland last three
14 Luoma
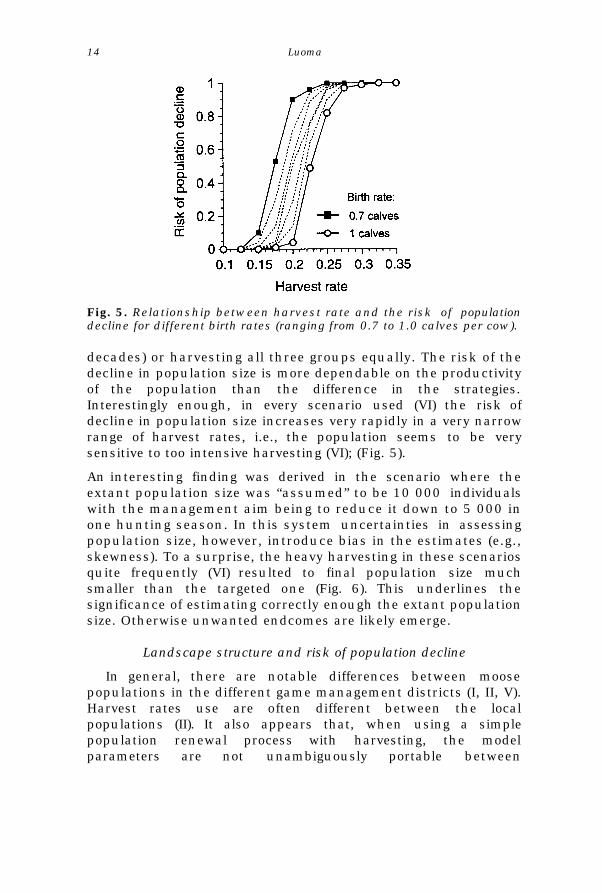
Fig. 5. Relationship between harvest rate and the risk of populationdecline for different birth rates (ranging from 0.7 to 1.0 calves per cow).
decades) or harvesting all three groups equally. The risk of thedecline in population size is more dependable on the productivityof the population than the difference in the strategies.Interestingly enough, in every scenario used (VI) the risk ofdecline in population size increases very rapidly in a very narrowrange of harvest rates, i.e., the population seems to be verysensitive to too intensive harvesting (VI); (Fig. 5).
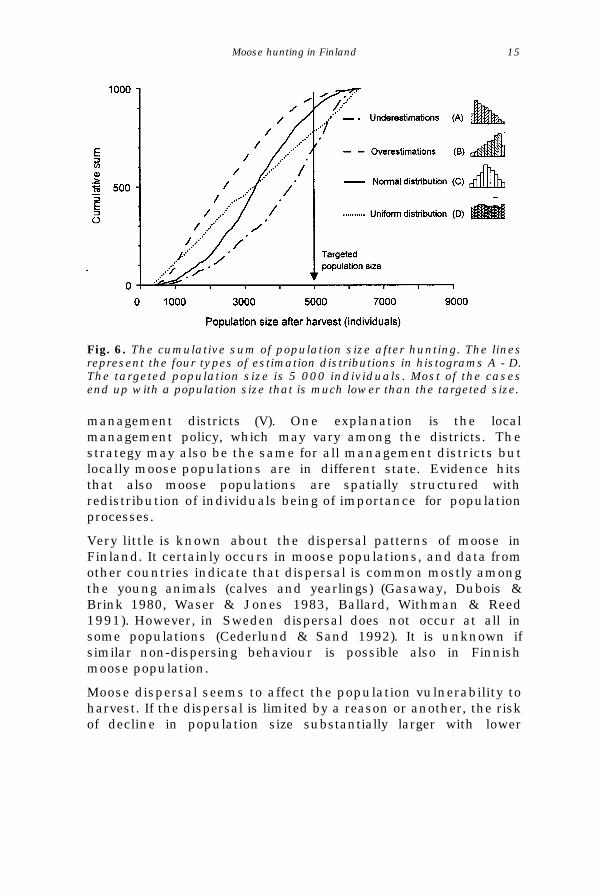
An interesting finding was derived in the scenario where theextant population size was “assumed” to be 10 000 individualswith the management aim being to reduce it down to 5 000 inone hunting season. In this system uncertainties in assessingpopulation size, however, introduce bias in the estimates (e.g.,skewness). To a surprise, the heavy harvesting in these scenariosquite frequently (VI) resulted to final population size muchsmaller than the targeted one (Fig. 6). This underlines thesignificance of estimating correctly enough the extant populationsize. Otherwise unwanted endcomes are likely emerge.
Landscape structure and risk of population decline
In general, there are notable differences between moosepopulations in the different game management districts (I, II, V).Harvest rates use are often different between the localpopulations (II). It also appears that, when using a simplepopulation renewal process with harvesting, the modelparameters are not unambiguously portable between
Moose hunting in Finland 15
Fig. 6. The cumulative sum of population size after hunting. The linesrepresent the four types of estimation distributions in histograms A - D.The targeted population size is 5 000 individuals. Most of the casesend up with a population size that is much lower than the targeted size.
management districts (V). One explanation is the localmanagement policy, which may vary among the districts. Thestrategy may also be the same for all management districts butlocally moose populations are in different state. Evidence hitsthat also moose populations are spatially structured withredistribution of individuals being of importance for populationprocesses.
Very little is known about the dispersal patterns of moose inFinland. It certainly occurs in moose populations, and data fromother countries indicate that dispersal is common mostly amongthe young animals (calves and yearlings) (Gasaway, Dubois &Brink 1980, Waser & Jones 1983, Ballard, Withman & Reed1991). However, in Sweden dispersal does not occur at all insome populations (Cederlund & Sand 1992). It is unknown ifsimilar non-dispersing behaviour is possible also in Finnishmoose population.
Moose dispersal seems to affect the population vulnerability toharvest. If the dispersal is limited by a reason or another, the riskof decline in population size substantially larger with lower
16 Luoma
Risk of population decline in center units
0
0.25
0.5
0.75
1
0 0.25 0.5 0.75 1
(A)
0 0.25 0.5 0.75 1
(B)
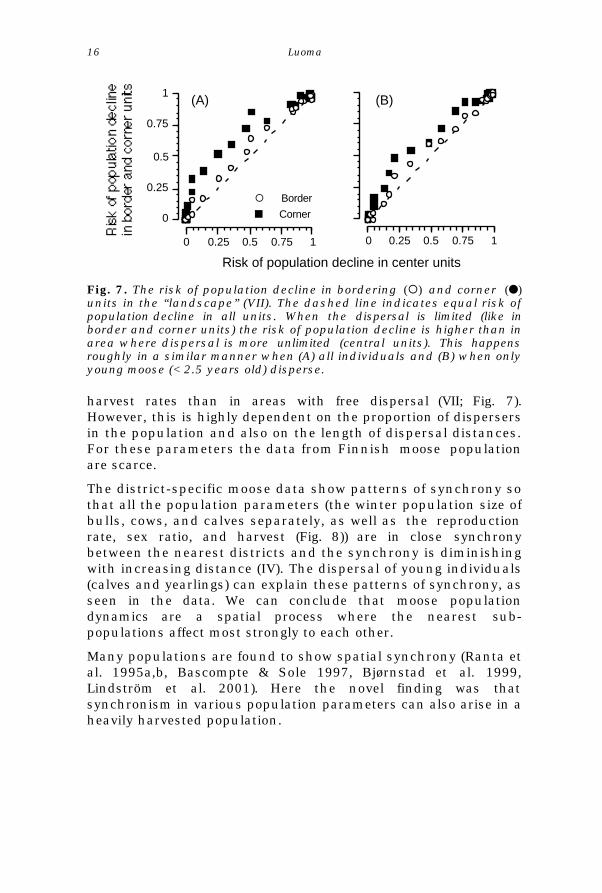
Fig. 7. The risk of population decline in bordering (¡) and corner (l)units in the “landscape” (VII). The dashed line indicates equal risk ofpopulation decline in all units. When the dispersal is limited (like inborder and corner units) the risk of population decline is higher than inarea where dispersal is more unlimited (central units). This happensroughly in a similar manner when (A) all individuals and (B) when onlyyoung moose (< 2.5 years old) disperse.
harvest rates than in areas with free dispersal (VII; Fig. 7).However, this is highly dependent on the proportion of dispersersin the population and also on the length of dispersal distances.For these parameters the data from Finnish moose populationare scarce.
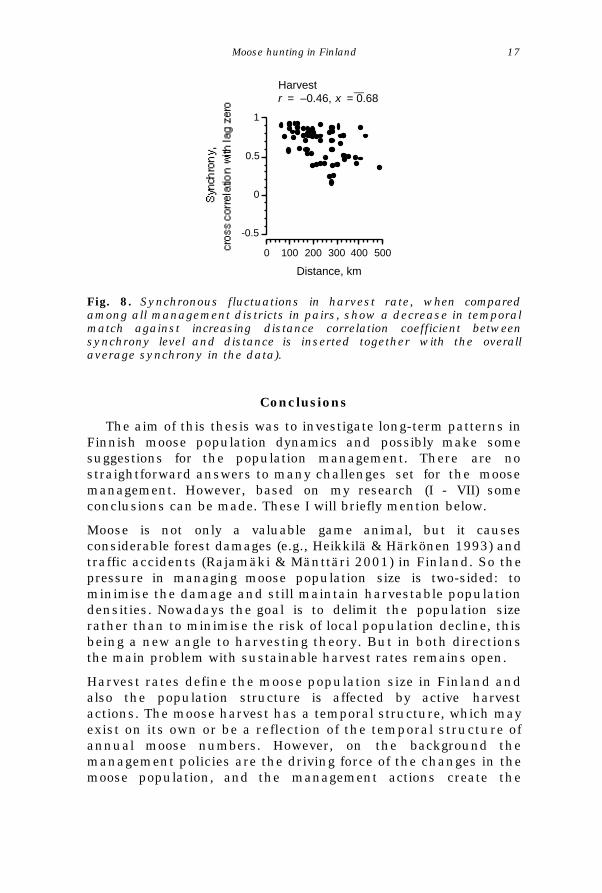
The district-specific moose data show patterns of synchrony sothat all the population parameters (the winter population size ofbulls, cows, and calves separately, as well as the reproductionrate, sex ratio, and harvest (Fig. 8)) are in close synchronybetween the nearest districts and the synchrony is diminishingwith increasing distance (IV). The dispersal of young individuals(calves and yearlings) can explain these patterns of synchrony, asseen in the data. We can conclude that moose populationdynamics are a spatial process where the nearest sub-populations affect most strongly to each other.
Many populations are found to show spatial synchrony (Ranta etal. 1995a,b, Bascompte & Sole 1997, Bjørnstad et al. 1999,Lindström et al. 2001). Here the novel finding was thatsynchronism in various population parameters can also arise in aheavily harvested population.
¡ Border
n Corner
Moose hunting in Finland 17
-0.5
0
0.5
1
0 100 200 300 400 500
Harvestr = –0.46, x = 0.68
Distance, km
—
Fig. 8. Synchronous fluctuations in harvest rate, when comparedamong all management districts in pairs, show a decrease in temporalmatch against increasing distance correlation coefficient betweensynchrony level and distance is inserted together with the overallaverage synchrony in the data).
Conclusions
The aim of this thesis was to investigate long-term patterns inFinnish moose population dynamics and possibly make somesuggestions for the population management. There are nostraightforward answers to many challenges set for the moosemanagement. However, based on my research (I - VII) someconclusions can be made. These I will briefly mention below.
Moose is not only a valuable game animal, but it causesconsiderable forest damages (e.g., Heikkilä & Härkönen 1993) andtraffic accidents (Rajamäki & Mänttäri 2001) in Finland. So thepressure in managing moose population size is two-sided: tominimise the damage and still maintain harvestable populationdensities. Nowadays the goal is to delimit the population sizerather than to minimise the risk of local population decline, thisbeing a new angle to harvesting theory. But in both directionsthe main problem with sustainable harvest rates remains open.
Harvest rates define the moose population size in Finland andalso the population structure is affected by active harvestactions. The moose harvest has a temporal structure, which mayexist on its own or be a reflection of the temporal structure ofannual moose numbers. However, on the background themanagement policies are the driving force of the changes in themoose population, and the management actions create the
18 Luoma
population sizes and structures we see in the practice. Ingeneral, the population size is dependent on harvest rate, whichin its turn effects on the population size. Both are created andmaintained by each other.
Moose harvesting is a spatial process (IV, V). The non-portabilityof the population parameters between the management districtsindicates that there are significant local differences between thedistricts. Also, the neighbouring sub-populations have astrongest effect to each other. This finding may have importantconsequences on moose harvest policies. More studies have tobe carried out to find out, which sub-population sizes should beused as basis for harvesting strategies. For example, should it bethe winter herd size in the management district, or a weighedaverage of a focal management district and those of neighbouringit. And also, how large an area should be counted as reasonablesub-population size for management decisions to be operational.
The analysis considering the harvest strategies supportthreshold-proportional harvesting over proportional strategies.Still, strict recommendations for all the management districts touse a certain management policy or to unify the harvest policiesamong the management districts are not wise. These analysesshow a general approach to the problem of sex- and age class-specific harvesting. Thus, judging from the data, the harvestpolicies in various management districts do not seem to followany clearly articulated principle. One major problem is that inaddition to selective hunting and sex or age specific harvestguidelines, hunters harvest what is available. It is not possible toorder exactly what individuals can be harvested. More detailedage-specific data would be needed for more specific studies ofmoose population structures. To mention one, the fact thatfecundity in moose is strongly age-specific (Nygrén 1983, Solberget al. 1999, Ericsson et al. 2001) is not taken account in theseanalyses.
This thesis provides a view to Finnish moose populationdynamics. It also reminds us that many uncertainties in thepopulation parameters jeopardise the management of moosepopulations. The uncertainties also make it hard to predict long-term consequences of various management actions. It has also tobe remembered, that any population data series, as extensive intime and space as here, is always based on estimations. Over thetime sampling and data pre-processing methods may be subject ofmodifications. Also, a different systematic error in the phase ofpopulation increase and decrease is possible (Solberg & Sæether

Moose hunting in Finland 19
1999). These are all likely to influence the available data.However, the current analyses are carried out using the bestpublished data on moose populations in Finland. The results ofthe research should be interpreted keeping in mind the quality ofthe data.
Acknowledgements
First I want to give my greatest thanks to my supervisors Esa and Veijofor all the help and support during these years. You gave me thepossibilities to work on my own, but also helped greatly when I wasstuck in my moose models. Especially during this last year your supporthas been considerable. I am very grateful to Tuire Nygrén, who hasgiven comments on my work and shared her vast knowledge of Finnishmoose population. Also from FGFRI, Vesa Ruusila has informed meabout the latest moose situation and Harto Lindén has supported mefrom the very beginning of my moose studies. My sincere thanks aredue to them. I also want to thank Jorma Tahvanainen for his diplomacyduring the most urgent moments when sending my thesis to the preexamination.
The whole IKP group has helped and kept me company during these fiveyears. Thanks for having a good time, all of you, and especially Teija,Katja and Marianne. The other post-graduate students from ourdepartment have shared enjoyable (and also frustrating) momentsduring the thesis work and free time. Thanks to you for your company inwork, at the coffee table and on many excursions (Minttu, Matti, Jon,Paa, Jano, Kikka and others). In the Division of Population BiologyHannu, Ilkka T. and Ilpo (and Sirkka-Liisa in the library of old Elukka)have helped me a lot in official things and made them go smoothly.
In addition I thank the people from Seitokai for giving me somethingelse to think about at the most pressing moments in my work. All thesupport needed to survive during this thesis work I have got from myparents Pirkko and Ossi, and also from my other relatives Raili, Sirkka,Matti, Juha and others, as well as from my friends Anne, Maria andKimmo. And of course without Jukka and his support everything wouldnot have been this easy.
I received financial support from the Finnish Ministry of Educationthrough LUOVA graduate school, from the Foundation for Research ofNatural Resources in Finland and from the Finnish Academy’s MaDaMeprogram (grant to Esa Ranta).
And finally, I want to thank all those hunters, who have collected themoose population data all over Finland over the years.
20 Luoma
References
Akçakaya, H.R. and Raphael, M.G. 1998. Assessing Human ImpactDespite Uncertainty: Viability of the Northern Spotted OwlMetapopulation in the Northwestern U.S. – Biodiversity andConservation 7: 875-894.
Ballard, W. B., Withman, J. S. and Reed, D. J. 1991. Populationdynamics of moose in south-central Alaska. – Wildl.Monogr. 114.
Bascompte, J. and Sole, R.V. eds. 1997. Modeling SpatiotemporalDynamics in Ecology. Springer-Verlag, Berlin.
Box, G. E. P. and Jenkins, G. 1976. Time Series Analysis:Forecasting and Control. – Holden-Day, San Francisco.
Bjørnstad, O.N., Ims, R.A. and Lambin, X. 1999. Spatialpopulation dynamics: analysing patterns and processes ofpopulation synchrony. – Trends in Ecology & Evolution14:427-432.
Cederlund, G. and Markgren, G. 1987. The development of theSwedish moose population, 1970-1983. – Swedish WildlifeResearch, Suppl. 1: 55-62.
Cederlund, G. and Sand, H. 1992. Dispersal of subadult moose(Alces alces) in nonmigratory population. – Can. J. Zool.70:1309-1314.
Ericsson, G. 1999. Demographic and life history consequences ofharvest in a Swedish moose population. – Doctoral thesis,Swedish University of Agricultural Sciences, Umeå, 34 pp.
Ericsson, G. & Wallin, K 2001. Age-specific moose (Alces alces)mortality in a predator-free environment: Evidence forsenescence in females. – Ecoscience 8: 157-163.
Ericsson, G., Wallin, K., Ball, J.P. and Broberg, M. 2001. Age-related reproductive effort and senescence in free-rangingmoose Alces alces. – Ecology 82: 1613-1620.
Gasaway, W. C., Dubois, S. D. and Brink, K. L. 1980. Dispersal ofsubadult moose in from a low density population in interiorAlaska. – Alces 16:314-337.
Haagenrud, H., Morow, K. Nygrén, K. and Stålfelt, F. 1987.Management of moose in Nordic countries. – SwedishWildlife Research, Suppl. 1: 635-642.
Heikkilä, R. and Härkönen, S. 1993. Moose (Alces alces L.)browsing in young Scots pine stands in relation to the
Moose hunting in Finland 21
characteristics of their winter habitats. – Silva Fennica 27:127-143.
Kaitala, V., Lundberg, P., Ripa, J. and Ylikarjula, J., Red, blue andgreen — Dyeing population dynamics. – Annales ZoologiciFennici 34, 217-228, 1997.
Kokko, H., Lindström, J. and Ranta, E. 1997. Risk analysis ofhunting of seal populations in the Baltic. – ConservationBiology 11:917-927.
Lindström, J., Ranta, E, Kokko, H., Lundberg, P. and Kaitala, V.2001. From arctic lemmings to adaptive dynamics: CharlesElton's legacy in population ecology. – Biol. Rev. 76: 129-158.
Nygrén, T. 1983. The relationship between reproduction rate andage structure, sex ratio and density in the Finnish moosepopulation. – XVIth Int. Congr. of Game Biologists in HighTatras, Strbske Pleso, Czechoslovakia. Pp. 1-22.
Nygrén, T. 1984. Moose population census and planning ofcropping in Finland. – Suomen Riista 31:74-82. (in Finnishwith English summary).
Nygren, T. 1987. The history of moose in Finland. – SwedishWildlife Research, Suppl. 1: 49-54.
Nygrén, T. and Pesonen, M. 1993. The moose population (Alcesalces l.) and methods of moose management in Finland1975-89. – Finnish Game Research 48:46-53.
Nygrén, T. 1996. Hirvi – in: Lindén, H., Hario, M. and Wikman, M.,Riistan jäljille. Riista- ja kalataloudentutkimuslaitos. Edita.Helsinki. P.104 (in Finnish)
Nygrén, T. 1997. Hirvi. – in: Kairikko, J.K., Aatolainen, J.,Louhisola, P. Nygrén, T. and Takamaa, S.: Hirvijahti.Hirvieläinten metsästyksen käsikirja. Gummerus.Jyväskylä. pp. 18-39 (in Finnish)
Nygrén, T., Pesonen, M., Tykkyläinen, R. and Wallén, M-L. 1999.Hirvijahdin kohteena rakenteeltaan kuntoutunut jaerittäin hyvätuottoinen kanta. – Riistantutkimuksentiedote 160: 1-13. (in Finnish)
Nygrén, T., Tykkyläinen, R. and Wallén, M-L. 2000. Syksynsuurjahdin kohteena erittäin tuottava, nopeasti kasvanuthirvikanta. – Riistantutkimuksen tiedote 168: 1-16. (inFinnish)
22 Luoma
Nygrén, K. and Wallén, M-L. 2001. Hirvi tietosanakirja. – FinnishGame and Fisheries Research Institute, Helsinki (inFinnish)
Peterson, R. O. 1977. Wolf ecology and prey relationships on IsleRoyale. – National Park Service Scient. Monogr. 11: 1-210.
Rajamäki, R. and Mänttäri, J. 2001. Hirvieläinonnettomuudetyleisillä teillä 2001. – Tiehallinto 2002 pp.19. (in Finnish)
Ranta, E., Kaitala, V., Lindström, J. and Linden, H. 1995a.Synchrony in population dynamics. – Proceedings of theRoyal Society of London. Series B, Biological Sciences 262:113-118.
Ranta, E., Lindström, J. and Kokko, H. 1996. Ecological riskanalysis – the case of the Saimaa ringed seal. – Ambio25:363-365.
Ranta, E., Lindström, J. and Lindén, H. 1995b. Synchrony intetraonid population dynamics. – Journal of Animal Ecology64: 767-776.
Royama, T. 1992. Analytical population dynamics. – Chapman &Hall, London. 380 p.
Ruusila, V., Pesonen, M., Tykkyläinen, R. and Wallén, M. 2002.Hirvikanta lähes ennallan suurista kaatomääristähuolimatta. – Riistantutkimuksen tiedote 180: 1-12. (inFinnish)
Solberg, E.J., Sæther, B.E., Strand, O., and Loison, A. 1999.Dynamics of a harvested moose population in a variableenvironment, Journal of Animal Ecology 68, 186-204.
Solberg, E.J., Loison, A., Sæther, B-E. and Strand, O. 2000. Age-specific harvest mortality in a Norwegian moose Alces alcespopulation. – Wildl. Biol. 6: 41-52.
Sæther, B-E., Engen, S. and Solberg, E.J. 2001. Optimal harvestof age-structured populations of moose Alces alces in afluctuating environment. – Wildlife Biology 7: 171-179.
Waser, L. R. and Jones, W. T. 1983. Natal philopatry amongsolitary mammals. – Q. Rev. Biol. 58:355-390.
Wolfe, M. L. 1977. Mortality patterns in the Isle Royale moosepopulation. – American Midland Naturalist 97: 267-279.
Østgård, J. 1987. Status of moose in Norway in the 1970’s andearly 1980’s. – Swedish Wildlife Research, Suppl. 1: 63-68.