morale in the english mental health workforce: questionnaire survey
TRANSCRIPT
The morale of the mental health workforce is important in severalways. First, this large workforce is exposed to substantial stressesand, at times, threats;1 ensuring staff well-being is thus a keychallenge for employers. Second, high levels of staff sickness inthe UK National Health Service (NHS) result in a large economicburden on the nation.2 Third, there is some evidence suggestinglinks between health staff well-being and patient experiencesand outcomes.2 Finally, staff attitudes are a key factor facilitatingor impeding implementation of new service initiatives.3
Implementation is particularly relevant to psychiatric in-patientcare settings (a central focus of our study), as wards in theUK have been criticised for being threatening and unsafeenvironments in which therapeutic relationships are impoverishedand treatment limited. This has resulted in a series of initiativesaimed at service improvement, which are unlikely to succeedunless a skilled and motivated workforce is recruited and retained.Despite its importance, research into staff morale remains limited,with a lack of large multisite studies that encompass all the mainmental health professions and include subspecialties other thanservices for adults of working age.4,5 Our study aimed to addressthis need for large-scale evidence on morale in the mental healthworkforce. Like previous authors,6 we use morale as a generalterm encompassing the main aspects of work-related well-beingand satisfaction and engagement with work. Specific objectiveswere:
(a) to describe staff well-being and satisfaction in a large multi-centre sample, identifying whether there are subspecialties orprofessions in which morale problems are especially acutelyfelt or, conversely, morale levels are exemplary;
(b) to investigate the interrelationships of the measures of well-being and satisfaction used, and whether a smaller numberof higher-order components can be derived from them;
(c) to explore how far variations in morale between settings andprofessions may be accounted for by job characteristics.
Method
Nineteen mental health trusts in England, each delivering a broadrange of mental health services to a catchment area, were the studysetting, drawn from the regions surrounding the four mainparticipating universities: University College London and theuniversities of Warwick, Sheffield and Bristol. Area demographicand geographical characteristics varied widely.
Sample and procedures
The in-patient care sample was recruited on 100 wards. Half wereacute general wards serving adults of working age resident withina specific catchment area; the remainder were divided betweenwards providing care for older people, rehabilitation wards(providing longer-term but time-limited care for severely illpeople with major difficulties functioning in the community),forensic wards (caring for mentally ill offenders usually referredby the criminal justice system), child and adolescent mental healthwards (for those under 18 years old) and psychiatric intensive careunits (PICUs) (for patients too difficult to manage on a generalward). Eighteen community mental health teams (CMHTs) and18 crisis resolution teams (CRTs) (providing rapid assessmentand short-term intensive home treatment in a crisis) formed thecommunity sample.
1
Morale in the English mental health workforce:questionnaire surveySonia Johnson, David P. J. Osborn, Ricardo Araya, Elizabeth Wearn, Moli Paul, Mai Stafford,Nigel Wellman, Fiona Nolan, Helen Killaspy, Brynmor Lloyd-Evans, Emma Andersonand Stephen J. Wood
BackgroundHigh-quality evidence on morale in the mental healthworkforce is lacking.
AimsTo describe staff well-being and satisfaction in a multicentreUK National Health Service (NHS) sample and exploreassociated factors.
MethodA questionnaire-based survey (n= 2258) was conducted in100 wards and 36 community teams in England. Measuresincluded a set of frequently used indicators of staff morale,and measures of perceived job characteristics based onKarasek’s demand–control–support model.
ResultsStaff well-being and job satisfaction were fairly good on mostindicators, but emotional exhaustion was high among acutegeneral ward and community mental health team (CMHT)staff and among social workers. Most morale indicatorswere moderately but significantly intercorrelated. Principal
components analysis yielded two components, oneappearing to reflect emotional strain, the other positiveengagement with work. In multilevel regression analysesfactors associated with greater emotional strain includedworking in a CMHT or psychiatric intensive care unit (PICU),high job demands, low autonomy, limited support frommanagers and colleagues, age under 45 years and juniorgrade. Greater positive engagement was associated withhigh job demands, autonomy and support from managersand colleagues, Black or Asian ethnic group, being apsychiatrist or service manager and shorter length of service.
ConclusionsPotential foci for interventions to increase morale includeCMHTs, PICUs and general acute wards. The explanatoryvalue of the demand–support–control model was confirmed,but job characteristics did not fully explain differences inmorale indicators across service types and professions.
Declaration of interestNone.
The British Journal of Psychiatry
1–8. doi: 10.1192/bjp.bp.111.098970
Researchers approached all frontline clinical staff in the parti-cipating teams and their immediate managers, and invited themto complete our questionnaire. Assurances of confidentiality wereprovided and reminders and tokens of gratitude such as fruit andbiscuits distributed. Multicentre ethical approval was obtained.Data collection commenced in late 2007 and was concluded in2009.
Measures
Morale
Staff well-being and attitudes to work were assessed with thefollowing five measures. First, burnout was rated with theMaslach Burnout Inventory, which yields three dimensions ofburnout: emotional exhaustion, assessing the extent to whichparticipants feel overburdened by their work; cynicism (a clearerdescription of this subscale than the original designation of‘depersonalisation’7), assessing how far they feel emotionallyhardened and indifferent to patients; and personal accomplish-ment, measuring whether they feel they can work with patientseffectively.8 The second measure was the Job-related AffectiveWell-being Scale, which in the version used generates two partiallyindependent subscales:9 on the anxiety–contentment scale highscores represent predominance of contentment over anxiety andlow scores the reverse, whereas on the depression– enthusiasmscale enthusiasm predominates at high scores and depression atlow scores. Third, to assess job satisfaction we used a combinationof items from the 2004 Workplace Employment Relations Surveyand the NHS Staff Survey to cover the aspects of satisfaction thatwe wished to include;10,11 this generated several satisfactionsubscores (see online Table DS2). Fourth, overall psychologicalhealth was rated with the 12-item version of the General HealthQuestionnaire (GHQ-12),12 covering depression, anxiety, suicidalideas, happiness and sleep disturbance; using the Likert versioneach item is scored from 0 to 3, and a total score of 12 or moreout of 36 is the threshold for ‘caseness’, indicating potentialmorbidity. Finally, the Job Involvement Scale, which definesthe degree of an individual’s psychological identification withtheir work, was used as an indicator of motivation;13 we used afive-item measure.14
Demographic and occupational details
Structured questions elicited the participants’ sociodemographicdetails and profession, length of service in mental health servicesand on their current ward, and seniority.
Job characteristics
Perceived job characteristics measured in the study originatedfrom Karasek’s ‘demand–control’ model of work-related strain,15
subsequently extended to include ‘support’.16 Central tooccupational psychology for the past two decades, this modelhas been widely replicated, although not prior to our study in amultidisciplinary sample of mental health staff.17 Job strain isconceptualised as resulting from the triad of high demands, lowdecisional latitude (autonomy) and low support. Good evidencealso supports an extension of this – the idea that a combinationof high demands, high autonomy and high support results in goodmotivation and job satisfaction.18 We measured demands andcontrol using questions developed by Haynes et al for health staff,all rated on a five-point scale.19 Seven items related to the extentof demands made by jobs, including whether these exceededavailable time and resources, conflicted with one another or madeit impossible to follow best practice. Five items related to control:how much autonomy respondents had in deciding how to do their
work. Three items in the same format measured support(including willingness to listen and helpfulness) from immediatemanagers, and four items measured support from colleagues.
Statistical analysis
We first estimated unadjusted mean morale indicators by servicetype and profession and tested for differences using analysis ofvariance. We originally planned to test the hypothesis thatin-patient unit staff would have worse morale than those workingin the community; this was not pursued, because descriptivestatistics revealed large differences between hospital specialties.To ascertain relationships between indicators of morale weexamined pairwise Pearson’s correlations between all the subscaleslisted above. We then used principal components analysis toexplore whether we could obtain plausible components ontowhich several indicators loaded to be used in further analyses.We then examined the associations between the components ofstaff morale and service type and profession, adjusted for otherdemographic and occupational variables. Mixed effects multilevelregression was used so that we could simultaneously modeleffects at both individual and service level, taking account of thenon-independence of observations at each level.20 Multilevelmodels were then derived with each of the morale componentsas dependent variables: individuals were nested within services.Initially, profession and service type were included along withthe demographic and job-related variables shown in Table 1. Wethen added job demands, support and control variables to themultilevel models obtained, assessing how far significantrelationships between morale and service type and professionpersisted with these variables included.
Less than 5% of the data were missing (between 13 and 144cases per variable), but exclusion of all cases with missing datawould have substantially reduced the sample. We therefore usedmultiple imputation, which fills in missing values based on valuesof other variables and a ‘missing at random’ assumption. Multipleimputation acknowledges uncertainty about the missing values bycreating several imputed data-sets, in this case five followingstandard guidance that the number of imputed data-sets shouldexceed the overall proportion of missing data.21 The ice commandin Stata version 10 for Windows was used to generate imputeddata-sets and the mim commands to combine them in ourmultilevel regression analyses.22
Results
One hundred wards in 19 mental health trusts provided thein-patient staff sample: 50 acute general wards, 10 child andadolescent mental health service (CAMHS), 9 rehabilitation, 9older people’s, 12 forensic and 10 PICU wards. In thecommunity we recruited 18 CMHTs and 18 CRTs. A total of3545 questionnaires were distributed, of which 2258 validresponses were returned, a 64% response rate. At trust level theresponse rate varied from 52% to 72%, median 60%. Wardresponse rates ranged between 22% and 100%, median 62%.
Just over a third of respondents were men, three-quarters werefrom a White ethnic background and the mean age was 40.7 years(Table 1). Around half the participants were nurses and just over aquarter were nursing assistants, healthcare assistants or otherswithout a relevant professional qualification. All other mainmental health professions were represented in smaller groups. Fiveper cent were ward or community team managers, subsequentlyreferred to as service managers. Temporary staff who had workedon the ward in a locum, bank or agency capacity for at least amonth were encouraged to participate, but constituted only 2%
2
Johnson et al
Morale in mental healthcare
of the sample. Staff on the national pay scales that reflectsubstantial managerial responsibilities (NHS Agenda for Changepay scales Band 7) and consultant psychiatrists were classified assenior: 12% met these criteria. Mean tenure in current servicewas 4.3 years and mean total service in mental healthcare was justunder 12 years.
Levels of morale by service type and profession
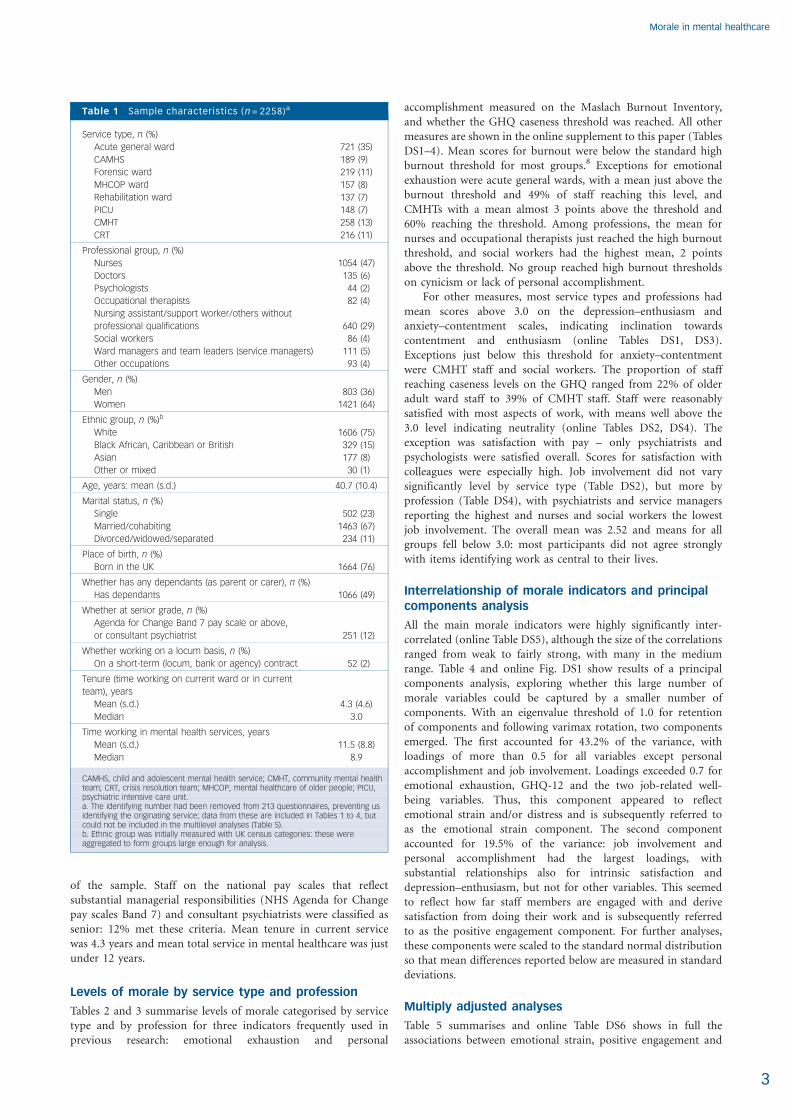
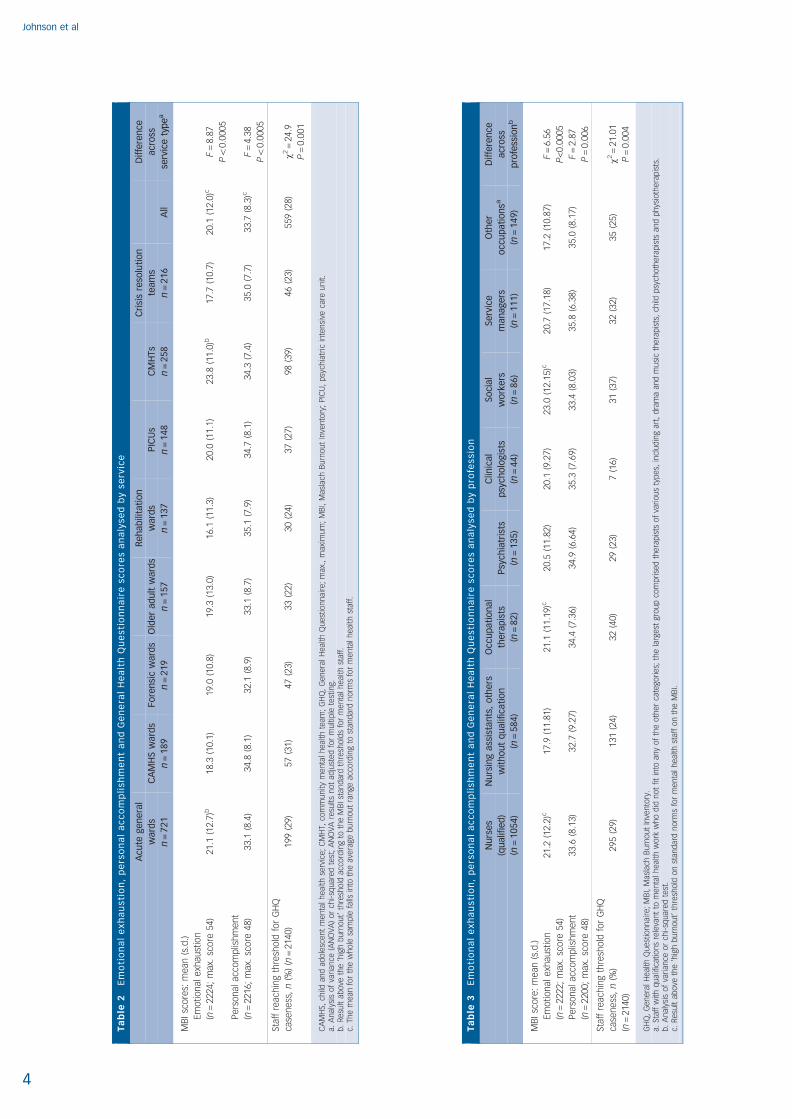
Tables 2 and 3 summarise levels of morale categorised by servicetype and by profession for three indicators frequently used inprevious research: emotional exhaustion and personal
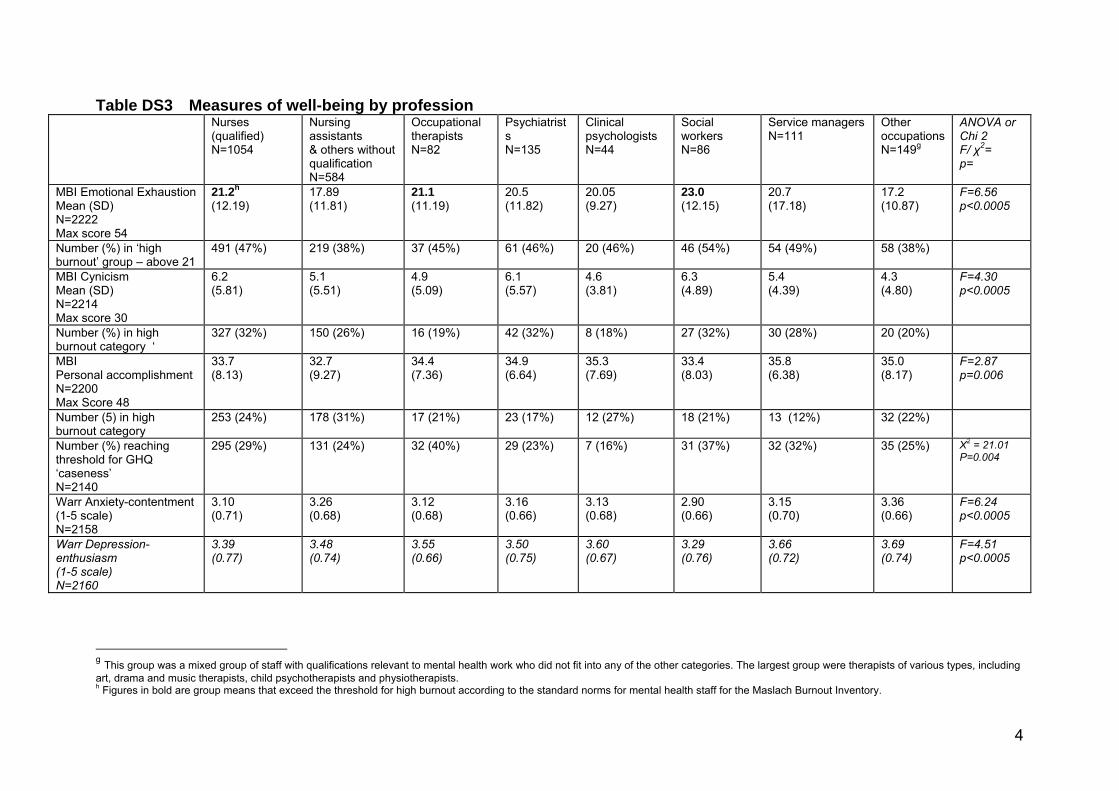
accomplishment measured on the Maslach Burnout Inventory,and whether the GHQ caseness threshold was reached. All othermeasures are shown in the online supplement to this paper (TablesDS1–4). Mean scores for burnout were below the standard highburnout threshold for most groups.8 Exceptions for emotionalexhaustion were acute general wards, with a mean just above theburnout threshold and 49% of staff reaching this level, andCMHTs with a mean almost 3 points above the threshold and60% reaching the threshold. Among professions, the mean fornurses and occupational therapists just reached the high burnoutthreshold, and social workers had the highest mean, 2 pointsabove the threshold. No group reached high burnout thresholdson cynicism or lack of personal accomplishment.
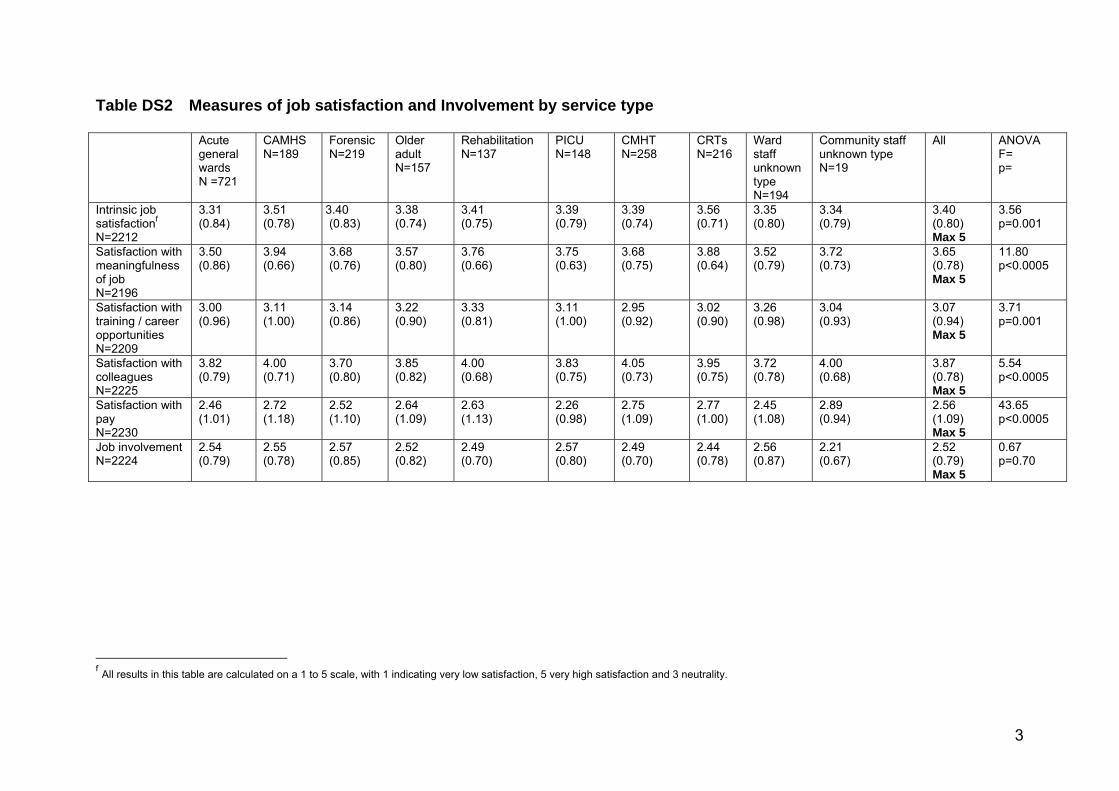
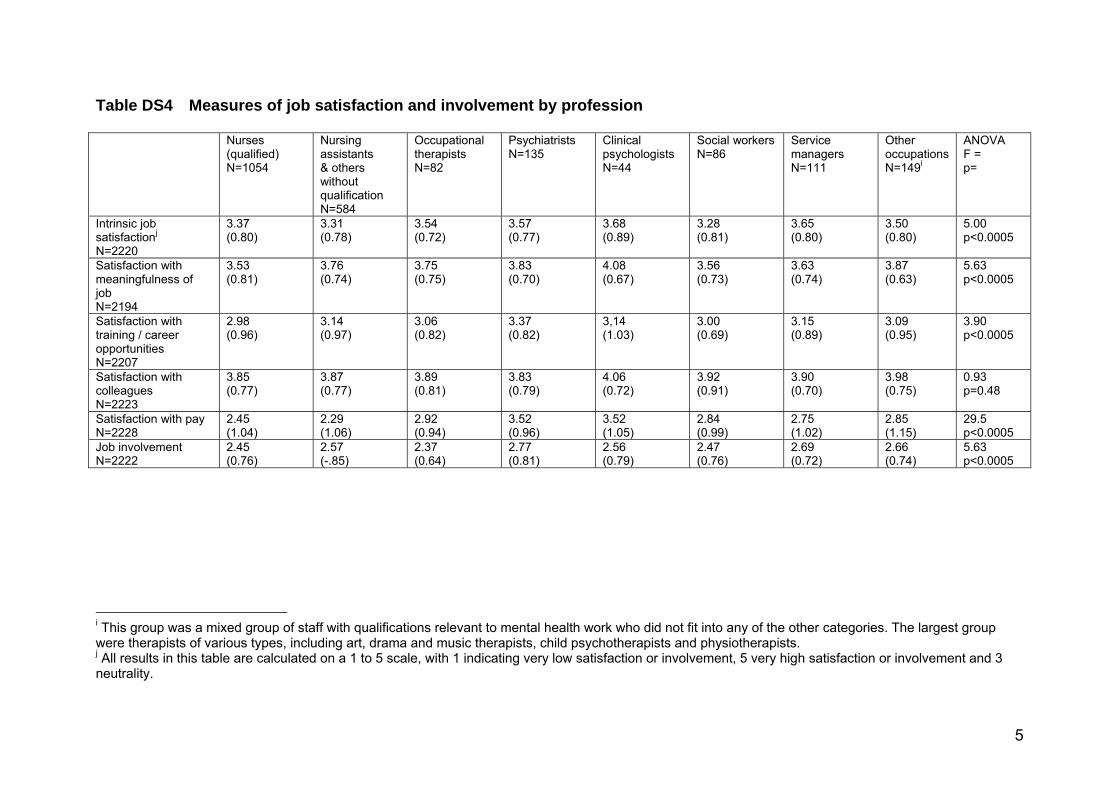
For other measures, most service types and professions hadmean scores above 3.0 on the depression–enthusiasm andanxiety–contentment scales, indicating inclination towardscontentment and enthusiasm (online Tables DS1, DS3).Exceptions just below this threshold for anxiety–contentmentwere CMHT staff and social workers. The proportion of staffreaching caseness levels on the GHQ ranged from 22% of olderadult ward staff to 39% of CMHT staff. Staff were reasonablysatisfied with most aspects of work, with means well above the3.0 level indicating neutrality (online Tables DS2, DS4). Theexception was satisfaction with pay – only psychiatrists andpsychologists were satisfied overall. Scores for satisfaction withcolleagues were especially high. Job involvement did not varysignificantly level by service type (Table DS2), but more byprofession (Table DS4), with psychiatrists and service managersreporting the highest and nurses and social workers the lowestjob involvement. The overall mean was 2.52 and means for allgroups fell below 3.0: most participants did not agree stronglywith items identifying work as central to their lives.
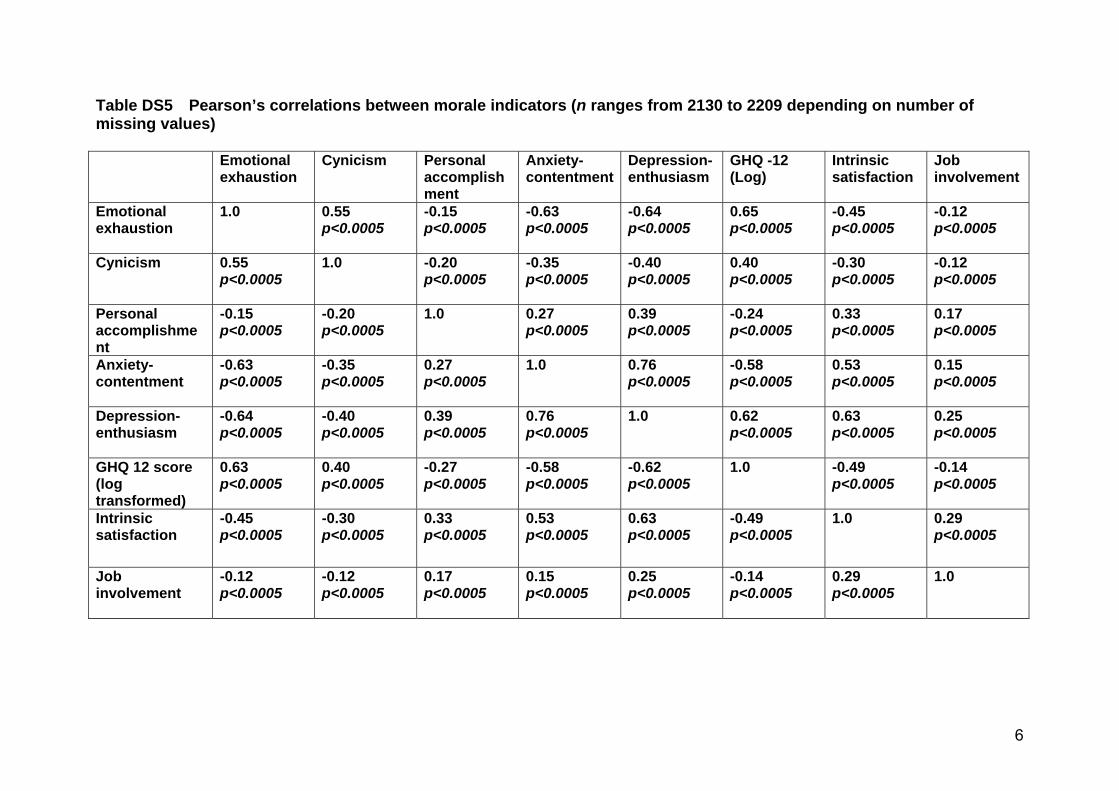
Interrelationship of morale indicators and principalcomponents analysis
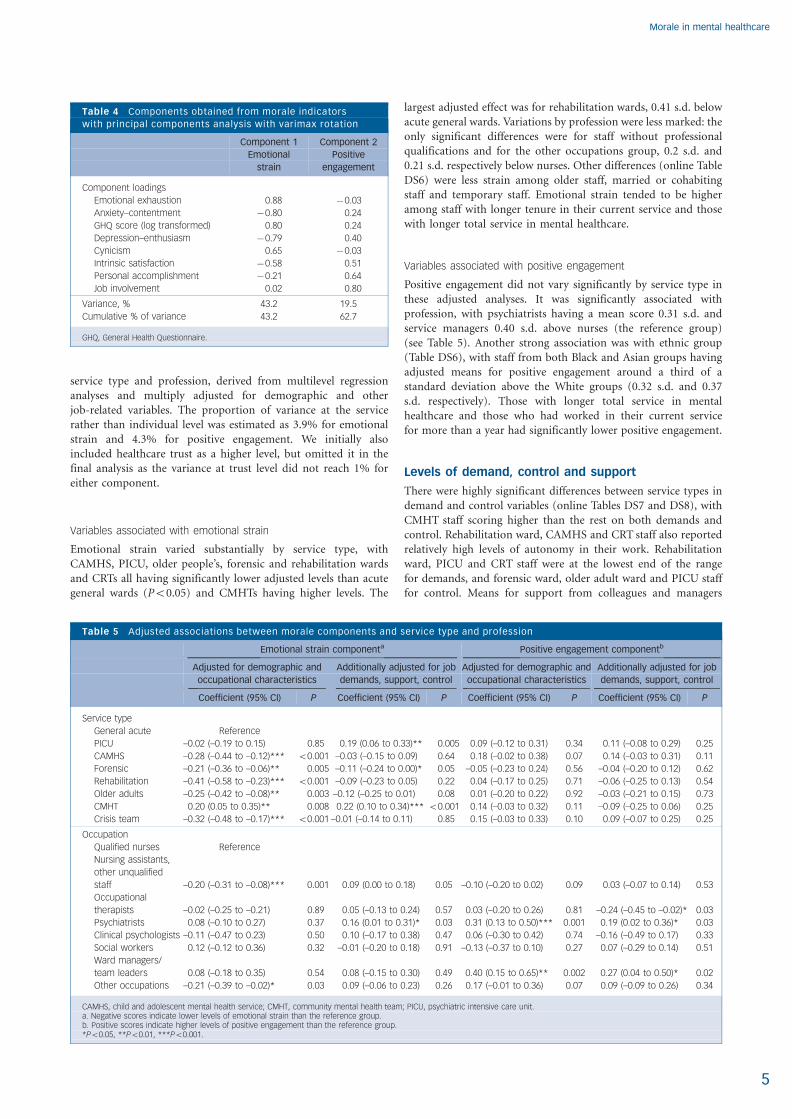
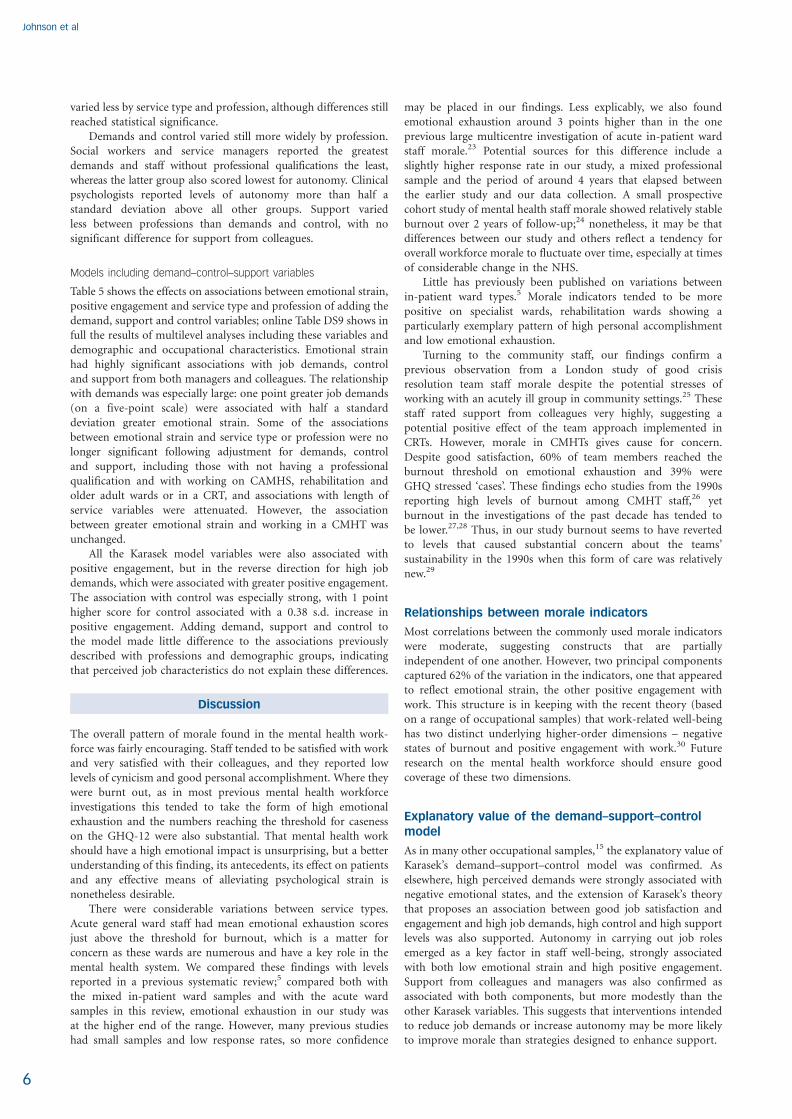
All the main morale indicators were highly significantly inter-correlated (online Table DS5), although the size of the correlationsranged from weak to fairly strong, with many in the mediumrange. Table 4 and online Fig. DS1 show results of a principalcomponents analysis, exploring whether this large number ofmorale variables could be captured by a smaller number ofcomponents. With an eigenvalue threshold of 1.0 for retentionof components and following varimax rotation, two componentsemerged. The first accounted for 43.2% of the variance, withloadings of more than 0.5 for all variables except personalaccomplishment and job involvement. Loadings exceeded 0.7 foremotional exhaustion, GHQ-12 and the two job-related well-being variables. Thus, this component appeared to reflectemotional strain and/or distress and is subsequently referred toas the emotional strain component. The second componentaccounted for 19.5% of the variance: job involvement andpersonal accomplishment had the largest loadings, withsubstantial relationships also for intrinsic satisfaction anddepression–enthusiasm, but not for other variables. This seemedto reflect how far staff members are engaged with and derivesatisfaction from doing their work and is subsequently referredto as the positive engagement component. For further analyses,these components were scaled to the standard normal distributionso that mean differences reported below are measured in standarddeviations.
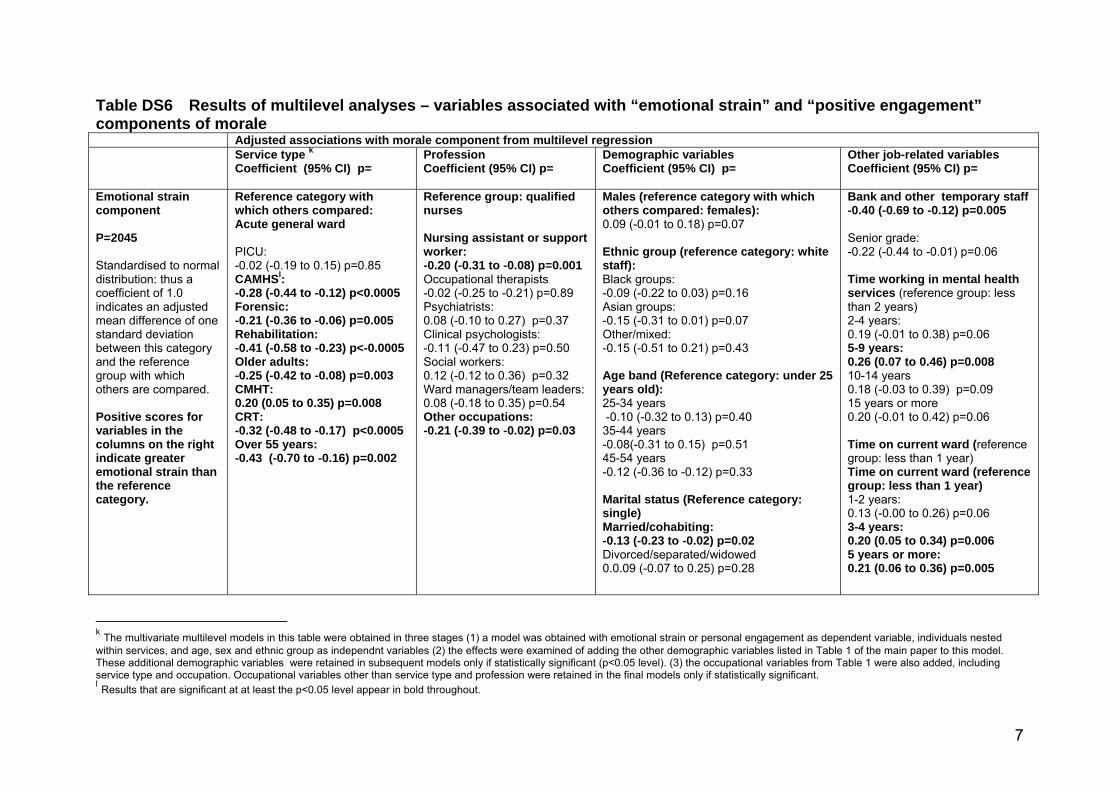
Multiply adjusted analyses
Table 5 summarises and online Table DS6 shows in full theassociations between emotional strain, positive engagement and
3
Table 1 Sample characteristics (n = 2258)a
Service type, n (%)
Acute general ward
CAMHS
Forensic ward
MHCOP ward
Rehabilitation ward
PICU
CMHT
CRT
721 (35)
189 (9)
219 (11)
157 (8)
137 (7)
148 (7)
258 (13)
216 (11)
Professional group, n (%)
Nurses
Doctors
Psychologists
Occupational therapists
Nursing assistant/support worker/others without
professional qualifications
Social workers
Ward managers and team leaders (service managers)
Other occupations
1054 (47)
135 (6)
44 (2)
82 (4)
640 (29)
86 (4)
111 (5)
93 (4)
Gender, n (%)
Men
Women
803 (36)
1421 (64)
Ethnic group, n (%)b
White
Black African, Caribbean or British
Asian
Other or mixed
1606 (75)
329 (15)
177 (8)
30 (1)
Age, years: mean (s.d.) 40.7 (10.4)
Marital status, n (%)
Single
Married/cohabiting
Divorced/widowed/separated
502 (23)
1463 (67)
234 (11)
Place of birth, n (%)
Born in the UK 1664 (76)
Whether has any dependants (as parent or carer), n (%)
Has dependants 1066 (49)
Whether at senior grade, n (%)
Agenda for Change Band 7 pay scale or above,
or consultant psychiatrist 251 (12)
Whether working on a locum basis, n (%)
On a short-term (locum, bank or agency) contract 52 (2)
Tenure (time working on current ward or in current
team), years
Mean (s.d.)
Median
4.3 (4.6)
3.0
Time working in mental health services, years
Mean (s.d.)
Median
11.5 (8.8)
8.9
CAMHS, child and adolescent mental health service; CMHT, community mental healthteam; CRT, crisis resolution team; MHCOP, mental healthcare of older people; PICU,psychiatric intensive care unit.a. The identifying number had been removed from 213 questionnaires, preventing usidentifying the originating service; data from these are included in Tables 1 to 4, butcould not be included in the multilevel analyses (Table 5).b. Ethnic group was initially measured with UK census categories: these wereaggregated to form groups large enough for analysis.
Johnson et al
4
Ta
ble
2E
mo
tio
na
le
xh
au
sti
on
,p
ers
on
al
ac
co
mp
lish
me
nt
an
dG
en
era
lH
ea
lth
Qu
esti
on
na
ire
sc
ore
sa
na
lyse
db
yse
rvic
e
Acu
tegen
era
l
ward
s
n=
721
CA
MH
Sw
ard
s
n=
189
Fo
ren
sic
ward
s
n=
219
Old
er
ad
ult
ward
s
n=
157
Reh
ab
ilita
tio
n
ward
s
n=
137
PIC
Us
n=
148
CM
HTs
n=
258
Cri
sis
reso
luti
on
team
s
n=
216
All
Diffe
ren
ce
acr
oss
serv
ice
typ
ea
MB
Isc
ore
s:m
ean
(s.d
.)
Em
otio
nal
exh
aust
ion
(n=
2224
;m
ax.
sco
re54
)21
.1(1
2.7)
b18
.3(1
0.1)
19.0
(10.
8)19
.3(1
3.0)
16.1
(11.
3)20
.0(1
1.1)
23.8
(11.
0)b
17.7
(10.
7)20
.1(1
2.0)
cF
=8.
87
P5
0.00
05
Pe
rso
nal
acco
mp
lish
me
nt
(n=
2216
;m
ax.
sco
re48
)33
.1(8
.4)
34.8
(8.1
)32
.1(8
.9)
33.1
(8.7
)35
.1(7
.9)
34.7
(8.1
)34
.3(7
.4)
35.0
(7.7
)33
.7(8
.3)c
F=
4.38
P5
0.00
05
Staf
fre
ach
ing
thre
sho
ldfo
rG
HQ
case
ne
ss,n
(%)
(n=
2140
)19
9(2
9)57
(31)
47(2
3)33
(22)
30(2
4)37
(27)
98(3
9)46
(23)
559
(28)
w2=
24.9
P=
0.00
1
CA
MH
S,ch
ildan
dad
ole
sce
nt
me
nta
lh
eal
thse
rvic
e;
CM
HT,
com
mu
nity
me
nta
lh
eal
thte
am;
GH
Q,
Ge
ne
ral
He
alth
Qu
est
ion
nai
re;
max
.,m
axim
um
;M
BI,
Mas
lach
Bu
rno
ut
Inve
nto
ry;
PIC
U,
psy
chia
tric
inte
nsi
veca
reu
nit.
a.A
nal
ysis
of
vari
ance
(AN
OV
A)
or
chi-
squ
are
dte
st;
AN
OV
Are
sults
no
tad
just
ed
for
mu
ltip
lete
stin
g.b
.R
esu
ltab
ove
the
‘hig
hb
urn
ou
t’th
resh
old
acco
rdin
gto
the
MB
Ist
and
ard
thre
sho
lds
for
me
nta
lh
eal
thst
aff.
c.Th
em
ean
for
the
wh
ole
sam
ple
falls
into
the
ave
rage
bu
rno
ut
ran
geac
cord
ing
tost
and
ard
no
rms
for
me
nta
lh
eal
thst
aff.
Ta
ble
3E
mo
tio
na
le
xh
au
sti
on
,p
ers
on
al
ac
co
mp
lish
me
nt
an
dG
en
era
lH
ea
lth
Qu
esti
on
na
ire
sc
ore
sa
na
lyse
db
yp
rofe
ssio
n
Nu
rses
(qu
alif
ied
)
(n=
1054)
Nu
rsin
gass
ista
nts
,o
thers
wit
ho
ut
qu
alif
icati
on
(n=
584)
Occ
up
ati
on
al
thera
pis
ts
(n=
82)
Psy
chia
tris
ts
(n=
135)
Clin
ical
psy
cho
logis
ts
(n=
44)
So
cial
wo
rkers
(n=
86)
Serv
ice
man
agers
(n=
111)
Oth
er
occ
up
ati
on
sa
(n=
149)
Diffe
ren
ce
acr
oss
pro
fess
ion
b
MB
Isc
ore
:m
ean
(s.d
.)
Em
otio
nal
exh
aust
ion
(n=
2222
;m
ax.
sco
re54
)
21.2
(12.
2)c
17.9
(11.
81)
21.1
(11.
19)c
20.5
(11.
82)
20.1
(9.2
7)23
.0(1
2.15
)c20
.7(1
7.18
)17
.2(1
0.87
)F
=6.
56
P<
0.00
05
Pe
rso
nal
acco
mp
lish
me
nt
(n=
2200
;m
ax.
sco
re48
)
33.6
(8.1
3)32
.7(9
.27)
34.4
(7.3
6)34
.9(6
.64)
35.3
(7.6
9)33
.4(8
.03)
35.8
(6.3
8)35
.0(8
.17)
F=
2.87
P=
0.00
6
Staf
fre
ach
ing
thre
sho
ldfo
rG
HQ
case
ne
ss,n
(%)
(n=
2140
)
295
(29)
131
(24)
32(4
0)29
(23)
7(1
6)31
(37)
32(3
2)35
(25)
w2=
21.0
1
P=
0.00
4
GH
Q,
Ge
ne
ral
He
alth
Qu
est
ion
nai
re;
MB
I,M
asla
chB
urn
ou
tIn
ven
tory
.a.
Staf
fw
ithq
ual
ifica
tion
sre
leva
nt
tom
en
tal
he
alth
wo
rkw
ho
did
no
tfit
into
any
of
the
oth
er
cate
gori
es;
the
larg
est
gro
up
com
pri
sed
the
rap
ists
of
vari
ou
sty
pe
s,in
clu
din
gar
t,d
ram
aan
dm
usi
cth
era
pis
ts,
child
psy
cho
the
rap
ists
and
ph
ysio
the
rap
ists
.b
.A
nal
ysis
of
vari
ance
or
chi-
squ
are
dte
st.
c.R
esu
ltab
ove
the
‘hig
hb
urn
ou
t’th
resh
old
on
stan
dar
dn
orm
sfo
rm
en
tal
he
alth
staf
fo
nth
eM
BI.
Morale in mental healthcare
service type and profession, derived from multilevel regressionanalyses and multiply adjusted for demographic and otherjob-related variables. The proportion of variance at the servicerather than individual level was estimated as 3.9% for emotionalstrain and 4.3% for positive engagement. We initially alsoincluded healthcare trust as a higher level, but omitted it in thefinal analysis as the variance at trust level did not reach 1% foreither component.
Variables associated with emotional strain
Emotional strain varied substantially by service type, withCAMHS, PICU, older people’s, forensic and rehabilitation wardsand CRTs all having significantly lower adjusted levels than acutegeneral wards (P50.05) and CMHTs having higher levels. The
largest adjusted effect was for rehabilitation wards, 0.41 s.d. belowacute general wards. Variations by profession were less marked: theonly significant differences were for staff without professionalqualifications and for the other occupations group, 0.2 s.d. and0.21 s.d. respectively below nurses. Other differences (online TableDS6) were less strain among older staff, married or cohabitingstaff and temporary staff. Emotional strain tended to be higheramong staff with longer tenure in their current service and thosewith longer total service in mental healthcare.
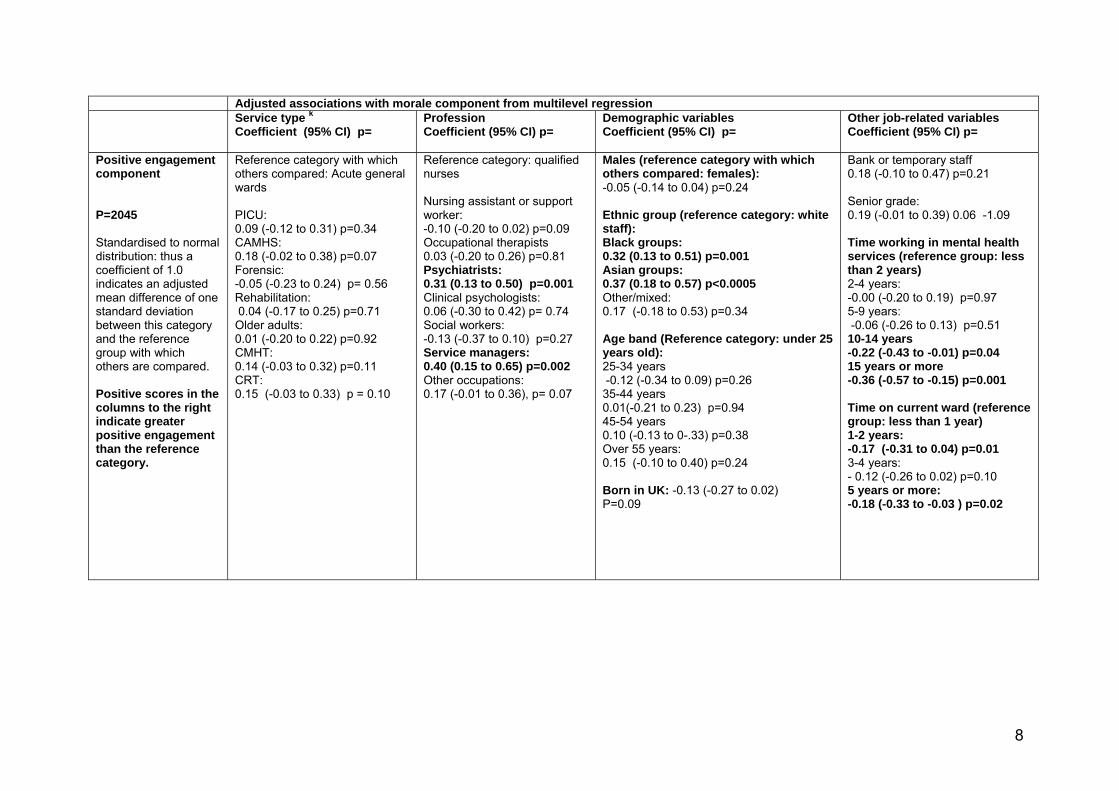
Variables associated with positive engagement
Positive engagement did not vary significantly by service type inthese adjusted analyses. It was significantly associated withprofession, with psychiatrists having a mean score 0.31 s.d. andservice managers 0.40 s.d. above nurses (the reference group)(see Table 5). Another strong association was with ethnic group(Table DS6), with staff from both Black and Asian groups havingadjusted means for positive engagement around a third of astandard deviation above the White groups (0.32 s.d. and 0.37s.d. respectively). Those with longer total service in mentalhealthcare and those who had worked in their current servicefor more than a year had significantly lower positive engagement.
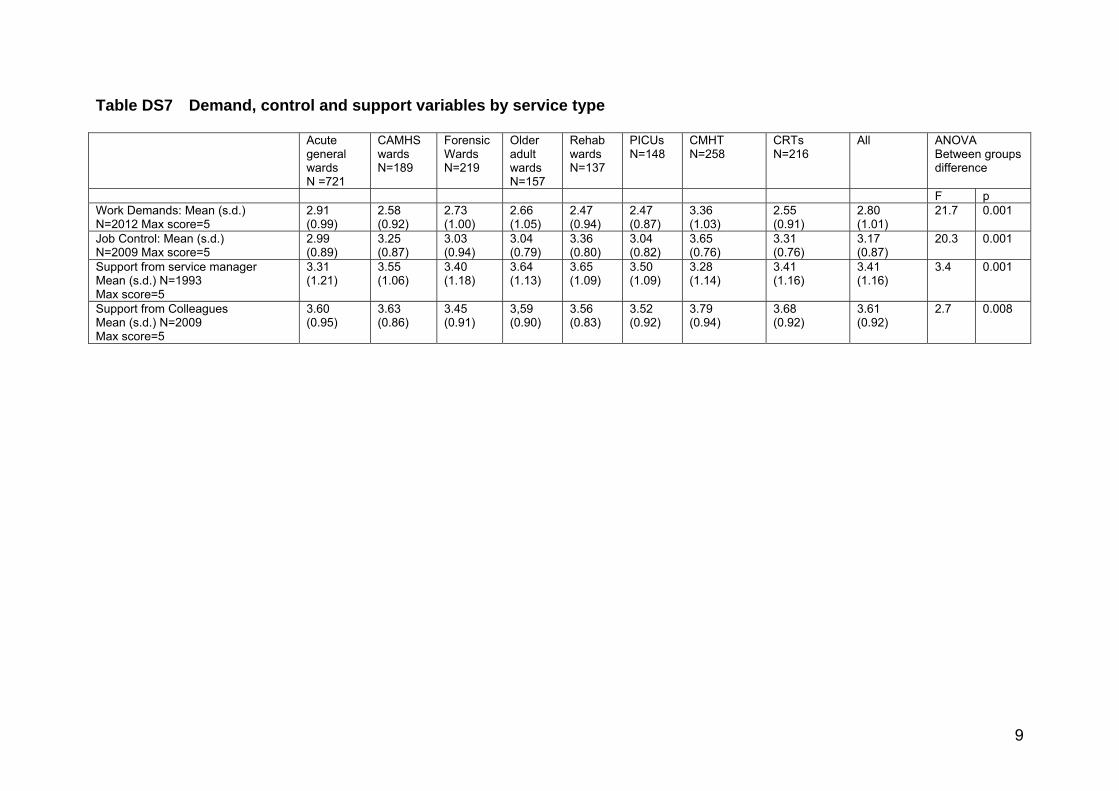
Levels of demand, control and support
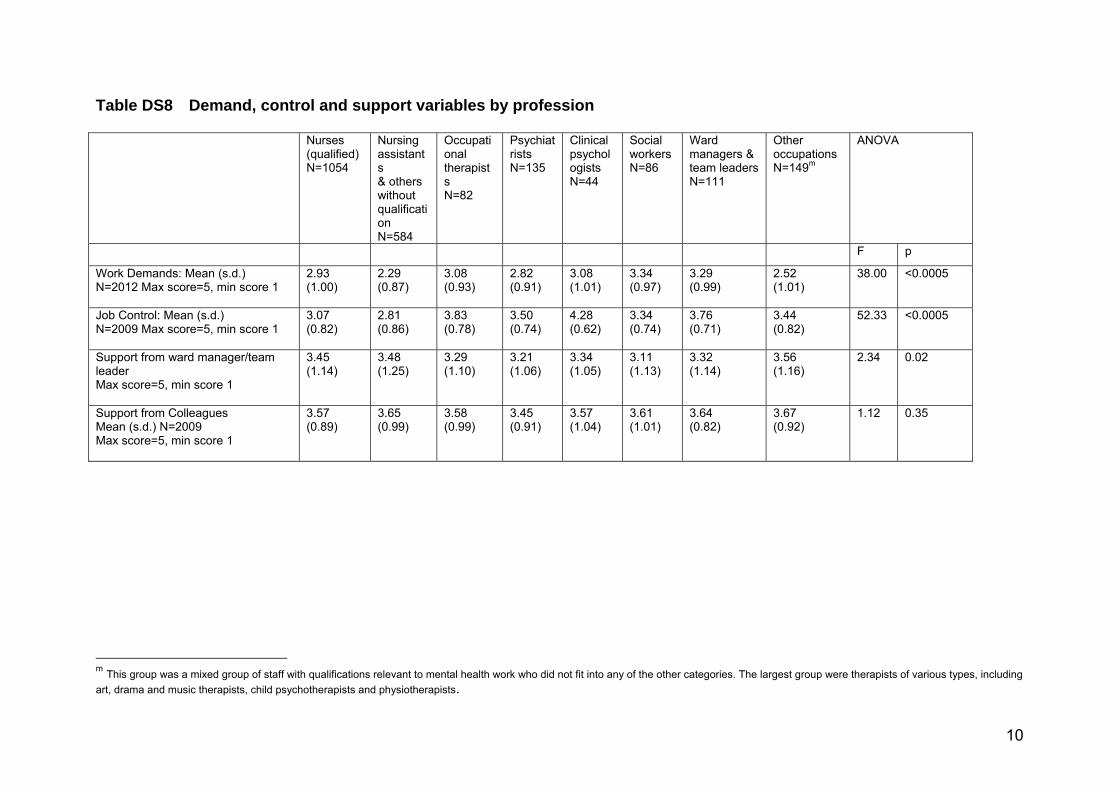
There were highly significant differences between service types indemand and control variables (online Tables DS7 and DS8), withCMHT staff scoring higher than the rest on both demands andcontrol. Rehabilitation ward, CAMHS and CRT staff also reportedrelatively high levels of autonomy in their work. Rehabilitationward, PICU and CRT staff were at the lowest end of the rangefor demands, and forensic ward, older adult ward and PICU stafffor control. Means for support from colleagues and managers
5
Table 4 Components obtained from morale indicators
with principal components analysis with varimax rotation
Component 1
Emotional
strain
Component 2
Positive
engagement
Component loadings
Emotional exhaustion 0.88 70.03
Anxiety–contentment 70.80 0.24
GHQ score (log transformed) 0.80 0.24
Depression–enthusiasm 70.79 0.40
Cynicism 0.65 70.03
Intrinsic satisfaction 70.58 0.51
Personal accomplishment 70.21 0.64
Job involvement 0.02 0.80
Variance, % 43.2 19.5
Cumulative % of variance 43.2 62.7
GHQ, General Health Questionnaire.
Table 5 Adjusted associations between morale components and service type and profession
Emotional strain componenta Positive engagement componentb
Adjusted for demographic and
occupational characteristics
Additionally adjusted for job
demands, support, control
Adjusted for demographic and
occupational characteristics
Additionally adjusted for job
demands, support, control
Coefficient (95% CI) P Coefficient (95% CI) P Coefficient (95% CI) P Coefficient (95% CI) P
Service type
General acute Reference
PICU –0.02 (–0.19 to 0.15) 0.85 0.19 (0.06 to 0.33)** 0.005 0.09 (–0.12 to 0.31) 0.34 0.11 (–0.08 to 0.29) 0.25
CAMHS –0.28 (–0.44 to –0.12)*** 50.001 –0.03 (–0.15 to 0.09) 0.64 0.18 (–0.02 to 0.38) 0.07 0.14 (–0.03 to 0.31) 0.11
Forensic –0.21 (–0.36 to –0.06)** 0.005 –0.11 (–0.24 to 0.00)* 0.05 –0.05 (–0.23 to 0.24) 0.56 –0.04 (–0.20 to 0.12) 0.62
Rehabilitation –0.41 (–0.58 to –0.23)*** 50.001 –0.09 (–0.23 to 0.05) 0.22 0.04 (–0.17 to 0.25) 0.71 –0.06 (–0.25 to 0.13) 0.54
Older adults –0.25 (–0.42 to –0.08)** 0.003 –0.12 (–0.25 to 0.01) 0.08 0.01 (–0.20 to 0.22) 0.92 –0.03 (–0.21 to 0.15) 0.73
CMHT 0.20 (0.05 to 0.35)** 0.008 0.22 (0.10 to 0.34)*** 50.001 0.14 (–0.03 to 0.32) 0.11 –0.09 (–0.25 to 0.06) 0.25
Crisis team –0.32 (–0.48 to –0.17)*** 50.001 –0.01 (–0.14 to 0.11) 0.85 0.15 (–0.03 to 0.33) 0.10 0.09 (–0.07 to 0.25) 0.25
Occupation
Qualified nurses Reference
Nursing assistants,
other unqualified
staff –0.20 (–0.31 to –0.08)*** 0.001 0.09 (0.00 to 0.18) 0.05 –0.10 (–0.20 to 0.02) 0.09 0.03 (–0.07 to 0.14) 0.53
Occupational
therapists –0.02 (–0.25 to –0.21) 0.89 0.05 (–0.13 to 0.24) 0.57 0.03 (–0.20 to 0.26) 0.81 –0.24 (–0.45 to –0.02)* 0.03
Psychiatrists 0.08 (–0.10 to 0.27) 0.37 0.16 (0.01 to 0.31)* 0.03 0.31 (0.13 to 0.50)*** 0.001 0.19 (0.02 to 0.36)* 0.03
Clinical psychologists –0.11 (–0.47 to 0.23) 0.50 0.10 (–0.17 to 0.38) 0.47 0.06 (–0.30 to 0.42) 0.74 –0.16 (–0.49 to 0.17) 0.33
Social workers 0.12 (–0.12 to 0.36) 0.32 –0.01 (–0.20 to 0.18) 0.91 –0.13 (–0.37 to 0.10) 0.27 0.07 (–0.29 to 0.14) 0.51
Ward managers/
team leaders 0.08 (–0.18 to 0.35) 0.54 0.08 (–0.15 to 0.30) 0.49 0.40 (0.15 to 0.65)** 0.002 0.27 (0.04 to 0.50)* 0.02
Other occupations –0.21 (–0.39 to –0.02)* 0.03 0.09 (–0.06 to 0.23) 0.26 0.17 (–0.01 to 0.36) 0.07 0.09 (–0.09 to 0.26) 0.34
CAMHS, child and adolescent mental health service; CMHT, community mental health team; PICU, psychiatric intensive care unit.a. Negative scores indicate lower levels of emotional strain than the reference group.b. Positive scores indicate higher levels of positive engagement than the reference group.*P50.05, **P50.01, ***P50.001.
Johnson et al
varied less by service type and profession, although differences stillreached statistical significance.
Demands and control varied still more widely by profession.Social workers and service managers reported the greatestdemands and staff without professional qualifications the least,whereas the latter group also scored lowest for autonomy. Clinicalpsychologists reported levels of autonomy more than half astandard deviation above all other groups. Support variedless between professions than demands and control, with nosignificant difference for support from colleagues.
Models including demand–control–support variables
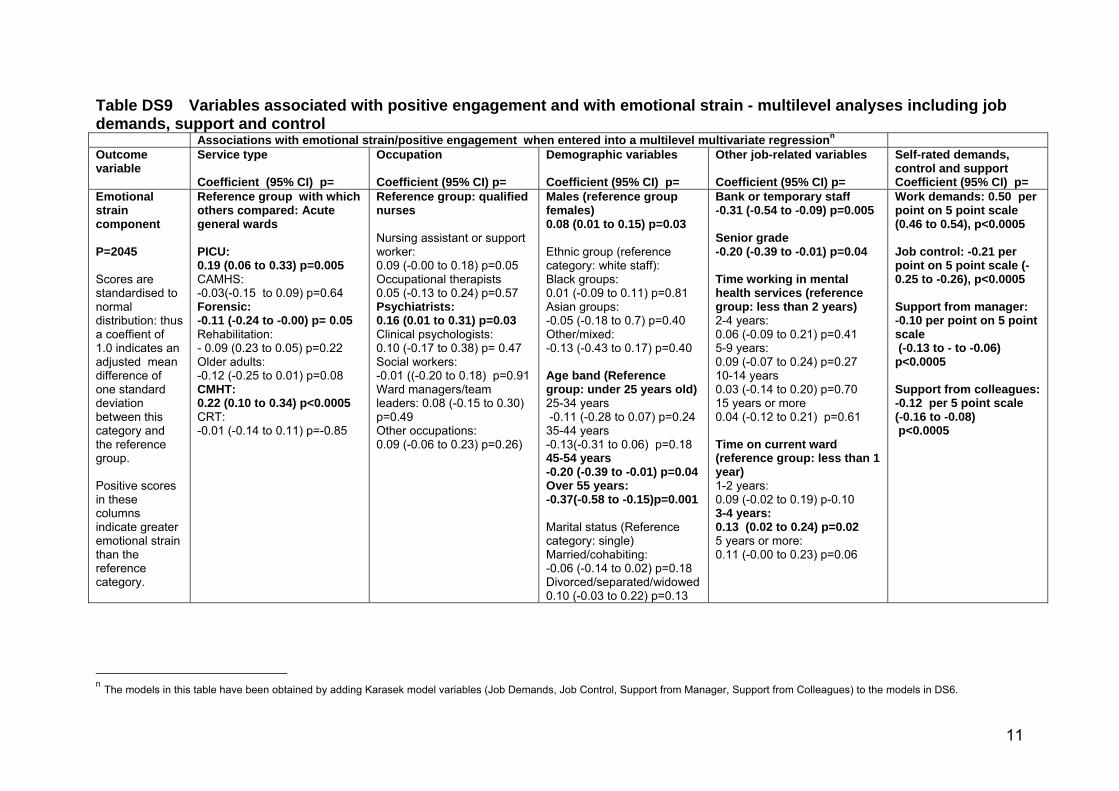
Table 5 shows the effects on associations between emotional strain,positive engagement and service type and profession of adding thedemand, support and control variables; online Table DS9 shows infull the results of multilevel analyses including these variables anddemographic and occupational characteristics. Emotional strainhad highly significant associations with job demands, controland support from both managers and colleagues. The relationshipwith demands was especially large: one point greater job demands(on a five-point scale) were associated with half a standarddeviation greater emotional strain. Some of the associationsbetween emotional strain and service type or profession were nolonger significant following adjustment for demands, controland support, including those with not having a professionalqualification and with working on CAMHS, rehabilitation andolder adult wards or in a CRT, and associations with length ofservice variables were attenuated. However, the associationbetween greater emotional strain and working in a CMHT wasunchanged.
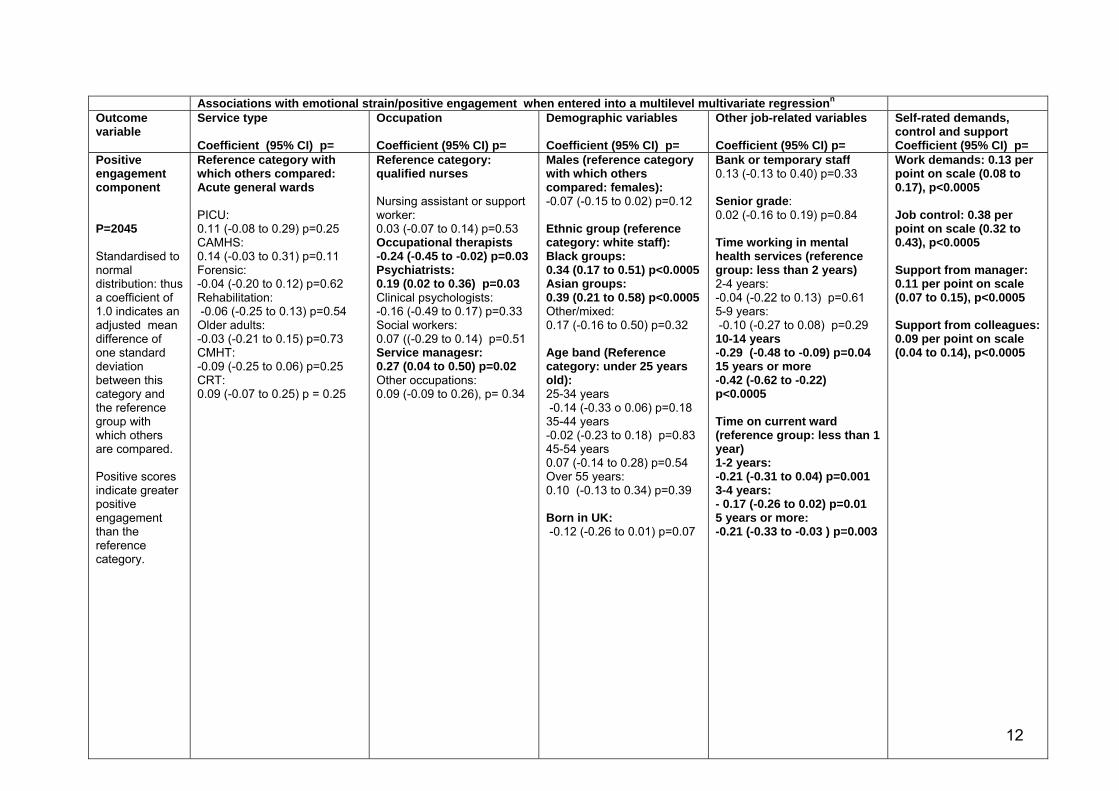
All the Karasek model variables were also associated withpositive engagement, but in the reverse direction for high jobdemands, which were associated with greater positive engagement.The association with control was especially strong, with 1 pointhigher score for control associated with a 0.38 s.d. increase inpositive engagement. Adding demand, support and control tothe model made little difference to the associations previouslydescribed with professions and demographic groups, indicatingthat perceived job characteristics do not explain these differences.
Discussion
The overall pattern of morale found in the mental health work-force was fairly encouraging. Staff tended to be satisfied with workand very satisfied with their colleagues, and they reported lowlevels of cynicism and good personal accomplishment. Where theywere burnt out, as in most previous mental health workforceinvestigations this tended to take the form of high emotionalexhaustion and the numbers reaching the threshold for casenesson the GHQ-12 were also substantial. That mental health workshould have a high emotional impact is unsurprising, but a betterunderstanding of this finding, its antecedents, its effect on patientsand any effective means of alleviating psychological strain isnonetheless desirable.
There were considerable variations between service types.Acute general ward staff had mean emotional exhaustion scoresjust above the threshold for burnout, which is a matter forconcern as these wards are numerous and have a key role in themental health system. We compared these findings with levelsreported in a previous systematic review;5 compared both withthe mixed in-patient ward samples and with the acute wardsamples in this review, emotional exhaustion in our study wasat the higher end of the range. However, many previous studieshad small samples and low response rates, so more confidence
may be placed in our findings. Less explicably, we also foundemotional exhaustion around 3 points higher than in the oneprevious large multicentre investigation of acute in-patient wardstaff morale.23 Potential sources for this difference include aslightly higher response rate in our study, a mixed professionalsample and the period of around 4 years that elapsed betweenthe earlier study and our data collection. A small prospectivecohort study of mental health staff morale showed relatively stableburnout over 2 years of follow-up;24 nonetheless, it may be thatdifferences between our study and others reflect a tendency foroverall workforce morale to fluctuate over time, especially at timesof considerable change in the NHS.
Little has previously been published on variations betweenin-patient ward types.5 Morale indicators tended to be morepositive on specialist wards, rehabilitation wards showing aparticularly exemplary pattern of high personal accomplishmentand low emotional exhaustion.
Turning to the community staff, our findings confirm aprevious observation from a London study of good crisisresolution team staff morale despite the potential stresses ofworking with an acutely ill group in community settings.25 Thesestaff rated support from colleagues very highly, suggesting apotential positive effect of the team approach implemented inCRTs. However, morale in CMHTs gives cause for concern.Despite good satisfaction, 60% of team members reached theburnout threshold on emotional exhaustion and 39% wereGHQ stressed ‘cases’. These findings echo studies from the 1990sreporting high levels of burnout among CMHT staff,26 yetburnout in the investigations of the past decade has tended tobe lower.27,28 Thus, in our study burnout seems to have revertedto levels that caused substantial concern about the teams’sustainability in the 1990s when this form of care was relativelynew.29
Relationships between morale indicators
Most correlations between the commonly used morale indicatorswere moderate, suggesting constructs that are partiallyindependent of one another. However, two principal componentscaptured 62% of the variation in the indicators, one that appearedto reflect emotional strain, the other positive engagement withwork. This structure is in keeping with the recent theory (basedon a range of occupational samples) that work-related well-beinghas two distinct underlying higher-order dimensions – negativestates of burnout and positive engagement with work.30 Futureresearch on the mental health workforce should ensure goodcoverage of these two dimensions.
Explanatory value of the demand–support–controlmodel
As in many other occupational samples,15 the explanatory value ofKarasek’s demand–support–control model was confirmed. Aselsewhere, high perceived demands were strongly associated withnegative emotional states, and the extension of Karasek’s theorythat proposes an association between good job satisfaction andengagement and high job demands, high control and high supportlevels was also supported. Autonomy in carrying out job rolesemerged as a key factor in staff well-being, strongly associatedwith both low emotional strain and high positive engagement.Support from colleagues and managers was also confirmed asassociated with both components, but more modestly than theother Karasek variables. This suggests that interventions intendedto reduce job demands or increase autonomy may be more likelyto improve morale than strategies designed to enhance support.
6
Morale in mental healthcare
A further aim was to explore how far variations in demands,control and support might account for differences between servicetypes and between professions. These variables had substantialexplanatory value for variations in emotional strain: several ofthe initially significant variations between service types andprofessional and demographic groups in emotional strain wereno longer significant with the Karasek variables in the model.Thus, for example, the lower emotional strain reported byrehabilitation ward and CRT staff can be accounted for by thefinding that staff in these services report both substantially lowerlevels of job demands and greater control (Table DS7) than acutegeneral ward staff. Higher levels of emotional strain in CMHTs,however, persisted unchanged when the Karasek variables wereadded to the model, suggesting that explanations need to besought in terms of other aspects of their culture and workingenvironments. Addition of the Karasek variables to the modelfor positive engagement had less influence on relationships withother variables, suggesting a need for alternative explanations ofits variations. For example, the striking relationship betweengreater positive engagement and non-White ethnic groups didnot appear related to differences in demand, support and controlvariables.
Limitations and strengths of the study
Strengths of our study include its size, which substantially exceedsany other investigation of the mental health workforce in thenational and international literature,4,5 both in numbersparticipating and in geographical reach and coverage of differentprofessions and subspecialties. The response rate is respectable,and we included a range of morale indicators, allowingcomparison both with previous mental health investigations andwith other samples in occupational psychology.
Limitations include the possibility of systematic differencesbetween non-responders and responders, and we had no formaltest of representativeness of the workforce as a whole. There werealso wide differences in response rates per ward, with outliers at22% and 100%; thus, scores for some wards with low responserates might have been particularly unrepresentative. Despiteexcellent numbers overall, some groups within the sample aresmall. The cross-sectional nature of the study is also a significantlimitation, especially in examination of the demand–support–control model where causality cannot be established; for example,we cannot ascertain whether those with high work demandsdevelop high levels of emotional strain, or whether the emotionallyexhausted perceive work demands as high.
Implications for research and service development
Our study suggests several questions for further investigation. Theinterrelationship of morale indicators, the extent to which they aredistinct and their potential reducibility to a smaller numberof main dimensions bears further exploration using moresophisticated psychometric techniques within both this and otherdata-sets. Other candidate explanatory variables for variations inmorale include organisational context, negative events, builtenvironment, patient population and staff personality attributes.Prospective examination of the relationship between explanatoryvariables and morale indicators is also desirable. Links betweenstaff morale and patient well-being and outcomes also remainpoorly understood.
Our study suggests a need to focus on CMHT staff, and, to alesser extent, those on acute general wards in further research anddevelopment of interventions. Our findings do not adequatelyexplain the high levels of emotional strain in CMHTs – further
quantitative and qualitative work on their antecedents, includingan analysis of the many organisational changes experienced oranticipated by CMHT staff in the NHS, might help arrive atsuch an understanding, underpinning the development ofinterventions.
Although not all differences between groups can be accountedfor by them, the Karasek model variables (demand, control/autonomy and support) have substantial associations with bothmorale components, making the model a potential basis fordeveloping interventions to raise morale. Mutual and managerialsupport tends currently to be the basis for interventions toimprove mental health workforce morale and this is supported,but the effects for support are smaller than those for demandsand autonomy. Designing interventions to reduce job demandsis a challenge in the current climate of austerity in the NHS.31
Nonetheless, initiatives such as the Productive Wardsprogramme,32 involving redesign of working environments andpractices aimed at increasing staff time available for direct patientcare and reducing other demands, may have some potential toreduce emotional strain. The substantial relationship betweenautonomy and both emotional strain and positive engagementsuggests that this relatively neglected factor might be anappropriate focus for interventions, examining in detail theorganisation of jobs and teams to identify ways in whichautonomy might be increased, especially in groups of staffreporting low levels of this factor.
Sonia Johnson, DM, David P. J. Osborn, PhD, Mental Health Sciences Unit,University College London; Ricardo Araya, PhD, School of Social and CommunityMedicine, Academic Unit of Psychiatry, University of Bristol; Elizabeth Wearn, BSc,Mental Health Sciences Unit, University College London; Moli Paul, PhD, University ofWarwick, Warwick Medical School, Coventry; Mai Stafford, PhD, Medical ResearchCouncil Unit for Lifelong Health and Ageing, London; Nigel Wellman, MSc, ThamesValley University; Fiona Nolan, PhD, Subdepartment of Clinical Health Psychology,University College London; Helen Killaspy, PhD, Brynmor Lloyd-Evans, PhD,Mental Health Sciences Unit, University College London; Emma Anderson, MSc,School of Social and Community Medicine, Academic Unit of Psychiatry, University ofBristol; Stephen J. Wood, PhD, School of Management, University of Leicester,Leicester, UK
Correspondence: Professor Sonia Johnson, Mental Health Sciences Unit,University College London, Charles Bell House, 67–73 Riding House Street,London W1W 7EY, UK. Email: [email protected]
First received 4 Jul 2011, final revision 4 Apr 2012, accepted 30 Apr 2012
Funding
This project was funded by the National Institute for Health Services and Delivery ResearchProgramme (project number/08/1604/142).
Acknowledgements
We wish to acknowledge the contribution of the other members of the In-patient StaffMorale Study research team, and are also very grateful for extensive support received fromthe North and South London, South-west, East of England and Heart of England hubs of theMental Health Research Network, and for the helpfulness of staff in the 136 participatingservices. The views and opinions expressed in this paper are those of the authors anddo not necessarily reflect those of the HS&DR programme, NIHR, NHS or the Departmentof Health.
References
1 Reid Y, Johnson S, Morant N, Kuipers E, Szmukler G, Thornicroft G, et al.Explanations for stress and satisfaction in mental health professionals: aqualitative study. Soc Psychiatry Psychiatr Epidemiol 1999; 34: 301–8.
2 Department of Health. NHS Health and Wellbeing: Final Report. Departmentof Health, 2009 (http://www.nhshealthandwellbeing.org/FinalReport.html).
3 Tansella M, Thornicroft G. Implementation science: understanding thetranslation of evidence into practice. Br J Psychiatry 2009; 195: 283–5.
4 Paris M, Hoge MA. Burnout in the mental health workforce: a review. J BehavHealth Serv Res 2010; 37: 519–28.
7
Johnson et al
5 Richards DA, Bee P, Barkham M, Gilbody SM, Cahill J, Glanville J. Theprevalence of nursing staff stress on adult acute psychiatric in-patient wards– a systematic review. Soc Psychiatry Psychiatr Epidemiol 2006; 41: 34–43.
6 Reininghaus U, Priebe S. Assessing morale in community mental healthprofessionals: a pooled analysis of data from four European countries. SocPsychiatry Psychiatr Epidemiol 2007; 42: 237–43.
7 Lasalvia A, Bonetto C, Bertani M, Bissoli S, Cristofalo D, Marella G. Influenceof perceived organisational factors on job burnout: survey of communitymental health staff. Br J Psychiatry 2009; 195: 537–44.
8 Maslach C, Jackson SE. The measurement of experienced burnout. J OccupBehav 1981; 2: 99–113.
9 Warr P. The measurement of well-being and other aspects of mental health.J Occup Psychol 1990; 63: 193–210.
10 Kersley B, Alpin C, Forth J. Inside the Workplace: First Findings From the2004 Workplace Employment Relations Survey (WERS 2004). Economic andSocial Research Council, 2005.
11 Healthcare Commission. National Health Service Staff Survey. HealthcareCommission, 2006.
12 Goldberg D, Williams P. The User’s Guide to the General HealthQuestionnaire. nferNelson, 1988.
13 Lodahl TM, Kejner M. The definition and measurement of job involvement.J Appl Psychol 1965; 49: 24–33.
14 Tummers GER, Janssen PPM, Landeweerd A, Houkes I. A comparative studyof work characteristics and reactions between general and mental healthnurses: a multi-sample analysis. J Adv Nurs 2001; 36: 151–62.
15 Karasek RA. Job demands, job decision latitude, and mental strain:implications for job redesign. Admin Sci Q 1979; 24: 285–308.
16 Johansson G, Johnson JV, Hall EM. Smoking and sedentary behavior asrelated to work organization. Soc Sci Med 1991; 32: 837–46.
17 Wood S, Stride C, Threapleton K, Wearn E, Nolan F, Osborn D, et al.Demands, control, supportive relationships and well-being amongst Britishmental health workers. Soc Psychiatry Psychiatr Epidemiol 2011; 10:1055–68.
18 De Jonge J, Kompier MAJ. A critical examination of the demand-control-support model from a work psychological perspective. Int J Stress Manag1997; 4: 235–58.
19 Haynes CE, Wall TD, Bolden RI, Stride C. Measures of perceived workcharacteristics for health services research: test of a measurement modeland normative data. Br J Health Psychol 1999; 4: 257–75.
20 SnijdersT, Bosker R. Multilevel Analysis: An Introduction to Basic andAdvanced Multilevel Modelling. Sage, 1999.
21 White IR, Royston P, Wood AM. Multiple imputation using chained equations:issues and guidance for practice. Stat Med 2011; 30: 377–99.
22 Royston P. Multiple imputation of missing values: update. Stata J 2005; 5:188–201.
23 Bowers L, Allan T, Simpson A, Jones J, Whittington R. Morale is high in acuteinpatient psychiatry. Soc Psychiatry Psychiatr Epidemiol 2009; 44: 39–46.
24 Prosser D, Johnson S, Kuipers E, Dunn G, Szmukler G, Reid Y, et al. Mentalhealth, ‘burnout’ and job satisfaction in a longitudinal study of mental healthstaff. Soc Psychiatry Psychiatr Epidemiol 1999; 34: 295–300.
25 Nelson T, Johnson S, Bebbington P. Satisfaction and burnout among staff ofcrisis resolution, assertive outreach and community mental health teams.Soc Psychiatry Psychiatr Epidemiol 2009; 44: 541–9.
26 Prosser D, Johnson S, Kuipers E, Szmukler G, Bebbington P, Thornicroft G.Mental health, ’burnout’ and job satisfaction among hospital and community-based mental health staff. Br J Psychiatry 1996; 169: 334–7.
27 Priebe S, Fakhoury WKH, Hoffmann K, Powell RA. Morale and job perceptionof community mental health professionals in Berlin and London. SocPsychiatry Psychiatr Epidemiol 2005; 40: 223–32.
28 Billings J, Johnson S, Bebbington P, Greaves A, Priebe S, Muijen M, et al.Assertive outreach teams in London: staff experiences and perceptions: Pan-London Assertive Outreach Study, Part 2. Br J Psychiatry 2003; 183: 139–47.
29 Wykes T, Stevens W, Everitt B. Stress in community care teams: will it affectthe sustainability of community care? Soc Psychiatry Psychiatr Epidemiol1997; 32: 398–407.
30 Schaufeli WB, Bakker AB. Job demands, job resources and their relationshipwith engagement and burnout: a multicentre study. J Organ Behav 2004; 25:293–315.
31 Holloway F. ‘Gentlemen, there is no money, therefore we must think’ –mental health services in hard times. Psychiatrist 2011; 35: 81–3.
32 Wilson G. Implementation of releasing time to care – the productive ward.J Nurs Manag 2009; 17: 647–54.
8
1
British Journal of Psychiatry, doi: 10.1192/bjp.bp.111.098970 Staff morale in the English mental health workforce Johnson et al.
Data Supplement

2
Table DS1 Measures of well-being in the English mental health workforce by service type
Acute general wards N =721a
CAMHS wards N=189
Forensic Wards N=219
Older adult wards N=157
Rehabilitation wards N=137
PICUs N=148
CMHTs N=258
CRTs N=216
Ward staff, unknown type N=194
Community, unknown type N=19
All ANOVAb or Chi 2c F/χ2= p=
MBI Emotional Exhaustion Mean (SD) N=2224 Max score 54
21.1d (12.7)
18.3 (10.1)
19.0 (10.8)
19.3 (13.0)
16.1 (11.3)
20.0 (11.1)
23.8(11.0)
17.7 (10.7)
20.3 (12.5)
21.1(12.3)
20.1 (12.0) Average burnoute
F = 8.87 p<0.0005
Number (%) in ‘high burnout’ group on standard norms.
347 (49%)
67 (36%) 86 (40%) 63 (41%)
39 (29%)
64 (44%)
153 (60%)
80 (38%)
82 (43%)
11 (58%)
992 (45%)
MBI Cynicism Mean (SD) N=2202 Max score 30
6.2 (6.0)
4.4 (4.1)
5.8 (5.9)
4.8 (4.9)
4.1 (4.7)
7.0 (5.9)
5.7 (5.2)
5.8 (5.2)
5.6 (5.7)
4.2 (4.7)
5.7 (5.6) Average burnout
F = 6.80 p<0.0005
Number (%) in high burnout category ‘
226 (32%)
35 (19%) 77 (36%) 31 (20%)
24 (18%)
52 (36%)
73 (29%)
57 (27%)
55 (29%)
5 (26%)
635 (29%)
MBI Personal accomplishment N=2216 Max Score 48
33.1 (8.4)
34.8 (8.1)
32.1 (8.9)
33.1 (8.7)
35.1 (7.9)
34.7 (8.1)
34.3 (7.4)
35.0 (7.7)
32.7 (8.6)
34.2 (9.3)
33.7 (8.3) Average burnout
F = 4.38 p<0.0005
% ‘Burnt out’ 193 (28%)
33 (18%) 65 (30%) 45 (29%)
32 (24%)
35 (24%)
49 (19%)
34 (17%)
57 (30%)
4 (21%)
547 (25%)
Number (%) reaching threshold for GHQ ‘caseness’ N=2140
199 (29%)
57 (31%)
47 (23%)
33 (22%)
30 (24%)
37 (27%)
98 (39%)
46 (23%)
43 (24%)
5 (31%)
559 (28%) χ2=24.9 P=0.001
Warr Anxiety-contentment (1-5 scale) N=2156
3.08 (0.71)
3.27 (0.68)
3.26 (0.60)
3.36 (0.70)
3.36 (0.67)
3.10 (0.66)
2.91 (0.75)
3.27 (0.64)
3.18 (0.73)
3.10 (0.62)
3.16 (0.70) Max 5
F=11.84 p<0.0005
Warr Depression-enthusiasm (1-5 scale) N=2158
3.37 (0.78)
3.63 (0.68)
3.55 (0.70)
3.61 (0.79)
3.60 (0.78)
3.42 (0.78)
3.32 (0.79)
3.61 (0.69)
3.34 (0.76)
3.51 (0.61)
3.46 (0.76) Max 5
8.40 p<0.0005
a Figures for number of participants per service type relate to the whole sample; the figures for respondents for each scale in the lefthand column show the no. of valid responses for each scale. The largest number of non-respondents was for anxiety-contentment (102/2258). b Throughout it should be noted that ANOVA results are unadjusted for multiple comparisons. c Statistical comparisons between groups in this and the following tables exclude staff of unknown service type. d Results presented in bold in this table fall above the ‘high burnout’ threshold according to standard norms for mental health staff on the Maslach Burnout Inventory. e Indicates that the mean for the whole sample falls into the average burnout range according to standard norms for mental health staff.
3
Table DS2 Measures of job satisfaction and Involvement by service type Acute
general wards N =721
CAMHS N=189
Forensic N=219
Older adult N=157
Rehabilitation N=137
PICU N=148
CMHT N=258
CRTs N=216
Ward staff unknown type N=194
Community staff unknown type N=19
All ANOVA F= p=
Intrinsic job satisfactionf N=2212
3.31 (0.84)
3.51 (0.78)
3.40 (0.83)
3.38 (0.74)
3.41 (0.75)
3.39 (0.79)
3.39 (0.74)
3.56 (0.71)
3.35 (0.80)
3.34 (0.79)
3.40 (0.80) Max 5
3.56 p=0.001
Satisfaction with meaningfulness of job N=2196
3.50 (0.86)
3.94 (0.66)
3.68 (0.76)
3.57 (0.80)
3.76 (0.66)
3.75 (0.63)
3.68 (0.75)
3.88 (0.64)
3.52 (0.79)
3.72 (0.73)
3.65 (0.78) Max 5
11.80 p<0.0005
Satisfaction with training / career opportunities N=2209
3.00 (0.96)
3.11 (1.00)
3.14 (0.86)
3.22 (0.90)
3.33 (0.81)
3.11 (1.00)
2.95 (0.92)
3.02 (0.90)
3.26 (0.98)
3.04 (0.93)
3.07 (0.94) Max 5
3.71 p=0.001
Satisfaction with colleagues N=2225
3.82 (0.79)
4.00 (0.71)
3.70 (0.80)
3.85 (0.82)
4.00 (0.68)
3.83 (0.75)
4.05 (0.73)
3.95 (0.75)
3.72 (0.78)
4.00 (0.68)
3.87 (0.78) Max 5
5.54 p<0.0005
Satisfaction with pay N=2230
2.46 (1.01)
2.72 (1.18)
2.52 (1.10)
2.64 (1.09)
2.63 (1.13)
2.26 (0.98)
2.75 (1.09)
2.77 (1.00)
2.45 (1.08)
2.89 (0.94)
2.56 (1.09) Max 5
43.65 p<0.0005
Job involvement N=2224
2.54 (0.79)
2.55 (0.78)
2.57 (0.85)
2.52 (0.82)
2.49 (0.70)
2.57 (0.80)
2.49 (0.70)
2.44 (0.78)
2.56 (0.87)
2.21 (0.67)
2.52 (0.79) Max 5
0.67 p=0.70
f All results in this table are calculated on a 1 to 5 scale, with 1 indicating very low satisfaction, 5 very high satisfaction and 3 neutrality.
4
Table DS3 Measures of well-being by profession Nurses
(qualified) N=1054
Nursing assistants & others without qualification N=584
Occupational therapists N=82
Psychiatrists N=135
Clinical psychologists N=44
Social workers N=86
Service managers N=111
Other occupations N=149g
ANOVA or Chi 2 F/ χ2= p=
MBI Emotional Exhaustion Mean (SD) N=2222 Max score 54
21.2h (12.19)
17.89 (11.81)
21.1(11.19)
20.5 (11.82)
20.05 (9.27)
23.0(12.15)
20.7 (17.18)
17.2 (10.87)
F=6.56 p<0.0005
Number (%) in ‘high burnout’ group – above 21
491 (47%) 219 (38%) 37 (45%) 61 (46%) 20 (46%) 46 (54%) 54 (49%) 58 (38%)
MBI Cynicism Mean (SD) N=2214 Max score 30
6.2 (5.81)
5.1 (5.51)
4.9 (5.09)
6.1 (5.57)
4.6 (3.81)
6.3 (4.89)
5.4 (4.39)
4.3 (4.80)
F=4.30 p<0.0005
Number (%) in high burnout category ‘
327 (32%) 150 (26%) 16 (19%) 42 (32%) 8 (18%) 27 (32%) 30 (28%) 20 (20%)
MBI Personal accomplishment N=2200 Max Score 48
33.7 (8.13)
32.7 (9.27)
34.4 (7.36)
34.9 (6.64)
35.3 (7.69)
33.4 (8.03)
35.8 (6.38)
35.0 (8.17)
F=2.87 p=0.006
Number (5) in high burnout category
253 (24%) 178 (31%) 17 (21%) 23 (17%) 12 (27%) 18 (21%) 13 (12%) 32 (22%)
Number (%) reaching threshold for GHQ ‘caseness’ N=2140
295 (29%) 131 (24%) 32 (40%) 29 (23%) 7 (16%) 31 (37%) 32 (32%) 35 (25%) Χ2 = 21.01 P=0.004
Warr Anxiety-contentment (1-5 scale) N=2158
3.10 (0.71)
3.26 (0.68)
3.12 (0.68)
3.16 (0.66)
3.13 (0.68)
2.90 (0.66)
3.15 (0.70)
3.36 (0.66)
F=6.24 p<0.0005
Warr Depression-enthusiasm (1-5 scale) N=2160
3.39 (0.77)
3.48 (0.74)
3.55 (0.66)
3.50 (0.75)
3.60 (0.67)
3.29 (0.76)
3.66 (0.72)
3.69 (0.74)
F=4.51 p<0.0005
g This group was a mixed group of staff with qualifications relevant to mental health work who did not fit into any of the other categories. The largest group were therapists of various types, including art, drama and music therapists, child psychotherapists and physiotherapists. h Figures in bold are group means that exceed the threshold for high burnout according to the standard norms for mental health staff for the Maslach Burnout Inventory.
5
Table DS4 Measures of job satisfaction and involvement by profession Nurses
(qualified) N=1054
Nursing assistants & others without qualification N=584
Occupational therapists N=82
Psychiatrists N=135
Clinical psychologists N=44
Social workers N=86
Service managers N=111
Other occupations N=149i
ANOVA F = p=
Intrinsic job satisfactionj N=2220
3.37 (0.80)
3.31 (0.78)
3.54 (0.72)
3.57 (0.77)
3.68 (0.89)
3.28 (0.81)
3.65 (0.80)
3.50 (0.80)
5.00 p<0.0005
Satisfaction with meaningfulness of job N=2194
3.53 (0.81)
3.76 (0.74)
3.75 (0.75)
3.83 (0.70)
4.08 (0.67)
3.56 (0.73)
3.63 (0.74)
3.87 (0.63)
5.63 p<0.0005
Satisfaction with training / career opportunities N=2207
2.98 (0.96)
3.14 (0.97)
3.06 (0.82)
3.37 (0.82)
3,14 (1.03)
3.00 (0.69)
3.15 (0.89)
3.09 (0.95)
3.90 p<0.0005
Satisfaction with colleagues N=2223
3.85 (0.77)
3.87 (0.77)
3.89 (0.81)
3.83 (0.79)
4.06 (0.72)
3.92 (0.91)
3.90 (0.70)
3.98 (0.75)
0.93 p=0.48
Satisfaction with pay N=2228
2.45 (1.04)
2.29 (1.06)
2.92 (0.94)
3.52 (0.96)
3.52 (1.05)
2.84 (0.99)
2.75 (1.02)
2.85 (1.15)
29.5 p<0.0005
Job involvement N=2222
2.45 (0.76)
2.57 (-.85)
2.37 (0.64)
2.77 (0.81)
2.56 (0.79)
2.47 (0.76)
2.69 (0.72)
2.66 (0.74)
5.63 p<0.0005
i This group was a mixed group of staff with qualifications relevant to mental health work who did not fit into any of the other categories. The largest group were therapists of various types, including art, drama and music therapists, child psychotherapists and physiotherapists. j All results in this table are calculated on a 1 to 5 scale, with 1 indicating very low satisfaction or involvement, 5 very high satisfaction or involvement and 3 neutrality.
6
Table DS5 Pearson’s correlations between morale indicators (n ranges from 2130 to 2209 depending on number of missing values) Emotional
exhaustion Cynicism Personal
accomplishment
Anxiety-contentment
Depression-enthusiasm
GHQ -12 (Log)
Intrinsic satisfaction
Job involvement
Emotional exhaustion
1.0
0.55 p<0.0005
-0.15 p<0.0005
-0.63 p<0.0005
-0.64 p<0.0005
0.65 p<0.0005
-0.45 p<0.0005
-0.12 p<0.0005
Cynicism
0.55 p<0.0005
1.0 -0.20 p<0.0005
-0.35 p<0.0005
-0.40 p<0.0005
0.40 p<0.0005
-0.30 p<0.0005
-0.12 p<0.0005
Personal accomplishment
-0.15 p<0.0005
-0.20 p<0.0005
1.0 0.27 p<0.0005
0.39 p<0.0005
-0.24 p<0.0005
0.33 p<0.0005
0.17 p<0.0005
Anxiety-contentment
-0.63 p<0.0005
-0.35 p<0.0005
0.27 p<0.0005
1.0
0.76 p<0.0005
-0.58 p<0.0005
0.53 p<0.0005
0.15 p<0.0005
Depression-enthusiasm
-0.64 p<0.0005
-0.40 p<0.0005
0.39 p<0.0005
0.76 p<0.0005
1.0
0.62 p<0.0005
0.63 p<0.0005
0.25 p<0.0005
GHQ 12 score (log transformed)
0.63 p<0.0005
0.40 p<0.0005
-0.27 p<0.0005
-0.58 p<0.0005
-0.62 p<0.0005
1.0
-0.49 p<0.0005
-0.14 p<0.0005
Intrinsic satisfaction
-0.45 p<0.0005
-0.30 p<0.0005
0.33 p<0.0005
0.53 p<0.0005
0.63 p<0.0005
-0.49 p<0.0005
1.0
0.29 p<0.0005
Job involvement
-0.12 p<0.0005
-0.12 p<0.0005
0.17 p<0.0005
0.15 p<0.0005
0.25 p<0.0005
-0.14 p<0.0005
0.29 p<0.0005
1.0
7
Table DS6 Results of multilevel analyses – variables associated with “emotional strain” and “positive engagement” components of morale Adjusted associations with morale component from multilevel regression Service type k
Coefficient (95% CI) p= ProfessionCoefficient (95% CI) p=
Demographic variables Coefficient (95% CI) p=
Other job-related variables Coefficient (95% CI) p=
Emotional strain component P=2045 Standardised to normal distribution: thus a coefficient of 1.0 indicates an adjusted mean difference of one standard deviation between this category and the reference group with which others are compared. Positive scores for variables in the columns on the right indicate greater emotional strain than the reference category.
Reference category with which others compared: Acute general ward PICU: -0.02 (-0.19 to 0.15) p=0.85 CAMHSl: -0.28 (-0.44 to -0.12) p<0.0005 Forensic: -0.21 (-0.36 to -0.06) p=0.005 Rehabilitation: -0.41 (-0.58 to -0.23) p<-0.0005 Older adults: -0.25 (-0.42 to -0.08) p=0.003 CMHT: 0.20 (0.05 to 0.35) p=0.008 CRT: -0.32 (-0.48 to -0.17) p<0.0005 Over 55 years: -0.43 (-0.70 to -0.16) p=0.002
Reference group: qualified nurses Nursing assistant or support worker: -0.20 (-0.31 to -0.08) p=0.001 Occupational therapists -0.02 (-0.25 to -0.21) p=0.89 Psychiatrists: 0.08 (-0.10 to 0.27) p=0.37 Clinical psychologists: -0.11 (-0.47 to 0.23) p=0.50 Social workers: 0.12 (-0.12 to 0.36) p=0.32 Ward managers/team leaders: 0.08 (-0.18 to 0.35) p=0.54 Other occupations: -0.21 (-0.39 to -0.02) p=0.03
Males (reference category with which others compared: females): 0.09 (-0.01 to 0.18) p=0.07 Ethnic group (reference category: white staff): Black groups: -0.09 (-0.22 to 0.03) p=0.16 Asian groups: -0.15 (-0.31 to 0.01) p=0.07 Other/mixed: -0.15 (-0.51 to 0.21) p=0.43 Age band (Reference category: under 25 years old): 25-34 years -0.10 (-0.32 to 0.13) p=0.40 35-44 years -0.08(-0.31 to 0.15) p=0.51 45-54 years -0.12 (-0.36 to -0.12) p=0.33 Marital status (Reference category: single) Married/cohabiting: -0.13 (-0.23 to -0.02) p=0.02 Divorced/separated/widowed 0.0.09 (-0.07 to 0.25) p=0.28
Bank and other temporary staff -0.40 (-0.69 to -0.12) p=0.005 Senior grade: -0.22 (-0.44 to -0.01) p=0.06 Time working in mental health services (reference group: less than 2 years) 2-4 years: 0.19 (-0.01 to 0.38) p=0.06 5-9 years: 0.26 (0.07 to 0.46) p=0.008 10-14 years 0.18 (-0.03 to 0.39) p=0.09 15 years or more 0.20 (-0.01 to 0.42) p=0.06 Time on current ward (reference group: less than 1 year) Time on current ward (reference group: less than 1 year) 1-2 years: 0.13 (-0.00 to 0.26) p=0.06 3-4 years: 0.20 (0.05 to 0.34) p=0.006 5 years or more: 0.21 (0.06 to 0.36) p=0.005
k The multivariate multilevel models in this table were obtained in three stages (1) a model was obtained with emotional strain or personal engagement as dependent variable, individuals nested within services, and age, sex and ethnic group as independnt variables (2) the effects were examined of adding the other demographic variables listed in Table 1 of the main paper to this model. These additional demographic variables were retained in subsequent models only if statistically significant (p<0.05 level). (3) the occupational variables from Table 1 were also added, including service type and occupation. Occupational variables other than service type and profession were retained in the final models only if statistically significant. l Results that are significant at at least the p<0.05 level appear in bold throughout.
8
Adjusted associations with morale component from multilevel regression Service type k
Coefficient (95% CI) p= ProfessionCoefficient (95% CI) p=
Demographic variables Coefficient (95% CI) p=
Other job-related variables Coefficient (95% CI) p=
Positive engagement component P=2045 Standardised to normal distribution: thus a coefficient of 1.0 indicates an adjusted mean difference of one standard deviation between this category and the reference group with which others are compared. Positive scores in the columns to the right indicate greater positive engagement than the reference category.
Reference category with which others compared: Acute general wards PICU: 0.09 (-0.12 to 0.31) p=0.34 CAMHS: 0.18 (-0.02 to 0.38) p=0.07 Forensic: -0.05 (-0.23 to 0.24) p= 0.56 Rehabilitation: 0.04 (-0.17 to 0.25) p=0.71 Older adults: 0.01 (-0.20 to 0.22) p=0.92 CMHT: 0.14 (-0.03 to 0.32) p=0.11 CRT: 0.15 (-0.03 to 0.33) p = 0.10
Reference category: qualified nurses Nursing assistant or support worker: -0.10 (-0.20 to 0.02) p=0.09 Occupational therapists 0.03 (-0.20 to 0.26) p=0.81 Psychiatrists: 0.31 (0.13 to 0.50) p=0.001 Clinical psychologists: 0.06 (-0.30 to 0.42) p= 0.74 Social workers: -0.13 (-0.37 to 0.10) p=0.27 Service managers: 0.40 (0.15 to 0.65) p=0.002 Other occupations: 0.17 (-0.01 to 0.36), p= 0.07
Males (reference category with which others compared: females): -0.05 (-0.14 to 0.04) p=0.24 Ethnic group (reference category: white staff): Black groups: 0.32 (0.13 to 0.51) p=0.001 Asian groups: 0.37 (0.18 to 0.57) p<0.0005 Other/mixed: 0.17 (-0.18 to 0.53) p=0.34 Age band (Reference category: under 25 years old): 25-34 years -0.12 (-0.34 to 0.09) p=0.26 35-44 years 0.01(-0.21 to 0.23) p=0.94 45-54 years 0.10 (-0.13 to 0-.33) p=0.38 Over 55 years: 0.15 (-0.10 to 0.40) p=0.24 Born in UK: -0.13 (-0.27 to 0.02) P=0.09
Bank or temporary staff 0.18 (-0.10 to 0.47) p=0.21 Senior grade: 0.19 (-0.01 to 0.39) 0.06 -1.09 Time working in mental health services (reference group: less than 2 years) 2-4 years: -0.00 (-0.20 to 0.19) p=0.97 5-9 years: -0.06 (-0.26 to 0.13) p=0.51 10-14 years -0.22 (-0.43 to -0.01) p=0.04 15 years or more -0.36 (-0.57 to -0.15) p=0.001 Time on current ward (reference group: less than 1 year) 1-2 years: -0.17 (-0.31 to 0.04) p=0.01 3-4 years: - 0.12 (-0.26 to 0.02) p=0.10 5 years or more: -0.18 (-0.33 to -0.03 ) p=0.02
9
Table DS7 Demand, control and support variables by service type Acute
general wards N =721
CAMHS wards N=189
Forensic Wards N=219
Older adult wards N=157
Rehab wards N=137
PICUs N=148
CMHT N=258
CRTs N=216
All
ANOVA Between groups difference
F p Work Demands: Mean (s.d.) N=2012 Max score=5
2.91 (0.99)
2.58 (0.92)
2.73 (1.00)
2.66 (1.05)
2.47 (0.94)
2.47 (0.87)
3.36 (1.03)
2.55 (0.91)
2.80 (1.01)
21.7 0.001
Job Control: Mean (s.d.) N=2009 Max score=5
2.99 (0.89)
3.25 (0.87)
3.03 (0.94)
3.04 (0.79)
3.36 (0.80)
3.04 (0.82)
3.65 (0.76)
3.31 (0.76)
3.17 (0.87)
20.3 0.001
Support from service manager Mean (s.d.) N=1993 Max score=5
3.31 (1.21)
3.55 (1.06)
3.40 (1.18)
3.64 (1.13)
3.65 (1.09)
3.50 (1.09)
3.28 (1.14)
3.41 (1.16)
3.41 (1.16)
3.4 0.001
Support from Colleagues Mean (s.d.) N=2009 Max score=5
3.60 (0.95)
3.63 (0.86)
3.45 (0.91)
3,59 (0.90)
3.56 (0.83)
3.52 (0.92)
3.79 (0.94)
3.68 (0.92)
3.61 (0.92)
2.7 0.008
10
Table DS8 Demand, control and support variables by profession Nurses
(qualified) N=1054
Nursing assistants & others without qualification N=584
Occupational therapists N=82
Psychiatrists N=135
Clinical psychologists N=44
Social workers N=86
Ward managers & team leaders N=111
Other occupations N=149m
ANOVA
F p
Work Demands: Mean (s.d.) N=2012 Max score=5, min score 1
2.93 (1.00)
2.29 (0.87)
3.08 (0.93)
2.82 (0.91)
3.08 (1.01)
3.34 (0.97)
3.29 (0.99)
2.52 (1.01)
38.00 <0.0005
Job Control: Mean (s.d.) N=2009 Max score=5, min score 1
3.07 (0.82)
2.81 (0.86)
3.83 (0.78)
3.50 (0.74)
4.28 (0.62)
3.34 (0.74)
3.76 (0.71)
3.44 (0.82)
52.33 <0.0005
Support from ward manager/team leader Max score=5, min score 1
3.45 (1.14)
3.48 (1.25)
3.29 (1.10)
3.21 (1.06)
3.34 (1.05)
3.11 (1.13)
3.32 (1.14)
3.56 (1.16)
2.34 0.02
Support from Colleagues Mean (s.d.) N=2009 Max score=5, min score 1
3.57 (0.89)
3.65 (0.99)
3.58 (0.99)
3.45 (0.91)
3.57 (1.04)
3.61 (1.01)
3.64 (0.82)
3.67 (0.92)
1.12 0.35
m This group was a mixed group of staff with qualifications relevant to mental health work who did not fit into any of the other categories. The largest group were therapists of various types, including art, drama and music therapists, child psychotherapists and physiotherapists.
11
Table DS9 Variables associated with positive engagement and with emotional strain - multilevel analyses including job demands, support and control Associations with emotional strain/positive engagement when entered into a multilevel multivariate regressionn
Outcome variable
Service type Coefficient (95% CI) p=
Occupation Coefficient (95% CI) p=
Demographic variables Coefficient (95% CI) p=
Other job-related variables Coefficient (95% CI) p=
Self-rated demands, control and support Coefficient (95% CI) p=
Emotional strain component P=2045 Scores are standardised to normal distribution: thus a coeffient of 1.0 indicates an adjusted mean difference of one standard deviation between this category and the reference group. Positive scores in these columns indicate greater emotional strain than the reference category.
Reference group with which others compared: Acute general wards PICU: 0.19 (0.06 to 0.33) p=0.005 CAMHS: -0.03(-0.15 to 0.09) p=0.64 Forensic: -0.11 (-0.24 to -0.00) p= 0.05 Rehabilitation: - 0.09 (0.23 to 0.05) p=0.22 Older adults: -0.12 (-0.25 to 0.01) p=0.08 CMHT: 0.22 (0.10 to 0.34) p<0.0005 CRT: -0.01 (-0.14 to 0.11) p=-0.85
Reference group: qualified nurses Nursing assistant or support worker: 0.09 (-0.00 to 0.18) p=0.05 Occupational therapists 0.05 (-0.13 to 0.24) p=0.57 Psychiatrists: 0.16 (0.01 to 0.31) p=0.03 Clinical psychologists: 0.10 (-0.17 to 0.38) p= 0.47 Social workers: -0.01 ((-0.20 to 0.18) p=0.91 Ward managers/team leaders: 0.08 (-0.15 to 0.30) p=0.49 Other occupations: 0.09 (-0.06 to 0.23) p=0.26)
Males (reference group females) 0.08 (0.01 to 0.15) p=0.03 Ethnic group (reference category: white staff): Black groups: 0.01 (-0.09 to 0.11) p=0.81 Asian groups: -0.05 (-0.18 to 0.7) p=0.40 Other/mixed: -0.13 (-0.43 to 0.17) p=0.40 Age band (Reference group: under 25 years old) 25-34 years -0.11 (-0.28 to 0.07) p=0.24 35-44 years -0.13(-0.31 to 0.06) p=0.18 45-54 years -0.20 (-0.39 to -0.01) p=0.04 Over 55 years: -0.37(-0.58 to -0.15)p=0.001 Marital status (Reference category: single) Married/cohabiting: -0.06 (-0.14 to 0.02) p=0.18 Divorced/separated/widowed 0.10 (-0.03 to 0.22) p=0.13
Bank or temporary staff-0.31 (-0.54 to -0.09) p=0.005 Senior grade -0.20 (-0.39 to -0.01) p=0.04 Time working in mental health services (reference group: less than 2 years) 2-4 years: 0.06 (-0.09 to 0.21) p=0.41 5-9 years: 0.09 (-0.07 to 0.24) p=0.27 10-14 years 0.03 (-0.14 to 0.20) p=0.70 15 years or more 0.04 (-0.12 to 0.21) p=0.61 Time on current ward (reference group: less than 1 year) 1-2 years: 0.09 (-0.02 to 0.19) p-0.10 3-4 years: 0.13 (0.02 to 0.24) p=0.02 5 years or more: 0.11 (-0.00 to 0.23) p=0.06
Work demands: 0.50 per point on 5 point scale (0.46 to 0.54), p<0.0005 Job control: -0.21 per point on 5 point scale (-0.25 to -0.26), p<0.0005 Support from manager: -0.10 per point on 5 point scale (-0.13 to - to -0.06) p<0.0005 Support from colleagues: -0.12 per 5 point scale (-0.16 to -0.08) p<0.0005
n The models in this table have been obtained by adding Karasek model variables (Job Demands, Job Control, Support from Manager, Support from Colleagues) to the models in DS6.
12
Associations with emotional strain/positive engagement when entered into a multilevel multivariate regressionn
Outcome variable
Service type Coefficient (95% CI) p=
Occupation Coefficient (95% CI) p=
Demographic variables Coefficient (95% CI) p=
Other job-related variables Coefficient (95% CI) p=
Self-rated demands, control and support Coefficient (95% CI) p=
Positive engagement component P=2045 Standardised to normal distribution: thus a coefficient of 1.0 indicates an adjusted mean difference of one standard deviation between this category and the reference group with which others are compared. Positive scores indicate greater positive engagement than the reference category.
Reference category with which others compared: Acute general wards PICU: 0.11 (-0.08 to 0.29) p=0.25 CAMHS: 0.14 (-0.03 to 0.31) p=0.11 Forensic: -0.04 (-0.20 to 0.12) p=0.62 Rehabilitation: -0.06 (-0.25 to 0.13) p=0.54 Older adults: -0.03 (-0.21 to 0.15) p=0.73 CMHT: -0.09 (-0.25 to 0.06) p=0.25 CRT: 0.09 (-0.07 to 0.25) p = 0.25
Reference category: qualified nurses Nursing assistant or support worker: 0.03 (-0.07 to 0.14) p=0.53 Occupational therapists -0.24 (-0.45 to -0.02) p=0.03 Psychiatrists: 0.19 (0.02 to 0.36) p=0.03 Clinical psychologists: -0.16 (-0.49 to 0.17) p=0.33 Social workers: 0.07 ((-0.29 to 0.14) p=0.51 Service managesr: 0.27 (0.04 to 0.50) p=0.02 Other occupations: 0.09 (-0.09 to 0.26), p= 0.34
Males (reference category with which others compared: females): -0.07 (-0.15 to 0.02) p=0.12 Ethnic group (reference category: white staff): Black groups: 0.34 (0.17 to 0.51) p<0.0005 Asian groups: 0.39 (0.21 to 0.58) p<0.0005 Other/mixed: 0.17 (-0.16 to 0.50) p=0.32 Age band (Reference category: under 25 years old): 25-34 years -0.14 (-0.33 o 0.06) p=0.18 35-44 years -0.02 (-0.23 to 0.18) p=0.83 45-54 years 0.07 (-0.14 to 0.28) p=0.54 Over 55 years: 0.10 (-0.13 to 0.34) p=0.39 Born in UK: -0.12 (-0.26 to 0.01) p=0.07
Bank or temporary staff0.13 (-0.13 to 0.40) p=0.33 Senior grade: 0.02 (-0.16 to 0.19) p=0.84 Time working in mental health services (reference group: less than 2 years) 2-4 years: -0.04 (-0.22 to 0.13) p=0.61 5-9 years: -0.10 (-0.27 to 0.08) p=0.29 10-14 years -0.29 (-0.48 to -0.09) p=0.04 15 years or more -0.42 (-0.62 to -0.22) p<0.0005 Time on current ward (reference group: less than 1 year) 1-2 years: -0.21 (-0.31 to 0.04) p=0.001 3-4 years: - 0.17 (-0.26 to 0.02) p=0.01 5 years or more: -0.21 (-0.33 to -0.03 ) p=0.003
Work demands: 0.13 per point on scale (0.08 to 0.17), p<0.0005 Job control: 0.38 per point on scale (0.32 to 0.43), p<0.0005 Support from manager: 0.11 per point on scale (0.07 to 0.15), p<0.0005 Support from colleagues: 0.09 per point on scale (0.04 to 0.14), p<0.0005
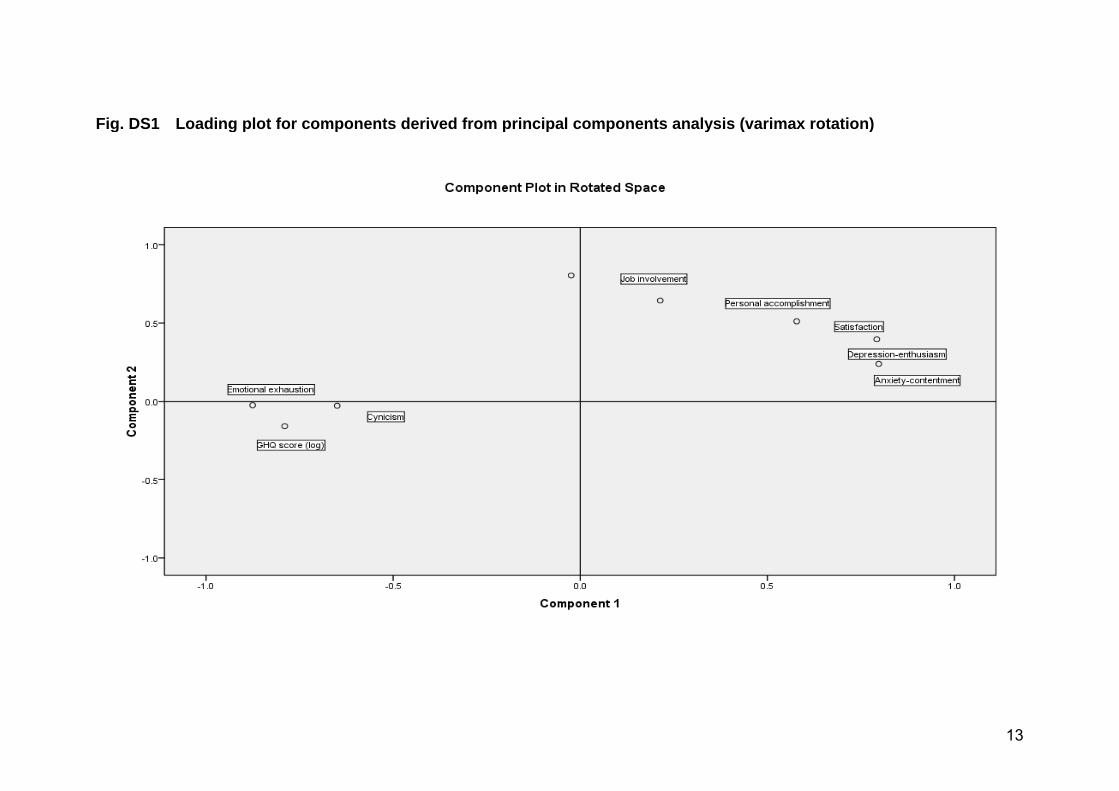
13
Fig. DS1 Loading plot for components derived from principal components analysis (varimax rotation)
10.1192/bjp.bp.111.098970 published online July 12, 2012 Access the most recent version at DOI: BJP Wellman, Fiona Nolan, Helen Killaspy, Brynmor Lloyd-Evans, Emma Anderson and Stephen J. WoodSonia Johnson, David P. J. Osborn, Ricardo Araya, Elizabeth Wearn, Moli Paul, Mai Stafford, NigelsurveyMorale in the English mental health workforce: questionnaire
MaterialSupplementary
http://bjp.rcpsych.org/content/suppl/2012/07/06/bjp.bp.111.098970.DC1Supplementary material can be found at:
Referenceshttp://bjp.rcpsych.org/content/early/2012/07/05/bjp.bp.111.098970#BIBLThis article cites 0 articles, 0 of which you can access for free at:
permissionsReprints/
[email protected] to To obtain reprints or permission to reproduce material from this paper, please
P<P Published online 2012-07-12T00:05:37-07:00 in advance of the print journal.
to this article atYou can respond /letters/submit/bjprcpsych;bjp.bp.111.098970v1
from Downloaded
The Royal College of PsychiatristsPublished by on February 15, 2018http://bjp.rcpsych.org/
digital object identifier (DOIs) and date of initial publication. theindexed by PubMed from initial publication. Citations to Advance online articles must include
final publication). Advance online articles are citable and establish publication priority; they areappeared in the paper journal (edited, typeset versions may be posted when available prior to Advance online articles have been peer reviewed and accepted for publication but have not yet
http://bjp.rcpsych.org/site/subscriptions/ go to: The British Journal of PsychiatryTo subscribe to