more examples of randomized experiments: direct...
TRANSCRIPT

More Examples of Randomized Experiments:Direct Interventions
Alexander Rothenberg
March 23, 2010
Outline
Projects designed to improve public goods through influencing theproviders directly (training, gender composition).
1. Springs Project
2. Police Project
Tomorow: monitoring projects.
Springs Project: Overview
Leino, Jessica (2007) “Gender and Community Management ofWater Infrastructure: Evidence from a Randomized Evaluation inKenya.” Working Paper
I Central Development Objective: Increasing gender equityand female participation in the management of public goods.
1. How can we increase female participation in local governance?
2. Given that females increasingly participate, are public goodsoutcomes any better?
I Evidence: An evaluation of a spring protection program inKenya. Water management committees were randomlyselected for a female participation intervention.

Springs Project: Overview
Participation intervention added to a larger study of rural waterimprovements (Kenya Rural Water Project).
I In Western Kenya, naturally occurring spring water seeps fromthe ground, especially vulnerable to contamination fromrunoff.
I Contaminated water is known to create severe healthproblems (e.g. diarrhea among young children).

Springs Project: Design
Pre-intervention surveys and randomization:
1. Identified universe of springs; June-July 2004
2. Conducted initial site visits and water quality tests, Selectionof sample; July-November 2004 (Ns = 200)
3. Spring user lists compiled; July 2004-January 2005(Ns = 200)
4. Randomization:I Springs randomly selected for one of 3 treatment waves
(Ns = 200)I Random selection of 7-8 households per spring (for surveys)
(Nh = 1500)

Treatment Area

Springs Project: Roll Out
1. Baseline Surveys: Households surveyed, water quality testedAugust 2004-February 2005
2. Wave 1: January-April 2005 (Ns = 50)I Survey 1: Households surveyed, water quality tested
April-August 2005 (Ns = 184, Nh = 1384)
3. Wave 2: August-November 2005 (Ns = 50)I Survey 2: Household surveys, water testing;
August-November 2006 (Ns = 175, Nh = 1, 250)
4. Survey 3: January-April 2006 (Ns = 100)I Household surveys, water testing; January-March 2007
(Ns = 184, Nh = 1, 231)

Unprotected Spring

Protected Spring

Water Maintenance
I After springs are protected, some maintenance activities arerequired, such as:
1. Clearing the drainage ditches around the spring, so that theconcrete encasement does not crack, or become waterlogged.
2. Keeping the area clean and free of rubbish.
3. Cutting back the grass around the spring, so that seepagecontamination is minimized.
I Maintenance activities extend the life of the spring for up to50 years.
I Poorly maintained springs: initial health benefits deteriorate in5 to 10 years.

Participation Intervention
I 1/2 of communities that received spring upgrades wererandomly assigned to receive a female participationintervention.
1. NGO workers spoke to water management committees aboutthe merits of female participation.
2. Committee meetings held in the afternoons, so more womencould attend.
3. NGO informed local elders to encourage women to attendcommittee meetings.
I Very cost-effective treatment program.

Results: Female Participation
I Average increase on committee membership is approximately1 woman (20% increase).
I Probability that a committee chair was a woman doubled.

Results: Public Goods Outcomes
I Outcome measures included:
1. # of days since grass last slashed.
2. # of days since trenches last cleared.
3. # of days since storm drain cleared.
I Central Finding: No significant differences on maintenanceoutcomes for springs with the female participationintervention.
I Very preliminary results. Maintenance outcomes measuredonly 6-12 months after the treatment.
Police Project: Overview
Banerjee, A., R. Chattopadhyay, E. Duflo, and D. Keniston (2009)“Rajasthan Police Performance and Perception Intervention.”Working Paper.
I In many developing countries, police are widely viewed to be:
1. Corrupt.2. Ineffective at fighting crime.3. Tools of political manipulation.
I Question: Can cost-effective training exercises and simplechanges in operating procedure make a difference?
I Evidence: An evaluation of a series of performanceinterventions in police departments across Rajasthan, India.

Police Project: Design
1. Baseline Surveys: Survey used identify problem areas, butalso as a benchmark for comparision (September, 2005).
I Interviews with police officers of all ranks.
I Surveys of police perception administered to members of thepublic.
2. Design of Interventions:
A In-service training programs.B Community observers.C Weekly day off / Duty rosters.D Freezing of transfers.
3. Pre-pilot: Field testing of interventions (N = 11, Feb 2006).
4. Scale up: Full sample of N = 150 stations (Jan 2007).
Police Project: Interventions
A In-service training programs
I Technical training on how to better fight crime, use ofscientific techniques.
I Improving public relations with soft-skills, such ascommunication, mediation.
I Stress management, team building, leadership improvements.
B Community observers
I Local volunteers chosen to sit in the police station.
I Observe activities and monitor police behavior.

Police Project: Interventions
C Weekly day off / Duty rosters
I Entire staff received one day off every week.
I All staff rotated tasks, given the opportunity to performmultiple tasks.
D Freezing of transfers
I All administrative transfers in the police stations wereprohibited for 1.5 years.
I Frequent police transfers had adverse effects on personal,professional lives.

Police Project: Design
I Working paper does not mention how the randomization wasactually implemented.
I Question: How would you do it?
I Form groups and discuss.I Remember: we have 4 treatments, and want to separately
identify the effects of each treatment.

Police Project: Simple Design Approach
I Simplest approach: take N = 1000 police stations, randomlyassign them to one of five groups:
1. Control Group: p = 1/5
2. Group A: p = 1/5
3. Group B: p = 1/5
4. Group C: p = 1/5
5. Group D: p = 1/5

Police Project: Cross-cutting Randomizations
I Another approach: take N = 1000 police stations, randomlyassign them to one of 9 bins:
Control Treatment C Treatment D
Control p = 1/9 p = 1/9 p = 1/9Treatment A p = 1/9 p = 1/9 p = 1/9Treatment B p = 1/9 p = 1/9 p = 1/9
I Advantage of this approach: estimate combined effects ofcertain treatments (e.g. A and C vs. B and D) separatelyfrom the direct effects of any individual treatment.
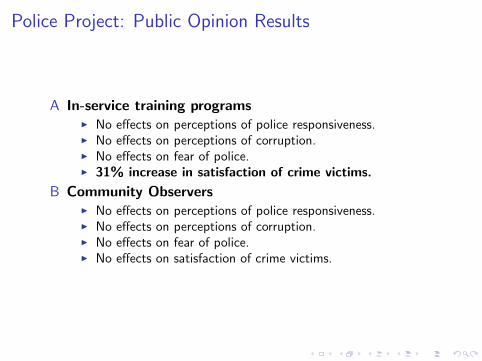
Police Project: Public Opinion Results
A In-service training programsI No effects on perceptions of police responsiveness.I No effects on perceptions of corruption.I No effects on fear of police.I 31% increase in satisfaction of crime victims.
B Community ObserversI No effects on perceptions of police responsiveness.I No effects on perceptions of corruption.I No effects on fear of police.I No effects on satisfaction of crime victims.

Police Project: Public Opinion Results
C Weekly day off / Duty rostersI 14% increase in perceptions of police responsiveness.I No effects on perceptions of corruption.I No effects on fear of police.I No effects on satisfaction of crime victims.
D Freezing of transfersI No effects on perceptions of police responsiveness.I No effects on perceptions of corruption.I 20% decrease in fear of police.I 30% increase in satisfaction of crime victims.
Police Project: Police Performance and Satisfaction Results
Note: Large attrition in the police satisfaction followup survey(40%).
1. Significant increases in police satisfaction from mostinterventions.
2. Staff complaints about certain aspects of policing decrease(especially those aspects that were treated).