morphometric analysis, genetic characterization and …nucleus.iaea.org/sites/naipc/dirsit/documents...
TRANSCRIPT

Morphometric analysis, genetic characterization and mating
compatibility studies among populations of Bactrocera
invadens from different origins
(Contract No. 16072/RO)
FIRST PROGRESS REPORT
SUBMITTED TO IAEA
International Centre of Insect Physiology and Ecology
P. O. Box 30772-00100 Nairobi, Kenya
Phone: +254 (20) 8632000; Fax: +254 (20) 8632001/2
Email: [email protected] Website: www.icipe.org
AUGUST 2011
Chief Investigator: Dr. Sunday Ekesi ([email protected])
2
Morphometric analysis, genetic characterization and mating
compatibility studies among populations of Bactrocera invadens
from different origins
(Contract No. 16072/RO)
Part of IAEA/FAO Co-ordinated Project: Resolution of Cryptic Species
Complexes of Tephritid Pests to Overcome Constraints to
SIT Application and International Trade
1ST
PROGRESS REPORT
Chief Scientific Investigator: Dr. S. Ekesi
August 10, 2011
3
EXECUTIVE SUMMARY
The report covers the period from May 2010 to May 2011. The accomplishments during the reporting
period are summarized below. For more information kindly refer to the detailed report following this
summary.
BACTROCERA INVADENS – DNA ACTIVITIES
Activity 1: Obtain collections of different populations of B. invadens from Africa and India for DNA
variation analysis, population genotype database and sharing with workers in CRP as required.
During the reporting period, contacts were established by icipe with the Director General of the
Department of Agriculture, Horticultural Crop Research and Development Institute (HORDI) (Dr. C.
Kudagamage), Peradeniya, Sri Lanka through the efforts Dr. K.A.N.P. Bandara (A Scientist at
HORDI). Sri Lanka currently has no clear policy regarding import and export of biological control
agents and the import of specimen from the country have been severely constrained by regulations
governing the UN Convention on Biological Diversity (CBD). With the regulation, most countries
including Sri Lanka have become very reluctant in sharing of biodiversity. Despite this, some efforts
were made to import few specimens of B. invadens and B. kandiensis for the current study.
Bactrocera dorsalis s.s. was imported from Hawaii and included in the analysis (see results below).
Activity 2: Screen populations for one mitochondrial (COI) and nuclear (period) gene.
Activity 2.1: Screen populations for one mitochondrial (COI): A total of 125 samples were extracted
from DNA and amplified by the forward primer LCO1490 and reverse primer HCO2198. The
evolutionary history was inferred using the Neighbor-Joining method. The first phylogenetic tree was
derived considering the B. invadens populations from Kenya, Uganda, Zaria and Sri Lanka and B.
dorsalis. The tree separated the B. invadens populations into two clusters. One cluster consisted of
the B. invadens populations from Kenya, Uganda and some individuals from B. invadens populations
of Zaria and Sri Lanka. Surprisingly, a separate branch had individuals from Sri Lanka and Zaria
clustering together and finally a clade consisting of the B. dorsalis population. Further analysis done
including B. kandiensis indicates that either the B. invadens individuals from the Zaria and Sri
Lankan populations that clustered separately are actually B. kandiensis or a type of B. invadens that is
very close to B. kandiensis. This is due to the fact that these individuals clustered on the same branch
with B. kandiensis. Overall, B. invadens from all the localities analysed seem to be in close genetic
proximity to B. dorsalis and B. kandiensis. This opens avenue for other molecular markers to be used
in order to interpret the relationship between them. Indeed, the CO1 gene is just a small region of 650
bp, so the intergenetic region between the CO1 and COII should be considered as a second target.
Activity 2.2: Screen populations for nuclear (period) gene: Although gels produced from phusion tag
and gradient PCR were accurate, the sequencing results were very poor, with either the sequences
being too short around 150 bp, which is contrary to the expected 650 bp, or too dirty to be analysed.
Over all the data could not be analysed.
BACTROCERA INVADENS – TAXONOMIC ACTIVITIES

4
Activity 1. Obtain collections of different populations of B. invadens from Africa, India and Sri Lanka
for morphometric analysis and sharing with workers in CRP.
Refer to Activity 1 of DNA activities above for results.
Activity 2. Conduct morphometric analyses involving African, Sri Lankan, and Indian populations of
B. invadens.
Projection of the populations on the first two principal axes showed a partial separation of the
populations. Bactrocera invadens populations and the other Bactrocera species belonging to the B.
dorsalis complex could not be separated by principal component analysis. However, the first two
principal components separated B. correcta, B. cucurbitae, B. oleae and B. zonata into distinct
groups. Likewise, the projection of the data on the first two canonical variate axes showed a similar
pattern of separation. Bactrocera invadens populations and the other B. dorsalis species complex
clustered together while B. correcta, B. cucurbitae, B. oleae and B. zonata distinctly separated. The
Sri Lankan B. invadens sample and B. kandiensis are very close with a distance of 6.9. When analysis
was done considering only the Sri Lankan B. invadens, B. dorsalis and B. kandiensis, the Sri Lankan
B. invadens was closer to B. kandiensis (with D2 = 7.2) than B. dorsalis (38.5). The Sri Lankan B.
invadens and B. kandiensis populations could neither be separated by the canonical variate nor the
principal component analyses and suggest that B. kandiensis could be one of the parent strain of B.
invadens although this will require additional investigations to confirm the current study.
CERATITIS FAR COMPLEX – BEHAVIOURAL STUDIES
Activity 1: Collection, establishment of colonies of the FAR group for sharing with CRP participants.
During the reporting period, fruit collections were made from different localities in Kenya for the
establishment of colonies of Ceratitis fasciventris, C. rosa and C. anonae. Ceratitis fasciventris
originated from coffee, Coffea arabica L. (Rubiaceae) in Rurima, Kenya, C. rosa from Monodora
grandidieri Welw (Annonaceae) in Koru, Kenya and C. anonae from Antiaris toxicara (Pers) Lesh
(Moraceae), a wild host from Kakamega forest, Kenya.
Shipment to the USA – Dr. Gary Steck
Specimens were prepared following procedure provided by Dr. Steck (a member of the CRP) and 30
specimens each of the following developmental stages: Egg, 1st Instar larvae, 2
nd Instar larvae, 3
rd
instar larvae, pupa and adult of the following Ceratitis species (C. capitata, C. fasciventris, C.
cosyra, C. rosa and C. anonae) were shipped to Dr. Steck via Dr. Marc De Meyer (Belgium) on 10th
February, 2011. Although not a member of the FAR group, request was made to include Ceratitis
capitata in the shipment and this was also provided as above.
Shipment to the Czech Republic – Dr. Lucie Vanickova
The following specimens were shipped to Dr. Vanickova (a member of the CRP): 100 puparia each
of the following species C. fasciventris, C. anonae, C. rosa on 6th
January, 2011. Additional 100
puparia each of the species of C. fasciventris, C. anonae, C. rosa on 8th
April, 2011. More specimens
are being prepared for shipment to the participant.
Shipment to Belgium – Dr. Virgilio and De Meyer
5
Dr. Virgilio visit icipe from Dr, De Meyer's on May 3, 2011 for a joint collection of samples of the
FAR group for DNA activities in Belgium. The survey included trips across the Central and Coast
Provinces of Kenya and fruit collections included samples of Flagellaria sp., guava and water melon
that yielded 936, 98, and 226 fruit fly puparia respectively from the host plants collected. From
Flagellaria sp., 3 male C. rosa and 30 male and 30 female C. pinnax were recovered. On guava, 10 m
and 13 female C. rosa and 3 male and 4 female C. fasciventris were recovered. On water melon, 60
male and 40 female Dacus sp. emerged. Also prior to the arrival of Dr. Virgilio, fruit collection from
Eriobotrya vaponica had been made that yielded 1 male C. rosa, 4 female C. rosa, 4 male C.
fasciventris and1 male C. fasciventris. In addition to the fruit collections, fruit fly traps were
deployed across the Central highlands of Kenya to trap the FAR group complex using pherolure and
torula yeast. Over 299 fruit fly specimens were trapped and all insect specimens were shipped to Dr.
De Meyer for identification and utilization in molecular work.
BACTROCERA CUCURBITAE – BEHAVIORAL STUDIES
Activity 2. Collection and establishment of colonies of B. cucurbitae.
Large collections of bitter gourd (Momordica charantia), pumpkin (Cucurbita maxima) and
cucumber (Cucumis melo) have been collected from different localities in Kenya and fruits are being
processed for B. cucurbitae. It is anticipated that colonies of B. cucurbitae will be established in the
next few months.
6
A. DNA ACTIVITIES
Planned Activities for the next 18 months: Bactrocera invadens
Activity 1: Obtain collections of different populations of B. invadens from Africa and India for DNA
variation analysis, population genotype database and sharing with workers in CRP.
1. Introduction
Bactrocera invadens undoubtedly has become a major species of quarantine significance yet there is
a lot of taxonomic uncertainty surrounding the insect. There is an increasing need for molecular
studies to establish the identity of the pest and studies in relation to population variability among
local populations within and between geographic regions should provide information to better
understand the identity of this insect and contributes to it management. In order to allow for
estimation of the degree of genetic relatedness among the populations across the geographical
distributional area, documenting the ancestral home range with respect to adventive populations, infer
the demographic history and the degree of differentiation of the adventive populations of each species
and perform fly traceability surveys to identify the source of invasion icipe was to contribute to the
study of the taxonomy of B. invadens by collecting samples across Africa, Sri Lanka and India and
ship to collaborators for the establishment of a population genotype database and other activities
relating to the project.
2. Material and methods
All the insect materials used in our studies were obtained through standard method of trapping with
methyl eugnol in Lynfield trap.
3. Results and discussion
During the reporting period, contacts were established by icipe with the Director General of the
Department of Agriculture, Horticultural Crop Research and Development Institute (HORDI) (Dr. C.
Kudagamage), Peradeniya, Sri Lanka through the efforts Dr. K.A.N.P. Bandara (A Scientist at
HORDI). Sri Lanka currently has no clear policy regarding import and export of biological control
agents and the import of specimen from the country have been severely constrained by regulations
governing the UN Convention on Biological Diversity (CBD). With the regulation, most countries
including Sri Lanka have become very reluctant in sharing of biodiversity. Despite this, some efforts
were made to import few specimens of B. invadens and B. kandiensis for the current study.
Bactrocera dorsalis s.s. was imported from Hawaii and included in the analysis (see results below).
Activity 2: Screen populations for one mitochondrial (COI) and nuclear (period) gene.
Activity 2.1: Screen populations for one mitochondrial (COI)
1. Introduction
DNA barcoding is a molecular technique that involves retrieval of a standard region of mitochondrial
gene, Cytochrome c oxidase 1 (CO1) at its 5’ end containing ≈ 650 base pairs gene to act as a
‘barcode’ to identify and delineate all animal life. The obtained sequence is specific for a particular
species and therefore used as a ‘tag’ or barcode in identification of organisms in the same species.
The two main goals of DNA barcoding are to assign unknown specimen to species and to enhance
7
discovery of new species and facilitate identification, particularly in cryptic and other organisms with
complex morphology (Hebert et al., 2003ab).
The barcode sequence from CO1 from each unknown specimen is then compared with a library of
reference barcode sequences derived from individuals of known identity. A specimen is identified if
its sequence closely matches one in the barcode library. Otherwise, the new record can lead to a novel
barcode sequence for a given species (i.e. a new haplotype or geographical variant), or it can suggest
the existence of a newly encountered species (Hajibabaei et al., 2007). Various gene regions have
been employed for species-level biosystematics; however, DNA barcoding advocates the adoption of
a ‘global standard’, and a 650-base fragment of the 5’ end of the mitochondrial CO1 (Hebert et al.,
2003) has gained designation as the barcode region for animals. The amplification of the 650 bp
region utilizes universal primers that are designed to amplify CO1 gene broad taxa.
Several studies have demonstrated the effectiveness of DNA barcoding in different animal groups
(Hebert et al., 2003a, b; Hebert et al., 2004; Hajibabaei et al., 2006; Smith et al., 2006). These reports
have shown that >95% of species possess unique COI barcode sequences; thus species-level
identifications are regularly attained (Hajibabaei et al., 2007). The analysis of DNA barcoding data is
usually performed by a clustering method, such as distance-based neighbor-joining (NJ) (Saitou. and
Nei, 1987), and by evaluating genetic distances within and between species.
In this study, DNA barcoding was used to investigate the population genetic structure of B. invadens
by comparing among populations in Africa with species ftom putative native origin of Sri Lanka and
also with other Bactrocera species such as B. correcta, B. cucurbitae, B. dorsalis, B. kandiensis, B.
oleae and B. zonata.
2. Materials and methods
Samples for the DNA barcoding
Alcohol preserved samples of B. invadens from Kenya (3 localities: Muranga (M), Nguruman (Ng)
and Kitui (Ki)), Uganda (Ug), Nigeria (Zaria (Zr)) and Sri Lanka (Ranbukpitiya (SL)) were used for
the studies. Other Bactrocera species included in the analysis are: B. dorsalis (Hawaii) and B.
kandiensis (Sri Lnka). Table 1 shows the samples and their collection details.
DNA extraction
DNA from individual insects was extracted using the Qiagen DNeasy®
Blood and Tissue Kit as per
manufacturer’s instructions. The DNA quality was checked by a 1% agarose gel. The samples were
then stored at -20 °C until use.
PCR amplification of the extracted DNA
DNA extracted from the insects was used as template for PCR amplifications. PCR was carried out
using universal primers, Forward primer (LCO1490) 5’-GGTCAACAAATCATAAAGATATTGG-
3’ and reverse primer (HCO2198) 5’-TAAACTTCAGGGTGACCAAAAAATCA-3’ (Folmer et al.,
1994). The PCR amplification were carried out in a volume of 20 µl containing 1x reaction Buffer,
200 µm of dNTP mix, 0.4 pmol/µl of each primer, 2.5 mM, MgCl2, 1 units Taq DNA polymerase
(Genescript) and 1 ng DNA template. Standard cycling conditions of 5 min at 94 °C, then 35 cycles
of 30 s at 94 °C, 1 min at annealing temperature of 45 °C and 1 min at 72 °C, followed by a final
elongation step of 5 min at 72 °C were used. The PCR amplification products were by 1.5% agarose
gel.

8
Table 1: Collection data of B. invadens populations and other Bactrocera species used in the studies
Region/Country Sample
name Sample site Host Coordinates
Bactrocera invadens Africa
1. Kenya
2. Uganda
3. Nigera
Ke Ug Nig
Nguruman Kawanda Zaria
ME ME ME
01°48΄32 S, 036°03΄35 E 00°49΄52 S, 031°55΄05" E 09°45΄ 03 N, 080°23΄ 00 E
Asia 1. Sri Lanka
SL
Ranbukpitiya
Tropical almond
11°06΄ N, 07°42΄ E
Bactrocera dorsalis s.s/
Bd
Hawaii
Laboratory reared
-
Bactrocera kandiensis
BK
Sri Lanka-Kandy
ME
07°16΄ 753 N, 80°35΄ 731 E
9
PCR products purification
The purification was carried out by the Sodium acetate (pH 5.2) method described below. DNA was
precipitated by 0.3 M Sodium acetate and the volume topped by ddH2O to 200 µl. Cold absolute
ethanol twice the reaction volume was added and the tubes centrifuged briefly, followed by freezing
at -20 ºC for 1 hour. The tubes were then centrifuged at 14000 RPM for 20 minutes and supernatant
discarded. The pellet was then washed with 500 µl of 70% ethanol and centrifuged again at 14000
RPM for 5 minutes. The supernatant was aspirated and discarded and the pellet air dried for 30
minutes. The purified products were run on a 1.5% for observation. The purified PCR products
were taken for Sequencing at the International Livestock Research Institute (ILRI). At this institute
sequencing services are offered commercially.
Data analysis
Sequences were assembled and edited using Chromas version 2.13 (Copyright ©
1998-2001
Technelysium Pty ltd, Queensland, Australia), and aligned in ClustalX version 1.81 (Thompson et
al., 1997). Phylogenetic and molecular evolutionary analyses were conducted using MEGA version
4 (Tamura et al., 2007). Trees were constructed using the Neighbour-joining option with
bootstrapping and using the Kimura 2 distance matrix (Kimura, 1980).
3. Results and Discussion
A total of 125 samples were extracted from DNA and amplified by the forward primer LCO1490
and reverse primer HCO2198. The PCR primers were optimised using B. invadens DNA. The
primers worked best at an annealing temperature of 45 °C. The PCR products were then purified by
Sodium acetate precipitation and sequenced. Sequencing was done with both the forward and
reverse primers. PCR products were easily produced and aligned as no insertion, deletions or stop
codons were observed. Additionally, no visualised PCR product contained double bands. These
observations support the conclusion that the sequences analysed were mitochondrial DNA and not
nuclear pseudogenes (Bensasson et al., 2001). Sequences obtained were first edited by Chromas
version 2.13 and then aligned by ClustalX version 1.81.
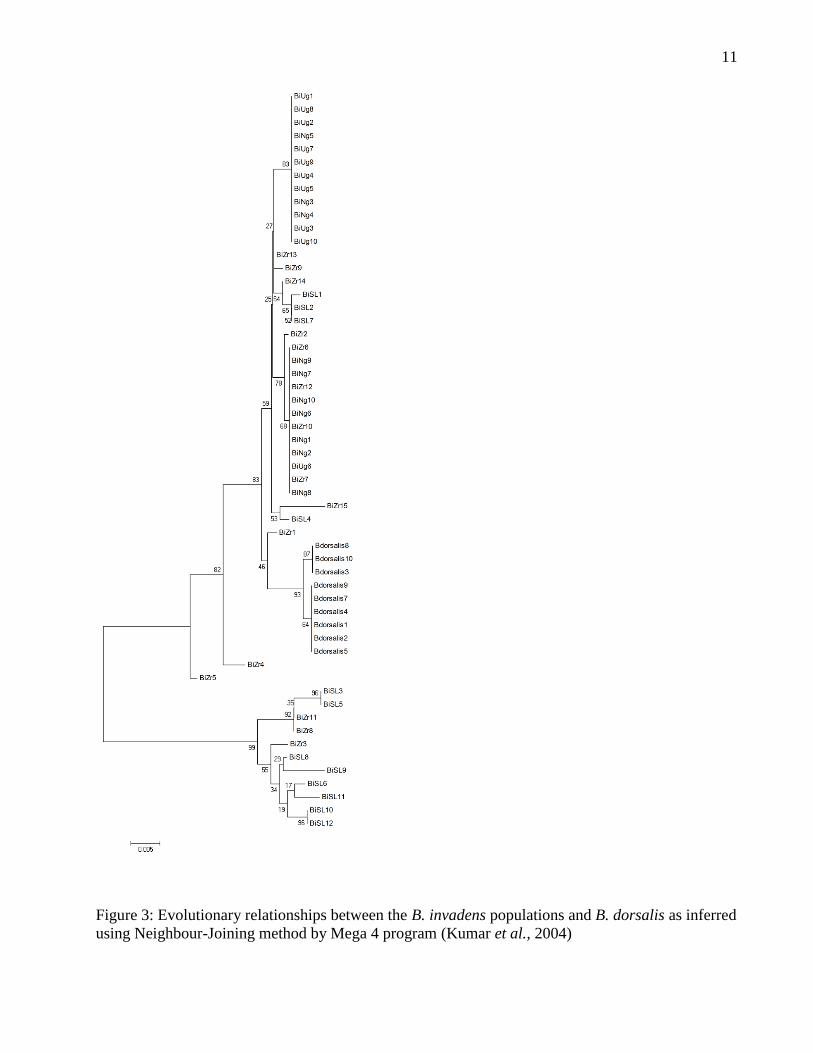
The evolutionary history was inferred using the Neighbor-Joining method (Saitou & Nei 1987). The
first phylogenetic tree was derived considering the B. invadens populations from Kenya, Uganda,
Zaria and Sri Lanka and B. dorsalis. The optimal tree with the sum of branch length = 0.13367926
is as shown (Fig. 1). The percentage of replicate trees in which the associated taxa clustered
together in the bootstrap test (500 replicates) are shown next to the branches (Felsenstein, 1985).
The tree is drawn to scale, with branch lengths in the same units as those of the evolutionary
distances used to infer the phylogenetic tree. The evolutionary distances were computed using the
Kimura 2-parameter method (Kimura, 1980) and are in the units of the number of base substitutions
per site. Codon positions included were 1st+2nd+3rd+Noncoding. All positions containing gaps and
missing data were eliminated from the dataset (Complete deletion option). There were a total of 658
positions in the final dataset.
The tree separated the B. invadens populations into two clusters. One cluster consisted of the B.
invadens populations from Kenya, Uganda and some individuals from B. invadens populations of
10
Zaria and Sri Lanka. Surprisingly, a separate branch had individuals from Sri Lanka and Zaria
clustering together and finally a clade consisting of the B. dorsalis population (Fig. 1). Further
analysis done including B. kandiensis indicates that either the B. invadens individuals from the
Zaria and Sri Lankan populations that clustered separately are actually B. kandiensis or a type of B.
invadens that is very close to B. kandiensis (Fig. 1). This is due to the fact that these individuals
clustered on the same branch with B. kandiensis.
The primers used for DNA barcoding in this study are the LCO1490 and HCO2198 (Folmer et al.,
1994) that successfully amplified the CO1 region of the mtDNA at 45 °C. Additionally, no
visualised PCR product contained double bands. These observations support the conclusion that the
sequences analysed were mitochondrial DNA and not nuclear pseudogenes (Bensasson et al., 2001).
Moreover, the alignment of COI sequences was straightforward, as indels were uncommon,
reinforcing the results of earlier work showing the rarity of indels in this gene (Mardulyn &
Whitfield 1999). Aside from their ease of acquisition and alignment, the COI sequences possessed,
as expected, a high level of diversity. Barcoding using the CO1 gene enabled the interpretation of
the relationship between B. invadens and the other Bactrocera species.
The interspecific variability was higher than the intrapecific variability as expected for the
populations analysed. The NJ tree showed different populations and species in the Bactrocera genus
clustering together and interestingly some populations clustering with B. kandiensis. DNA barcodes
do not usually have sufficient phylogenetic signal to resolve evolutionary relationships, especially at
deeper levels (Hajibabaei et al., 2006). Although its role in identifying specimens to a species level
is an important aid for taxonomic workflow, barcoding is no replacement for comprehensive
taxonomic analysis (Hajibabaei et al., 2007). Overall, B. invadens from all the localities analysed
seem to be in close genetic proximity to B. dorsalis and B. kandiensis. This opens avenue for other
molecular markers to be used in order to interpret the relationship between them. Indeed, the CO1
gene is just a small region of 650 bp, so the intergenetic region between the CO1 and COII should
be considered as a second target.
11
Figure 3: Evolutionary relationships between the B. invadens populations and B. dorsalis as inferred
using Neighbour-Joining method by Mega 4 program (Kumar et al., 2004)
12
Activity 2.2: Screen populations for nuclear (period) gene
1. Introduction
Period (per) is a gene located on the X chromosome of Drosophila melanogaster. Oscillations in
levels of both per transcript and its corresponding protein PER have a period of approximately 24
hours and together play a central role in the molecular mechanism of the Drosophila biological
clock driving circadian rhythms in eclosion and locomotor activity (Hardin et al., 1990; Dunlap,
1999). Mutations in the per gene can shorten (perS), lengthen (per
L), and even abolish (per
01) the
period of the circadian rhythm (Hardin et al., 1990). This gene can be exploited to distinguish
species on the basis of their circadian cycles.
2. Materials and Method
Sample collection
Samples of B. invadens were collected from localities in Africa and one from the supposed source
area in South East Asia. The sampling area covers regions from the eastern to the western Africa
(Table 1). East Africa includes samples from Kenya (three samples), Sudan (one sample), Tanzania
(one sample), and Uganda (one samples). West Africa region includes Nigeria (one sample), Benin
(one sample), Ghana (one samples). The South East Asia is represented by Sri Lanka. Other
Bactrocera species included in the analysis are: B. correcta (India), B. cucurbitae (Kenya), B.
dorsalis (Hawaii), B. kandiensis (Sri Lnka) B. oleae (Kenya), B. paraverbascifoliae (Sri Lanka) and
B. zonata (Mauritius).
DNA extraction and PCR
DNA from individual insects was extracted using the Qiagen DNeasy®
Blood and Tissue Kit as per
manufacturer’s instructions. PCR was carried out using per primers, Forward primer Bt-Fa
5'AAGAAGGCAACCGAAAAGGT3' and reverse primer Bt-Rc 5'
AGGTGTGATCGAGTGGAAGG 3'. The PCR amplification was carried out in a 20 µl volume
containing 1x reaction Buffer, 200 µm of dNTP mix, 0.4 pmol/µl of each primer, 2.5 mM, MgCl2, 1
units Taq DNA polymerase (Genescript) and 1 ng DNA template. Standard cycling conditions of 5
min at 94 °C, then 35 cycles of 30 s at 94 °C, 1 min at annealing temperature of 54 - 65 °C and 1
min at 72 °C, followed by a final elongation step of 5 min at 72 °C were used. PCR products were
purified and sequenced.
3. Results and Discussion
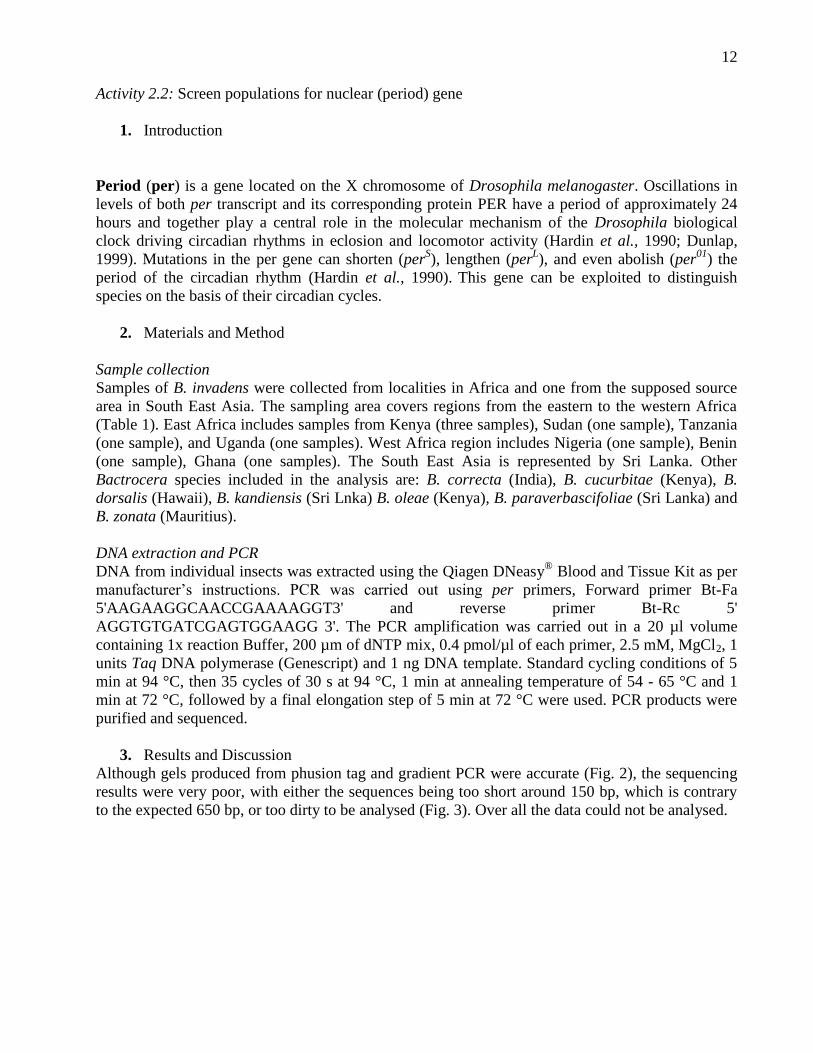
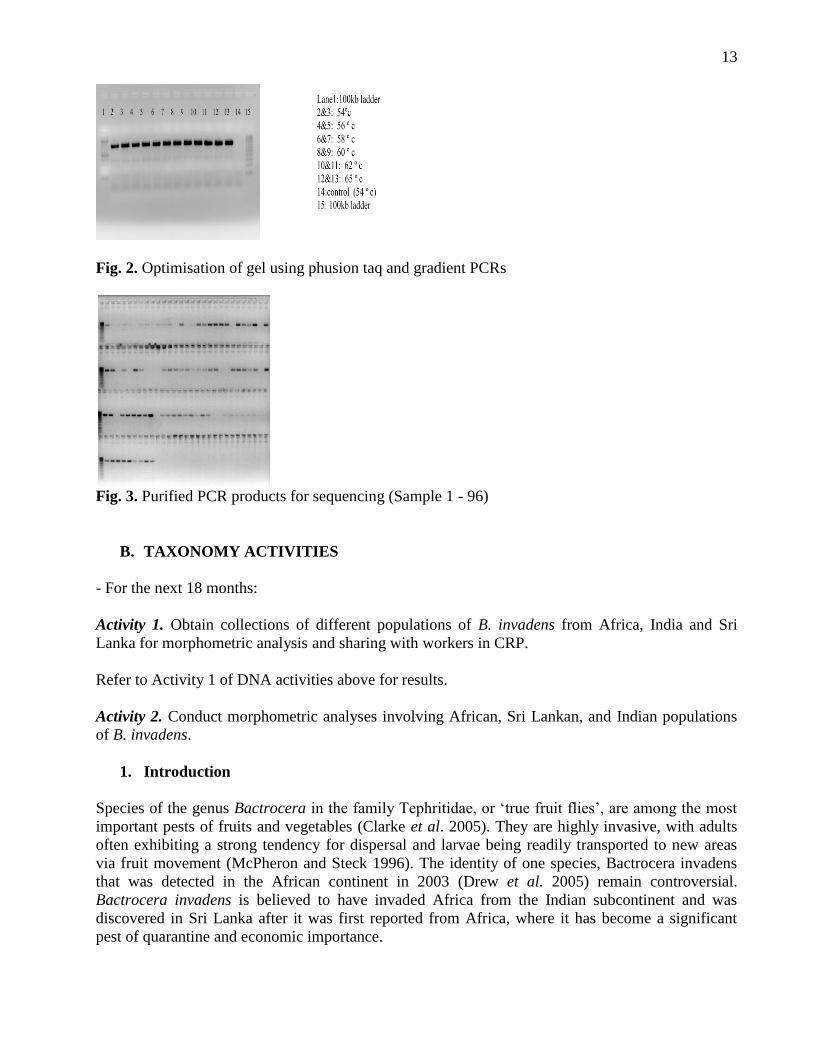
Although gels produced from phusion tag and gradient PCR were accurate (Fig. 2), the sequencing
results were very poor, with either the sequences being too short around 150 bp, which is contrary
to the expected 650 bp, or too dirty to be analysed (Fig. 3). Over all the data could not be analysed.
13
Fig. 2. Optimisation of gel using phusion taq and gradient PCRs
Fig. 3. Purified PCR products for sequencing (Sample 1 - 96)
B. TAXONOMY ACTIVITIES
- For the next 18 months:
Activity 1. Obtain collections of different populations of B. invadens from Africa, India and Sri
Lanka for morphometric analysis and sharing with workers in CRP.
Refer to Activity 1 of DNA activities above for results.
Activity 2. Conduct morphometric analyses involving African, Sri Lankan, and Indian populations
of B. invadens.
1. Introduction
Species of the genus Bactrocera in the family Tephritidae, or ‘true fruit flies’, are among the most
important pests of fruits and vegetables (Clarke et al. 2005). They are highly invasive, with adults
often exhibiting a strong tendency for dispersal and larvae being readily transported to new areas
via fruit movement (McPheron and Steck 1996). The identity of one species, Bactrocera invadens
that was detected in the African continent in 2003 (Drew et al. 2005) remain controversial.
Bactrocera invadens is believed to have invaded Africa from the Indian subcontinent and was
discovered in Sri Lanka after it was first reported from Africa, where it has become a significant
pest of quarantine and economic importance.
14
Taxonomic description by Drew et al. (2005) depicted different thoracic colourations of B. invadens
that are morphotypes of the same pest. These colour forms have been found in all localities and
countries where the insect was collected. Awareness of how much variability exist among local
populations within and between geographic regions will help in the interpretation of the biology of
the fly while also contributing to a better understanding of dynamics, habitat characteristics,
dispersal and distribution patterns, resources utilization and other ecological process.
In this study, we collected several populations of B. invadens from different African countries and
compared them with Sri Lankan populationsto determine if any morphometric differences exist
between the populations and also assess how they relate to other invasive or potentially invasive
Bactrocera species such as B. correcta, B. cucurbitae, B. dorsalis, B. kadiensis, B. oleae and B.
zonata. This will help ascertain the species limit, facilitate their reliable separation and enhance the
future development of targeted management options.
2. Materials and methods
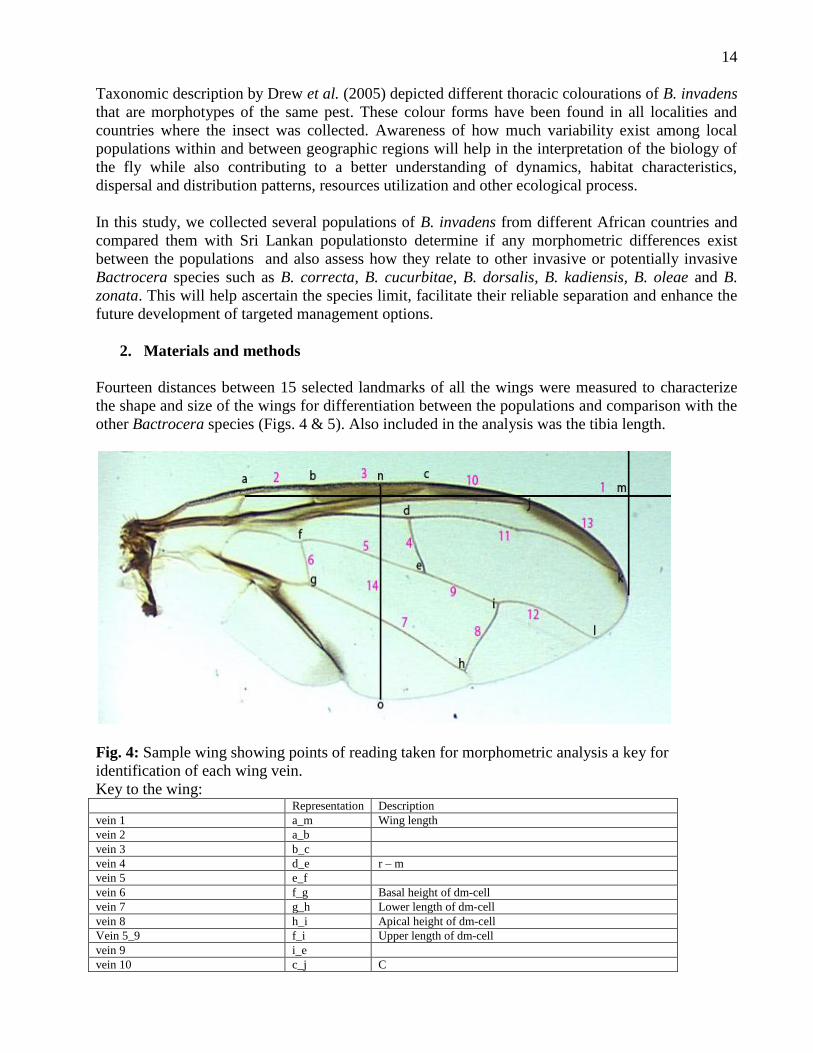
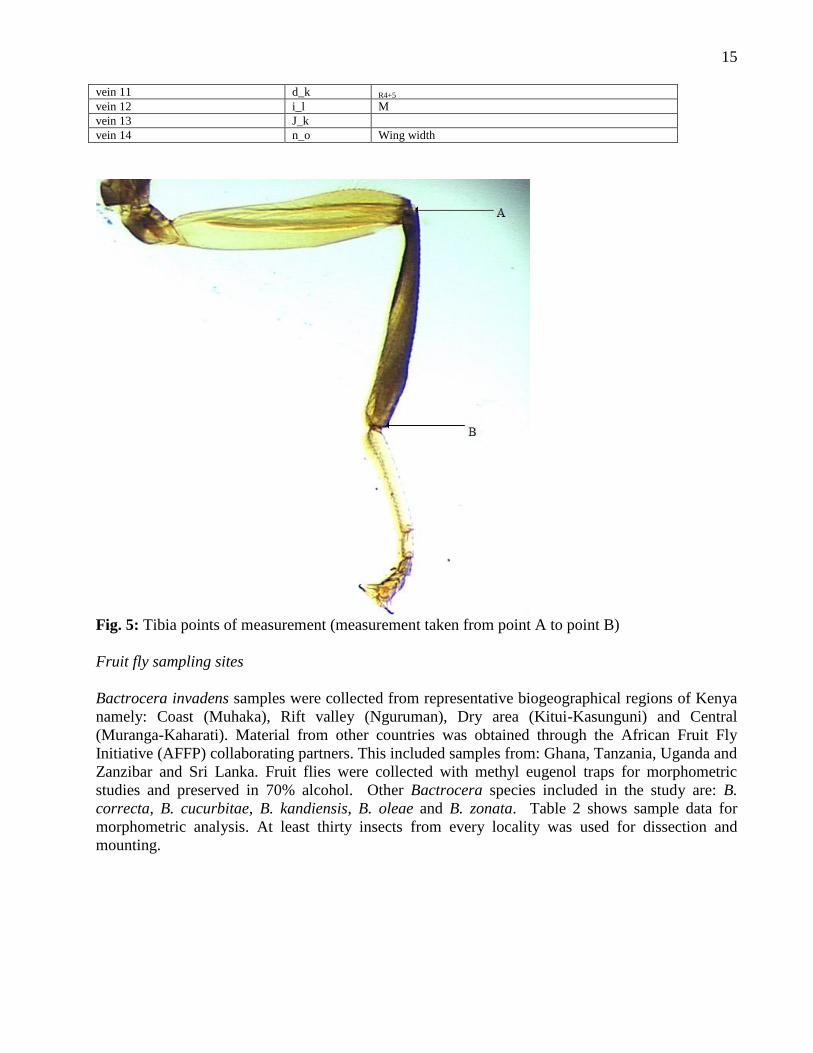
Fourteen distances between 15 selected landmarks of all the wings were measured to characterize
the shape and size of the wings for differentiation between the populations and comparison with the
other Bactrocera species (Figs. 4 & 5). Also included in the analysis was the tibia length.
Fig. 4: Sample wing showing points of reading taken for morphometric analysis a key for
identification of each wing vein.
Key to the wing: Representation Description
vein 1 a_m Wing length
vein 2 a_b
vein 3 b_c
vein 4 d_e r – m
vein 5 e_f
vein 6 f_g Basal height of dm-cell
vein 7 g_h Lower length of dm-cell
vein 8 h_i Apical height of dm-cell
Vein 5_9 f_i Upper length of dm-cell
vein 9 i_e
vein 10 c_j C
15
vein 11 d_k R4+5
vein 12 i_l M
vein 13 J_k
vein 14 n_o Wing width
Fig. 5: Tibia points of measurement (measurement taken from point A to point B)
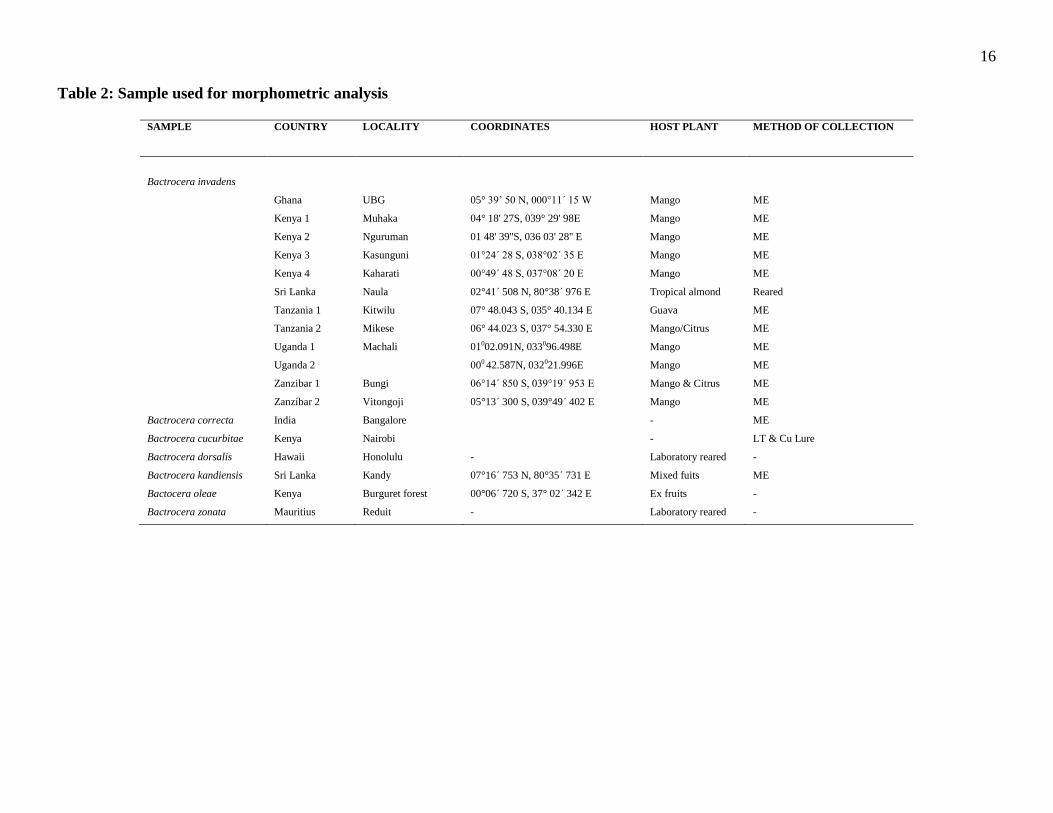
Fruit fly sampling sites
Bactrocera invadens samples were collected from representative biogeographical regions of Kenya
namely: Coast (Muhaka), Rift valley (Nguruman), Dry area (Kitui-Kasunguni) and Central
(Muranga-Kaharati). Material from other countries was obtained through the African Fruit Fly
Initiative (AFFP) collaborating partners. This included samples from: Ghana, Tanzania, Uganda and
Zanzibar and Sri Lanka. Fruit flies were collected with methyl eugenol traps for morphometric
studies and preserved in 70% alcohol. Other Bactrocera species included in the study are: B.
correcta, B. cucurbitae, B. kandiensis, B. oleae and B. zonata. Table 2 shows sample data for
morphometric analysis. At least thirty insects from every locality was used for dissection and
mounting.
16
Table 2: Sample used for morphometric analysis
SAMPLE COUNTRY LOCALITY COORDINATES HOST PLANT METHOD OF COLLECTION
Bactrocera invadens
Ghana UBG 05° 39’ 50 N, 000°11΄ 15 W Mango ME
Kenya 1 Muhaka 04° 18' 27S, 039° 29' 98E Mango ME
Kenya 2 Nguruman 01 48' 39''S, 036 03' 28'' E Mango ME
Kenya 3 Kasunguni 01°24΄ 28 S, 038°02΄ 35 E Mango ME
Kenya 4 Kaharati 00°49΄ 48 S, 037°08΄ 20 E Mango ME
Sri Lanka Naula 02°41΄ 508 N, 80°38΄ 976 E Tropical almond Reared
Tanzania 1 Kitwilu 07° 48.043 S, 035° 40.134 E Guava ME
Tanzania 2 Mikese 06° 44.023 S, 037° 54.330 E Mango/Citrus ME
Uganda 1 Machali 01002.091N, 033096.498E Mango ME
Uganda 2 000 42.587N, 032021.996E Mango ME
Zanzibar 1 Bungi 06°14΄ 850 S, 039°19΄ 953 E Mango & Citrus ME
Zanzíbar 2 Vitongoji 05°13΄ 300 S, 039°49΄ 402 E Mango ME
Bactrocera correcta India Bangalore - ME
Bactrocera cucurbitae Kenya Nairobi - LT & Cu Lure
Bactrocera dorsalis Hawaii Honolulu - Laboratory reared -
Bactrocera kandiensis Sri Lanka Kandy 07°16΄ 753 N, 80°35΄ 731 E Mixed fuits ME
Bactocera oleae Kenya Burguret forest 00°06΄ 720 S, 37° 02΄ 342 E Ex fruits -
Bactrocera zonata Mauritius Reduit - Laboratory reared -
17
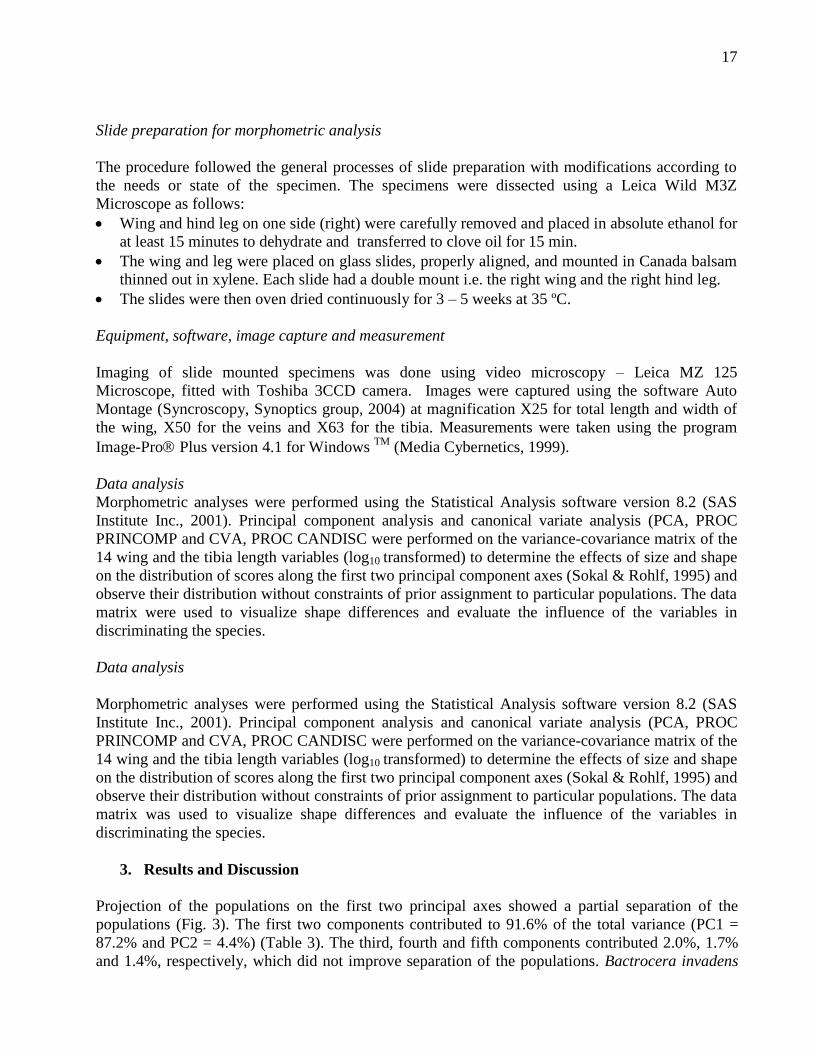
Slide preparation for morphometric analysis
The procedure followed the general processes of slide preparation with modifications according to
the needs or state of the specimen. The specimens were dissected using a Leica Wild M3Z
Microscope as follows:
Wing and hind leg on one side (right) were carefully removed and placed in absolute ethanol for
at least 15 minutes to dehydrate and transferred to clove oil for 15 min.
The wing and leg were placed on glass slides, properly aligned, and mounted in Canada balsam
thinned out in xylene. Each slide had a double mount i.e. the right wing and the right hind leg.
The slides were then oven dried continuously for 3 – 5 weeks at 35 ºC.
Equipment, software, image capture and measurement
Imaging of slide mounted specimens was done using video microscopy – Leica MZ 125
Microscope, fitted with Toshiba 3CCD camera. Images were captured using the software Auto
Montage (Syncroscopy, Synoptics group, 2004) at magnification X25 for total length and width of
the wing, X50 for the veins and X63 for the tibia. Measurements were taken using the program
Image-Pro Plus version 4.1 for Windows TM
(Media Cybernetics, 1999).
Data analysis
Morphometric analyses were performed using the Statistical Analysis software version 8.2 (SAS
Institute Inc., 2001). Principal component analysis and canonical variate analysis (PCA, PROC
PRINCOMP and CVA, PROC CANDISC were performed on the variance-covariance matrix of the
14 wing and the tibia length variables (log10 transformed) to determine the effects of size and shape
on the distribution of scores along the first two principal component axes (Sokal & Rohlf, 1995) and
observe their distribution without constraints of prior assignment to particular populations. The data
matrix were used to visualize shape differences and evaluate the influence of the variables in
discriminating the species.
Data analysis
Morphometric analyses were performed using the Statistical Analysis software version 8.2 (SAS
Institute Inc., 2001). Principal component analysis and canonical variate analysis (PCA, PROC
PRINCOMP and CVA, PROC CANDISC were performed on the variance-covariance matrix of the
14 wing and the tibia length variables (log10 transformed) to determine the effects of size and shape
on the distribution of scores along the first two principal component axes (Sokal & Rohlf, 1995) and
observe their distribution without constraints of prior assignment to particular populations. The data
matrix was used to visualize shape differences and evaluate the influence of the variables in
discriminating the species.
3. Results and Discussion
Projection of the populations on the first two principal axes showed a partial separation of the
populations (Fig. 3). The first two components contributed to 91.6% of the total variance (PC1 =
87.2% and PC2 = 4.4%) (Table 3). The third, fourth and fifth components contributed 2.0%, 1.7%
and 1.4%, respectively, which did not improve separation of the populations. Bactrocera invadens
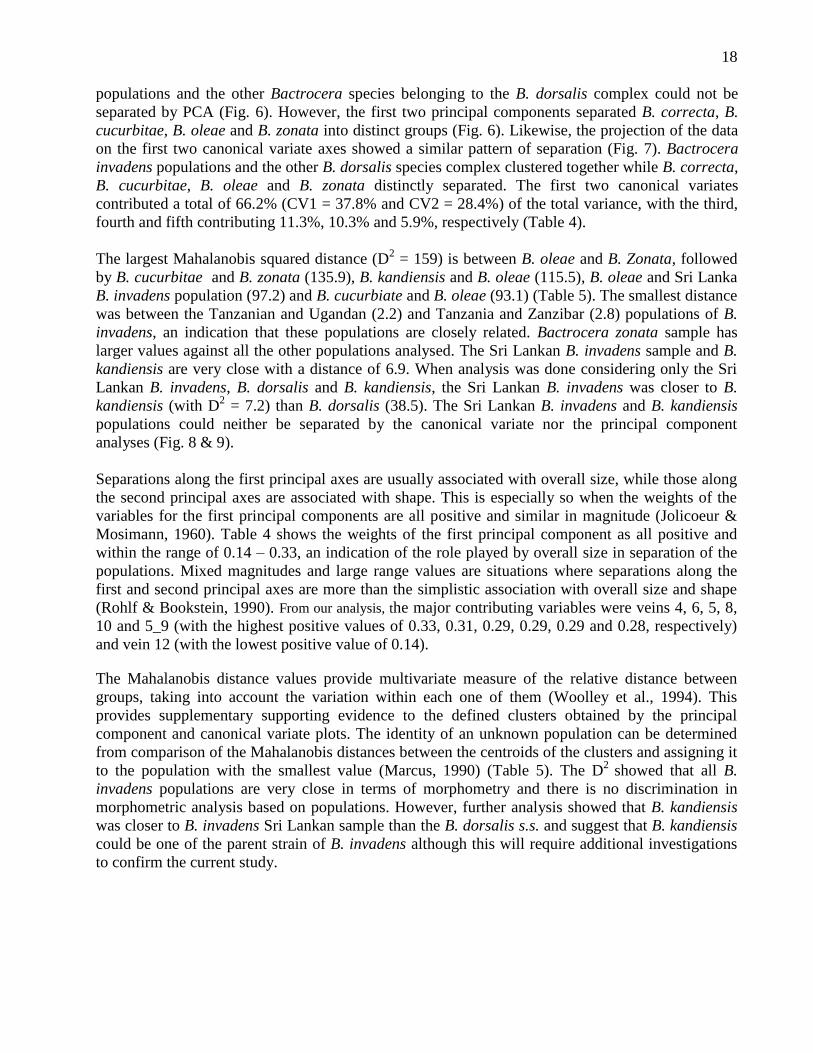
18
populations and the other Bactrocera species belonging to the B. dorsalis complex could not be
separated by PCA (Fig. 6). However, the first two principal components separated B. correcta, B.
cucurbitae, B. oleae and B. zonata into distinct groups (Fig. 6). Likewise, the projection of the data
on the first two canonical variate axes showed a similar pattern of separation (Fig. 7). Bactrocera
invadens populations and the other B. dorsalis species complex clustered together while B. correcta,
B. cucurbitae, B. oleae and B. zonata distinctly separated. The first two canonical variates
contributed a total of 66.2% (CV1 = 37.8% and CV2 = 28.4%) of the total variance, with the third,
fourth and fifth contributing 11.3%, 10.3% and 5.9%, respectively (Table 4).
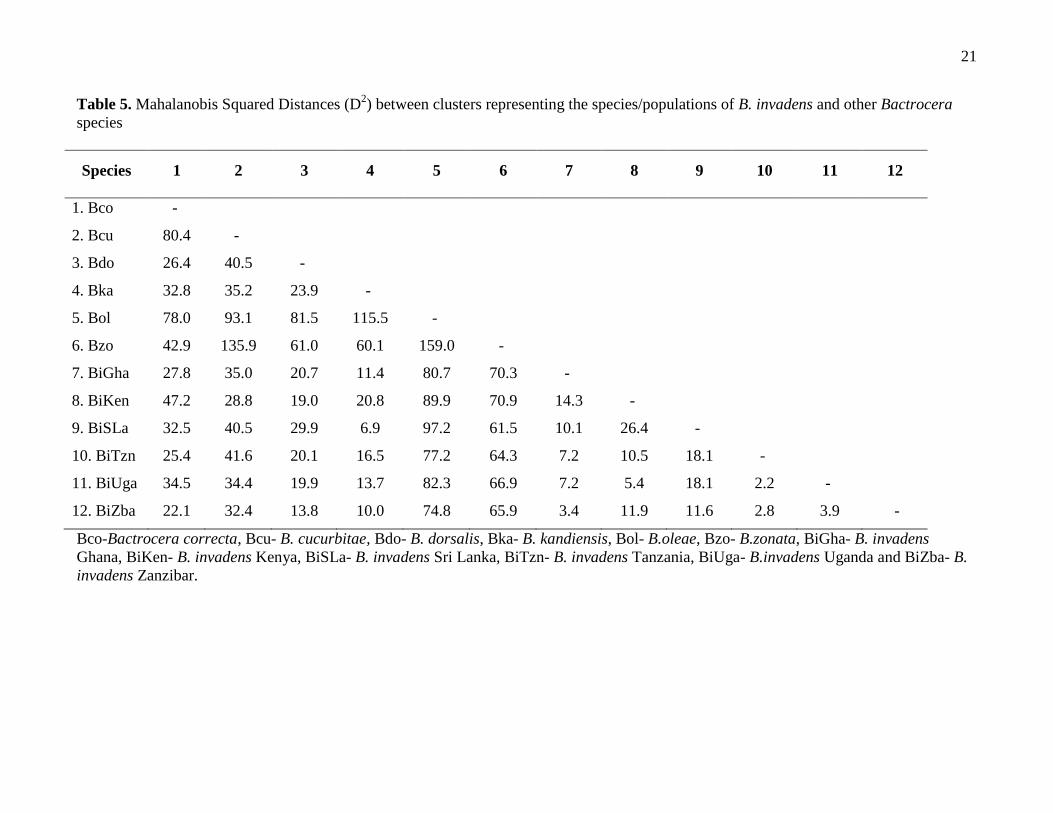
The largest Mahalanobis squared distance (D2 = 159) is between B. oleae and B. Zonata, followed
by B. cucurbitae and B. zonata (135.9), B. kandiensis and B. oleae (115.5), B. oleae and Sri Lanka
B. invadens population (97.2) and B. cucurbiate and B. oleae (93.1) (Table 5). The smallest distance
was between the Tanzanian and Ugandan (2.2) and Tanzania and Zanzibar (2.8) populations of B.
invadens, an indication that these populations are closely related. Bactrocera zonata sample has
larger values against all the other populations analysed. The Sri Lankan B. invadens sample and B.
kandiensis are very close with a distance of 6.9. When analysis was done considering only the Sri
Lankan B. invadens, B. dorsalis and B. kandiensis, the Sri Lankan B. invadens was closer to B.
kandiensis (with D2 = 7.2) than B. dorsalis (38.5). The Sri Lankan B. invadens and B. kandiensis
populations could neither be separated by the canonical variate nor the principal component
analyses (Fig. 8 & 9).
Separations along the first principal axes are usually associated with overall size, while those along
the second principal axes are associated with shape. This is especially so when the weights of the
variables for the first principal components are all positive and similar in magnitude (Jolicoeur &
Mosimann, 1960). Table 4 shows the weights of the first principal component as all positive and
within the range of 0.14 – 0.33, an indication of the role played by overall size in separation of the
populations. Mixed magnitudes and large range values are situations where separations along the
first and second principal axes are more than the simplistic association with overall size and shape
(Rohlf & Bookstein, 1990). From our analysis, the major contributing variables were veins 4, 6, 5, 8,
10 and 5_9 (with the highest positive values of 0.33, 0.31, 0.29, 0.29, 0.29 and 0.28, respectively)
and vein 12 (with the lowest positive value of 0.14).
The Mahalanobis distance values provide multivariate measure of the relative distance between
groups, taking into account the variation within each one of them (Woolley et al., 1994). This
provides supplementary supporting evidence to the defined clusters obtained by the principal
component and canonical variate plots. The identity of an unknown population can be determined
from comparison of the Mahalanobis distances between the centroids of the clusters and assigning it
to the population with the smallest value (Marcus, 1990) (Table 5). The D2
showed that all B.
invadens populations are very close in terms of morphometry and there is no discrimination in
morphometric analysis based on populations. However, further analysis showed that B. kandiensis
was closer to B. invadens Sri Lankan sample than the B. dorsalis s.s. and suggest that B. kandiensis
could be one of the parent strain of B. invadens although this will require additional investigations
to confirm the current study.

19
Fig. 6. Projection of the wing data of Bactrocera invadens compared with the other Bactrocera
species on the first two principal components
Fig. 7. Projection of the wing data of Bactrocera invadens compared with other Bactrocera species
on the first two canonical variates
-0.2
-0.2
-0.1
-0.1
0.0
0.1
0.1
0.2
-0.7 -0.5 -0.3 -0.1 0.1 0.3 0.5
Prin 1 (87.2%)
Pri
n 2
(4
.4%
)
B.correcta B. cucurbitae B. dorsalis B. kandiensis B. oleae B. zonata Ghana
Kenya Sri Lanka Tanzania Uganda Zanzibar
-8.0
-6.0
-4.0
-2.0
0.0
2.0
4.0
6.0
-10.0 -8.0 -6.0 -4.0 -2.0 0.0 2.0 4.0 6.0
Can 1 (37.8%)
Can
2 (2
8.4%
)
Ghana Kenya Sri Lanka Tanzania Uganda Zanzibar B. kandiensis
B. correcta B. cucurbitae B. oleae B. zonata B. dorsalis
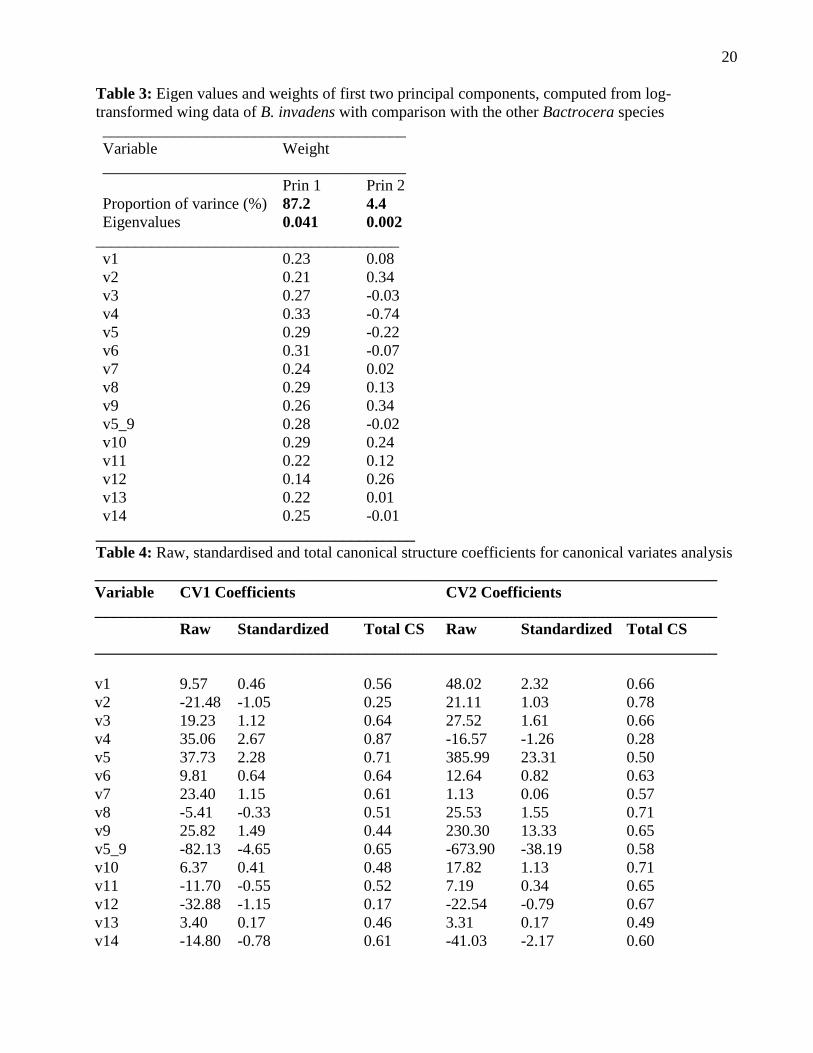
20
Table 3: Eigen values and weights of first two principal components, computed from log-
transformed wing data of B. invadens with comparison with the other Bactrocera species
______________________________________
Variable Weight
______________________________________
Prin 1 Prin 2
Proportion of varince (%) 87.2 4.4
Eigenvalues 0.041 0.002
______________________________________
v1 0.23 0.08
v2 0.21 0.34
v3 0.27 -0.03
v4 0.33 -0.74
v5 0.29 -0.22
v6 0.31 -0.07
v7 0.24 0.02
v8 0.29 0.13
v9 0.26 0.34
v5_9 0.28 -0.02
v10 0.29 0.24
v11 0.22 0.12
v12 0.14 0.26
v13 0.22 0.01
v14 0.25 -0.01
________________________________________
Table 4: Raw, standardised and total canonical structure coefficients for canonical variates analysis
______________________________________________________________________________
Variable CV1 Coefficients CV2 Coefficients
______________________________________________________________________________
Raw Standardized Total CS Raw Standardized Total CS
______________________________________________________________________________
v1 9.57 0.46 0.56 48.02 2.32 0.66
v2 -21.48 -1.05 0.25 21.11 1.03 0.78
v3 19.23 1.12 0.64 27.52 1.61 0.66
v4 35.06 2.67 0.87 -16.57 -1.26 0.28
v5 37.73 2.28 0.71 385.99 23.31 0.50
v6 9.81 0.64 0.64 12.64 0.82 0.63
v7 23.40 1.15 0.61 1.13 0.06 0.57
v8 -5.41 -0.33 0.51 25.53 1.55 0.71
v9 25.82 1.49 0.44 230.30 13.33 0.65
v5_9 -82.13 -4.65 0.65 -673.90 -38.19 0.58
v10 6.37 0.41 0.48 17.82 1.13 0.71
v11 -11.70 -0.55 0.52 7.19 0.34 0.65
v12 -32.88 -1.15 0.17 -22.54 -0.79 0.67
v13 3.40 0.17 0.46 3.31 0.17 0.49
v14 -14.80 -0.78 0.61 -41.03 -2.17 0.60
21
Table 5. Mahalanobis Squared Distances (D2) between clusters representing the species/populations of B. invadens and other Bactrocera
species
Species 1 2 3 4 5 6 7 8 9 10 11 12
1. Bco -
2. Bcu 80.4 -
3. Bdo 26.4 40.5 -
4. Bka 32.8 35.2 23.9 -
5. Bol 78.0 93.1 81.5 115.5 -
6. Bzo 42.9 135.9 61.0 60.1 159.0 -
7. BiGha 27.8 35.0 20.7 11.4 80.7 70.3 -
8. BiKen 47.2 28.8 19.0 20.8 89.9 70.9 14.3 -
9. BiSLa 32.5 40.5 29.9 6.9 97.2 61.5 10.1 26.4 -
10. BiTzn 25.4 41.6 20.1 16.5 77.2 64.3 7.2 10.5 18.1 -
11. BiUga 34.5 34.4 19.9 13.7 82.3 66.9 7.2 5.4 18.1 2.2 -
12. BiZba 22.1 32.4 13.8 10.0 74.8 65.9 3.4 11.9 11.6 2.8 3.9 -
Bco-Bactrocera correcta, Bcu- B. cucurbitae, Bdo- B. dorsalis, Bka- B. kandiensis, Bol- B.oleae, Bzo- B.zonata, BiGha- B. invadens
Ghana, BiKen- B. invadens Kenya, BiSLa- B. invadens Sri Lanka, BiTzn- B. invadens Tanzania, BiUga- B.invadens Uganda and BiZba- B.
invadens Zanzibar.
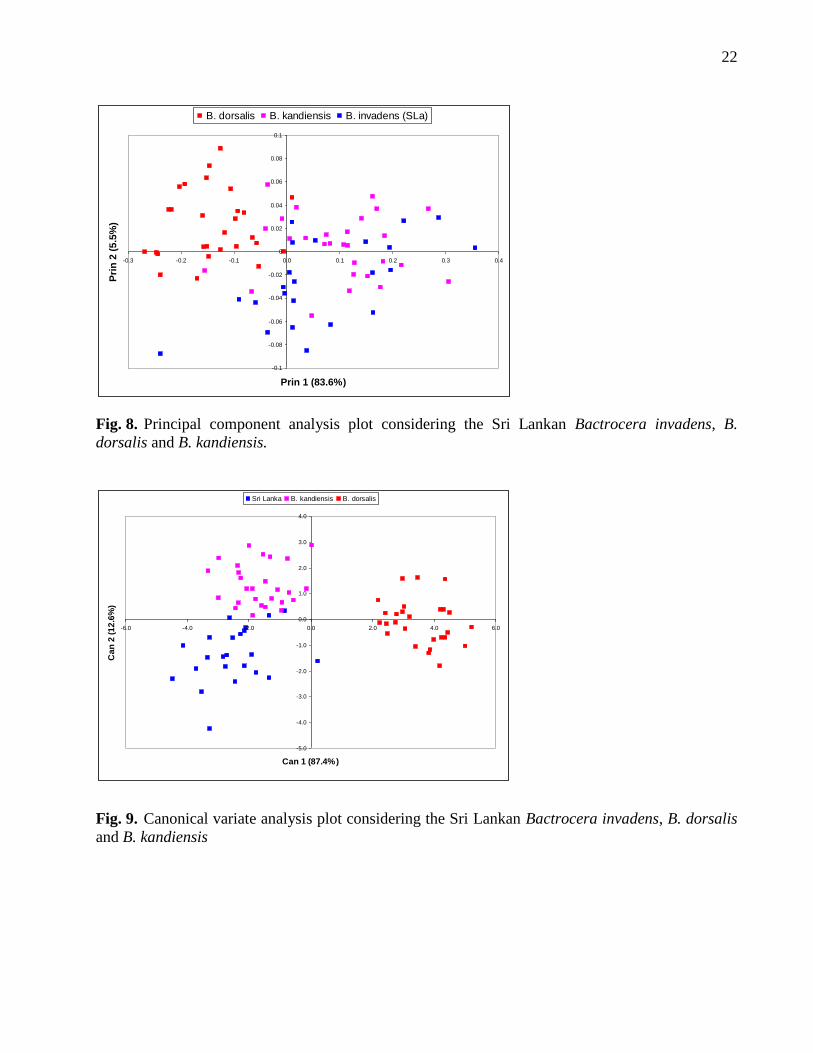
22
Fig. 8. Principal component analysis plot considering the Sri Lankan Bactrocera invadens, B.
dorsalis and B. kandiensis.
Fig. 9. Canonical variate analysis plot considering the Sri Lankan Bactrocera invadens, B. dorsalis
and B. kandiensis
-0.1
-0.08
-0.06
-0.04
-0.02
0
0.02
0.04
0.06
0.08
0.1
-0.3 -0.2 -0.1 0.0 0.1 0.2 0.3 0.4
Prin 1 (83.6%)
Pri
n 2
(5
.5%
)B. dorsalis B. kandiensis B. invadens (SLa)
-5.0
-4.0
-3.0
-2.0
-1.0
0.0
1.0
2.0
3.0
4.0
-6.0 -4.0 -2.0 0.0 2.0 4.0 6.0
Can 1 (87.4%)
Ca
n 2
(1
2.6
%)
Sri Lanka B. kandiensis B. dorsalis
23
C. BEHAVIORAL ACTIVITIES
Planned activities for the next 18 months: Collection and establishment of colonies of African
and Asian population for sharing with CRP members.
(1) Ceratitis FAR complex
Activity 1: Collection and establishment of colonies of the FAR group and sharing of specimens
with CRP partners.
During the reporting period, fruit collections were made from different localities in Kenya for the
establishment of colonies of Ceratitis fasciventris, C. rosa and C. anonae. Ceratitis fasciventris
originated from coffee, Coffea arabica L. (Rubiaceae) in Rurima, Kenya, C. rosa from Monodora
grandidieri Welw (Annonaceae) in Koru, Kenya and C. anonae from Antiaris toxicara (Pers) Lesh
(Moraceae), a wild host from Kakamega forest, Kenya.
Shipment to the USA – Dr. Gary Steck
Specimens were prepared following procedure provided by Dr. Steck (a member of the CRP) and
30 specimens each of the following developmental stages: Egg, 1st Instar larvae, 2
nd Instar larvae,
3rd
instar larvae, pupa and adult of the following Ceratitis species (C. capitata, C. fasciventris, C.
cosyra, C. rosa and C. anonae) were shipped to Dr. Steck via Dr. Marc De Meyer (Belgium) on 10th
February, 2011. Although not a member of the FAR group, request was made to include Ceratitis
capitata in the shipment and this was also provided as above.
Shipment to the Czech Republic – Dr. Lucie Vanickova
The following specimens were shipped to Dr. Vanickova (a member of the CRP): 100 puparia each
of the following species C. fasciventris, C. anonae, C. rosa on 6th
January, 2011. Additional 100
puparia each of the species of C. fasciventris, C. anonae, C. rosa on 8th
April, 2011. More
specimens are being prepared for shipment to the participant.
Shipment to Belgium – Dr. Virgilio and De Meyer
Dr. Virgilio visit icipe from Dr, De Meyer's on May 3, 2011 for a joint collection of samples of the
FAR group for DNA activities in Belgium. The survey included trips across the Central and Coast
Provinces of Kenya and fruit collections included samples of Flagellaria sp., guava and water
melon that yielded 936, 98, and 226 fruit fly puparia respectively from the host plants collected.
From Flagellaria sp., 3 male C. rosa and 30 male and 30 female C. pinnax were recovered. On
guava, 10 m and 13 female C. rosa and 3 male and 4 female C. fasciventris were recovered. On
water melon, 60 male and 40 female Dacus sp. emerged. Also prior to the arrival of Dr. Virgilio,
fruit collection from Eriobotrya vaponica had been made that yielded 1 male C. rosa, 4 female C.
rosa, 4 male C. fasciventris and1 male C. fasciventris. In addition to the fruit collections, fruit fly
traps were deployed across the Central highlands of Kenya to trap the FAR group complex using
pherolure and torula yeast. Over 299 fruit fly specimens were trapped and all insect specimens were
shipped to Dr. De Meyer for identification and utilization in molecular work.

24
(2) Bactrocera cucurbitae
Activity 1. Collection and establishment of colonies of B. cucurbitae.
Large collections of bitter gourd (Momordica charantia), pumpkin (Cucurbita maxima) and
cucumber (Cucumis melo) have been collected from different localities in Kenya and fruits are
being processed for B. cucurbitae. It is anticipated that colonies of B. cucurbitae will be established
in the next few months.

25
References
Adsavakulchai A, Baimai V, Prachyabrued W, Grote PJ, Lertlum S. (1999). Morphometric
study for identification of the Bactrocera dorsalis complex (Diptera: Tephritidae) using
wing image analysis. Biotropica 13:37–48.
Baxter M. J. (1995). Standardization and Transformation in Principal Component Analysis, with
Applications to Archaeometry. Applied. Statististics. V44(4), 513-527
Clarke A.R., Armstrong K.F., Carmichael A.E., Milne J.R., Raghu S., Roderick G.K. &
Yeates D.K. (2005). Invasive phytophagous pests arising through a recent evolutionary
radiation: the Bactrocera dorsalis complex of fruit flies. Annual Review of Entomology 50,
293-319.
Drew R.A.I. & Hancock D.L. (1994). The Bactrocera dorsalis complex of fruit flies (Diptera:
Tephritidae: Dacinae) in Asia. Bulletin of Entomological Research, Supplement Series 2: 1-
68.
Drew R.A.I., Tsuruta K. & White. I.M. (2005). A new species of pest fruit fly (Diptera:
Tephritidae: Dacinae) from Sri Lanka and Africa. African Entomology, 13: 149-154.
Drew R.A.I, Raghu S. & Halcoop P. (2008). Bridging the morphological and biological species
concepts: studies on the Bactrocera dorsalis (Hendel) complex (Diptera: Tephritidae:
Dacinae) in South-east Asia. Biological Journal of the Linnean Society, 93, 217–226.
Felsenstein J. (1985). Confidence limits on phylogenies: An approach using the bootstrap.
Evolution 39:783-791.
Folmer O., Black M., Hoeh W., Lutz R. & Vrijenhoek R. (1994). DNA primers for amplification
of mitochondrial cytochrome c oxidase subunit I from diverse metazoan invertebrates.
Molecular Marine Biological Biotechnology 3: 294–299.
French C. (2005). The new invasive Bactrocera species. pp. 19-20 in Insect Pest Control
Newsletter, No. 65. International Atomic Energy Agency, Vienna, Austria.
Hajibabaei M., de Waard R., Ivanova V., Ratnasingham S., Dooh T., Kirk L., Mackie M. &
Hebert P.D.N. (2005). Critical factors for assembling a high volume of DNA barcodes.
Philosophical Transactions of the Royal Society (London) B Biological Science 360: 1959–
1967.
Hajibabaei M. et al. (2006) DNA barcodes distinguish species of tropical Lepidoptera. Proc. Natl.
Acad. Sci. U. S. A. 103, 968–971.
Hajibabaei M., Singer G.A., Hebert P.D.N. & Hickey D.A.C. (2007). DNA barcoding: how it
complements taxonomy, molecular Phylogenetics and population genetics. Science direct
10:1-6.
Hebert P.D., Cywinska A., Ball S.L. & de Waard J.R. (2003a). Biological identifications through
DNA barcodes. Proceedings of the Royal Society B 270: 313–321.
Hebert P.D.N., Ratnasingham S. & de Waard J.R. (2003b). Barcoding animal life: cytochrome c
oxidase subunit 1 divergences among closely related species. Proc. R. Soc. Lond. B Biol.
Sci. 270 (Suppl.): S96–S99.
Hebert P.D., Penton E.H., Burns J.M., Janzen D.H. & Hallwachs W. (2004). Ten species in
one: DNA barcoding reveals cryptic species in the neotropical skipper butterfly Astraptes
fulgerator. Proceedings of the National Academy of Sciences USA 101: 14 812–14 817.
Kimura M. (1980). A simple method for estimating evolutionary rate of base substitutions through
comparative studies of nucleotide sequences. Journal of Molecular Evolution. 16: 111–120.
Kumar S, Tamura K & Nei M (2004). MEGA3: Integrated Software for Molecular Evolutionary
Genetics Analysis and Sequence Alignment. Briefings in Bioinformatics 5:150-163.
26
Lawson A.E., McGuire D.J., Yeates D.K., Drew R.A.I., Clarke A.R. (2003). Dorsalis: an
interactive identification tool to fruit flies of the Bactrocera dorsalis complex. CD-ROM
Publication, Griffith University, Brisbane, Australia.
Lux S.A., Copeland R.S. White I.M., Manrakhan A. & Billah M.K. (2003). A New Invasive
Fruit Fly Species from the Bactrocera dorsalis (Hendel) Group Detected in East Africa.
Insect Science and Its Application, 23(4): 355–361.
Lux S.A., Ekesi S., Dimbi S., Mohamed S. & Billah M (2003). Mango-infesting fruit flies in
Africa: Perspectives and limitations of biological approaches to their management. In
Biological Control in IPM Systems in Africa (Edited by P. Neuenschwander, C.
Borgemeister and J. Langewald). CABI, Wallingford.
Marcus L.F. (1990). Traditional morphometrics, In: Proceeding of the Michigan Morphometrics
Workshop. Special Publication No. 2, University of Michigan. Museum of Zoology: Ann
Arbor pp. 77-122.
Marshall E. (2005). Taxonomy. Will DNA barcodes breath life into classification? Science
(Washington, D.C.), 307: 1037.
McPheron B.A. & Steck G.J. (1996). Fruit Fly Pests: A world assesessment of their biology and
management. St Lucie Press, Delray Beach, FL.
Meyer C.P. & Paulay G. (2005). DNA barcoding: error rates based on comprehensive sampling.
PLoS Biol. 3, e422.
Moritz C. & Cicero C. (2004). DNA barcoding: promise and pitfalls. PLoS Biol. 2, 1529–1531.
R Development Core Team (2011). R: A language and environment for statistical computing. R
Foundation for Statistical Computing, Vienna, Austria. ISBN 3-900051-07-0, URL
http://www.R-project.org/.
Ratnasingham S. & Hebert P. (2007). BOLD: The Barcode of Life Data System. Molecular
Ecology Notes 10: 1-10.
Rice R.E., Phillips P.A., Stewart-Leslie J. & Sibbett G.S. (2003). Olive fruit fly populations
measured in central and southern California. California Agriculture, 57, 122-127.
Saitou N. & Nei M. (1987) The neighbor-joining method: a new method for reconstructing
phylogenetic trees. Mol. Biol. Evol. 4, 406–425.
Smith M.A., Smith M.A., Woodley N.E., Janzen D.H., Hallwachs W., Hebert P.D.N., (2006). DNA barcodes reveal cryptic host-specificity within the presumed polyphagous members of
a genus of parasitoid flies (Diptera: Tachinidae). Proc. Natl. Acad. Sci. U. S. A. 103, 3657–
3662.
Sokal R.R. & Rohlf F.J. (1995). Biometry: The principles and Practice of Statistics in Biological
Research. 3rd
Edition. W. H. Freeman & Company, USA. 887 pp.
Thompson J.D., Gibson T.J., Plewniak F., Jeanmougin F. & Higgins D.G. (1997). The ClustalX
windows interface: flexible strategies for multiple sequence alignment aided by quality
analysis tools. Nucleic Acids Research, 24:4876-4882.
White I.M. & Elson-Harris M.M. (1992). Fruit flies of economic ignificance: their Identification and
bionomics. C.A.B International and Australian Centre for International Agricultural Research.
601 pp.
Woolley J.B. & Browning H.W. (1987). Morphometric analysis of uniparental Aphytis reared from
Chaff scale, Pariatoria pergondii Comstock, on Texas citrus (Hymenoptera: Aphelinidae,
Homoptera: Diaspididae). Proceedings of the Entomological Society of Washington, 89: 77-
94.
Woolley J.B., Rose M. & Krauter P. (1994). Morphometric comparisons of Aphytis species in the
lingnanensis group (Hymenoptera: Aphelinidae). Chapter 12, pp. 223-244, In: Rosen, D.,
(Ed). Advances in Aphytis Research. Intercept Ltd., Andover, UK, 362 pages.