morton college your text · pdf file · 2017-09-27your text here morton college...
TRANSCRIPT
Your text here
Morton College
www.morton.edu
Annual Budget Fiscal Year 2018
District 527 Cicero, Illinois
FISCAL YEAR 2018 BUDGET
Prepared by:
Mireya Perez, Chief Financial Officer David A. Gonzalez, Treasurer
Morton College District 527 3801 S. Central Ave. Cicero, Illinois 60804
(708) 656-8000 www.morton.edu

MORTON COMMUNITY COLLEGE
FISCAL YEAR 2018 BUDGET
TABLE OF CONTENTS
INTRODUCTION 1 Transmittal Letter
5 Principal Officials
GRAPHICAL INFORMATION
6 Operating Fund– Revenues By Source
8 Operating Fund– Expenditures By Object
10 Operating Fund– Expenditures By Program
11 Education Fund– Expenditures By Object
12 Operations & Maintenance Fund– Expenditures By Object
Financial
13 Educational Philosophy and Mission
17 Financial Reporting and Funds
19 General Overview
20 Operating Fund Review
21 Budgeted Revenues & Expenditures Fiscal Year 2018 (Summary)
22 Budgeted Revenues & Expenditures Fiscal Year 2018
23 Budgeted Operating Revenue by Source Fiscal Year 2018
24 Budgeted Expenditures by Object Fiscal Year 2018
25 Fiscal Year 2018 Revenue & Expenditures by Fund
Statistical Information 40 Changes in Net Position
41 Operating Expenses by Function
42 Property Tax Levies and Collections
43 Debt Capacity
Resolutions 44 2017 – 2018 Budget Legal Notice

MORTON COMMUNITY COLLEGE
FISCAL YEAR 2018 BUDGET
Introduction
Transmittal Letter
Principal Officials

MORTON COLLEGE Community College District No. 527
Annual Budget July 1, 2017 to June 30, 2018
Presented is the Annual Budget of Morton College for the fiscal year ending June 30, 2018. The College’s financial plan has been developed utilizing a comprehensive, systematic approach designed to make the budget more easily understood. BACKGROUND Morton Community College District No. 527 was established on September 5, 1924 and provides baccalaureate-oriented, career-oriented and continuing education courses to a six suburb community. The District is located approximately 12 miles west of downtown Chicago, Illinois with a viable transportation network including I-290 (Eisenhower Expressway) and I-55 (Stevenson Expressway) just to the north and south, respectively, Metra’s Burlington Northern and the Chicago Transit Authority. The Board of Trustees, which is elected by residents within the District, is the District’s ruling body that establishes the policies and procedures by which the College is governed. This District is known for its academic excellence, dedicated teaching, small classes, friendly atmosphere, personalized learning and affordability. The College offers educational programs and support services to students at an affordable cost. The programs and services offered by the College prepare students for an education that leads to a bachelor’s degree, job entry and career advancement and developmental education. The College also provides opportunities for lifelong learning and develops and conducts programs and activities that enhance the cultural, civic and economic life of the community. The College serves approximately 160,000 residents of the District which encompasses the communities of Berwyn, Cicero, Forest View, Lyons, McCook and Stickney. The 37.12 acre campus contains five buildings with state of the art classrooms and science laboratories, a 350 seat theatre, 50,000 piece library, a 1,000 seat gymnasium and a physical fitness center.
1
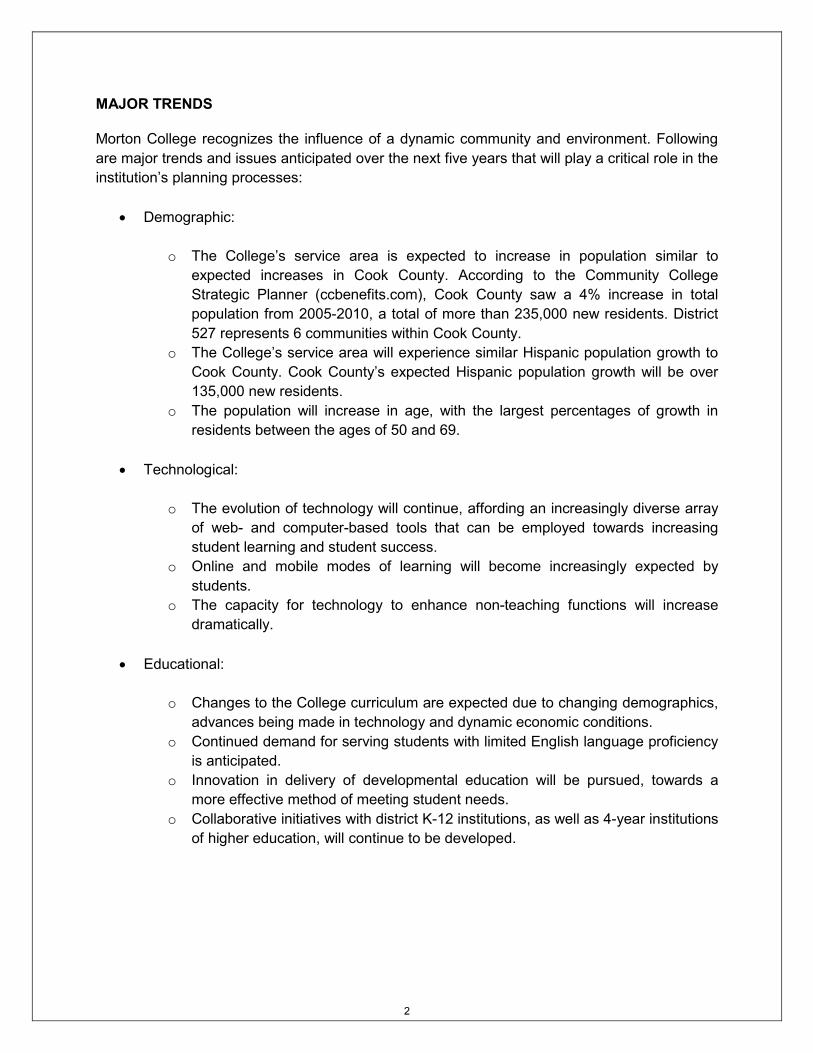
MAJOR TRENDS Morton College recognizes the influence of a dynamic community and environment. Following are major trends and issues anticipated over the next five years that will play a critical role in the institution’s planning processes:
• Demographic:
o The College’s service area is expected to increase in population similar to expected increases in Cook County. According to the Community College Strategic Planner (ccbenefits.com), Cook County saw a 4% increase in total population from 2005-2010, a total of more than 235,000 new residents. District 527 represents 6 communities within Cook County.
o The College’s service area will experience similar Hispanic population growth to Cook County. Cook County’s expected Hispanic population growth will be over 135,000 new residents.
o The population will increase in age, with the largest percentages of growth in residents between the ages of 50 and 69.
• Technological:
o The evolution of technology will continue, affording an increasingly diverse array of web- and computer-based tools that can be employed towards increasing student learning and student success.
o Online and mobile modes of learning will become increasingly expected by students.
o The capacity for technology to enhance non-teaching functions will increase dramatically.
• Educational:
o Changes to the College curriculum are expected due to changing demographics, advances being made in technology and dynamic economic conditions.
o Continued demand for serving students with limited English language proficiency is anticipated.
o Innovation in delivery of developmental education will be pursued, towards a more effective method of meeting student needs.
o Collaborative initiatives with district K-12 institutions, as well as 4-year institutions of higher education, will continue to be developed.
2
• Financial:
o The state continues to struggle to meet diverse demands with limited resources. As a result, state funding will continue to be a challenge.
o Increased costs due to aging buildings, infrastructure, and necessary site improvements are anticipated.
o The College will continue to assess its position among peer institutions trending towards increased tuition.
• Political:
o Legislation affecting pension reform that will increase amounts that will be paid
by the College on behalf of their employees is anticipated. o Increased competition for government funds is expected to continue.
FUTURE OUTLOOK The Morton community has undergone profound changes in the last 20 years, including an increase in its Latino population from 6.6% to 81% since 1980. As this shift made Morton College the largest Latino-serving public college or university in the Midwest, a review of the mission was necessary in order to serve the college's "new" community. To enable the necessary changes to the mission, a Blue Ribbon panel of citizens from diverse backgrounds and expertise was appointed and charged with researching how Morton College could meet the community's needs so that Morton College, once again, could distinguish itself by its sense of purpose — a College that understands and changes to meet the needs of its community, now and in the future — a college that embraces collaboration among and between all stakeholders. The College’s Enterprise Resource Planning (ERP) system has enabled them to centrally aggregate data, both academic and financial, in a secure repository. The system has improved the effectiveness and efficiency of information management, which is critical to the success of Morton College. Further, the ability to securely store, internally share and analyze information is critical for Morton College to meet the needs of the communities it serves. This has improved every aspect of our service to the community. Examples include:
• Provide a secure portal for remote access over the internet: o Student access to schedules, grades, class or semester registration, add or drop
courses, grades and transcripts. o Faculty access to class rosters, course and schedule information, class teaching
assignments, grades, and student information within restrictions. • Provide staff better access to information at the college to improve service to students,
faculty and the community – and do it more timely and efficiently. • Provide a single source of reliable data, eliminating the need for multiple auxiliary
systems to store information. Currently, multiple systems require manual up-dating to add or correct information.
3
• Allow the College to better forecast and target market efforts to grow the services available to our community.
• Provide the ability to track and audit data to ensure its accuracy and security. These and other benefits of the Enterprise Resource Planning System have improved the quality of service Morton College provides to our community while lowering our costs of service. VISION AND MISSION The District’s Vision Statement: Our Vision is to be the leader in educational institutions in the delivery of quality academic and workforce development programs that enhance the quality of life for the towns of Berwyn, Cicero, Forest View, Lyons, McCook and Stickney. The District’s Mission Statement: As a comprehensive Community College, recognized by the Illinois Community College Board, the mission of Morton College is to enhance the quality of life of our diverse community through exemplary teaching and learning opportunities, community service and life-long learning. Consistent with our mission, Morton College’s educational philosophy conforms to requirements set forth in state law and stresses the importance of helping individuals live and work as better informed citizens in a dynamic society. This philosophy is reflected in the College’s programs that model core values of truth, compassion, fairness, responsibility and respect. DIVERSITY STATEMENT Diversity at Morton College is more than just a variety of people with different backgrounds. It is the core of who we are as an educational culture and it supports our goals as an organization. Consistent with its mission of social responsibility and community development, Morton College continually works “to enhance the quality of life of our diverse community.”
4
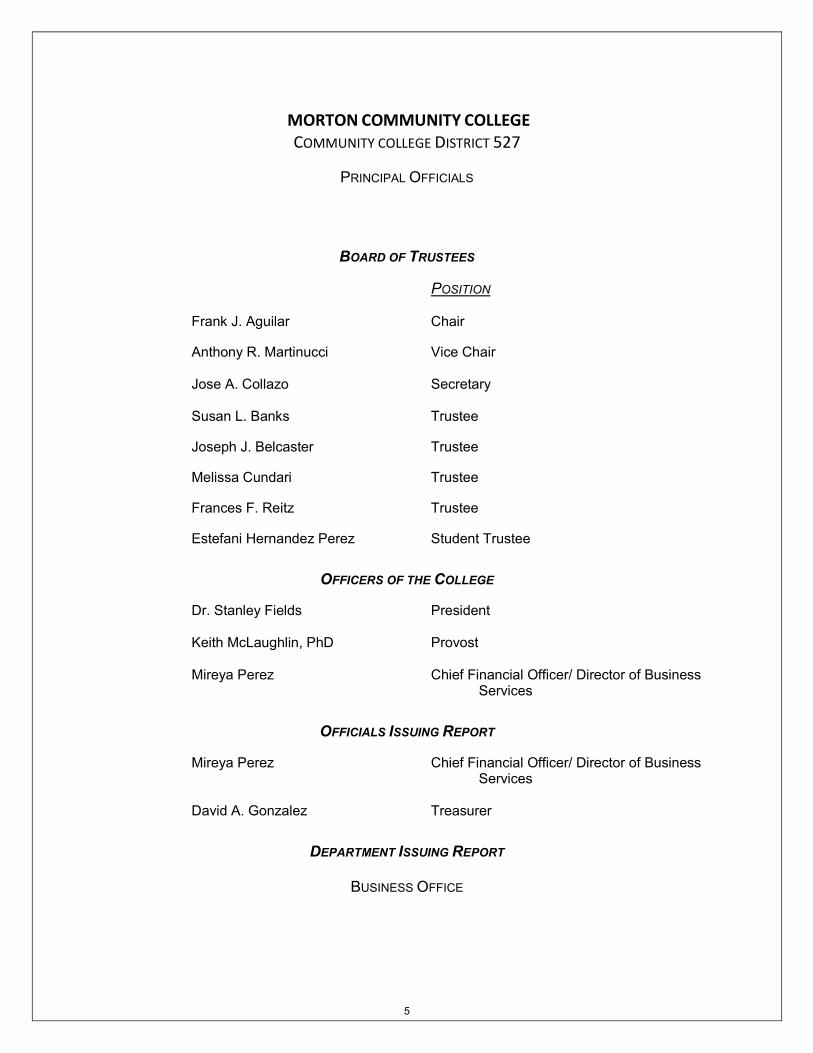
MORTON COMMUNITY COLLEGE COMMUNITY COLLEGE DISTRICT 527
PRINCIPAL OFFICIALS
BOARD OF TRUSTEES
POSITION
Frank J. Aguilar Chair
Anthony R. Martinucci Vice Chair Jose A. Collazo Secretary Susan L. Banks Trustee
Joseph J. Belcaster Trustee
Melissa Cundari Trustee
Frances F. Reitz Trustee
Estefani Hernandez Perez Student Trustee
OFFICERS OF THE COLLEGE Dr. Stanley Fields President Keith McLaughlin, PhD Provost Mireya Perez Chief Financial Officer/ Director of Business Services
OFFICIALS ISSUING REPORT Mireya Perez Chief Financial Officer/ Director of Business Services David A. Gonzalez Treasurer
DEPARTMENT ISSUING REPORT
BUSINESS OFFICE
5
MORTON COMMUNITY COLLEGE
FISCAL YEAR 2018 BUDGET
Graphical Information
Operating Fund-Revenues by Source
Operating Fund-Expenditures by Object
Operation Fund-Expenditures by Program
Education Fund-Expenditures by Object
Operations & Maintenance Fund-Expenditures by Object
MORTON COMMUNITY COLLEGE
FUNDING SOURCEEDUCATION
FUNDO&M FUND
TOTAL OPERATING REVENUES
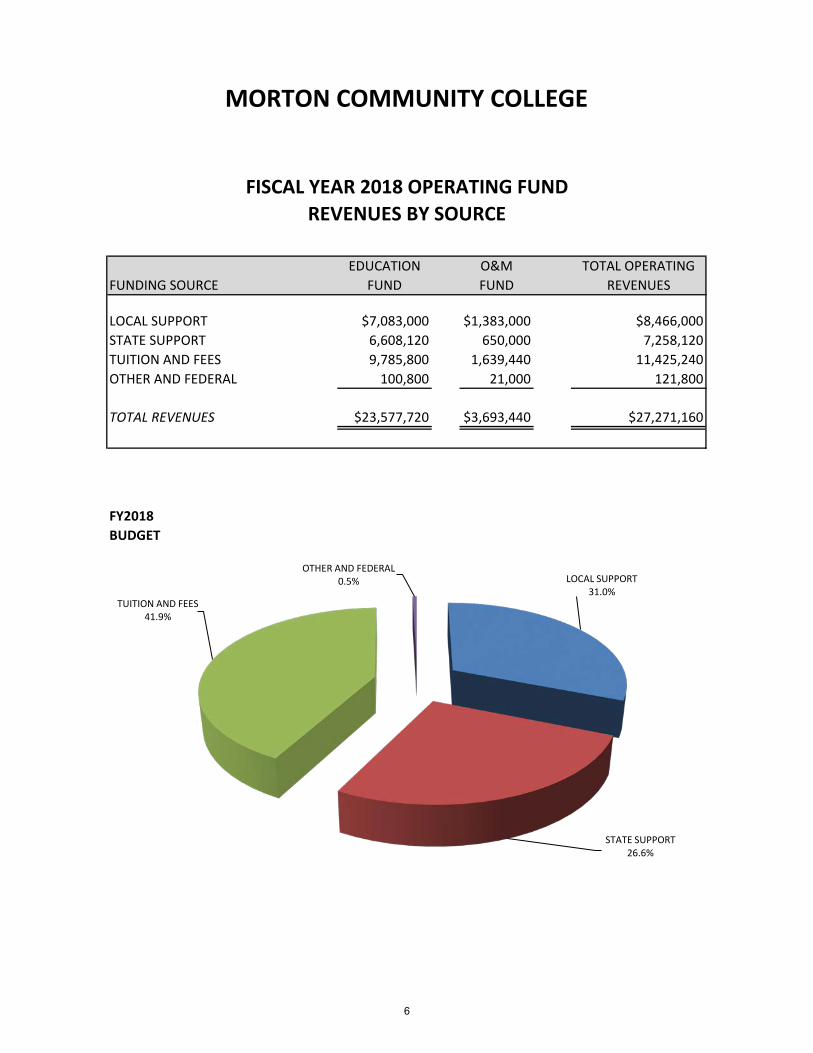
LOCAL SUPPORT $7,083,000 $1,383,000 $8,466,000STATE SUPPORT 6,608,120 650,000 7,258,120TUITION AND FEES 9,785,800 1,639,440 11,425,240OTHER AND FEDERAL 100,800 21,000 121,800
TOTAL REVENUES $23,577,720 $3,693,440 $27,271,160
FY2018BUDGET
FISCAL YEAR 2018 OPERATING FUNDREVENUES BY SOURCE
LOCAL SUPPORT31.0%
STATE SUPPORT26.6%
TUITION AND FEES41.9%
OTHER AND FEDERAL0.5%
6
MORTON COMMUNITY COLLEGE
FUNDING SOURCEFY2017 BUDGET
FY2018 BUDGET
PERCENTAGE INCREASE/ DECREASE
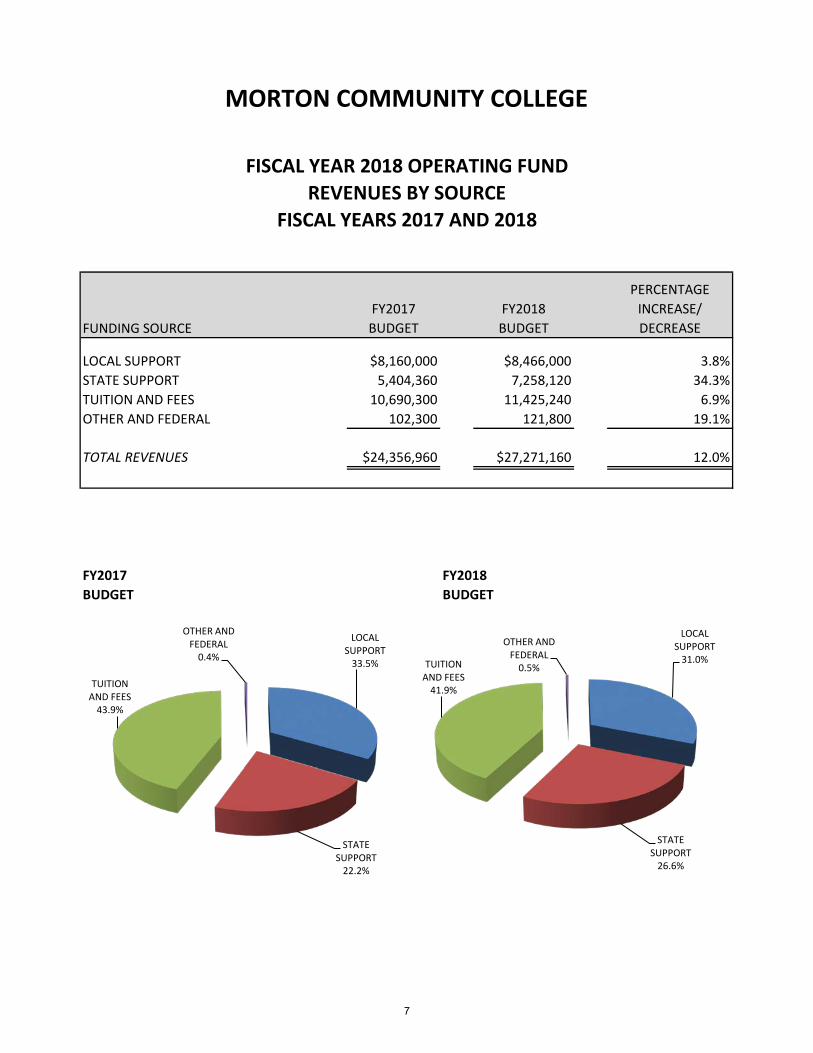
LOCAL SUPPORT $8,160,000 $8,466,000 3.8%STATE SUPPORT 5,404,360 7,258,120 34.3%TUITION AND FEES 10,690,300 11,425,240 6.9%OTHER AND FEDERAL 102,300 121,800 19.1%
TOTAL REVENUES $24,356,960 $27,271,160 12.0%
FY2017 FY2018BUDGET BUDGET
FISCAL YEAR 2018 OPERATING FUNDREVENUES BY SOURCE
FISCAL YEARS 2017 AND 2018
LOCAL SUPPORT
33.5%
STATE SUPPORT
22.2%
TUITION AND FEES
43.9%
OTHER AND FEDERAL
0.4%
LOCAL SUPPORT
31.0%
STATE SUPPORT
26.6%
TUITION AND FEES
41.9%
OTHER AND FEDERAL
0.5%
7

MORTON COMMUNITY COLLEGE
OBJECTEDUCATION
FUNDO&M FUND
TOTAL OPERATING EXPENDITURES
SALARIES & BENEFITS $14,950,966 $2,045,156 $16,996,122CONTRACTUAL SERVICES 2,528,779 563,000 3,091,779GENERAL MATERIALS & SUPPLIES 1,293,504 165,984 1,459,488CONFERENCES & MEETINGS 475,800 6,000 481,800FIXED CHARGES 81,800 0 81,800UTILITIES 0 888,300 888,300CAPITAL OUTLAY 5,000 15,000 20,000OTHER 1,299,000 10,000 1,309,000
TOTAL EXPENDITURES $20,634,849 $3,693,440 $24,328,289
FY2018BUDGET
FISCAL YEAR 2018 OPERATING FUNDEXPENDITURES BY OBJECT
SALARIES & BENEFITS69.9%
CONTRACTUAL SERVICES 12.7%
GENERAL MATERIALS & SUPPLIES 6.0%
CONFERENCES & MEETINGS
2.0%
FIXED CHARGES0.3% UTILITIES
3.6%
CAPITAL OUTLAY0.1% OTHER
5.4%
8

MORTON COMMUNITY COLLEGE
OBJECT2017
BUDGET2018
BUDGET
PERCENT INCREASE/ DECREASE
SALARIES & BENEFITS $17,083,404 $16,996,122 -0.5%CONTRACTUAL SERVICES 3,196,298 3,091,779 -3.3%GENERAL MATERIALS & SUPPLIES 1,425,288 1,459,488 2.4%CONFERENCES & MEETINGS 467,825 481,800 3.0%FIXED CHARGES 97,800 81,800 -16.4%UTILITIES 834,300 888,300 6.5%CAPITAL OUTLAY 7,500 20,000 166.7%OTHER 1,291,000 1,309,000 1.4%
TOTAL EXPENDITURES $24,403,415 $24,328,289 -0.3%
FY2017 FY2018BUDGET BUDGET
FISCAL YEAR 2018 OPERATING FUNDEXPENDITURES BY OBJECT
FISCAL YEARS 2017 AND 2018
SALARIES & BENEFITS
70.0%
CONTR. SERVICES
13.1%
GENERAL MATERIALS & SUPPLIES
5.9%
CONFR. & MEETINGS
1.9%
FIXED CHARGES
0.4%
UTILITIES3.4%
CAPITAL OUTLAY
0.0%
OTHER5.3%
SALARIES & BENEFITS
69.9%
CONTR. SERVICES
12.7%
GENERAL MATERIALS & SUPPLIES
6.0%
CONFER. & MEETINGS
2.0%
FIXED CHARGES
0.3%UTILITIES
3.6%
CAPITAL OUTLAY
0.1%
OTHER5.4%
9
MORTON COMMUNITY COLLEGE
OBJECT2017
BUDGET2018
BUDGET
PERCENT INCREASE/ DECREASE
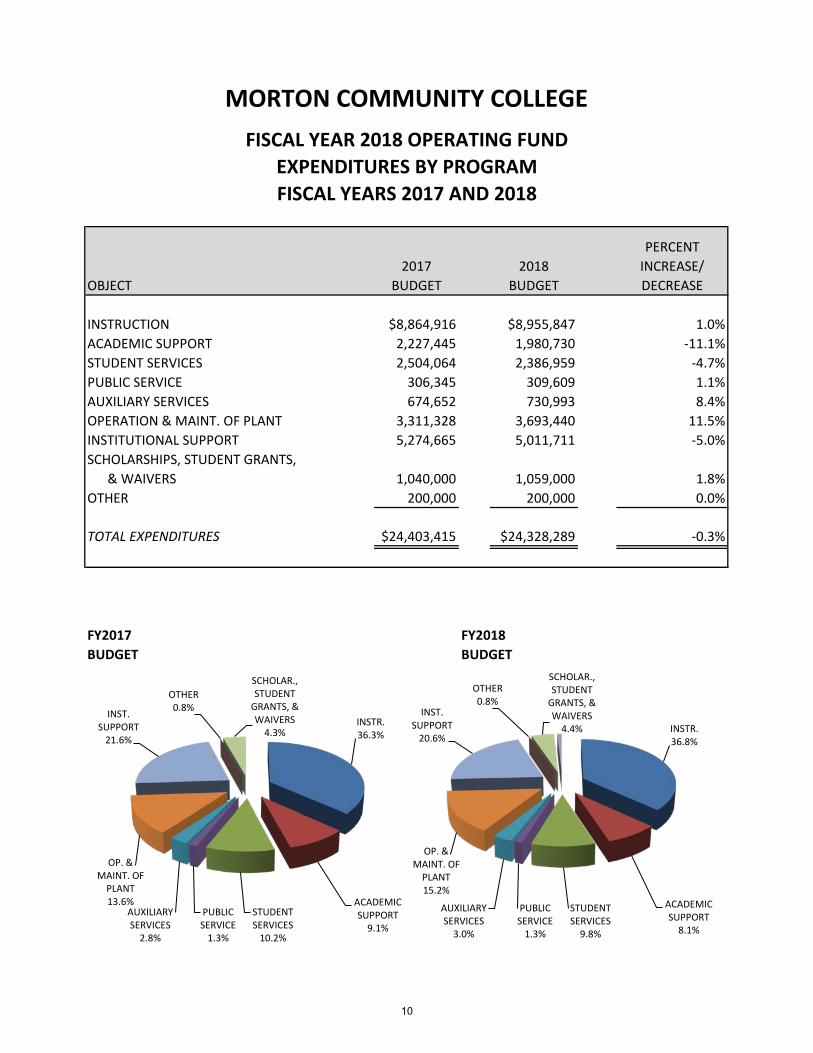
INSTRUCTION $8,864,916 $8,955,847 1.0%ACADEMIC SUPPORT 2,227,445 1,980,730 -11.1%STUDENT SERVICES 2,504,064 2,386,959 -4.7%PUBLIC SERVICE 306,345 309,609 1.1%AUXILIARY SERVICES 674,652 730,993 8.4%OPERATION & MAINT. OF PLANT 3,311,328 3,693,440 11.5%INSTITUTIONAL SUPPORT 5,274,665 5,011,711 -5.0%SCHOLARSHIPS, STUDENT GRANTS,
& WAIVERS 1,040,000 1,059,000 1.8%OTHER 200,000 200,000 0.0%
TOTAL EXPENDITURES $24,403,415 $24,328,289 -0.3%
FY2017 FY2018BUDGET BUDGET
FISCAL YEAR 2018 OPERATING FUNDEXPENDITURES BY PROGRAMFISCAL YEARS 2017 AND 2018
INSTR.36.3%
ACADEMIC SUPPORT
9.1%STUDENT SERVICES
10.2%
PUBLIC SERVICE
1.3%
AUXILIARY SERVICES
2.8%
OP. & MAINT. OF
PLANT 13.6%
INST. SUPPORT
21.6%
OTHER 0.8%
SCHOLAR.,STUDENT
GRANTS, & WAIVERS
4.3% INSTR.36.8%
ACADEMIC SUPPORT
8.1%
STUDENT SERVICES
9.8%
PUBLIC SERVICE
1.3%
AUXILIARY SERVICES
3.0%
OP. & MAINT. OF
PLANT15.2%
INST.SUPPORT
20.6%
OTHER 0.8%
SCHOLAR.,STUDENT
GRANTS, & WAIVERS
4.4%
10
MORTON COMMUNITY COLLEGE
OBJECT2017
BUDGET2018
BUDGET
PERCENT INCREASE/ DECREASE
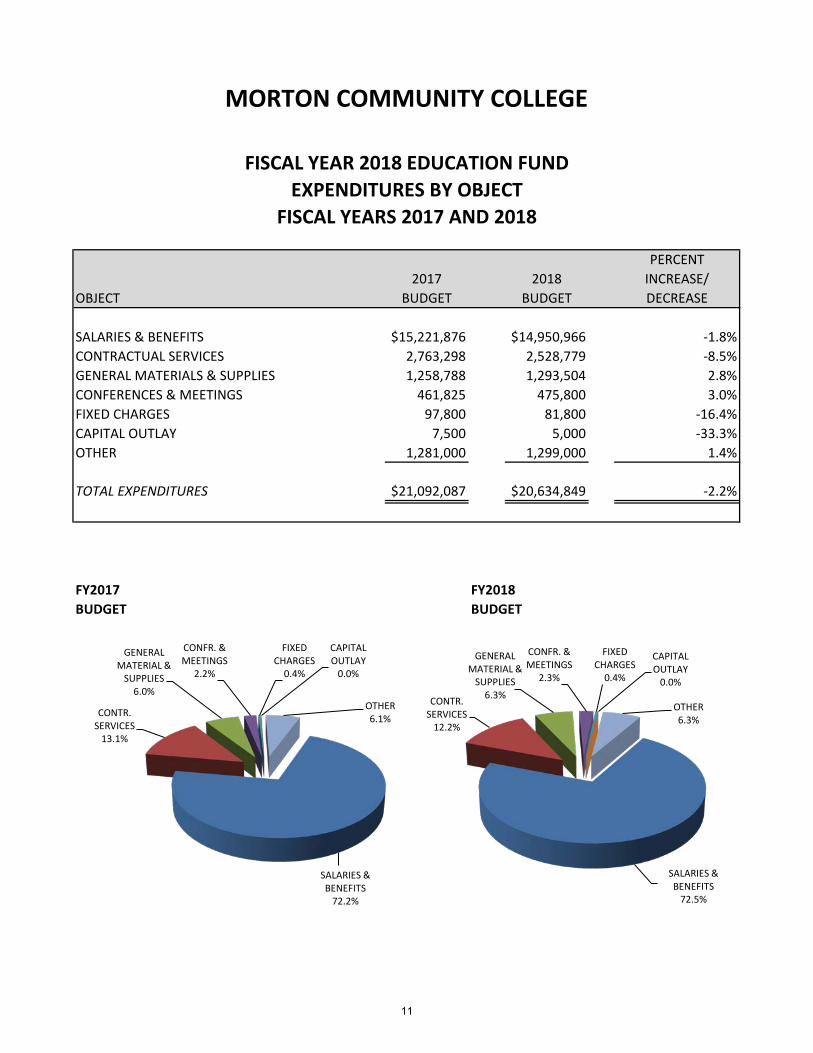
SALARIES & BENEFITS $15,221,876 $14,950,966 -1.8%CONTRACTUAL SERVICES 2,763,298 2,528,779 -8.5%GENERAL MATERIALS & SUPPLIES 1,258,788 1,293,504 2.8%CONFERENCES & MEETINGS 461,825 475,800 3.0%FIXED CHARGES 97,800 81,800 -16.4%CAPITAL OUTLAY 7,500 5,000 -33.3%OTHER 1,281,000 1,299,000 1.4%
TOTAL EXPENDITURES $21,092,087 $20,634,849 -2.2%
FY2017 FY2018BUDGET BUDGET
FISCAL YEAR 2018 EDUCATION FUNDEXPENDITURES BY OBJECT
FISCAL YEARS 2017 AND 2018
SALARIES & BENEFITS
72.2%
CONTR. SERVICES
13.1%
GENERAL MATERIAL &
SUPPLIES6.0%
CONFR. & MEETINGS
2.2%
FIXED CHARGES
0.4%
CAPITAL OUTLAY
0.0%
OTHER6.1%
SALARIES & BENEFITS
72.5%
CONTR. SERVICES
12.2%
GENERAL MATERIAL &
SUPPLIES6.3%
CONFR. & MEETINGS
2.3%
FIXED CHARGES
0.4%
CAPITAL OUTLAY
0.0%
OTHER6.3%
11

MORTON COMMUNITY COLLEGE
OBJECT 2017 BUDGET 2018 BUDGET
PERCENT INCREASE/ DECREASE
SALARIES & BENEFITS $1,861,528 $2,045,156 9.9%CONTRACTUAL SERVICES 433,000 563,000 30.0%GENERAL MATERIALS & SUPPLIES 166,500 165,984 -0.3%CONFERENCES & MEETINGS 6,000 6,000 0.0%UTILITIES 834,300 888,300 6.5%CAPITAL OUTLAY 0 15,000 100.0%OTHER 10,000 10,000 0.0%
TOTAL EXPENDITURES $3,311,328 $3,693,440 11.5%
FY2017 FY2018BUDGET BUDGET
OPERATIONS & MAINTENANCE FUNDEXPENDITURES BY OBJECT
FISCAL YEARS 2017 AND 2018
SALARIES & BENEFITS
56.2%
CONTR. SERVICES
13.1%
GENERAL MATERIALS &
SUPPLIES5.0%
CONFR. & MEETINGS
0.2%
UTILITIES25.2%
CAPITAL OUTLAY
0.0%
OTHER0.3%
SALARIES & BENEFITS
55.4%CONTR.
SERVICES15.2%
GENERAL MATERIALS &
SUPPLIES 4.5%
CONFR. & MEETINGS
0.2%
ULITITIES24.0%
CAPITAL OUTLAY
0.4%
OTHER0.3%
12
MORTON COMMUNITY COLLEGE
FISCAL YEAR 2018 BUDGET
Financial
Educational Philosophy and Mission
Financial Reporting and Funds
General Overview
Operating Fund Review
Budgeted Revenues & Expenditures Fiscal Year 2018 (Summary)
Budgeted Revenues & Expenditures Fiscal Year 2018
Budgeted Operating Revenue by Source Fiscal Year 2018
Budgeted Expenditures by Object Fiscal Year 2018
Fiscal Year 2018 Revenue & Expenditures by Fund
EDUCATIONAL PHILOSOPHY As a comprehensive Community College that is recognized by the Illinois Community College Board, the mission of Morton College is to enhance the quality of life of our diverse community through exemplary teaching and learning opportunities, community service and life-long learning. Consistent with our mission, Morton College’s educational philosophy conforms to requirements set forth in state law and stresses the importance of helping individuals live and work as better informed citizens in a dynamic society. This philosophy is reflected in the College’s programs that model core values of truth, compassion, fairness, responsibility and respect. The programs, which are available to all individuals qualified to profit from them, are summarized below. Adult Education Program This program is committed to shaping the future of Adult Education students by providing English as a second language, basic education and GED preparation courses. University Transfer Program Courses in these curricula parallel in content, credit and quality with degree-granting institutions. Career Program Career curricula prepare students for workplace, technical and semi-technical positions and lead to an associate in applied science degree or certificate. Students in these curricula receive initial job training, upgraded workplace and technical skills and become qualified for career opportunities. Liberal Studies Program The liberal studies program is designed for students desiring maximum flexibility in preparing to transfer to a baccalaureate degree granting college. Transfer, career and continuing education courses may be used to meet a student’s specific educational goals. Students completing this program earn an associate in liberal studies degree. General Education Program General education courses are required in all curricula leading to an associate degree. They provide students with basic knowledge in communications, mathematics, physical science, social and behavioral science, humanities and health and physical fitness.
13
Continuing Education Program Curricula and courses in the continuing education program focus on improving basic academic skills and life-long learning opportunities. Programs include developmental education, general studies, vocational skills and personal development. Community Service Program The community service program consists of noncredit continuing education courses and activities designed to meet the hobby, leisure time and cultural needs of the community. Student Services Program The student development program helps students develop as they work to achieve their educational goals. Academic advising, career and personal counseling, financial aid assistance and job placement represent some of its functions. Academic Support Services Program The academic support services program augments classroom instruction. The Learning Resources Center, Academic Skills Center, Writing and Math Center and the Peer Tutoring Program are components of this program. Academic programs and student support services are available at an affordable cost without regard to age, gender, ethnicity, disability or marital status. The programs and services emphasize preparation for additional post-secondary study, job entry and career advancement, developmental education and opportunities for life-long learning. Furthermore, the College offers programs and activities that enhance the cultural, civic and economic development of the community.
14
Strategic Planning Mission: To enhance the quality of life of our diverse community through exemplary teaching and learning opportunities, community service and life-long learning.
In 2012 Morton College developed a new, comprehensive five-year strategic plan, based on extensive data collection and analysis, market research and projected demographic trends in the college district, regionally, state-wide and nationally. A planning committee, comprised of faculty, staff and administrators, has met periodically since the initiation of the new plan and have prioritized goals outlined in the plan, established targets and monitored progress. In an effort to keep the strategic plan active, effective and relevant, the Committee has also periodically revised, updated and consolidated major goal areas since the development of the plan in response to internal and external factors impacting the strategic direction of the College. The Strategic Plan goals are developed within the framework of a systematic planning process that includes inputs from institutional goals, Support Unit Annual Plans and Academic Unit Annual Plans. The following represent the AY 17-18 updates to the strategic goals.
SOAR
S - Goal #1: Make Student Success the Core Work of Morton College
• Develop a comprehensive “first-year experience” for students • Repurpose the second floor of library for an innovative learning commons and student
success center • Increase fall-to-fall retention and graduation rates by 3% over academic year 15-16 • Increase the graduation rate to 28% • Increase the number of students participating in PantherPalooza new-student orientation
by 5% over academic year 15-16 • Fully implement and refine the academic advising caseload model • Develop protocols and guidelines for provision of services provided by the new social/
emotional counselor position
O - Goal #2: Strengthen Efficiencies in Operations
• Make better use of data to inform decision-making and planning • Expand migration of business processes to electronic format • Fully implement and refine electronic transcript request system • Fully automate ICCB reporting processes • Streamline marketing, public relations and communications • Apply for at least three federal, state, or private grants • Develop a comprehensive enrollment/retention plan
15
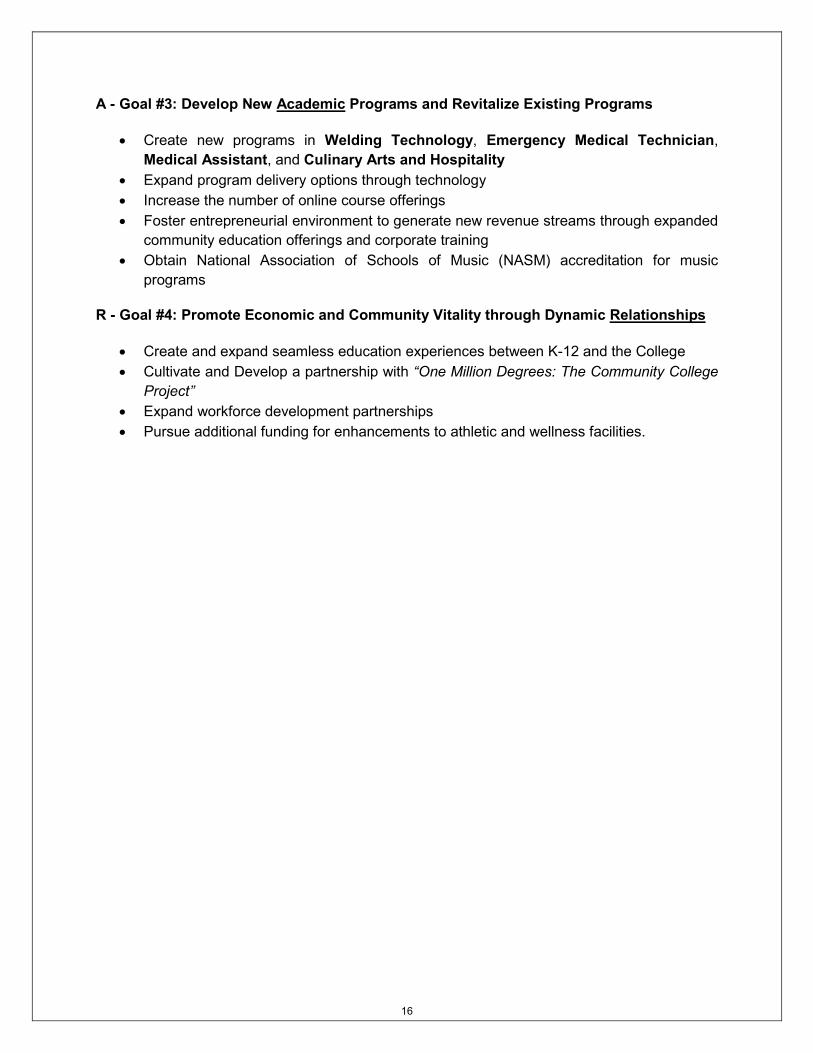
A - Goal #3: Develop New Academic Programs and Revitalize Existing Programs
• Create new programs in Welding Technology, Emergency Medical Technician, Medical Assistant, and Culinary Arts and Hospitality
• Expand program delivery options through technology • Increase the number of online course offerings • Foster entrepreneurial environment to generate new revenue streams through expanded
community education offerings and corporate training • Obtain National Association of Schools of Music (NASM) accreditation for music
programs
R - Goal #4: Promote Economic and Community Vitality through Dynamic Relationships
• Create and expand seamless education experiences between K-12 and the College • Cultivate and Develop a partnership with “One Million Degrees: The Community College
Project” • Expand workforce development partnerships • Pursue additional funding for enhancements to athletic and wellness facilities.
16
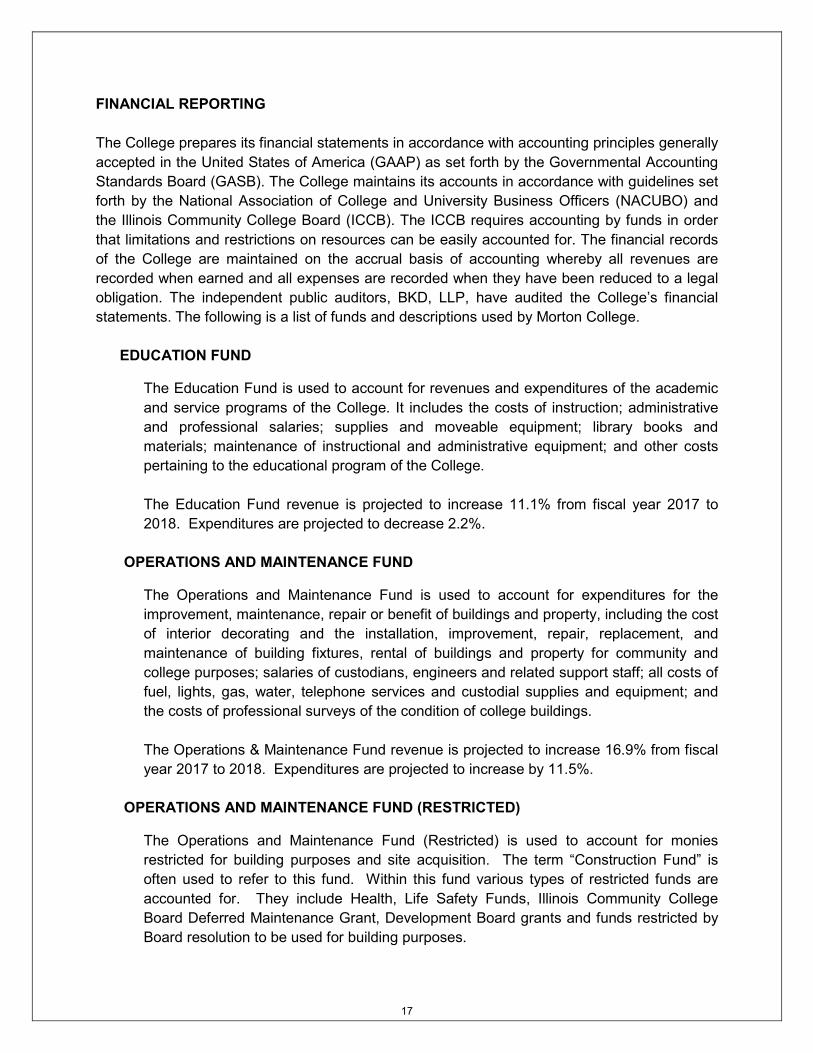
FINANCIAL REPORTING The College prepares its financial statements in accordance with accounting principles generally accepted in the United States of America (GAAP) as set forth by the Governmental Accounting Standards Board (GASB). The College maintains its accounts in accordance with guidelines set forth by the National Association of College and University Business Officers (NACUBO) and the Illinois Community College Board (ICCB). The ICCB requires accounting by funds in order that limitations and restrictions on resources can be easily accounted for. The financial records of the College are maintained on the accrual basis of accounting whereby all revenues are recorded when earned and all expenses are recorded when they have been reduced to a legal obligation. The independent public auditors, BKD, LLP, have audited the College’s financial statements. The following is a list of funds and descriptions used by Morton College.
EDUCATION FUND
The Education Fund is used to account for revenues and expenditures of the academic and service programs of the College. It includes the costs of instruction; administrative and professional salaries; supplies and moveable equipment; library books and materials; maintenance of instructional and administrative equipment; and other costs pertaining to the educational program of the College. The Education Fund revenue is projected to increase 11.1% from fiscal year 2017 to 2018. Expenditures are projected to decrease 2.2%.
OPERATIONS AND MAINTENANCE FUND
The Operations and Maintenance Fund is used to account for expenditures for the improvement, maintenance, repair or benefit of buildings and property, including the cost of interior decorating and the installation, improvement, repair, replacement, and maintenance of building fixtures, rental of buildings and property for community and college purposes; salaries of custodians, engineers and related support staff; all costs of fuel, lights, gas, water, telephone services and custodial supplies and equipment; and the costs of professional surveys of the condition of college buildings. The Operations & Maintenance Fund revenue is projected to increase 16.9% from fiscal year 2017 to 2018. Expenditures are projected to increase by 11.5%.
OPERATIONS AND MAINTENANCE FUND (RESTRICTED)
The Operations and Maintenance Fund (Restricted) is used to account for monies restricted for building purposes and site acquisition. The term “Construction Fund” is often used to refer to this fund. Within this fund various types of restricted funds are accounted for. They include Health, Life Safety Funds, Illinois Community College Board Deferred Maintenance Grant, Development Board grants and funds restricted by Board resolution to be used for building purposes.
17
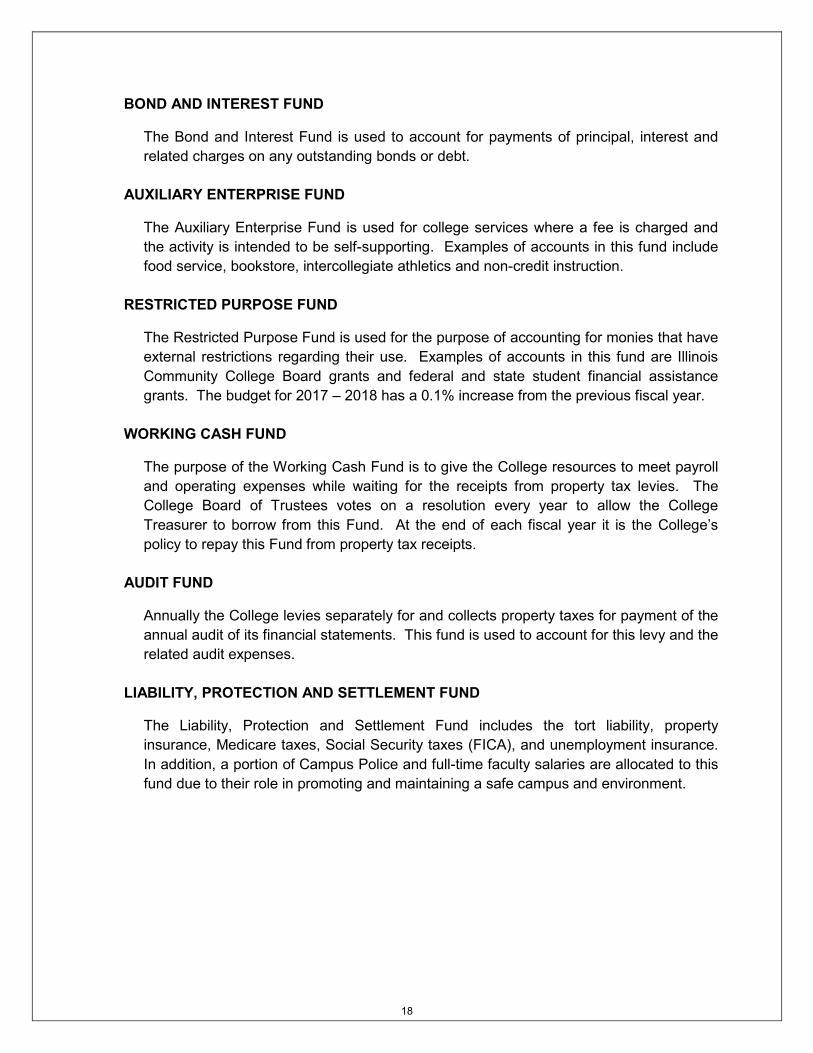
BOND AND INTEREST FUND
The Bond and Interest Fund is used to account for payments of principal, interest and related charges on any outstanding bonds or debt.
AUXILIARY ENTERPRISE FUND
The Auxiliary Enterprise Fund is used for college services where a fee is charged and the activity is intended to be self-supporting. Examples of accounts in this fund include food service, bookstore, intercollegiate athletics and non-credit instruction.
RESTRICTED PURPOSE FUND
The Restricted Purpose Fund is used for the purpose of accounting for monies that have external restrictions regarding their use. Examples of accounts in this fund are Illinois Community College Board grants and federal and state student financial assistance grants. The budget for 2017 – 2018 has a 0.1% increase from the previous fiscal year.
WORKING CASH FUND
The purpose of the Working Cash Fund is to give the College resources to meet payroll and operating expenses while waiting for the receipts from property tax levies. The College Board of Trustees votes on a resolution every year to allow the College Treasurer to borrow from this Fund. At the end of each fiscal year it is the College’s policy to repay this Fund from property tax receipts.
AUDIT FUND
Annually the College levies separately for and collects property taxes for payment of the annual audit of its financial statements. This fund is used to account for this levy and the related audit expenses.
LIABILITY, PROTECTION AND SETTLEMENT FUND
The Liability, Protection and Settlement Fund includes the tort liability, property insurance, Medicare taxes, Social Security taxes (FICA), and unemployment insurance. In addition, a portion of Campus Police and full-time faculty salaries are allocated to this fund due to their role in promoting and maintaining a safe campus and environment.
18

GENERAL OVERVIEW
This section contains general information concerning funding, authorized compensations, insurance, staffing, debt obligations and contracts. The College’s main source of revenue is from property taxes (20.7%), state revenue (21.4%), federal revenue (26.1%) and tuition and fees (23.8%). The needs of the College are evaluated on an ongoing basis and have made a number of adjustments in order to properly service the community in which it serves. The 2018 budget includes the following assumptions as it relates to our main source of funding.
• No significant increase due to the lack of new property that would generate property tax revenue above the 3.5% tax cap.
• Tuition and fees for Fiscal Year 2018 are at a rate of $128.00 per credit hour
including tuition, the comprehensive fee, the technology fee and the repair and renovation fee.
• Union Agreement with the Faculty and American Federation of Teachers Local 1600 is
effective May 31, 2014 through August 15, 2019. • Union Agreement with the Campus Safety Staff and Service Employees International
Union Local 73 is effective July 1, 2011 through June 30, 2016.
• Union Agreement with the Custodial/Maintenance Staff and Service Employees International Union Local 73 is effective July 1, 2016 through June 30, 2021.
• Union Agreement with the Classified Staff effective July 1, 2014 through June 30, 2019.
• Union Agreement with the Adjunct Faculty Association IEA-NEA is effective July 1, 2014
to June 30, 2017. • The risk management consortium the College has participated in for many years
continues to provide significant benefits at very reasonable costs for property, casualty and liability insurance. However, increases are expected and planned for in fiscal year 2018.
19

OPERATING FUND REVIEW
REVENUE
• Revenue resources include local support (property taxes) 31.0%, state support 26.6%, student support (tuition and fees) 41.9%, and miscellaneous (federal grants, interest, etc.) 0.5%.
• Tax revenue is based on 90% collection of the remaining calendar year 2016 levy
and the first half of calendar year 2017 levy.
• State support is based on credit hours generated two years ago. Also, amounts are based on the governor’s recommended budget that has not been approved and is subject to change.
• Tuition revenue is based on the tuition and fees of $128.00 per credit hour. The
current year credit hours remain the same from last year.
• TOTAL BUDGETED OPERATING FUND REVENUE FOR FISCAL YEAR 2018 $27,271,160. EXPENDITURES
Salaries and employee benefits comprise 69.9% of our entire operating budget. This distribution is a slight decrease from the 70.0% of last year. Other large operating costs are contractual services 12.7%, supplies 6.0%, utilities 3.6%, conferences and meetings 2.0%, and other 5.4%.
• TOTAL BUDGETED OPERATING EXPENDITURES FOR FISCAL YEAR 2018 $24,328,289.
20
Debt ServiceCapital Projects
ProprietaryN
onexpendable Trust
EducationO
perations and M
aintenanceRestricted Purpose
Audit
Liability, Protection
and Settlem
ent
General O
bligation Bond
Operations and M
aintenance (Restricted)
AuxiliaryW
orking CashTotal
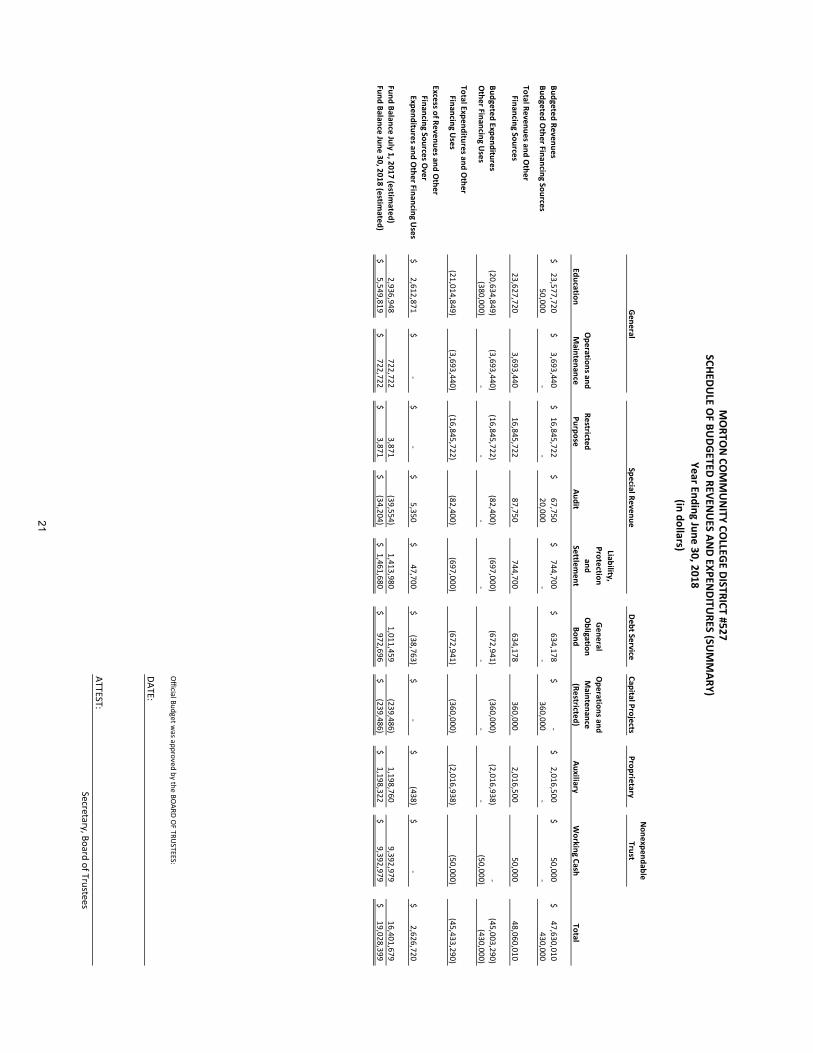
Budgeted Revenues23,577,720
$ 3,693,440
$ 16,845,722
$ 67,750
$ 744,700
$ 634,178
$ -
$ 2,016,500
$ 50,000
$ 47,630,010
$ Budgeted O
ther Financing Sources50,000
-
-
20,000
-
-
360,000
-
-
430,000
Total Revenues and Other
Financing Sources23,627,720
3,693,440
16,845,722
87,750
744,700
634,178
360,000
2,016,500
50,000
48,060,010
Budgeted Expenditures(20,634,849)
(3,693,440)
(16,845,722)
(82,400)
(697,000)
(672,941)
(360,000)
(2,016,938)
-
(45,003,290)
O
ther Financing Uses
(380,000)
-
-
-
-
-
-
-
(50,000)
(430,000)
Total Expenditures and Other
Financing Uses
(21,014,849)
(3,693,440)
(16,845,722)
(82,400)
(697,000)
(672,941)
(360,000)
(2,016,938)
(50,000)
(45,433,290)
Excess of Revenues and Other
Financing Sources Over
Expenditures and Other Financing U
ses2,612,871
$ -
$ -
$ 5,350
$ 47,700
$ (38,763)
$ -
$ (438)
$ -
$ 2,626,720
$
Fund Balance July 1, 2017 (estimated)
2,936,948
722,722
3,871
(39,554)
1,413,980
1,011,459
(239,486)
1,198,760
9,392,979
16,401,679
Fund Balance June 30, 2018 (estimated)
5,549,819$
722,722$
3,871$
(34,204)$
1,461,680$
972,696$
(239,486)$
1,198,322$
9,392,979$
19,028,399$
Official Budget w
as approved by the BOARD O
F TRUSTEES:
DATE:
ATTEST: Secretary, Board of Trustees
MO
RTON
COM
MU
NITY CO
LLEGE DISTRICT #527
GeneralSpecial Revenue
(in dollars)Year Ending June 30, 2018
SCHEDULE O
F BUDGETED REVEN
UES AN
D EXPENDITU
RES (SUM
MARY)
21
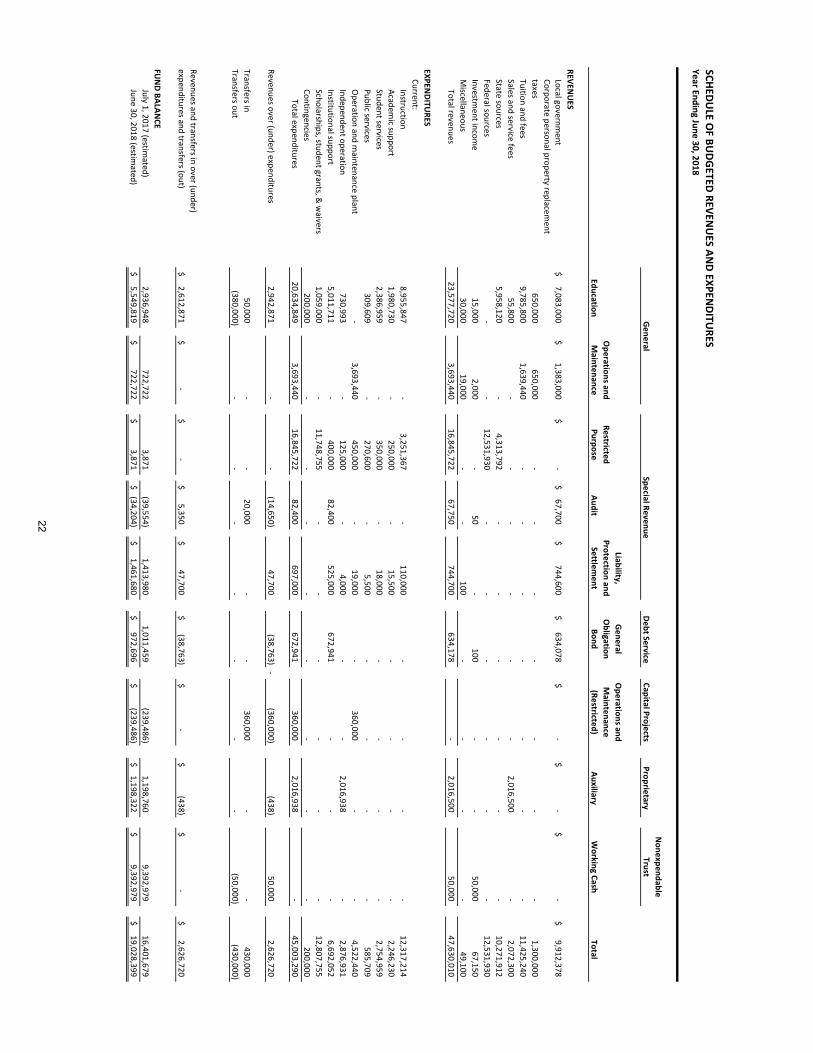
SCHEDULE O
F BUDGETED REVEN
UES AN
D EXPENDITU
RESYear Ending June 30, 2018
Debt ServiceCapital Projects
ProprietaryN
onexpendable Trust
EducationO
perations and M
aintenanceRestricted Purpose
Audit
Liability, Protection and
Settlement
General O
bligation Bond
Operations and M
aintenance (Restricted)
AuxiliaryW
orking CashTotal
REVENU
ESLocal governm
ent7,083,000
$ 1,383,000
$ -
$ 67,700
$ 744,600
$ 634,078
$ -
$ -
$ -
$ 9,912,378
$ Corporate personal property replacem
ent taxes
650,000
650,000
-
-
-
-
-
-
-
1,300,000
Tuition and fees9,785,800
1,639,440
-
-
-
-
-
-
-
11,425,240
Sales and service fees
55,800
-
-
-
-
-
-
2,016,500
-
2,072,300
State sources5,958,120
-
4,313,792
-
-
-
-
-
-
10,271,912
Federal sources
-
-
12,531,930
-
-
-
-
-
-
12,531,930
Investment incom
e15,000
2,000
-
50
-
100
-
-
50,000
67,150
M
iscellaneous30,000
19,000
-
-
100
-
-
-
-
49,100
Total revenues
23,577,720
3,693,440
16,845,722
67,750
744,700
634,178
-
2,016,500
50, 000
47,630,010
EXPENDITU
RESCurrent:
Instruction8,955,847
-
3,251,367
-
110,000
-
-
-
-
12,317,214
Academ
ic support1,980,730
-
250,000
-
15,500
-
-
-
-
2,246,230
Student services
2,386,959
-
350,000
-
18,000
-
-
-
-
2,754,959
Public services309,609
-
270,600
-
5,500
-
-
-
-
585,709
O
peration and maintenance plant
-
3,693,440
450,000
-
19,000
-
360,000
-
-
4,522,440
Independent operation730,993
-
125,000
-
4,000
-
-
2,016,938
-
2,876,931
Institutional support
5,011,711
-
400,000
82,400
525,000
672,941
-
-
-
6,692,052
Scholarships, student grants, & w
aivers1,059,000
-
11,748,755
-
-
-
-
-
-
12,807,755
Contingencies
200,000
-
-
-
-
-
-
-
-
200,000
Total expenditures20,634,849
3,693,440
16,845,722
82,400
697,000
672,941
360,000
2,016,938
-
45,003,290
Revenues over (under) expenditures2,942,871
-
-
(14,650)
47,700
(38,763)
-
(360,000)
(438)
50,000
2,626,720
Transfers in50,000
-
-
20,000
-
-
360,000
-
-
430,000
Transfers out
(380,000)
-
-
-
-
-
-
-
(50,000)
(430,000)
Revenues and transfers in over (under) expenditures and transfers (out)
2,612,871$
-$
-$
5,350$
47,700$
(38,763)$
-$
(438)
$ -
$ 2,626,720
$
FUN
D BALANCE
July 1, 2017 (estimated)
2,936,948
722,722
3,871
(39,554)
1,413,980
1,011,459
(239,486)
1,198,760
9,392,979
16,401,679
June 30, 2018 (estimated)
5,549,819$
722,722$
3,871$
(34,204)$
1,461,680$
972,696$
(239,486)$
1,198,322$
9,392,979$
19,028,399$
GeneralSpecial Revenue
22
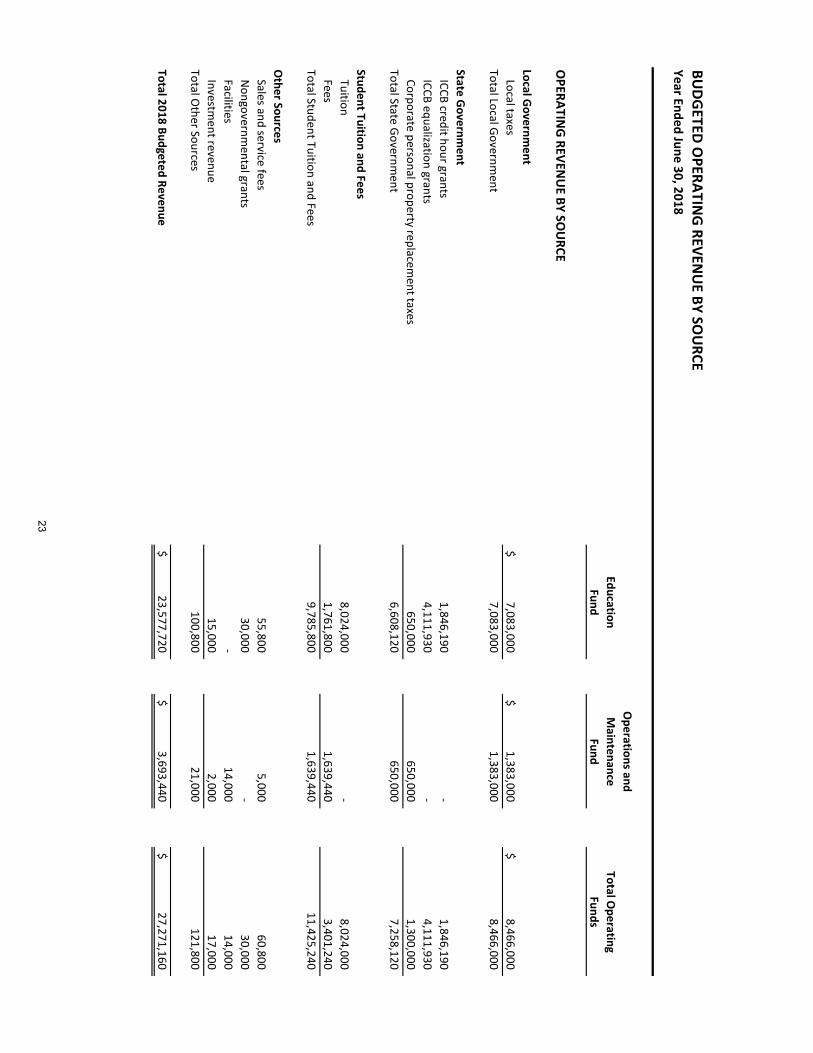
BUDGETED O
PERATING REVEN
UE BY SO
URCE
Year Ended June 30, 2018
Operations and
EducationM
aintenanceTotal O
peratingFund
FundFunds
OPERATIN
G REVENU
E BY SOU
RCE
Local Government
Local taxes7,083,000
$ 1,383,000
$ 8,466,000
$ Total Local Governm
ent7,083,000
1,383,000
8,466,000
State Government
ICCB credit hour grants1,846,190
-
1,846,190
ICCB equalization grants
4,111,930
-
4,111,930
Corporate personal property replacement taxes
650,000
650,000
1,300,000
Total State Government
6,608,120
650,000
7,258,120
Student Tuition and FeesTuition
8,024,000
-
8,024,000
Fees1,761,800
1,639,440
3,401,240
Total Student Tuition and Fees
9,785,800
1,639,440
11,425,240
Other SourcesSales and service fees
55,800
5,000
60,800
Nongovernm
ental grants30,000
-
30,000
Facilities
-
14,000
14,000
Investment revenue
15,000
2,000
17,000
Total Other Sources
100,800
21,000
121,800
Total 2018 Budgeted Revenue23,577,720
$
3,693,440$
27,271,160
$
23

BUDGETED EXPEN
DITURES BY O
BJECTYear Ended June 30, 2018
Debt ServiceCapital Projects
ProprietaryN
onexpendable Trust
Education
Operations
and M
aintenanceRestricted Purpose
Audit
Liability, Protection, and
Settlement
General O
bligation Bond
Operations and M
aintenance (Restricted)
AuxiliaryW
orking CashTotal
EXPENDITU
RES
Salaries13,357,295
$ 1,799,346
$ 1,152,362
$ -
$ -
$ -
$ -
$ 192,397
$ -
$ 16,501,400
$
Employee Benefits
1,593,671
245,810
3,734,041
-
227,000
-
-
23,991
-
$5,824,513
Contracted Services2,528,779
563,000
125,072
82,400
370,000
-
350,000
16,000
-
$4,035,251
Materials and Supplies
1,293,504
165,984
149,289
-
-
-
-
1,781,550
-
$3,390,327
Conferences and Meetings
475,800
6,000
33,864
-
-
-
-
3,000
-
$518,664
Fixed Charges81,800
-
-
-
100,000
672,941
-
-
-
$854,741
Utilities-
888,300
-
-
-
-
-
-
-
$888,300
Capital Outlay
5,000
15,000
-
-
-
-
10,000
-
-
$30,000
Othe r
1,299,000
10,000
11,651,094
-
-
-
-
-
-
12,960,094
Total Expenditures20,634,849
$ 3,693,440
$ 16,845,722
$ 82,400
$ 697,000
$ 672,941
$ 360,000
$ 2,016,938
$ -
$ 45,003,290
$
TRANSFERS
Transfers in50,000
$ -
$ -
$ 20,000
$ -
$ -
$ 360,000
$ -
$ -
$ 430,000
$ Transfers out
(380,000)
-
-
-
-
-
-
-
(50,000)
(430,000)
Total Expenditures and Transfers
20,964,849$
3,693,440$
16,845,722$
62,400$
697,000$
672,941$
-$
2,016,938$
50,000$
45,003,290$
GeneralSpecial Revenue
24
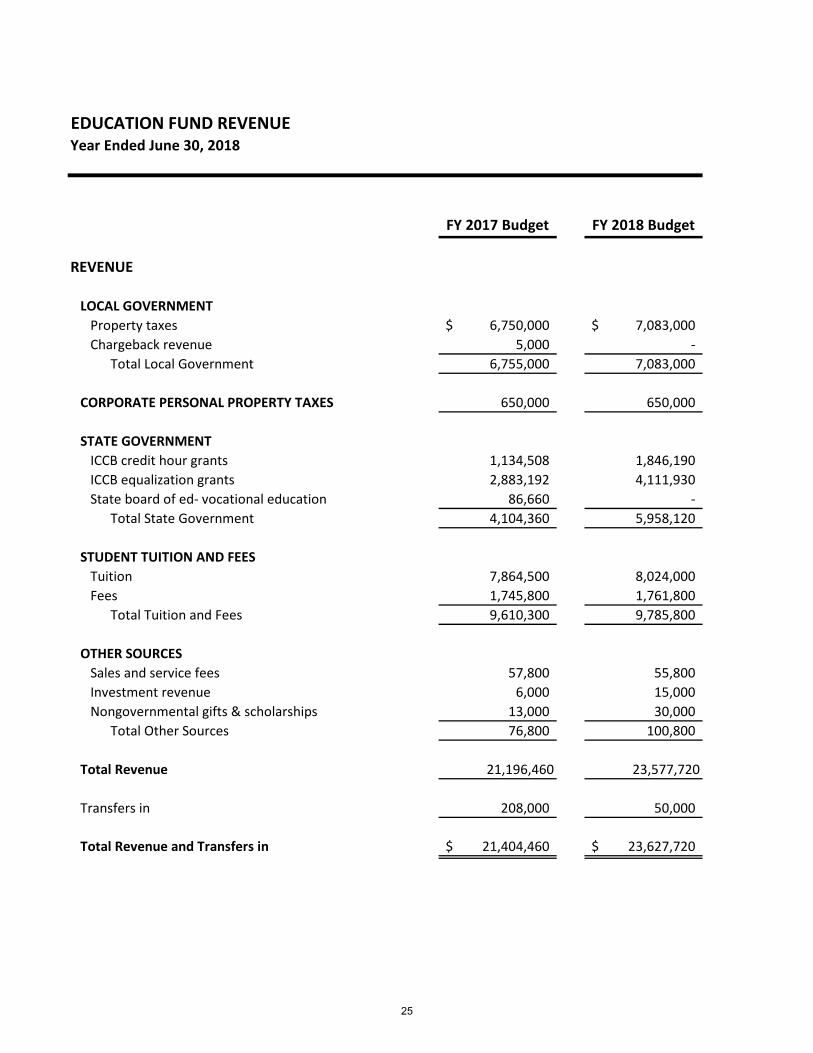
EDUCATION FUND REVENUEYear Ended June 30, 2018
FY 2017 Budget FY 2018 Budget
REVENUE
LOCAL GOVERNMENT Property taxes 6,750,000$ 7,083,000$ Chargeback revenue 5,000 -
Total Local Government 6,755,000 7,083,000
CORPORATE PERSONAL PROPERTY TAXES 650,000 650,000
STATE GOVERNMENTICCB credit hour grants 1,134,508 1,846,190 ICCB equalization grants 2,883,192 4,111,930 State board of ed- vocational education 86,660 -
Total State Government 4,104,360 5,958,120
STUDENT TUITION AND FEESTuition 7,864,500 8,024,000 Fees 1,745,800 1,761,800
Total Tuition and Fees 9,610,300 9,785,800
OTHER SOURCESSales and service fees 57,800 55,800 Investment revenue 6,000 15,000 Nongovernmental gifts & scholarships 13,000 30,000
Total Other Sources 76,800 100,800
Total Revenue 21,196,460 23,577,720
Transfers in 208,000 50,000
Total Revenue and Transfers in 21,404,460$ 23,627,720$
25
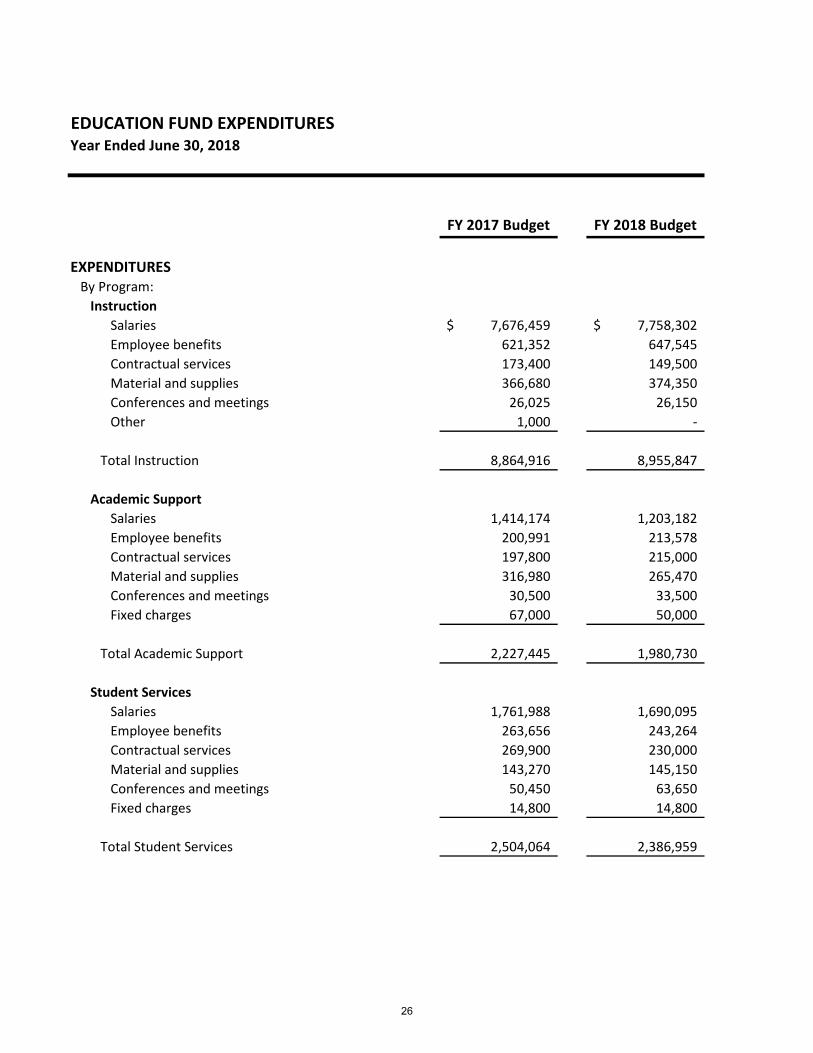
EDUCATION FUND EXPENDITURESYear Ended June 30, 2018
FY 2017 Budget FY 2018 Budget
EXPENDITURESBy Program:
InstructionSalaries 7,676,459$ 7,758,302$ Employee benefits 621,352 647,545 Contractual services 173,400 149,500 Material and supplies 366,680 374,350 Conferences and meetings 26,025 26,150 Other 1,000 -
Total Instruction 8,864,916 8,955,847
Academic SupportSalaries 1,414,174 1,203,182 Employee benefits 200,991 213,578 Contractual services 197,800 215,000 Material and supplies 316,980 265,470 Conferences and meetings 30,500 33,500 Fixed charges 67,000 50,000
Total Academic Support 2,227,445 1,980,730
Student ServicesSalaries 1,761,988 1,690,095 Employee benefits 263,656 243,264 Contractual services 269,900 230,000 Material and supplies 143,270 145,150 Conferences and meetings 50,450 63,650 Fixed charges 14,800 14,800
Total Student Services 2,504,064 2,386,959
26
EDUCATION FUND EXPENDITURESYear Ended June 30, 2018
FY 2017 Budget FY 2018 Budget
EXPENDITURES
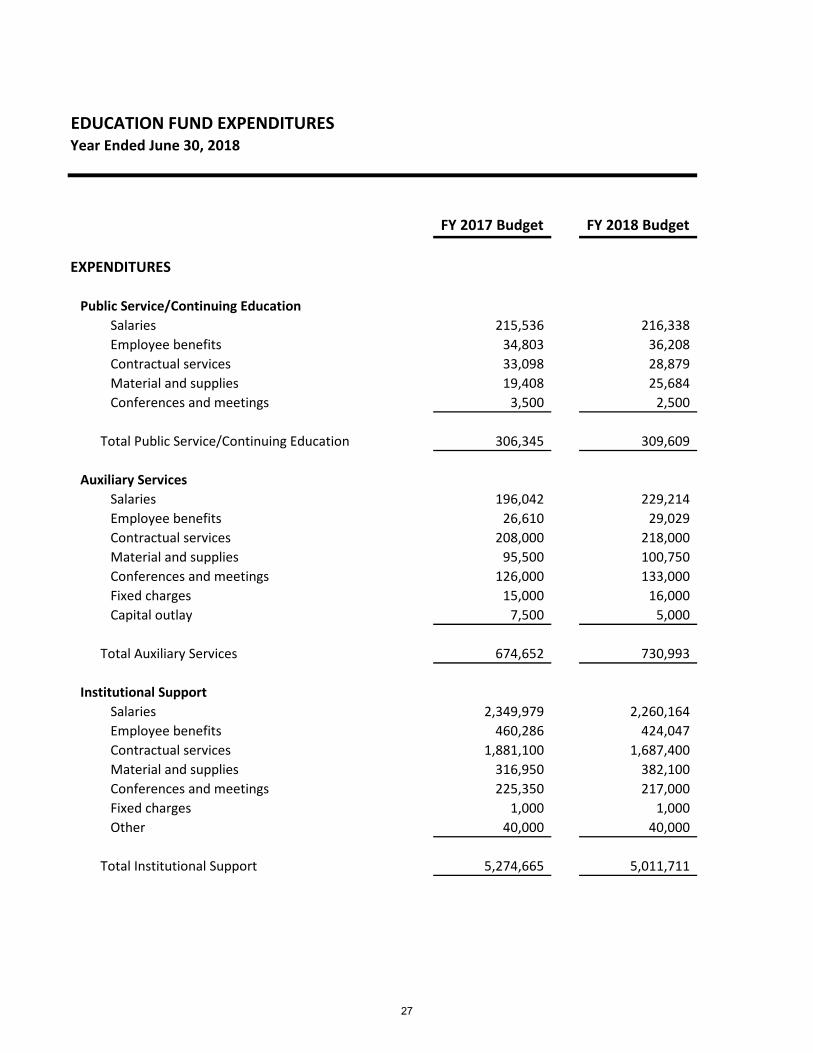
Public Service/Continuing EducationSalaries 215,536 216,338 Employee benefits 34,803 36,208 Contractual services 33,098 28,879 Material and supplies 19,408 25,684 Conferences and meetings 3,500 2,500
Total Public Service/Continuing Education 306,345 309,609
Auxiliary ServicesSalaries 196,042 229,214 Employee benefits 26,610 29,029 Contractual services 208,000 218,000 Material and supplies 95,500 100,750 Conferences and meetings 126,000 133,000 Fixed charges 15,000 16,000 Capital outlay 7,500 5,000
Total Auxiliary Services 674,652 730,993
Institutional SupportSalaries 2,349,979 2,260,164 Employee benefits 460,286 424,047 Contractual services 1,881,100 1,687,400 Material and supplies 316,950 382,100 Conferences and meetings 225,350 217,000 Fixed charges 1,000 1,000 Other 40,000 40,000
Total Institutional Support 5,274,665 5,011,711
27
EDUCATION FUND EXPENDITURESYear Ended June 30, 2018
FY 2017 Budget FY 2018 Budget
EXPENDITURES
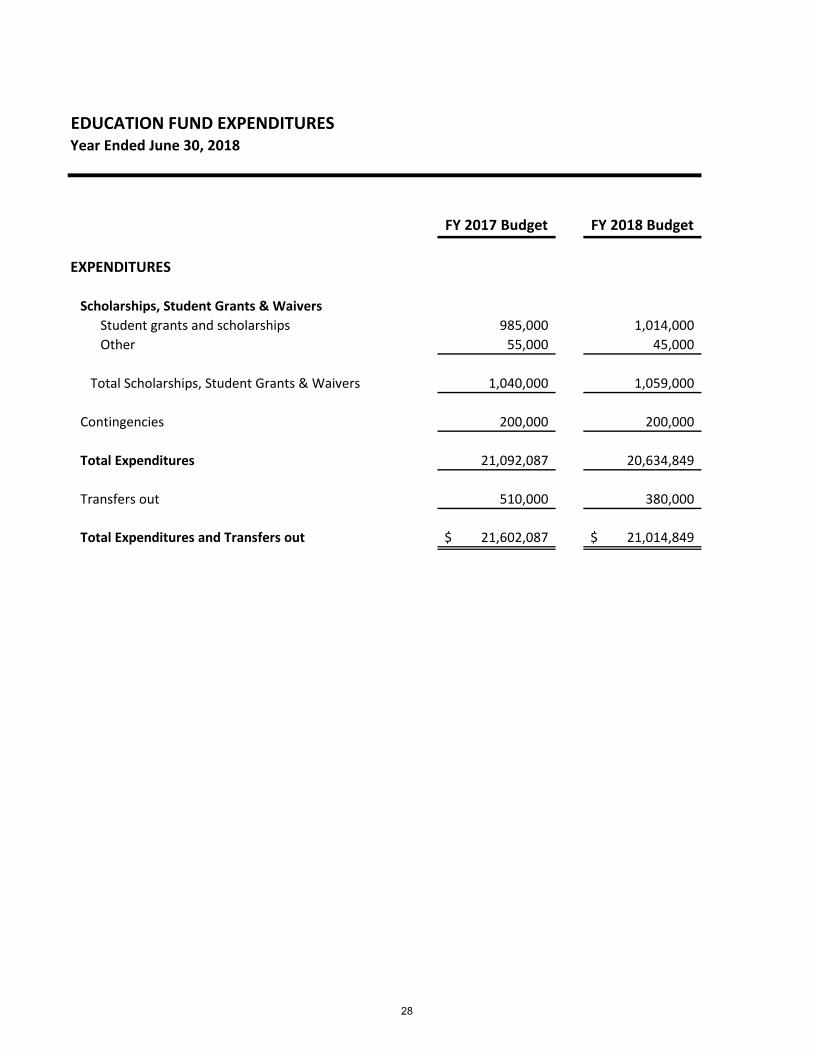
Scholarships, Student Grants & WaiversStudent grants and scholarships 985,000 1,014,000 Other 55,000 45,000
Total Scholarships, Student Grants & Waivers 1,040,000 1,059,000
Contingencies 200,000 200,000
Total Expenditures 21,092,087 20,634,849
Transfers out 510,000 380,000
Total Expenditures and Transfers out 21,602,087$ 21,014,849$
28
OPERATIONS & MAINTENANCE FUND REVENUEYear Ended June 30, 2018
FY 2017 Budget FY 2018 Budget
REVENUE
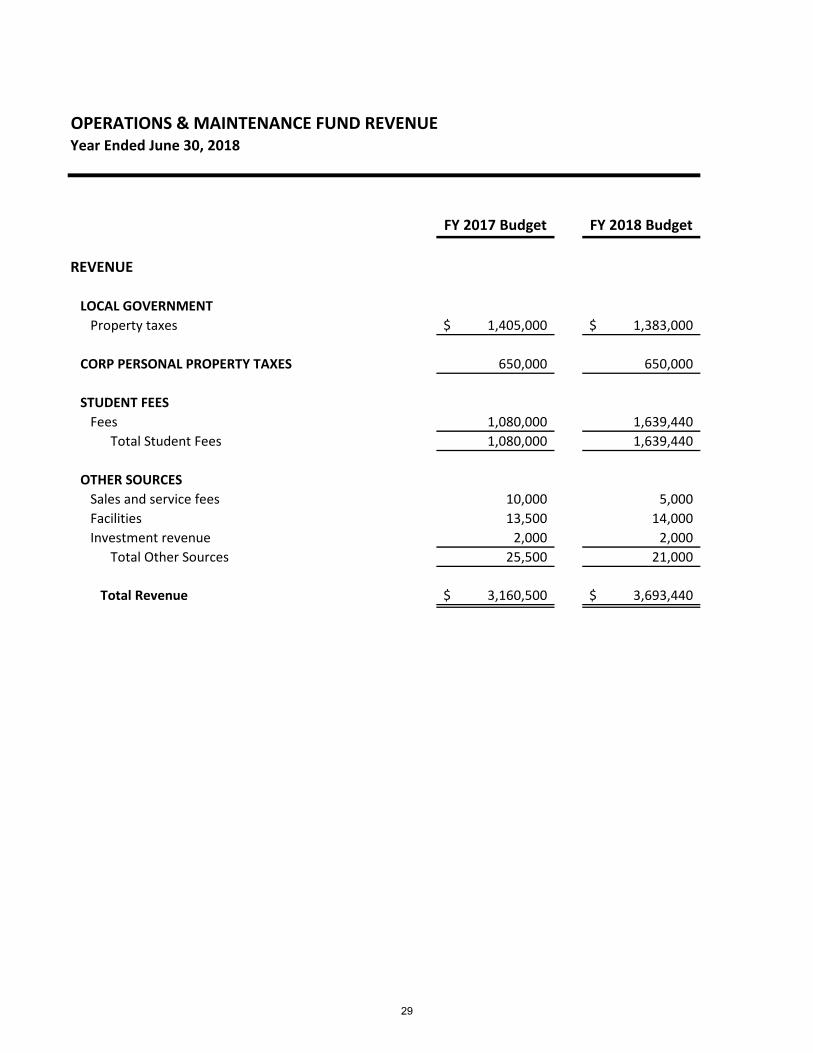
LOCAL GOVERNMENTProperty taxes 1,405,000$ 1,383,000$
CORP PERSONAL PROPERTY TAXES 650,000 650,000
STUDENT FEESFees 1,080,000 1,639,440
Total Student Fees 1,080,000 1,639,440
OTHER SOURCESSales and service fees 10,000 5,000 Facilities 13,500 14,000 Investment revenue 2,000 2,000
Total Other Sources 25,500 21,000
Total Revenue 3,160,500$ 3,693,440$
29
OPERATIONS & MAINTENANCE FUND EXPENDITURESYear Ended June 30, 2018
FY 2017 Budget FY 2018 Budget
EXPENDITURESBy Program:
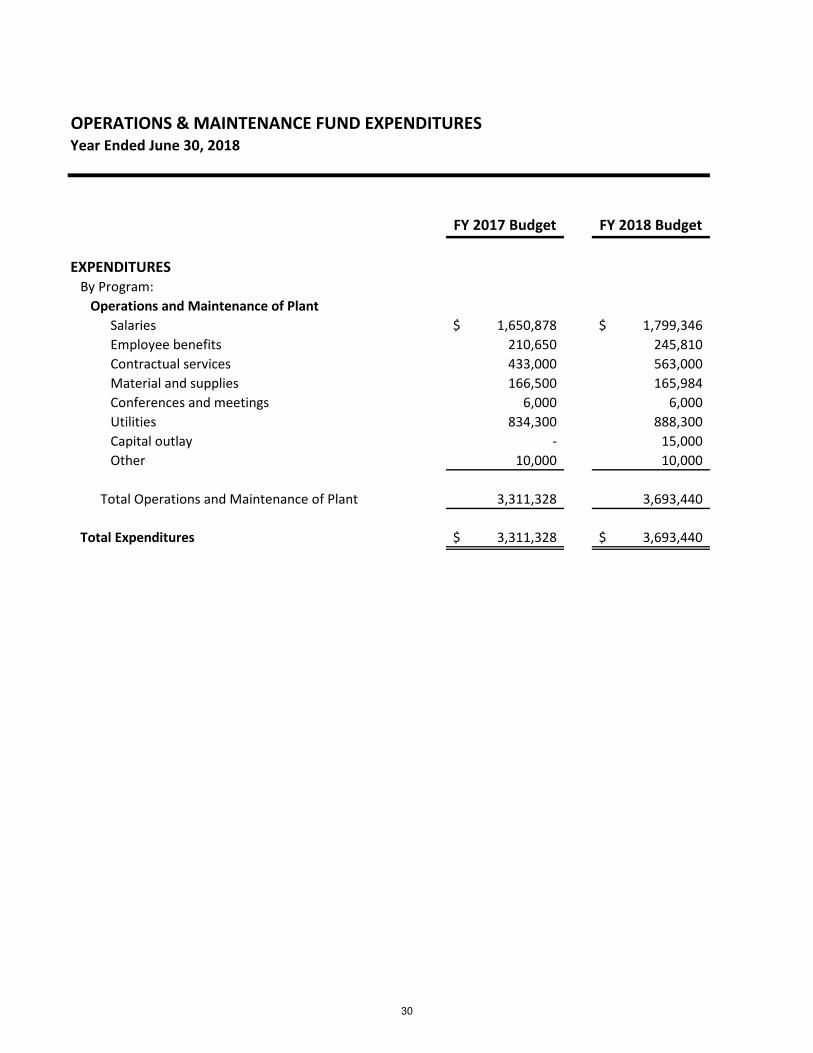
Operations and Maintenance of PlantSalaries 1,650,878$ 1,799,346$ Employee benefits 210,650 245,810 Contractual services 433,000 563,000 Material and supplies 166,500 165,984 Conferences and meetings 6,000 6,000 Utilities 834,300 888,300 Capital outlay - 15,000 Other 10,000 10,000
Total Operations and Maintenance of Plant 3,311,328 3,693,440
Total Expenditures 3,311,328$ 3,693,440$
30
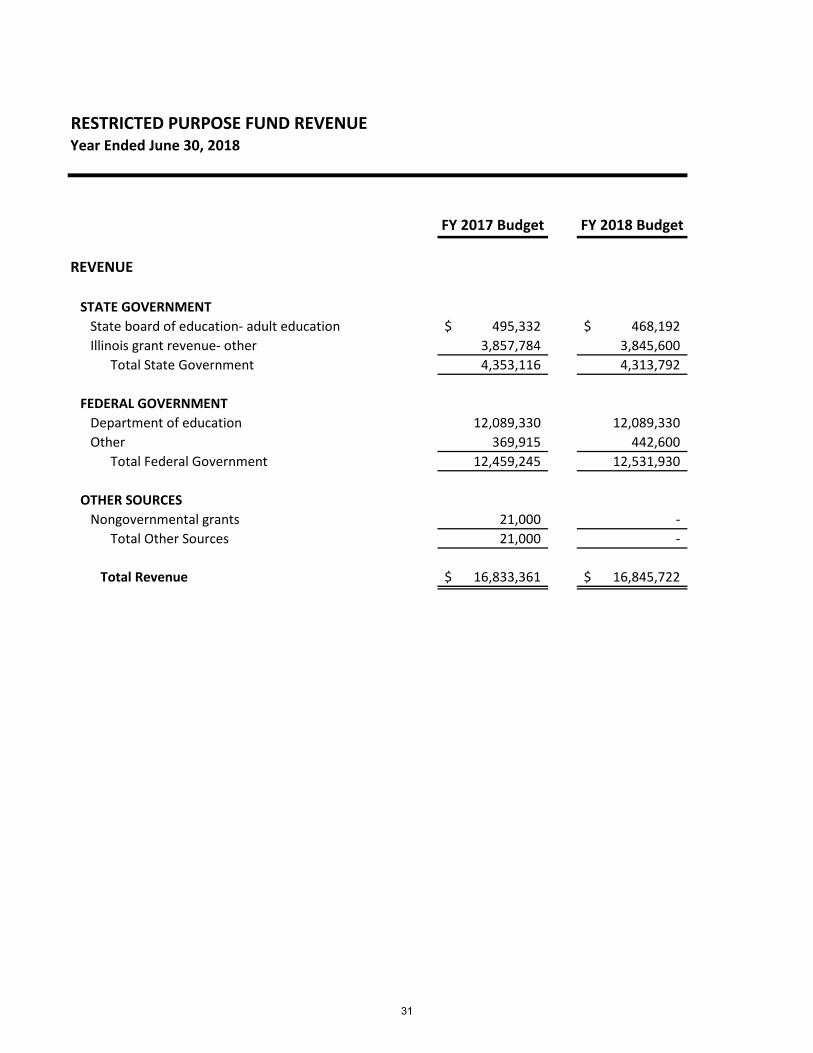
RESTRICTED PURPOSE FUND REVENUEYear Ended June 30, 2018
FY 2017 Budget FY 2018 Budget
REVENUE
STATE GOVERNMENTState board of education- adult education 495,332$ 468,192$ Illinois grant revenue- other 3,857,784 3,845,600
Total State Government 4,353,116 4,313,792
FEDERAL GOVERNMENTDepartment of education 12,089,330 12,089,330 Other 369,915 442,600
Total Federal Government 12,459,245 12,531,930
OTHER SOURCESNongovernmental grants 21,000 -
Total Other Sources 21,000 -
Total Revenue 16,833,361$ 16,845,722$
31

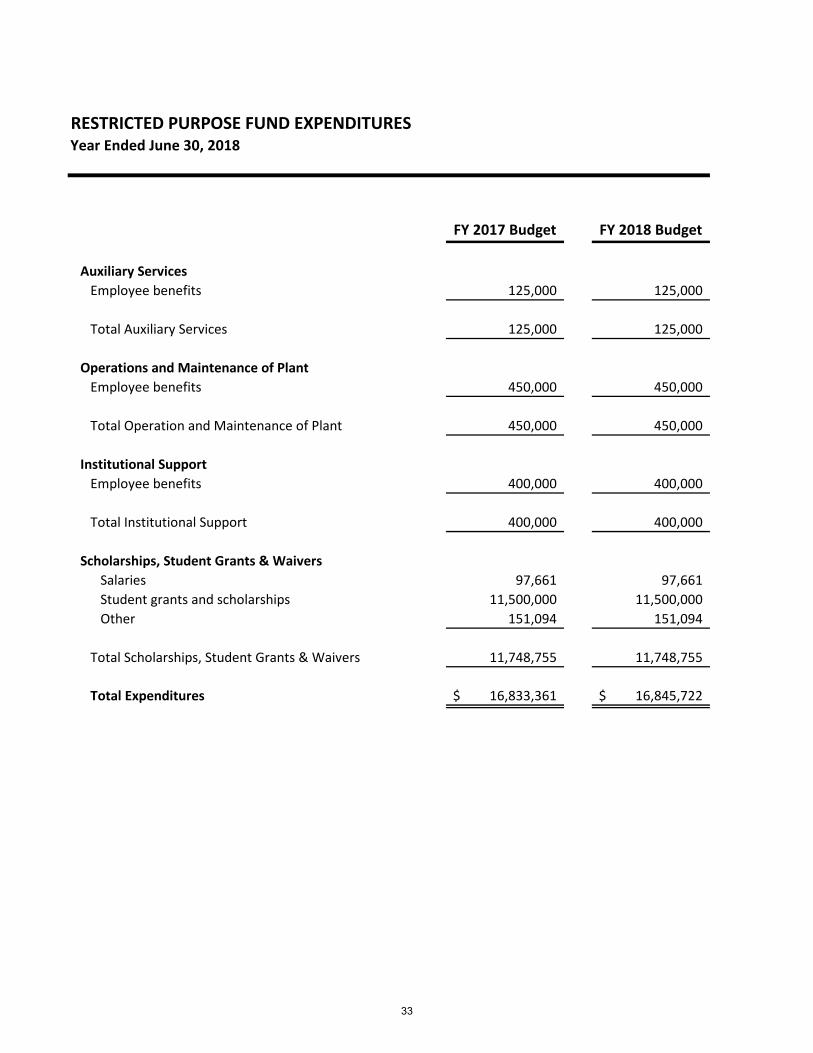
RESTRICTED PURPOSE FUND EXPENDITURESYear Ended June 30, 2018
FY 2017 Budget FY 2018 Budget
EXPENDITURESBy Program:
InstructionSalaries 908,869$ 911,531$ Employee benefits 2,029,002 2,048,856 Contractual services 139,130 122,872 Material and supplies 133,416 146,709 Conferences and meetings 18,239 21,399 Capital outlay 10,000 - Other 350 -
Total Instruction 3,239,006 3,251,367
Academic SupportEmployee benefits 250,000 250,000
Total Academic Support 250,000 250,000
Student ServicesEmployee benefits 350,000 350,000
Total Student Services 350,000 350,000
Public Service/Continuing EducationSalaries 143,170 143,170 Employee benefits 110,185 110,185 Contractual services 2,200 2,200 Material and supplies 2,580 2,580 Conferences and meetings 12,465 12,465
Total Public Service/Continuing Education 270,600 270,600
32
RESTRICTED PURPOSE FUND EXPENDITURESYear Ended June 30, 2018
FY 2017 Budget FY 2018 Budget
Auxiliary ServicesEmployee benefits 125,000 125,000
Total Auxiliary Services 125,000 125,000
Operations and Maintenance of PlantEmployee benefits 450,000 450,000
Total Operation and Maintenance of Plant 450,000 450,000
Institutional SupportEmployee benefits 400,000 400,000
Total Institutional Support 400,000 400,000
Scholarships, Student Grants & WaiversSalaries 97,661 97,661 Student grants and scholarships 11,500,000 11,500,000 Other 151,094 151,094
Total Scholarships, Student Grants & Waivers 11,748,755 11,748,755
Total Expenditures 16,833,361$ 16,845,722$
33
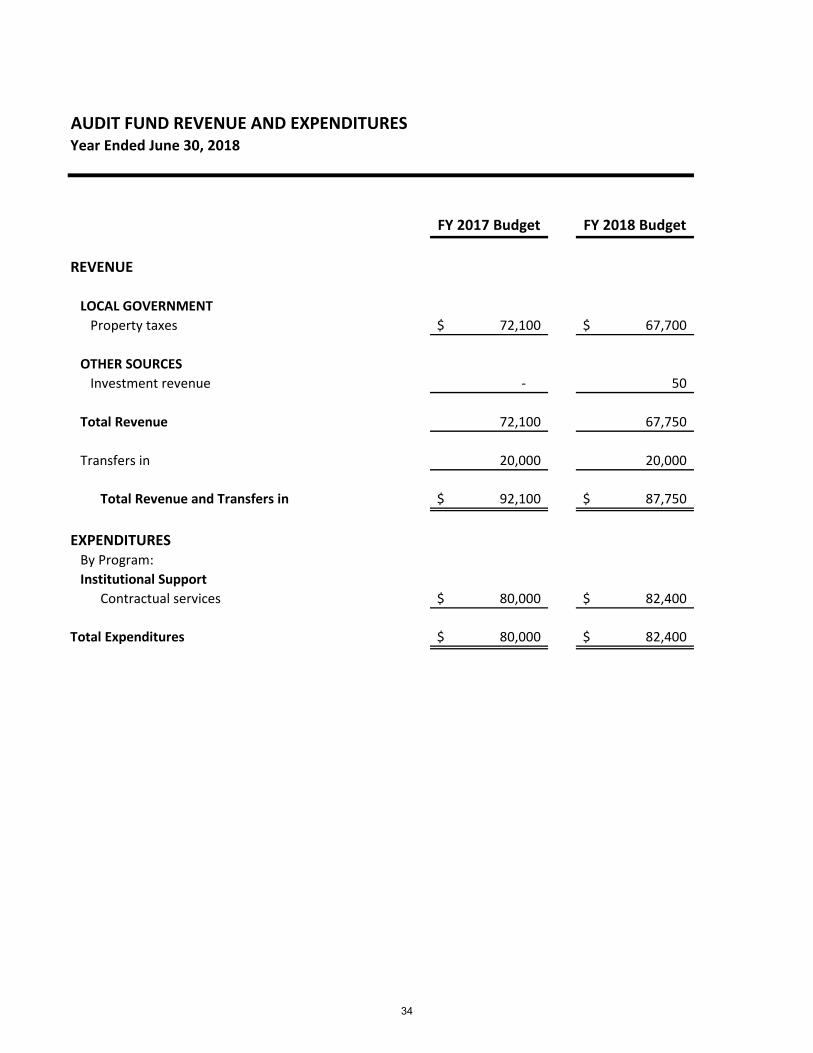
AUDIT FUND REVENUE AND EXPENDITURESYear Ended June 30, 2018
FY 2017 Budget FY 2018 Budget
REVENUE
LOCAL GOVERNMENTProperty taxes 72,100$ 67,700$
OTHER SOURCESInvestment revenue - 50
Total Revenue 72,100 67,750
Transfers in 20,000 20,000
Total Revenue and Transfers in 92,100$ 87,750$
EXPENDITURESBy Program:Institutional Support
Contractual services 80,000$ 82,400$
Total Expenditures 80,000$ 82,400$
34
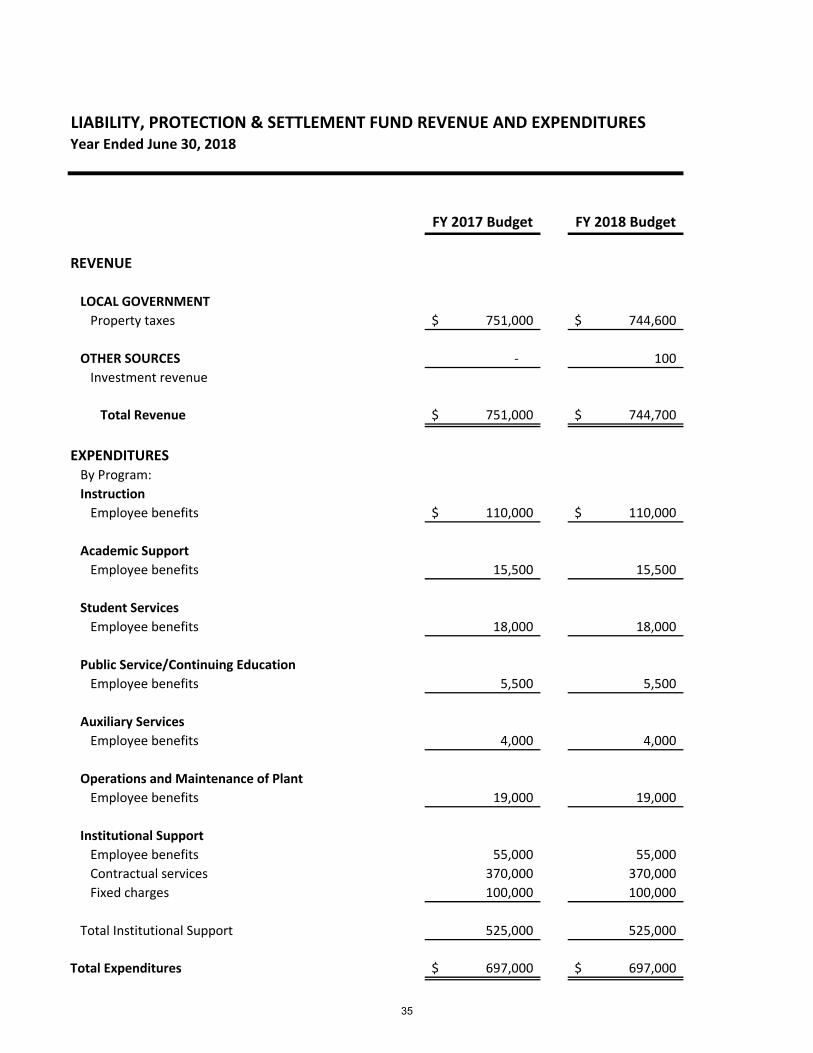
LIABILITY, PROTECTION & SETTLEMENT FUND REVENUE AND EXPENDITURESYear Ended June 30, 2018
FY 2017 Budget FY 2018 Budget
REVENUE
LOCAL GOVERNMENTProperty taxes 751,000$ 744,600$
OTHER SOURCES - 100 Investment revenue
Total Revenue 751,000$ 744,700$
EXPENDITURESBy Program:Instruction
Employee benefits 110,000$ 110,000$
Academic SupportEmployee benefits 15,500 15,500
Student ServicesEmployee benefits 18,000 18,000
Public Service/Continuing EducationEmployee benefits 5,500 5,500
Auxiliary ServicesEmployee benefits 4,000 4,000
Operations and Maintenance of PlantEmployee benefits 19,000 19,000
Institutional SupportEmployee benefits 55,000 55,000 Contractual services 370,000 370,000 Fixed charges 100,000 100,000
Total Institutional Support 525,000 525,000
Total Expenditures 697,000$ 697,000$
35
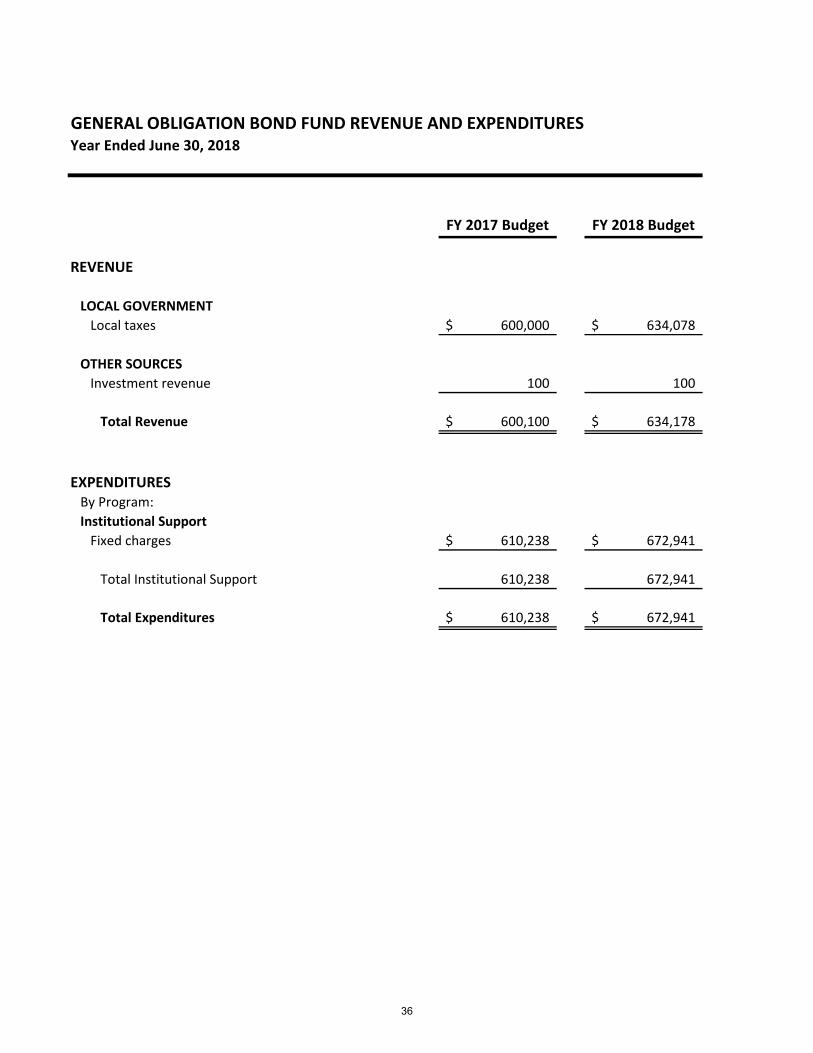
GENERAL OBLIGATION BOND FUND REVENUE AND EXPENDITURESYear Ended June 30, 2018
FY 2017 Budget FY 2018 Budget
REVENUE
LOCAL GOVERNMENTLocal taxes 600,000$ 634,078$
OTHER SOURCESInvestment revenue 100 100
Total Revenue 600,100$ 634,178$
EXPENDITURESBy Program:Institutional Support
Fixed charges 610,238$ 672,941$
Total Institutional Support 610,238 672,941
Total Expenditures 610,238$ 672,941$
36

OPERATIONS & MAINTENANCE (RESTRICTED) FUND REVENUE AND EXPENDITURESYear Ended June 30, 2018
FY 2017 Budget FY 2018 Budget
REVENUE
STATE CAPITAL GRANTOther state sources- capital grant $ 250,000 $ -
Total Revenue 250,000 -
Transfers in 490,000 360,000
Total Revenue and Transfers in $ 740,000 $ 360,000
EXPENDITURESBy Program:
Operations and Maintenance of PlantContractual services 390,000$ 350,000$ Capital outlay 350,000 10,000
Total Operation and Maintenance of Plant 740,000 360,000
Total Expenditures 740,000$ 360,000$
37
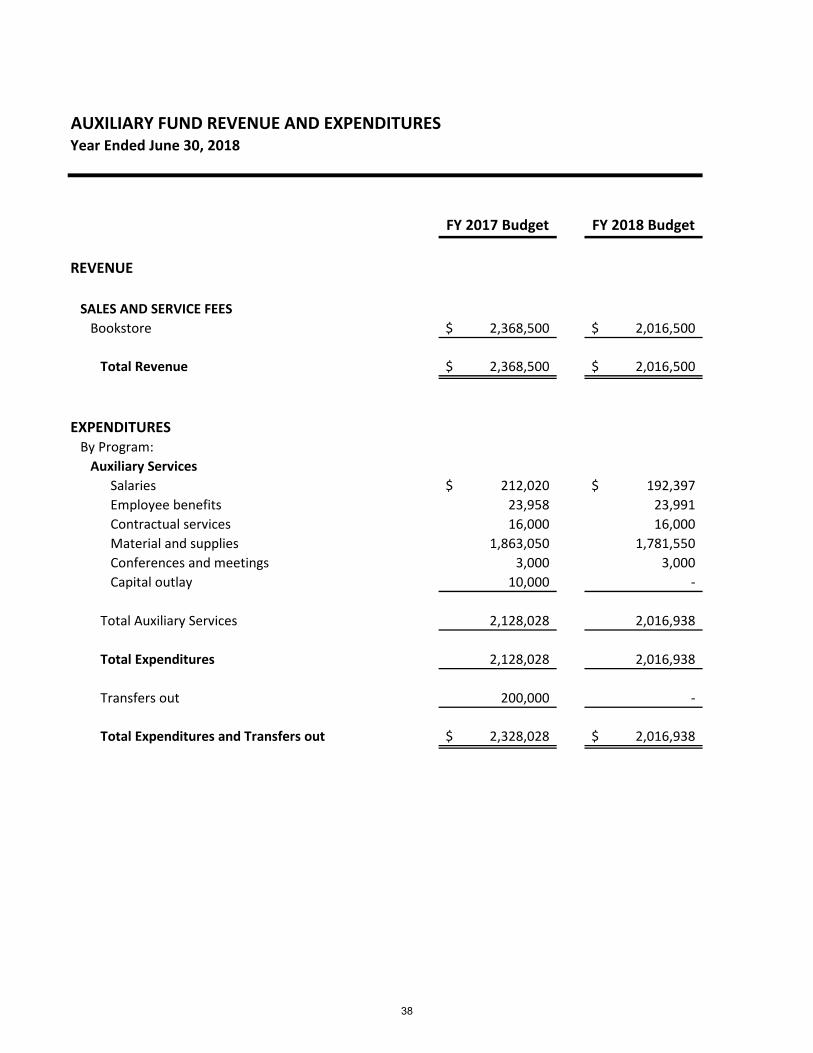
AUXILIARY FUND REVENUE AND EXPENDITURESYear Ended June 30, 2018
FY 2017 Budget FY 2018 Budget
REVENUE
SALES AND SERVICE FEESBookstore 2,368,500$ 2,016,500$
Total Revenue 2,368,500$ 2,016,500$
EXPENDITURESBy Program:
Auxiliary ServicesSalaries 212,020$ 192,397$ Employee benefits 23,958 23,991 Contractual services 16,000 16,000 Material and supplies 1,863,050 1,781,550 Conferences and meetings 3,000 3,000 Capital outlay 10,000 -
Total Auxiliary Services 2,128,028 2,016,938
Total Expenditures 2,128,028 2,016,938
Transfers out 200,000 -
Total Expenditures and Transfers out 2,328,028$ 2,016,938$
38
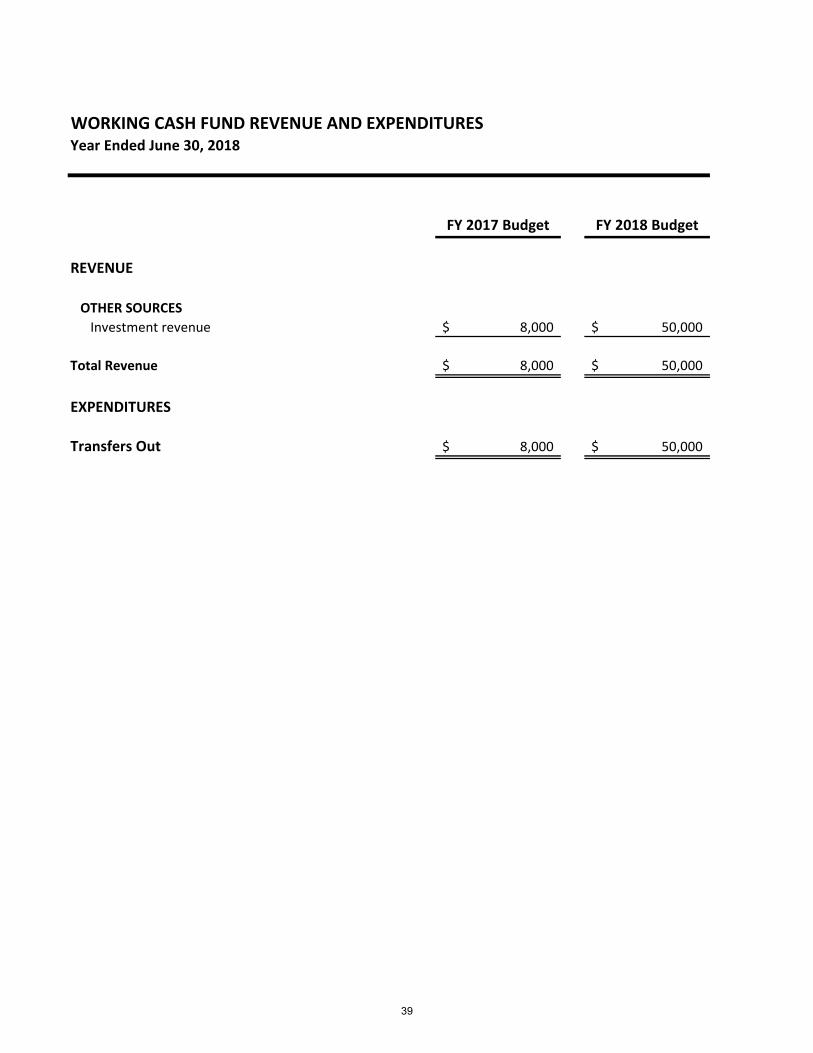
WORKING CASH FUND REVENUE AND EXPENDITURESYear Ended June 30, 2018
FY 2017 Budget FY 2018 Budget
REVENUE
OTHER SOURCESInvestment revenue 8,000$ 50,000$
Total Revenue 8,000$ 50,000$
EXPENDITURES
Transfers Out 8,000$ 50,000$
39
MORTON COMMUNITY COLLEGE
FISCAL YEAR 2018 BUDGET
Statistical Information
Changes in Net Position
Operating Expenses by Function
Property Tax Levies and Collections
Debt Capacity
20162015
20142013
20122011
20102009
OPER
ATIN
G R
EVEN
UES
Stu
den
t tuitio
n a
nd
fees
4,5
96
,20
4$
4
,04
0,5
67
$
3,3
61
,08
6$
4
,12
5,9
36
$
3,3
36
,36
7$
2
,96
5,1
07
$
1,9
78
,33
4$
2
,46
3,4
62
$
Oth
er
1,7
20
,31
5
1,8
50
,76
4
1,9
82
,77
5
2,2
38
,13
8
2,4
08
,89
3
2,5
97
,82
8
2,3
83
,06
8
2,0
16
,03
2
To
tal o
pera
ting
rev
en
ues
6,3
16
,51
9
5,8
91
,33
1
5,3
43
,86
1
6,3
64
,07
4
5,7
45
,26
0
5,5
62
,93
5
4,3
61
,40
2
4,4
79
,49
4
OPER
ATIN
G EXPEN
SESIn
str
uctio
n1
0,5
17
,89
5
12
,56
8,2
59
1
3,6
83
,81
6
11
,17
8,9
77
1
0,5
60
,77
6
10
,89
1,7
69
1
0,2
07
,87
9
8,8
20
,97
8
Aca
dem
ic s
up
po
rt
2,7
66
,99
0
2,3
64
,63
0
2,3
00
,30
0
2,1
46
,75
0
1,6
40
,87
0
1,6
57
,04
4
72
8,7
71
1
,26
1,1
97
Stu
den
t serv
ices
2,5
52
,96
3
2,5
52
,58
3
2,4
63
,09
9
2,0
64
,68
5
1,7
24
,41
6
1,9
63
,42
5
2,4
57
,24
0
2,6
44
,01
9
Pu
blic
serv
ices
55
8,0
55
5
28
,55
3
51
7,5
63
4
86
,25
5
52
8,2
09
4
99
,90
3
96
4,7
27
5
17
,12
8
Op
era
tion
an
d m
ain
ten
an
ce o
f pla
nt
6,5
89
,00
7
4,7
87
,61
0
5,6
02
,01
9
5,8
78
,45
4
4,3
63
,13
0
3,3
17
,14
3
2,9
15
,45
2
2,6
21
,43
7
Gen
era
l institu
tion
al
7,9
59
,93
2
7,0
22
,77
3
2,7
02
,34
6
4,2
65
,75
4
5,4
87
,90
8
4,0
68
,16
2
4,2
67
,79
7
3,4
96
,61
3
Au
xilia
ry
en
terp
ris
es
2,0
68
,04
2
2,4
40
,24
9
1,7
61
,59
7
1,4
45
,01
6
2,6
03
,13
8
2,5
39
,30
2
2,4
81
,19
7
2,1
01
,71
0
Sch
ola
rsh
ip e
xp
en
se
4,0
95
,79
9
4,3
91
,96
5
4,3
80
,56
3
6,2
03
,70
7
4,6
82
,95
0
4,1
60
,47
5
2,7
48
,85
9
1,9
35
,71
5
Dep
recia
tion
ex
pen
se
2,4
82
,40
7
1,7
97
,41
9
2,6
49
,89
2
2,5
67
,77
8
1,4
37
,22
8
1,4
50
,71
4
1,1
95
,65
1
1,1
45
,93
6
To
tal o
pera
ting
ex
pen
ses
39
,59
1,0
90
3
8,4
54
,04
1
36
,06
1,1
95
3
6,2
37
,37
6
33
,02
8,6
25
3
0,5
47
,93
7
27
,96
7,5
73
2
4,5
44
,73
3
Op
era
ting
(Lo
ss)
(33
,27
4,5
71
)
(32
,56
2,7
10
)
(30
,71
7,3
34
)
(29
,87
3,3
02
)
(27
,28
3,3
65
)
(24
,98
5,0
02
)
(23
,60
6,1
71
)
(20
,06
5,2
39
)
NO
N-O
PERA
TING
REV
ENU
ES (EXPENSES)
Rea
l esta
te ta
xes
9,1
28
,82
1
9,3
10
,38
1
8,3
37
,49
5
8,2
15
,44
1
7,6
67
,16
8
8,9
45
,30
8
8,6
52
,34
1
8,3
66
,31
7
Sta
te a
pp
ro
pria
tion
s1
5,1
45
,28
0
14
,44
9,8
48
1
4,4
53
,70
7
12
,81
6,4
92
9
,41
1,2
30
8
,47
1,0
61
8
,36
2,6
72
7
,78
0,6
47
Fed
era
l gra
nts
an
d c
on
tra
cts
8,8
52
,94
8
9,4
58
,61
1
9,9
17
,89
0
10
,91
1,2
86
1
0,1
59
,84
1
9,3
79
,39
7
7,3
08
,80
0
4,9
15
,01
4
No
n-g
ov
ern
men
tal g
ifts a
nd
gra
nts
3,3
00
2
0,7
10
2
3,6
50
2
20
,42
8
29
4,4
08
2
54
,56
5
20
9,4
67
1
58
,01
4
Inv
estm
en
t inco
me
27
,67
7
3,6
87
3
,43
7
12
,69
1
19
,31
7
12
,39
4
41
,85
9
18
9,4
44
Inte
rest o
n c
ap
ital a
sset-r
ela
ted
deb
t(2
04
,46
6)
(2
43
,64
8)
(2
48
,61
2)
(3
56
,00
0)
(2
80
,84
9)
(3
04
,98
6)
(1
56
,16
8)
(1
65
,16
1)
Net N
on
-Op
era
ting
Rev
en
ues (E
xp
en
ses)
32
,95
3,5
60
3
2,9
99
,58
9
32
,48
7,5
67
3
1,8
20
,33
8
27
,27
1,1
15
2
6,7
57
,73
9
24
,41
8,9
71
2
1,2
44
,27
5
Net In
co
me B
efo
re C
ap
ital C
on
trib
utio
ns
(32
1,0
11
)
43
6,8
79
1
,77
0,2
33
1
,94
7,0
36
(1
2,2
50
)
1,7
72
,73
7
81
2,8
00
1
,17
9,0
36
CA
PITAL C
ON
TRIBU
TION
SC
ap
ital g
ifts a
nd
gra
nts
-
-
-
-
-
-
-
-
To
tal c
ap
ital c
on
trib
utio
ns
-
-
-
-
-
-
-
-
CH
AN
GE IN
NET PO
SITION
(32
1,0
11
)$
4
36
,87
9$
1
,77
0,2
33
$
1,9
47
,03
6$
(1
2,2
50
)$
1
,77
2,7
37
$
81
2,8
00
$
1,1
79
,03
6$
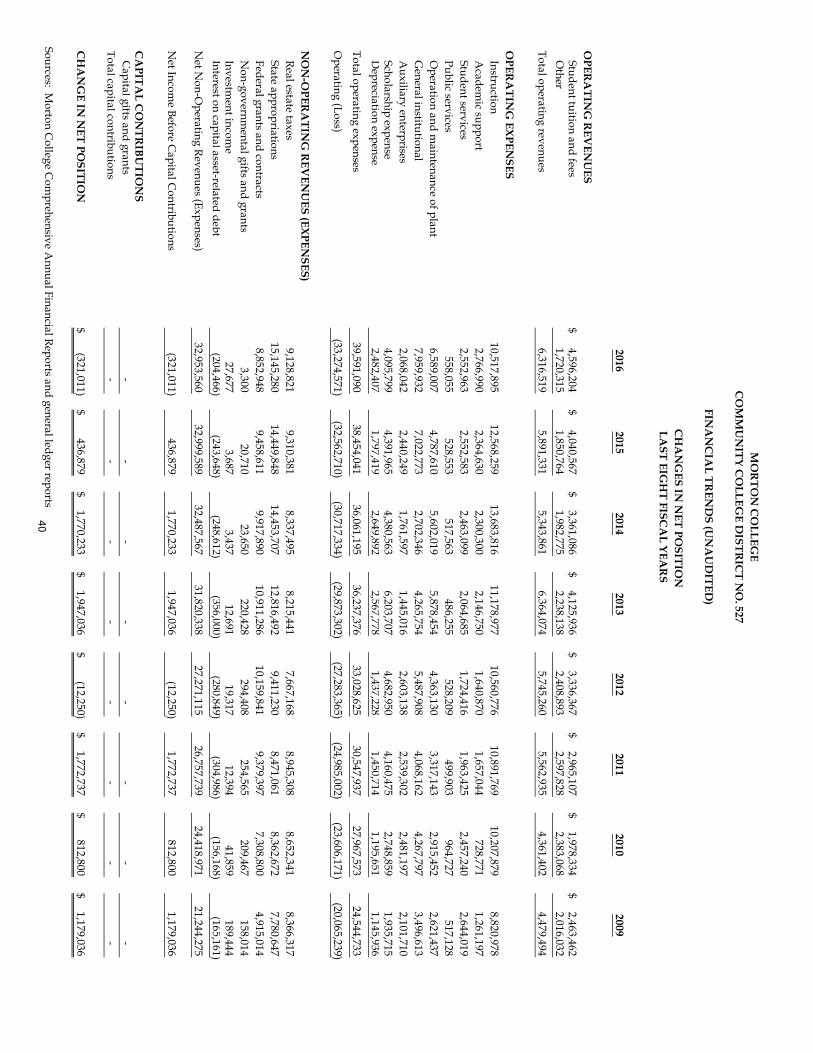
So
urces: M
orto
n C
olle
ge C
om
preh
en
siv
e A
nn
ua
l Fin
an
cia
l Rep
orts
an
d g
en
era
l led
ger r
ep
orts
LAST EIG
HT FISC
AL YEA
RS
MO
RTO
N C
OLLEG
EC
OM
MU
NITY C
OLLEG
E DISTR
ICT N
O. 527
FINA
NC
IAL TR
END
S (UN
AU
DITED
)
CH
AN
GES IN
NET PO
SITION
40

Operation
andScholarships
YearA
cademic
StudentInstitutional
Maintenance
andPublic
Auxiliary
of LevyTotal
InstructionSupport
ServicesSupport
of PlantFellow
shipsSupport
Service
2016
37
,523
$
10
,518
$
2,7
67
$
2,5
53
$
6,5
89
$
7,9
60
$
4,0
96
$
558
$
2,4
82
$
20
15
36
,658
1
2,7
69
2
,36
5
2,5
53
6
,88
2
4,7
88
4,3
92
529
2,4
40
20
14
34,3
00
1
3,6
84
2
,30
0
2,4
63
5
,60
2
2,7
02
4,3
81
518
2,6
50
20
13
34,7
94
11
,179
2
,14
7
2,0
65
5
,87
9
4,2
66
6,2
04
486
2,5
68
20
12
31,5
91
10
,561
1
,64
1
1,7
24
5
,48
8
4,3
63
4,6
83
528
2,6
03
20
11
29,0
96
10
,892
1
,65
7
1,9
63
4
,06
8
3,3
17
4,1
60
500
2,5
39
20
10
26,7
72
10
,208
7
29
2
,45
7
4,2
68
2,9
15
2,7
49
965
2,4
81
20
09
23,3
99
8
,821
1,2
61
2,6
44
3,4
97
2,6
21
1,9
36
517
2,1
02
200
824
,177
8
,134
1
,55
7
2,6
05
3
,80
0
3,0
08
2,5
11
434
2, 1
29
200
723
,323
7
,927
1
,74
1
2,8
55
3
,10
4
2,8
40
2,5
49
357
1,9
50
So
urce: C
olle
ge R
eco
rd
s
MO
RTO
N C
OLLEG
EC
OM
MU
NITY C
OLLEG
E DISTR
ICT N
O. 527
FINA
NC
IAL TR
END
S (UN
AU
DITED
)
OPER
ATIN
G EXPEN
SES BY FUN
CTIO
N (D
OLLA
RS IN
THO
USA
ND
S)LA
ST TEN FISC
AL YEA
RS
41
Delinquent Taxes
Total Year
Total ExtendedC
urrent YearPercent
Collected
Taxes Percent
of LevyTax Levy
Collections
of Levy(refunded)
Collected
of Levy
20
15
9,7
29
,038
$
3,7
14,8
93
$
38.1
8%
-$
3,7
14
,89
3$
3
8.1
8%
20
14
9,6
13
,393
9,3
65,1
96
97.4
2%
(95,9
88)
9
,26
9,2
08
9
6.4
2%
20
13
9,4
28
,97
0
9,3
64,8
46
99.3
2%
(182,3
76)
9
,18
2,4
70
9
7.3
9%
201
29
,12
3,0
84
9,0
43,6
69
99.1
3%
(169,0
46)
8
,87
4,6
23
9
7.2
8%
201
18
,98
9,5
63
8,9
14,2
23
99.1
6%
(196,9
42)
8
,71
7,2
81
9
6.9
7%
20
10
9,0
36,8
94
8,9
77,6
70
99.3
4%
(242,4
60)
8
,73
5,2
10
9
6.6
6%
20
09
8,9
12
,68
8
8,9
18,8
89
100.0
7%
(386,9
28)
8
,53
1,9
61
9
5.7
3%
20
08
8,8
05
,98
5
8,8
64,9
14
100.6
7%
(353,7
81
)
8,5
11
,13
3
96
.65
%
20
07
8,4
78
,94
5
8,4
65,2
04
99.8
4%
(308,3
39
)
8,1
56
,86
5
96
.20
%
20
06
8,2
37
,64
58,2
23,1
35
99.8
2%
(423,9
85
)
7,7
99
,15
0
94
.68
%
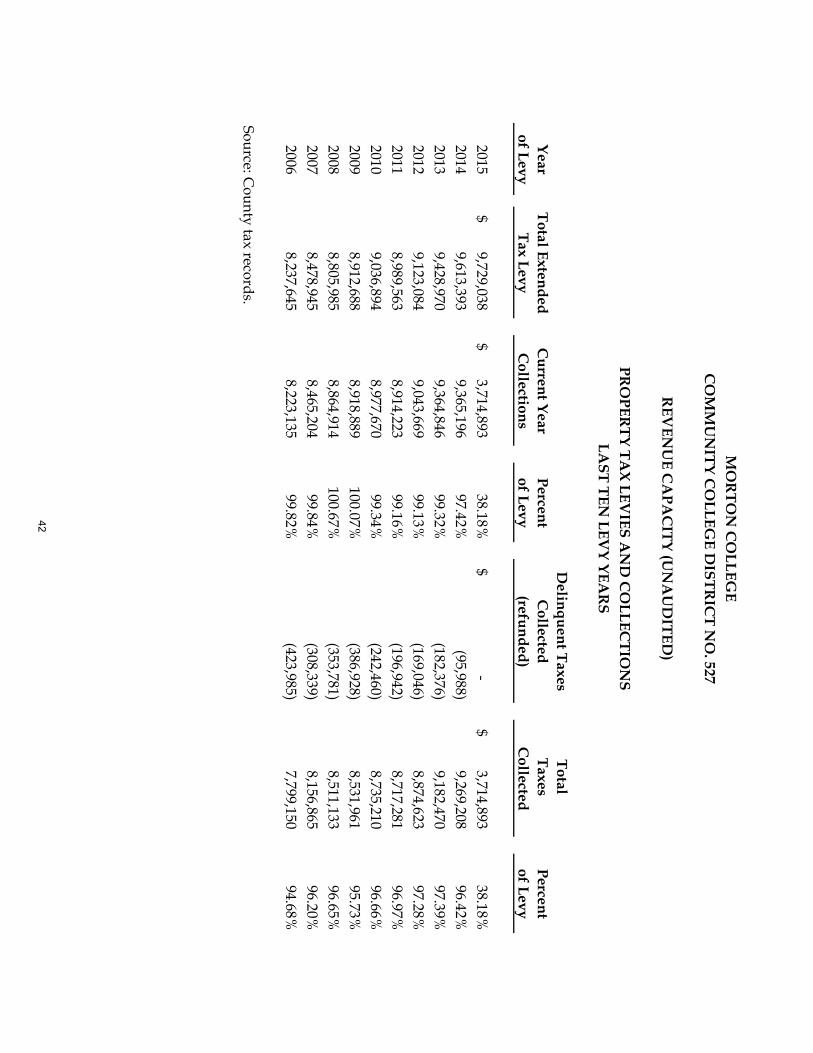
So
urce: C
ou
nty
tax
reco
rd
s.
LAST TEN
LEVY YEA
RS
MO
RTO
N C
OLLEG
EC
OM
MU
NITY C
OLLEG
E DISTR
ICT N
O. 527
REV
ENU
E CA
PAC
ITY (UN
AU
DITED
)
PRO
PERTY TA
X LEVIES A
ND
CO
LLECTIO
NS
42
LEGA
L DEBT M
AR
GIN
INFO
RM
ATIO
NLA
ST TEN FISC
AL YEA
RS
Net D
ebtA
pplicable toD
ebt Limit
Net D
ebtD
ebt Limit as a
Fiscal A
ssessedD
ebt Limit
(Assessed V
alue A
pplicableLegal D
ebtPercentage of
YearV
alueR
ate D
ebt Limit R
ate)to D
ebt Limit
Margin
Debt Lim
it
20
16
1,3
93
,85
1,9
49
$
2.8
75%
40,0
73,2
44
$
4,2
59,2
64
$
35
,81
3,9
80
$
10
.63
%
20
15
1,4
34
,85
1,1
28
2.8
75%
41,2
51,9
70
4,4
87,3
76
3
6,7
64
,59
4
10
.88
%
20
14
1,5
38
,19
8,3
34
2.8
75%
44,2
23,2
02
4,7
45,0
00
3
9,4
78
,20
2
10
.73
%
201
31
,64
0,8
96
,56
1
2.8
75%
47,1
75,7
76
5,5
80,0
00
4
1,5
95
,77
6
11
.83
%
201
21
,78
3,7
04
,12
4
2.8
75%
51,2
81,4
94
6,3
95,0
00
4
4,8
86
,49
4
12
.47
%
201
12
,30
5,3
98
,88
5
2.8
75%
66,2
80,2
18
7,2
00,0
00
5
9,0
80
,21
8
10
.86
%
201
02
,28
2,8
36
,10
0
2.8
75%
65,6
31,5
38
8,0
75,0
00
5
7,5
56
,53
8
12
.30
%
200
92
,27
9,0
23
,70
92.8
75%
65,5
21,9
32
3,3
75,0
00
62
,14
6,9
32
5.1
5%
200
82
,06
3,1
15
,77
0
2.8
75%
59,3
14,5
78
3,7
60,0
00
5
5,5
54
,57
8
6.3
4%
200
71
,97
5,5
91
,55
9
2.8
75%
56,7
98,2
57
4,1
30,0
00
5
2,6
68
,25
7
7.2
7%
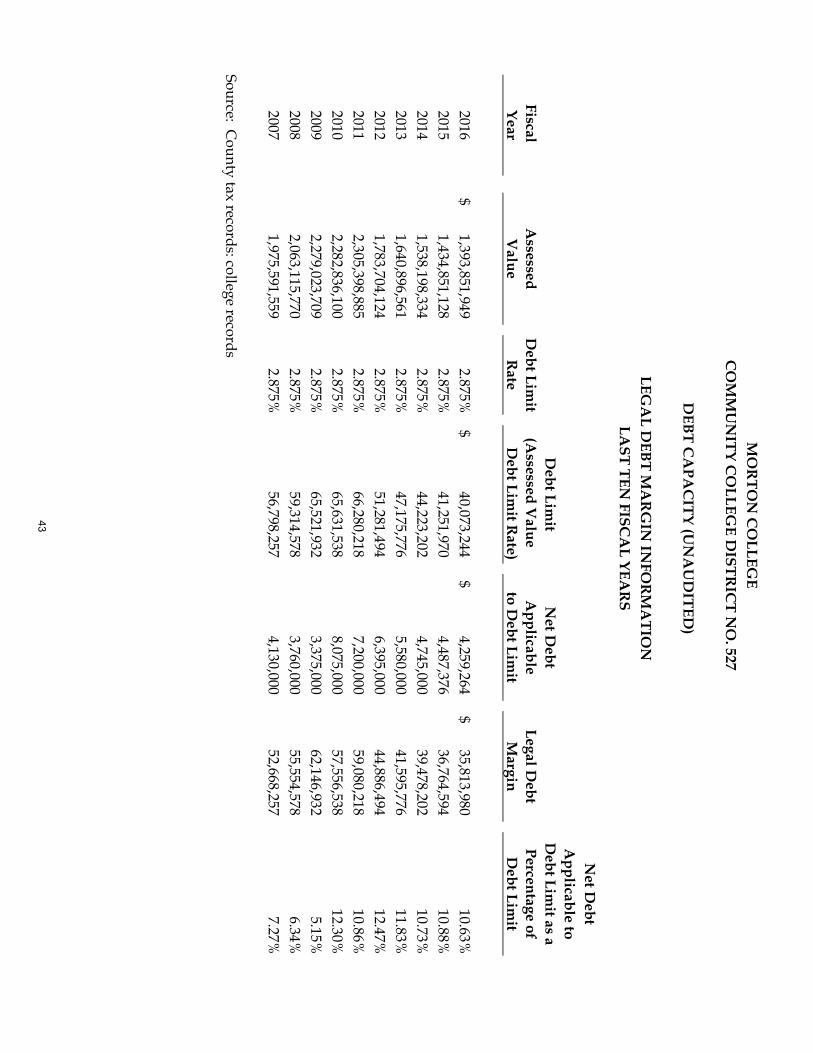
So
urce: C
ou
nty
tax
reco
rd
s: c
olle
ge r
eco
rd
s
MO
RTO
N C
OLLEG
EC
OM
MU
NITY C
OLLEG
E DISTR
ICT N
O. 527
DEBT C
APA
CITY (U
NA
UD
ITED)
43

MORTON COMMUNITY COLLEGE
FISCAL YEAR 2018 BUDGET
Resolutions
2017 – 2018 Budget Legal Notice
NOTICE
2017-2018 BUDGET AVAILABLE FOR PUBLIC INSPECTION
NOTICE IS HEREBY GIVEN by the Board of Trustees of Illinois Community College
District No. 527, in the County of Cook, State of Illinois, that a Tentative Budget for said District
for the fiscal year beginning July 1st, 2017 will be on file and conveniently available for public
inspection beginning Wednesday, July 5th, 2017, through Thursday, August 17th, 2017 on
Monday, Tuesday, Wednesday and Thursday from 8:00 a.m. to 4:30 p.m. in the Business Office,
Room 203C of Building “C” and in the Morton College Library, on reserve at the Circulation Desk,
1st floor “B” Building from 8:00 a.m. to 8:00 p.m. located at 3801 South Central Avenue, Cicero,
IL 60804.
NOTICE IS FURTHER HEREBY GIVEN that a public hearing on said budget will be held
at 5:00 p.m. on Wednesday the 23rd day of August 2017 in the Morton College Board Room,
Room 221, Building "B", 3801 South Central Avenue, Cicero, Illinois.
Dated this 26th day of June 2017.
Morton College, Community College District No. 527, in the County of Cook, State of Illinois.
Jose Collazo, Secretary Board of Trustees Morton College Community College District No. 527
4444