moving at the speed of innovation - nimir · in 1977, he started descon engineering limited and...
TRANSCRIPT
moving at the
speed of Innovation
Descon Chemicals Limited
Annual Report 2013

moving at the
speed of Innovation
Descon Chemicals Limited
Annual Report 2013
Cover
ConceptAt Descon Chemicals Limited (DCH) our progress is synonymous with innovation. It is our aim to focus on improvising things essential to human progress. Therefore, we continue with our incessant efforts to create chemistry, for a sustainable future through our chemicals that are used in multiple industries worldwide, to not only meet their current and future needs, but, that of our civilization as well.
It is innovation that lies at the core of our competitiveness and sets DCH apart from the mediocre players of the industry. Like always, we remain committed to creating solutions that will make lives healthier, safer, easier and more enjoyable.
Today, the DCH business acknowledges its role as a vital player that influences and assists a wide variety of industries across the globe in keeping pace with the ever-changing demands of the society. This is what motivates us to improve our existing product portfolio.

2345678
171819202122242526282930313270727375
Vision & MissionCompany Information Board & Management CommitteesProfile of the Chairman & CEOChairman’s Statement CEO’s ReviewDirectors’ ReportKey Operating and Financial DataHorizontal Analysis of the Balance SheetVertical Analysis of the Balance SheetHorizontal & Vertical Analysis of the Profit and Loss Account Statement of Wealth Creation & Its DistributionStatement of Compliance with the Code of Corporate GovernanceAuditors’ Review Report Auditors’ Report Balance SheetProfit & Loss AccountStatement of Comprehensive IncomeCash Flow Statement Statement of Changes in EquityNotes to and forming part of the Financial StatementsPattern of ShareholdingCategories of ShareholdersNotice of Annual General MeetingForm of Proxy
Contents
AnnuAl RepoRt 20131

VIsIonTo become a leading chemical solutions provider to industry worldwide.
MissionTo provide competitive chemical solutions through technological innovation to form the basis of better life.
statement of ethics & Business PracticesWe believe in a stimulating and challenging team oriented work environment that encourages develops and rewards excellence. We are committed to diligently serving our community and stakeholders, while maintaining high standards of moral and ethical values.
Vision & Mission
DESCON CHEMICALS LIMITED 2

Board of DirectorsAbdul Razak DawoodChairman
Taimur SaeedChief Executive Officer
Dr. Salman ZakariaFarooq NazirSyed Zamanat AbbasTaimur DawoodMuhammad SadiqFaisal Dawood
Chief Financial OfficerYasir Siddique Sheikh
Company SecretaryAbdul Sohail
AuditorsHorwath Hussain Chaudhury & Co.Chartered Accountants
Internal AuditorsM/s KPMG Taseer Hadi & Co.Chartered Accountants
Legal AdvisorsM/s Hassan & HassanAdvocates
BankersBank Al Habib LimitedHabib Metropolitan Bank Limited
Share RegistrarM/s Corplink (Pvt.) LimitedWings Arcade, 1-K Commercial Area,Model Town, Lahore - 53000Tel: +92 42 35887262, 35839182Fax: +92 42 35869037 Registered OfficeDescon Headquarters18-KM Ferozepur RoadLahore - 53000 Pakistan.Tel: +92 42 35923721-9Fax: +92 42 35923749
CompanyInformation
Plant SiteSite 1:14.5-KM Lahore - Sheikhupura Road, Lahore, Pakistan. Tel: +92 42 37970 962Fax: +92 42 37970 229
Site 2:14.8 Km Sheikhupura - Faisalabad Road Mouza Bhikki District, Sheikhupura Pakistan.Tel: +92 56 3090 955, 3091 294Fax: +92 56 3882 189
Karachi OfficeBusiness Avenue, 26/A, 9th Floor, Block 6, PECHS, Shahra-e-Faisal, Karachi, PakistanTel: +92 21 34544485-6Fax: +92 21 34382674
Web PresenceUpdated Company’s Information together with the latest Annual Report can be accessed at Descon’s website,www.descon.com
AnnuAl RepoRt 20133

Board and management committees
Audit CommitteeAudit committee has been constituted by the Board in compliance with the Listing Regulations. The committee oversees the Internal Audit function, and also reviews internal audit plans and reports. The committee conducts its meetings as and when required. The committee apprises the Board about the significant discussions and decisions at its meetings and recommendations in respect of Company’s operations and financial results.
The committee comprises of four members, of whom three are non-executive directors, including the Chairman of the committee. This committee is constituted of the following members:
Farooq Nazir ChairmanTaimur Dawood MemberSyed Zamanat Abbass Member Muhammad Sadiq Member
Human Resource & Remuneration CommitteeThe Committee has been constituted by the Board to recommend human resource management policies to the Board and fulfill the requirements of the Code of Corporate Governance. It comprises of three members, of whom two are non-executive directors including the Chairman of the committee who is a non-executive director.
Taimur Dawood ChairmanFarooq Nazir MemberTaimur Saeed Member
Enterprise Risk Management CommitteeEnterprise Risk Management Committee was constituted to assist Audit Committee of the Board of Directors in overseeing and reviewing information regarding the enterprise Risk Management framework, including the significant policies, procedures and practices employed to manage all risks affecting the Company. The committee at minimum meets on a quarterly basis or as frequently as necessary. The committee is constituted of the following members:
Farooq Nazir Chief Risk OfficerTaimur Dawood Board NomineeTaimur Saeed Chief Executive OfficerAbdul Sohail Company SecretaryAther Mahmood Khan Head Shared ServicesAhmad Ali Masood Finance ManagerSaima Momin Head HR
Compliance CommitteeCompliance Committee was constituted to oversee Company’s compliance with applicable legal and regulatory requirements, industry standards, and the Company’s Code of Ethics and Business Conduct. The committee is constituted of the following members:
Taimur Saeed Chief Executive OfficerAbdul Sohail Company SecretaryAther Mahmood Khan Head Shared ServicesTarriq Jabbar Plant ManagerAhmad Ali Masood Finance ManagerSaima Momin Head HR
DESCON CHEMICALS LIMITED 4

profile of the chairman and Ceo
Abdul Razak Dawood is the Chairman of Descon, which is involved in Engineering, Chemicals and Power businesses.
He started his career as Managing Director of Lawrencepur Woolen Mills, before assuming responsibility of Managing Director at Dawood Hercules Chemicals Limited.
In 1977, he started Descon Engineering Limited and since then has been associated with it. Currently, he is the Chairman of Descon Engineering Limited, the premier Pakistani multinational company, which is operating in five countries, and holding four overseas manufacturing units. It has more than 25000 employees, 50% of them based overseas.
He is one of the founders of Lahore University of Management Sciences (LUMS) and has been its Rector since inception. He has also served the Lahore Chapter of Management Association of Pakistan as Chairman. He is a former trustee of Shaukat Khanam Memorial Cancer Hospital.
He has graduated in Engineering from Newcastle University, UK and obtained his MBA from Columbia University, USA.
Taimur Saeed is the Chief Executive Officer of the Company, while also serving on the board of Descon Oxychem Limited as Chief Executive Officer.
He had an illustrious career of over 18 years at BOC Pakistan, (Linde Group, Germany), where he last held the position of Head of Sales & Customer Services and also was Business Manager Industrial Products in Malaysia, Indonesia, India, Bangladesh and Pakistan. He joined Descon Chemicals Limited as GM Sales & Marketing before his appointment as CEO.
He has attended management Leadership course at INSEAD, Singapore. He is an MBA from Mercer University, Atlanta, USA and a B.Com, from Karachi University.
Abdul Razak DawoodChairman
Taimur Saeed Chief Executive Officer
AnnuAl RepoRt 20135

Chairman’s statement
The macroeconomic challenges in Pakistan have impacted all businesses in the country and we are
no exception, however, your Company has managed to develop and implement effective strategies to mitigate risks posed by these challenges. I am pleased to share that your Company succeeded in introducing new products with higher contribution margin endeavoring to change the product mix to provide a sustainable platform for profitable growth. The new product portfolio faces the challenges of utility shortages not only in our production facilities but also at the manufacturing facilities of our customers.
Management is continuously focusing on product development to add new products to its existing range and at the same time exit the products that are not performing. Our objective is product diversification through new technology to continue to be relevant for our customers. Management is confident that continuous innovation and the use of technology in the development of cost effective recipes shall help stabilize the Company’s financial position. The Management and the Board are fully aware of the necessity and urgency to continue to innovate and provide solutions and we have plans and resources in place to achieve this ambitious goal. We have invested not only in products but also in providing application support to our customers. This has repositioned your Company in the market as a solution provider as opposed to a manufacturer only.
The Company with its existing product portfolio and continuous innovation is fully equipped to capture a
significant share of the market. Despite proliferation in the market with competition from the undocumented sector which puts your company at a disadvantage in the short term yet we are determined to compete with quality chemical solutions by continuously introducing winning products and ideas in the market. Our contribution to society is not limited to delivering profitability to stakeholders but envisages a wider scope which among other things includes gainful employment, technical advice for our customers and savings of foreign exchange by providing credible alternatives for imports.
The Company has a strong governance structure, based on integrity, business ethics and honesty, driven by strong sense of duty to our colleagues, stakeholders and ourselves. The Board of Directors has procedures and policies in place to evaluate performance of the Company, so that it delivers exceptional results within the sphere of its challenges.
I would like to thank my fellow Directors and all stakeholders, particularly our customers, shareholders and lenders for their assistance and commitment throughout the year. I congratulate the Management and employees for performing in a very hostile economic condition and wish them growth and success in future.
Abdul Razak DawoodChairman
September 30, 2013
DESCON CHEMICALS LIMITED 6

Ceo’s ReVIeW
Descon Chemicals Limited maintained a steady conversion of its product portfolio to high margin
technologically superior products. The Company invested in various cost efficiency projects as well to remain competitive in its existing product portfolio and to provide cost effective solutions to our customers. Economic slowdown of the country coupled with increased energy shortages decreased demand for many of our products as our customers continue to suffer utility shortages. Demand is also greatly affected by unorganized small players in the industry against which innovation is the only differentiating strategy for profitable growth in the long run.
Product development through innovation to provide customers with products developed with cutting edge scheme is gradually being transformed into reality. We have launched numerous new products while paper and pulp remained under greater focus. We are also providing application support to our customers to highlight the value addition our products can bring to their processes. We aim to continue fighting challenging economic climate by internal strength that we have built over a period of time.
Increase in raw material prices has placed significant pressures on our margins. The management has taken various initiatives to reduce overheads through efficient utilization of resources. We have increased our focus on timely collection of outstanding receivables and aim to reduce investment in working capital in light of expected increase in interest rates. Challenging economic environment in the country has negatively
impacted vulnerable businesses within our customer base which precludes our ability to solicit a wide range of customers and restricts us to few financially strong ones to protect our receivables.
We thank all our stakeholders, especially our shareholders and lenders, and request them for continued support, for persevering with us, while we continue to strive to meet the challenges in the future. I would also like to appreciate the efforts of Management and employees for their hard work and grit to take us through these tough times.
Taimur SaeedChief Executive Officer
September 30, 2013
AnnuAl RepoRt 20137

DIReCtoRs’ RePoRt
or 13% less compared to the previous year. An increase of price by 6% completely off-set the increase in cost of raw materials consumed. Consequently, gross profit margin remained flat at 9%.
Operating profit of the Company registered a decrease of approximately PKR 12 mln or 10% over last year mainly due to the additional expenditure on research and development for new products. However, the finance cost of the Company decreased by 12% due to reduction in KIBOR and tight control over working capital. Challenging economic environment in the country has negatively impacted vulnerable businesses within our customer base which could not survive hence increase in other operating expenses by PKR 34 mln represents provisions against outstanding receivables.
Management’s focus on working capital continues with stringent working capital controls, reducing the investment in trade debts and inventories.
The Company’s investment in Descon Oxychem Limited, a related party, suffered a loss during the year, giving a share of loss of PKR 5 mln to the Company against a loss of PKR 13 mln last year contributing to the increase of loss after taxation and share of net loss of associate to PKR 42 mln as compared to PKR 61 mln last year.
2013 2012 (Rupees in thousands)
Sales 2,402,440 2,560,856 Gross profit 216,361 219,154 EBITDA 106,383 163,207 Operating profit 106,633 118,305 Finance cost 110,466 125,670
(Loss) / profit before tax and share of loss of associated undertaking (37,908) 9,035 Share of net loss of associate (5,409) (13,299) Loss before tax (43,318) (4,264) Loss after tax (42,101) (61,704) EPS - (Rupees) (0.21) (0.31)
The financial year was challenging for the Company as it had more than its fair share of challenges.
The adverse effects of macroeconomic environment reduced demand of our products and ultimately affected Company’s profitability. The Company suffered net loss of PKR 42 mln which is PKR 19 mln less than last year. We sold 16,095 MTs, a decrease of 2,050 MTs
The Directors of the Company are pleased to present the Annual Report along with the Audited Financial Statements for the year ended June 30, 2013.
Financial Review
DESCON CHEMICALS LIMITED 8
Cash Flow ManagementThe Company has a strong working capital management system, which is regularly monitored through rolling forecasts. Receipts and payments of cash and other liquid assets, including investments, are diligently managed to achieve optimal working capital cycle.
Furthermore, working capital management has been institutionalized through controls built in the ERP system, which helps coordinate the activities amongst various departments including marketing, supply chain and finance. This cash focused strategy has enabled the Company to survive through difficult times when both sales volumes and profit margins are under immense pressure. Moreover, this strategy has also kept the overall credit risk of the Company under check.
Risk ManagementThe Company’s activities expose it to a variety of risks, operational and financial. The Company’s overall risk management program focuses on the uncertainties of these risks and seeks to minimize potential adverse effects on the financial performance, through appropriate strategies for their mitigation. Risk management is an ongoing process involving assessing and identifying individual risks posed to the Company, and evaluating the potential impact, while devising appropriate course of action to counter them.
Economic, political and environmental uncertainties of a business environment and inherent risks within the nature of a business expose even the strongest of companies to a certain level of external risk. The Board
manages these risks through its Risk Management Committee, and is confident that we have sufficient mitigating factors in place to respond to these risks, as they arise.
Subsequent EventsThere are no subsequent events to report after the year-end.
Sales and Marketing
With over 30 years experience, Descon Chemicals Limited prides itself for providing its customers the best possible chemical solutions in the industry. Catering to a multitude of industrial sectors, our solutions and services provide the best value and quality that our customers deserve.
Innovation is an integral part of Descon Chemicals business philosophy. Descon Chemicals is a technology leader for new development in commercial and advanced application. We are constantly redefining ourselves in terms of products and services that we offer to meet the growing and changing needs of our customers. Our product offerings are categorized under five Business Lines, which cater to specific sectors of the industry as detailed below:
Coatings and Emulsions Polyester ResinsPulp & Paper Textile Trading
AnnuAl RepoRt 20139
Coating & EmulsionsOur range of chemicals includes a wide assortment of Binders and Additives for the Paints & Coatings industry. In spotlight are Long Oil-based medium viscosity and low viscosity enamels with the highest quality in hardness, water-resistance and durability for decorative paints.
Coatings & Emulsions form the backbone of our Company, and form almost half of the total turnover. Market share of low cost manufacturers has increased rendering this industry as extremely price sensitive and exerting pressure on our margins. Imposition of various taxation measures has also affected demand of our products in a negative manner. These continued developments have resulted in reorganization of some major players in the industry.
We continuously strive to improve our current products in terms of quality, suitability, and economy. Additionally our dedicated team of experts fights hard to develop new products, which can bring success in the world of cut throat competition. Moreover, the efficient and timely, sourcing and procurement, lead us to be competitive in prices. The focus of our endeavors is to provide the best-suited, efficient and cost-effective solutions to the coatings and emulsions industry. It is for this reason that we lay so much emphasis on collaborating with our customers in technical development.
Polyester ResinsDescon Chemicals Limited is one of Pakistan’s major supplier of unsaturated polyester and vinyl ester resins for composites applications. Company offers the broadest manufacturing presence to produce a complete line of resin products, Gel-coats and bonding pastes for customers who fabricate composite products rang-ing from bathtubs to sewerage pipes.
Innovation is the key to Company’s success. Company is a technology leader for development of new materials for both conventional and advanced composites
applications. Company offers resin systems that meet and exceed customer expectations of application properties, environmental compliance and end use performance. Introduction of new version of general-purpose resins in combination with high performance properties shows the dedication of Company’s commitment to development of customized solutions for the industry.
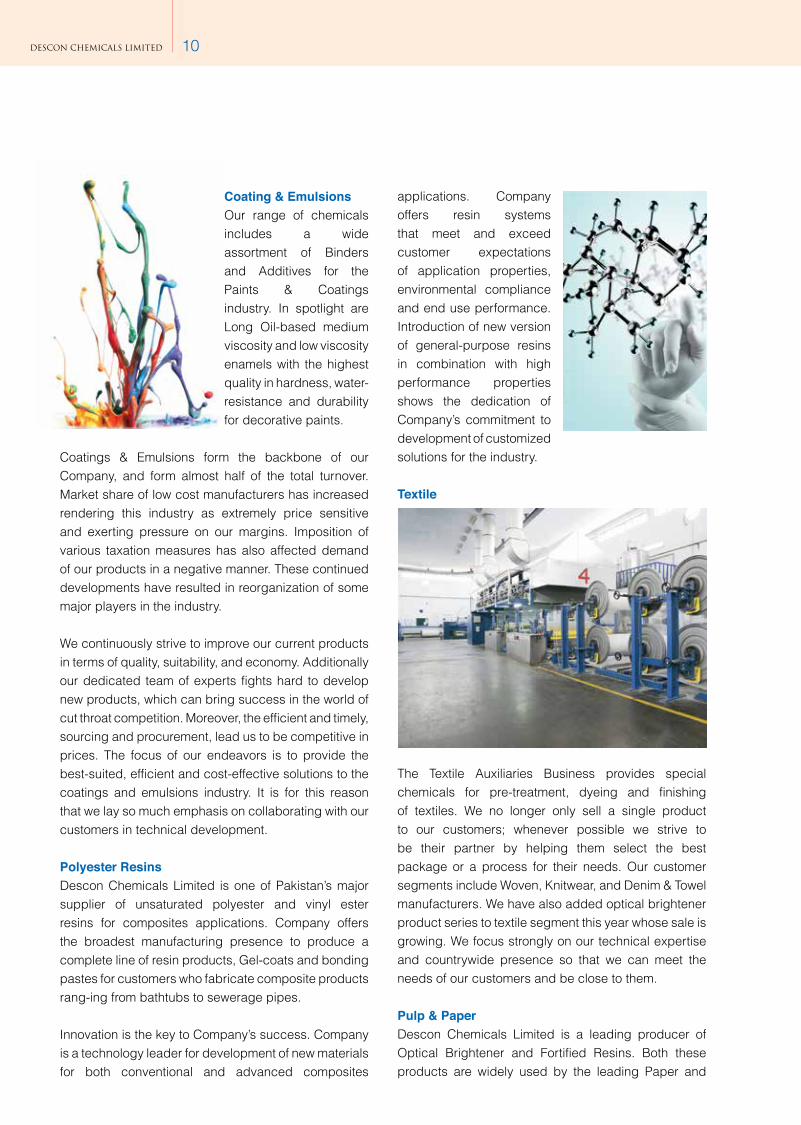
Textile
The Textile Auxiliaries Business provides special chemicals for pre-treatment, dyeing and finishing of textiles. We no longer only sell a single product to our customers; whenever possible we strive to be their partner by helping them select the best package or a process for their needs. Our customer segments include Woven, Knitwear, and Denim & Towel manufacturers. We have also added optical brightener product series to textile segment this year whose sale is growing. We focus strongly on our technical expertise and countrywide presence so that we can meet the needs of our customers and be close to them.
Pulp & PaperDescon Chemicals Limited is a leading producer of Optical Brightener and Fortified Resins. Both these products are widely used by the leading Paper and
DESCON CHEMICALS LIMITED 10

Board manufacturers of Pakistan. Additionally, Company’s Fortified Rosen is an ideally suited option for controlling the roughness and spreading of ink on paper.
We have added new products to our portfolio in paper segment namely AKD, SP-30, De-Ink, De-Polyresil 3, De-Fix to meet the needs of pulp & paper industry. These products are also being exported. Although we are a market leader in Optical Brightener technology, but we don’t stop here, we have improved our operating efficiency by introducing Nano-Filteration technology to Optical Brightener category which has also improved the product quality. Our motivation is to provide cost effective solutions to our valued customers along with consistent improvement to existent products and adding new products to portfolio. We hope and feel confident that in the coming years pulp & paper segment will add considerable value to our company.
Trading Due to the Com-pany being a substantial user of speciality and commodity chemi-cals, it also trades in selected chemi-
cals after adding significant value to the products, for which it is a substantial player in the market. The idea is to leverage our sourcing and buying efficiencies and earn a healthy margin. We continuously endeavor to develop strong sources for supply with which we can serve our valuable customers. Petrochemicals have been our key focus area where we have been working extremely hard for the last three years. We are grow-ing a Company, which introduces high quality product range and a staunch commitment to excellent custom-er service.
Trading business has always been a profitable segment for the Company for the past few years. Although
business ability to perform on consistent basis has been a challenge, due to external challenges like market demand, pricing, and product availability, but still trading has been able to cope with these challenges in a timely manner.
ExportsThe company is exporting some of its products, where it has significant regional competitive advantage.
Domestic Chemical MarketThe chemical sec-tor in Pakistan is made up of large multination-als, large to me-dium sized local companies and small companies, mostly in the unorganized sec-tor. The market is highly fragmented with competition for specific products, instead of business lines. The companies are working in niche products, and the competitive advantage is only maintained by invest-ing resources and energy in innovation, and continu-ous improvement of a product line. Due to the general macroeconomic conditions in the country, coupled with the energy shortages, the chemical sector has suf-fered a slowdown, which affected demand throughout 2013. Marketing
The Sales and Mar-keting Department is well-organized, managed by com-petent and experi-enced employees, committed towards the success and growth of the Com-pany. The year
brought new challenges for your Company, as the com-petition in the market grew stronger due to the flagging of demand and the significant instability in prices.
AnnuAl RepoRt 201311

Human Resource and Social Responsibility
An engaged workforce and an inclusive work environment are vital to our success and are aligned with our core values of honesty, integrity and respect for people.
At Descon Chemicals Limited, HR is focused at enabling our Human Capital to add value to the Organization. We strive to groom leaders for the future by providing competency based career progression and challenge our people to display exceptional results through performance.
HR’s foremost objective is to foster a performance driven culture, which supports and values employee contribution while providing them opportunities for career growth and development. Human Resource DevelopmentAt Descon Chemicals Limited, HR‘s aim is to partner with the business and provide the Organization with a strategic edge by focusing on the following
• Evolve as an Employer of Choice• Inculcate a performance driven culture• Develop a talent pipeline for future leaders • Induct talent development initiatives aligned with
business goals
Career ProgressionWe believe that business growth is dependent upon the potential and caliber of our employees. It is therefore essential for the Company’s growth and its obligation towards its employees that they are provided full opportunity and resources to grow in the organization to their maximum potential.
We provide our employees with professional training and development programs. We have established career road-maps for high potential incumbents through support and a sustained succession planning program. We encourage creativity and out of the box thinking and provide our employees the opportunity to face new challenges and to take on increased responsibility.
Our top performers are offered career opportunities (within and outside the Company with other Group companies) that help to provide exposure and further develop talent for future leadership roles.
Awards & RecognitionThere are a number of awards and recognition programs offered at Descon Chemicals Limited, based entirely on performance. Among these awards, is the “Des-Icon” Employee of the Quarter award that acknowledges exceptional effort of an employee in an assigned project or in the normal course of work.
Kaizen award acknowledges new ideas that may have value adding impact. Kaizen encourages and engages employees to share their ideas and take ownership of continuous development. Moreover, Long Service Award is also granted based on an employee’s service tenure and productive input.
In order to inculcate the concept of the “Descon Family, HR continually takes initiatives to arrange events and activities to promote employee engagement. Events such as “Team Building Day”, “Family Day”, “Green Day” and various sporting activities are arranged to instill the values of team work, collaboration and recognition of employees’ contribution.
Employee BenefitsWe believe in providing equal opportunity & see ourselves as an institution where employees are treated as one family, given opportunity to learn, challenged and rewarded for optimum performance.
We recognize and reward individual achievement through competitive remuneration and benefits package. We offer competitive levels of annual leave entitlements and maternity leave. We also accommodate career breaks if possible and our employees are encouraged to participate in social responsibility projects.
We intend to continuously build better reward structure for our employees. Long service award, Hajj & Umrah Award, Des-Icon and Variable Pay Policies are some of the few examples.
DESCON CHEMICALS LIMITED 12

Retirement Benefit PlansOur policies such as Provident Fund & Gratuity Fund cover for employee retirement benefit plan. The value of investments of Provident fund as at June 30, 2013 is as follows: (PKR) (PKR)
2013 2012 (Un-audited) (Audited)
Provident Fund 38,928,725 14,884,475Gratuity Fund 8,011,562 4,998,228
Code of Ethics for EmployeesThe Company works hard every day to earn a reputation of trust, honesty and candor, while being mindful of its responsibilities to shareholders, customers, partners and each other. The Code describes what acting with integrity means at the Company and how it relates to core beliefs and leadership. The Code and each employee’s commitment to it, is an essential component of the plan for catapulting the company to world-class one and we:
• Are committed to Ethical Behavior:• Embrace the Company Code, Policies, and other
applicable laws.• Report suspected non-compliance.• Value and safeguard relationship with our custom-
ers.• Value and safeguard employee relationships.• Comply with Health, Safety, Security and Environ-
mental Laws.• Value and safeguard our relationships with Suppli-
ers and contractors.• Protect our property and property of others.• Use our electronic communications and internet
accesses for Company purposes.• Protect Company Confidential information• Gather Processes information ethically and lawfully• Avoid conflicts of interest.• Award contracts fairly and without prejudice.• Do not speak on behalf of the Company without
specific approval.• Protect the Company’s documents and proprietary
information
Safety and HealthCompany’s dedication to meeting the principles of safety and environment is a key component in our
commitment to sustainable development and are committed to:
• Develop and supply products and services that best meet the needs of our customers, are safe, and have minimal impacts on health and the environment throughout their life cycle.
• Run our plants and transport our products safely, protecting our neighbors and employees, and minimizing the impact of our activities on our environment.
• Inform and debate with all stakeholders on matters affecting health, safety and the environment, in a spirit of openness and mutual respect.
• Encouraging our subcontractors, suppliers and customers to adopt a policy on health, safety and environment equivalent to our own.
• Comply with all relevant local, national and international regulations relating to health, safety and environment
EnvironmentThe Company manages its impact on environment by minimizing harmful effects of its emissions, both gaseous and liquid. Strict monitoring of plant effluents is done on continuous basis to control their disposal within National Environmental Quality Standards [NEQS] limits. The Company continues to introduce most modern and environmental friendly technologies in its manufacturing processes.
AnnuAl RepoRt 201313

Corporate Governance
Your Company is pleased to inform you that its Directors and management are fully conversant with the responsibilities as formulated in Code of Corporate Governance 2012, issued by SECP and incorporated in the Listing Regulations of the Stock Exchanges. The Company ensures best practices of Corporate Governance by adopting a set of processes, customs and policies, to help us direct and control management activities with good business sense, objectivity, accountability and integrity. We have made corporate governance a system of structuring, operating and controlling the Company with a view to achieve long term strategic goals to satisfy shareholders, creditors, employees, customers and suppliers.
The prescribed practices are effectively under implementation in the Company and there has been no material departure from the best practices of Corporate Governance as detailed in the listing regulations.
Best Corporate PracticesThe Company surpasses the minimum legal requirements for good corporate governance imposed by applicable laws and regulations. Company encourages adherence to best corporate practices. During the year, all periodic financial statements of the Company were circulated well in time to the Directors duly endorsed by the Chief Executive and the Chief Financial Officer prior to circulation. The Quarterly financial statements of the Company were approved, published and circulated to shareholders within one month of the closing date, while Half Yearly financial statements of the Company were reviewed by the external auditors, approved by the Board, published and circulated to shareholders within the permitted time period of two months after closing. Other non-financial information to be circulated to governing bodies and other stakeholders were also delivered in an accurate and timely manner. The annual financial statements have also been audited by the external auditors and approved by the Board and will be presented to the shareholders in the forthcoming Annual General Meeting for their approval.
Composition of the Board of DirectorsKeeping in mind the Legal and Regulatory framework defining the factors regarding qualification and composition of the Board of Directors, the Company has on its Board highly capable and dedicated personnel with vast experience, knowledge, integrity, and strong sense of responsibility for safe guarding of shareholders’ interest. The Board consists of 8 Directors including the Chief Executive Officer, effectively representing the interest of shareholders. There are six (6) non-executive Directors and two Executive Directors, including the CEO.
Meetings of the BoardThe Board is legally required to meet at least once every quarter to monitor the Company’s performance aimed at effective and timely accountability of its management. The Board held 5 such meetings during the year, agendas of which were circulated in a timely
DESCON CHEMICALS LIMITED 14

manner. The decisions made by the Board during the meetings were minuted, and were duly circulated to all the Directors for endorsement and were approved in the following Board meetings. All meetings of the Board had minimum quorum for attendance prescribed by the Code of Corporate Governance and were also attended by the Chairman and the Company Secretary. Details of attendance by Directors at each Board meeting are as follows:
Meetings Name of Director Attended Remarks
Abdul Razak Dawood 5 –
Salman Zakaria 2 Leave for absence was granted in three meetings
Taimur Dawood 5 –
Farooq Nazir 3 Leave for absence was granted in two meetings
Muhammad Sadiq 4 Leave for absence was granted in one meeting
Syed Zamanat Abbas 2 Leave for absence was granted in three meetings
Faisal Dawood 0 Leave for absence was granted in five meetings
Taimur Saeed 5 –
Training of the BoardAs per requirements of the listing regulations, each member of the Board shall be subject to orientation and training for enhancing their directors’ skills. The Board has arranged Corporate Governance Leadership Skills (CGLS) training program from Pakistan Institute of Corporate Governance for its directors. Four directors have obtained certification of CGLS.
Changes to the BoardThere were no changes to the Board during the year.
Directors’ StatementThe Directors are pleased to make statements as required by the Code of Corporate Governance as given below:
i. Presentation of Financial Statements The financial statements, prepared by the
management of the Company, fairly present its state of affairs, the results of its operations, cash flows and changes in equity.
ii. Books of Accounts The Company has maintained proper books of
accounts.
iii. Accounting Policies Appropriate accounting policies have been
consistently applied in preparation of financial statements and accounting estimates are based on reasonable and prudent judgment.
iv. International Financial Reporting Standards (IFRS) International Financial Reporting Standards, as
applicable in Pakistan, have been followed in preparation of financial statements.
v. Accounting Year The accounting year of the Company is from 1st
July to 30th June.
vi. Safety and Environments The Company strictly complies with the standards
of the safety rules and regulations. It also follows environmental friendly policies.
vii. Going Concern There is no significant doubt upon the Company’s
ability to continue as a going concern.
viii. Internal Control System The system of internal control is sound in design
and has been effectively implemented and monitored. The review will continue in future for the improvement in controls.
AnnuAl RepoRt 201315

ix. Trading Company’s Shares During the year under review no Director, CEO,
CFO, Company Secretary and their spouses and minor children has sold or purchased any shares of the Company.
x. Outstanding Statutory Dues There are no outstanding statutory dues.
xi. Dividends The Company could not declare any dividend.
xii. Quality Control To ensure implementation of the Management
System, Internal Quality Audits, Surveillance Audits and Management Review meetings are conducted regularly.
xiii. Communication Communication with the shareholders is given high
priority. Annual, Half Yearly and Quarterly Accounts are distributed to them within the time specified in the Companies Ordinance, 1984. Every opportunity is given to the individual shareholders to attend and freely ask questions about the Company’s operations at the Annual General Meeting.
xiv. Board of Directors The details of the meetings are given above.
xv. Auditors In pursuance of the Code of Corporate Governance,
the Audit Committee has recommended the re-appointment of M/s. Horwath Hussain Chaudhury & Co., Chartered Accountants, as Auditors of the Company for the year ending June 30, 2014.
xvi. Audit Committee The Board of Directors in compliance to the Code
of Corporate Governance has established an audit committee comprising majority of non-executive Directors. During the year, four audit committee
meetings were held. The following are the members of the Audit Committee:
Name of Director Designation
Farooq Nazir Chairman Taimur Dawood Member Syed Zamanat Abbas Member Muhammad Sadiq Member
Internal audit function of the Company is outsourced to M/s. KPMG Taseer Hadi and Co., Chartered Accountants. During the year under review, the Audit Committee has performed its functions satisfactorily and in accordance with the Code of Corporate Governance.
AcknowledgementsIn the end, the management would like to take this opportunity to express their appreciation and thank all employees for their commitment, loyalty and hard work in meeting targets for the year. We also acknowledge the support and cooperation received from our esteemed customers, suppliers, bankers and stakeholders towards the development of the Company.
For and on behalf of the Board
Lahore Taimur SaeedSeptember 30, 2013 Chief Executive Officer
DESCON CHEMICALS LIMITED 16

KeY oPeRAtInG AnD FInAnCIAL DAtA 2013 2012 2011 2010 2009 2008 (Rupees in ‘000)
Summary of Profit and LossSales 2,402,440 2,560,856 2,601,734 2,383,950 2,769,953 3,109,803Cost of goods sold (2,186,080) (2,341,702) (2,287,690) (2,072,600) (2,551,882) (2,681,459)Gross profit 216,361 219,155 314,044 311,350 218,071 428,345Operating profit 106,633 118,305 151,084 136,970 38,057 264,946Finance cost (110,466) (125,670) (159,160) (159,606) (186,708) (111,953)Profit / (loss) before tax (43,318) (4,264) 1,222 (53,183) (164,927) 173,650Profit / (loss) after tax (42,101) (61,704) (19,280) (49,409) (134,694) 162,581
Financial PositionShare capital 997,789 997,789 997,789 997,789 315,670 363,408Reserves including un-appropriated profit (654,273) (612,147) (550,718) (531,642) 199,631 37,761Long term borrowings 269,000 287,000 33,500 100,375 128,185 162,495Property, plant and equipment 534,998 548,457 581,143 625,230 708,264 495,664Net current assets 58,058 109,645 (126,420) (64,078) (45,571) 159,386
Investor InformationGross profit margin (%) 9.01% 8.56% 12.07% 13.06% 7.87% 13.77%
Pre-tax margin (%) (1.80%) (0.17%) 0.05% (2.23%) (5.95%) 5.58%
Net profit margin (%) (1.75%) (2.41%) (0.74%) (2.07%) (4.86%) 5.23%
Return on equity (%) (12.26%) (16.00%) (4.31%) (10.60%) (26.14%) 40.53%
Return on capital employed (%) 9.77% 15.95% 27.86% 16.06% 2.89% 32.16%
Current ratio 1.07 1.13 0.89 0.95 0.96 1.13
Quick ratio 0.66 0.72 0.55 0.55 0.60 0.60
Debtors turnover (days) 57 59 62 74 63 71
Inventory turnover (days) 57 53 66 94 55 88
Creditors turnover (days) 35 42 43 54 27 32
Operating cycle (days) 79 70 85 114 92 127
Debt: Equity (ratio) 72% 67% 67% 70% 66% 73%
Interest cover (times) 0.61 0.97 1.01 0.67 0.12 2.55
Earnings / (loss) per share (pre tax) (Rupees) (0.22) (0.02) 0.01 (0.27) (2.61) 2.39
Earnings / (loss) per share (after tax) (Rupees) (0.21) (0.31) (0.10) (0.25) (2.13) 2.2
AnnuAl RepoRt 201317

Horizontal Analysis of the Balance sheet
2013 13 Vs. 12 2012 12 Vs. 11 2011 11 Vs. 10 Rs. ‘000 % Rs. ‘000 % Rs. ‘000 %
EQUITY AND LIABILITIES
EQUITY
Share capital 997,789 – 997,789 – 997,789 –Reserves (654,273) 6.9% (612,147) 11.2% (550,718) 3.6%
343,516 (10.9%) 385,643 (13.7%) 447,071 (4.1%)
Surplus on revaluation of property, plant & equipment 38,416 (0.3%) 38,527 (0.3%) 38,643 (0.3%)
NON-CURRENT LIABILITIES
Long term financing 269,000 (6.3%) 287,000 756.7% 33,500 (66.6%)Deferred tax liability 36,603 (26.5%) 49,807 41.0% 35,312 (13.4%)Retirement benefit obligation – – 252 (98.8%) 21,093 25.8%
305,603 (9.3%) 337,059 274.9% 89,906 (43.1%)
CURRENT LIABILITIES
Trade and other payables 211,310 (22.4%) 272,163 1.7% 267,542 (13.5%)Accrued mark up 22,126 (6.8%) 23,731 (20.8%) 29,961 (17.5%)Short term borrowings 583,175 22.9% 474,351 (41.0%) 803,513 (15.4%)Current portion of long term borrowings 18,000 (21.7%) 23,000 (66.4%) 68,375 133.3%Provision for taxation 11,988 (53.0%) 25,514 (1.8%) 25,989 118.7%
846,599 3.4% 818,759 (31.5%) 1,195,380 (10.5%)
1,534,135 (2.9%) 1,579,988 (10.8%) 1,770,999 (11.4%)
ASSETS
NON-CURRENT ASSETS
Property, plant and equipment 534,998 (2.5%) 548,457 (5.6%) 581,143 (7.1%)Intangible assets 27,724 (14.3%) 32,345 (12.5%) 36,966 (11.1%)Long term investments 64,489 (7.9%) 70,034 (15.8%) 83,173 42.9%Long term deposits and advances 1,712 129.1% 747 (1.3%) 757 (60.4%)Retirement benefit asset – prepayments 554 – – – – –
629,478 (3.4%) 651,583 (7.2%) 702,040 (3.4%)
CURRENT ASSETS
Stores, spares and loose tools 10,205 (1.3%) 10,337 (30.4%) 14,849 36.0%Stock in trade 343,559 1.7% 337,753 (18.9%) 416,375 (21.7%)Trade debts 374,229 (10.3%) 417,265 (5.0%) 439,262 (9.6%)Loans and advances 158,385 42.1% 111,434 (14.6%) 130,434 (20.7%)Short term prepayments and other receivables 6,841 (74.1%) 26,402 26.2% 20,913 (44.1%)Cash and bank balances 11,438 (54.6%) 25,213 (46.5%) 47,128 14.4%
904,657 (2.6%) 928,404 (13.1%) 1,068,960 (16.0%)
1,534,135 (2.9%) 1,579,988 (10.8%) 1,770,999 (11.4%)
DESCON CHEMICALS LIMITED 18

Vertical Analysis of the Balance sheet
2013 2012 2011 Rs. ‘000 % Rs. ‘000 % Rs. ‘000 %
EQUITY AND LIABILITIES
EQUITY
Share capital 997,789 65.0% 997,789 63.2% 997,789 56.3%Reserves (654,273) (42.6%) (612,147) (38.7%) (550,718) (31.1%)
343,516 29.8% 385,643 33.4% 447,071 34.8%
Surplus on revaluation of property, plant & equipment 38,416 2.5% 38,527 2.4% 38,643 2.2%
NON-CURRENT LIABILITIES
Long term financing 269,000 17.5% 287,000 18.2% 33,500 1.9%Deferred liability 36,603 2.4% 49,807 3.2% 35,312 2.0%Retirement benefit obligation – – 252 – 21,093 1.2%
305,603 19.9% 337,059 21.3% 89,906 5.1%
CURRENT LIABILITIES
Trade and other payables 211,310 13.8% 272,163 17.2% 267,542 15.1%Accrued mark up 22,126 1.4% 23,731 1.5% 29,961 1.7%Short term borrowings 583,175 38.0% 474,351 30.0% 803,513 45.4%Current portion of long term borrowings 18,000 1.2% 23,000 1.5% 68,375 3.9%Provision for taxation 11,988 0.8% 25,514 1.6% 25,989 1.5%
846,599 55.2% 818,759 51.8% 1,195,380 67.5%
1,534,135 100.0% 1,579,988 100.0% 1,770,999 100.0%
ASSETS
NON-CURRENT ASSETS
Property, plant and equipment 534,998 34.9% 548,457 34.7% 581,143 32.8%Intangible assets 27,724 1.8% 32,345 2.0% 36,966 2.1%Long term investments 64,489 4.2% 70,034 4.4% 83,173 4.7%Long term deposits and advances 1,712 0.1% 747 – 757 –Retirement benefit asset – prepayments 554 – – – – –
629,478 41.0% 651,583 41.2% 702,040 39.6%
CURRENT ASSETS
Stores, spares and loose tools 10,205 0.7% 10,337 0.7% 14,849 0.8%Stock in trade 343,559 22.4% 337,753 21.4% 416,375 23.5%Trade debts 374,229 24.4% 417,265 26.4% 439,262 24.8%Loans and advances 158,385 10.3% 111,434 7.1% 130,434 7.4%Short term prepayments and other receivables 6,841 0.4% 26,402 1.7% 20,913 1.2%Cash and bank balances 11,438 0.7% 25,213 1.6% 47,128 2.7%
904,657 59.0% 928,404 58.8% 1,068,960 60.4%
1,534,135 100.0% 1,579,988 100.0% 1,770,999 100.0%
AnnuAl RepoRt 201319

2013 13 Vs. 12 2012 12 Vs. 11 2011 11 Vs. 10 Rs. ‘000 % Rs. ‘000 % Rs. ‘000 %
HORIZONTAL ANALYSIS
Sales 2,402,440 (6%) 2,560,856 (2%) 2,601,734 9%Cost of sales (2,186,080) (7%) (2,341,702) 2% (2,287,690) 10%
Gross profit 216,361 (1%) 219,155 (30%) 314,044 1%
Administration and general expenses (44,596) 10% (40,408) (48%) (77,940) (23%)Distribution cost (57,742) (2%) (58,892) (29%) (83,020) 13%Research and development expenses (7,390) 377% (1,550) (23%) (2,000) –
Operating profit 106,633 (10%) 118,305 (22%) 151,084 10%
Other operating charges (41,431) 519% (6,691) (81%) (35,599) 122%Finance cost (110,466) (12%) (125,670) (21%) (159,160) –Other operating income 7,357 (68%) 23,090 (15%) 27,124 93%Share of net (loss) / profit of associate (5,409) (59%) (13,299) (175%) 17,773 (162%)
Loss before taxation (43,318) 916% (4,264) (449%) 1,222 (102%)Taxation 1,216 (102%) (57,439) 180% (20,502) (643%)
Net profit after taxation (42,101) (32%) (61,704) 220% (19,280) (61%)
VERTICAL ANALYSIS
Sales 2,402,440 100% 2,560,856 100% 2,601,734 100%Cost of sales (2,186,080) (91%) (2,341,702) (91%) (2,287,690) (88%)
Gross profit 216,361 9% 219,155 9% 314,044 12%
Administration and general expenses (44,596) (1.9%) (40,408) (1.6%) (77,940) (3.0%)Distribution cost (57,742) (2.4%) (58,892) (2.3%) (83,020) (3.2%)Research and development expenses (7,390) (0.3%) (1,550) (0.1%) (2,000) (0.1%)
Operating profit 106,633 4.4% 118,305 4.6% 151,084 5.8%
Other operating charges (41,431) (1.7%) (6,691) (0.3%) (35,599) (1.4%)Finance cost (110,466) (4.6%) (125,670) (4.9%) (159,160) (6.1%)Other operating income 7,357 0.3% 23,090 0.9% 27,124 1.0%Share of net (loss) / profit of associate (5,409) (0.2%) (13,299) (0.5%) 17,773 0.7%
Net profit before taxation (43,318) (1.8%) (4,264) (0.2%) 1,222 0.0%Taxation 1,216 0.1% (57,439) (2.2%) (20,502) (0.8%)
Net profit after taxation (42,101) (1.8%) (61,704) (2.4%) (19,280) (0.7%)
Horizontal AnD VeRtICAL AnALYsIs of the
profit and loss account
DESCON CHEMICALS LIMITED 20

18%
62%
20% 13%
67%
20%
2013 % 2012 % (Rupees in ‘000) (Rupees in ‘000)
Wealth Generated / Value Added: Turnover (including sales tax) 2,731,314 2,924,362 Less: Purchased materials & services (2,201,004) (2,325,456) Value added 530,310 598,906 Other income 7,357 23,090
Net wealth generated 537,667 621,996
Depreciation, amortization and loss retained by the Company 10,662 (7,892)
548,329 100% 614,104 100%
Wealth Distribution: To Government: Income tax, sales tax, excise & custom duty, WWF & WPPF 340,862 62% 407,151 66% To Lenders: Interest on borrowed funds 110,466 20% 125,670 20% To Employees: Salaries, wages and other benefits 96,999 18% 81,283 13%
548,329 100% 614,104 100%
statement of Wealth Creation & its Distribution
Wealth Distribution 2013 Wealth Distribution 2012
To GovernmentTo LendersTo Employees
AnnuAl RepoRt 201321

This statement is being presented to comply with the Code of Corporate Governance (the “Code”)
contained in Regulation No. 35 of listing regulations of Stock Exchanges in Pakistan for the purpose of establishing a framework of good governance, whereby a listed company is managed in compliance with the best practices of corporate governance.
The Company has applied the principles contained in the Code in the following manner:
1. The Company encourages the representation of independent non-executive directors and directors representing minority interests on its Board of Directors. At present the board includes:
Category Names
Independent Director * –
Non-Executive Directors Mr. Abdul Razak Dawood Mr. Salman Zakaria Syed Zamanat Abbas Mr. Farooq Nazir Mr. Taimur Dawood Mr. Faisal Dawood
Executive Directors Muhammad Sadiq Mr. Taimur Saeed
* Currently, the Board does not have any independent Director. The company will adhere with this clause at the time of next election of directors due on December 30, 2013. Moreover, there is no representation of minority shareholders on the Board.
2. The directors have confirmed that none of them is serving as a director on more than seven listed companies, including this Company (excluding the listed subsidiaries of listed holding company where applicable).
3. All the resident directors of the Company are registered as taxpayers and none of them has defaulted in payment of any loan to a banking company, a DFI or an NBFI, or being a member of a stock exchange, has been declared as defaulter by that stock exchange.
4. No casual vacancy occurred on the Board during the year under review.
5. The Company has prepared a “Code of Conduct”, which has been approved by the Board of Directors and signed by the senior executives and employees of the Company, and has ensured that appropriate steps have been taken to disseminate it throughout the Company along with its supporting policies and procedures.
6. The Board has developed a vision/mission statement, overall corporate strategy and significant policies of the Company. A complete record of particulars of significant policies along with the dates on which they were approved or amended has been maintained.
7. All the powers of the Board have been duly exercised and decisions on material transactions, including appointment and determination of remuneration and terms and conditions of employment of the Chief Executive Officer and other executive directors have been taken by the board of directors/shareholders.
8. The meetings of the Board were presided over by the Chairman and, in his absence, by a director elected by the Board for this purpose, the Board met at least once in every quarter or when deemed necessary. Written notices of the Board meetings, along with agenda and working papers were circulated at least seven days before the meetings. The minutes of the meetings were appropriately recorded and circulated. The Chief Financial Officer and the Company Secretary also attended the meetings of the Board.
9. The Board has arranged Corporate Governance Leadership Skills (CGLS) training program from Pakistan Institute of Corporate Governance for its directors. The majority of directors has obtained certification of CGLS and has familiarized themselves on their responsibilities with the Code.
10. The Board has approved appointment of Chief Financial Officer and Head of Internal Audit including their remuneration and terms and conditions of employment.
stAteMent oF CoMPLIAnCe WItH tHe CoDe oF CoRPoRAte GoVeRnAnCe
DESCON CHEMICALS LIMITED 22

11. The Director’s Report for this year has been prepared in compliance with the requirements of the Code and fully describes the salient matters required to be disclosed.
12. The Chief Executive Officer and Chief Financial Officer have duly endorsed the financial statements of the Company before its approval from the Board.
13. The Directors, Chief Executive Officer and executives do not hold any interest in the shares of the Company other than that disclosed in the Pattern of Shareholding.
14. The Company has complied with the applicable corporate and financial reporting requirements of the Code.
15. The Board has formed an Audit Committee. It comprises of four members, of whom three are non-executive directors, including the Chairman of the Committee.
16. The meetings of the Audit Committee were held at least once every quarter prior to approval of interim and final results of the Company and as required by the Code. The terms of reference of the Audit Committee have been formulated and communicated to the Committee for compliance.
17. The Board has formed an HR and Remuneration Committee. It comprises of three members, of whom two are non-executive directors and the Chairman of the Committee is a non-executive director.
18. The Board has outsourced the internal audit
function to M/s. KPMG Taseer Hadi and Co., Chartered Accountants, who are considered suitably qualified and experienced for the purpose and are conversant with the policies and procedures of the Company.
19. The statutory auditors of the Company have confirmed that they have been given a satisfactory
rating under the quality control review program of the Institute of Chartered Accountants of Pakistan (ICAP), that they or any of the partners of the firm, their spouses and minor children do not hold shares of the company and that the firm and all its partners are in compliance with International Federation of Accountants (IFAC) guidelines on code of ethics as adopted by Institute of Chartered Accountants of Pakistan (ICAP).
20. The statutory auditors or the persons associated with them have not been appointed to provide other services except in accordance with the listing regulations and the auditors have confirmed that they have observed IFAC guidelines in this regard.
21. The ‘closed period’ prior to the announcement of interim/final results and business decisions which may materially affect the market price of Company’s securities, was determined and intimated to directors, employees and stock exchange(s).
22. Material/price sensitive information has been disseminated among all market participants at once through stock exchange(s).
23. We confirm that all other material principles enshrined in the Code have been complied with.
For and on behalf of the Board
Lahore Taimur SaeedSeptember 30, 2013 Chief Executive Officer
AnnuAl RepoRt 201323
We have reviewed the Statement of Compliance with the best practices contained in the Code of Corporate Governance prepared by the Board of Directors of Descon Chemicals Limited to comply with the Listing Regulation No. 35 (Chapter XI) of both the Karachi Stock Exchange and Lahore Stock Exchange, where the Company is listed.
The responsibility for compliance with the Code of Corporate Governance is that of the Board of Directors of the Company. Our responsibility is to review, to the extent where such compliance can be objectively verified, whether the Statement of Compliance reflects the status of the Company’s compliance with the provisions of the Code of Corporate Governance and report if it does not. A review is limited primarily to inquiries of the Company personnel and review of various documents prepared by the Company to comply with the Code.
As part of our audit of financial statements we are required to obtain an understanding of the accounting and internal controls systems sufficient to plan the audit and develop an effective audit approach. We have not carried out any special review of the internal control system to enable us to express an opinion as to whether the Board’s statement on internal control covers all controls and the effectiveness of such internal controls.
Further, Sub-Regulation (x) of Listing Regulation 35 of Karachi and Lahore Stock Exchanges requires the Company to place before the Board of Directors for their consideration and approval related party transactions distinguishing between transactions carried out on terms equivalent to those that prevail in arm’s length transactions and transactions which are not executed at arm’s length price, recording proper justification for using such alternate pricing mechanism. Further, all such transactions are also required to be separately placed before the audit committee. We are only required and have ensured compliance of requirement to the extent of approval of related party transactions by the Board of Directors and placement of such transactions before the audit committee. We have not carried out any procedures to determine whether the related party transactions were undertaken at arm’s length price or not.
Based on our review, nothing has come to our attention which causes us to believe that the Statement of Compliance does not appropriately reflect the Company’s compliance, in all material respects, with the best practices contained in the Code of Corporate Governance as applicable to the Company for the year ended June 30, 2013.
Lahore Horwath Hussain Chaudhury & Co.September 30, 2013 Chartered Accountants
(Engagement Partner: Muhammad Nasir Muneer)
ReVIeW RePoRt to tHe MeMBeRs on stAteMent oF CoMPLIAnCe WItH Best PRACtICes oF CoDe oF CoRPoRAte GoVeRnAnCe

We have audited the annexed balance sheet of Descon Chemicals Limited as at June 30, 2013 and the related profit and loss account, statement of comprehensive income, cash flow statement and statement of changes in equity together with the notes forming part thereof, for the year then ended and we state that we have obtained all the information and explanations which, to the best of our knowledge and belief, were necessary for the purposes of our audit.
It is the responsibility of the Company’s management to establish and maintain a system of internal control, and prepare and present the above said statements in conformity with the approved accounting standards and the requirements of the Companies Ordinance, 1984. Our responsibility is to express an opinion on these statements based on our audit.
We conducted our audit in accordance with the auditing standards as applicable in Pakistan. These standards require that we plan and perform the audit to obtain reasonable assurance about whether the above said statements are free of any material misstatement. An audit includes examining, on a test basis, evidence supporting the amounts and disclosures in the above said statements. An audit also includes assessing the accounting policies and significant estimates made by management, as well as, evaluating the overall presentation of the above said statements. We believe that our audit provides a reasonable basis for our opinion and, after due verification, we report that:
(a) in our opinion, proper books of account have been kept by the Company as required by the Companies Ordinance, 1984;
(b) in our opinion:
(i) the balance sheet and profit and loss account together with the notes thereon have been drawn up in conformity with the Companies Ordinance, 1984, and are in agreement with the books of account and are further in accordance with the accounting policies consistently applied;
(ii) the expenditure incurred during the year was for the purpose of the Company’s business; and
(iii) the business conducted, investments made and the expenditure incurred during the year were in accordance with the objects of the Company;
(c) in our opinion and to the best of our information and according to the explanations given to us, the balance sheet, profit and loss account, statement of comprehensive income, cash flow statement and statement of changes in equity together with the notes forming part thereof conform with approved accounting standards as applicable in Pakistan, and, give the information required by the Companies Ordinance, 1984, in the manner so required and respectively give a true and fair view of the state of the Company’s affairs as at June 30, 2013 and of the loss, total comprehensive loss, its cash flows and changes in equity for year then ended; and
(d) in our opinion, no Zakat was deductible at source under the Zakat and Ushr Ordinance, 1980 (XVIII of 1980).
Lahore Horwath Hussain Chaudhury & Co.September 30, 2013 Chartered Accountants
(Engagement Partner: Muhammad Nasir Muneer)
AUDITORS’ REPORT TO THE MEMBERS

BAlance sheetas at june 30, 2013
2013 2012 Note Rupees Rupees
ASSETS
Non Current Assets
Property, plant and equipment 4 534,998,469 548,457,070Intangible assets 5 27,724,463 32,345,206Long term investments 6 64,488,804 70,033,769Long term deposits and loans 7 1,712,063 747,263Retirement benefit asset - prepayments 17 554,276 –
629,478,075 651,583,308
Current Assets
Stores and spares 10,204,768 10,337,304Stock in trade 8 343,559,463 337,753,292Trade debts 9 374,229,068 417,264,757Loans and advances 10 158,384,547 111,433,998Short term prepayments and other receivables 11 6,841,180 26,402,247Bank balances 12 11,437,764 25,212,894
904,656,790 928,404,492
Total Assets 1,534,134,865 1,579,987,800
The annexed notes form an integral part of these financial statements.
CHIEF EXECUTIVE DIRECTOR
DESCON CHEMICALS LIMITED 26
2013 2012 Note Rupees Rupees
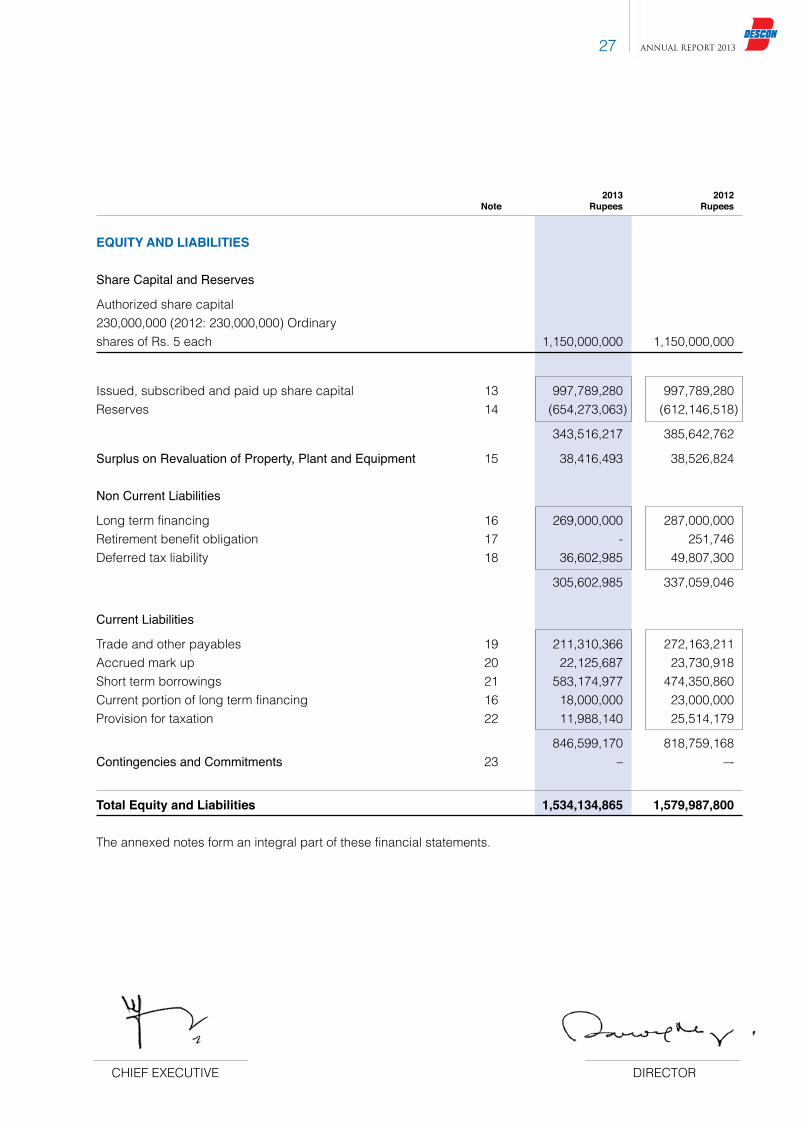
EQUITY AND LIABILITIES
Share Capital and Reserves
Authorized share capital230,000,000 (2012: 230,000,000) Ordinaryshares of Rs. 5 each 1,150,000,000 1,150,000,000
Issued, subscribed and paid up share capital 13 997,789,280 997,789,280Reserves 14 (654,273,063) (612,146,518)
343,516,217 385,642,762
Surplus on Revaluation of Property, Plant and Equipment 15 38,416,493 38,526,824
Non Current Liabilities
Long term financing 16 269,000,000 287,000,000Retirement benefit obligation 17 - 251,746Deferred tax liability 18 36,602,985 49,807,300
305,602,985 337,059,046
Current Liabilities
Trade and other payables 19 211,310,366 272,163,211Accrued mark up 20 22,125,687 23,730,918Short term borrowings 21 583,174,977 474,350,860Current portion of long term financing 16 18,000,000 23,000,000Provision for taxation 22 11,988,140 25,514,179
846,599,170 818,759,168Contingencies and Commitments 23 – –-
Total Equity and Liabilities 1,534,134,865 1,579,987,800
The annexed notes form an integral part of these financial statements.
CHIEF EXECUTIVE DIRECTOR
AnnuAl RepoRt 201327

PROFIT AND LOSS ACCOUNTFOR THE YEAR ENDED JUNE 30, 2013
2013 2012 Note Rupees Rupees
Sales 24 2,402,440,493 2,560,856,250 Cost of sales 25 (2,186,079,779) (2,341,701,743)
Gross Profit 216,360,714 219,154,507
Distribution cost 26 (57,742,114) (58,891,540)Administrative expenses 27 (44,595,913) (40,408,116)Research and development expenses 28 (7,389,570) (1,549,662)
(109,727,597) (100,849,318)
Operating Profit 106,633,117 118,305,189 Other operating expenses 29 (41,431,467) (6,690,783)Finance cost 30 (110,466,241) (125,669,614)Other income 31 7,356,505 23,089,715 Share of net loss of associate (5,409,466) (13,298,842)
Loss before Taxation (43,317,552) (4,264,335)Taxation 32 1,216,175 (57,439,294)
Net Loss for the Year (42,101,377) (61,703,629)
Loss per Share - Basic and Diluted 33 (0.21) (0.31)
The annexed notes form an integral part of these financial statements.
CHIEF EXECUTIVE DIRECTOR
DESCON CHEMICALS LIMITED 28

STATEMENT OF COMPREHENSIVE INCOMEFOR THE YEAR ENDED JUNE 30, 2013
2013 2012 Rupees Rupees
Net Loss for the Year (42,101,377) (61,703,629)
Other comprehensive income
Unrealized gain on available for sale investment 192,600 36,300
Share of unrealized (loss) / gain on available for sale investment of associate (328,099) 122,918
Transfer from surplus on revaluation of property, plant and equipment in respect of incremental depreciation charged in current year 110,331 116,138
Other comprehensive (loss) / income for the year (25,168) 275,356
Total Comprehensive Loss for the Year (42,126,545) (61,428,273)
The annexed notes form an integral part of these financial statements.
CHIEF EXECUTIVE DIRECTOR
AnnuAl RepoRt 201329

cash flow statementFOR THE YEAR ENDED JUNE 30, 2013
2013 2012 Note Rupees Rupees
CASH GENERATED FROM OPERATIONS 34 92,015,322 281,281,396
Finance cost paid (112,071,472) (131,899,683)Gratuity paid (1,095,317) (21,928,633)Income tax paid (58,283,591) (29,713,250)Long term deposits and loans (964,800) 10,000
(172,415,180) (183,531,566)
Net Cash (used in) / generated from Operating Activities (80,399,858) 97,749,830 CASH FLOWS FROM INVESTING ACTIVITIES
Property, plant and equipment purchased (10,608,163) (3,519,069)Capital work-in-progress (11,116,894) (3,830,634)Proceeds from disposal of property, plant and equipment 1,572,728 6,552,369 Interest income received 952,940 2,170,242
Net Cash (used in) / generated from Investing Activities (19,199,389) 1,372,908 CASH FLOWS FROM FINANCING ACTIVITIES
Long term financing repaid (23,000,000) (66,875,116)Long term financing acquired – 275,000,000 Short term borrowings acquired / (repaid) - net 108,824,117 (329,162,309)
Net Cash generated from / (used in) Financing Activities 85,824,117 (121,037,425)
Net Decrease in Cash and Cash Equivalents (13,775,130) (21,914,687)Cash and cash equivalents at the beginning of the year 25,212,894 47,127,581
Cash and Cash Equivalents at the end of the Year 11,437,764 25,212,894
The annexed notes form an integral part of these financial statements.
CHIEF EXECUTIVE DIRECTOR
DESCON CHEMICALS LIMITED 30
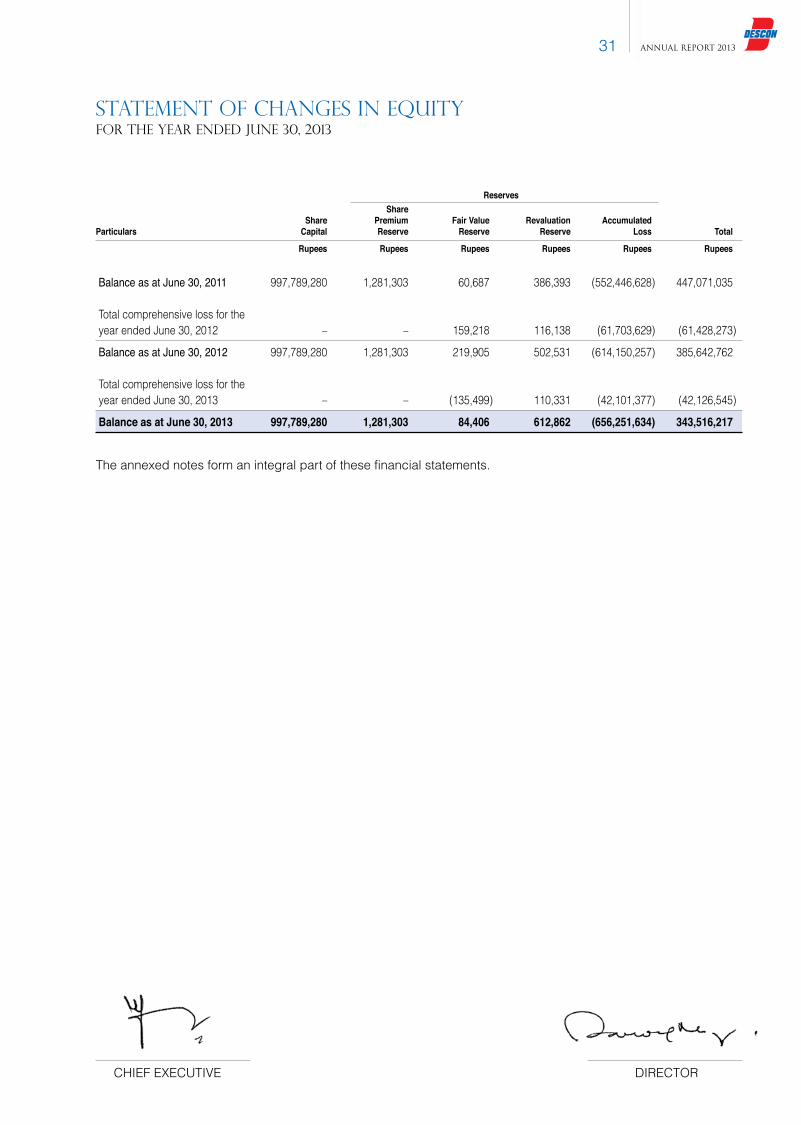
statement of changes in equityFOR THE YEAR ENDED JUNE 30, 2013
Reserves Share Share Premium Fair Value Revaluation AccumulatedParticulars Capital Reserve Reserve Reserve Loss Total
Rupees Rupees Rupees Rupees Rupees Rupees
Balance as at June 30, 2011 997,789,280 1,281,303 60,687 386,393 (552,446,628) 447,071,035
Total comprehensive loss for the year ended June 30, 2012 – – 159,218 116,138 (61,703,629) (61,428,273)
Balance as at June 30, 2012 997,789,280 1,281,303 219,905 502,531 (614,150,257) 385,642,762
Total comprehensive loss for the year ended June 30, 2013 – – (135,499) 110,331 (42,101,377) (42,126,545)
Balance as at June 30, 2013 997,789,280 1,281,303 84,406 612,862 (656,251,634) 343,516,217
The annexed notes form an integral part of these financial statements.
CHIEF EXECUTIVE DIRECTOR
AnnuAl RepoRt 201331

notes to and forming part of the financial statementsFOR THE YEAR ENDED JUNE 30, 2013
1. The Company and its Operations
Descon Chemicals Limited (the Company) was initially incorporated in Pakistan on December 17, 1964 as a private limited company under the Companies Act, 1913 (now the Companies Ordinance, 1984) and was converted into public limited company on August 19, 1991 with the name of Nimir Resins Limited. The name of the Company was changed to Descon Chemicals Limited on April 01, 2010 when the Company entered into a scheme of arrangement for merger / amalgamation with Descon Chemicals (Private) Limited.
Shares of the Company are quoted on Karachi and Lahore Stock Exchanges. The registered office of the Company is situated at Descon Headquarters, 18 KM, Ferozepur Road, Lahore. The principal activity of the Company is to manufacture surface coating resins, polyesters, optical brightener and textile auxiliaries.
2. Basis of Preparation
2.1 Statement of compliance
These financial statements have been prepared in accordance with approved accounting standards as applicable in Pakistan. Approved accounting standards comprise of such International Financial Reporting Standards (IFRS) issued by the International Accounting Standards Board as are notified under the Companies Ordinance, 1984, provisions of and directives issued under the Companies Ordinance, 1984. In case requirements differ, the provisions or directives of the Companies Ordinance, 1984 shall prevail.
2.2 Basis of measurement
These financial statements have been prepared under the historical cost convention except to the extent of following:
Certain property, plant and equipment Note 4 Revalued / Fair value Investment in quoted companies Note 6 Fair value Employee retirement benefits (Gratuity) Note 17 Present value
2.3 Functional and presentation currency
These financial statements are prepared and presented in Pak Rupees which is the Company’s functional and presentation currency. All the figures have been rounded off to the nearest rupee, unless otherwise stated.
2.4 Use of estimates and judgments
The preparation of financial statements in conformity with IFRSs requires management to make judgments, estimates and assumptions that affect the application of policies and reported amounts of assets, liabilities, income and expenses. The estimates and related assumptions are based on historical experience and various other factors that are believed to be reasonable under the circumstances.
These estimates and related assumptions are reviewed on an ongoing basis. Accounting estimates are revised in the period in which such revisions are made. Significant management estimates in these financial statements relate to the useful life and residual values of property, plant and equipment, amortization of intangible assets, provisions for doubtful receivables, provisions for defined benefit plans, slow moving inventory, obsolescence of inventory and taxation. However, the management
DESCON CHEMICALS LIMITED 32

notes to and forming part of the financial statementsFOR THE YEAR ENDED JUNE 30, 2013
believes that the change in outcome of estimates would not have a material effect on the amounts disclosed in these financial statements.
2.5 New and revised standards and interpretations
Since June 30, 2012, International Accounting Board (IASB) has made certain amendments into the existing standards and introduced one new interpretation (IFRIC 20). These amendments seek to enhance the disclosure requirements in the financial statements and do not have any significant effect on the Company’s financial statements other than presentation / disclosures. These amendments are as under:
Revision / improvements / ammendments to IFRS and interpretations
Effective Date
(Period beginning on or after)
- IAS 32: Financial instruments: Presentation - January 1, 2014 Offsetting Financial Assets and Financial Liabilities
- IFRS 1: First-time Adoption of International Financial Reporting Standards - January 1, 2013 Government Loans
- IFRS 7: Financial instruments: Disclosures - January 1, 2013 Offsetting Financial Assets and Financial Liabilities
- IFRS 9: Financial Instruments - Mandatory January 1, 2015 Effective Date and Transition Disclosures
- IFRS 10: Consolidated Financial Statements - January 1, 2013 Transition Guidance
- IFRS 11: Joint Arrangements - January 1, 2013 Transition Guidance
- IFRS 12: Disclosures of Interest in Other Entities - January 1, 2013 Transition Guidance
- Annual Improvements 2009-2011 Cycle January 1, 2013
- IFRIC 20: Stripping Costs in the Production Phase of a Surface Mine January 1, 2013
3. Significant Accounting Policies
The significant accounting policies adopted in the preparation of these financial statements are set out below. These policies have been consistently applied, unless stated otherwise.
3.1 Property, plant and equipment
Owned
Property, plant and equipment are stated at cost / revalued amounts less accumulated depreciation and identified impairment losses, if any, except freehold land which is stated at revalued amount. Cost of property, plant and equipment consists of historical cost, borrowing cost pertaining to the construction and erection period and directly attributable cost of bringing the assets to working condition.
AnnuAl RepoRt 201333

Depreciation is charged to income on reducing balance method except vehicles that are depreciated using straight line method at the rates specified in Note 4. Full month’s depreciation is charged on additions during the month, whereas no depreciation is charged on assets disposed off during the month. Where an impairment loss is recognised, the depreciation charge is adjusted in the future periods to allocate the asset’s revised carrying amount over its estimated useful life.
Maintenance and normal repairs are charged to income as and when incurred. Major renewals and replacements are capitalised. Gains or losses on disposal of property, plant and equipment are included in the current year’s income.
Capital work-in-progress
Capital work-in-progress is stated at cost less any identified impairment loss.
3.2 Intangible asset
An intangible asset is recognised as an asset if it is probable that future economic benefits attributable to the asset will flow to the Company and the cost of such asset can be measured reliably. Cost of intangible assets i.e. ERP software includes purchase cost and directly attributable expenses incidental to bring the software for its intended use.
Costs that are directly associated with identifiable software and have probable economic benefits beyond one year, are recognised as an intangible asset. However, costs associated with the maintenance of software are recognised as an expense.
All intangibles are measured initially at cost and subsequently stated at cost less accumulated amortisation and identified impairment losses, if any. Amortisation is charged to income using the straight line method so as to write off cost of an asset over its estimated useful life. The amortisation period and the amortisation method for an intangible asset are reviewed, at each balance sheet date, and adjusted if impact on the amortisation is significant. ERP software is being amortised over 10 years based on estimated useful life.
3.3 Investment in associate
An enterprise is considered to be the associate of the Company in which the Company has ownership of not less than 20% and not more than 50% of the voting power and / or has significant influence but not control. Investments in associates are accounted for using the equity method. The equity method is applied from the date when significant influence is established until the date when that significant influence ceases.
3.4 Stores and spares
These are valued at lower of moving average cost and net realizable value; whilst items considered obsolete are carried at nil value. Cost of items in transit comprises invoice value plus incidental charges paid thereon.
3.5 Stock in trade
These are valued at lower of cost and net realizable value. Cost is determined as follows:
notes to and forming part of the financial statementsFOR THE YEAR ENDED JUNE 30, 2013
DESCON CHEMICALS LIMITED 34

Raw and packing materials - Moving average cost Materials in transit - Cost and incidental charges Work in process - Estimated manufacturing cost Finished goods - Average manufacturing cost Wastes - At net realizable value
Manufacturing cost in relation to work in process and finished goods comprises cost of material, labour and appropriate manufacturing overheads. Net realizable value signifies the estimated selling price in the ordinary course of business less necessary cost to make the sale.
3.6 Trade debts
Trade debts are recognised at fair value less provision for impairment. A provision for impairment of trade debts and other receivables is established when there is objective evidence that the Company will not be able to collect all amounts due according to the original terms of the receivable. Significant financial difficulties of the debtor, probability that the debtor will enter bankruptcy or financial re-organisation, and default or delinquency in payments are considered indicators that the trade receivable is impaired. Debts, considered irrecoverable, are written off, as and when identified.
3.7 Cash and cash equivalents
Cash and cash equivalents are carried at cost. For the purpose of cash flow statement, cash and cash equivalents comprise cash in hand and cash at banks in current and saving accounts.
3.8 Provisions
A provision is recognised in the balance sheet when the Company has a legal or constructive obligation as a result of a past event and it is probable that an outflow of economic benefits will be required to settle the obligation and a reliable estimate of the amount can be made. Provisions are reviewed at each balance sheet date and adjusted to reflect the current best estimate.
3.9 Staff retirement benefits
Defined benefits plan
The Company operates a funded gratuity scheme for employees whose period of service is seven years or more. Under this scheme, gratuity is paid to retiring employees on the basis of their last drawn basic salary for each completed year of service by applying the following factor:
Service period in the Company Factor
Less then 7 years Nil 7 years or more but less than 10 years 50% 10 years or more but less than 15 years 60% 15 years or more but less than 20 years 72% 20 years or more but less then 25 years 85% 25 years or more (Maximum of 25 Basic Salaries) 100%
A recognised fund for gratuity scheme of employees was established during the year 2012 and related liabilities and assets were transferred to that fund.
notes to and forming part of the financial statementsFOR THE YEAR ENDED JUNE 30, 2013
AnnuAl RepoRt 201335

The policy for the recognition of actuarial gains / losses used in this report is based on the “minimum 10% corridor” approach mentioned under paragraph 92 of IAS-19.
Defined contribution plan
The Company operates an approved provident fund scheme for all its permanent employees. The Company and employees make equal monthly contributions to the fund at the rate of 10% of basic salary.
3.10 Taxation
Income tax on the profit or loss for the year comprises current and deferred tax. Income tax expense is recognised in the profit and loss account except to the extent that relates to items recognised directly in equity, in which case it is recognised in equity.
Current
The charge for current tax is based on taxable income for the year determined in accordance with the prevailing laws of taxation. All tax credits and tax rebates are taken into account in calculating this charge. However, in the case of loss for the year, income tax expense is recognised as minimum tax liability on turnover of the Company in accordance with the provisions of the Income Tax Law.
Deferred
Deferred tax is recognised using the balance sheet liability method on all temporary differences between the carrying amount of the assets and liabilities and their tax bases.
Deferred tax liabilities are recognised for all major taxable temporary differences.
Deferred tax assets are recognised for all major deductible temporary differences to the extent that it is probable that taxable profit will be available against which the deductible temporary differences can be utilised.
The carrying amount of the deferred tax asset is reviewed at each balance sheet date and is recognised only to the extent that it is probable that future taxable profits will be available against which the assets may be utilised. Deferred tax assets are reduced to the extent that it is no longer probable that the related tax benefit will be realised.
Unrecognised deferred tax assets are reassessed at each balance sheet date and are recognised to the extent of probable future taxable profit available that will allow deferred tax asset to be recovered.
Deferred tax assets and liabilities are measured at the tax rate that are expected to apply to the year when the asset is utilised or the liability is settled, based on the tax rates that have been enacted or substantially enacted at the balance sheet date.
3.11 Trade and other payables
Liabilities for trade and other amounts payable are carried at cost which is the fair value of the consideration to be paid or given in future for goods and services received or to be delivered or for any other amount, whether or not billed to the Company.
notes to and forming part of the financial statementsFOR THE YEAR ENDED JUNE 30, 2013
DESCON CHEMICALS LIMITED 36

3.12 Contingent liabilities
Contingent liability is disclosed when there is a possible obligation that arises from past events and whose existence is confirmed only by the occurrence or non-occurrence of one or more uncertain future events not wholly within the control of the Company.
A contingent liability is also disclosed when there is present obligation that arises from past events but it is not probable that an outflow of resources embodying economic benefits would be required to settle the obligation or the amount of the obligation cannot be measured with sufficient reliability.
3.13 Borrowing cost
Borrowing cost is charged to income as and when incurred except costs directly attributable to acquisition, construction or production of qualifying assets that are capitalised as part of the cost of assets.
3.14 Foreign currency transactions
Transactions denominated in foreign currencies are initially recorded at Pak Rupees by applying the foreign exchange rate ruling on the date of transaction. All monetary assets and liabilities in foreign currencies are translated into Pak Rupees at exchange rate prevailing at the balance sheet date except for balances covered under forward exchange contracts, which are converted at the contracted rates. Exchange differences are included in income currently.
3.15 Revenue recognition
- Local sales are recorded on dispatch of goods to customers. - Export sales are recorded on the receipt of bills of lading. - Profit on bank deposits is recognised on a time proportion basis that takes into account the
effective yield on deposits.
3.16 Related party transactions
Transactions in relation to sales, purchases and services with related parties are made at arm’s length prices determined in accordance with the Company’s policy except for the allocation of expenses such as utilities, rental and common overheads relating to the corporate office shared with related parties, which are on actual basis.
3.17 Financial instruments
3.17.1 Financial assets
The classification depends on the purpose for which the financial assets were acquired. The management determines the classification of its financial assets at the time of initial recognition. The Company classifies its financial assets in the following categories:
At fair value through profit or loss
Financial assets at fair value through profit or loss are financial assets held for trading and financial assets designated upon initial recognition as at fair value through profit or loss. A financial asset is
notes to and forming part of the financial statementsFOR THE YEAR ENDED JUNE 30, 2013
AnnuAl RepoRt 201337
classified as held for trading if acquired principally for the purpose of selling in the short term. Assets in this category are classified as current assets.
Loans and receivables
Loans and receivables are non-derivative financial assets with fixed or determinable payments that are not quoted in an active market. These are included in current assets, except for maturities greater than twelve months after the balance sheet date, which are classified as non-current assets. Loans and receivables comprise advances, deposits and other receivables in the balance sheet.
Held to maturity
Held to maturity are financial assets with fixed or determinable payments and fixed maturity, where management has the intention and ability to hold till maturity are carried at amortised cost.
Available-for-sale
Available-for-sale financial assets are non-derivatives that are either designated in this category or not classified in any of the other categories. They are included in non-current assets unless the management intends to dispose off the investments within twelve months from the balance sheet date, in which case these financial assets are classified as short term investments in the balance sheet.
When securities classified as available-for-sale are sold or impaired, the accumulated fair value adjustments recognised directly in equity are included in the profit and loss account as gains and losses from investment securities. Interest on available-for-sale securities calculated using the effective interest method is recognised in the profit and loss account. Dividends on available-for sale equity instruments are recognised in the profit and loss account when the Company’s right to receive payments is established.
Measurement criteria
All financial assets are recognised at the time when the company becomes a party to the contractual provisions of the instrument. Regular purchases and sales of investments are recognised at trade date that is the date on which the Company commits to purchase or sell the asset.
Financial assets are initially recognised at fair value plus transaction costs for all financial assets not carried at fair value through profit or loss. Financial assets carried at fair value through profit or loss are initially recognised at fair value and transaction costs are expensed in the profit and loss account.
Available-for-sale financial assets and financial assets at fair value through profit or loss are subsequently carried at fair value. ‘Loans and receivables’ and ‘held to maturity’ investments are carried at amortised cost using effective interest rate method.
The fair values of quoted investments are based on current prices. If the market for a financial asset is not active (for unlisted securities), the Company measures the investments at cost less impairment in value, if any.
Financial assets are derecognised when the rights to receive cash flows from the assets have expired or have been transferred and the Company has transferred substantially all risks and rewards of ownership.
notes to and forming part of the financial statementsFOR THE YEAR ENDED JUNE 30, 2013
DESCON CHEMICALS LIMITED 38

The Company assesses at each balance sheet date whether there is objective evidence that a financial asset or group of financial assets is impaired.
3.17.2 Financial liabilities
All financial liabilities are recognised at the time when the Company becomes a party to the contractual provisions of the instrument.
Financial liabilities, other than those at fair value through profit or loss, are measured at amortised cost using the effective yield method.
A financial liability is derecognised when the obligation under the liability is discharged or cancelled or expired. Where an existing financial liability is replaced by another from the same lender on substantially different terms, or the terms of an existing liability are substantially modified, such an exchange and modification is treated as a derecognition of the original liability and the recognition of a new liability. The difference in respective carrying amounts is recognised in the profit and loss account.
3.17.3 Off-setting of financial assets and financial liabilities
A financial asset and a financial liability is offset and the net amount is reported in the financial statements if the Company has a legally enforceable right to set-off the transaction and also intends either to settle on a net basis or to realise the asset and settle the liability simultaneously.
3.18 Impairment
Carrying amounts of the Company’s assets are reviewed at each balance sheet date to determine whether there is any indication of impairment. If any such indication exists, the asset’s recoverable amount is estimated in order to determine the extent of the impairment loss, if any. The recoverable amount is the higher of fair value less costs to sell and value in use. In the absence of any information about the fair value, the recoverable amount is determined to be the value in use. Impairment losses are recognised as expense in the profit and loss account.
3.19 Segment reporting
Operating segments are reported in a manner consistent with the internal reporting provided to the Chief Operating Decision Maker (the Chief Executive Officer of the Company). Segment results, assets and liabilities include items directly attributable to a segment. Segment capital expenditure is the total cost incurred during the year to acquire property, plant and equipment and intangible assets.
3.20 Dividend
Dividends are recognised as a liability in the period in which these are declared.
4. Property, Plant and Equipment
2013 2012
Note Rupees Rupees
Operating fixed assets 4.1 525,048,758 547,125,460Capital work in progress 4.5 9,949,711 1,331,610
534,998,469 548,457,070
notes to and forming part of the financial statementsFOR THE YEAR ENDED JUNE 30, 2013
AnnuAl RepoRt 201339

notes to and forming part of the financial statementsFOR THE YEAR ENDED JUNE 30, 2013
4.1
Ope
ratin
g fix
ed a
sset
s
Year
End
ed J
une
30, 2
013
O
ffice
B
uild
ings
equi
pmen
t,
Fr
eeho
ld
on fr
eeho
ld
Plan
t and
fu
rnitu
re a
nd
La
bora
tory
D
escr
iptio
n la
nd
land
m
achi
nery
fix
ture
s IT
equ
ipm
ent
equi
pmen
t Ve
hicl
es
Tota
l
Rup
ees
R
upee
s
Rup
ees
R
upee
s
Rup
ees
R
upee
s
Rup
ees
R
upee
s
O
wne
d as
sets
C
ost
Ba
lanc
e as
at J
uly
01, 2
012
178
,365
,000
1
64,6
05,9
55
520
,766
,943
2
0,14
3,51
6
29,
249,
578
6
,921
,470
1
2,12
0,46
9
932
,172
,931
Ad
ditio
ns
-
-
3,2
73,7
93
581
,318
5
,968
,004
-
3
,283
,841
1
3,10
6,95
6
Dis
posa
ls
-
-
(373
,199
) (1
78,5
08)
(818
,595
) -
(2
,079
,372
) (3
,449
,674
)
Ba
lanc
e as
at J
une
30, 2
013
178
,365
,000
1
64,6
05,9
55
523
,667
,537
2
0,54
6,32
6
34,
398,
987
6
,921
,470
1
3,32
4,93
8
941
,830
,213
A
ccum
ulat
ed d
epre
ciat
ion
Ba
lanc
e as
at J
uly
01, 2
012
-
38,
662,
249
3
02,3
00,8
40
10,
359,
863
1
9,68
7,13
4
5,1
31,4
02
8,9
05,9
83
385
,047
,471
C
harg
e fo
r the
yea
r -
6
,297
,185
2
2,01
8,72
1
1,0
11,6
56
2,9
96,9
27
268
,511
2
,021
,065
3
4,61
4,06
5
Dis
posa
ls
-
-
(218
,322
) (1
05,4
20)
(575
,550
) -
(1
,980
,789
) (2
,880
,081
)
Ba
lanc
e as
at J
une
30, 2
013
-
44,
959,
434
3
24,1
01,2
39
11,
266,
099
2
2,10
8,51
1
5,3
99,9
13
8,9
46,2
59
416
,781
,455
To
tal a
s at
Jun
e 30
, 201
3 1
78,3
65,0
00
119
,646
,521
1
99,5
66,2
98
9,2
80,2
27
12,
290,
476
1
,521
,557
4
,378
,679
5
25,0
48,7
58
Year
End
ed J
une
30, 2
012
O
wne
d as
sets
C
ost
Ba
lanc
e as
at J
uly
01, 2
011
178
,365
,000
1
64,6
05,9
55
523
,374
,719
1
9,54
9,80
0
27,
252,
370
6
,491
,607
1
5,90
5,36
9
935
,544
,820
Ad
ditio
ns
-
-
2,1
33,8
12
661
,216
2
,166
,508
4
29,8
63
790
,000
6
,181
,399
D
ispo
sals
-
-
(4
,741
,588
) (6
7,50
0)
(169
,300
) -
(4
,574
,900
) (9
,553
,288
)
Ba
lanc
e as
at J
une
30, 2
012
178
,365
,000
1
64,6
05,9
55
520
,766
,943
2
0,14
3,51
6
29,
249,
578
6
,921
,470
1
2,12
0,46
9
932
,172
,931
A
ccum
ulat
ed d
epre
ciat
ion
Ba
lanc
e as
at J
uly
01, 2
011
-
32,
033,
633
2
80,1
83,5
62
9,6
10,1
65
16,
886,
847
4
,828
,113
1
1,02
2,77
4
354
,565
,094
C
harg
e fo
r the
yea
r -
6
,628
,616
2
4,13
3,82
3
786
,180
2
,931
,613
3
03,2
89
2,3
97,7
51
37,
181,
272
D
ispo
sals
-
-
(2
,016
,545
) (3
6,48
2)
(131
,326
) -
(4
,514
,542
) (6
,698
,895
)
Ba
lanc
e as
at J
une
30, 2
012
-
38,
662,
249
3
02,3
00,8
40
10,
359,
863
1
9,68
7,13
4
5,1
31,4
02
8,9
05,9
83
385
,047
,471
To
tal a
s at
Jun
e 30
, 201
2 1
78,3
65,0
00
125
,943
,706
2
18,4
66,1
03
9,7
83,6
53
9,5
62,4
44
1,7
90,0
68
3,2
14,4
86
547
,125
,460
D
epre
ciat
ion
rate
s -
5%
10
%
10%
25
%
15%
20
% to
25
DESCON CHEMICALS LIMITED 40

2
01
3
20
12
Not
e R
upee
s
Rup
ees
4.2
App
ortio
nmen
t of d
epre
ciat
ion
char
ge fo
r the
yea
r
Dep
reci
atio
n ch
arge
for t
he y
ear h
as b
een
appo
rtion
ed a
s fo
llow
s:
Cos
t of s
ales
2
5
25,
960,
549
2
8,11
0,85
1Ad
min
istra
tive
expe
nses
2
7
8,6
53,5
16
9,0
70,4
21
34,6
14,0
65
37,
181,
272
4.3
Dis
posa
l of p
rope
rty,
pla
nt a
nd e
quip
men
t
D
etai
l of p
rope
rty, p
lant
and
equ
ipm
ent d
ispo
sed
off d
urin
g th
e ye
ar is
as
follo
ws:
A
ccum
ulat
ed
Writ
ten
dow
n
Sale
G
ain
/ (Lo
ss)
Pa
rtic
ular
s
Cos
t de
prec
iatio
n
valu
e pr
ocee
ds
on d
ispo
sal
Buy
er N
ame
Mod
e of
sal
e
R
upee
s
Rup
ees
R
upee
s
Rup
ees
R
upee
s
A
sset
s w
ith b
ook
valu
e ex
ceed
ing
Rs.
50,
000
IT
equ
ipm
ent:
Dat
a Se
rver
s 6
66,7
04
468
,756
1
97,9
48
227
,210
2
9,26
2 D
esco
n O
xych
em L
imite
d
At A
rm’s
Leng
th
Pl
ant a
nd m
achi
nery
:
La
the
Mac
hine
1
32,1
99
69,
447
6
2,75
2
70,
198
7
,446
D
esco
n O
xych
em L
imite
d
At A
rm’s
Leng
th
Ve
hicl
es:
Suzu
ki L
iana
RXI
8
45,0
00
746
,417
9
8,58
3
568
,965
4
70,3
82
Syed
Ishr
at A
li
Neg
otia
tion
Suzu
ki C
ultu
s VX
R 6
47,0
00
647
,000
-
1
11,5
52
111
,552
M
r. Sa
jjad
Has
san
(Em
ploy
ee)
Com
pany
Pol
icy
Suzu
ki A
ulto
5
21,0
00
521
,000
-
4
61,2
07
461
,207
N
adee
m In
tern
atio
nal
Neg
otia
tion
Su
b-to
tal
2
,811
,903
2
,452
,620
3
59,2
83
1,4
39,1
32
1,0
79,8
49
A
sset
s w
ith b
ook
valu
e
of
less
than
Rs.
50,
000
637
,771
4
27,4
61
210
,310
1
33,5
96
(76,
714)
Va
rious
C
ompa
ny P
olic
y
To
tal 2
013
3,
449,
674
2
,880
,081
5
69,5
93
1,5
72,7
28
1,0
03,1
35
To
tal 2
012
9,
553,
288
6
,698
,895
2
,854
,393
6
,552
,369
3
,697
,976
notes to and forming part of the financial statementsFOR THE YEAR ENDED JUNE 30, 2013
AnnuAl RepoRt 201341

notes to and forming part of the financial statementsFOR THE YEAR ENDED JUNE 30, 2013
4.4 Cost, accumulated depreciation and book value of revalued assets, had there been no revaluation
Latest revaluation of land and buildings was carried out by an independent valuer as at June 30, 2011. Had there been no revaluation, the cost, accumulated depreciation and book values of revalued assets would have been as follows:
As at June 30, 2013
Accumulated Written Cost Depreciation Down Value
Rupees Rupees Rupees
Freehold land 142,044,797 - 142,044,797 Factory buildings on freehold land 158,295,923 41,933,874 116,362,049
2013 2012
Note Rupees Rupees
4.5 Capital Work in Progress
Plant and machinery
Opening balance 1,331,610 163,306 Additions during the year 11,116,894 3,830,634 Transferred to operating fixed assets (2,498,793) (2,662,330)
Closing balance 9,949,711 1,331,610
5. Intangible Assets
Net Carrying Value Net carrying value - opening balance 32,345,206 36,965,949 Additions during the year - -
32,345,206 36,965,949 Amortization during the year (4,620,743) (4,620,743)
Net carrying value as at June 30, 27,724,463 32,345,206
Gross Carrying Value Cost 46,207,435 46,207,435 Accumulated amortization (18,482,972) (13,862,229)
Net book value 27,724,463 32,345,206
Amortization rate 10% 10%
5.1 Apportionment of amortization charge for the year
Amortization charge for the year has been apportioned as follows:
Cost of sales 25 3,493,507 3,493,507 Administrative expenses 27 1,127,236 1,127,236
4,620,743 4,620,743
DESCON CHEMICALS LIMITED 42

2013 2012
Note Rupees Rupees
6. Long Term Investments
Related Parties (Associates)
Quoted - Measured using the Equity Method 6.1
Descon Oxychem Limited - Cost of investment 107,737,000 107,737,000 - Post acquisition loss brought forward - net (40,016,331) (26,840,407)
67,720,669 80,896,593 - Share of net loss for the year (5,409,466) (13,298,842) - Share of un-realised (loss) / gain on available-for- sale investment of associate (328,099) 122,918
61,983,104 67,720,669
Unquoted - Measured at cost
Jotun Powder Coatings Pakistan (Private) Limited 6.3 - 220,000 (2012: 220,000) fully paid 2,200,000 2,200,000 ordinary shares of Rs. 10 each - Equity holding 1.10% (2012: 3.67%)
Others - Quoted (Available-for-Sale) 6.4
TRG Pakistan Limited - 30,000 (2012: 30,000) fully paid ordinary 305,700 113,100 shares of Rs. 10 each - Cost of investment - Rs. 300,000 (2012: Rs. 300,000) - Market value Rs. 10.19 (2012: 3.57) per share
64,488,804 70,033,769
6.1 The Company’s investment in Descon Oxychem Limited is less than 20% but this is considered to be an associate because the Company has significant influence over the financial and operating policies of the investee company through common directorship.
6.2 The summarised audited financial results of Descon Oxychem Limited are as follows:
2013 2012
Rupees in million
Total assets 2,911.95 3,082.59 Total liabilities 2,354.23 2,470.53 Sales 1,369.55 1,192.44 Net loss for the year (51.23) (125.94)
Equity held 10.56% 10.56%
6.3 Jotun Powder Coatings Pakistan (Private) Limited is an associate as per the Companies Ordinance, 1984. However, for the purpose of measurement, this investment has been classified as available-for-sale and measured at cost which is considered to be the fair value in the absence of publicly available information.
notes to and forming part of the financial statementsFOR THE YEAR ENDED JUNE 30, 2013
AnnuAl RepoRt 201343
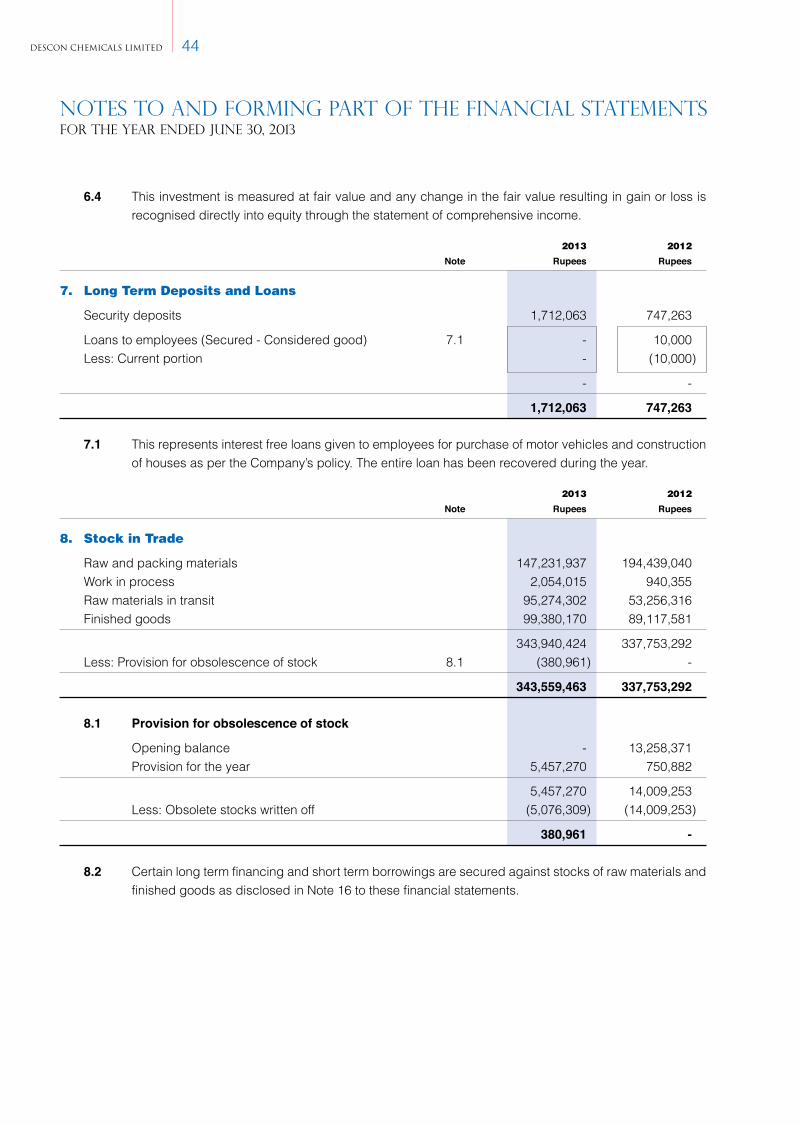
notes to and forming part of the financial statementsFOR THE YEAR ENDED JUNE 30, 2013
6.4 This investment is measured at fair value and any change in the fair value resulting in gain or loss is recognised directly into equity through the statement of comprehensive income.
2013 2012
Note Rupees Rupees
7. Long Term Deposits and Loans
Security deposits 1,712,063 747,263
Loans to employees (Secured - Considered good) 7.1 - 10,000 Less: Current portion - (10,000)
- -
1,712,063 747,263
7.1 This represents interest free loans given to employees for purchase of motor vehicles and construction of houses as per the Company’s policy. The entire loan has been recovered during the year.
2013 2012
Note Rupees Rupees
8. Stock in Trade
Raw and packing materials 147,231,937 194,439,040 Work in process 2,054,015 940,355 Raw materials in transit 95,274,302 53,256,316 Finished goods 99,380,170 89,117,581
343,940,424 337,753,292 Less: Provision for obsolescence of stock 8.1 (380,961) -
343,559,463 337,753,292
8.1 Provision for obsolescence of stock
Opening balance - 13,258,371 Provision for the year 5,457,270 750,882
5,457,270 14,009,253 Less: Obsolete stocks written off (5,076,309) (14,009,253)
380,961 -
8.2 Certain long term financing and short term borrowings are secured against stocks of raw materials and finished goods as disclosed in Note 16 to these financial statements.
DESCON CHEMICALS LIMITED 44

2013 2012
Note Rupees Rupees
9. Trade Debts
Unsecured
Considered good 374,229,068 414,309,449 Considered doubtful 52,661,761 20,377,647
Secured
Foreign debtors - 2,955,308
426,890,829 437,642,404Less: Provision for doubtful debts 9.3 (52,661,761) (20,377,647)
374,229,068 417,264,757
9.1 Trade debts include receivables of Rs. 63.809 million (2012: 23.812 million) that are under lien against long term financing and short term borrowings provided by a banking company.
9.2 Trade debts do not include any amount due from related parties (2012: Nil).
2013 2012
Note Rupees Rupees
9.3 Provision for doubtful debts
Opening balance 20,377,647 17,230,308 Provision for the year 34,539,318 4,316,672
54,916,965 21,546,980 Less: Bad debts written off (2,255,204) (1,169,333)
52,661,761 20,377,647
10. Loans and Advances
Advances (Unsecured - Considered good): - Suppliers and contractors 4,990,851 4,999,435 - Employees 10.1 1,636,126 946,696 - Letters of credit 293,119 448,142 Short term loans to employees (Secured - Considered good) 10.2 822,360 893,019 Income tax deducted at source and advance tax 136,916,118 104,146,706 Sales tax refundable - Net 13,725,973 -
158,384,547 111,433,998
10.1 Advances to employees include Rs. 179,250 (2012: Rs. 126,500) given to directors and executives of the Company for business travel purposes as per the Company’s policy.
10.2 This represents interest-free loans given to employees as per the Company’s policy. These loans are recoverable in monthly instalments from salary and are secured against provident fund balances of employees.
notes to and forming part of the financial statementsFOR THE YEAR ENDED JUNE 30, 2013
AnnuAl RepoRt 201345

notes to and forming part of the financial statementsFOR THE YEAR ENDED JUNE 30, 2013
2013 2012
Note Rupees Rupees
11. Short Term Prepayments and Other Receivables
Prepayments 3,517,533 5,489,990 Due from associates / related parties 11.1 2,277,420 20,797,985 Imprest with employees 53,677 51,462 Other receivables 992,550 62,810
6,841,180 26,402,247
11.1 This represents amounts due from associates / related parties as under:
Descon Oxychem Limited 191,948 3,565,529 Gray Mackenzie Engineering Services LLC 428,867 1,576,812 Gray Mackenzie Engineering Services WLL Qatar 463,923 1,320,060 Inspectest (Private) Limited 206,220 2,601,431 Inspectest Industrial Solutions LLC 674,098 1,300,479 Rousch Pakistan (Private) Limited - 260,198 Descon Power Solutions (Private) Limited 287,247 10,017,857 Interworld Travels (Private) Limited 25,117 45,509 Descon Integrated Projects (Private) Limited - 46,998 Presson Descon International (Private) Limited - 8,662 Olyan Descon Industrial Company Limited - 54,450
2,277,420 20,797,985
11.1.1 These balances represent receivables on account of sharing of common expenses.
11.1.2 These balances do not represent any amount which is past due (2012: Nil).
2013 2012
Note Rupees Rupees
12. Bank Balances
Cash at bank - in current accounts 5,360,234 9,938,238 Cash at bank - in saving accounts 12.1 6,077,530 15,274,656
11,437,764 25,212,894
12.1 It carries interest at the rates ranging from 1.25% to 10.5% (2012: 4% to 10%) per annum.
DESCON CHEMICALS LIMITED 46
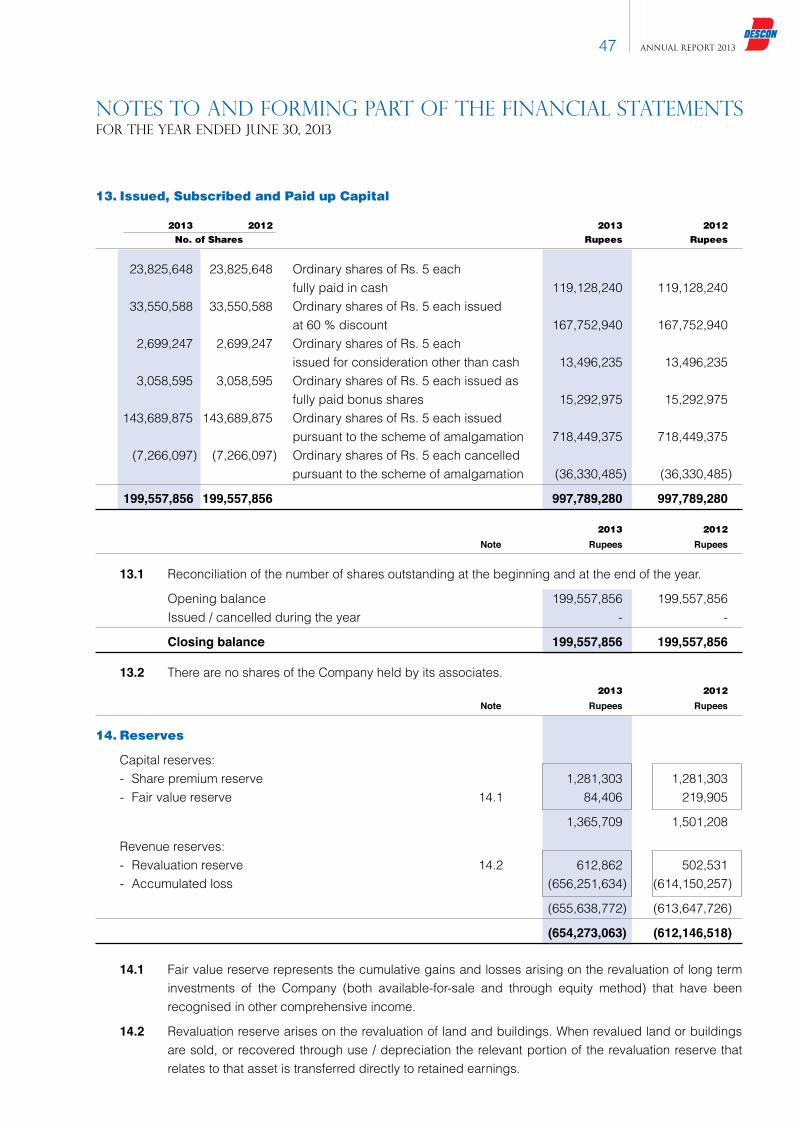
13. Issued, Subscribed and Paid up Capital
2013 2012 2013 2012 No. of Shares Rupees Rupees
23,825,648 23,825,648 Ordinary shares of Rs. 5 each fully paid in cash 119,128,240 119,128,240
33,550,588 33,550,588 Ordinary shares of Rs. 5 each issued at 60 % discount 167,752,940 167,752,940 2,699,247 2,699,247 Ordinary shares of Rs. 5 each issued for consideration other than cash 13,496,235 13,496,235 3,058,595 3,058,595 Ordinary shares of Rs. 5 each issued as
fully paid bonus shares 15,292,975 15,292,975 143,689,875 143,689,875 Ordinary shares of Rs. 5 each issued
pursuant to the scheme of amalgamation 718,449,375 718,449,375 (7,266,097) (7,266,097) Ordinary shares of Rs. 5 each cancelled
pursuant to the scheme of amalgamation (36,330,485) (36,330,485)
199,557,856 199,557,856 997,789,280 997,789,280
2013 2012
Note Rupees Rupees
13.1 Reconciliation of the number of shares outstanding at the beginning and at the end of the year.
Opening balance 199,557,856 199,557,856 Issued / cancelled during the year - -
Closing balance 199,557,856 199,557,856
13.2 There are no shares of the Company held by its associates. 2013 2012
Note Rupees Rupees
14. Reserves
Capital reserves: - Share premium reserve 1,281,303 1,281,303 - Fair value reserve 14.1 84,406 219,905
1,365,709 1,501,208
Revenue reserves: - Revaluation reserve 14.2 612,862 502,531 - Accumulated loss (656,251,634) (614,150,257)
(655,638,772) (613,647,726)
(654,273,063) (612,146,518)
14.1 Fair value reserve represents the cumulative gains and losses arising on the revaluation of long term investments of the Company (both available-for-sale and through equity method) that have been recognised in other comprehensive income.
14.2 Revaluation reserve arises on the revaluation of land and buildings. When revalued land or buildings are sold, or recovered through use / depreciation the relevant portion of the revaluation reserve that relates to that asset is transferred directly to retained earnings.
notes to and forming part of the financial statementsFOR THE YEAR ENDED JUNE 30, 2013
AnnuAl RepoRt 201347
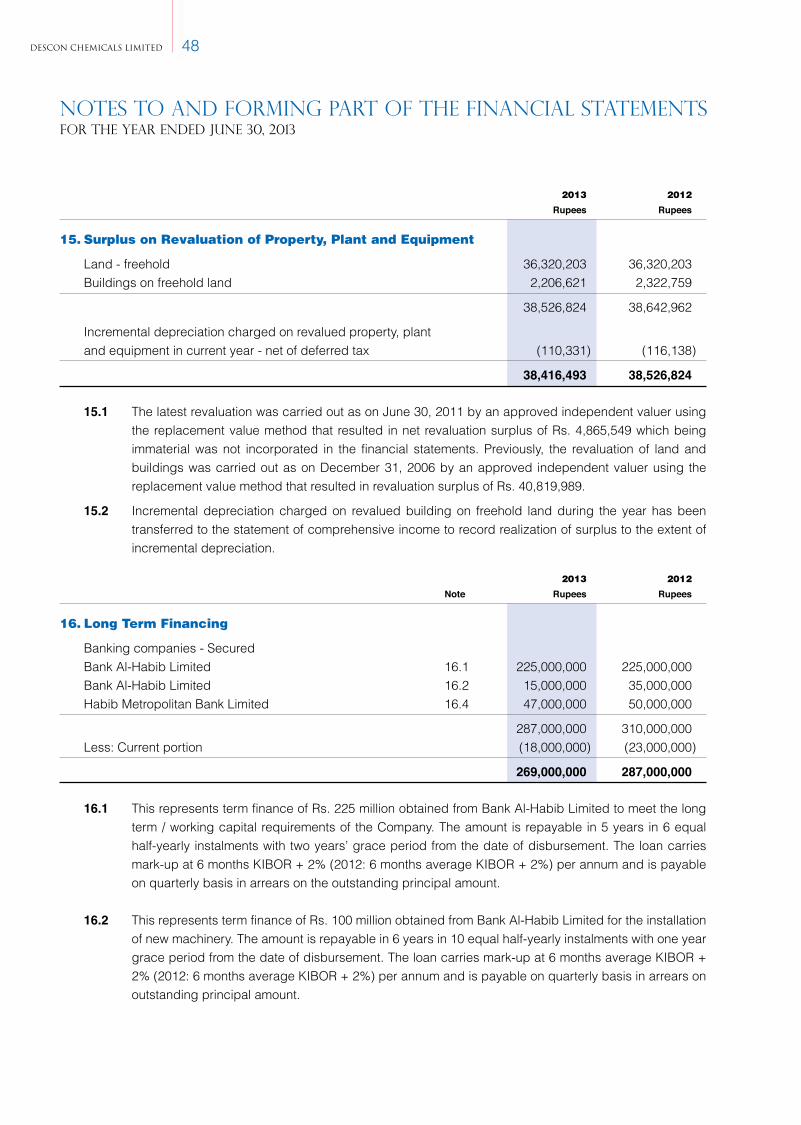
notes to and forming part of the financial statementsFOR THE YEAR ENDED JUNE 30, 2013
2013 2012
Rupees Rupees
15. Surplus on Revaluation of Property, Plant and Equipment
Land - freehold 36,320,203 36,320,203 Buildings on freehold land 2,206,621 2,322,759
38,526,824 38,642,962
Incremental depreciation charged on revalued property, plant and equipment in current year - net of deferred tax (110,331) (116,138)
38,416,493 38,526,824
15.1 The latest revaluation was carried out as on June 30, 2011 by an approved independent valuer using the replacement value method that resulted in net revaluation surplus of Rs. 4,865,549 which being immaterial was not incorporated in the financial statements. Previously, the revaluation of land and buildings was carried out as on December 31, 2006 by an approved independent valuer using the replacement value method that resulted in revaluation surplus of Rs. 40,819,989.
15.2 Incremental depreciation charged on revalued building on freehold land during the year has been transferred to the statement of comprehensive income to record realization of surplus to the extent of incremental depreciation.
2013 2012
Note Rupees Rupees
16. Long Term Financing
Banking companies - Secured Bank Al-Habib Limited 16.1 225,000,000 225,000,000 Bank Al-Habib Limited 16.2 15,000,000 35,000,000 Habib Metropolitan Bank Limited 16.4 47,000,000 50,000,000
287,000,000 310,000,000 Less: Current portion (18,000,000) (23,000,000)
269,000,000 287,000,000
16.1 This represents term finance of Rs. 225 million obtained from Bank Al-Habib Limited to meet the long term / working capital requirements of the Company. The amount is repayable in 5 years in 6 equal half-yearly instalments with two years’ grace period from the date of disbursement. The loan carries mark-up at 6 months KIBOR + 2% (2012: 6 months average KIBOR + 2%) per annum and is payable on quarterly basis in arrears on the outstanding principal amount.
16.2 This represents term finance of Rs. 100 million obtained from Bank Al-Habib Limited for the installation of new machinery. The amount is repayable in 6 years in 10 equal half-yearly instalments with one year grace period from the date of disbursement. The loan carries mark-up at 6 months average KIBOR + 2% (2012: 6 months average KIBOR + 2%) per annum and is payable on quarterly basis in arrears on outstanding principal amount.
DESCON CHEMICALS LIMITED 48

16.3 Financing from Bank Al-Habib Limited (both long term and short term) is secured against the following securities:
2013 2012
Rupees in million
- Pari passu charge over current assets of the Company 500 230 - Pari passu charge over present and future fixed assets
of the Company 230 230 - Ranking charge over current assets of the Company 334 1,004 - Joint pari passu charge over current assets of the Company 3,050 700 - Pari passu mortgage charge over factory 105 105 - First mortgage charge over factory 163 163 - Personal guarantees of directors of the Company 3,450 3,450 - Lien over certain local bills / receivables / shipping
documents etc. – –
16.4 This represents financing of Rs. 50 million obtained from Habib Metropolitan Bank Limited to meet the working capital requirements of the Company. The amount is repayable in 5 years in 60 monthly instalments starting from July 1, 2012. The loan carries mark-up at 3 months KIBOR + 2% (2012: 3 months KIBOR + 2%) per annum and is payable on quarterly basis in arrears on outstanding principal amount.
Financing from Habib Metropolitan Bank Limited (both long term and short term) is secured against the following securities:
2013 2012
Rupees in million
- Joint pari passu charge over present and future current assets of the Company 650 650
- Ranking charge over present and future fixed assets of the Company 170 170
- Personal guarantees of directors of the Company - Lien over certain local bills /shipping documents / trust receipts
2013 2012
Note Rupees Rupees
17. Retirement Benefit Obligation
Retirement benefit obligation - Gratuity 17.1 (554,276) 251,746 Transferred to retirement benefit asset - prepayment 17.2 554,276 -
- 251,746
17.1 As stated in note 3.9, the Company operates an approved gratuity scheme for its permanent employees subject to attainment of retirement age and minimum service of prescribed period. Actuarial valuation of the scheme is carried out every year by an independent actuary and the latest actuarial valuation was carried out as at June 30, 2013. The disclosures made in note 17.3 are based on the information included in that actuarial report.
17.2 Acturial valuation of the scheme resulted in retirement benefit asset in current year which has been presented under the heading of non current assets.
notes to and forming part of the financial statementsFOR THE YEAR ENDED JUNE 30, 2013
AnnuAl RepoRt 201349

notes to and forming part of the financial statementsFOR THE YEAR ENDED JUNE 30, 2013
2013 2012
Note Rupees Rupees
17.3 Actuarial assumptions
Discount rate 10.5% 13% Expected rate of salary increase in future years 9.5% 12% Expected rate of return on plan assets during 2012-2013 10.5% 13% Expected rate of return on plan assets during 2013-2014 10.5% –
Average expected remaining working life of employees 13 years Actuarial valuation method Projected Unit Credit Method Mortality rate Based on EFU 61-66 mortality table
17.3.1 Reconciliation of the funded status
Present value of defined benefit obligation 17.3.3 4,609,720 4,458,879 Unrecognised actuarial loss 2,847,566 791,095 Fair value of plan assets 17.3.4 (8,011,562) (4,998,228)
(554,276) 251,746
17.3.2 Company’sliability
Opening balance 251,746 21,093,469 Charge for the year 17.3.7 289,295 1,086,910
541,041 22,180,379 Transferred to the fund (1,095,317) (21,550,213) Benefits paid to outgoing employees - (378,420)
Closing balance (554,276) 251,746
17.3.3 The movement in present value of defined obligation is as follows:
Opening balance 4,458,879 22,139,149 Current service cost for the year 380,216 1,775,227 Interest cost for the year 579,654 3,099,481 Payable to staff - (17,350,006) Gain due to settlement made during the year - (2,441,171) Benefits paid during the year (895,753) (1,211,299) Actuarial loss / (gain) on present value of defined benefit obligation 86,724 (1,552,502)
Closing balance 4,609,720 4,458,879
17.3.4 The movement in fair value of plan assets is as follows:
Opening balance 4,998,228 - Expected return on plan assets 649,770 1,346,627 Contributions made during the year 1,095,317 21,550,213 Payable to staff - (17,350,006) Benefits paid during the year (895,753) (832,879) Actuarial gain on plan assets 2,164,000 284,273
Closing balance 8,011,562 4,998,228
DESCON CHEMICALS LIMITED 50
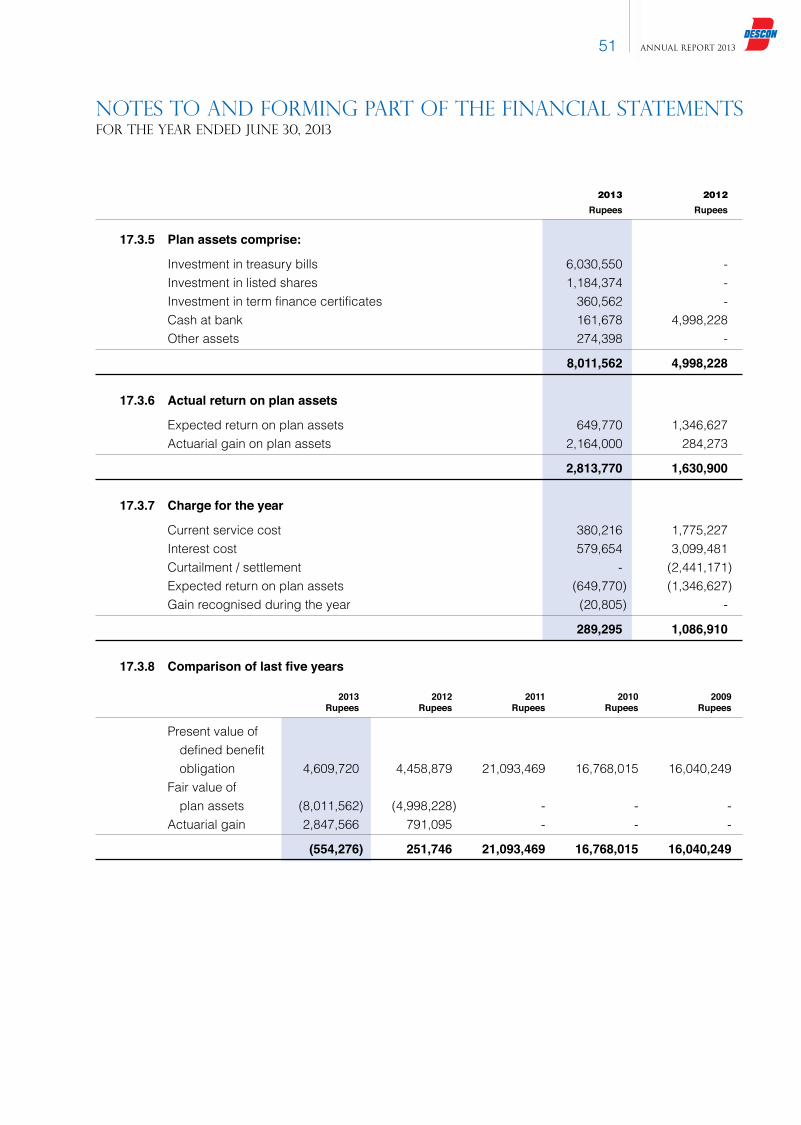
2013 2012
Rupees Rupees
17.3.5 Plan assets comprise:
Investment in treasury bills 6,030,550 - Investment in listed shares 1,184,374 - Investment in term finance certificates 360,562 - Cash at bank 161,678 4,998,228 Other assets 274,398 -
8,011,562 4,998,228
17.3.6 Actual return on plan assets
Expected return on plan assets 649,770 1,346,627 Actuarial gain on plan assets 2,164,000 284,273
2,813,770 1,630,900
17.3.7 Charge for the year
Current service cost 380,216 1,775,227 Interest cost 579,654 3,099,481 Curtailment / settlement - (2,441,171) Expected return on plan assets (649,770) (1,346,627) Gain recognised during the year (20,805) -
289,295 1,086,910
17.3.8 Comparison of last five years
2013 2012 2011 2010 2009 Rupees Rupees Rupees Rupees Rupees
Present value of defined benefit obligation 4,609,720 4,458,879 21,093,469 16,768,015 16,040,249 Fair value of plan assets (8,011,562) (4,998,228) - - - Actuarial gain 2,847,566 791,095 - - -
(554,276) 251,746 21,093,469 16,768,015 16,040,249
notes to and forming part of the financial statementsFOR THE YEAR ENDED JUNE 30, 2013
AnnuAl RepoRt 201351
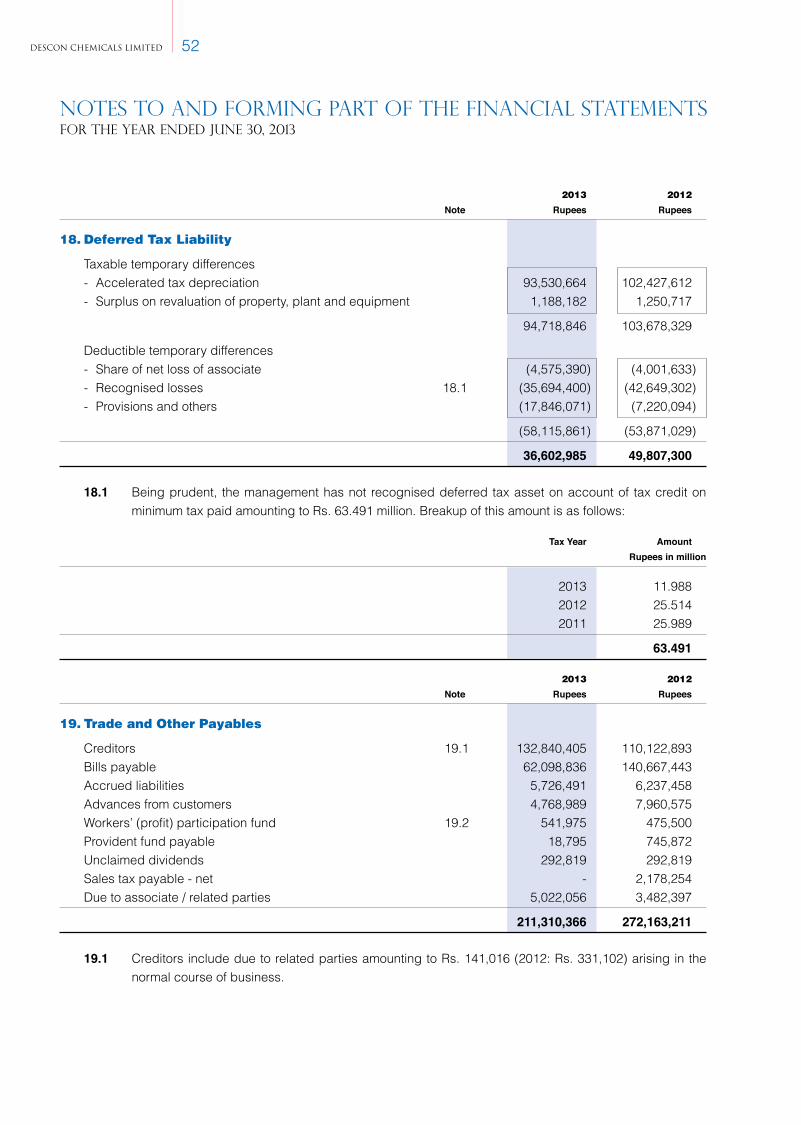
notes to and forming part of the financial statementsFOR THE YEAR ENDED JUNE 30, 2013
2013 2012
Note Rupees Rupees
18. Deferred Tax Liability
Taxable temporary differences - Accelerated tax depreciation 93,530,664 102,427,612 - Surplus on revaluation of property, plant and equipment 1,188,182 1,250,717
94,718,846 103,678,329
Deductible temporary differences - Share of net loss of associate (4,575,390) (4,001,633) - Recognised losses 18.1 (35,694,400) (42,649,302) - Provisions and others (17,846,071) (7,220,094)
(58,115,861) (53,871,029)
36,602,985 49,807,300
18.1 Being prudent, the management has not recognised deferred tax asset on account of tax credit on minimum tax paid amounting to Rs. 63.491 million. Breakup of this amount is as follows:
Tax Year Amount Rupees in million
2013 11.988 2012 25.514 2011 25.989
63.491
2013 2012
Note Rupees Rupees
19. Trade and Other Payables
Creditors 19.1 132,840,405 110,122,893 Bills payable 62,098,836 140,667,443 Accrued liabilities 5,726,491 6,237,458 Advances from customers 4,768,989 7,960,575 Workers’ (profit) participation fund 19.2 541,975 475,500 Provident fund payable 18,795 745,872 Unclaimed dividends 292,819 292,819 Sales tax payable - net - 2,178,254 Due to associate / related parties 5,022,056 3,482,397
211,310,366 272,163,211
19.1 Creditors include due to related parties amounting to Rs. 141,016 (2012: Rs. 331,102) arising in the normal course of business.
DESCON CHEMICALS LIMITED 52

2013 2012
Rupees Rupees
19.2 Workers’(profit)participationfund
Opening balance 475,500 - Provision for the year - 475,500 Interest on funds utilised in Company’s business 66,475 -
541,975 475,500 Payments / adjustments - -
541,975 475,500
20. Accrued Mark up
Long term financing 8,342,676 9,381,997 Short term borrowings - Banking companies 13,783,011 14,348,921
22,125,687 23,730,918
21. Short Term Borrowings
Banking companies - Secured - Running finance 148,249,214 203,721,543 - Borrowings / FATRs 434,925,763 270,629,317
583,174,977 474,350,860
21.1 Terms and conditions of borrowings
Purpose These facilities have been obtained from various banking companies with sanctioned limit, funded and
unfunded, of Rs. 1,275 million (2012: 1,500 million) for working capital requirements, retirement of local and foreign LCs, discounting local bills / receivables and loan against trust receipts etc.
Mark-up Mark-up on short term borrowings is charged using 3 to 6 Months KIBOR + 1% to 1.5% (2012: 1 to 6
Months KIBOR + 1% to 2.75%) per annum. Mark up is payable on quarterly basis in arrears. Further, some limits carry commission against foreign and local LCs at 0.1% to 0.25% (2012: 0.1% to 0.25%) per quarter.
Securities against short term borrowings have been disclosed in Note 16.3 and 16.4 to the financial statements. All these facilities are renewable latest by January 31, 2014.
2013 2012
Rupees Rupees
22. Provision for Taxation
Opening balance 25,514,179 25,988,561 Add: Charge for the year 11,988,140 25,514,179
37,502,319 51,502,740 Less: Payment / adjustments against advance tax (25,514,179) (25,988,561)
11,988,140 25,514,179
notes to and forming part of the financial statementsFOR THE YEAR ENDED JUNE 30, 2013
AnnuAl RepoRt 201353
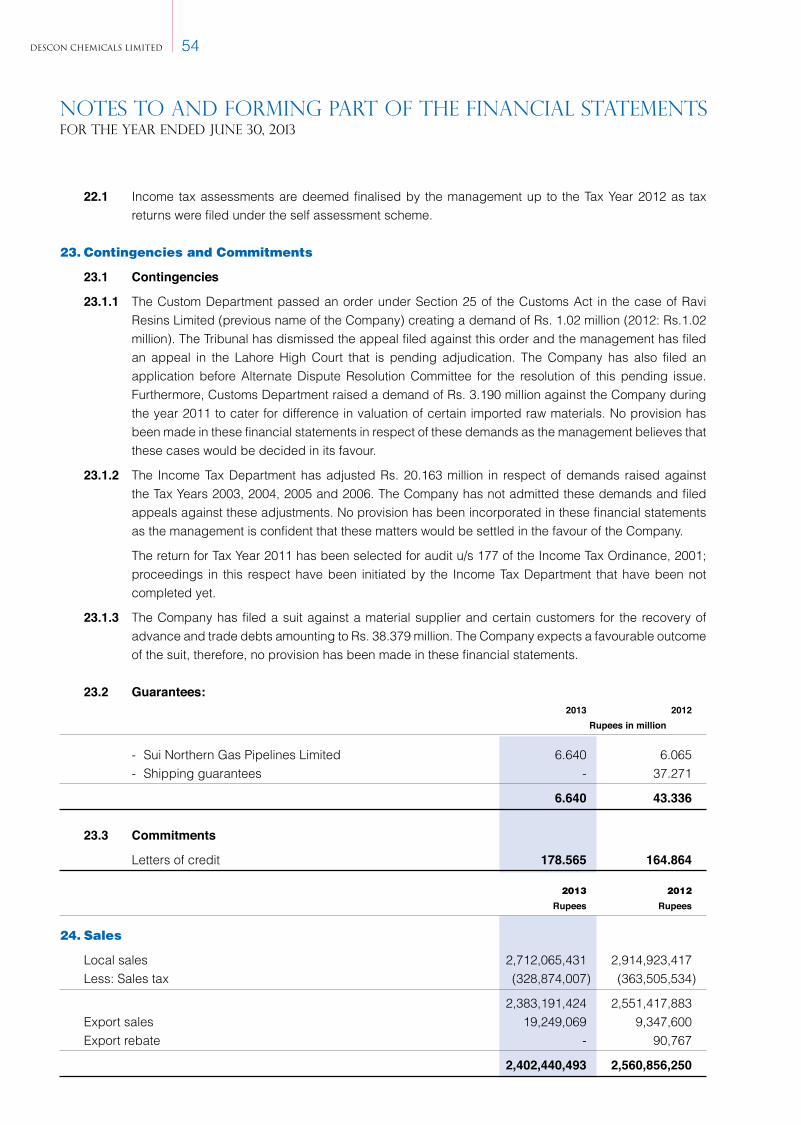
notes to and forming part of the financial statementsFOR THE YEAR ENDED JUNE 30, 2013
22.1 Income tax assessments are deemed finalised by the management up to the Tax Year 2012 as tax returns were filed under the self assessment scheme.
23. Contingencies and Commitments
23.1 Contingencies
23.1.1 The Custom Department passed an order under Section 25 of the Customs Act in the case of Ravi Resins Limited (previous name of the Company) creating a demand of Rs. 1.02 million (2012: Rs.1.02 million). The Tribunal has dismissed the appeal filed against this order and the management has filed an appeal in the Lahore High Court that is pending adjudication. The Company has also filed an application before Alternate Dispute Resolution Committee for the resolution of this pending issue. Furthermore, Customs Department raised a demand of Rs. 3.190 million against the Company during the year 2011 to cater for difference in valuation of certain imported raw materials. No provision has been made in these financial statements in respect of these demands as the management believes that these cases would be decided in its favour.
23.1.2 The Income Tax Department has adjusted Rs. 20.163 million in respect of demands raised against the Tax Years 2003, 2004, 2005 and 2006. The Company has not admitted these demands and filed appeals against these adjustments. No provision has been incorporated in these financial statements as the management is confident that these matters would be settled in the favour of the Company.
The return for Tax Year 2011 has been selected for audit u/s 177 of the Income Tax Ordinance, 2001; proceedings in this respect have been initiated by the Income Tax Department that have been not completed yet.
23.1.3 The Company has filed a suit against a material supplier and certain customers for the recovery of advance and trade debts amounting to Rs. 38.379 million. The Company expects a favourable outcome of the suit, therefore, no provision has been made in these financial statements.
23.2 Guarantees: 2013 2012 Rupees in million
- Sui Northern Gas Pipelines Limited 6.640 6.065 - Shipping guarantees - 37.271
6.640 43.336
23.3 Commitments
Letters of credit 178.565 164.864
2013 2012
Rupees Rupees
24. Sales
Local sales 2,712,065,431 2,914,923,417 Less: Sales tax (328,874,007) (363,505,534)
2,383,191,424 2,551,417,883 Export sales 19,249,069 9,347,600 Export rebate - 90,767
2,402,440,493 2,560,856,250
DESCON CHEMICALS LIMITED 54
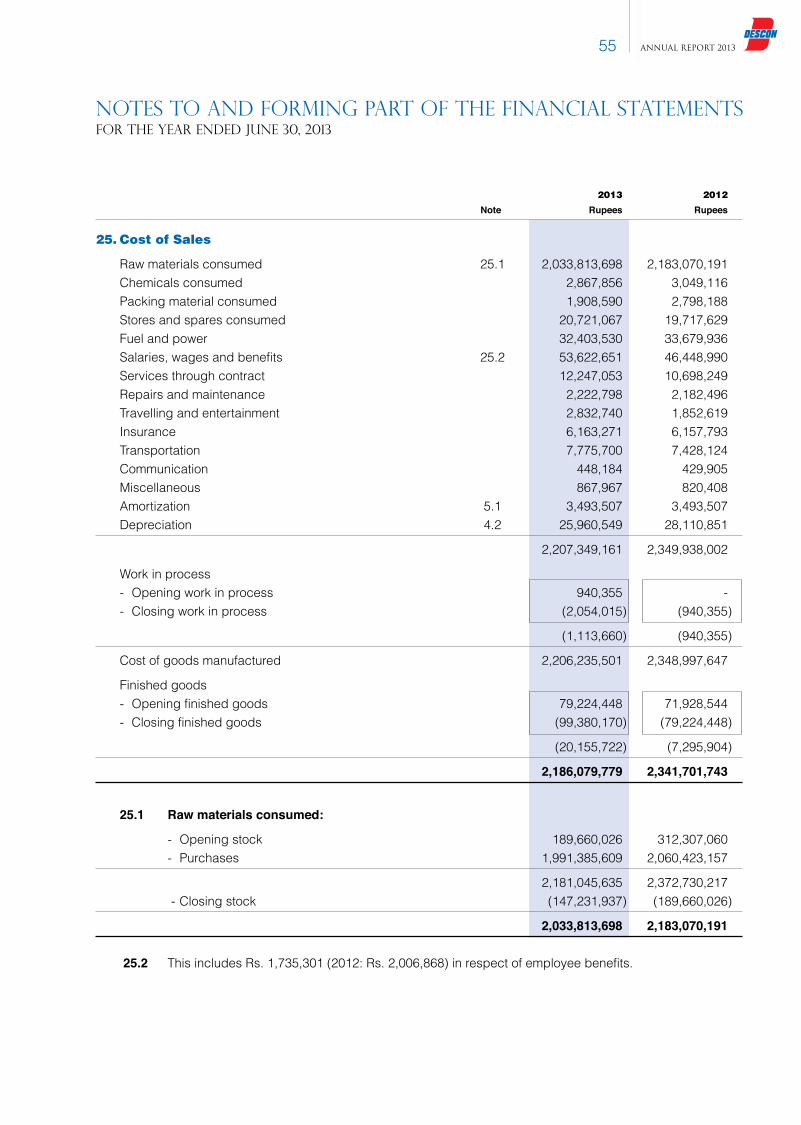
2013 2012
Note Rupees Rupees
25. Cost of Sales
Raw materials consumed 25.1 2,033,813,698 2,183,070,191 Chemicals consumed 2,867,856 3,049,116 Packing material consumed 1,908,590 2,798,188 Stores and spares consumed 20,721,067 19,717,629 Fuel and power 32,403,530 33,679,936 Salaries, wages and benefits 25.2 53,622,651 46,448,990 Services through contract 12,247,053 10,698,249 Repairs and maintenance 2,222,798 2,182,496 Travelling and entertainment 2,832,740 1,852,619 Insurance 6,163,271 6,157,793 Transportation 7,775,700 7,428,124 Communication 448,184 429,905 Miscellaneous 867,967 820,408 Amortization 5.1 3,493,507 3,493,507 Depreciation 4.2 25,960,549 28,110,851
2,207,349,161 2,349,938,002
Work in process - Opening work in process 940,355 - - Closing work in process (2,054,015) (940,355)
(1,113,660) (940,355)
Cost of goods manufactured 2,206,235,501 2,348,997,647
Finished goods - Opening finished goods 79,224,448 71,928,544 - Closing finished goods (99,380,170) (79,224,448)
(20,155,722) (7,295,904)
2,186,079,779 2,341,701,743
25.1 Raw materials consumed:
- Opening stock 189,660,026 312,307,060 - Purchases 1,991,385,609 2,060,423,157
2,181,045,635 2,372,730,217 - Closing stock (147,231,937) (189,660,026)
2,033,813,698 2,183,070,191
25.2 This includes Rs. 1,735,301 (2012: Rs. 2,006,868) in respect of employee benefits.
notes to and forming part of the financial statementsFOR THE YEAR ENDED JUNE 30, 2013
AnnuAl RepoRt 201355
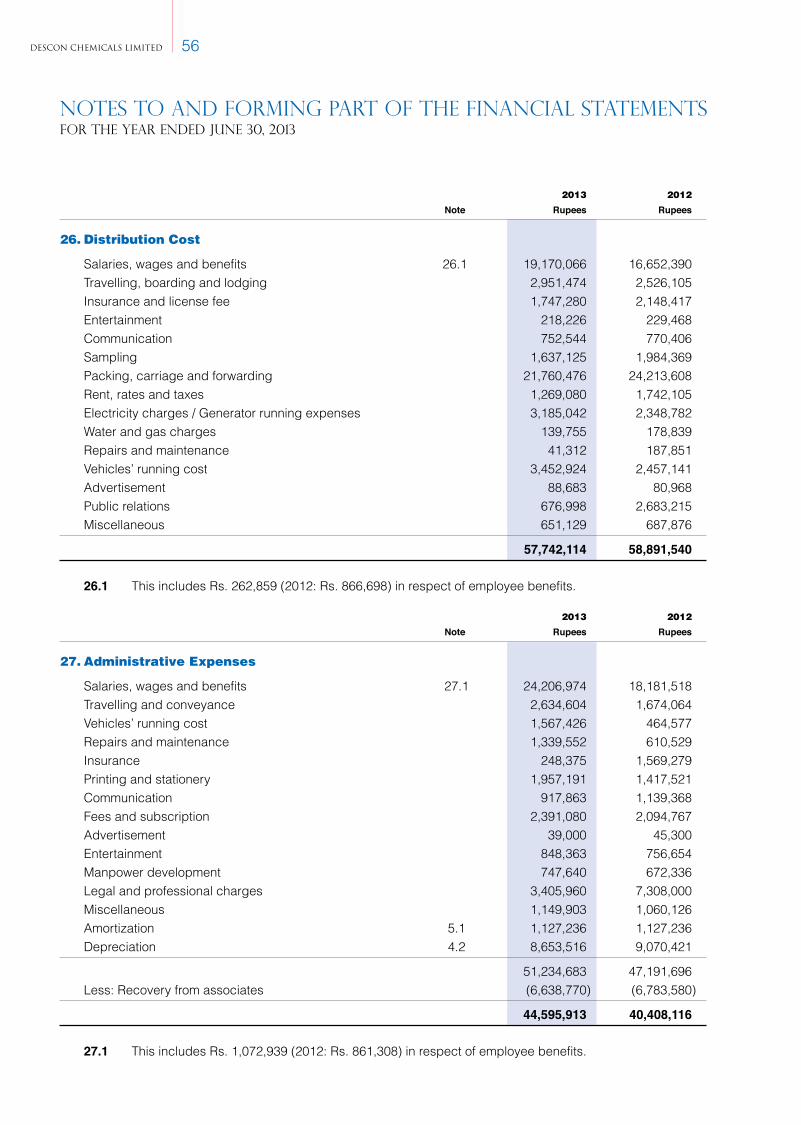
2013 2012
Note Rupees Rupees
26. Distribution Cost
Salaries, wages and benefits 26.1 19,170,066 16,652,390 Travelling, boarding and lodging 2,951,474 2,526,105 Insurance and license fee 1,747,280 2,148,417 Entertainment 218,226 229,468 Communication 752,544 770,406 Sampling 1,637,125 1,984,369 Packing, carriage and forwarding 21,760,476 24,213,608 Rent, rates and taxes 1,269,080 1,742,105 Electricity charges / Generator running expenses 3,185,042 2,348,782 Water and gas charges 139,755 178,839 Repairs and maintenance 41,312 187,851 Vehicles’ running cost 3,452,924 2,457,141 Advertisement 88,683 80,968 Public relations 676,998 2,683,215 Miscellaneous 651,129 687,876
57,742,114 58,891,540
26.1 This includes Rs. 262,859 (2012: Rs. 866,698) in respect of employee benefits.
2013 2012
Note Rupees Rupees
27. Administrative Expenses
Salaries, wages and benefits 27.1 24,206,974 18,181,518 Travelling and conveyance 2,634,604 1,674,064 Vehicles’ running cost 1,567,426 464,577 Repairs and maintenance 1,339,552 610,529 Insurance 248,375 1,569,279 Printing and stationery 1,957,191 1,417,521 Communication 917,863 1,139,368 Fees and subscription 2,391,080 2,094,767 Advertisement 39,000 45,300 Entertainment 848,363 756,654 Manpower development 747,640 672,336 Legal and professional charges 3,405,960 7,308,000 Miscellaneous 1,149,903 1,060,126 Amortization 5.1 1,127,236 1,127,236 Depreciation 4.2 8,653,516 9,070,421
51,234,683 47,191,696 Less: Recovery from associates (6,638,770) (6,783,580)
44,595,913 40,408,116
27.1 This includes Rs. 1,072,939 (2012: Rs. 861,308) in respect of employee benefits.
notes to and forming part of the financial statementsFOR THE YEAR ENDED JUNE 30, 2013
DESCON CHEMICALS LIMITED 56

2013 2012
Note Rupees Rupees
28. Research and Development Expenses
Consultancy 4,092,563 - Travelling, boarding and lodging 1,445,557 - Royalty fee 1,851,450 1,549,662
7,389,570 1,549,662
29. Other Operating Expenses
Auditors’ remuneration 29.1 922,000 922,000 Tax penalties - 225,729 Workers’ profit (participation) fund - 475,500 Provision for doubtful debts / bad debts written off 34,539,318 4,316,672 Provision for obsolescence of stock / stocks written off 5,457,270 750,882 Advances written off 512,879 -
41,431,467 6,690,783
29.1 Auditors’remuneration Audit fee 550,000 550,000 Half yearly review and corporate governance certifications 330,000 330,000 Out of pocket expenses 42,000 42,000
922,000 922,000
30. Finance Cost
Markup on long term financing 37,939,846 17,749,645 Markup on short term borrowings from banking companies 70,882,037 105,877,096 Interest on workers’ (profit) participation fund 66,475 - Bank charges 1,577,883 2,042,873
110,466,241 125,669,614
31. Other Income
Income from financial assets Profit on bank accounts 952,940 2,169,523 Exchange gain 772,233 918,767 Profit on investments - 719 1,725,173 3,089,009 Income from non - financial assets Sale of waste material / scrap 3,870,240 10,073,891 Gain on disposal of property, plant and equipment 1,003,135 3,697,976 4,873,375 13,771,867 Others Liabilities written back - 4,891,169 Indenting commission 757,957 1,337,670 757,957 6,228,839
7,356,505 23,089,715
notes to and forming part of the financial statementsFOR THE YEAR ENDED JUNE 30, 2013
AnnuAl RepoRt 201357

2013 2012
Note Rupees Rupees
32. Taxation
Current 32.1 11,988,140 42,944,207 Deferred (13,204,315) 14,495,087
(1,216,175) 57,439,294
32.1 This includes Rs. Nil (2012: 17.430 million) on account of prior year taxation.
32.2 Numerical reconciliation between the average effective tax rate and the applicable tax rate is not given due to accounting and tax losses.
2013 2012
33. Loss per Share
Net loss for the year Rupees (42,101,377) (61,703,629) Weighted average number of ordinary shares outstanding during the year Numbers 199,557,856 199,557,856 Loss per share - basic Rupees (0.21) (0.31)
33.1 Diluted earnings per share
There is no dilution effect on the basic earnings per share of the Company as the Company has no such commitments that would result in dilution of earnings of the Company.
2013 2012
Rupees Rupees
34. Cash Generated from Operations
CASH FLOWS FROM OPERATING ACTIVITIES (Loss) / profit before taxation and share of loss of associate (37,908,086) 9,034,507
Adjustments for: - Depreciation 34,614,065 37,181,272 - Amortization of intangible asset 4,620,743 4,620,743 - Provision for gratuity 289,295 1,086,910 - Provision for obsolescence of stock 5,457,270 750,882 - Provision for doubtful debts 34,539,318 4,316,672 - Liabilities written back - (4,891,169) - Gain on disposal of property, plant and equipment (1,003,135) (3,697,976) - Exchange gain (772,233) (918,767) - Finance cost 110,466,241 125,669,614 - Interest income (952,940) (2,170,242)
187,258,624 161,947,939
Operating profit before working capital changes 149,350,538 170,982,446
notes to and forming part of the financial statementsFOR THE YEAR ENDED JUNE 30, 2013
DESCON CHEMICALS LIMITED 58
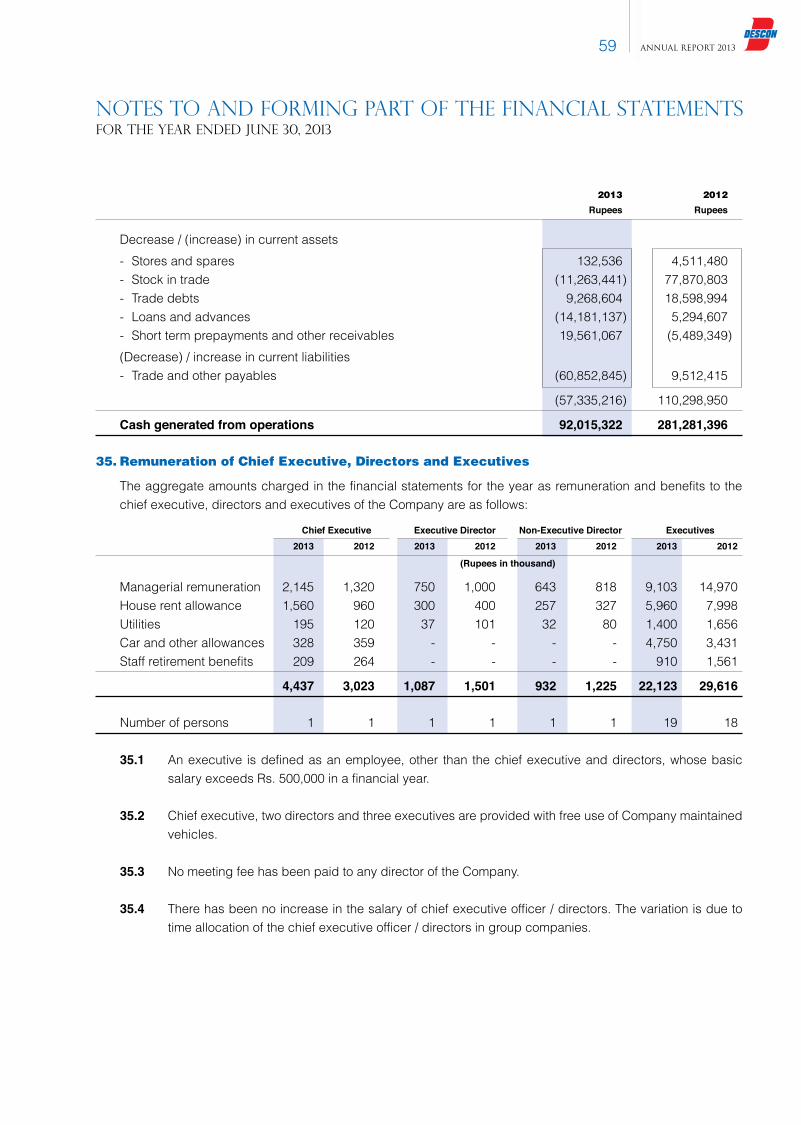
2013 2012
Rupees Rupees
Decrease / (increase) in current assets - Stores and spares 132,536 4,511,480 - Stock in trade (11,263,441) 77,870,803 - Trade debts 9,268,604 18,598,994 - Loans and advances (14,181,137) 5,294,607 - Short term prepayments and other receivables 19,561,067 (5,489,349) (Decrease) / increase in current liabilities - Trade and other payables (60,852,845) 9,512,415
(57,335,216) 110,298,950
Cash generated from operations 92,015,322 281,281,396
35. Remuneration of Chief Executive, Directors and Executives
The aggregate amounts charged in the financial statements for the year as remuneration and benefits to the chief executive, directors and executives of the Company are as follows:
Chief Executive Executive Director Non-Executive Director Executives 2013 2012 2013 2012 2013 2012 2013 2012
(Rupees in thousand)
Managerial remuneration 2,145 1,320 750 1,000 643 818 9,103 14,970 House rent allowance 1,560 960 300 400 257 327 5,960 7,998 Utilities 195 120 37 101 32 80 1,400 1,656 Car and other allowances 328 359 - - - - 4,750 3,431 Staff retirement benefits 209 264 - - - - 910 1,561
4,437 3,023 1,087 1,501 932 1,225 22,123 29,616
Number of persons 1 1 1 1 1 1 19 18
35.1 An executive is defined as an employee, other than the chief executive and directors, whose basic salary exceeds Rs. 500,000 in a financial year.
35.2 Chief executive, two directors and three executives are provided with free use of Company maintained vehicles.
35.3 No meeting fee has been paid to any director of the Company.
35.4 There has been no increase in the salary of chief executive officer / directors. The variation is due to time allocation of the chief executive officer / directors in group companies.
notes to and forming part of the financial statementsFOR THE YEAR ENDED JUNE 30, 2013
AnnuAl RepoRt 201359

36. Transaction with Related Parties
Related parties and associated companies comprise related group companies, associated companies, staff retirement funds, directors and key management personnel. The Company in the normal course of business carries out transactions with various related parties. The Company enters into transactions with related parties on the basis of mutually agreed terms. Significant balances and transactions with related parties are as follows:
Sale of goods, services provided and Relationship with 2013 2012
reimbursement of expenses the Company Rupees in thousands
Descon Oxychem Limited Associate 26,708 48,328 Descon Power Solutions (Private) Limited Associate 11,977 4,975 Inspectest (Private) Limited Associate 9,736 6,733 Descon Engineering Limited Associate 3,888 2,825 Gray Mackenzie Engineering Services LLC Associate 3,227 5,780 Gray Mackenzie Engineering Services WLL Qatar Associate 2,648 - Inspectest Industrial Solutions LLC Associate 2,537 - Interworld Travels (Private) Limited Associate 1,514 678 Rousch Pakistan (Private) Limited Associate 1,316 1,131 Descon Corporation (Private) Limited Associate 8 67
63,559 70,517
Rent expense Descon Corporation (Private) Limited Associate 2,879 2,793
Purchase of goods, services received and Relationship with 2013 2012
reimbursement of expenses the Company Rupees in thousands
Descon Oxychem Limited Associate 9,890 6,334 Descon Engineering Limited Associate 5,435 5,190 Interworld Travels (Private) Limited Associate 2,224 1,777 Descon Corporation (Private) Limited Associate 717 176 Gray Mackenzie Engineering Services LLC Associate 426 1,057 Inspectest (Private) Limited Associate 258 287 Descon Power Solutions (Private) Limited Associate 34 11
18,984 14,832
Contribution to staff retirement benefits
Descon Chemicals Limited Employees’ Provident Fund Employee Fund 3,509 2,648 Descon Chemicals Limited Employees’ Gratuity Fund Employee Fund 1,095 1,087
4,604 3,735
There were no transactions with key management personnel other than undertaken as per terms of their employment as disclosed in Note 35.
Sale and purchase transactions have been carried out on commercial terms and conditions as per the Company’s Policy.
notes to and forming part of the financial statementsFOR THE YEAR ENDED JUNE 30, 2013
DESCON CHEMICALS LIMITED 60
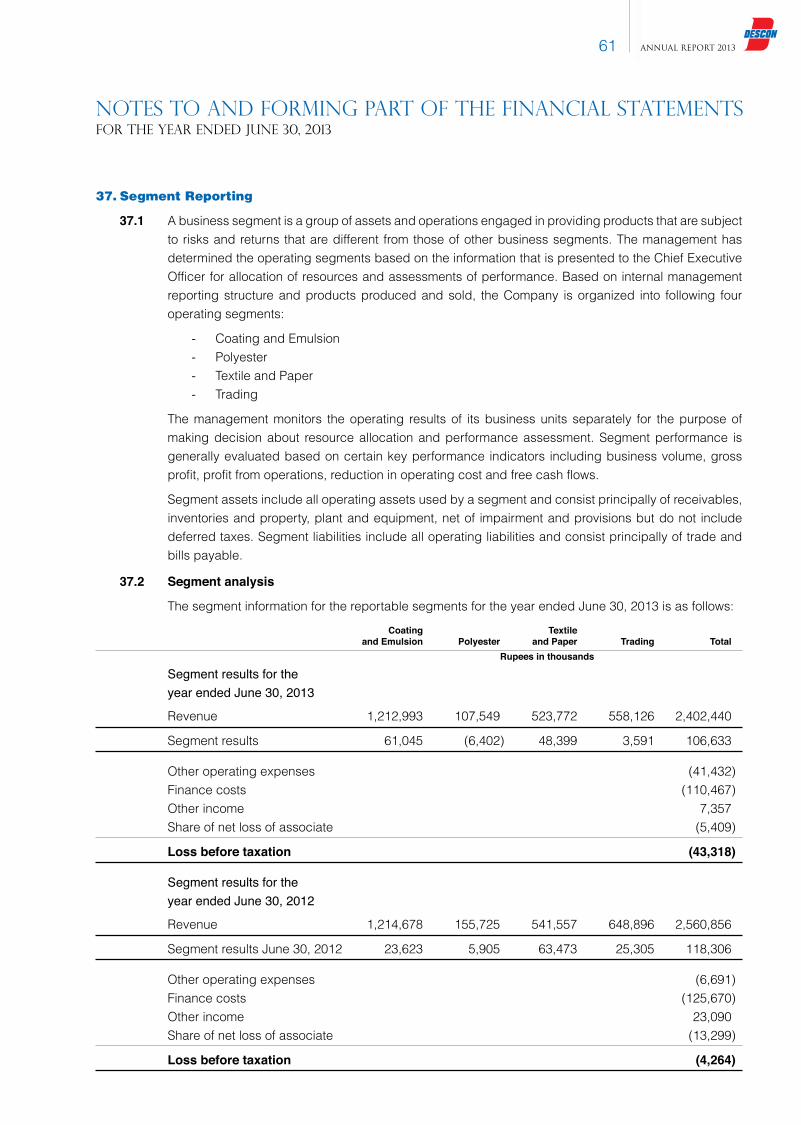
37. Segment Reporting
37.1 A business segment is a group of assets and operations engaged in providing products that are subject to risks and returns that are different from those of other business segments. The management has determined the operating segments based on the information that is presented to the Chief Executive Officer for allocation of resources and assessments of performance. Based on internal management reporting structure and products produced and sold, the Company is organized into following four operating segments:
- Coating and Emulsion - Polyester - Textile and Paper - Trading
The management monitors the operating results of its business units separately for the purpose of making decision about resource allocation and performance assessment. Segment performance is generally evaluated based on certain key performance indicators including business volume, gross profit, profit from operations, reduction in operating cost and free cash flows.
Segment assets include all operating assets used by a segment and consist principally of receivables, inventories and property, plant and equipment, net of impairment and provisions but do not include deferred taxes. Segment liabilities include all operating liabilities and consist principally of trade and bills payable.
37.2 Segment analysis
The segment information for the reportable segments for the year ended June 30, 2013 is as follows:
Coating Textile and Emulsion Polyester and Paper Trading Total Rupees in thousands
Segment results for the year ended June 30, 2013
Revenue 1,212,993 107,549 523,772 558,126 2,402,440
Segment results 61,045 (6,402) 48,399 3,591 106,633
Other operating expenses (41,432) Finance costs (110,467) Other income 7,357 Share of net loss of associate (5,409)
Loss before taxation (43,318)
Segment results for the year ended June 30, 2012
Revenue 1,214,678 155,725 541,557 648,896 2,560,856
Segment results June 30, 2012 23,623 5,905 63,473 25,305 118,306
Other operating expenses (6,691) Finance costs (125,670) Other income 23,090 Share of net loss of associate (13,299)
Loss before taxation (4,264)
notes to and forming part of the financial statementsFOR THE YEAR ENDED JUNE 30, 2013
AnnuAl RepoRt 201361

Coating Textile and Emulsion Polyester and Paper Trading Total Rupees in thousands
Segment assets and liabilities as at June 30, 2013
Segment assets 568,946 117,468 290,740 111,139 1,088,293
Segment liabilities 96,280 12,910 76,049 7,856 193,095
Segment assets and liabilities as at June 30, 2012
Segment assets 567,205 122,277 302,528 78,120 1,070,130
Segment liabilities 116,891 15,127 69,209 49,446 250,673
2013 2012 Rupees in thousands
Reportablesegments’assetsarereconciledto total assets as follows:
Segment assets for reportable segments 1,088,293 1,070,130 Corporate assets unallocated 335,941 346,062 Cash and bank balances 11,438 25,213 Others 98,463 138,583
Total assets as per the balance sheet 1,534,135 1,579,988
Reportablesegments’liabilitiesarereconciledto total liabilities as follows:
Segment liabilities for reportable segments 193,095 250,673 Corporate liabilities unallocated 870,175 784,351 Trade and other payables 76,944 95,280 Taxation - net 11,988 25,514
Total liabilities as per the balance sheet 1,152,202 1,155,818
37.3 Entity-wide disclosures regarding reportable segment are as follows:
- Information about products One product of the Company comprises 11.89% (2012: 10.64%) of total sales for the year.
- Information about major customers One customer of the Company accounts for 16.04% (2012: 21.61%) of total sales for the year.
- Information about geographical area - All non-current assets of the Company are located in Pakistan as at the reporting date. - Revenue from external customers attributed to foreign countries in aggregate is not material.
38. Financial Risk Management
38.1 Financial risk factors
The Company’s activities expose it to a variety of financial risks: market risk (including currency risk, other price risk and interest rate risk), credit risk and liquidity risk. The Company’s overall risk
notes to and forming part of the financial statementsFOR THE YEAR ENDED JUNE 30, 2013
DESCON CHEMICALS LIMITED 62

management policies focus on the unpredictability of financial markets and seek to minimize potential adverse effects on the financial performance.
Risk management is carried out by the Board of Directors (the Board). The Board provides principles for overall risk management as well as policies covering specific areas such as currency risk, other price risk, interest rate risk, credit risk and liquidity risk.
(a) Market risk
Market risk is the risk that the fair value of future cash flows of a financial instrument will fluctuate because of changes in foreign currency, interest rate, commodity price and equity price that will affect the Company’s income or the value of its holdings of financial instruments.
(i) Currency risk
Currency risk is the risk that the fair value or future cash flows of a financial instrument will fluctuate because of changes in foreign exchange rates. Currency risk arises mainly from future commercial transactions or receivables and payables that exist due to transactions in foreign currencies.
The Company is exposed to currency risk arising from various currency exposures, primarily with respect to foreign receivables and payables. Currently, the Company’s foreign exchange risk exposure is restricted to the amounts receivable from / payable to foreign entities. The Company’s exposure to currency risk is as follows:
2013
Rupees USD
Trade debts 14,373,491 145,481 Outstanding letters of credit (99,280,800) (1,004,866)
Net exposure (84,907,309) (859,385)
2012
Rupees USD
Trade debts 2,955,308 31,356 Outstanding letters of credit (106,875,165) (1,133,954)
Net exposure (103,919,857) (1,102,598)
The following exchange rates were applied during the year:
2013 2012
Rupees per foreign currency rate Average rate - Rupees per US Dollar 99.26 89.93 Reporting date rate - Rupees per US Dollar 98.80 94.25
If the functional currency, at reporting date, had weakened / strengthened by 5% against the foreign currencies with all other variables held constant, the impact on profit before taxation for the year would have been Rs. 4.245 million (2012: Rs. 5.196 million) respectively higher / lower, mainly as a result of exchange gains / losses on translation of foreign exchange denominated financial instruments.
notes to and forming part of the financial statementsFOR THE YEAR ENDED JUNE 30, 2013
AnnuAl RepoRt 201363

(i) Currency risk
Currency risk is the risk that the fair value or future cash flows of a financial instrument will fluctuate because of changes in foreign exchange rates. Currency risk arises mainly from future commercial transactions or receivables and payables that exist due to transactions in foreign currencies.
(ii) Other price risk
Other price risk represents the risk that the fair value or future cash flows of a financial instrument will fluctuate because of changes in market prices (other than those arising from interest rate risk or currency risk), whether those changes are caused by factors specific to the individual financial instrument or its issuer, or factors affecting all similar financial instrument traded in the market. The Company is exposed to equity / commodity price risk in respect of long term investments in quoted companies.
Sensitivity analysis A change of 5% in the value of investments available for sale would have increased / decreased
equity investments by Rs. 15,285 (2012: Rs. 5,655) on the basis that all other variables remain constant.
(iii) Interest rate risk
This represents the risk that the fair value or future cash flows of a financial instrument will fluctuate because of changes in market interest rates.
The Company has no significant long-term interest-bearing assets. The Company’s interest rate risk arises from long term financing and short term borrowings. As the borrowings are obtained at variable rates, these expose the Company to cash flow interest rate risk.
As at the balance sheet date, the interest rate profile of the Company’s interest bearing financial instruments was as follows:
2013 2012
Rupees Rupees
Floating rate instruments
Financial liabilities
Long term financing 287,000,000 310,000,000 Short term borrowings 583,174,977 474,350,860
Financial assets
Bank balances - saving accounts 6,077,530 15,274,656
Cash flow sensitivity analysis for variable rate instruments
If interest rates at the balance sheet date fluctuate by 1% higher / lower with all other variables held constant, loss before taxation for the year would have been Rs. 8.641 million (2012: Rs. 7.691 million) higher / lower, mainly as a result of higher / lower interest expense on floating rate borrowings. This analysis is prepared assuming the amounts of liabilities outstanding at the balance sheet date are outstanding for the whole year.
notes to and forming part of the financial statementsFOR THE YEAR ENDED JUNE 30, 2013
DESCON CHEMICALS LIMITED 64

(b) Credit risk
Credit risk represents the risk that one party to a financial instrument will cause a financial loss for the other party by failing to discharge an obligation. Carrying amounts of financial assets represent the maximum credit exposure. The maximum exposure to credit risk at the reporting date was as follows:
2013 2012
Rupees Rupees
Long term investments 2,505,700 2,313,100 Long term deposits and advances 1,712,063 757,263 Trade debts 374,229,068 417,264,757 Other receivables 3,269,970 20,860,795 Bank balances 11,437,764 25,212,894
The aging of trade debts as at balance sheet date is as follows: Past due 1 - 30 days 132,665,357 162,802,032 Past due 31 - 60 days 104,671,729 107,429,539 Past due 61 - 120 days 73,521,032 31,625,319 More than 120 days 63,370,950 115,407,867
374,229,068 417,264,757
The credit risk on liquid funds is limited because the counter parties are banks with reasonably high credit ratings. The Company believes that it is not exposed to major concentration of credit risk as its exposure is spread over a large number of counter parties and trade debts are subject to specific credit ceilings based on customer credit history.
The credit quality of bank balances that are neither past due nor impaired can be assessed by reference to external credit ratings (if available) or to historical information about counterparty default rate:
Rating Rating Short term Long term Agency 2013 2012
Rupees Rupees
Habib Metropolitan Bank Limited A1+ AA+ PACRA 6,094,706 10,342,405 KASB Bank Limited A3 BBB PACRA 49 99 Bank Al-Habib Limited A1+ AA+ PACRA 5,343,009 14,870,390
11,437,764 25,212,894
Due to the Company’s long standing business relationships with these counterparties and after giving due consideration to their strong financial standing, management does not expect non-performance by these counter parties on their obligations to the Company. Accordingly, the credit risk is minimal.
(c) Liquidity risk
Liquidity risk is the risk that an entity will encounter difficulty in meeting obligations associated with financial liabilities. The Company manages liquidity risk by maintaining sufficient cash and the availability of funding through an adequate amount of committed credit facilities. As at the balance sheet date, the Company had Rs. 1,275 million (2012: Rs. 1,500 million) worth short term borrowing limits available from financial institutions and Rs. 11.438 million (2012: Rs. 25.213 million) cash and bank balances. Following are the contractual maturities of financial liabilities, including interest payments.
notes to and forming part of the financial statementsFOR THE YEAR ENDED JUNE 30, 2013
AnnuAl RepoRt 201365
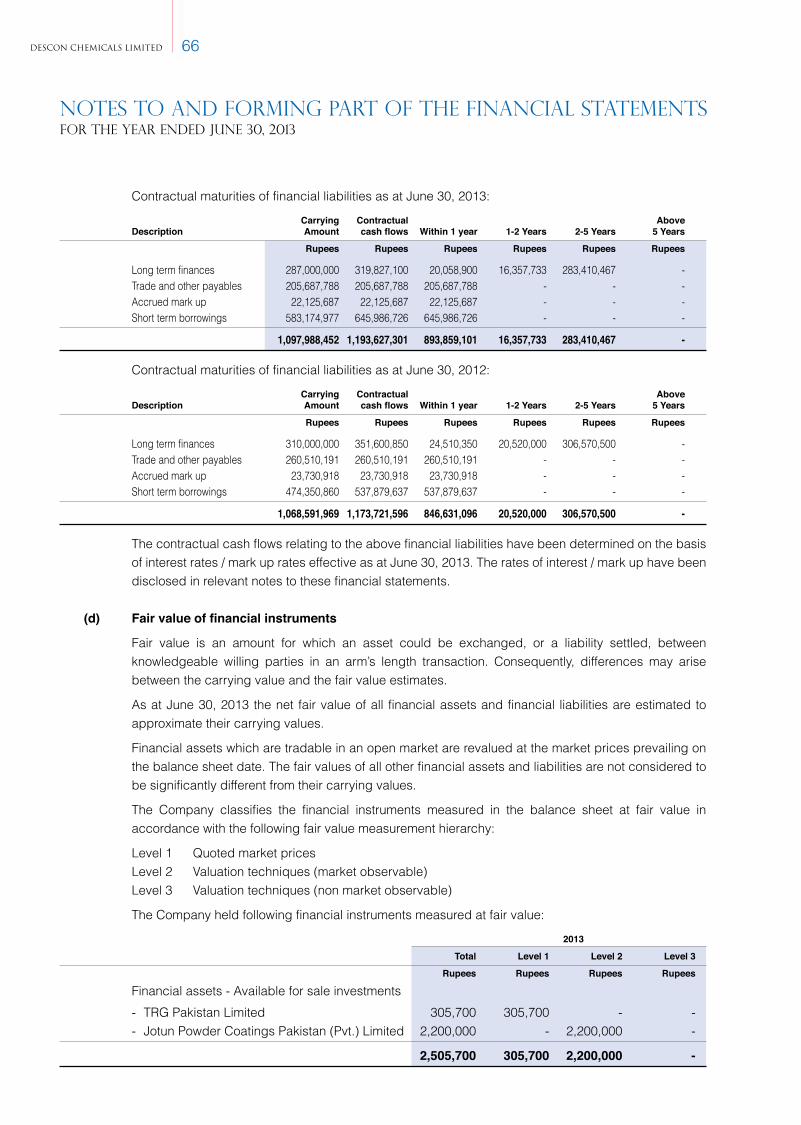
Contractual maturities of financial liabilities as at June 30, 2013:
Carrying Contractual Above Description Amount cash flows Within 1 year 1-2 Years 2-5 Years 5 Years
Rupees Rupees Rupees Rupees Rupees Rupees
Long term finances 287,000,000 319,827,100 20,058,900 16,357,733 283,410,467 - Trade and other payables 205,687,788 205,687,788 205,687,788 - - - Accrued mark up 22,125,687 22,125,687 22,125,687 - - - Short term borrowings 583,174,977 645,986,726 645,986,726 - - -
1,097,988,452 1,193,627,301 893,859,101 16,357,733 283,410,467 -
Contractual maturities of financial liabilities as at June 30, 2012:
Carrying Contractual Above Description Amount cash flows Within 1 year 1-2 Years 2-5 Years 5 Years
Rupees Rupees Rupees Rupees Rupees Rupees
Long term finances 310,000,000 351,600,850 24,510,350 20,520,000 306,570,500 - Trade and other payables 260,510,191 260,510,191 260,510,191 - - - Accrued mark up 23,730,918 23,730,918 23,730,918 - - - Short term borrowings 474,350,860 537,879,637 537,879,637 - - -
1,068,591,969 1,173,721,596 846,631,096 20,520,000 306,570,500 -
The contractual cash flows relating to the above financial liabilities have been determined on the basis of interest rates / mark up rates effective as at June 30, 2013. The rates of interest / mark up have been disclosed in relevant notes to these financial statements.
(d) Fair value of financial instruments
Fair value is an amount for which an asset could be exchanged, or a liability settled, between knowledgeable willing parties in an arm’s length transaction. Consequently, differences may arise between the carrying value and the fair value estimates.
As at June 30, 2013 the net fair value of all financial assets and financial liabilities are estimated to approximate their carrying values.
Financial assets which are tradable in an open market are revalued at the market prices prevailing on the balance sheet date. The fair values of all other financial assets and liabilities are not considered to be significantly different from their carrying values.
The Company classifies the financial instruments measured in the balance sheet at fair value in accordance with the following fair value measurement hierarchy:
Level 1 Quoted market prices Level 2 Valuation techniques (market observable) Level 3 Valuation techniques (non market observable)
The Company held following financial instruments measured at fair value:
2013
Total Level 1 Level 2 Level 3
Rupees Rupees Rupees Rupees
Financial assets - Available for sale investments - TRG Pakistan Limited 305,700 305,700 - - - Jotun Powder Coatings Pakistan (Pvt.) Limited 2,200,000 - 2,200,000 -
2,505,700 305,700 2,200,000 -
notes to and forming part of the financial statementsFOR THE YEAR ENDED JUNE 30, 2013
DESCON CHEMICALS LIMITED 66
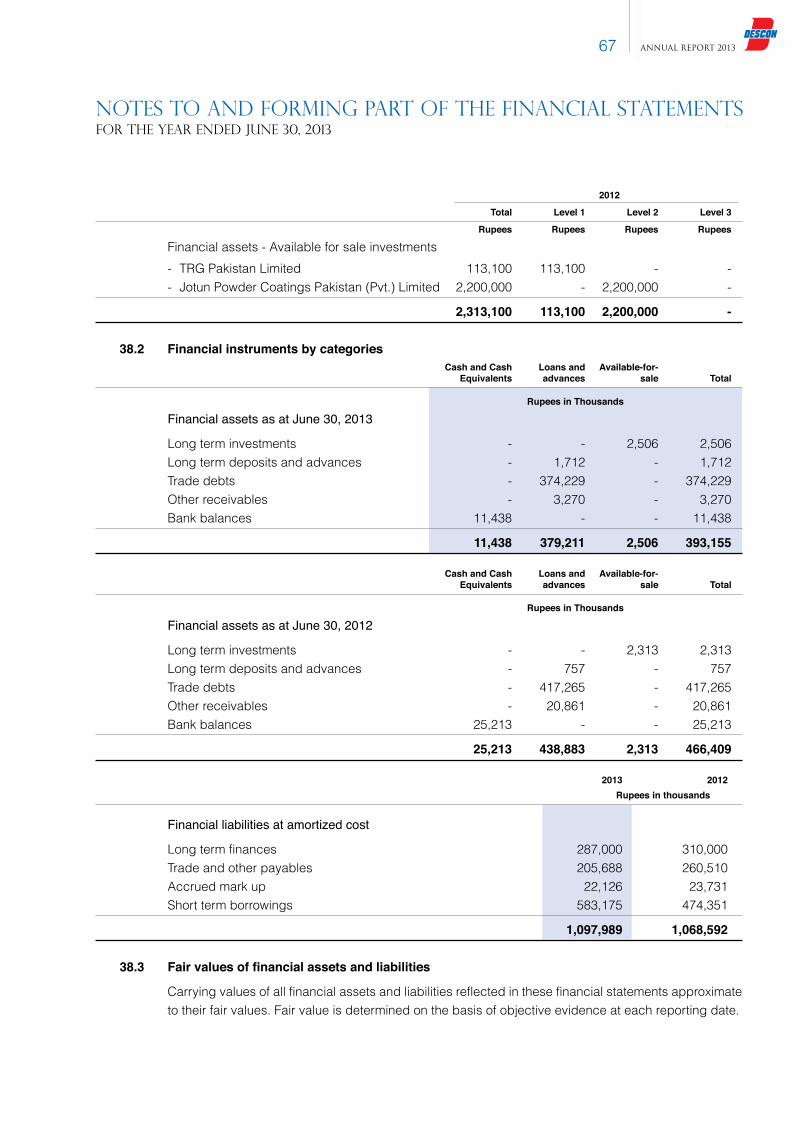
2012
Total Level 1 Level 2 Level 3
Rupees Rupees Rupees Rupees
Financial assets - Available for sale investments - TRG Pakistan Limited 113,100 113,100 - - - Jotun Powder Coatings Pakistan (Pvt.) Limited 2,200,000 - 2,200,000 -
2,313,100 113,100 2,200,000 -
38.2 Financial instruments by categories Cash and Cash Loans and Available-for- Equivalents advances sale Total
Rupees in Thousands
Financial assets as at June 30, 2013
Long term investments - - 2,506 2,506 Long term deposits and advances - 1,712 - 1,712 Trade debts - 374,229 - 374,229 Other receivables - 3,270 - 3,270 Bank balances 11,438 - - 11,438
11,438 379,211 2,506 393,155
Cash and Cash Loans and Available-for- Equivalents advances sale Total
Rupees in Thousands
Financial assets as at June 30, 2012
Long term investments - - 2,313 2,313 Long term deposits and advances - 757 - 757 Trade debts - 417,265 - 417,265 Other receivables - 20,861 - 20,861 Bank balances 25,213 - - 25,213
25,213 438,883 2,313 466,409
2013 2012 Rupees in thousands
Financial liabilities at amortized cost
Long term finances 287,000 310,000 Trade and other payables 205,688 260,510 Accrued mark up 22,126 23,731 Short term borrowings 583,175 474,351
1,097,989 1,068,592
38.3 Fair values of financial assets and liabilities
Carrying values of all financial assets and liabilities reflected in these financial statements approximate to their fair values. Fair value is determined on the basis of objective evidence at each reporting date.
notes to and forming part of the financial statementsFOR THE YEAR ENDED JUNE 30, 2013
AnnuAl RepoRt 201367

39. Capital Risk Management
While managing capital, the objectives of the Company are to ensure that it continues to meet the going concern assumption, enhance shareholders’ wealth and meets stakeholders’ expectations. The Company ensures its sustainable growth viz. maintaining optimal capital structure, keeping its finance cost low, exercising the option of issuing right shares or repurchase shares, if possible, selling surplus property, plant and equipment without affecting the optimal operating level and regulating its dividend payout thus maintaining smooth capital management.
In line with the industry norm, the Company monitors capital on the basis of the gearing ratio. This ratio is calculated as net debt divided by total capital. Net debt is calculated as total borrowings (including current and non current) less cash and cash equivalents. Total capital is calculated as equity as shown in the balance sheet plus net debt.
As at the balance sheet date, the gearing ratio of the Company was worked out as under:
2013 2012
Rupees Rupees
Total borrowings 870,174,977 784,350,860 Cash and bank balances (11,437,764) (25,212,894)
Net debt 858,737,213 759,137,966 Equity 343,516,217 385,642,762
Total capital employed 1,202,253,430 1,144,780,728
Gearing ratio 71.43% 66.31%
40. Plant Capacity and Production 2013 2012
Metric Ton Metric Ton
Actual production 16,095 14,384
The plant production capacity is indeterminable because it is a multi-product plant involving varying processes of manufacturing.
41. Provident Fund Related Disclosures
The Company runs a recognized provident fund (Descon Chemicals Limited Staff Provident Fund Trust) established on April 30, 1987 in which equal contributions are made by the Company and employees.
The fund has been formed to accumulate certain sums to the benefit of employees of Descon Chemicals Limited and their families in the event of employees’ termination of service, retirement or death as provided by the fund rules. Following information is based on un-audited financials of the Fund as at June 30, 2013 and audited financials of June 30, 2012:
2013 2012
Note Rupees Rupees
Total assets of the fund 40,135,777 40,991,573 Fair value of the investments 41.2 38,928,725 14,884,475
Percentage of the investments made 96.99% 36.31%
notes to and forming part of the financial statementsFOR THE YEAR ENDED JUNE 30, 2013
DESCON CHEMICALS LIMITED 68

41.1 The cost of above investments amounted to Rs. 38.44 million (2012: Rs. 17.43 million)
41.2 The break-up of fair value of investments is as follows:
2013 2012 2013 2012 Percentage Percentage Rupees Rupees
- Listed securities 30% 10% 11,521,531 1,428,220 - GOP treasury bills 46% - 18,055,523 - - National Saving Certificates 12% 32% 4,725,000 4,725,000 - Term finance certificates 7% 26% 2,535,750 3,946,893 - Unit trust schemes 5% 32% 2,090,921 4,784,362
100% 100% 38,928,725 14,884,475
41.3 The investments out of the provident fund have been made in accordance with the provisions of Section 227 of the Companies Ordinance, 1984 and the rules formulated for that purpose.
42. Number of Employees 2013 2012
Number Number
Employees as at June 30, - Permanent 164 168 - Contractual 26 30
Average employees during the year - Permanent 166 165 - Contractual 32 32
43. Authorization of Financial Statements
These financial statements were authorized for issue on September 30, 2013 by the Board of Directors of the Company.
44. General
Comparative figures are re-arranged / reclassified, wherever necessary, to facilitate comparison. Following re-arrangements / reclassifications have been made in these financial statements for better presentation:
Nature From To Amount
(Rupees)
Expenses shared Administrative Expenses Administrative Expenses 6,783,580 with associates (Salaries, wages and benefits) (Recovery from Associates)
Royalty fee Administrative Expenses Research and Development 1,549,662 (Research and development) (Royalty fee)
CHIEF EXECUTIVE DIRECTOR
notes to and forming part of the financial statementsFOR THE YEAR ENDED JUNE 30, 2013
AnnuAl RepoRt 201369

No. of Shareholding
Shareholders From To Total Shares Held
771 1 100 28,851
621 101 500 181,471
525 501 1,000 450,556
679 1,001 5,000 1,989,318
209 5,001 10,000 1,815,031
69 10,001 15,000 916,178
50 15,001 20,000 926,329
41 20,001 25,000 969,682
18 25,001 30,000 512,920
8 30,001 35,000 265,600
12 35,001 40,000 466,430
9 40,001 45,000 398,195
28 45,001 50,000 1,390,629
6 50,001 55,000 329,000
9 55,001 60,000 528,524
5 60,001 65,000 311,600
6 65,001 70,000 406,000
4 70,001 75,000 291,147
2 75,001 80,000 152,000
6 80,001 85,000 500,500
4 85,001 90,000 349,730
2 90,001 95,000 183,500
11 95,001 100,000 1,098,931
2 100,001 105,000 207,500
2 105,001 110,000 216,628
2 110,001 115,000 225,572
2 120,001 125,000 241,605
1 130,001 135,000 133,000
1 140,001 145,000 140,270
3 145,001 150,000 448,000
2 155,001 160,000 317,009
1 160,001 165,000 165,000
1 170,001 175,000 174,500
1 185,001 190,000 188,000
1 190,001 195,000 190,500
pattern of holding of the shares held by the shareholdersas at june 30, 2013
DESCON CHEMICALS LIMITED 70

No. of Shareholding
Shareholders From To Total Shares Held
2 195,001 200,000 400,000
1 200,001 205,000 203,000
1 205,001 210,000 207,003
1 220,001 225,000 221,000
2 225,001 230,000 451,502
2 235,001 240,000 475,343
3 245,001 250,000 750,000
1 255,001 260,000 260,000
2 270,001 275,000 545,500
2 280,001 285,000 568,500
2 300,001 305,000 606,692
2 305,001 310,000 614,597
1 315,001 320,000 320,000
1 400,001 405,000 402,000
1 445,001 450,000 449,000
1 495,001 500,000 500,000
1 510,001 515,000 513,395
1 655,001 660,000 656,500
1 905,001 910,000 910,000
1 1,015,001 1,020,000 1,018,100
1 1,260,001 1,265,000 1,264,000
1 1,270,001 1,275,000 1,275,000
1 1,340,001 1,345,000 1,345,000
4 4,995,001 5,000,000 20,000,000
1 5,250,001 5,255,000 5,253,640
1 143,235,001 143,240,000 143,238,378
3,152 199,557,856
AnnuAl RepoRt 201371

categories of shareholdersrequired under code of corporate governance as on june 30, 2013
SHAREHOLDING INFORMATIONrequired under code of corporate governance as on june 30, 2013
Number of Categories of shareholders Shareholders Shares Held Percentage
Directors, Chief Executive Officer, 8 164,134,021 82.249 and their spouses and minor childrenNIT and ICP 4 523,208 0.262Banks Development Financial Institutions, Non Banking Financial Institutions 5 241,613 0.121Modarabas and Mutual Funds 1 58 0.000General Public 3095 33,617,823 16.846Joint Stock Companies 35 991,063 0.497Investment Companies 2 796 0.000Pension Funds 1 47,604 0.024Others 1 1,670 0.001
Total 3,152 199,557,856 100%
Sr. No. Name No. of Shares Held Percentage
Associated Companies, Undertakings and Related Parties – – Mutual Funds
1 PRODENTIAL STOCKS FUND LIMITED 58 0.0000 Directors and their Spouse and Minor Children
1 MR. TAIMUR DAWOOD 5,314,252 2.66302 MR. ABDUL RAZZAK DAWOOD 148,492,018 74.41053 MR. FAISAL DAWOOD 5,270,750 2.64124 MR. MUHAMMAD SADIQ 15,001 0.00755 SYED ZAMANAT ABBAS (CDC) 1,000 0.00056 MR. SALMAN ZIKRIA (CDC) 40,000 0.02007 MR. FAROOQ NAZIR (CDC) 1,000 0.00058 MRS. BILQUIS DAWOOD W/O A. RAZZAK DAWOOD (CDC) 5,000,000 2.5055 Executives – 0.0000
Public Sector Companies & Corporations – 0.0000
Banks, Development Finance Institutions, Non Banking Finance Companies, Insurance Companies, Takaful, Modarabas and Pension Funds 289,217 0.1449 Shareholders holding five percent or more voting interest in the listed company 1 MR. ABDUL RAZZAK DAWOOD 148,492,018 74.4105 Dealings in shares by Directors, Executives and their spouses and minor children NIL
DESCON CHEMICALS LIMITED 72
Notice is hereby given that 49th Annual General Meeting of Descon Chemicals Limited will be held on Wednesday, October 30, 2013 at 11.00 am, at Descon Headquarters, 18-Km Ferozepur Road, Lahore, to transact the following business:
ORDINARY BUSINESS
1. To confirm minutes of the last Annual General Meeting of the Company held on October 22, 2012.
2. To receive, consider and adopt the audited financial statements of the Company for the year ended June 30, 2013 together with the reports of Directors’ and Auditors’ thereon.
3. To appoint Auditors and fix their remuneration for the year ending June 30, 2014. (The present auditors M/s. Horwath Hussain Chaudhury & Co., Chartered Accountants, retire and have offered themselves for re-appointment.)
4. To consider and approve the transmission of quarterly accounts of the Company through website.
5. To transact any other business with the permission of the Chair.
By Order of the Board
Lahore (ABDUL SOHAIL)October 08, 2013 Company Secretary
Notes:
1. The share transfer books of the Company shall remain closed from 21-10-2013 to 30-10-2013 (both days inclusive).
2. Member are requested to attend in person along with Computerized National Identity Card (“CNIC”) or appoint some other member as proxy and send their proxy duly witnessed so as to reach the registered office of the Company not later than 48 hours before the time of holding the meeting.
3. Any individual Beneficial Owner of CDC, entitled to attend and vote at this meeting, must bring his / her original CNIC or passport, Account and participant’s I.D. Numbers to prove his / her identity, and in case of proxy it must enclose an attested copy of his / her CNIC or passport. Representatives of corporate members should bring the usual documents required for such purpose.
4. Shareholders are requested to immediately notify change in address, if any, to the Company’s Share Registrar, M/s. Corplink (Private) Limited, Wings Arcade, 1-K, Commercial, Model Town, Lahore and also furnish attested photocopy of their CNIC as per Listing Regulations, if not provided earlier.
notice of ANNUAL GENERAL meeting
AnnuAl RepoRt 201373

NOTES
DESCON CHEMICALS LIMITED 74

form of proxydescon chemicals limited
IMPORTANTThis form of proxy, in order to be effective, must be deposited duly completed, at the Company’s Registered Office at Descon Headquarters, 18-KM, Ferozepur Road, Lahore not less than 48 hours before the time of holding the meeting.
A Proxy must be member of the Company. Signature should agree with the specimen register with the Company.
Please quote registered Folio / CDC Account numbers
I/We
of
being a member of Descon Chemicals Limited entitled to vote and holder of
ordinary shares, hereby appoint Mr./Mrs./Mst.
of
who is also a member of the Company, as my/our proxy in my / our absence to attend and vote for me / us on my / our behalf at the Forty Ninth Annual General Meeting of the Company to be held at Descon Headquarters, 18-Km, Ferozepur Road, Lahore on Wednesday, October 30, 2013 at 11:00 hours and at any adjournment thereof.
As witness my / our hand this day of 2013
Signed by the said in the presence of
(Member’s Signature)
Place
Date (Witness’s Signature)
Affix Rs. 5/-
Revenue Stamp which must be cancelled
either by signature over it or by some other
means
AnnuAl RepoRt 201375


IF UNDELIVERED PLEASE RETURN TODESCON CHEMICALS LIMITED
LAHOREDESCON HEADQUARTERS,18 KM FEROZEPUR ROAD,LAHORE, PAKISTAN.T : +92 42 3 5923721-7F : +92 42 3 5923732E : [email protected]: www.desconchemicals.com
www.descon.com