moving from research to public policy - … · moving from research to public policy steven p....
TRANSCRIPT

Moving from Research to Public Policy
Steven P. Wallace, Ph.D.Associate Director
UCLA Center for Health Policy Research;Professor & Chair
Department of Community Health Sciences;UCLA Fielding School of Public Health
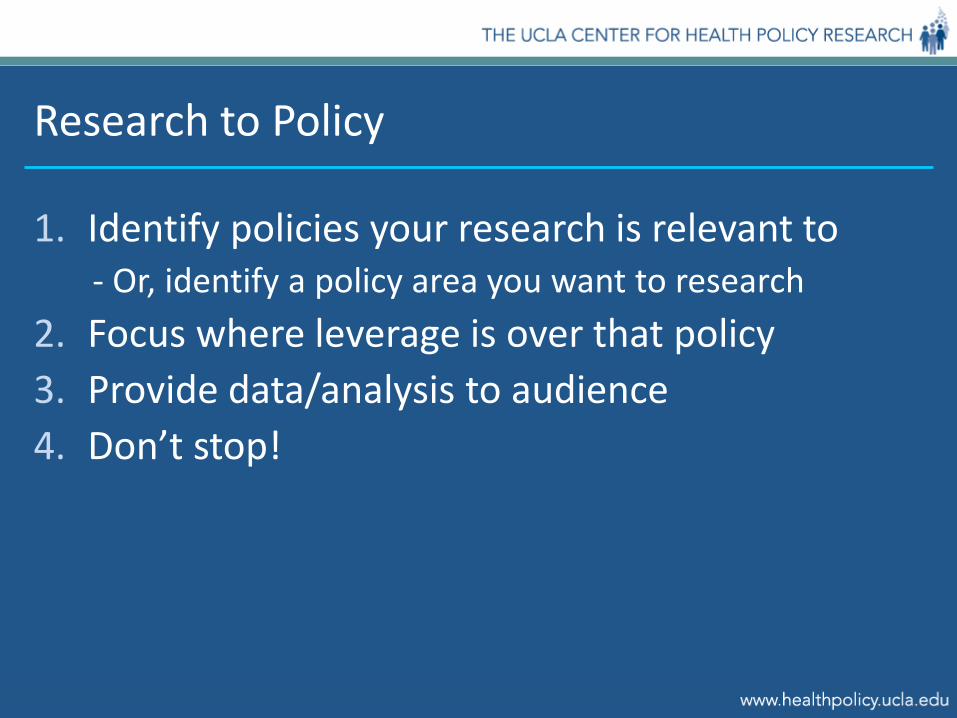
Research to Policy
1. Identify policies your research is relevant to- Or, identify a policy area you want to research
2. Focus where leverage is over that policy3. Provide data/analysis to audience4. Don’t stop!

Where are your immigrant health policy issues handled?
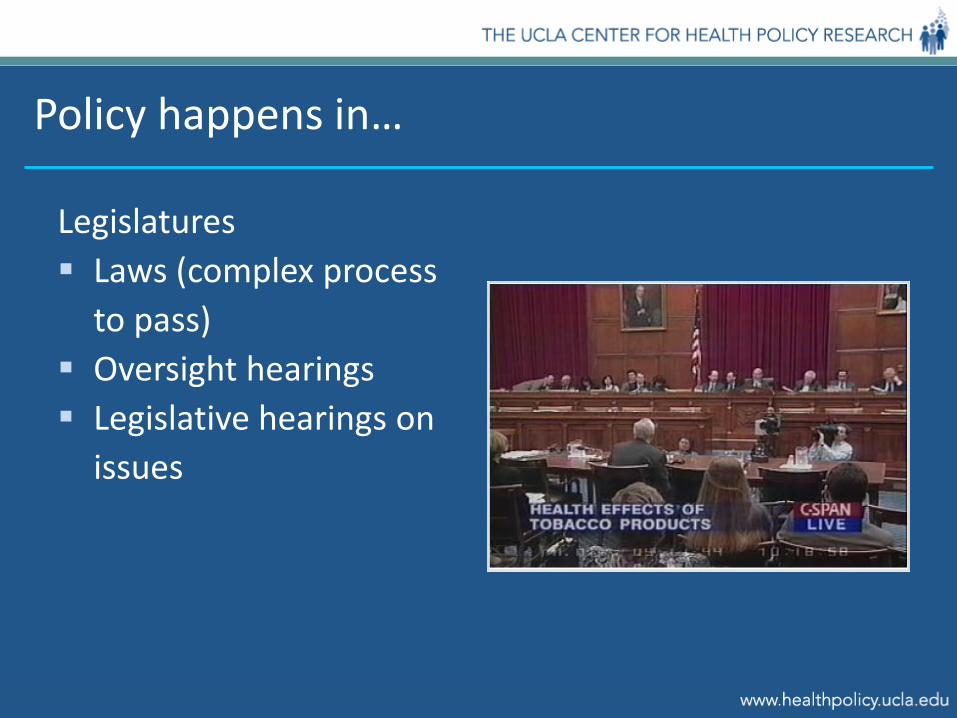
Policy happens in…
Legislatures Laws (complex process
to pass) Oversight hearings Legislative hearings on
issues

Policy also happens in…
Agencies (administrative policy) DHHS Medicaid administrative
offices County health departments Licensing/ certification
boards Consumer protection offices

Agencies are part of the executive branch
President Trump signs executive order on building a border wall, 1/26/17

Policy further happens in…
Courts Federal State Municipal
Blocking Trump’s travel ban from 6 mostly Muslim countries

What data are useful?

What shapes policies?
• Cost• Ideology (especially in
immigration)• Influence from donors &
others with influence• Personal experience• Legislative politics, e.g.
trading votes, compromises, leadership pressures
• DATA!

Make empirical evidence relevant in policy process
Data alone don’t change policy Reduces uncertaintyProvides evidence of the costs involvedSuggest parameters of the size, change, and impact
of issuesIndicates potential efficacy of proposalsCombines with other forces: administrative complexity,
political pressure to change (or not), competing priorities, etc

Research and data analysis for policy impact
What does it take to get data to policy? Receptivity by policy actors Data and evidence relevant to
policy decisions Easily accessed channels of
communication Formats accessible to policy
audiences Creating body of evidence that
stakeholders and interest groups accept

“Ideal” Policy Process
https://www.cdc.gov/policy/analysis/process/index.html
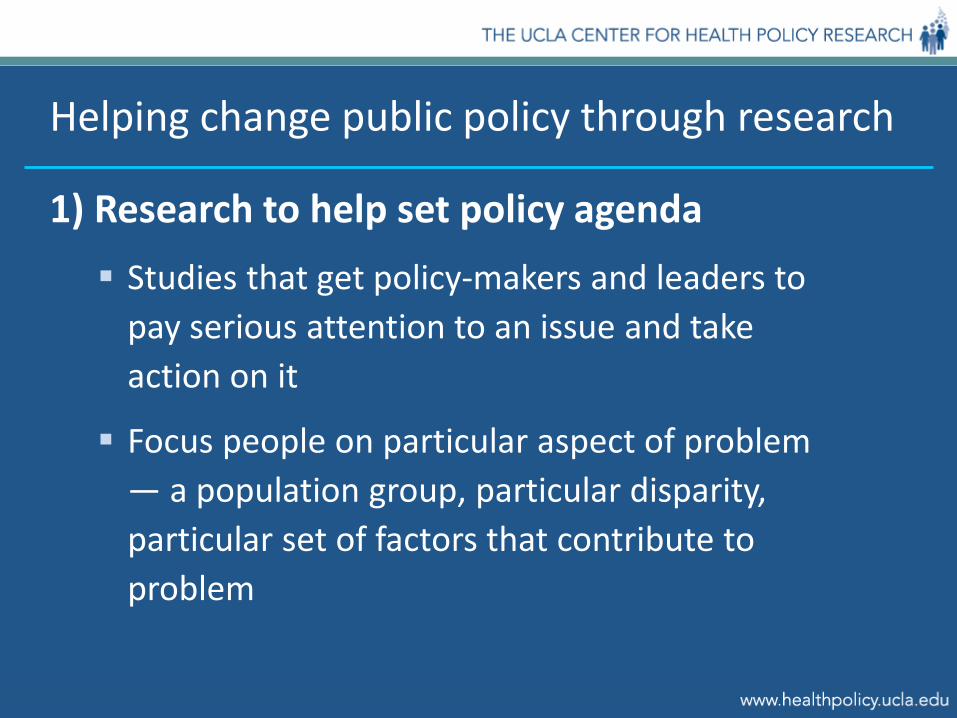
Helping change public policy through research
1) Research to help set policy agenda Studies that get policy-makers and leaders to
pay serious attention to an issue and take action on it
Focus people on particular aspect of problem — a population group, particular disparity, particular set of factors that contribute to problem

First steps in helping change public policy through research
Frame the problem Identify, describe, publicize the
problem Frame the issue, e.g. “law
enforcement” vs. “public health” – shapes potential solution
If framing and public debate are purely ideological, evidence-based arguments carry little weight

Framing – drives legitimacy of issue & solutions
Illegal alien vs Undocumented immigrant vs Unauthorized worker
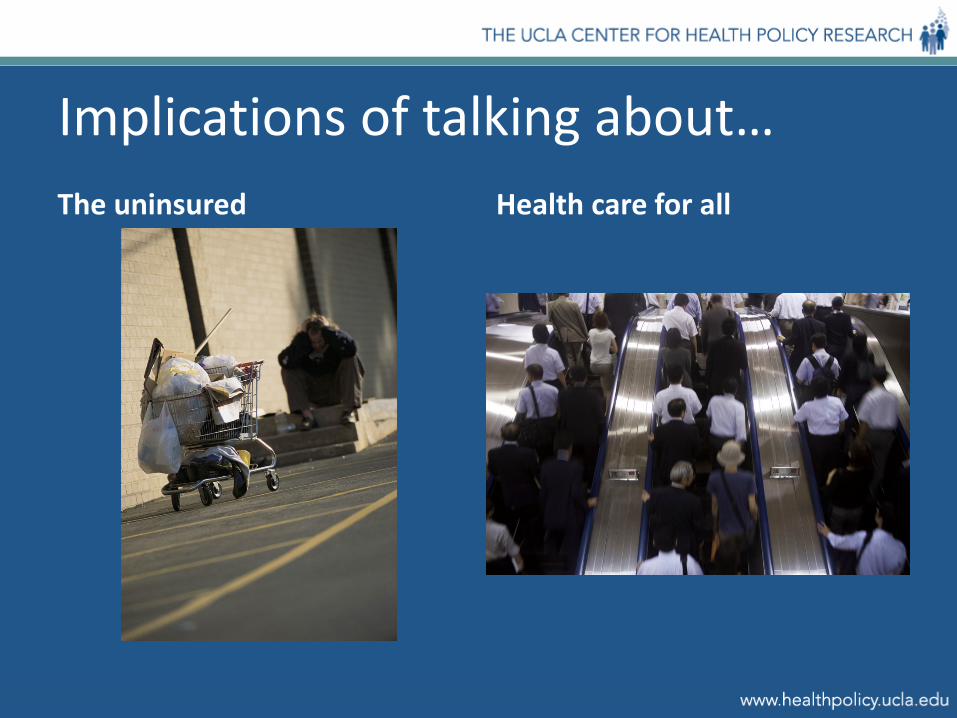
Implications of talking about…The uninsured Health care for all
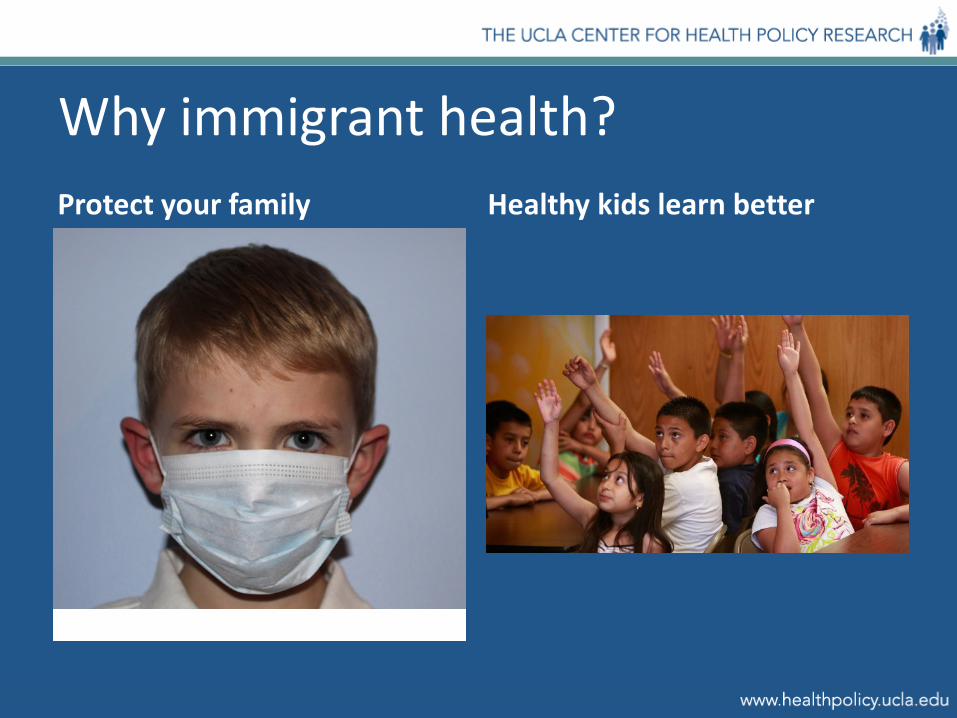
Why immigrant health?Protect your family Healthy kids learn better

Helping change public policy through research
2-3) Research to help identify solutions Identify practical
steps to address problem Offer solutions to
potential barriers Cost out solution;
secondary benefits

Helping change public policy through research
4) Provide data to select solution Testify in legislative
hearing (try not to endorse a particular bill) Provide data for
legislative findings, CBO analysis
Helping change public policy through research
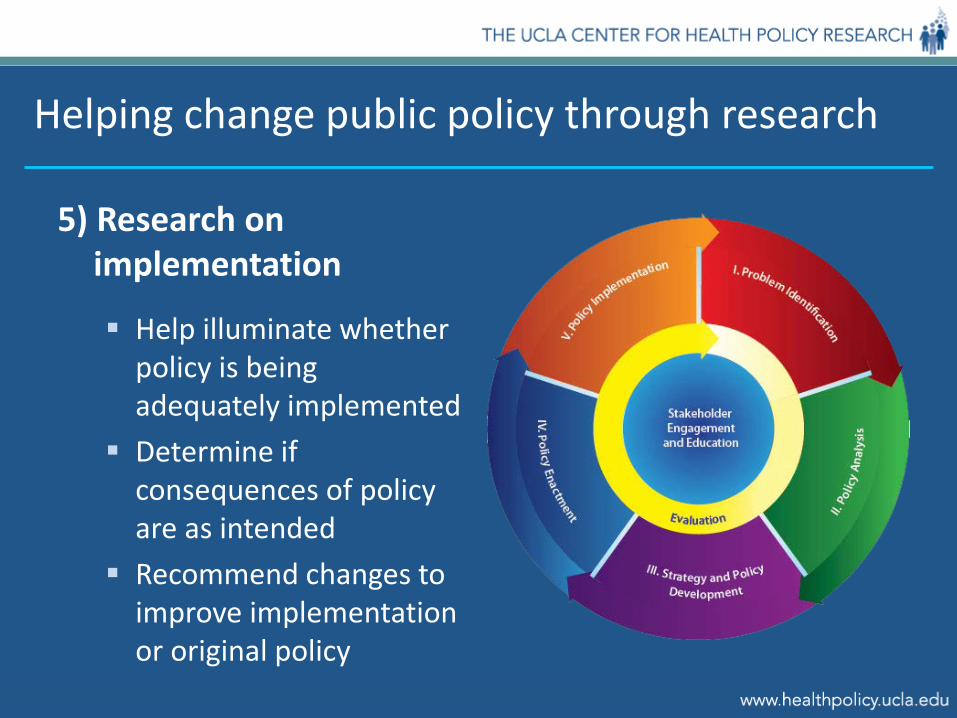
5) Research on implementation
Help illuminate whether policy is being adequately implemented
Determine if consequences of policy are as intended
Recommend changes to improve implementation or original policy

Researchers encourage policy audiences to use data and research evidence
Policy audiences care about policy issues and relevant actionable factors Does it inform debate on the issues they care
about? Does it support their policy goals? Does it identify policy relevant factors that will
make a difference? Credible role as a policy researcher Researcher, educator, not advocate

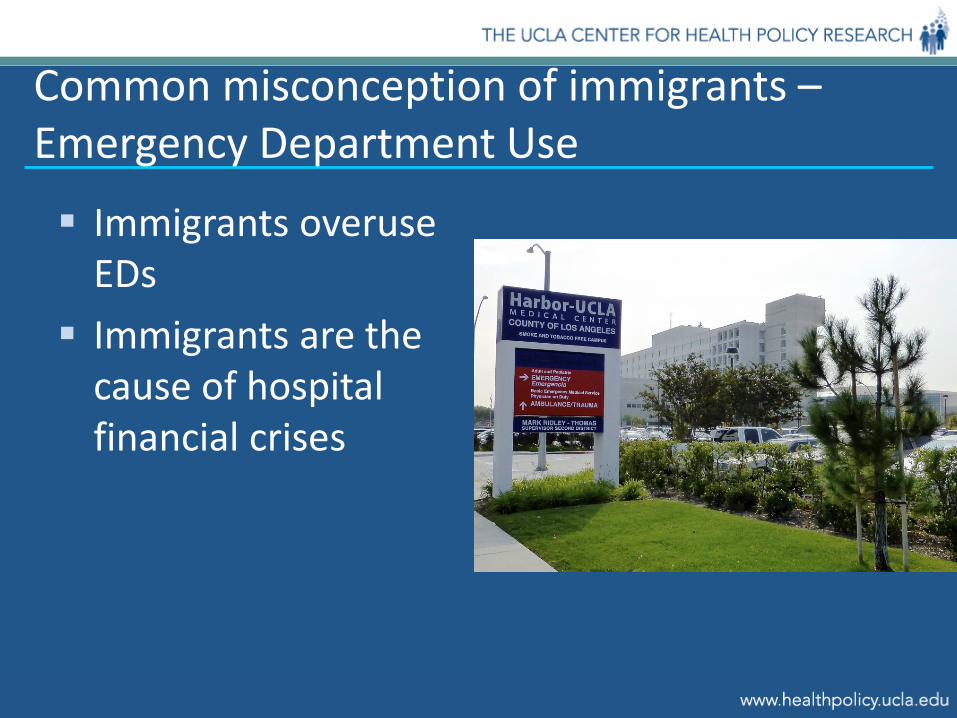
Common misconception of immigrants –Emergency Department Use
Immigrants overuse EDs Immigrants are the
cause of hospital financial crises

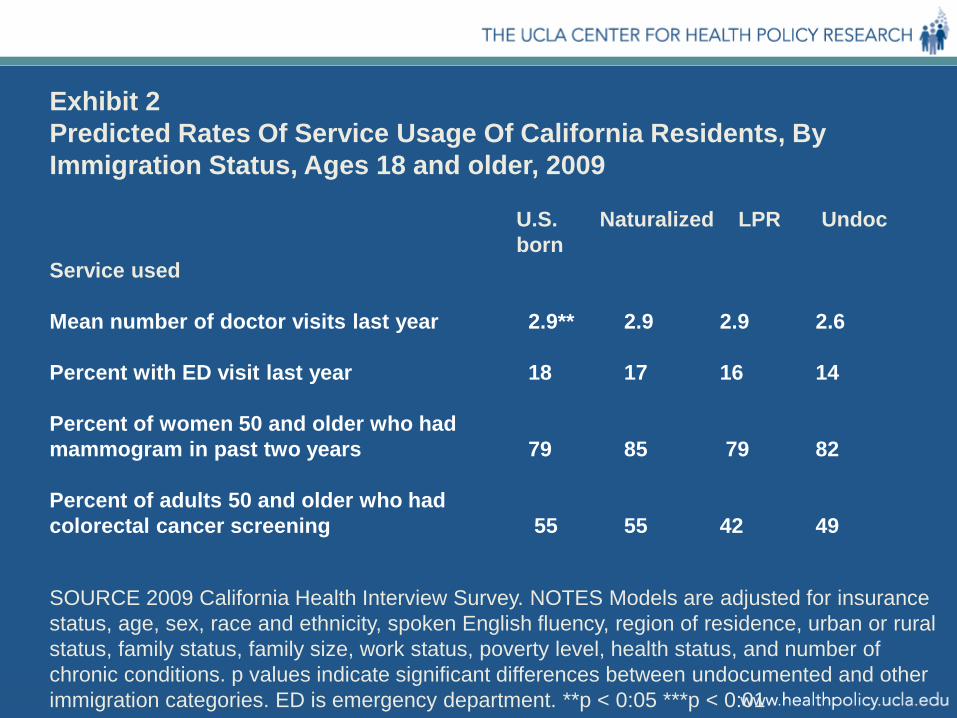
Exhibit 2Predicted Rates Of Service Usage Of California Residents, By Immigration Status, Ages 18 and older, 2009
U.S. Naturalized LPR Undocborn
Service used
Mean number of doctor visits last year 2.9** 2.9 2.9 2.6
Percent with ED visit last year 18 17 16 14
Percent of women 50 and older who hadmammogram in past two years 79 85 79 82
Percent of adults 50 and older who hadcolorectal cancer screening 55 55 42 49
SOURCE 2009 California Health Interview Survey. NOTES Models are adjusted for insurance status, age, sex, race and ethnicity, spoken English fluency, region of residence, urban or rural status, family status, family size, work status, poverty level, health status, and number of chronic conditions. p values indicate significant differences between undocumented and other immigration categories. ED is emergency department. **p < 0:05 ***p < 0:01
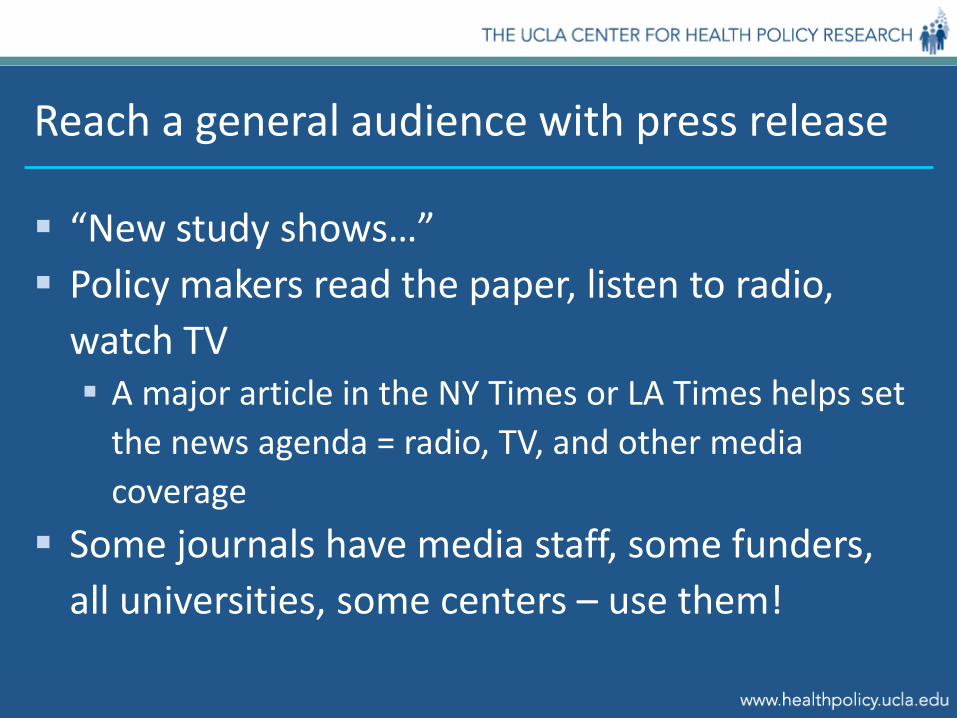
Reach a general audience with press release
“New study shows…” Policy makers read the paper, listen to radio,
watch TV A major article in the NY Times or LA Times helps set
the news agenda = radio, TV, and other media coverage
Some journals have media staff, some funders, all universities, some centers – use them!
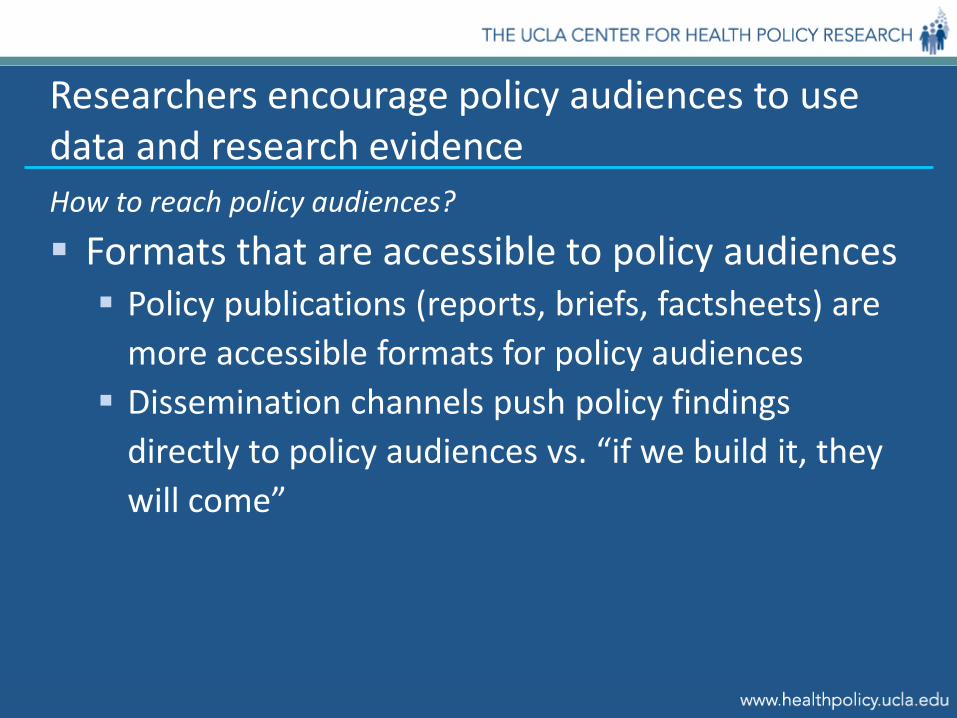
Researchers encourage policy audiences to use data and research evidenceHow to reach policy audiences?
Formats that are accessible to policy audiences Policy publications (reports, briefs, factsheets) are
more accessible formats for policy audiences Dissemination channels push policy findings
directly to policy audiences vs. “if we build it, they will come”

Give your results more impact
Journal articles follow form required by particular journal and by academic convention Policy publications can speak directly to
policy audiences Make it relevant Make it brief Make it sing!
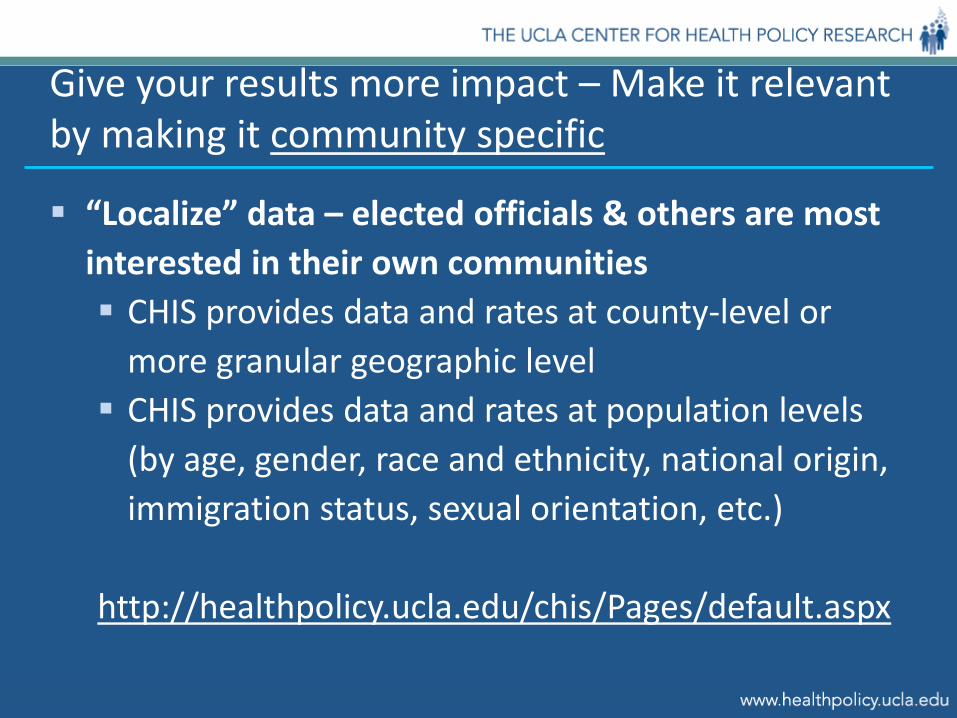
Give your results more impact – Make it relevant by making it community specific
“Localize” data – elected officials & others are most interested in their own communities CHIS provides data and rates at county-level or
more granular geographic level CHIS provides data and rates at population levels
(by age, gender, race and ethnicity, national origin, immigration status, sexual orientation, etc.)
http://healthpolicy.ucla.edu/chis/Pages/default.aspx

Give your results more impact – Make it relevant by making it community specific
No local data? Take national data and “extrapolate” it to local area Take data from similar population and apply it to
yours California is not typical of the U.S. Alameda county is not the same as the whole state ? Should you go to the effort to create legislative
district analyses?
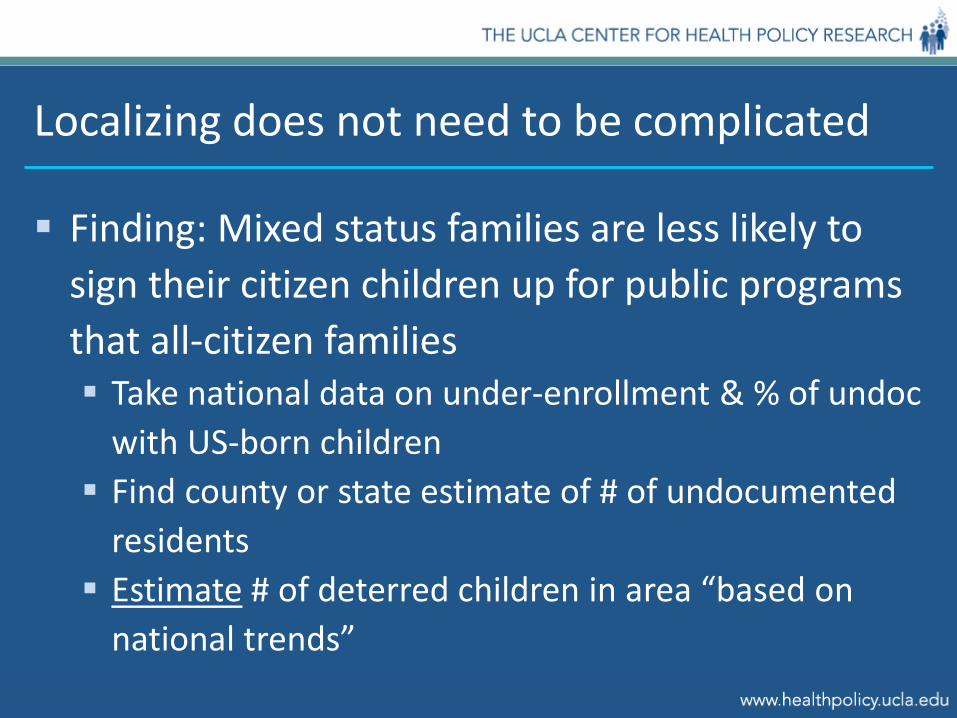
Localizing does not need to be complicated
Finding: Mixed status families are less likely to sign their citizen children up for public programs that all-citizen families Take national data on under-enrollment & % of undoc
with US-born children Find county or state estimate of # of undocumented
residents Estimate # of deterred children in area “based on
national trends”
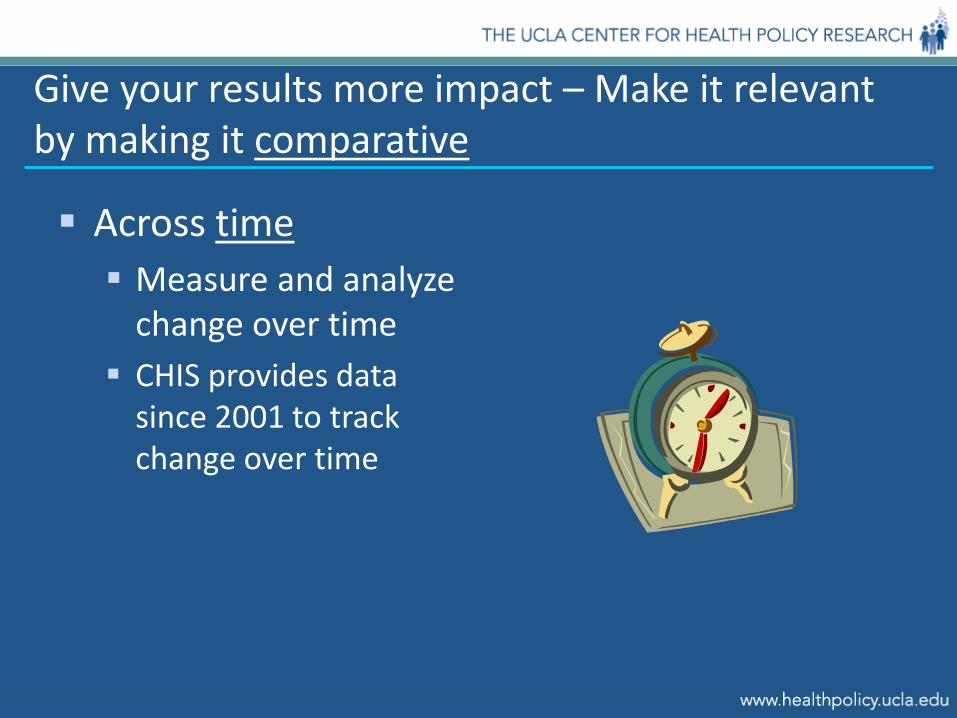
Give your results more impact – Make it relevant by making it comparative
Across time Measure and analyze
change over time CHIS provides data
since 2001 to track change over time

Give your results more impact – Make it relevant by making it comparative
Across space Compare rural to
urban areas CHIS oversamples rural;
has large urban, suburban, rural samples Compare counties CHIS 41 individual
counties and some subcounty areas
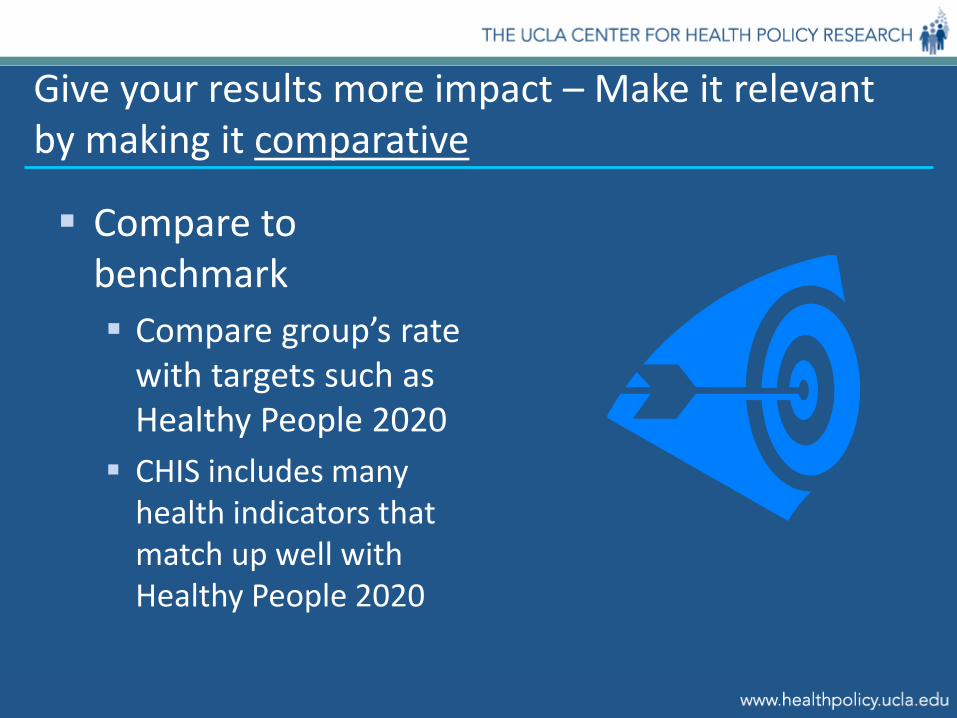
Give your results more impact – Make it relevant by making it comparative
Compare to benchmark Compare group’s rate
with targets such as Healthy People 2020 CHIS includes many
health indicators that match up well with Healthy People 2020
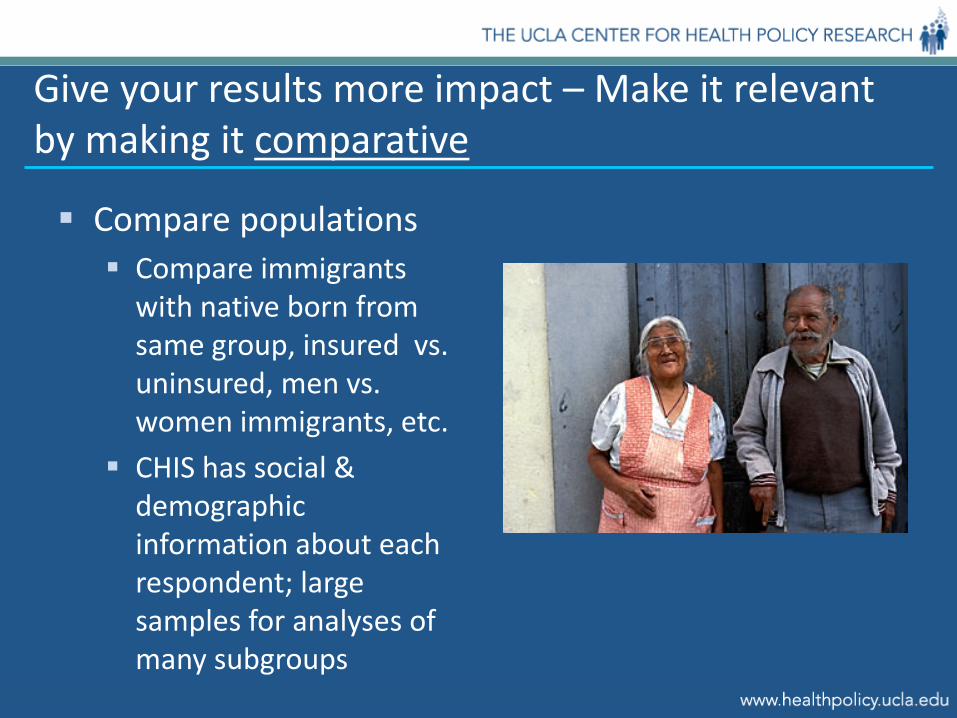
Give your results more impact – Make it relevant by making it comparative
Compare populations Compare immigrants
with native born from same group, insured vs. uninsured, men vs. women immigrants, etc.
CHIS has social & demographic information about each respondent; large samples for analyses of many subgroups

Give your results more impact – Make it relevant by making it sing!
Keep the data presentation simple! Tell a story with your data Start with conclusion The narrative should describe: the problem the conclusions the supporting data
The narrative should lead directly to the policy conclusion

Give your results more impact – Make it relevant by making it sing!
Use charts and graphs to make it easy to scan & pretty to look at Bars compare totals or rates across groups Lines demonstrate trends Pies show parts of a whole (distributions) Tables display precise data

Diabetes rates by place of birth, CA 2009
Diagnosed with diabetesCountry of
birth Est. N Col% Row%
United States 15,393,000 54.3 5.4%
Mexico 3,847,000 27.6 11.0%Central America 769,000 6.0 12.0%Other Latin America 263,000 1.1 6.5%Asia and Pacific Islands 2,490,000 8.3 5.1%
Europe 441,000 1.2 4.3%
Other 272,000 1.5* 8.1%
TOTAL 23,476,000 100.0
5.4%
11.0%12.0%
6.5%5.1%4.3%
8.1%
Data from 2009 California Health Interview Survey

Give your results more impact – Make it relevant by making it sing!
Keep it simple
Make comparisons “intuitive” If something is increasing, show it going up!
Make comparisons stand out Show greatest proportional differences
Don’t put too much in a slide Make just 1 to 3 points per slide (not like this one!)
Give your results more impact – Disseminating research results to policy audiences
Discuss policy implications in reports, articles, and public meetings
Identify how specific public policies (or absence of policies) affect outcomes Death, disease, health care access, $$ Poor access to fresh produce linked to lower
consumption of fruits and vegetables Living near freeways linked to higher asthma
Identify specific public policies needed to address problem

Give your results more impact – Disseminating research results to policy audiences
Share results with affected communities and populations, especially those that participated in research
“Giving back” to community Informs and educates Engages them in addressing the issue
Getting community’s input on interpretation of results Improves accuracy and relevance of study
conclusions and recommendations

Give your results more impact – Disseminating research results to policy audiences
Disseminate to policy makers Create and send brief, readable summary of
research and results with rec’s (e.g., policy brief) Make issues concrete and personal
Bring study findings to attention of groups that can influence policy makers
Reach public and policy makers through news media
Increase credibility and reach policy analysts by publishing in journals
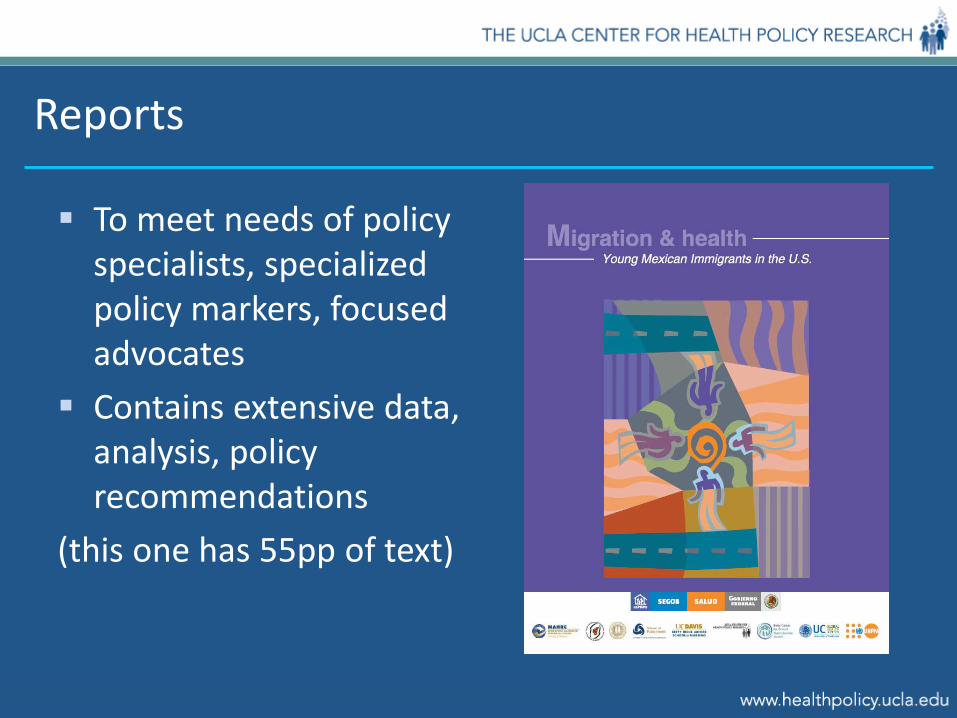
Reports
To meet needs of policy specialists, specialized policy markers, focused advocates
Contains extensive data, analysis, policy recommendations
(this one has 55pp of text)

Policy Briefs
For those interested in policy issue but not deeply involved
More focused & “digested” in 6-8 pages
3-5 charts

Fact sheet
Makes a focused point and/ or presents data on a single issue
2 pages Quick to produce,
disseminate
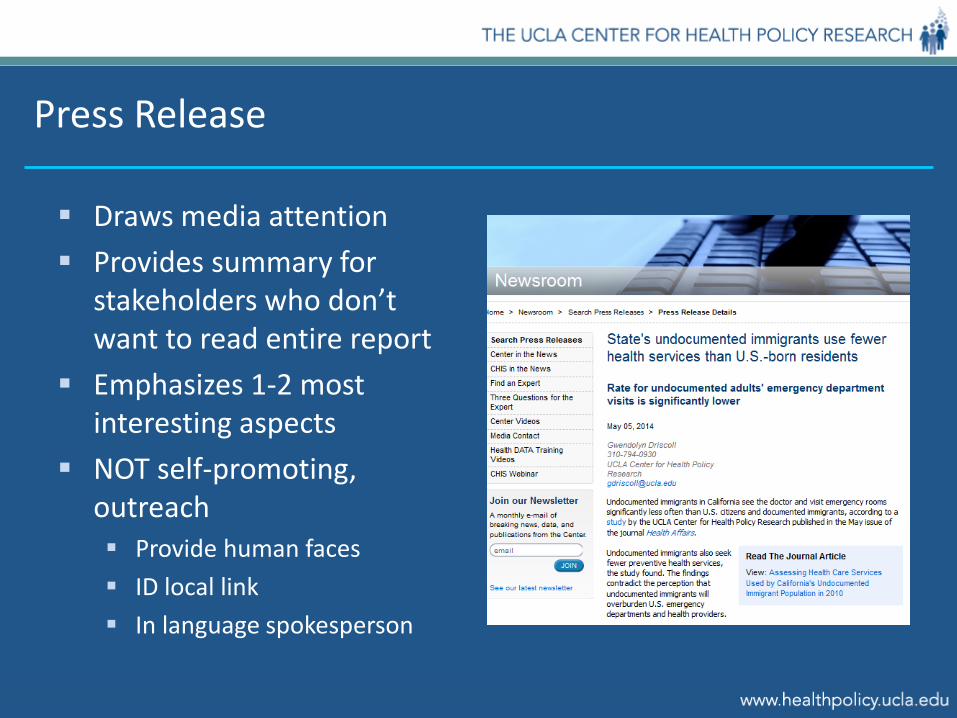
Press Release
Draws media attention Provides summary for
stakeholders who don’t want to read entire report
Emphasizes 1-2 most interesting aspects
NOT self-promoting, outreach Provide human faces ID local link In language spokesperson

Media (p.1, above the fold)
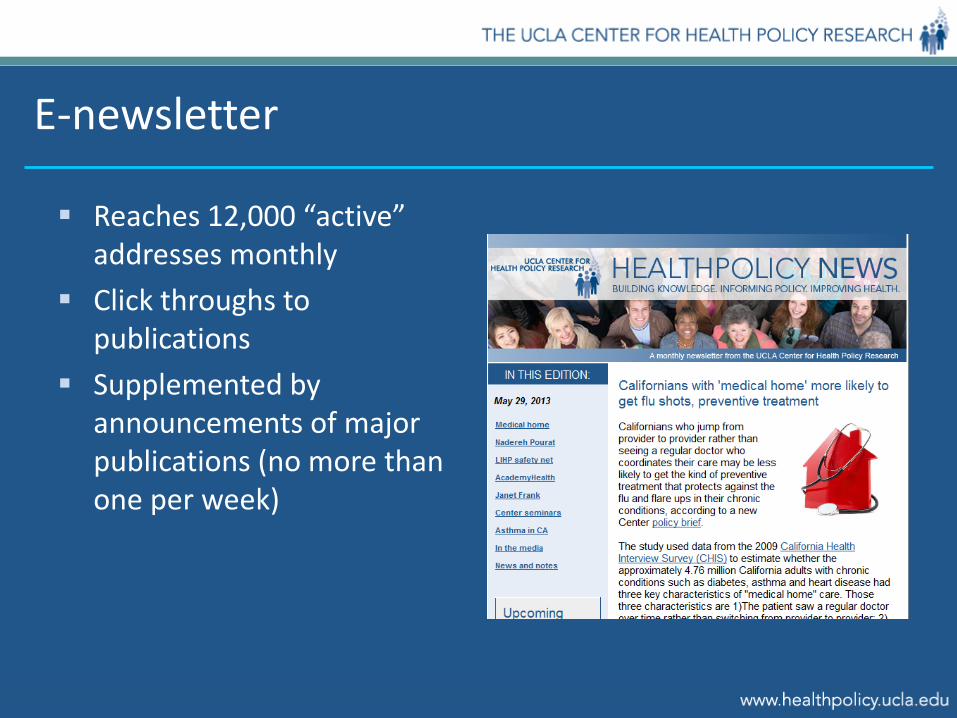
E-newsletter
Reaches 12,000 “active” addresses monthly
Click throughs to publications
Supplemented by announcements of major publications (no more than one per week)

Op-ed, editorials
Reach a broader audience Present conclusion with less
data, but link or reference longer reports
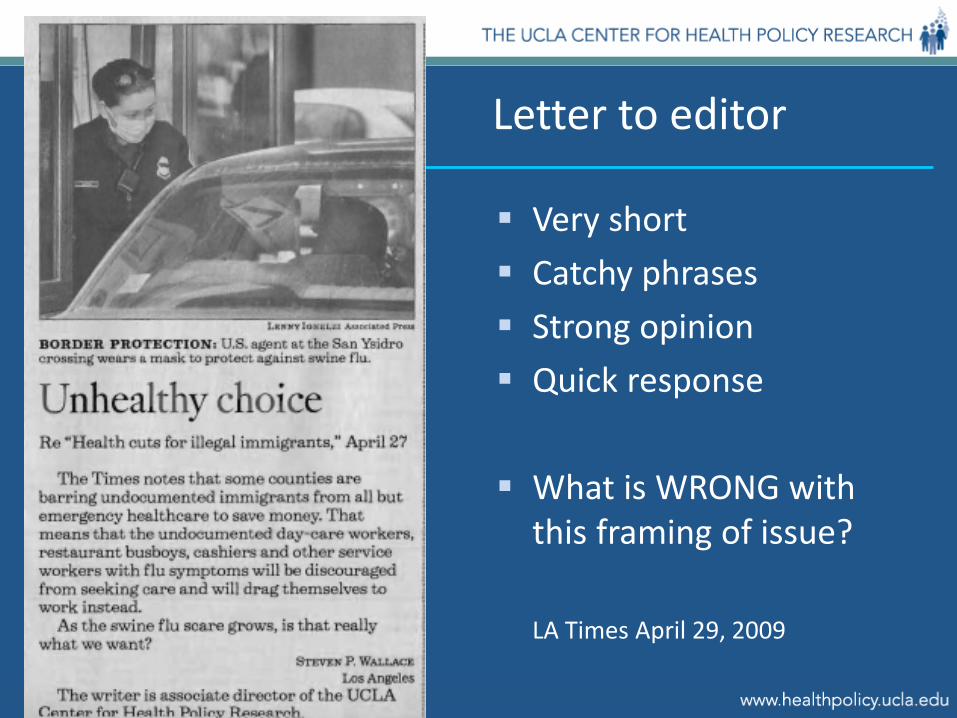
Letter to editor
Very short Catchy phrases Strong opinion Quick response
What is WRONG with this framing of issue?
LA Times April 29, 2009

Is this better?

Web page with updates
http://healthpolicy.ucla.edu/ElderIndex
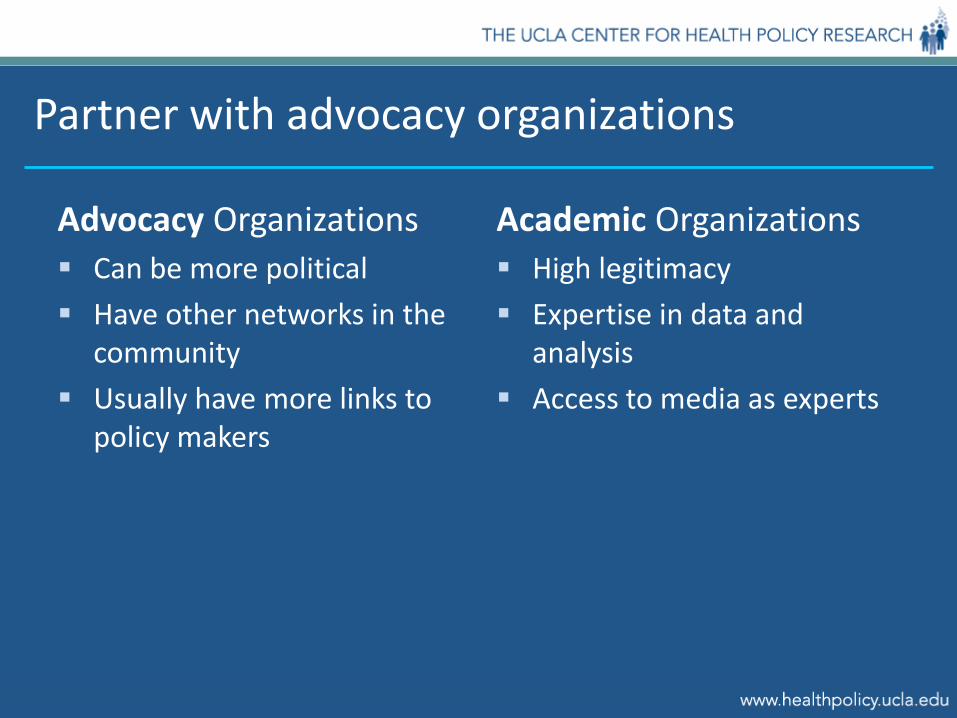
Partner with advocacy organizations
Advocacy Organizations Can be more political Have other networks in the
community Usually have more links to
policy makers
Academic Organizations High legitimacy Expertise in data and
analysis Access to media as experts

Having an impact on policy is a marathon
You can’t stop Most policy change is
incremental and creates constant need for data
Big policy change can happen unpredictability and your data has to be ready
Existing policy is always subject to evaluation and revision
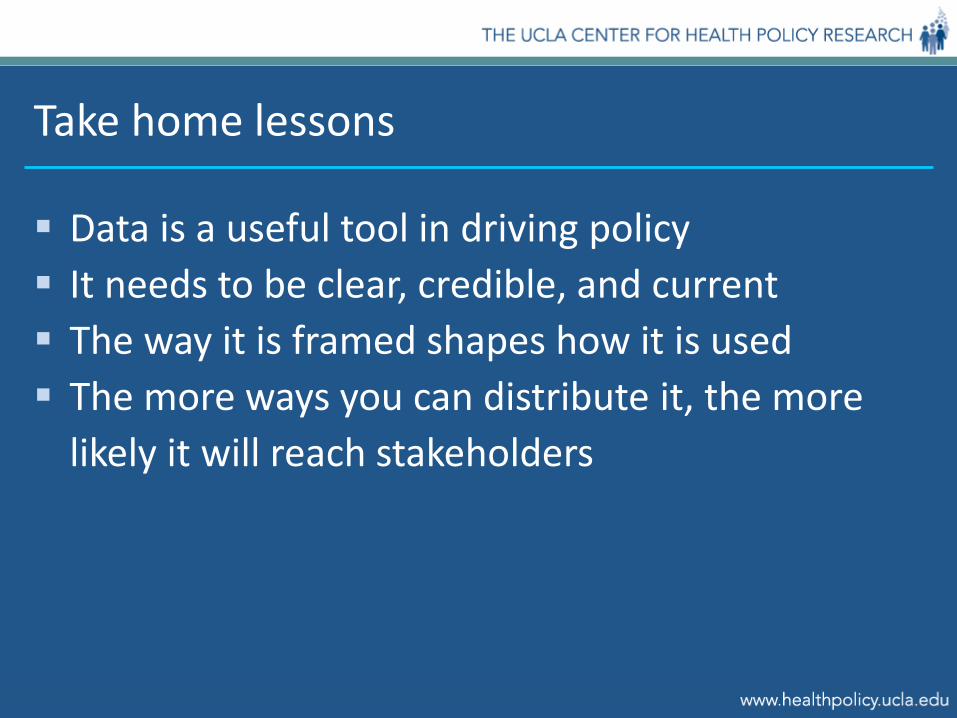
Take home lessons
Data is a useful tool in driving policy It needs to be clear, credible, and current The way it is framed shapes how it is used The more ways you can distribute it, the more
likely it will reach stakeholders

Conclusion: Research can help change public policy to improve public health
Data needs to be part of larger policy process with clear policy goals and strategy
Use creative and appropriate data methods To get data (CHIS, other good data, original) To make data relevant (analysis) To make it understood and interesting to target
audiences (presentation): Make it sing! Disseminate research findings Include explicit policy discussions To communities that are affected and participated To policy makers
Immigration Resources
Migration Policy Institute - www.migrationpolicy.org Pew Hispanic Center - www.pewhispanic.org Health Initiative of the Americas - hia.berkeley.edu Immigration Policy Center
www.immigrationpolicy.org/issues/health USC Center for the Study of Immigrant Integration
csii.usc.edu International Organization for Migration
www.iom.int/jahia/Jahia/lang/en/pid/1 Center for Immigration Studies (anti-immigration)
www.cis.org

Thank you
immigrant rights march