moving public power forward
TRANSCRIPT
COMMUNITY-DRIVEN
SOLUTIONS FOR INDUSTRY
TRANSFORMATION
MOVINGPUBLIC POWERFORWARD

2 MOVING PUBLIC POWER FORWARD
PREPARED BY PAUL ZUMMO, DIRECTOR, POLICY RESEARCH AND ANALYSIS AMERICAN PUBLIC POWER ASSOCIATION
The American Public Power Association is the voice of not-for-profit, community-owned utilities that power 2,000 towns and cities nationwide. We represent public power before the federal
government to protect the interests of the more than 49 million people that public power utilities serve, and the 96,000 people they employ. More at www.PublicPower.org.
©2021 American Public Power Association www.PublicPower.org

3 MOVING PUBLIC POWER FORWARD
EXECUTIVE SUMMARY
Decarbonizing the electric sector allows for decarbonizing other sectors.Although the electric sector is not the largest source of CO2 emissions across our economy, decarbonizing the electric sector is seen by many as a critical first step in paving the way for decarbonization of other sectors, such as transportation and home heating.
As the backbone of many industries and daily life for all Americans, electric utilities are critical players in not only how the electric industry will shift, but how other sectors can move forward as well.
Public power utilities, which are not-for-profit and locally owned, have already been laying the groundwork for this transition. From working with their communities to shift their generating mix, to supporting economy-wide decarbonization through transportation electri-fication and smart city efforts, and redesigning rates that support this transformation, public power has many notable examples of how the electric sector is embracing change.
Public power utilities are working with their communities to reduce carbon emissions.While often exempted from complying with state renewable portfolio standards, public power utilities are still setting clean energy goals that align with the interests of their com-munities and the attributes of their area. Util-ities including Orlando Utilities Commission in Florida, the Sacramento Utility District in California, and Austin Energy in Texas have robust integrated resource plans that look to shift to carbon-free emissions within the next few decades.
Looking at overall capacity ownership figures, one would notice that public pow-er utilities do not own a significant portion of renewable capacity. This is due in large part to public power’s inability to directly take ad-vantage of the investment tax credit for these resources, as non-profit entities. Instead, they have engaged in power purchase agreements with third parties to ensure these resources are part of their portfolios. While exact figures are not collected, a pair of APPA surveys found at least 22,000 megawatts in contracted or planned solar and wind capacity PPAs in 2020 and 2021. This figure, which is likely substan-
Whether from advancements in technology, changes
in costs, interest from the community and large
customers, or pressure from state and local
government, the electric sector has been making
major changes to reduce carbon dioxide and other
greenhouse gas emissions. Between 2005 and 2019, total electric sector CO2
emissions declined 33%, despite a 2% increase in generation.

4 MOVING PUBLIC POWER FORWARD
tially lower than reality, would suggest that public power has a stake in at least 16% of the total utility-scale wind and solar capacity in the United States.
Apart from shifting their resource mix, public power utilities are also working to explore the next generation of advanced energy technolo-gies. Some examples include:
Public power utilities forge community partnerships to accelerate this energy transition.A shift to a decarbonized economy and in-creased electrification presents both oppor-tunities and challenges for electric utilities. Challenges can include burdens on the grid from load that is tougher to manage or pre-dict, which can lead to decreased reliability or increased price volatility.
Among potential challenges is the need to ensure that certain communities are not left out of the transition. Without inclusion from all customer segments, especially those in histor-ically underserved communities, such pro-grams could further widen disparities in access to, and benefits from, clean energy initiatives.
While utilities play a central role in the transformation, they are not alone in making changes. Utilities are exploring many aspects of this industry transformation, including how to engage with and partner with others from across the community.
l The City of Healdsburg, California has developed the largest floating solar array in the U.S.
l Salt River Project in Arizona is developing projects to bring its total solar capacity above 2,000 MW by 2035, with many new projects getting paired with energy storage. One project features a battery energy storage system capable of dispatching 1 gigawatt-hour of power.
l The Northern California Power Agency is exploring configuring a natural gas plant to incorporate a hydrogen fuel mix.
l City Water, Light and Power in Springfield, Illinois is part of a study testing carbon capture at a coal plant.
l Idaho Falls Power is working with Idaho National Laboratory to develop black start capability with small hydropower plants.
l Grant County Public Utility District in Washington is investigating advanced nuclear reactor technology at two locations.
l The Virgin Islands Water and Power Authority is deploying a series of microgrids across the islands.

5 MOVING PUBLIC POWER FORWARD
Designing rates and building an advanced grid are critical to the foundation of becoming a utility of the future.Rate design is one of the most important aspects of building the utility of the future. Changing from a traditional rate structure, which customers have become familiar with for over a century, to a dynamic design cannot be too abrupt. Utilities should be laying out a long-term strategy that takes into account future changes to the grid, costs associated with those changes, and customer needs and expectations.
Several utilities are moving to more dynam-ic, time-varying rates. One example is Fort Collins Utilities in Colorado, which now has time-of-use rates for all residential custom-ers. In addition to reducing customers’ bills, the rates have helped the utility to decrease wholesale electricity expenditures and lower carbon emissions. Other utilities have lever-aged TOU rates and other pricing structures to manage electric vehicle charging.
Some utilities are taking advantage of the data analytics from advanced metering infra-structure to predict and target opportunities for increased savings. For example, Algona Mu-
nicipal Utilities in Iowa used its AMI to develop a customer clustering tool to better analyze customer load shapes and attributes.
Lastly, updates including to control centers and transmission lines will help the electric sector to manage the more complex future grid and keep it secure.
The attributes that define public power position these utilities for success in managing the future grid.As locally owned and governed entities, public power utilities have strong ties to their commu-nities. That makes tackling some of the chal-lenges in transformation easier. In addition, the regulatory regime under which public power operates — governed by local boards and/or city councils rather than under the jurisdiction of state commissions — allows them to make changes more quickly and change that are more suitable for the needs and desires of their customers. While public power utilities will take different paths to the future, they will continue to demonstrate their value to the local commu-nity.
l Glendale Water and Power in California provides credits to residential and commercial customers for enrolling in a demand response program. The program allows the utility to automatically adjust participants’ smart thermostats during peak events, reducing the utility’s overall peak demand.
l Seattle City Light in Washington developed a clean transportation electrification plan with the city of Seattle that aims to increase use of zero emissions vehicles across the city. The plan emphasizes engagement with environmental justice communities to support an equitable implementation.
l SMUD in California incents home builders to construct all-electric homes, with added incentives for building homes with induction cooking appliances.
l CPS Energy in San Antonio, Texas has a partnership with the city of San Antonio, AT&T, and Itron on a smart streetlight program.
l Imperial Irrigation District in California partnered with Citizens Energy Corporation on a community solar project for customers with low-to-moderate incomes.
Examples include:

6 MOVING PUBLIC POWER FORWARD
INTRODUCTION

7 MOVING PUBLIC POWER FORWARD
While deployment of distributed energy resources, especially rooftop solar and behind-the-meter energy storage, is expected to expand in future years, the
electric grid will continue to be an essential resource for the vast majority of Americans. In 2018, the American Public Power Association published The Value of the Grid1, which explored emerging trends and technologies and the potential disruption of the traditional electric utility business model. This report detailed why wide-spread grid defection, where customers rely completely on their own generation resources, is unlikely due to economic and technical considerations.
The report noted that rooftop solar penetration was forecast to increase consistently in future years, and more recent forecasts affirm the steady growth in solar rooftop penetration.2 What’s more, prices for energy storage continue to decline steadily, making solar plus storage more affordable for customers. At the same time, other considerations – such as the lack of suit-able rooftop space for many customers and unsuitable weather in most regions – make full grid defection im-possible. The electrification of end uses, such as trans-portation and home heating, will contribute to increased electric sales, and therefore will make the electric grid even more indispensable.
With the grid being at the center of the transforma-tion of the electric sector, the report argued that electric utilities would be best positioned to manage the grid of the future because of their collective experience having done so for the past century. Moreover, electric utilities have developed trust with their customers that allows them to better understand their customers’ needs.
Public power utilities are especially well-positioned to manage the grid of the future. Having already es-tablished superior metrics with regards to price and reliability, public power utilities also can take advantage of their relative small size and connectedness to the lo-cal community, as well as their regulatory flexibility and community focus, to develop programs and implement technologies that meet the needs of their custom-ers and address the challenges presented by climate change.
This paper builds upon The Value of the Grid to look more closely at the role public power utilities have already played in leading this energy transition, and to outline pathways for continued change. It begins by exploring the latest developments, including emerging trends in electric vehicle development and research into hydrogen, as well as further development in state renewable portfolio standard (RPS) programs. The second chapter provides a statistical overview of public power, including stats on generation capacity of pow-er purchase agreements, reliability metrics, and rates data. Chapter Three discusses public power and clean energy and provides examples of the many ways public power utilities are incorporating clean energy into their portfolios. The fourth chapter discusses electrifica-tion and smart cities and provides examples of public power programs meant to incent electrification. The final chapter focuses on rates and business models, including case studies of public power experiences with new rate designs, such as time-of-use rates. There is also a discussion of partnerships and collaboration that help public power utilities manage this transition to the future grid.
The case studies presented in this paper merely scratch the surface of what public power utilities are doing to guide their customers into the future.
1 American Public Power Association, The Value of the Grid, 2018. https://www.publicpower.org/resource/value-grid
2 SEIA and Wood Mackenzie Power & Renewables, Solar Market Insight Report 2021 Q2, released June 15, 2021. Accessed at https://www.seia.org/research-resources/solar-market-insight-re-port-2021-q2/ Year-over-year growth in the residential market is expected to reach 5 gigawatts (GW) by 2026.

8 MOVING PUBLIC POWER FORWARD
CHAPTER ONE
ELECTRIC SECTOR TRANSFORMATION

9 MOVING PUBLIC POWER FORWARD
Other
Oil
Non-hydro Renewable
Hydro
Gas
Nuclear
Coal
2,000,0001,500,0001,000,000500,000
2005 2020
Figure 1. Electric Generation by Fuel Type, 2005 and 2020 (in gigawatt-hours)
In just the last few years, the electric indus-try has witnessed rapid change. Nowhere is this more visible than in efforts to reduce carbon dioxide (CO2) emissions and deploy carbon free
resources. According to the Energy Information Ad-ministration (EIA), energy-related CO2 emissions have declined by an average of 1% per year since their peak in 2007, despite an increase in the overall population, though they are 1.8% above 1990 levels.3
The electric sector has reduced emissions more than any other part of the energy sector. Between 2005
and 2019, total electric sector CO2 emissions declined 33%, despite a 2% increase in generation.4 The greatest factor in this emissions reduction was the shift from coal to natural gas and to forms of non-carbon generation. EIA calculates that this shift led to a total reduction in carbon emissions of 5,475 million metric tons (MMT), with most of that reduction coming from the switch to natural gas.5
Figure 1 shows the change in the generation mix between 2005 and 2020.
3 EIA, U.S. Energy-Related Carbon Dioxide Emissions, 2019, September 30, 2020, accessed at https://www.eia.gov/environment/emissions/carbon/
4 Ibid.
5 Ibid.

10 MOVING PUBLIC POWER FORWARD
This trend in decarbonization is not slowing down. As shown in our report, America’s Electricity Generation Capacity, 2021 Update6, more than 374,000 megawatts of generation capacity was under development in the United States as of January 2021 – with solar projects accounting for more than 157,000 MW of this capac-ity, wind accounting for 125,906 MW, and natural gas accounting for nearly all the rest. Though not all of this capacity will come online, this represents a significant shift in America’s generation capacity.
Several factors are influencing this turn to clean en-ergy resources.
State and Federal Clean Energy StandardsThirty states, collectively accounting for 58% of U.S. retail sales, have now adopted renewable portfolio stan-dards (RPS), and several states have made their RPS more stringent and/or have pushed up the timeline for compliance (Visit APPA’s Renewable Portfolio Standards Tracker for more details on state and utility RPS).7 While state-level RPS have been a factor in increased pene-tration of renewable generation, according to a Berke-ley Lab report, they have not been the animating factor behind renewable capacity investment in Texas, the Midwest, and Southeast.8 In these areas of the country, economic considerations have been an important factor in renewable capacity investment.
Under the Biden administration, there is renewed in-terest in federal legislation to impose a federal RPS and establish clean energy goals. Even if legislation is not adopted, the conversation is prompting stakeholders to study clean energy options.
Corporate and Investor GoalsAnother factor in the adoption of clean energy resourc-es is corporate focus on Environmental, Social, and Governance (ESG) criteria. Investors are increasingly concerned about the governance structure, social impact, and environmental stewardship of their invest-ments. Partly in response to this investor pressure, large corporations have adopted environmental and low- or zero-carbon goals. Major corporations such as Google and Facebook have contracted for large amounts of re-newable resources or have worked with utilities to either aid in procurement of these resources or to work with the utility as it develops clean energy resources directly.
Advances in Clean Energy TechnologyWhile wind and solar are the major sources of new non-emitting generation, other resources will play a continued and potentially even more significant role in a decarbonized electric grid. Nuclear power remains the leading source of carbon-free electric generation in the United States, accounting for approximately 53% of emissions-free generation, or 19.6% of all electricity generated in 2019. Though several reactors have been shut down in recent years, the increased efficiency of the existing fleets have enabled nuclear power to maintain a steady share of generation. Utilities, including some public power utilities, are exploring the feasibil-ity of using small modular reactors (SMRs) to expand options for nuclear generation in the future (see Chapter Three).
Another resource garnering renewed attention is hydrogen. As a Department of Energy (DOE) report puts it, hydrogen is a “versatile energy carrier and chemi-cal feedstock” that can “unite all of our nation’s energy resources – renewables, nuclear, and fossil fuels” to en-able innovation both in energy production and end uses to decarbonize multiple energy sectors.9 Hydrogen has
6 American Public Power Association, America’s Electricity Genera-tion Capacity, 2021 Update. www.publicpower.org/resource/ameri-cas-electricity-generating-capacity
7 Galen Barbose, U.S. Renewables Portfolio Standards 2021 Status Update: Early Release, Lawrence Berkeley Lab, February 2021, p. 9. https://emp.lbl.gov/publications/us-renewables-portfolio-stan-dards-3.
8 Barbose, p. 19
9 U.S. Department of Energy, Department of Energy Hydrogen Pro-gram Plan, November 2020, p. 4. www.hydrogen.energy.gov/pdfs/hydrogen-program-plan-2020.pdf

11 MOVING PUBLIC POWER FORWARD
multiple uses, and “can be used to store, move, and de-liver low- or no-carbon energy to where it is needed.”10 Current hydrogen demand is 10 MMT/year, but DOE projects that demand can grow to 41 MMT/year in the next 30 years.11
Much of the interest in hydrogen is in green hydro-gen, or hydrogen produced from non-fossil resources. Green hydrogen is created through electrolysis of water with renewables, steam methane reformation of biogas, or “thermal conversion or gasification of organic matter and other waste streams.”12 While green hydrogen con-stitutes a small portion of hydrogen used in the energy sector, its potential as a source of transportation fuel and stored energy may lead it to have a more promi-nent role.
Decarbonizing the Electric Sector Allows for Decarbonizing Other SectorsAccording to the Environmental Protection Agency (EPA), as of 2019 electricity accounted for 25% of green-house gas emissions. The transportation sector ac-counts for the highest portion of U.S. GHG emissions, at 29%.13 The commercial and residential sectors, primarily via space heating, make up another 13% of emissions. Electrification of transportation and heating therefore present an opportunity to decarbonize these sectors.
The Electric Power Research Institute (EPRI) analyzed the potential for the electrification of transportation and heating. EPRI notes that for electric vehicles, “pump-to-wheels fuel consumption is one-third to one-quarter that of an efficient internal combustion engine.” Simi-larly, electric heat pumps require one-third to one-half
as much input energy as a natural gas furnace.14 This increased efficiency means that even if these devices are fueled by fossil resources, their emissions are much less than that of traditional transportation and heating mechanisms. An EV powered by natural gas, driven 12,000 miles in one year, uses 33 million Btu (MMBtu) of final energy, including production, as compared to 86 MMBtu for a petroleum-fueled vehicle.15
Projections for EV growth are ever-changing and vary by organization. Bloomberg projects passenger EV sales to increase from 3.1 million in 2020 to 14 million in 202516 and projects that EVs will account for approx-imately 70% of new vehicle sales in the US by 2040.17 EPRI projects EVs and plug-in hybrids to account for 75% of vehicle sales and 70% of vehicle miles traveled by 2050.18 Electric vehicle adoption will be influenced by several factors, paramount among them is continued cost declines in batteries and the availability of public charging options.
Electrification has the potential to greatly increase the share of energy produced by the electric sector. EPRI projects that final energy use will be anywhere from 32% to 47% electric by 2050, up sharply from 21% today.19 Efficient electrification means that, despite the projected growth in the economy, overall energy use will decline overall over the next three decades.20
10 Ibid.
11 Ibid., p. 15
12 Laura Nelson et al, Green Hydrogen Guidebook, Green Hydrogen Coalition, August 2020, p. 9, www.ghcoalition.org/guidebook
13 “Sources of Greenhouse Gas Emissions,” Environmental Protection Agency. www.epa.gov/ghgemissions/sources-green-house-gas-emissions. Accessed July 27, 2021.
14 EPRI, U.S. National Electrification Assessment, April 2018, p. 14
15 Ibid., p. 15
16 “Electric Vehicle Outlook 2021” Bloomberg New Energy Finance. https://bnef.turtl.co/story/evo-2021/page/3
17 Bloomberg NEF. https://bnef.turtl.co/story/evo-2021/page/4/2?teaser=yes (see Figure 5)
18 EPRI, U.S. National Electrification Assessment, April 2018, p. 27
19 Ibid., p. 38
20 Ibid.

12 MOVING PUBLIC POWER FORWARD
Utility RolesElectric utilities will have a crucial role in this transi-tion. For one, utilities can provide financial and/or rate incentives to encourage adoption of EVs and electric heating (Chapters Three through Five highlight exam-ples of innovative strategies public power utilities have developed to accomplish this). Utilities will also provide the backbone undergirding EV adoption, either by de-ploying EV charging stations or by working closely with charging companies in selecting optimal locations for charging stations.
Most importantly, as discussed in Value of the Grid, electric utilities have the technical expertise to integrate resources to maximize reliability and resiliency. For example, increased EV adoption will potentially impose new burdens on the grid. Fast charging stations re-quire a large amount of electricity, and home charging stations, if many are deployed in a single neighborhood, can place stress on substations, particularly if all cars charge at the same time. Therefore, utilities will need to consider ways to influence charging behavior either through rates or managed charging options.
Utilities may also be tasked with integrating dis-tributed energy resources (DERs). As with EVs, a small number of DERs on the system do not necessarily pose a challenge, but as more DERs are deployed, utilities might want to consider how to integrate them into their system for management. One way to accomplish this is through virtual power plants (VPPs). VPPs use software and advanced metering infrastructure (AMI) to dispatch integrated DER (iDER) in a wholesale or retail market via aggregation. VPPs are a way to “aggregate hetero-geneous DER to make the services these resources provide resemble conventional and dispatchable cen-tralized power plants.”21
The specific way in which utilities can manage iDERs is through DER management systems (DERMS). One definition of DERMS is a “software control system typ-ically deployed by utilities to optimize DER assets and maintain the reliability of the distribution system through
use cases such as active power management, voltage issues, and other services to support utility operation-al needs.”22 One analysis suggests that iDERs could decrease the need for centralized generation by 50%.23 While iDER, VPPs, and DERMS pose data management and security challenges24, they offer an opportunity for utilities to engage more directly with customers who install DERs.
Another important consideration in this transforma-tion is environmental justice. As defined by the EPA, en-vironmental justice “is the fair treatment and meaningful involvement of all people regardless of race, color, national origin, or income with respect to the devel-opment, implementation and enforcement of environ-mental laws, regulations and policies.”25 As a priority effort under the Biden administration, federal agencies have been instructed to develop environmental jus-tice strategies to “address disproportionately high and adverse human health or environmental effects of their programs on minority and low-income populations.?” For utilities, environmental justice considerations might spur greater efforts to prioritize electrification efforts, including charging infrastructure and EV resale mar-kets, in disadvantaged communities. Increased focus on weatherization (adding insulation, replacing windows) is also a focus, as people with low incomes tend to live in homes that are poorly insulated and not energy effi-cient, thereby increasing their energy bills.26
Along similar lines, there has been increased con-sideration of how to assist individuals and families with low-to-moderate income (LMI). Not only do these cus-tomers spend a larger portion of their income on energy bills, they also are much less likely to be able to afford EVs or install solar photovoltaics on their homes, even
21 Alex Metz, et al. Integrated DER: Orchestrating the Grid’s Last Mile. Guidehouse, 2020, p. 7. https://guidehouse.com/-/media/www/site/insights/energy/2020/gh_integrated-der_2020.pdf
22 Ibid., p. 8
23 Ibid., p. 19
24 Ibid., p. 25
25 EPA, “Learn about environmental justice.” www.epa.gov/environ-mentaljustice/learn-about-environmental-justice.
26 EPRI, Equity and Environmental Considerations for a Clean Energy Transition, July 2021

13 MOVING PUBLIC POWER FORWARD
if they own those homes. An LBNL review shows that households earning $200,000 or more are four times more likely to install solar than households earning less than $50,000.27 Data are similar for EV adoption. Many states have adopted programs for people with LMI to assist this population. LBNL identifies 41 active pro-grams in 21 states to assist customers with LMI. These programs have three elements: subsidized finances, direct financial incentives, and set asides.28
Public power utilities have responded to this concern by initiating their own LMI programs and initiating com-munity solar projects (see Chapter Five).
27 Bentham Paulos, et al. An Assessment of Evaluation Practices of Low- and Moderate-Income Solar Programs, Lawrence Berkeley National Laboratory, April 2021, p. 1
28 Ibid., p. 3.

CHAPTER TWO
PUBLIC POWER PROFILE
14 MOVING PUBLIC POWER FORWARD

15 MOVING PUBLIC POWER FORWARD
Not-for-profit, locally owned public power util-ities have been providing safe, reliable, and affordable power for over 140 years. While innovations have swept over the industry,
the core values and approach for public power has not: provide affordable, reliable, environmentally responsible electricity to our communities, guided by local deci-sion-making. Public power utilities still offer the most af-fordable electricity while providing more reliable power than other utilities.
The following statistics provide perspective on how the public power sector adheres to these values.
Sales and GenerationThere are more than 2,000 publicly owned electric utilities in the United States. They operate in every state except Hawaii and in five U.S. territories. These utilities serve more than 22 million customers, or approximately 49 million people. While several large cities and juris-dictions are served by public power utilities, most public power utilities serve small and medium towns and cities. The median public power utility serves just over 2,000 customers.
Despite constituting over two-thirds of electric util-ities in the U.S., public power utilities account for just over 15% of all electric sales.
Table 1. Sales to Ultimate Consumers, by Utility Type (in thousands of MWh)
Full-Service Energy-Only Sales Sales Total % of Total
Publicly Owned Utilities 563,893 18,042 581,935 15.3%
Investor-Owned Utilities 1,904,138 33 1,904,171 50.0%
Cooperatives 458,300 1,303 459,603 12.1%
Federal Power Agencies 29,679 - 29,679 0.8%
Behind-the-Meter 8,045 - 8,045 0.2%
Community Choice Aggregators - 42,377 42,377 1.1%
Power Marketers 263,665 521,676 785,341 20.6%
TOTAL 3,227,719 583,431 3,811,150

16 MOVING PUBLIC POWER FORWARD
Public power utilities provide an even smaller percentage of the electric generation in the U.S.
Table 2. Generation by Utility Type (in thousands of MWh)
Generation (MWh) % of Total
Publicly Owned Utilities 393,502 9.4%
Investor-Owned Utilities 1,484,669 35.4%
Cooperatives 185,950 4.4%
Federal Power Agencies 265,222 6.3%
Behind-the-Meter 8,137 0.2%
Non-Utility Generators 1,861,951 44.3%
TOTAL 4,199,432
Figure 2 depicts public power generation by source. As will be further explained in the next chapter, this graph does not tell the entire story. Table 2 and Figure 2 only show utility-owned generation. Public power utilities enter into power purchase agreements (PPA) to obtain a significant share of their resource needs. There is no publicly available resource that summarizes the type of resource procured this way, so a large amount of renewable resources are not captured.
Figure 2. Public Power Generation by Energy Source, 2019
Oil 0.2%
Gas31.7%
Coal28.7%
Hydro20.7%
Nuclear16.4%
Other 2.3%
These statistics provide some perspective on the size and scope of public power utilities. Furthermore, as Table 2 shows, at least one-third of public power resource needs are met via PPA with non-public power entities. Over two-thirds of public power utilities have no ownership stake in any generation resource, though many are served by a joint action agency (JAA).
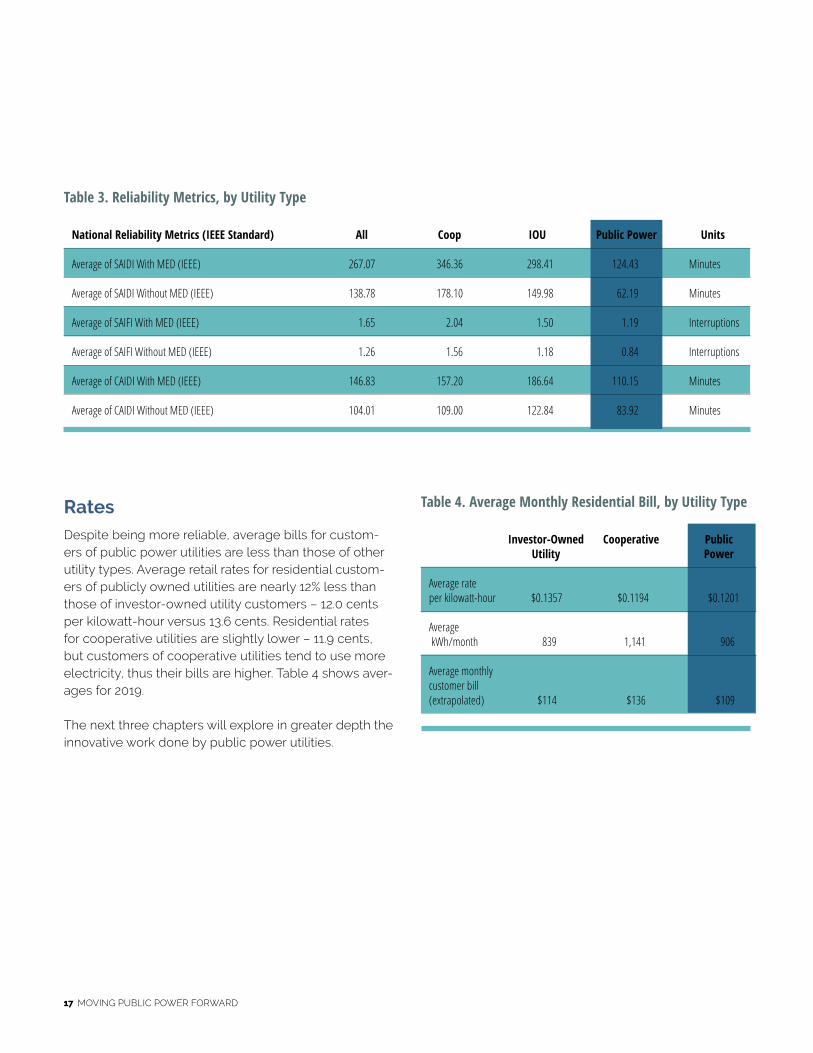
ReliabilityDespite their relatively small size and lack of immediate capacity availability, public power utilities provide more reliable power. Table 3 shows metrics reported to EIA for 2019 for System Average Interruption Duration Index (SAIDI), System Average Interruption Frequency Index (SAIFI), and Customer Average Interruption Duration In-dex (CAIDI). These metrics capture the average duration and frequency of customer outages. For each of these indexes, public power utilities consistently have better performance.
17 MOVING PUBLIC POWER FORWARD
RatesDespite being more reliable, average bills for custom-ers of public power utilities are less than those of other utility types. Average retail rates for residential custom-ers of publicly owned utilities are nearly 12% less than those of investor-owned utility customers – 12.0 cents per kilowatt-hour versus 13.6 cents. Residential rates for cooperative utilities are slightly lower – 11.9 cents, but customers of cooperative utilities tend to use more electricity, thus their bills are higher. Table 4 shows aver-ages for 2019.
The next three chapters will explore in greater depth the innovative work done by public power utilities.
Table 3. Reliability Metrics, by Utility Type
National Reliability Metrics (IEEE Standard) All Coop IOU Public Power Units
Average of SAIDI With MED (IEEE) 267.07 346.36 298.41 124.43 Minutes
Average of SAIDI Without MED (IEEE) 138.78 178.10 149.98 62.19 Minutes
Average of SAIFI With MED (IEEE) 1.65 2.04 1.50 1.19 Interruptions
Average of SAIFI Without MED (IEEE) 1.26 1.56 1.18 0.84 Interruptions
Average of CAIDI With MED (IEEE) 146.83 157.20 186.64 110.15 Minutes
Average of CAIDI Without MED (IEEE) 104.01 109.00 122.84 83.92 Minutes
Table 4. Average Monthly Residential Bill, by Utility Type
Investor-Owned Cooperative Public Utility Power
Average rate per kilowatt-hour $0.1357 $0.1194 $0.1201
Average kWh/month 839 1,141 906
Average monthly customer bill (extrapolated) $114 $136 $109

18 MOVING PUBLIC POWER FORWARD
CHAPTER THREE
PUBLIC POWER UTILITIES AND CLEAN ENERGY

19 MOVING PUBLIC POWER FORWARD
Whether or not they are guided by a state or local mandate, public power utilities are increasing the amount of clean energy capacity in their portfolio.
Even though many states have implemented RPS and/or clean energy standards (CES), in some cases, public power utilities are exempt from these state man-dates. Even when exempt from the RPS, many public power utilities have developed their own goals – within the utility or in coordination with a city-wide effort. Our RPS Tracker includes a table showing public power utility CES or other zero-emission targets.
Figure 2 showed only about 2% of public power gen-eration was supplied by non-hydro renewables. What’s more, public power utilities own just over 3,000 MW of
non-hydro renewable capacity – just over 200 MW of which is solar and 842 MW of which is wind. But as ex-plained earlier, this does not tell the whole story, since a significant portion of public power capacity is contract-ed through PPAs.
To determine the amount of capacity for which public power utilities have entered PPAs with non-public power suppliers, APPA surveyed public power utilities in January 2020 and May 2021. The survey respondents account for approximately half of all public power sales each year. Table 5 shows both the PPA capacity under contract and the planned PPA capacity over the next five years for these respondents compared with the owned capacity for all public power entities. Utilities that responded to both surveys are not double counted.
Table 5. Public Power PPA Capacity and Planned Capacity (in megawatts)
Public Power Owned Under Contract Planned Capacity**Fuel Type 2021 2020* 2021 2020* Total
Solar 3,089.04 3,815.67 2,336.97 3,682.15 12,923.83 211
Wind 3,218.93 4,526.90 405.00 1,112.40 9,263.23 809
Hydro 4,334.36 2,995.51 71.00 3.00 7,403.87 22,235
Natural Gas 7,009.0 6,271.30 510.00 776.00 14,566.30 53,330
Coal 1,342.72 3,360.60 0.00 0 4,703.32 28,499
Nuclear 501.10 1,226.60 194.00 200.00 2,121.70 8,027
Other (Non-Renewable) 220.80 690.00 140.80 115.00 1,166.60 6,277
Other (Renewable) 137.25 1,020.80 66.00 248.40 1,472.45 1,594
*Includes survey data and supplemental data procured from web searches
**Capacity totals are for all public power utilities

20 MOVING PUBLIC POWER FORWARD
The survey data indicates that while public power utilities own barely more than 1,000 MW of wind and solar capacity, they have contracted for or have plans to contract for more than 22,000 MW of wind and solar power, plus another 7,404 MW of hydropower over the next five years. Considering that the survey sample represents about half of public power utility sales, the actual amount of renewable PPA capacity is likely much higher.
Public power utilities tend to contract for wind and solar power because, as tax exempt entities, they are not able to claim the investment tax credit (ITC). It is therefore economically beneficial to contract with third parties who can claim the ITC, thus bringing down the project costs. The same surveys also asked if utilities would change their plans to engage in PPAs if the ITC became available to them, and over two-thirds indicat-ed they would, signifying more public power utilities would build their own renewable capacity if the tax laws changed.
This data shows that public power utilities are plan-ning to add clean energy to their portfolio to reduce carbon emissions. The following case studies highlight specific actions utilities are engaging in to add different types of clean energy to their mix.
Changes in Resource PortfoliosUtilities publish integrated resource plans (IRPs) every few years to relay a strategic mapping of how they seek to procure resources. A sample of some public power IRPs show that many of them are focused on procuring clean energy resources.
Orlando, Florida
Orlando Utilities Commission (OUC) released its IRP report in November 2020, projecting its resource needs through 2030. OUC committed $420 million to solar technology, plus an additional $90 million to energy storage. OUC had already committed to providing 270 MW of storage to its customers.29 OUC studied multi-ple portfolio options and concluded that the optimized
portfolio was one where all resource options were considered, including converting coal to gas between 2025-2027. This option is projected to reduce carbon emissions by approximately 7.6 million tons over the forecast period. OUC’s analysis also found that adding wind later in the period would increase diversity and likely would increase reliability and resiliency.30
Austin, Texas
Austin Energy’s portfolio already consists of 63% zero-emission generation – 40% renewable and 23% nuclear. In its resource plan, Austin Energy commits to cease purchasing, contracting for, or building “long-term generation or storage resources that emit new carbon.” Under the plan, 86% of generation will be car-bon-free by 2025, 93% by 2030, and 100% by 2035.31
Austin Energy is using an approach it terms Reduce Emissions Affordably for Climate Health (REACH). The utility will gradually phase out its fossil resources while continuing to adhere to the city of Austin’s affordability metrics.32 Additionally, Austin Energy commits to achiev-ing a total of 375 MW of local solar by 2030, of which 200 MW will be customer-sited, while also continuing its shared solar program for residents of multi-family housing.33 The plan also incorporates energy efficiency and demand response programs. It also states that the utility “will contract with a qualified third-party service to design and implement, with the cooperation of the Aus-tin Equity Office, the convening of community meetings comprised of those living in, or serving those in limit-ed-income communities and communities of color, and others who cannot afford or access current programs.” The intent of these meetings is to identify barriers and
29 Orlando Utilities Commission. 2020 Electric Integrated Resource Plan Report, prepared by Siemens, November 2020, p. 1-1
30 Ibid., p. 9-1
31 Austin Energy, Austin Energy Resource, Generation and Climate Protection Plan to 2030, recommended to Austin City Council March 2020, p. 2.
32 Ibid., p. 3.
33 Ibid., pp. 3-4

21 MOVING PUBLIC POWER FORWARD
recommend approaches to “achieve more equitable energy efficiency, demand response and solar programs that reach customers currently underserved by existing programs because of income limitations and/or other barriers.”34
Sacramento, California
Sacramento Municipal Utility District (SMUD) released a Zero Carbon Plan in April 2021. SMUD aims to achieve zero carbon emissions by 2030, five years earlier than California’s mandate. SMUD will be looking at multiple pathways for decarbonization, including retiring all fossil plants by 2030. Some of these plants could be repur-posed for hydrogen production. The plan also stipulates that SMUD will study other clean technology, including long-duration storage, vehicle-to-grid technologies, and the use of virtual power plants. Other technologies being explored are concentrating solar power, micro-grids, and the optimization of existing hydropower.35 SMUD projects that rooftop solar will increase from 240 MW to 500-750 MW by 2030. Behind-the-meter storage is projected to be anywhere from 50-250 MW by 2030.36
SMUD plans on making many utility-scale invest-ments by 2030. SMUD proposes developing 1,200-1,600 MW of solar, 700-1,100 MW of local battery storage, 390-590 MW of wind, and 100-220 MW of geothermal.37
In its plan, SMUD emphasizes the need to develop new technologies to achieve these zero carbon goals. Stud-ies show “that reliance on only proven clean technolo-gies would be very expensive and would not pass basic reliability tests.”38
Tennessee Valley
The Tennessee Valley Authority (TVA) released its Strategic Intent and Guiding Principles in May 2021. TVA notes it already has over 2,300 MW of solar commit-ments by 2023 and expects to add another 10,000 MW of solar by 2035. It will also support public power utilities in the region in adding over 2,000 MW of distributed solar. TVA, whose resources are nearly 60% carbon free, will retire all coal plants by 2035 to further its decarbon-ization efforts.39 TVA has also contracted for 180 MW of energy storage through the second quarter of 2021.40
TVA’s goal is to be zero net carbon by 2050. In the meantime, the Authority has a goal of reducing CO2 emissions 70% from 2005 levels by 2030 and 80% by 2035.41 As a means of achieving this goal, TVA is study-ing the deployment of SMRs. An early site permit was granted in 2019 for two or more SMRs at the Cling River site in Oak Ridge, Tennessee.42 TVA states that light-wa-ter SMRs are the technology that will be ready for deployment soonest and believes they could be ready for commercial deployment by 2030.43
Solar and StorageDespite the limitations placed on public power utilities due to their inability to claim the ITC, they are still mov-ing ahead with deployment of solar and energy storage.
One innovative approach to solar deployment is floating arrays. Several public power utilities have be-gun to explore this technology. One example is the City
34 Ibid., pp. 4-5
35 SMUD, 2030 Zero Carbon Plan, April 2021, pp. 6-7, www.smud.org/-/media/Documents/Corporate/Environmental-Leadership/ZeroCarbon/2030-Zero-Carbon-Plan-Technical-Report.ashx
36 Ibid., p. 7
37 Ibid., p. 16
38 Ibid., p. 90
39 Tennessee Valley Authority, TVA Strategic Intent and Guiding Principles, May 2021, p. 10. https://tva-azr-eastus-cdn-ep-tvaw-cm-prd.azureedge.net/cdn-tvawcma/docs/default-source/about-tva/board-of-directors/may-6-2021/strategic-plan-docu-mentc67079e2-d479-4f3d-a13b-1fa6fd714cde.pdf?sfvrsn=bc7b-b2e8_7
40 Ibid., p. 15
41 Ibid., p. 21
42 Ibid., p. 27
43 Ibid., p. 29

22 MOVING PUBLIC POWER FORWARD
of Healdsburg, California, which cut the ribbon for a 3 MW floating solar project that can generate 6.5 giga-watt-hours a year, or enough to supply about 8% of the city’s annual energy needs. It is the largest floating solar project in the nation.44 The project is being financed and built by White Pine Renewables.
Pairing solar with storage can maximize solar ener-gy’s potential.
Salt River Project (SRP) in Phoenix, Arizona is plan-ning on massively increasing its solar portfolio. The pub-lic power utility currently has 648 MW of utility-scale solar online or contracted for and plans to add another 1,375 MW of solar power by 2035. This latest plan aims for double the capacity SRP had previously committed to adding to their system by 2025 in a plan from No-vember 2018.45 Many of the projects in the works pair storage with the solar, including the 250 MW Sonoran Energy Center, which will feature a battery energy stor-age system capable of dispatching 1 GWh of power to SRP’s customers.46
Grand Rapids Public Utilities in Minnesota has col-laborated with US Solar on the latter’s 2 MW solar array and 1 MW/2.5 MWh energy storage battery project. The project, which is expected to begin operating by the end of 2021, will be located on city-owned land near the Grand Rapids/Itasca County Airport. The contract runs for 25 years and is expected to generate $465,000 in local tax revenue and land lease payments.47
Smaller utilities can also take advantage of ener-gy storage as a means of reducing costs. Pascoag Utility District in Rhode Island, a utility with less than 5,000 customers, has partnered with Agilitas Energy to develop a 3 MW/9 MWh lithium-ion battery array. The storage system, slated to come online in the second quarter of 2022, is being used as an alternative to up-grading transmission lines, avoiding between $6 million and $12 million in additional costs. The batteries “will provide peak shaving services to the utility and ancillary services to ISO-New England.”48
The Public Power Energy Storage Tracker provides details on dozens of other public power energy storage projects that are currently online.49
HydrogenPublic power utilities are also investing in hydrogen re-search and deployment, as highlighted in Understand-ing Hydrogen: Trends and Use Cases.50 In Florida, OUC has a goal of achieving net-zero carbon emissions by 2050. To help meet its goal it has contracted with Burns & McDonnell to develop a hydrogen demonstration project. Justin Kramer, supervisor of emerging technolo-gies at OUC, states that “using hydrogen as storage and in other capacities is one way OUC can reach its goal of close to 100% renewable power by 2050.”51
44 “Healdsburg, Calif., to cut ribbon on 3-MW floating solar project,” Public Power Current, February 23, 2021. www.publicpower.org/periodical/article/healdsburg-calif-cut-ribbon-3-mw-floating-so-lar-project
45 Paul Ciampoli, “SRP to more than double utility scale solar to 2,025 megawatts by 2025,” Public Power Current, May 4, 2021. www.publicpower.org/periodical/article/srp-more-double-utility-scale-solar-2025-megawatts-2025
46 Patty Garcia-Likens, “SRP solar expansion announcement: Cutting emissions through major solar + battery energy purchase.” January 15, 2020. https://blog.srpnet.com/srp-solar/
47 Paul Ciampoli, “Grand Rapids Public Utilities collaborates on solar-plus-storage project,” Public Power Daily, December 11, 2020. www.publicpower.org/periodical/article/grand-rapids-public-utili-ties-collaborates-solar-plus-storage-project
48 Peter Maloney, “Rhode Island’s Pascoag Utility District turns to batteries to avoid a transmission upgrade,” Public Power Current, May 18, 2021. www.publicpower.org/periodical/article/rhode-is-lands-pascoag-utility-district-turns-batteries-avoid-transmis-sion-upgrade
49 “Public Power Energy Storage Tracker,” APPA. www.publicpower.org/resource/public-power-energy-storage-tracker
50 Patricia Taylor, Understanding Hydrogen: Trends and Use Cases, APPA, June 2021. www.publicpower.org/resource/understand-ing-hydrogen-trends-and-use-cases (APPA members only)
51 “Orlando Utilities Commission teaming with Burns & Mac on hydrogen project,” Power Engineering, April 19, 2021. www.power-eng.com/emissions/orlando-utilities-commission-team-ing-with-burns-mac-on-hydrogen-project/

23 MOVING PUBLIC POWER FORWARD
A grant from APPA’s Demonstration of Energy & Efficiency Developments (DEED) program helped the Northern California Power Agency (NCPA), a JAA serv-ing 16 publicly owned utilities, investigate equipping its natural gas-powered Lodi Energy Center with a turbine capable of operating with a natural gas blend of up to 45% hydrogen. The facility could also supply hydro-gen for the transportation sector. The study concluded that “production of hydrogen via water electrolysis and storage as a compressed vapor or cryogenic liquid is technically feasible using commercially-available tech-nology.” The study also showed that while capital costs for hydrogen projects remain high, cost parity with other technologies may be possible under certain circum-stances.52
The Intermountain Power Project (IPP), located in Utah and owned and operated by multiple public power utilities, including the Los Angeles Department of Water and Power, will be converting from coal to other forms of generation. Two coal units of a total of 1,800 MW will be retired, and 840 MW of natural gas will be online on the site by 2025. The plant will be configured to use a 30% hydrogen mix, with a goal of 45% by 2045. IPP will also incorporate wind and solar in the mix.53
These developments follow the announcement of the Advanced Clean Energy Storage (ACES) project in 2019. Located adjacent to IPP, it is being developed by Magnum Development and Mitsubishi. It features 1,000 MW of clean energy storage, including onsite hydrogen storage in underground salt caverns.54
Carbon CaptureSeveral studies have concluded that for the electric industry to achieve net zero carbon emissions, multi-ple resource options need to be included in portfolio planning.55 One option for reducing carbon emissions is to install carbon capture technology on fossil re-sources. City Water, Light and Power in Springfield, Illinois has a coal-fired unit – Dallman Unit 4 – which has been selected for testing of CO2 capture technology. The University of Illinois’s Prairie Research Institute will conduct the testing, with funding granted from the DOE. $47 million has been allocated for the final phase of the project, which features the construction of a 10MW Linde-BASF advanced post-combustion CO2 capture system that will process the unit’s flue gas. Construction of the system will begin in 2022, with testing scheduled to take place between March 2024 and May 2026.56
HydropowerHydropower has been providing carbon-free elec-tric generation for more than a century. Innovations are spurring changes in how hydropower is used as a resource today. For example, Idaho Falls Power worked with Idaho National Laboratory (INL) to test the ability of small hydropower plants to provide startup power during outages. Idaho Falls operates five run of the river hydro plants, all of which are low pressure, so the utility worked with INL to figure out a way to develop black start capability. Tests demonstrated that “small hydro-52 Northern California Power Agency. Green Hydrogen Electrolyzer
Feasibility Study – Supporting Clean Energy Investment. DEED Proj-ect Library. Project end date: March 1, 2021. www.publicpower.org/deed-project/green-hydrogen-electrolyzer-feasibility-study-sup-porting-clean-energy-investment (DEED members only)
53 Patricia Taylor, Understanding Hydrogen: Trends and Use Cases, APPA, June 2021. www.publicpower.org/resource/understand-ing-hydrogen-trends-and-use-cases
54 Ibid.
55 Resource Adequacy in the Pacific Northwest. Energy and Envi-ronmental Economics Inc. Project Team: Zach Ming, Arne Olson, Huai Jing, Manohar Mogadali, and Nick Schlag. March 2019; Energy Futures Initiative, The Green Real Deal: A Framework for Achieving a Deeply Decarbonized Economy, August 2019; Energy Futures Initia-tive, Optionality, Flexibility, & Innovation: Pathways for Deep Decar-bonization of California, May 2019.
56 Peter Maloney, “City Water, Light and Power plant chosen as site for carbon capture technology pilot testing, Public Power Current, May 13, 2021. www.publicpower.org/periodical/article/city-water-light-and-power-plant-chosen-site-carbon-capture-technology-pilot-testing
24 MOVING PUBLIC POWER FORWARD
power plants like Idaho Falls’, combined with integrat-ed energy storage technologies, may prove to be as nimble as natural gas when it comes to load following.” Testing also discovered that bringing all plants up si-multaneously worked better than bringing them online individually.57
Small Modular ReactorsNuclear energy is another clean energy source that has been providing zero-emission generation for decades. The next generation of nuclear power may be SMRs. These smaller designs mean that nuclear projects can be scaled up or down depending on the needs of the participant.
Utah Associated Municipal Power Systems, a JAA serving 48 members in multiple states, formally initiat-ed its Carbon Free Power Project in January of 2021. It will deploy NuScale Energy’s SMRs at INL. Electricity from the project will flow to customers of 33 UAMPS’ members across five states. The first module will begin generating in 2029, with the rest scheduled to begin operation by 2030.58
Grant County Public Utility District in Washington has initiated a pair of investigations into advanced nuclear reactors. In April 2021, Grant County executed a memo-randum of understanding with X-energy to study using X-energy’s Xe-100 advanced nuclear power plant in Richland, Washington. JAA Energy Northwest is provid-ing the site for the plant, which will have four 80 MW units that are scheduled to begin construction in 2024
and begin operating in 2027. The Xe-100 design uses helium as a coolant instead of water.59 Grant County also signed an MOU with NuScale to investigate using its design, which is scalable in 77 MW increments to 924 MW, for a site in central Washington state.60
MicrogridsAs part of an effort to make its electric system more resilient, the Virgin Islands Water and Power Authority received federal funds for its 18 MW St. Croix microgrid project. The $129 million project will incorporate solar generation and battery energy storage. This is part of a larger strategic initiative to construct four microgrids across the territory, which when completed will supply 50 MW of generation and about 82 MWh of energy storage.61
Demand Response and Energy EfficiencyAvoiding the need for generation altogether is another means to decrease carbon emissions. Demand re-sponse programs offer customers incentives to shift their usage — to flatten the overall demand curve and to reduce stress on the system during peak times. Ener-gy efficiency measures, meanwhile, help reduce overall demand.
The effectiveness of energy efficiency programs is demonstrated by the decreasing electricity intensity across the country. The U.S. population has increased 17% since 2000, but total electric sales have increased by only 9%. More starkly, electric sales have only in-creased 2.4% since 2005, and average monthly residen-
57 Peter Maloney, “Idaho Falls Power, with Idaho National Lab, tests small hydro’s black start capabilities, Public Power Current, April 28, 2021. www.publicpower.org/periodical/article/idaho-falls-power-with-idaho-national-lab-tests-small-hydros-black-start-capabilities
58 NuScale, Carbon Free Power Project. www.nuscalepower.com/Projects/Carbon-Free-Power-Project
59 Peter Maloney, “Grant County PUD, Energy Northwest sign MOU for advanced nuclear project, Public Power Current, April 5, 2021. www.publicpower.org/periodical/article/grant-county-pud-ener-gy-northwest-sign-mou-advanced-nuclear-project
60 Paul Ciampoli, “Grant County PUD signs MOU on possible small modular reactor deployment,” Public Power Current, May 26, 2021.
61 John Egan, “A Big Boost for Microgrids: Reliability, Resilience and Favorable Economics.” Public Power Magazine, July 14, 2021. www.publicpower.org/periodical/article/big-boost-microgrids-reliabili-ty-resilience-and-favorable-economics

25 MOVING PUBLIC POWER FORWARD
tial electricity usage has declined 4% since 2005. These reductions have occurred even as people began using more electronic devices.
Increasing energy efficiency continues to be a goal of many utilities in their attempt to decrease emissions. SMUD changed their efficiency metrics from “energy savings” to “avoided carbon emissions” as a means of linking energy efficiency to emissions reduction. SMUD is the first utility in the country to make this change. SMUD’s energy efficiency program will concentrate on investments that reduce carbon emissions to the lowest possible levels, and at the lowest cost possible.62 SMUD’s building electrification plan, detailed in the next chapter, is a part of this overall strategy.
Snohomish County Public Utility District in Washing-ton emphasizes conservation as a means of achieving its carbon emissions goals. According to its IRP, “con-servation remains the PUD’s resource of choice as a cost-effective resource to meet some or all of the PUD’s winter energy need” and projects that its conservation measures can defer long-term capacity additions until the late 2020s.63
The PUD launched Flex Energy to help achieve these conservation goals. There are three distinct programs: Flex Time, Flex Peak, and Flex Response. With Flex Time, rates are 20% lower during nights, weekends, and holidays, with higher peak rates from 7-10 a.m. and 5-8 p.m. during winter months. Customers in the Flex Peak program receive 10% off the base rate but have a higher cost for usage during peak events. Under Flex Re-sponse, customers receive a text message in advance
of a peak event and can receive annual bill credits if they make a “good faith effort” to conserve during those events.64
As for demand response, Glendale Water and Power in California launched a new program where residential customers grant the utility access and permission to their smart thermostats, which can then be automatical-ly adjusted by up to three degrees during peak events. Residential customers receive a $50 credit for enrolling in the program and a $50 credit every year on their enrollment anniversary date. Other program incentives include a $100 rebate for purchasing a smart thermostat and a complimentary site assessment for commercial customers that enroll.65
Public power utilities that innovate in these areas have been recognized through APPA’s Smart Energy Provider (SEP) program. As of August 2021, 94 public power utilities hold an SEP designation. The designation signifies a commitment to and proficiency in energy efficiency, distributed generation, renewable energy, and environmental initiatives. In addition to the recogni-tion, achieving SEP designation can help public power utilities benchmark and evaluate their work on these topics against a set of industry best practices. As utilities continue to innovate in how they approach smart ener-gy, the SEP program will continue to update and share these best practices.
62 SMUD first in US to change efficiency metric to “avoided carbon,” February 3, 2020. www.smud.org/en/Corporate/About-us/News-and-Media/2020/2020/SMUD-first-in-US-to-change-efficiency-metric-to-avoided-carbon
63 Snohomish County PUD, 2019 Update to the 2017 Integrated Resource Plan, 2020 through 2039, March 19, 2019, p. 35
64 Zacharia Bryan, “PUD seeks volunteers to change energy habits – and save money,” Everett Herald, May 24, 2021. www.heraldnet.com/news/pud-wants-to-change-our-energy-habits-it-needs-volunteers/
65 Paul Ciampoli, “Glendale Water & Power launches demand response program,” Public Power Current, April 21, 2021. www.publicpower.org/periodical/article/glendale-water-power-launch-es-demand-response-program.

CHAPTER FOUR
ELECTRIFICATION AND SMART CITIES
26 MOVING PUBLIC POWER FORWARD

27 MOVING PUBLIC POWER FORWARD
As discussed previously, electrification pres-ents an opportunity for increased electric sales with simultaneous reduction in energy intensity and carbon emissions. Electrifica-
tion of end uses primarily encompasses home heating, water heating, and electric vehicles.
Transportation ElectrificationWith regards to electric vehicles, public power utilities have been actively involved in encouraging EV adop-tion through designing rate structures, offering financial incentives, developing charging infrastructure, electri-fying their fleets, and providing other incentives. The Public Power EV Activities Tracker summarizes these efforts.66
Another APPA resource, Exploring Electric Vehicle Rates for Public Power67, details trends in EV rate design and which structures public power utilities have used to date. The report found that time-of-use rates are the most common form of rates offered to residential EV customers, followed by bill credits for off-peak charging. One utility, Austin Energy, offers a subscription rate through a pilot program that grants subscribers access to unlimited charging at a network of stations and un-limited off-peak home charging for a flat rate of $30 per month for demands of 10 kilowatts or less, and $50 for more than 10 kW of demand.68
Seattle City Light developed a clean transportation electrification plan with the city of Seattle. The plan sets targets for using zero emissions vehicles across the city by 2030, including for 100% of all shared mobility trips, 100% of the city’s fleet, 90% of all personal trips, and
30% for all goods delivery.69 Under the blueprint, the city will “develop and launch new utility rate-based pro-grams, incentives and rate structures for transportation electrification.” The blueprint also calls for an infrastruc-ture plan to address grid modernization and stream-lining the installation process for expedited charging infrastructure deployment, as well as engagement with environmental justice communities “to better under-stand priorities for utility programs and co-create one or more transportation electrification projects.”70
In Seattle City Light’s Transportation Electrification Strategic Investment Plan, the public power utility notes that it is centering its work on three key values: “equity, environment, and operating the grid as an asset to de-liver public good.”71 Through its outreach to environmen-tal justice communities, it identified five key priorities:
1. Conduct customer and stakeholder outreach and awareness on transportation electrification
2. Prioritize electric buses
3. Electrify commercial and local government fleets that run through the Duwamish Valley
4. Expand at-home and near-home charging for multifamily residents
5. Electrify high-mileage ride-hailing vehicles72
Public power utilities are also helping each other with EV deployment. The Iowa Association of Municipal Utilities, with funding from APPA’s DEED program, de-veloped an EV planning, implementation, and customer
66 Public Power EV Activities Tracker. APPA. www.publicpower.org/resource/public-power-ev-activities-tracker
67 Patricia Taylor et al. Exploring Electric Vehicle Rates for Public Power, APPA. February 2021. www.publicpower.org/resource/ex-ploring-electric-vehicle-rates-public-power
68 Ibid., p. 26
69 Peter Maloney, “Seattle City Light, agencies release clean trans-portation electrification plan,” Public Power Current, March 24, 2021. www.publicpower.org/periodical/article/seattle-city-light-agen-cies-release-clean-transportation-electrification-plan
70 Seattle’s Clean Transportation Electrification Blueprint: Electrifying Our Transportation System, p. 10. https://www.seattle.gov/docu-ments/Departments/CityLight/TESIP.pdf
71 Seattle City Light, Transportation Electrification Strategic In-vestment Plan, p. 7. https://powerlines.seattle.gov/wp-content/uploads/2020/09/SCL-Transportation-Electrification-Strategic-In-vestment-Plan-2021-2024-w-attachments.pdf
72 Ibid., p. 8
28 MOVING PUBLIC POWER FORWARD
engagement toolkit.73 The Charging Forward EV Toolkit is aimed at helping public power utilities to forecast EV growth and associated effects on load, and provides resources to help streamline planning and implemen-tation activities for public power utilities looking to encourage EV adoption.74
The toolkit includes a series of transportation elec-trification case studies featuring various public power utilities. One such case study is the Burlington Electric Department in Vermont, which offers a $1,200 rebate on the purchase or lease of a new EV or PHEV, and an $800 rebate on a used EV or PHEV. Burlington also offers an off-peak charging incentive. Customers who charge their vehicles between 10 p.m. and noon are charged 45% less, for a savings of about $0.07 per kWh.75
The case studies also feature OUC’s efforts to increase public charging. The city has 500 level 2 charging ports, 194 of which OUC owns. There are also 30 DC fast charging ports. Additionally, OUC developed two programs to incent commercial deployment – “Charge It” and “Own It.” Under the “Charge It” program, OUC installs the charging infrastructure on the partici-pant’s property and receives a fixed monthly payment. Under the “Own It” arrangement, the participant owns the equipment and then pays OUC for the design, pro-curement, and installation.”76
Building Electrification SMUD’s All-Electric Smart Homes program incents home electrification. SMUD provides incentives to build-ers to construct all-electric homes. For a single-family home, participating builders receive $4,000, plus an ad-ditional $1,000 for installing induction cooking applianc-es. For multifamily homes, builders receive $1,250 per home built and $500 per home with induction cooking.77
SMUD notes that an all-electric home emits 40% less greenhouse gas than an equivalent natural gas-pow-ered home.78
Smart CitiesSMUD’s smart home program is also associated with the smart city concept. In 2018, APPA released a smart city roadmap for public power utilities.79 The paper “define[d] smart as the intersection of digital with in-telligence. Smart city, therefore, will refer to a city that leverages digital connectivity and data analytics to drive smart decision making.”80 However it is defined, the core of smart cities is leveraging technologies and utilizing data to improve efficiencies and meet the needs of city residents.
CPS Energy in San Antonio, Texas, has been at the forefront of smart city efforts. One recent example is its agreement with the city of San Antonio, AT&T, and Itron on a smart streetlight program. As explained by a utility press release, “Smart streetlight sensors can provide near real-time operational performance of the utility’s assets, while enhancing service levels for their custom-ers.” The release adds:
73 Iowa Association of Municipal Utilities, “Electric Vehicle Planning, Implementation, and Customer Engagement Toolkit.” DEED Project Library. Project ended February 3, 2021. www.publicpower.org/deed-project/electric-vehicle-planning-implementation-and-cus-tomer-engagement-toolkit (DEED members only)
74 David Roberts et al. Charging Forward EV Toolkit. July 2021. http://ebiz.publicpower.org/APPAEbiz/ProductCatalog/Product.aspx?ID=10197
75 Public Power Transportation Electrification Case Studies, p. 6
76 Ibid., p. 18
77 “All-electric smart home builder incentives,” SMUD. Accessed August 11, 2021. www.smud.org/en/Going-Green/Smart-Homes/Builder-incentives
78 “All-electric smart homes,” SMUD. Accessed August 11, 2021. www.smud.org/en/Going-Green/Smart-Homes
79 SmartEnergyIP for APPA, “Creating a Smart City Roadmap for Public Power Utilities.” 2018. https://www.publicpower.org/re-source/creating-smart-city-roadmap-public-power-utilities
80 Ibid., p. 5

29 MOVING PUBLIC POWER FORWARD
The goal is to evaluate the performance of sensing technology that can be attached to CPS Energy’s existing and more efficient LED lighting systems. The evaluation will include data analysis to help us determine how to use it best to serve our broader community and align with the City’s Climate Action & Adaptation Plan (CAAP) and ozone attainment goals. Aligned to its on-going commitment to its customers, CPS Energy and SmartSA will also prioritize the importance of protecting the privacy rights of the public as it works on this and future Smart City initiatives.81
The final chapter explores some of the business models and technological advancements that can be built upon smart city concepts.
81 John Moreno, “CPS Energy and the City of San Antonio Forge a Smart City Agreement with AT&T and Itron.” December 8, 2020. https://newsroom.cpsenergy.com/cps-energy-and-the-city-of-san-antonio-forge-smart-city-agreement-with-att-and-itron/

CHAPTER FIVE
RATE DESIGN, ADVANCED GRID, AND NEW BUSINESS MODELS
30 MOVING PUBLIC POWER FORWARD

31 MOVING PUBLIC POWER FORWARD
As utilities move ahead with clean energy resources and electrification efforts, they will need to carefully consider a plethora of financial, operational, and technical options
to integrate resources, promote adoption, and ensure customer satisfaction. The diversity across the 2,000 publicly owned electric utilities in the U.S. —in terms of size, region, resource availability, and so much more — means that no single business model is appropriate for all. Yet, public power utilities have already engaged in innovative practices that may help others develop their own roadmap. This chapter lays out some of the work already done to help utilities meet the needs of the future.
Rate DesignRate design is one of the most important aspects of building the utility of the future. If utilities are to keep the lights on, they need to make sure, at a minimum, their costs are recovered through appropriately set rates. What makes a rate “appropriate” has been the subject of intense debate for some time. As with business models, no one rate design is appropriate for all utilities. APPA has provided numerous case studies and examples for utilities to consider in reports published the past several years.82 In one of those reports, Mark Beauchamp, who leads a firm that consults with utilities on rates, ex-plained why rate design is foundational to the utility of the future:
A long-term rate strategy, along with an imple-mentation plan, is needed to meet the evolving challenges of our industry. More accurate rate structures — including TOU rates, real-time pricing for larger customers, and demand charges for all customers — will become more common. The earlier a utility begins the pro-cess, the easier the transition to more accurate rate structures.83
In the same compendium, Ashley Brown, executive director of the Harvard Electricity Policy Group, not-ed some of the inadequacies of modern rate design. Among the faults with rates is that pricing information is often conveyed in a way that “provides no actionable or timely information and no hint of how one might more efficiently use energy. The bill offers no meaningful signal of how costs are incurred and how they might be reduced.”84 Brown further observes that most revenues are collected through the variable component of the bill despite much of the variable component representing fixed and demand costs. He also critiques the discon-nect between variable prices and “the market realities of supply and demand at specific times and locations.”85
While the authors in the compendium might disagree about some specifics, there is a consensus that rate design needs to be modified. One trend, alluded to by all the authors, is toward rates that reflect differences in season and time of day. Specifically, time-of-use (TOU) or time varying rates (TVR). The most common TOU rate is time-of-day (TOD), where a weekday is normally bro-ken out into two to four discrete pricing periods. There are at least two distinct peak and off-peak periods, with some utilities adding intermediate periods. 82 Rate Design for Distributed Generation: Net Metering Alternatives,
www.publicpower.org/system/files/documents/ppf_rate_design_for_dg.pdf; Rate Design Options for Distributed Energy Resources, www.publicpower.org/system/files/documents/ppf_rate_de-sign_options_for_der.pdf; Value of Solar Primer, www.publicpower.org/system/files/documents/ppf_value_of_solar_primer.pdf; Leadership in Rate Design, www.publicpower.org/resource/lead-ership-rate-design; Moving Ahead with Time of Use Rates, www.publicpower.org/resource/moving-ahead-with-time-use-rates
83 Mark Beauchamp, “What a Long-Term Rate Strategy Should Address,” Leadership in Rate Design, p. 6. www.publicpower.org/resource/leadership-rate-design
84 Ashley Brown, “The Urgent Need for Retail Electricity Prices That Reflect Costs,” in ibid., p. 8
85 Ibid.

32 MOVING PUBLIC POWER FORWARD
According to EIA data, at least 82 public power util-ities offer some form of TOU rate.86 Approximately one million public power residential customers, or just under 5%, are on a TOU rate. Most of these offerings are on a pilot or voluntary basis, though several public power utilities have rolled out default or opt-out TOU rates, meaning TOU is the default rate option for residential customers.
Two of those public power utilities were featured in APPA’s Moving Ahead with Time of Use Rates report. Fort Collins Utilities in Colorado implemented a pilot TOU program in 2015 with 2,400 customers, and then moved to a default TOU rate in October 2018. Fort Collins laid out its reasons for moving to a default TOU rate:
The principal reason for moving to a default TOU rate structure was rate equity within the residential class. Utilities sought to be more transparent in passing on varying time-based costs for electricity to residential customers, especially considering wholesale coincident peak demand charges. New rates also would give customers greater control with two ways to manage bills: reducing overall consumption and shifting when they use appliances and the need for electricity.87
Load management was another reason for the move. Both the pilot study and a review a year after imple-mentation of the default rate showed reductions in both peak load and overall consumption. Total consumption was 1.9% lower, and on-peak consumption was 7.5% lower in the first year of the default rate than the previ-ous year.88
Fort Collins’ rate is two-tiered, with off-peak hours at $0.07 per kWh and on-peak rates at $0.22/kWh in the non-summer months (October-April) and $0.24/
kWh during the summer months. After the first year of default TOU rates, 65% of residential accounts showed a decrease in bills compared to the previous year, and overall monthly bills were $1.38 lower with TOD pricing. Fort Collins also saw a decrease in wholesale electricity expenditures, as well as a reduction in carbon emissions of 0.8% compared to the previous year.89
SMUD transitioned to default TOD rates between the fourth quarter of 2018 and the first quarter of 2019. SMUD’s non-summer (October 1-May 1) TOD pricing is similar to that of Fort Collins’ in that it offers two tiers – a $0.1035/kWh rate during off-peak hours and a $0.1438/kWh rate during peak periods (5 p.m to 8 p.m). During summer months, the off-peak price (midnight to noon) is $0.1209/kWh and the peak price (5 p.m. to 8 p.m.) is $0.2941/kWh. SMUD also has a mid-peak price (noon-5p.m. and 8p.m.-midnight) of $0.1671/kWh in the summer months.90 Both SMUD and Fort Collins offer off-peak pricing for all weekend hours.
SMUD’s results after implementation were simi-lar to Fort Collins. The resulting decreased demand reduced CO2 emissions by 12.8 million metric tons, or the equivalent of powering 4,800 homes for one year. Residential peak load reduction was 8%, and SMUD had $5 million in reduced commodity costs. For customers, the average bill declined by 2% or $3 per month on their summer bills.91
While these innovative rate designs have generally befitted most customers, public power utilities remain diligent about providing assistance to low-income customers. For example, SMUD has budgeted between $30 and $35 million annually for its Energy Assistance Program Rate, which has enrolled 75,000 customers. This program offers a discount to customers at 200% of the federal poverty level or lower. Tacoma Public Utilities in Washington state offers a 30% discount for
86 Department of Energy, Energy Information Administration, Form EIA-861, Dynamic Pricing, 2019 data
87 Moving Ahead with Time of Use Rates, p. 8
88 Ibid., p, 9
89 Ibid., p. 12
90 Ibid., p. 19
91 Ibid., p. 23

33 MOVING PUBLIC POWER FORWARD
customers 62 years of age or older and for customers receiving disability income. Enrolled customers also receive a 20% credit to their bills when paid in full and on time.92
Public power utilities came to their customers’ aid during the COVID-19 pandemic. Glencoe Light and Power in Minnesota forgave all customer electric bills in the month of March 2020. Also in Minnesota, New Ulm Public Utilities Commission suspended all penal-ties and shutoffs and worked with customers to spread arrears over 12 months. CPS Energy made thousands of calls to customers to see if they needed assistance and encouraged customers to be proactive in enrolling in assistance programs.93
Public power utilities are seeking additional ways to assist customers with low and moderate income, in-cluding in improving their access to renewable resourc-es. In 2019, Imperial Irrigation District (IID) in California brought a first of its kind community solar project online for all qualified, low-income customers in the Imperial and Coachella Valleys. IID partnered with Citizens En-ergy Corporation for this project, which serves approxi-mately 12,000 low-income customers registered in IID’s Residential Energy Assist Program (REAP). The project, operating under a 23-year PPA, offers 30 MW of solar capacity.94
AMIImplementing TOU or many other types of new rate design generally requires advanced metering infra-structure (AMI), or smart meters. According to the most recent EIA data, over 12 million public power meters are now AMI, which represents just over half of all public power meters.95
AMI has uses beyond billing and rates, and many util-ities are now discovering new ways to take advantage of this technology. A prime example of this is Emerald People’s Utility District in Oregon, which launched an advanced analytics initiative to make better use of the data it was collecting through its AMI system. The PUD partnered with The Energy Authority (TEA) to use TEA’s advanced analytics service. Emerald PUD’s goal was to use the data collected to identify customers who were “high potential” for energy efficiency marketing. The data showed approximately 500 customers who used significantly more energy than their peers, and the utility used this information to market to them to encourage adoption of energy efficiency measures.96 As a result of this marketing campaign, Emerald PUD estimates that customers saved between 20,000 kWh and 140,000 kWh of energy.97 Emerald PUD used DEED grant fund-ing to conduct this analysis.
Algona Municipal Utilities in Iowa also used a DEED grant to develop a customer clustering tool for small public power utilities. Using a utility’s AMI, the tool plots load duration curves for a variety of customer catego-
92 Jessica Porter, “Affordable energy for the whole community,” Public Power Magazine, January 17, 2020. www.publicpower.org/periodical/article/affordable-energy-whole-community
93 James Patterson, “A Critical Link: Public Power Steps Up to Con-nect Customers with Assistance,” Public Power Magazine, March 8, 2021. www.publicpower.org/periodical/article/critical-link-pub-lic-power-steps-connect-customers-with-assistance
94 Paul Ciampoli, “IID community solar project to serve low-in-come customers,” Public Power Daily, September 26, 2019. www.publicpower.org/periodical/article/iid-community-solar-proj-ect-serve-low-income-customers
95 Form EIA-861, Advanced Meters, 2019 data. Over 6,000,000 meters are Automated Meter Readers (AMR), which is a one-way device that automatically reads customer usage data.
96 Kyle Roadman, “Putting Data to Work: EPUD Launches Ad-vanced Analytics Initiative.” NWPPA Bulletin, October 2019. www3.teainc.org/wp-content/uploads/2019/10/Oct-2019-NWPPA-Bul-letin-article-on-Emerald-PUD-for-Whats-New.pdf
97 Peter Maloney, “Emerald PUD uses DEED grant for data an-alytics project with TEA,” Public Power Daily, May 22, 2020. www.publicpower.org/periodical/article/emerald-pud-uses-deed-grant-data-analytics-project-with-tea
34 MOVING PUBLIC POWER FORWARD
ries, calculates each class’ load factor, and provides customer clustering using an algorithm. Using this tool, a utility can analyze how different customers fit into common load shapes. Users of the tool can export this analysis as tables and graphs. The tool may be able to help small utilities to develop new rate design, including “usage-specific tariff structures.”98
Vermont Public Power Supply Authority (VPPSA), in partnership with mPower Innovations, is using data analytics to develop mapping software. VPPSA and mPower “will build and maintain a geographic informa-tion system (GIS) mapping program” that will assist each of VPPSA’s 11 member utilities. Access to mPower’s Integrator software “enables geospatially-based load analysis, voltage analysis, interconnection studies, and insight into energy use trends.” This partnership is part of a larger plan to bring technology advancement, includ-ing AMI deployment, to smaller utilities.99
Grid ImprovementsUtilities are also planning major grid upgrades to inte-grate new resources. TVA’s resource plan calls for over $2 billion in transmission system improvements over the next five years. It also incorporates over $300 million for a new System Operations Center and Energy Manage-ment System, which will be online in 2020. This system will employ “smart technologies to manage power grid operations more reliably, efficiently, and securely.”100
Two New York public power utilities are also planning major transmission upgrades to accommodate new power resources. New York Power Authority’s board granted approval for the Northern New York Priority
Transmission Project, a major rebuild that will increase the resilience of the New York power grid. Construc-tion would begin in 2022 on approximately 100 miles of lines, to be completed in 2025.101
NYPA’s board also approved a $382 million grid up-grade for four separate projects.
l $200 million has been allocated for a transmission upgrade for 93 miles of line between Marcy (Oneida County) and New Scotland (Albany County).
l $139 million was granted for the final phase of equipment upgrades to Robert Moses Niagara Power Plant’s switchboard.
l $18 million was allocated to a 15-year contract “for the design, manufacture, and delivery of new turbine shafts for the mechanical overhaul of its Niagara Power Plant’s turbines.”
l $25 million was allocated for the final phase of NYPA’s Communication Backbone Program.102
Long Island Power Authority was one among several stakeholders to agree to the construction of a 7.6-mile transmission line to link a proposed 132 MW offshore windfarm to the state’s grid due to come online in 2023. The cable will be buried at least 30 feet below Wain-scott beach, and construction is limited to the off-peak season.103
In Florida, Fort Pierce Utilities Authority (FPUA) developed a ten-year system hardening plan aimed at protecting infrastructure from extreme weather events. As reported in Public Power magazine, FPUA “gathered
98 Algona Municipal Utilities, “Customer Clustering Using AMI Tool at Small Public Utilities,” DEED Project Library. Project ended Janu-ary 1, 2021. www.publicpower.org/deed-project/customer-cluster-ing-using-ami-tool-small-public-utilities
99 Paul Ciampoli, “Vermont Public Power Supply Authority to bring mapping software, data analytics to members,” Public Power Daily, December 14, 2020. www.publicpower.org/periodical/article/ver-mont-public-power-supply-authority-bring-mapping-software-da-ta-analytics-members
100 TVA Strategic Intent and Guiding Principles, p. 20
101 Paul Ciampoli, “NYPA board approves major transmission line rebuild project,” Public Power Current, March 30, 2021. www.pub-licpower.org/periodical/article/nypa-board-approves-major-trans-mission-line-rebuild-project
102 Peter Maloney, “NYPA’s board approves $382 million in grid upgrade programs,” Public Power Current, February 1, 2021. www.publicpower.org/periodical/article/nypas-board-approve-382-mil-lion-grid-upgrade-programs
103 Peter Maloney, “N.Y. stakeholders, including LIPA, adopt plan for power line for offshore wind farm,” Public Power Current, March 29, 2021. www.publicpower.org/periodical/article/ny-stakehold-ers-including-lipa-adopt-plan-power-line-offshore-wind-farm

35 MOVING PUBLIC POWER FORWARD
data from its outage management systems, reviewed outage reports and collected institutional knowledge from field workers to create its system hardening plan.” Under the plan all poles are to be inspected, and are to be replaced if needed, and all wood poles, which have a 40-year life expectancy, are being replaced by ductile iron utility poles, which have a 70-year life expectan-cy.”104
Moving to the Future TogetherAs the electric industry moves into the future, so are public power utilities. They are working to create more sustainable power systems by integrating more clean energy into their portfolios, encouraging adoption of electrified end-uses, and adapting their financial and business models to accommodate these changes. And true to the public power model, they are keeping their customers at the forefront when making these changes.
These utilities are not doing it by themselves. One common theme in nearly all the case studies provided here is collaboration. Public power utilities are collab-orating with third party vendors, joint action agencies, and each other to study, develop, and bring online new technologies and programs.
As discussed in Value of the Grid, public power utili-ties are uniquely qualified to integrate and operate the resources that will power the future electric grid. The regulatory regime under which they operate — gov-erned by local boards and/or city councils rather than under the jurisdiction of state commissions — allows public power utilities to make changes more quickly and more suitable for the needs and desires of their customers. Strikingly, these utilities are often making changes without being forced to do so by state man-dates. Their customers – who, in effect, are their own-ers – are asking for these changes, and public power utilities are responding.
Public power utilities will travel different paths. Some may choose to outsource some key functions, while others will more actively engage in operation and con-trol, including of DERs. Some may choose to serve as energy advisors to their customers, aiding them in their selection of resources appropriate to their needs. What-ever they choose, they will continue to demonstrate their value to the local community.
104 Jessica Porter, “Riding the Storm: Increasing Resiliency for Extreme Weather Events,” Public Power Magazine, March 9, 2020. www.publicpower.org/periodical/article/riding-storm-increas-ing-resiliency-extreme-weather-events

2451 Crystal Drive Suite 1000
Arlington, Virginia 22202-4804
www.PublicPower.org
202.467.2900