moving from traditional fixed id / t&m to ‘outcome based ...... moving from traditional fixed...
TRANSCRIPT

https://isma13in.wordpress.com
Moving from traditional Fixed Bid / T&M to ‘Outcome based’ pricing model using Function Points - Practical challenges & Inferences
The Joint 13th CSI/IFPUG International Software Measurement & Analysis (ISMA13) Conference
Mumbai (India) – March 6, 2017
Saurabh Saxena, CFPS, PMP
Insert here a picture

2ISMA 13 – March 6, 2017 https://isma13in.wordpress.com
More than 11 years experience in Software Sizingmeasurement – Certified Function Point Specialist(IFPUG)
Member of various IFPUG International Committees –appointed as Function Point Country Representative(India)
Globally, several Function Point based articles andWhitepapers published
Established Function Point based model (Estimations,Productivity & Quality Analysis) for major Telecom,Insurance and Banking customers
Mr. Saurabh Saxena
(Country Representative India)
Function Point Expert
Zensar Technologies
Pune, Maharastra
India
About the Author
3ISMA 13 – March 6, 2017 https://isma13in.wordpress.com
Agenda Goals of the Presentation
Pricing Models – ‘Fixed Bid’ Vs. ‘Time and Materials’ Vs.‘Managed Services / Outcome / Unit based’
Proposed ‘Outcome based Operating Model’
Function Point based Estimations & Pricing
Transformation Roadmap & Continuous Improvement
Customer Story – Past Experience

4ISMA 13 – March 6, 2017 https://isma13in.wordpress.com
Pricing isn’t that Easy

5ISMA 13 – March 6, 2017 https://isma13in.wordpress.com
Pricing Models What are they ?
A Pricing Model refers to the contractual agreement between aservice provider and a service gainer
Traditional models (‘Time & Material’ / ‘Fixed Price’)
simple to understand and implement but not very optimal
Mature models (‘Manage Services’ / ‘Outcome base’)
provide a long lasting Win-Win partnership

6ISMA 13 – March 6, 2017 https://isma13in.wordpress.com
Mature Models Benefits
Customer
• Directly aligned to Customer’s business outcome/ objective
• Focus completely on their core strategic initiatives
• SLA driven approach results in measurable benefits
• Knowledge retention becomes more streamlined and sustainable
• Enhances visibility into consumption pattern
• Potential for higher eventual savings as labor arbitrage is replaced by productivity and synergies between tasks
Service Provider
• Empowered with a sense of ownership and incentivized to think big & innovate
• More independent and have a relatively interference free project management
• Able to manage capacity during spike in work load and new client on-boarding
• Bring their best practices into the project, thereby making key process improvements

7ISMA 13 – March 6, 2017 https://isma13in.wordpress.com
Manage Services Models
Vision
Go
ve
rna
nc
e
& C
on
tro
ls
Strategic
Partnership
(Deep understanding of Customer’s IT
footprint)
Technology Alignment to
Business growth
(Technology leadership)
Best Practices
For IT Service Improvement
Outcome Based /Managed Services
Service Ownership
Cost Predictability
Outcome driven Governance
• Reduce ‘Total Cost of Operations’• Improved Productivity & Utilization• Business Value Output
Customer Goals
Through
Ve
nd
or
Dri
ve
rs
Driven

8ISMA 13 – March 6, 2017 https://isma13in.wordpress.com
Mature Models Service Offering
Traditional ENGAGEMENT MANAGED SERVICES
ENGAGEMENT ALIGNMENT
MANAGEMENT
MEASUREMENT
OWNERSHIP
PARTNERSHIP GAIN
EVALUATION PARAMETERS
TACTICAL
SKILLS DRIVEN
OPERATIONAL MEASURES
SPLIT
LIMITED SCOPE
STRATEGIC
SERVICES DRIVEN
OUTCOME DRIVEN
COMPLETE
TRUSTED & VALUE BASED
QUALITY
TIME • SLA Adherence
• SLA Adherence for Outputs to be delivered • YOY % COQ reduction Vs IT Budget
• SLA Adherence for Tickets • % Service Uptime improvement• Time to Market Improvement
Traditional Models Output Based Pricing
• SLA Adherence
PRICING• Output based Pricing
(FP/Ticket/Transactions)• Payment based on Outputs Delivered &
SLA adherence
• Capacity / FTE based• Payment based on Efforts &
SLA Targets Met

9ISMA 13 – March 6, 2017 https://isma13in.wordpress.com
Manage Services Model
Framework and Transition Plan
09-03-2017 www.zensar.com | © Zensar Technologies 2016 9
• Kick-Off current services delivery in Managed Services Model
o Team in action
o New MS metrics review & reporting
• Stabilize the Operations
• Continues Service Improvement
Steady State
4 – 6 weeks 4 weeks
Stakeholder CommunicationDesign
Managed Service Frame work Run and Stabilize
• Establish MS Team Structure for engagement
• Transition Action Plan with Target Steady State
• Implement Governance Model
• Measure Performance and Volume of Delivery
• Create Baselines
Execution – 1 Cycle
• Agree on Managed Services Model and Units of Work
• Develop Program Plan
• On-board MS Implementation Consultant
• Finalize Transformation Roadmap
• Initiate Change Management
Initiate & Buy-In
Setup the Model
Communication & Change Management
Target Operating Model Pilot Baselines
• Develop Target Operating Model
o Unit based Estimation & Pricing model
o Tools, Processes and Frameworks to track, measure and report the Unit of Work
• Create & operationalize Demand Forecast & Capacity model
• Finalize Estimation and Pricing model
• Finalize SLAs & Metrics
• Customer’s approval
Define the MS Framework
Strategic Partnership Engagement
* Timelines are Indicative
Ongoing

10ISMA 13 – March 6, 2017 https://isma13in.wordpress.com
30-60-90 Model
90 Days Before60 Days Before30 Days BeforeCheck the skillset of available
associates and plan trainings if needed
Size the Function Points of the work to be performed and get it approved
from Customer
Pipeline ProjectsProjects pipeline forecast for next 3 months along with high level size Minor Enhancement <10 FPs Small Enhancement – 11 - 30 FPs Medium Enhancement – 31 - 60 FPs Large Enhancement – 61+ FPs
Probable Release planSubset of the Pipeline Projects as per prioritization along with following details: Scope Documents Impacted Applications and
Interfaces
Fixed Final Release PlanSubset of Probable Release Plan along with following details: Release schedule for different
Applications Requirements that will GO-LIVE Finalized Requirements Document Defect Fixes
Customer
Service Provider
The Resource Ramp Up/Ramp Down will be done based on the forecast
of Work in pipeline

11ISMA 13 – March 6, 2017 https://isma13in.wordpress.com
Team Utilization
For any project, there are always peaks & troughs in the work load month on month although the assigned resource capacity remains constant.
Moving to Output Based Managed Services model requires Service Provider to manage teams/individuals as per the utilization measures and taking appropriate actions based on the overall utilization of the teams/individuals
Team/Individual Utilization Percentage
Optimum Utilization90-100%
Utilization a bit on low side
Utilization on a lower side
Least Utilization
75-90%
50- 75%
Below 50%
Ideal resource utilization : Win-WIN for both Customer and Service Provider
Utilization drops but up to an acceptable limit : The resources can work on System Health Initiatives
Drop in Utilization below 75% : Service Provider may reuse the available capacity across other projects / applications/ assignments as shared resources
Consistent under utilization below 50% for continuous 2 weeks : Service Provider may ramp down the resources post notification to the customer. If customer wants them to retain them, they will be charges on T&M rate card basis

12ISMA 13 – March 6, 2017 https://isma13in.wordpress.com
Estimation is an ART

13ISMA 13 – March 6, 2017 https://isma13in.wordpress.com
Outcome based Estimation & Pricing
Support
Volume &
Complexity
/ Actuals
Function
Points
Application Support &
Maintenance
Production Support Operations Support Customer Support
Incidents Meetings Research Requests
Service Requests Capacity Management Deploy Readiness
Problem Records Ad-hoc requests
Monitoring Efforts for Alerts/ Jobs
Root Cause Analysis efforts
Application Enhancements & Development
Development Enhancement
New Project/ Development Work Request for Enhancement

14ISMA 13 – March 6, 2017 https://isma13in.wordpress.com
Support Size Model Support
Analyze the Ticket Volumes and Complexity
Define Ticket Type & Complexity Classification
Arrive Effort Trending per Ticket typeIncidents |Service Requests | Problem Records
Baseline Ticket Productivity (hrs./unit)
Determine Support Requirements• Applications & Technology in Scope• Type of Tickets
Ticket Type Simple Medium Complex
Incidents P1 P2 P3
Service Request P4 P5 P6
Problem Records P7 P8 P9

15ISMA 13 – March 6, 2017 https://isma13in.wordpress.com
Function Point Model Development and Enhancement
• Functional Flows• Database• Use Cases/ High level Req.• Interfaces• Inbound & Outbound feeds/
Reports
• Transaction Functions –Inputs, Outputs and Queries
• Data Functions – Internal DB & External Referred DB
• Interaction with Application experts to bridge all gaps
• High-level Estimations based on Function Points
Requirement Analysis
FP CountingVerification
Sessions with Application Experts
Estimates

16ISMA 13 – March 6, 2017 https://isma13in.wordpress.com
Support Size Model Support
DERIVE BASE RATE
BASE RATE ADJUSTMENT
Step 1 Step 2
Service Location
Skill Demand(Vanilla/ Niche)
Service Coverage
ADJUSTED RATE – Y$/TT
VOLUME BASED DISCOUNTS
Step 3
Tier-1X ~ 2X
Tickets/ Month
Tier-22X ~ 4X
Tickets/ Month
Y$/ TT
Y1$/ TT
Tier-0Sustainable Demand< X Tickets / Month
Min. revenue
$A/month
Tier-3> 4X
Tickets/ MonthY2$/ TTBASE RATE
per Ticket Type (TT)
Adhoc Requests/ Overheads
Ticket
Volume
Productivity on
Complexity basis

17ISMA 13 – March 6, 2017 https://isma13in.wordpress.com
Function Point Pricing Model
Development and Enhancement
DERIVE BASE RATE
BASE RATE ADJUSTMENT
Step 1 Step 2
Service Location
Skill Demand(Vanilla/ Niche)
Productivity on Complexity Basis
ADJUSTED RATE – Z$/FP
VOLUME BASED DISCOUNTS
Step 3
Tier-1X ~ 2X
FP/ Month
Tier-22X ~ 4X
FP/ Month
Z$/ SP
Z1$/ SP
Tier-0Sustainable Demand
< X FP/ Month
Tier-3> 4X
FP/ MonthZ2$/ SPBASE RATE / FP
Interfaces / Data /
Transactions
Scope / Requirements
Complexity
Function Points
Min. revenue
$B/month

18ISMA 13 – March 6, 2017 https://isma13in.wordpress.com
Price Points
Application Support & Maintenance• Adjusted Base Rate – Y $/TT
Requirement Complexity
Productivity (Hrs/FP)
Regular Niche
SIMPLE 10 ~ 15 hrs/FP
Z1 Z2
MEDIUM 15 ~ 20 hrs/FP
Z3 Z4
COMPLEX 20 ~ 30hrs/FP
Z5 Z6Min. revenue $A/month for Minimum Sustainable Demand
Min. revenue $B/month for Minimum Sustainable Demand
Ticket Type Simple Medium Complex
Incidents Y1 Y2 Y3
ServiceRequest
Y4 Y5 Y6
ProblemRecords
Y7 Y8 Y9
Application Development & Enhancement• Adjusted Base Rate – Z $/FP

19ISMA 13 – March 6, 2017 https://isma13in.wordpress.com
Invoicing Milestones and Deliverables
Invoicing Mechanism Milestones Deliverable% of Total FP distribution
Application Enhancements & Development
(Function points)
Requirement Analysis Requirement Document 10%
Design Design Document 15%
Coding & Unit Testing Unit Tested Code / UTC / UTR 35%
System Integration Testing / QA System Test Cases / Results 30%
User Acceptance Testing Support Defect fix 10%
Invoicing Mechanism Milestones Deliverable PaymentApplication Support &
Maintenance(Support Volumes)
L2 ticket Defect fix
After Deliverables
L3 ticket Defect Fix & Test Results
Others(Effort Based)
Customer Support Closed Requests
Operation Support Completed Activities
• Warranty, Release Management & Project Management efforts on Enhancements/Projects/WRs will be tracked on actuals and converted into Equivalent FPs (~ 15% to 20% of overall efforts)
% to be mutually agreed between Customer and Service Provider

20ISMA 13 – March 6, 2017 https://isma13in.wordpress.com
AREA METRIC/ KPI UNIT IMPACT
PRODUCTIVITY
FP Productivity (Hours/ FP) Effort per Function PointTIME
Function Points per Full Time Employee FP / FTE
DEFECTSDefect Density (Defect/FP) Defects detected per Function Point
QUALITYDefect Potential Expected # of Defects / FP
CHANGESOverall Scope Creep FPs for Scope Creep
SCOPE
Average size of FPs per CR FPs / # of CRs
OVERALL SIZE
Application Size FPs
# of Resources for Support FTE per 1000 FPs
Re-engineering effort benefits Maintenance hours / FP
ESTIMATES Estimated vs. actual effort (variance) Estimated FP vs. Actual FP
RE-USE
Reusable assets created# of FPs reusable assets created per 1000 FP
COST% reduction in effort towards new development due to knowledge assets reuse
FP’s saved through reuse expressed as a percentage of the total FP’s of the initiative.
COST Cost per Function Point Cost($) / FP
FP KPIs for MS Health Index

21ISMA 13 – March 6, 2017 https://isma13in.wordpress.com
Value Proposition
Productivity Improvement 3%~5% YoYSME Development Framework, Process improvement, Trainings, Reusable Assets
Optimum Resource Utilization 3%~5% YoYCross Skill and Upskill across LOB’s and Applications, Demand Forecast and Capacity management, Core Flex Resource Model
System Health Initiatives 3% ~ 5% YoYRCAs, Preventive Maintenance, work load forecast
Process & Quality Improvement 3% ~ 5%Streamline processes as per Industry Best practices, SLA & KPI driven maturity model
Service Provider’s committed to create value for Customer & reducing cost by leveraging multiple improvement levers
22ISMA 13 – March 6, 2017 https://isma13in.wordpress.com
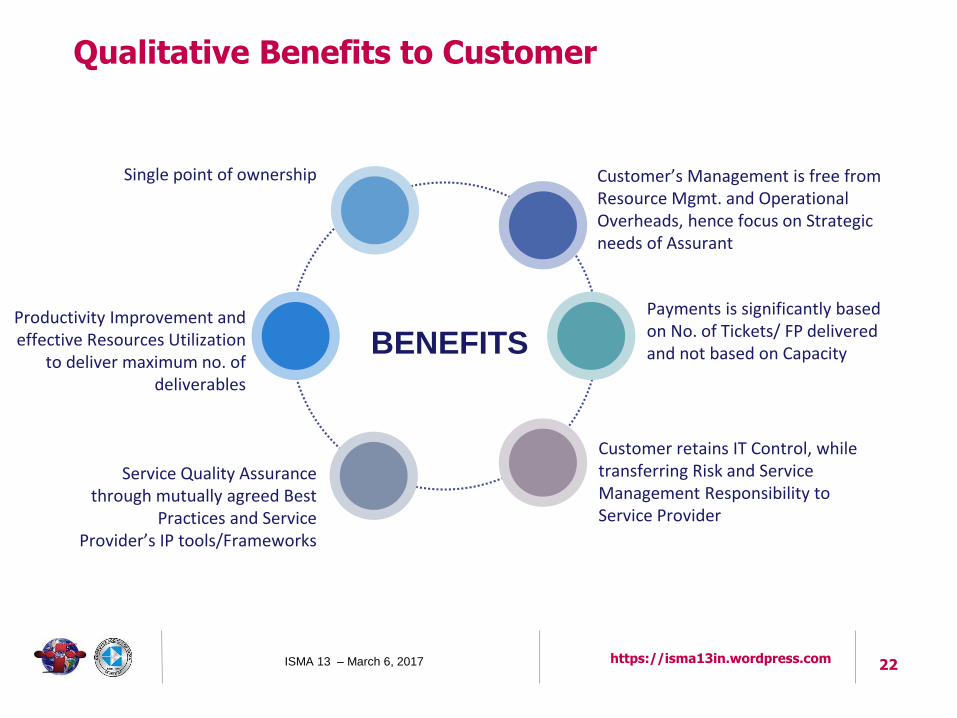
Qualitative Benefits to Customer
Customer retains IT Control, while transferring Risk and Service Management Responsibility to Service Provider
Productivity Improvement and effective Resources Utilization
to deliver maximum no. of deliverables
Customer’s Management is free fromResource Mgmt. and Operational Overheads, hence focus on Strategic needs of Assurant
Single point of ownership
Service Quality Assurance through mutually agreed Best
Practices and Service Provider’s IP tools/Frameworks
Payments is significantly based on No. of Tickets/ FP delivered and not based on CapacityBENEFITS

23ISMA 13 – March 6, 2017 https://isma13in.wordpress.com
Customer Story
14
9
5
0
2
4
6
8
10
12
14
16
0%
10%
20%
30%
40%
50%
60%
70%
80%
90%
100%
Year 1 Year 2 Year 3
Major Banking Customer
% Over Budget/Schedule Dollars (Millions) out of Financial Control
Quantative Benfits
Traditional Model
MS Model Pilot
MS Model Full fledge

24ISMA 13 – March 6, 2017 https://isma13in.wordpress.com
THANK YOU !!!

25ISMA 13 – March 6, 2017 https://isma13in.wordpress.com
Fully Mature FP based Model
Support
Contract Year 1
State of Artefacts –Completen
ess/ Correctness
Business Criticality and System Complexity
High Medium Low
Application Software Stability Application Software Stability Application Software Stability
Poor Moderate Good Poor Moderate Good Poor Moderate Good
Good 450 425 400 350 325 300 250 225 200
Moderate 500 480 450 400 380 350 300 280 250
Poor 550 525 500 450 425 400 350 325 300
Price per 100 Function Points for each application
Numbers are SAMPLE and not actuals

26ISMA 13 – March 6, 2017 https://isma13in.wordpress.com
Critical Success Factors
• Mutual understanding and agreement on standard measure of unit work and mechanism formeasurement
• Predictable work load forecast (30-60-90) plan to have to ensure the Delivery capacity andcapability managed optimally for mutual beneficial
• Availability of standard Tools/templates (project Estimation, Change, Release & ITSM tools) toaccurately measure and reconcile volume of work quantitatively, to support new Operating model
• Change of terms and conditions w.r.t Pricing, Rate card and (FP/SP based rate card)
• Mutual Agreement on service procurement and Invoicing and Billing Process (Invoice now will haveoutput units in place of Hours/resource Names)
• Manged Service Roles and Responsibilities shift w.r.t Managed Service model between ServiceProvider & Customer
• Minimum quantity of work commitment (X volume/Month/per service Line) from Customer tohave win-win situation for both sides for Optimum utilization of capacity & capability

27ISMA 13 – March 6, 2017 https://isma13in.wordpress.com
Assumptions
• Moving to Output based charge, Critical need to have Mutual SLAs from both partner side as wellas customer side (e.g. Milestone based Delivery SLA with Service Partner and milestonedeliverables acceptance SLA for customer to minimise delays in schedules from both side)
• Any new scope to be added to new model will need to go through Change Management Process(Transition phase to new model)
• Any scope of work that cannot be quantified into work units (Mutually agreed) will be charged onFixed Capacity based Monthly
• In new Model, Service Provider will have control on Resource Management, will have Teamrestructure as per new model, however if Customer would like to retain some named resourcesand location preference. Work delivered by named resources will be charged on T&M basis
• Service Provider will charge minimum volume of work where Customer could not generate monthlyminimum commitment of work mutually agreed