mr volumetry of intracranial and brain … otak kepada isipadu intrakranial dengan umur. korelasi...
TRANSCRIPT
MR VOLUMETRY OF INTRACRANIAL
AND BRAIN VOLUME IN NORMAL
ADULT POPULATION AGED 40
YEARS OLD AND ABOVE
DR. MUHAMAD ZABIDI BIN AHMAD
Dissertation Submitted in Partial Fulfillment of the Requirement for the Degree of Master of Medicine
(RADIOLOGY)
2014
MR VOLUMETRY OF INTRACRANIAL
AND BRAIN VOLUME IN NORMAL
ADULT POPULATION AGED 40
YEARS OLD AND ABOVE
DR. MUHAMAD ZABIDI BIN AHMAD
Dissertation Submitted in Partial Fulfillment of the Requirement for the Degree of Master of Medicine
(RADIOLOGY)
SUPERVISOR: ASSOCIATE PROFESSOR DR. MOHD. SHAFIE BIN
ABDULLAH
CO-SUPERVISOR: DR. WIN MAR@SALMAH JALALUDDIN
SCHOOL OF MEDICAL SCIENCES,
UNIVERSITI SAINS MALAYSIA.

i
ACKNOWLEDGEMENT
All praises to Allah SWT for His blessings, of which I was able to
complete my dissertation. My heartfelt gratitude to my supervisor and co-
supervisor, Associate Professor Dr. Mohd Shafie Abdullah and Dr. Win
Mar@Salmah Jalaludin for their guidance and supervision. My gratitude to
Professor Dr. Syed Hatim Noor and Dr. Aniza Abd Aziz from the Unit of
Biostatistics and Research Methodology for their help and advice. Special
thanks are to all staffs of the Department of Radiology, School of Medical
Sciences, Universiti Sains Malaysia, whom without their assistance and
cooperation this dissertation would not have been completed. Special mention
to the Human Research Ethical Committee, School of Medical Sciences,
Universiti Sains Malaysia for approving the study.
Finally, I am forever grateful to my lovely wife, Dr. Suria Emilia Suhana
binti Othman Tan and my children, Nur Ainul Nabilah, Muhammad Arif Fadhil
and Siti Nur Khadijah. They have been and always are my source of inspiration
of which without their understanding and encouragement, this dissertation
would not have been completed.

ii
TABLE OF CONTENTS
ACKNOWLEDGEMENT i
LIST OF FIGURES v
LIST OF TABLES vii
ABBREVIATIONS ix
ABSTRAK x
ABSTRACT xiii
1. INTRODUCTION 1
2. LITERATURE REVIEW 4
2.1. INTRACRANIAL ANATOMY 4
2.2. BRAIN ANATOMY AND FUNCTION 11
2.3. BRAIN DEVELOPMENT 15
2.4. BRAIN VOLUME IN NORMAL AGING PROCESS 17
2.5. DISORDERS AFFECTING THE BRAIN VOLUME 19
2.6. VOLUMETRY METHOD 24
2.7. BRAIN VOLUMETRY IN NORMAL POPULATION 26
3. OBJECTIVES 29
3.1. GENERAL OBJECTIVE 29
3.2. SPECIFIC OBJECTIVES 29
3.3. PROBLEM STATEMENT 29
3.4. HYPOTHESIS 30
3.5. BENEFITS OF RESEARCH 30
4. METHODOLOGY 31
4.1. STUDY DESIGN 31
iii
4.2. STUDY POPULATION AND PATIENT SELECTION 31
4.3. INCLUSION CRITERIA 31
4.4. EXCLUSION CRITERIA 32
4.5. SAMPLE SIZE DETERMINATION 33
4.6. POWER OF THE STUDY 37
4.7. MRI PROTOCOL 38
4.8. IMAGE VIEWING 39
4.9. MANUAL TRACING OF INTRACRANIAL AND BRAIN VOLUMES 40
4.10. VALIDATION TEST 49
4.11. STUDY FLOW 50
4.12. DATA COLLECTION AND STATISTICAL ANALYSIS 51
5. RESULTS 52
5.1. DESRICPTIVE DATA 52
5.2. INTRACRANIAL VOLUME 55
5.3. BRAIN VOLUME 63
5.4. BRAIN VOLUME TO INTRACRANIAL VOLUME RATIO 71
6. DISCUSSION 79
6.1. OVERVIEW 79
6.2. DEMOGRAPHIC CHARACTERISTICS 80
6.3. INTRACRANIAL VOLUME 81
6.4. BRAIN VOLUME 85
6.7. BRAIN VOLUME TO INTRACRANIAL VOLUME RATIO 91
6.8. CORRELATIONS OF INTRACRANIAL VOLUME, BRAIN VOLUME
AND BRAIN VOLUME TO INTRACRANIAL VOLUME RATIO WITH
AGE AND SEX
93

iv
7. CONCLUSION 97
8. LIMITATIONS 98
9. RECOMMENDATIONS 99
BIBLIOGRAPHY 100
APPENDICES 108
APPENDIX A
APPENDIX B
APPENDIX C
108
109
110

v
LIST OF FIGURES
Figure 2.1. Lithograph plate of the human cranium 4
Figure 2.2. Lithograph plate showing inside of the human
cranium
5
Figure 2.3. Lithograph plate showing the base of the
human cranium
6
Figure 2.4. Anterior cranial fossa and part of middle cranial
fossa
8
Figure 2.5. Middle and posterior cranial fossa 10
Figure 2.6. Drawing of the human brain 11
Figure 2.7. Meningeal layers of the brain 13
Figure 2.8. The human embryo’s brain at four weeks
gestation
16
Figure 4.1. Manual tracing delineation of intracranial area 43
Figure 4.2. Manual tracing delineation of brain surface
area
46
Figure 4.3. Flow of the study 50
Figure 5.1. Age distribution of study participants 53
Figure 5.2. Age distribution of study participants according
to sex
54
Figure 5.3. Mean intracranial volume for male and female
subjects are normally distributed. Assumption
was met
56
Figure 5.4. Correlation between mean intracranial volume
with age among all subjects
59
Figure 5.5. Linear relationship between intracranial volume
and age among all subjects
61
Figure 5.6. Mean brain volume among male and female
subjects was normally distributed. Assumption
was met
64

vi
Figure 5.7. Correlation between mean brain volume with
age among all subjects
67
Figure 5.8. Linear relationship between brain volume and
age among all subjects
69
Figure 5.9. Brain volume to intracranial volume ratio
among male and female subjects was normally
distributed
72
Figure 5.10. Correlation between brain volume to
intracranial volume ratio with age among all
subjects
75
Figure 5.11. Linear relationship between brain volume to
intracranial volume ratio with age among all
subjects
77

vii
LIST OF TABLES
Table 4.1. MRI brain sequences used in the study 38
Table 4.2. Parameters of MRI sequences 38
Table 4.3. Inter-rater reliability measured by Intraclass
Correlation Coefficient
49
Table 5.1. Demographic characteristics of study
participants
52
Table 5.2. Mean intracranial volume for all subjects 55
Table 5.3. Comparison of mean intracranial volume
according to sex
57
Table 5.4. Correlation between mean intracranial volume
with age and sex
58
Table 5.5. The relationship between mean intracranial
volume with age and sex
60
Table 5.6. Factors associated with mean intracranial
volume among study population
62
Table 5.7. Mean brain volume for all subjects 63
Table 5.8. Comparison of mean brain volume according to
sex
65
Table 5.9. Correlation between mean brain volume with
age and sex
66
Table 5.10. The relationship between mean brain volume
with age and sex
68
Table 5.11. Factors associated with mean brain volume
among study population
70
Table 5.12. Brain volume to intracranial volume ratio for all
subjects
71
Table 5.13. Comparison of brain volume to intracranial
volume ratio according to sex
73
Table 5.14. Correlation between brain volume to intracranial
volume ratio with age and sex
74

viii
Table 5.15.
The relationship between age and sex with brain
volume to intracranial volume ratio
76
Table 5.16. Factors associated with brain volume to
intracranial volume ratio among study population
78
Table 6.1. Comparison of mean total intracranial volumes
according to sex to other published data
85
Table 6.2. Comparison of mean total brain volumes
according to sex to other published data
91

ix
ABBREVIATIONS
BIR Brain to Intracranial Volume Ratio
BV Brain Volume
CI Confidence Interval
CT Computed Tomography
DICOM Digital Imaging and Communications in Medicine
FDA United States Food and Drug Administration
GNU GNU's Not Unix! (a recursive acronym)
IBM International Business Machines Corporation
ICD International Classification of Diseases
ITK Insight Segmentation and Registration Toolkit
IV Intracranial Volume
MRI Magnetic Resonance Imaging
PACS Picture Archiving and Communications System
PET-CT Positron Emission Tomography and Computed
Tomography
RU Research University
SD Standard Deviation
SPSS Statistical Package for the Social Sciences, later
Statistical Product and Service Solutions
T1WI T1 Weighted Images
T2WI T2 Weighted Images
VTK Visualization ToolKit

x
ABSTRAK
Tajuk: Pengukuran isipadu intrakranial dan otak menggunakan pengimejan
MRI di kalangan orang dewasa berumur 40 tahun ke atas
Pendahuluan:
Magnetic Resonance Imaging (MRI) telah memangkinkan dengan ketara
banyak kajian yang melibatkan otak dengan lebih ramai penyelidik mengkaji
bukan sahaja aspek anatomi dan struktur otak, tetapi juga aspek fungsi kerana
diskriminasi tisu lembut baik (Kennedy et al., 2003). MRI juga membolehkan
penyelidik untuk mengkaji perubahan yang melibatkan jumlah isipadu
intrakranial, otak dan isipadu ruangan dalam otak, memberikan data-data
penting mengenai perubahan normal otak manusia dan penyakit degeneratif
tertentu atau penyakit psikiatri (Ohnishi et al, 2001; Peters, 2006).
Isipadu intrakranial dan otak boleh diperolehi daripada MRI. Secara
umum isipadu intrakranial boleh diukur secara manual daripada imej T1.
Kajian ini bertujuan untuk mengkaji isipadu intrakranial, isipadu otak dan
nisbah isipadu intrakranial kepada isipadu otak dalam subjek yang sihat. Data
yang diperolehi kemudiannya boleh digunakan dalam meramalkan perubahan
degeneratif pada pesakit dengan penyakit pesakit dengan penyakit mental
seperti skizofrenia dan gangguan bipolar atau Alzheimer.
Objektif:
Untuk menentukan isipadu intrakranial dan isipadu otak yang normal
dalam kalangan Melayu dewasa yang sihat yang berumur 40 tahun dan ke
atas.

xi
Tatacara:
Ini adalah satu kajian keratan rentas yang melibatkan 58 subjek yang
menjalani MRI di bawah penyelidikan sebelumnya. Umur subjek adalah antara
41 hingga 77 tahun.
MRI dilakukan dengan menggunakan pengimbas Signa Horison LX 1.0
Tesla oleh General Electric. Imej MRI diperolehi dalam keratan sagital dan
paksi T1 dengan ketebalan 5milimeter dengan jurang 2milimeter. Isipadu
intrakranial dan otak diukur secara terapan manual menggunakan kaedah
selangan antara keratan. Purata (isipadu sisihan) daripada isipadu intrakranial
dan isipadu otak telah dikira dan dianalisis menggunakan IBM SPSS versi 20.
Keputusan:
Purata (isipadu sisihan) isipadu intrakranial adalah 1397.06 cm3 (132.51
cm3) bagi semua subjek. Purata isipadu intrakranial bagi subjek lelaki adalah
1496.12 cm3 (100.08 cm3) dan subjek wanita adalah 1310.79 cm3 (90.34 cm3).
Purata isipadu otak bagi keseluruhan subjek adalah 1245.29 cm3 (125.34
cm3). Purata isipadu otak bagi keseluruhan subjek lelaki adalah 1338.05 cm3
(91.96 cm3) dan subjek wanita adalah 1164.49 cm3 (89.61 cm3).
Purata nisbah isipadu keseluruhan intrakranial kepada isipadu otak untuk
semua subjek adalah 0.8911 (0.0245). Purata nisbah isipadu keseluruhan
intracranial kepada isipadu otak bagi subjek lelaki adalah 0.8946 (0.0276) dan
subjek wanita adalah 0.8881 (0.0214).
Tidak ada perbezaan yang signifikan daripada purata isipadu intrakranial,
purata isipadu otak dan nisbah isipadu otak kepada isipadu intrakranial antara
subjek lelaki dan perempuan. Terdapat korelasi yang signifikan antara nisbah

xii
isipadu otak kepada isipadu intrakranial dengan umur. Korelasi yang signifikan
dilihat antara jumlah purata intrakranial dengan umur dan jantina. Jantina
adalah satu faktor yang penting yang berkaitan dengan purata jumlah isipadu
otak.
Kesimpulan:
Kami telah memperolehi data normatif untuk anggaran dan meramalkan
perubahan degeneratif masa depan di kalangan penduduk Melayu. Keputusan
ini paling bermanfaat untuk pesakit yang mengalami kemerosotan kognitif
ringan atau yang baru didiagnosis gangguan neuropsikiatri seperti penyakit
Alzheimer atau skizofrenia. Walaubagaimanapun, terdapat beberapa limitasi di
dalam kajian ini seperti jumlah subjek yang sedikit dalam kalangan satu
bangsa, terapan manual berserta penggunaan MRI 1 Tesla yang mungkin
menyebabkan penggunaan hasil kajian yang terhad.

xiii
ABSTRACT
Topic: MR volumetry of intracranial and brain volume in normal adult population
aged 40 years old and above.
Introduction:
Magnetic Resonance Imaging (MRI) has significantly accelerated many
studies involving the brain with more researchers looking into not only anatomy
and structural aspects of the brain, but also functional aspect due to excellent
soft tissue discrimination (Kennedy et al., 2003). MRI also enables researchers
to study the changes involving intracranial volume, brain volume and
compartmental volumes, giving valuable data regarding the normal human brain
morphological changes and in certain degenerative diseases or psychiatric
illnesses (Ohnishi et al., 2001; Peters, 2006).
Total intracranial volume and brain volume can be obtained from MRI. In
general intracranial volume can be measured manually from T1-weighted
images.
This study aimed to study the intracranial volume, brain volume and
intracranial volume to brain volume ratio in the normal healthy subjects. Data
obtained can later be used in predicting degenerative changes in patients with
Alzheimer’s disease or patients with psychiatric illnesses such as schizophrenia
and bipolar disorder.
Objectives:
To determine the intracranial volume and brain volume in normal healthy
adult Malay aged 40 years old and above.
xiv
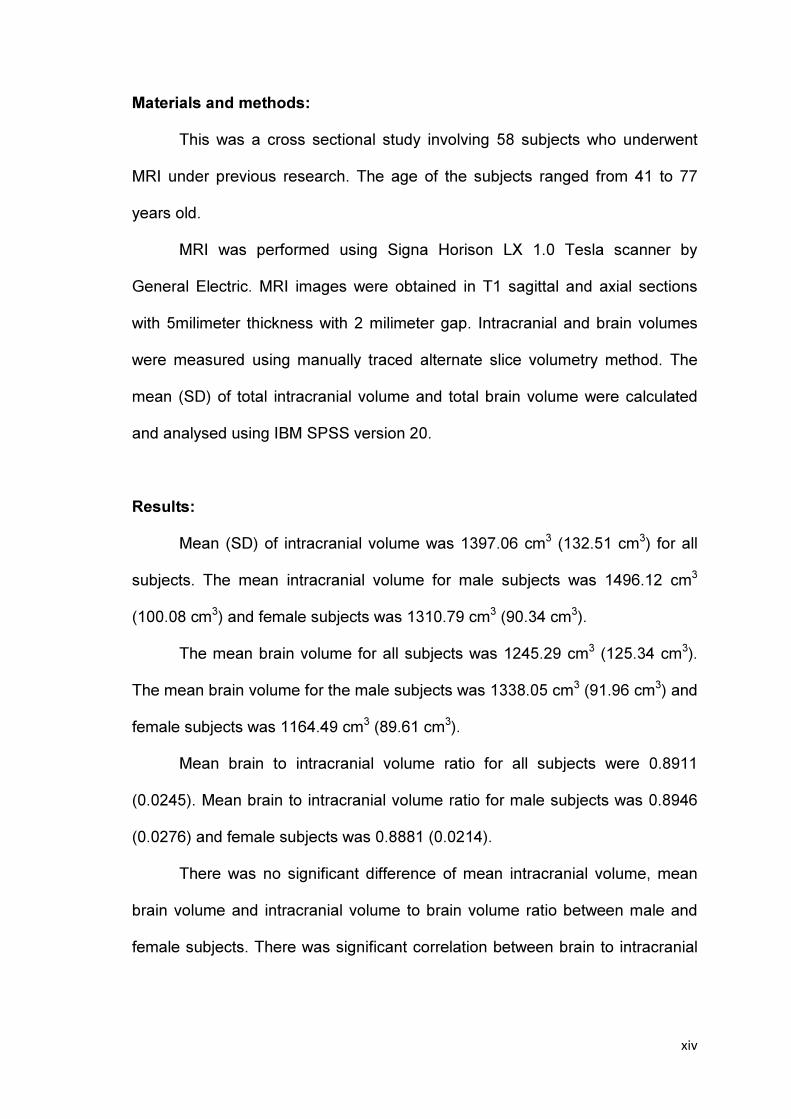
Materials and methods:
This was a cross sectional study involving 58 subjects who underwent
MRI under previous research. The age of the subjects ranged from 41 to 77
years old.
MRI was performed using Signa Horison LX 1.0 Tesla scanner by
General Electric. MRI images were obtained in T1 sagittal and axial sections
with 5milimeter thickness with 2 milimeter gap. Intracranial and brain volumes
were measured using manually traced alternate slice volumetry method. The
mean (SD) of total intracranial volume and total brain volume were calculated
and analysed using IBM SPSS version 20.
Results:
Mean (SD) of intracranial volume was 1397.06 cm3 (132.51 cm3) for all
subjects. The mean intracranial volume for male subjects was 1496.12 cm3
(100.08 cm3) and female subjects was 1310.79 cm3 (90.34 cm3).
The mean brain volume for all subjects was 1245.29 cm3 (125.34 cm3).
The mean brain volume for the male subjects was 1338.05 cm3 (91.96 cm3) and
female subjects was 1164.49 cm3 (89.61 cm3).
Mean brain to intracranial volume ratio for all subjects were 0.8911
(0.0245). Mean brain to intracranial volume ratio for male subjects was 0.8946
(0.0276) and female subjects was 0.8881 (0.0214).
There was no significant difference of mean intracranial volume, mean
brain volume and intracranial volume to brain volume ratio between male and
female subjects. There was significant correlation between brain to intracranial
xv
volume ratio with age. Significant correlation was seen between mean
intracranial volume with age and sex, and mean brain volume with sex.
Conclusion:
We have obtained a normative data for estimation and predicting future
degenerative events in Malay population. The results gathered would be most
beneficial for those patients who are experiencing mild cognitive impairment or
newly diagnosed neuropsychiatric disorders such as Alzheimer’s disease or
schizophrenia. Limitations such as small sample size within single ethnicity,
manual tracing method with 1 Tesla MRI machines would however limit the
usage of this data.

ABSTRACT
MR VOLUMETRY OF INTRACRANIAL AND BRAIN VOLUME IN NORMAL
ADULT POPULATION AGED 40 YEARS OLD AND ABOVE.
Dr. Muhamad Zabidi bin Ahmad
MMed Radiology
Department of Radiology,
School of Medical Sciences, Universiti Sains Malaysia,
Health Campus, 16150 Kelantan, Malaysia.
Introduction:
Magnetic Resonance Imaging (MRI) has significantly accelerated many
studies involving the brain with more researchers looking into not only anatomy
and structural aspects of the brain, but also functional aspect due to excellent
soft tissue discrimination (Kennedy et al., 2003). MRI also enables researchers
to study the changes involving intracranial volume, brain volume and
compartmental volumes, giving valuable data regarding the normal human brain
morphological changes and in certain degenerative diseases or psychiatric
illnesses (Ohnishi et al., 2001; Peters, 2006).
Total intracranial volume and brain volume can be obtained from MRI. In
general intracranial volume can be measured manually from T1-weighted
images.
This study aimed to study the intracranial volume, brain volume and
intracranial volume to brain volume ratio in the normal healthy subjects. Data

obtained can later be used in predicting degenerative changes in patients with
Alzheimer’s disease or patients with psychiatric illnesses such as schizophrenia
and bipolar disorder.
Objectives:
To determine the intracranial volume and brain volume in normal healthy
adult Malay aged 40 years old and above.
Materials and methods:
This was a cross sectional study involving 58 subjects who underwent
MRI under previous research. The age of the subjects ranged from 41 to 77
years old.
MRI was performed using Signa Horison LX 1.0 Tesla scanner by
General Electric. MRI images were obtained in T1 sagittal and axial sections
with 5milimeter thickness with 2 milimeter gap. Intracranial and brain volumes
were measured using manually traced alternate slice volumetry method. The
mean (SD) of total intracranial volume and total brain volume were calculated
and analysed using IBM SPSS version 20.
Results:
Mean (SD) of intracranial volume was 1397.06 cm3 (132.51 cm3) for all
subjects. The mean intracranial volume for male subjects was 1496.12 cm3
(100.08 cm3) and female subjects was 1310.79 cm3 (90.34 cm3).

The mean brain volume for all subjects was 1245.29 cm3 (125.34 cm3).
The mean brain volume for the male subjects was 1338.05 cm3 (91.96 cm3) and
female subjects was 1164.49 cm3 (89.61 cm3).
Mean brain to intracranial volume ratio for all subjects were 0.8911
(0.0245). Mean brain to intracranial volume ratio for male subjects was 0.8946
(0.0276) and female subjects was 0.8881 (0.0214).
There was no significant difference of mean intracranial volume, mean
brain volume and intracranial volume to brain volume ratio between male and
female subjects. There was significant correlation between brain to intracranial
volume ratio with age. Significant correlation was seen between mean
intracranial volume with age and sex, and mean brain volume with sex.
Conclusion:
We have obtained a normative data for estimation and predicting future
degenerative events in Malay population. The results gathered would be most
beneficial for those patients who are experiencing mild cognitive impairment or
newly diagnosed neuropsychiatric disorders such as Alzheimer’s disease or
schizophrenia. Limitations such as small sample size within single ethnicity,
manual tracing method with 1 Tesla MRI machines would however limit the
usage of this data.
Associate Professor Dr. Mohd. Shafie Abdullah (Supervisor)
Dr. Win Mar@Salmah Jalaluddin (Co-Supervisor)

1
1 Introduction
The human brain is an important part of central nervous system which
consists of cerebrum, cerebellum and midbrain. Many studies have been
published in regards to brain anatomy, physiology and function. With the advent
of medical imaging in the last 50 years, the study of the brain has become more
intense and detailed, with more researchers looking into more detailed and
specific aspects of the human brain (Buckner et al., 2008).
For 100 years prior to the invention of cross sectional imaging such as
Computed Tomography (CT), the study of the human brain largely conducted
through autopsy (Miller et al., 1980; Hwang et al., 1995). With CT scan, the
study of the human brain has accelerated and became more detailed.
Researchers such as Abbott et al. (2000) and Hahn et al. (1984) studied the
intracranial cavity using CT scan, although most of their studies involved
paediatric population. Nevertheless, with cross sectional imaging, many novel
measurement and volumetry techniques were developed and utilized.
The arrival of Magnetic Resonance Imaging (MRI) has significantly
accelerated many studies involving the brain with more researchers looking into
not only anatomy and structural aspects of the brain, but also functional aspect.
This is partly because MRI allows excellent soft tissue discrimination (Kennedy
et al., 2003). MRI also enables researchers to study the changes involving
intracranial volume, brain volume and compartmental volumes, giving valuable
data regarding the normal human brain morphological changes and in certain

2
degenerative diseases or psychiatric illnesses (Ohnishi et al., 2001; Peters,
2006).
Intracranial volume measurement has long been studied by researchers
because of its usefulness in recognizing changes within the human brain.
Intracranial volume is defined as the total volume within the cranial space,
which includes the brain, meninges and cerebrospinal fluid. Previously data
gathered from autopsies considered to be the gold standard in measuring total
intracranial volume. However, problems surrounding the autopsy process in
regards to presence of concomitant illness, long intervals between death and
brain removal and weighing in different conditions may or may not affect the
data gathered. MRI as a non-invasive method of study has eliminated inherent
difficulties that come with autopsy process, thus making the measurement of
brain and its anatomical parts much more accurate.
Intracranial volume measurement provides stable and accurate data in
studying and estimating the volumetric changes within the cranium and its
contents. Intracranial volume measurement can be used as a predictor to
degenerative brain disease in early stages when measured together with total
brain volume or ventricular volume, such as in patients with Alzheimer’s
disease, schizophrenia, bipolar disorders or other conditions such as
Huntington’s disease (Fox and Freeborough, 1997). It can also be used as a
predictor for severity in patients with these conditions (Kruggel, 2006; El-Sayed,
2010; Reite et al., 2010; Giorgio and De Stefano, 2013).
Intracranial volume and brain volume can be obtained from MRI. MRI
itself can be performed in various planes such as sagittal and coronal or axial.
3
Studies showed that there are no differences in intracranial volume measured in
T1-weighted or T2-weighted images (Keller and Roberts, 2009). However, in
general intracranial volume can be measured manually from T1-weighted
images although there are studies being done to compare between automatic
and manual measurements (Kennedy et al., 2009).
This study aimed to study the intracranial volume as well as the brain
volume in the normal healthy patients to provide normative data about
intracranial volume/total brain volume ratio. This data can later be used later in
predicting degenerative changes in patients with Alzheimer’s disease or
patients with psychiatric illnesses such as schizophrenia and bipolar disorder.

4
2 Literature review
2.1 Intracranial anatomy
The intracranial cavity is a volume enclosed by the frontal, occipital,
sphenoid and ethmoid bones with a pair of parietal and temporal bones on its
sides. It is occupied by the human brain and its associated vascular supply. In
humans, the size and shape of the brain is partly determined by the size and
shape of the human skull.
Figure 2.1. Lithograph plate of the human cranium (Adapted from Gray and
Lewis (1924))

5
Figure 2.2. Lithograph plate showing the inside of the human cranium (Adapted
from Gray and Lewis (1924))

6
Figure 2.3. Lithograph plate showing the base of the human cranium (Adapted
from Gray and Lewis (1924))
Groove for super. sagittai sinus Grooves for anter. meningeal vessels
Foramen ca<cwm·- - -
Posterior clinoid process
Groove for abd1u;ent nerve Foramen lacen~m
Orifice of carotid canol Depression for semil1Lna.·r ganglion
JlaBtoid formnen~--.-::.---~
Postenor meningeal m·•oot,es ·---

7
The human cranium is consists of neurocranium and viscerocranium.
These two different parts are derived from different embryological processes.
The viscerocranium is formed by the facial bones while the neurocranium is
formed by the skull or cranial vault. These bones are formed and held together
by a series of sutures and joints.
Other than containing the brain, the cranium also contains sinus cavities.
Sinus cavities are air filled cavities which are lined by the same epithelial cells
that lines the airways.
The cranium was developed from endochondral ossification and
intramembranous ossification. The bones that support the brain are mostly
developed from endochondreal ossification while the skull roof is formed by
means of endochondral ossification.
During pregnancy, especially during the first trimester, the geometry of
the cranium and its fossae are rapidly changing, thus it is the most important
phase for development of any congenital skull defects.
At birth, the bones of the cranium are separated by fontanelles.
Fontanelles are regions containing dense connective tissue which are replaced
by bone as the child grows older. There are six fontanelles which are frontal,
occipital, sphenoid and mastoid.
Cranial cavity is divided into three cranial fossae which are anterior,
middle and posterior cranial fossae. Anterior cranial fossa houses the frontal
lobes of the brain. Anteriorly, it is bounded by the posterior wall of frontal
sinuses. Posteriorly it is bounded by the anterior clinoid process and planum
sphenoidale. Bilateral frontal bones form the lateral bounderies. Ethmoid bone

8
forms the central part of the floor. Cribriform plate is located central to this, in
which the olfactory nerve passes. Crista galli is a sharp upward projection of the
ethmoid bone in the midline, where the falx cerebri is attached. Foramen cecum
lies between the frontal crest and crista galli. This is the site of communication
between the draining veins of the nasal cavity and superior sagittal sinus.
Sulcus chiasmaticus which houses the optic chiasm sits posteriorly in the
midline.
Figure 2.4. Anterior cranial fossa and part of middle cranial fossa (Adapted
from Singh (2004))

9
Middle cranial fossa is located posterior to the anterior cranial fossa and
is deeper than the anterior cranial fossa. It is narrow in the middle and widens at
the lateral aspects of the skull. Anteriorly it is bounded by the posterior margins
of the lesser wing of sphenoid, anterior clinoid process and anterior margin of
the chiasmatic groove. Posteriorly it is bounded by superior angles of petrous
part of temporal bone and dorsum sellae. Laterally it is bounded by the
squamous temporal, sphenoid angle of the temporal bone and greater wing of
sphenoid. It houses the temporal lobes of the brain and part of the brainstem.
Posterior cranial fossa is the deepest and the largest of the three cranial
fossae. It is formed by the dorsum sellae and clivus of the sphenoid; occipital,
petrous and mastoid part of the temporal bone and the mastoid angle of the
parietal bone. Posterior cranial fossa houses the cerebellum, pons and medulla
oblangata. Foramen magnum is situated on the floor of the posterior cranial
fossa.

10
Figure 2.5. Middle and posterior cranial fossa (Adapted from Singh (2004))

11
2.2 Brain anatomy and function
The brain is an organ suspended in cerebrospinal fluid with average
weight of approximately 1.5 kilograms. Human brain shares similar basic
general structures as to other mammals although the ratio of human brain to the
body is larger compared to other mammals. The organ is suspended in the
cerebrospinal fluid and protected from external elements by skull vault. It is
isolated from the rest of the circulation by the blood-brain barrier.
Figure 2.6. Drawing of the human brain (Adapted from Rodgers (2008))

12
The brain is divided into four lobes which are the frontal, parietal,
temporal and occipital lobes. Each of this lobes consist of numerous cortical
folds, each control various functions such as memory, motor, sensory, language
and vision. The lobes names are derived from the skull bones that overlies them
rather than being an actual lobe by itself. The frontal lobe controls behaviour,
attention and other executive functions. The parietal lobe controls
somatosensation, hearing, language and spatial cognition. The temporal lobe
controls auditory and visual memories, language and some speech and
hearing. The occipital lobe controls visual, visual-spatial cognition, colour and
movement.
The largest part of the brain is the cerebrum which is located superior to
the brain stem. It contains and covered by numerous convoluted cortical layers.
The brainstem is located inferior to the cerebrum while the cerebellum is located
posterior to the brainstem.
Cerebral cortex is a dominant feature of the human brain. It is essentially
a sheet of neural tissue, folded allowing large surface area to fit inside a
cranium. Total surface area of each cerebral hemisphere is estimated to
approximately 1.3 square feet (Toro et al., 2008).
The brain is firmly surrounded by three layers of membranes or
meninges, which protects the brain from injury and infection. The three layers
are dura mater, arachnoid mater and pia mater.

13
Figure 2.7. Meningeal layers of the brain (Adapted from Knipe (2013))
Dura mater is also known as pachymeninx while the arachnoid mater and
pia mater are collectively referred to as lepromeninges. Dura mater is a thick
membrane derived from the mesoderm. It surrounds the brain and spinal cord,
keeping the cerebrospinal fluid within. It is pierced by the cranial nerves, the
internal carotid arteries and vertebral arteries. Intracranially it is formed two
layers which are the outer endosteal layer that is continuous via the sutures and
foraminae with the periosteum; and inner meningeal layer, which continuous
inferiorly the theca of the spinal cord.
Arachnoid mater is the second layer of the meninges, interposed
between the more superficial dura mater and deeper pia mater. It is separated
from the pia mater by subarachnoid space in which the cerebrospinal fluid

14
flows. Arachnoid mater loosely surrounds the brain and extends to the superior
surface of pituitary fossa but does not envelope the pituitary itself.
Pia mater is a thin fibrous tissue, impermeable to fluid and extends into
the sulci. It is a translucent, mesh like meningeal cover, spanning nearly the
entire surface of the brain. It is highly vascular layer with blood vessels
supplying the brain as well as protecting the blood vessels and encloses the
venous sinuses.
15
2.3 Brain Development
During gastrulation cells will migrate into the interior part of the embryo
and later forms three germinal layers. These germinal layers are endoderm,
mesoderm and ectoderm in which endoderm giving rise to skin and nervous
system, endoderm gives rise to gastrointestinal system while mesoderm gives
rise to the rest of the organs.
Post gastrulation, mesoderm forms the notochord in which during the
third week of gestation, notochord send signals to the ectoderm and becoming
neuroectoderm. This forms the neural plate which is the origin of the central
nervous system. Neural plate then folds to form neural groove and later folds to
form neural tube. The ventral part of this tube is called the basal plate while
dorsal part is called the alar plate.
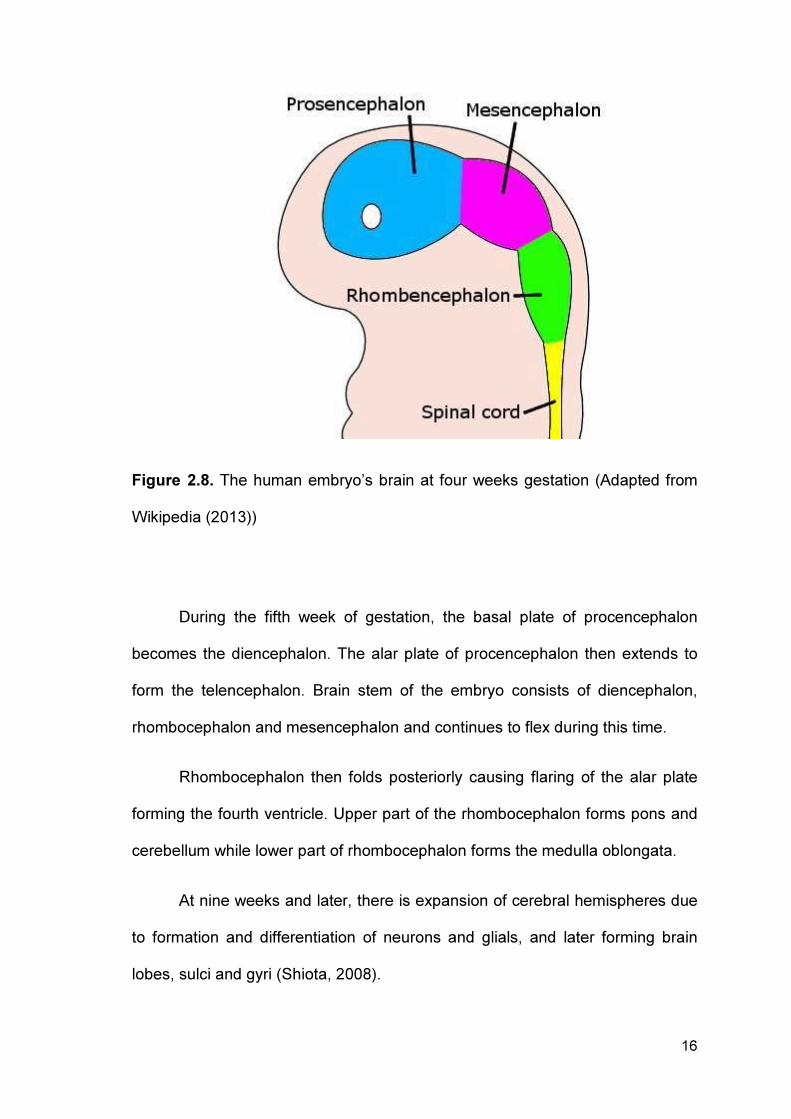
Later in fourth week of gestation, superior part of the neural tube flexes at
the level of mesencephalon. Procencephalon forms superior to the
mesencephalon while rhombocephalon forms inferior to mesencephalon. At the
basal plate of procencephalon, the optical vessels form.
16
Figure 2.8. The human embryo’s brain at four weeks gestation (Adapted from
Wikipedia (2013))
During the fifth week of gestation, the basal plate of procencephalon
becomes the diencephalon. The alar plate of procencephalon then extends to
form the telencephalon. Brain stem of the embryo consists of diencephalon,
rhombocephalon and mesencephalon and continues to flex during this time.
Rhombocephalon then folds posteriorly causing flaring of the alar plate
forming the fourth ventricle. Upper part of the rhombocephalon forms pons and
cerebellum while lower part of rhombocephalon forms the medulla oblongata.
At nine weeks and later, there is expansion of cerebral hemispheres due
to formation and differentiation of neurons and glials, and later forming brain
lobes, sulci and gyri (Shiota, 2008).

17
2.4 Brain volume in normal aging process
Aging has shown to have effects on the cells, vasculature, molecules,
gross morphology and cognition (Peters, 2006). Therefore, aging process is
shown to have similar effects to the brain as well as the rest of the body. Many
recent studies show age related decrease in brain size as well as expansion of
the cerebral ventricles that being shown to expand as a function of age.
Although regional volume decrease is not uniform throughout the whole brain
(Trollor and Valenzuela, 2001), it is estimated that the brain shows decline in
volume and/or weight around 2-5% per decade after the age of 40 years old
(Peters, 2006).
Some studies also had shown almost similar findings, showing that the
brain shrinks at rates up to 1% each year. Literature described that the
shrinking of grey matter is reported to be originated from neuronal cell death as
well as decline in neuronal volume. Rate of reduction of brain volume also
showed marked increase in age more than 70 years old (Scahill et al., 2003).
Aging brain also widely seen as a cause for reduced or impaired memory
and other cognitive function. For example impairment in episodic and semantic
memory which is commonly seen in Alzheimer’s disease (Parkin, 1983).
Memory impairment and aging are closely related to two neurotransmitters –
dopamine and serotonin as well as other hormonal influence. These two factors
are related not only to memory but to aging process as well.
Post mortem and in vivo imaging studies have suggested that prefrontal,
entorlinal and temporal cortex are the most severely affected regions of the
brain in regards to aging (Haug, 1985). While these changes are physiologic

18
and age related, studies suggested that patients with Alzheimer’s disease have
shown to have great significant difference in morphology of the brain (Ohnishi et
al., 2001). This indicated that not only there are differences in brain morphology,
but also there are changes in brain volume as well as a whole.

19
2.5 Disorders affecting the brain volume
There are a few diseases which affects the brain and its morphology.
Among these, Alzheimer’s disease, schizophrenia and bipolar disorder has
become the subject for research of brain morphology. Many of the studies
looked into the general brain morphology changes while some looked into the
possibility of using findings from studies of brain morphology of these patients to
predict future treatment strategies as well as creating new disease altering
drugs.
Alzheimer’s disease (ICD 10:G30) (Alzheimer, 1991) is a disease which
affects memory and is a common form of dementia. Named after a German
neuropathologist Alois Alzheimer in 1906, the disease natural history is that it
progresses and worsens, eventually leading to death.
Alzheimer’s disease usually affects people with age more than 60 years
old. However, the presentation may vary in different patients. Most patients with
early Alzheimer’s disease showed impairment in recalling recent events.
Diagnosis of Alzheimer’s disease usually confirmed with certain memory related
tests that evaluate behaviour and thinking skills. On imaging, MRI is the most
preferred method to exclude any other organic causes as well as to see the
progression or changes in brain morphology. Untreated, patients with
Alzheimer’s disease could lead to confusion, irritability, aggression, mood
swings and long term memory loss.
Studies have been conducted in imaging of patients with Alzheimer’s
disease. A study by Fox and Freeborough (1997) showed significant differences
in rate of atrophy in patients with Alzheimer’s disease compared to healthy

20
control. The authors found that in patients with Alzheimer’s disease, the rate of
atrophy ranged from 10 to 40 times faster than healthy control subjects, which
showed aggressive and degenerative nature of Alzheimer’s disease. Another
study by Silbert et al. (2003) was conducted to assess whether MRI brain
volume measurements are valid predictors of Alzheimer’s disease pathology.
He found that rate of ventricular volume increase is significant over healthy
control and concluded that MRI volume measured over time are valid
biomarkers of progression of Alzheimer’s disease.
Patients with cognitive impairment are also at risk of developing
Alzheimer’s disease. A study by a group of researchers from University of
California San Diego (McEvoy et al., 2011) was done to see whether a single
MRI measurement can provide a predictive prognostic information in patients
with mild cognitive impairment. This study involved 164 patients with
Alzheimer’s disease and 203 healthy control subjects in which the data
gathered from the MRI were used to discriminate patients with mild cognitive
impairment and evaluate their risk scores. They found that MRI measurement
showed more informative patient specific risk estimates in predicting the change
from mild cognitive impairment to Alzheimer’s disease.
Another study by Chiang et al. (2011) was done to determine whether
temporoparietal brain volumes could be used to predict future memory decline
in healthy individuals. The study involved 149 cognitively healthy individuals
whom underwent MRI of the brain at the initial phase of the study and at 2 years
follow up. The patients were also underwent neuropsychological assessment at
the start of the study and at 2 years follow up. The study result showed that the

21
temporoparietal brain volume can be used to identify with high accuracy healthy
individuals who are at risk for future memory decline.
Schizophrenia (ICD 10:F20) is a mental disorder with severely impaired
thinking, emotions and behaviour. Commonly patients with schizophrenia have
common symptoms such as auditory hallucinations; paranoid or bizarre
delusions with disorganize speech and thinking. It affects approximately 7 per
1000 adult population mostly in 15 to 35 years old age group. It is a treatable
disease if recognized and treated early.
The diagnosis of schizophrenia is made according to a pre-set criterion.
For a person to be diagnosed with schizophrenia, the person must have at least
one major criterion two minor criteria present for one month duration within six
months. The major criteria are:
i. Thought echo, thought insertion or withdrawal, or thought
broadcasting.
ii. Delusions of control, influence or passivity; or delusion of perception.
iii. Hallucination.
iv. Neologisms or break in train of thoughts, resulting in incoherent or
irrelevant speech.
v. Catatonic behaviour.
vi. Negative symptoms such as marked apathy, paucity of speech and
blunting of emotional response.
Treatment of schizophrenia are mainly by antipsychotic drugs in which if
started early in the initial stage of the disease, will prevent further decline in
brain volume.

22
Brain volume loss in patients with schizophrenia has been extensively
studied in previous years. van Haren et al. (2008) conducted a study looking
into the loss of brain volume in patients with schizophrenia over the course of
the illness. MRI scans of the brain were performed over a period of 5 years
involving 96 schizophrenia patients and 113 healthy control subjects ranging
from 16 years old to 56 years old of age. His study showed that over the course
of 5 years, there was excessive brain volume loss concomitant with increase in
ventricular size in patients with schizophrenia compared to healthy individuals.
The study further showed that patients with poor disease outcome developed
more excessive brain volume loss than patients with good disease outcome and
he concluded that the brain volume changes are clinically relevant in patients
with schizophrenia.
Another study involving brain volume changes in patients with first
episode of schizophrenia was done by Cahn et al. (2002). Imaging studies in
patients with schizophrenia usually involved grey matter volume loss. The
author reasoned that previously, there was no study done to determine brain
volume loss in patients with first episode of schizophrenia. The study stated that
clinical deterioration in schizophrenia is greatest in early stages of the disease
and assumed that imaging of the brain would show significant brain volume
changes. This study involved 34 patients with first episode of schizophrenia and
36 healthy control subjects. MRI scan of the brain were performed at the
beginning of the study and 1 year after the first MRI brain. The disease
outcomes of the patients were measured 2 years after the start of the study.
This study showed that there were significant losses of brain volume and grey
matter volume with increase of ventricle size at the early stages of the disease.

23
Study by McDonald et al. (2006) also showed that patients with
schizophrenia exhibited morphologic distinctions in ventricular and hippocampal
regional volumes.
Bipolar disorder (ICD 10:F31) or bipolar affective disorder is a disorder
that causes alternating mood swings of alternating mania and depression. It is
also known as manic disorder or manic-depressive disorder. Patients have
different levels of mania or depressive symptoms, depending on severity.
Diagnosis is usually by excluding other organic causes by clinical assessment
or imaging. Recent years have showed few studies that were done to see
whether there are changes in brain volume in patients with bipolar disorder as
opposed to patients with schizophrenia. Study by Arnone et al. (2009) showed
that patients with bipolar disorder have robust changes in brain volume
compared to healthy adults. His study showed whole brain and prefrontal lobe
volume reduction with increased lateral ventricle size.
Several meta-analysis (Hoge et al., 1999; McDonald et al., 2004) suggest
that brain volume loss in patients with bipolar disorder were not as significant as
in patients with schizophrenia. However, these authors suggested the need of
further studies to establish a consistent brain volume deviation in patients with
bipolar disorder.

24
2.6 Volumetry method
Volumetric measurements are significantly more sensitive and definitive
than visual inspection alone. With the MRI, volumetry techniques have been
more optimized and more new techniques have been developed for accurate
measurement and volumetry of the brain. This is especially critical in patients
who are at risk of developing Alzheimer’s disease, or patients with newly
diagnosed schizophrenia and bipolar disorder. Several techniques in brain
volumetry measurement are manual, semi-automated and automated
measurement techniques. Manual volumetry technique once considered the
gold standard of brain volumetry. This technique involved manual slice by slice
tracing of the brain structures and anatomy and measurement. It is also useful
as a correction method of local miscalculation as part of the processing chain in
semi-automated volumetry technique (Klauschen et al., 2009). However,
manual volumetry is very time consuming and operator dependant, thus each
measurement need to be done by a trained and skilled observer.
Semi-automated volumetry technique also used input and feedback from
the operator or observer. This has made semi-automated volumetry
measurement to be as time consuming as manual volumetry technique and at
times can be expensive.
Comparison of manual and automated brain volumetry technique was
done by Ambarki et al. (2011). The purpose of the study was to evaluate
commercially available fully automated software for MRI brain volume
assessment. The study was conducted in 41 healthy subjects and 20 patients
with hydrocephalus. Both manual and automated volumetry techniques were
used in the study with manual technique as the reference standard. The study