mrpl - initiating coverage - centrum...
TRANSCRIPT

Centrum Equity Research is available on Bloomberg, Thomson Reuters and FactSet
Phase III delay set to end; initiate with a BUY We initiate coverage on MRPL, a standalone refiner, with a BUY rating and a PT of Rs60 (~38% upside). A credible turnaround candidate, we are optimistic on it due to (1) Channel checks revealing stabilization of power plant and hence imminent commissioning of phase-III in 1-2 months; (2) Strong business outlook despite building in conservative Gross Refining Margin (GRM) leading to a modest positive turnaround in earnings from FY15E; and (3) Negligible impact of Export Parity Pricing (EPP), if implemented. The stock adequately factors in the continuing delay in capacity expansion and consequent low GRM.
� Benefits of Phase-III to gain traction from 2HFY15E: Phase III expansion is set for commissioning by Q1FY15 with stabilization of CPP - as corroborated by channel checks; however, we have conservatively built-in benefits to accrue from 2HFY15 and expect a significant jump in GRM led by (1) high yield products; (2) lower fuel loss; (3) full benefits of lower freight costs from FY16E due to Single Point Mooring and (4) tax benefits. Delay in implementing phase-III resulted in adverse impact on FY13 and YTD earnings due to low yield product mix and high fuel loss. This, we believe, will reverse from 2HFY15.
� Intrinsically strong despite lower GRMs built-in: We have built-in a modest GRM of USD4.2/6 per bbl in FY15E/FY16E against the preceding 5-year average GRM of USD5/bbl (without Phase-III expansion benefits). We derive GRMs using historical linear relationship between crude and product prices; estimates are conservative to factor in risk of global product imbalances. Although incremental supply of Gasoline and Naphtha is expected to contribute 50% of the overall product surplus in CY13-18, MRPL with 9% exposure to export markets in these products will be relatively insulated. Further, MRPL is competitively buttressed by its ability to source low-cost high-sulphur crude, cost and energy efficiency and favourable logistics.
� Robust financials make MRPL a strong investment case: A 55% CAGR in EBITDA earnings and 105% CAGR in EBIT earnings over FY13-16E coupled with RoE of 17% in FY16E, turning free cash flow positive over FY15/FY16E and current valuations at Mean-SD across matrix on FY16E, make MRPL a compelling investment bet. We emphasise that for such a turnaround case, only FY16 would represent a return to stable earnings, and demonstrate that even modestly better GRMs, realistic for MRPL, can lead to material positive earnings surprises.
� Valuation and Key risks: We initiate coverage with a BUY rating and a PT of Rs60 which is derived as the average value using DCF and fair multiple assigned to EV/EBITDA, EPS and BV. MRPL in FY16E would trade at trough valuations and valuations at 20% discount to global peers, caps the downside. Key risks are (1) Lower GRMs; (2) Delay in commissioning of phase III and (3) Skewed product mix. The stock has limited coverage on the street.
Target Price Rs60 Key Data
Bloomberg Code MRPLIN
CMP* Rs43.6 Curr Shares O/S (mn) 1,752.6
Diluted Shares O/S(mn) 1,752.6
Upside 38% Mkt Cap (Rsbn/USDbn) 76.4/1.3
Price Performance (%)* 52 Wk H / L (Rs) 52.9/26.3
1M 6M 1Yr 5 Year H / L (Rs) 102.5/26.3
MRPL IN 12.8 27.9 (13.2) Daily Vol. (3M NSE Avg.) 326321.9
NIFTY 6.4 11.7 16.5
*as on 24 March 2014; Source: Bloomberg, Centrum Research
Shareholding pattern (%)
Dec-13 Sep-13 Jun-13 Mar-13
Promoter 88.6 88.6 88.6 88.6
FIIs 0.5 0.5 0.6 0.5
DIIs 2.9 2.8 2.6 2.7
Others 8.0 8.1 8.2 8.2
Source: BSE
GRM trend
Source: Company, Centrum Research Estimates
Bloomberg Consensus Centrum Target Price (Rs)
Variance (%)
BUY SELL HOLD Target Price
(Rs)
4 1 2 56 60 8.1
*as on 24 March 2014; Source: Bloomberg, Centrum Research
Sachin Mehta, [email protected] 91 22 4215 9854
Y/E Mar (Rsmn) Revenue YoY (%) EBITDA EBITDA(%) Adj. PAT YoY (%) EPS (Rs) RoE (%) RoCE (%) PB (x) EV/EBITDA (x)
FY12 5,37,655 38.0 22,589 4.2 9,107 (22.6) 5.2 13.2 10.6 1.1 4.1 FY13 6,56,943 22.2 8,295 1.3 (8,067) NM (4.6) (11.8) (2.6) 1.2 14.2 FY14E 6,81,975 3.8 7,598 1.1 (3,458) NM (2.0) (5.4) 0.6 1.2 17.7 FY15E 7,02,984 3.1 17,416 2.5 962 NM 0.5 1.5 3.5 1.2 7.5 FY16E 7,52,580 7.1 31,018 4.1 11,827 NM 6.7 17.3 10.6 1.0 3.9
Source: Company, Centrum Research Estimates
0
1
2
3
4
5
6
7
8
FY05
FY06
FY07
FY08
FY09
FY10
FY11
FY12
FY13
FY14
E
FY15
E
FY16
E
(USD
/bbl)
Oil & Gas Buy
Initiating Coverage 25 March 2014
INDIA
MRPL
5 year average
1

2 MRPL
Table of Contents
Benefits of Phase-III to gain traction from 2HFY15 ...................................................................... 3 High yield product slate and expansion in GRM – On the anvil ............................................................................ 3 Lower GRMs built-in offer margin of safety: ................................................................................................................. 4
Our Thesis on Crude Pricing .......................................................................................................................................... 4 Our Thesis on Product Pricing and GRM - Based on Historical Linear Relationship ................................ 4
Industry Overview: MRPL well placed to ride over competition ............................................. 6 Global Market dynamics ....................................................................................................................................................... 6
Global refining complexity vis-à-vis MRPL places MRPL well to ride over global competition: ......... 6 Global capacity additions vs. requirement and trend in historical utilization rate .................................. 7 Complex Refining Capacity – A competitive edge ............................................................................................... 8 Low global refining complexity level leads to lower incremental supply of middle distillates .......... 9 MRPL product slate bias towards range of middle and light distillates gives it an edge .................... 10 Worries of local demand curb Chinese refinery expansion boom – To soothe competition ............ 10 Capacity ramp-up in Middle East poses no real competition threat ........................................................... 10 Further refinery shut-downs in Europe – provides scope to explore new export markets ................ 11 Recent global refining trend corroborate to above investment arguments ............................................ 11
Domestic Market Dynamics............................................................................................................................................... 12 Historical and projected demand of petroleum products in India .............................................................. 12 MRPL share in domestic consumption in FY16E vs FY13 – Nearly stable .................................................. 13 Surplus domestic refining capacity in XII Plan – To continue going forward as well............................ 14 Historical sales and earnings mix of MRPL – Domestic vs Exports ............................................................... 14
Cost Competitiveness .......................................................................................................................................................... 15
Sensitivity Analysis............................................................................................................................... 16
Upside Risks ........................................................................................................................................... 16
Downside Risks ..................................................................................................................................... 16
Financial Analysis - Standalone ....................................................................................................... 17
Valuations ............................................................................................................................................... 18
Company Background ........................................................................................................................ 20
Quarterly Financials ............................................................................................................................. 21
Key Performance Indicators .............................................................................................................. 21
Financials-Standalone ........................................................................................................................ 22
Financials-Standalone (Historical) .................................................................................................. 23
2

3 MRPL
Benefits of Phase-III to gain traction from 2HFY15
Our channel checks reveal stabilisation of 118 MW captive power plant (CPP); this will spur MRPL to commission critical secondary units of Phase-III like Petroleum Fluid Catalytic Cracking Unit (PFCCU), Delayed Coker Unit (DCU), Sulphur Recovery Unit (SRU) and Coker Hydrotreating Units (CHU) as these were dependent on CPP. Delay in implementing phase-III resulted in adverse impact on FY13 and YTD earnings due to low yield product mix and high fuel loss. This, we believe, will certainly reverse from FY15E. Management expects secondary units to come on-stream by Mar/Apr-14 and reap benefits from Q1FY15, whereas we have conservatively factored-in effective production from Q3FY15. Hence, we expect MRPL to reap benefits from 2HFY15 onwards leading to a significant jump in GRMs.
High yield product slate and expansion in GRM – On the anvil
Post phase III expansion, Nelson complexity would increase to 9.5 from current 5.5 pre-expansion, leading to higher distillate yield of ~80% on the back of commissioning of key secondary units ( PFCCU, DCU SRU and CHU) and the polypropylene unit in Q2FY15. We factor-in GRM of USD4.2/6.0 per bbl on the cumulative effect of higher TAN crude oil processing ability, higher distillate yield, saving on freight cost with phase-wise implementation of Single Point Mooring (SPM) and earnings from the polypropylene unit which is expected to be commissioned by Q2FY15.
Exhibit 1: Current product slate Exhibit 2: Product slate post expansion
Source: Company, Centrum Research Estimates Source: Company, Centrum Research Estimates
Exhibit 3: GRM vs 5 year average Exhibit 4: MRPL GRM vs. peers
Source: Bloomberg, Company, Centrum Research Estimates Source: Bloomberg, Company, Centrum Research Estimates
2.1%
8.2%1.2%
11.1%
3.1%
41.6%
10.9%
4.2%
15.7%
1.4%0.6%
LPG
MS
Mixed Xylene
Naptha
SKO
HSD
ATF
VGO
FO
ASPHALT
Bitumen/CRMB/Sulphur
5.7%3.2%
8.6% 2.0%
7.9%
2.3%
41.2%
14.2%
5.1%6.1%
3.7% LPG
Polypropylene
MS
Mixed Xylene
Naptha
SKO
HSD
ATF
FO
Petroleum Coke
Bitumen/CRMB/Sulphur
0
1
2
3
4
5
6
7
8
FY05
FY06
FY07
FY08
FY09
FY10
FY11
FY12
FY13
FY14
E
FY15
E
FY16
E
(USD
/bbl)
5 year avg. GRM
0.5
2.5
4.5
6.5
8.5
10.5
12.5
FY09 FY10 FY11 FY12 FY13 FY14E FY15E FY16E
(USD
/bbl)
MRPL Singapore GRM RILIOCL HPCL BPCLCPCL
3

4 MRPL
Lower GRMs built-in offer margin of safety:
Our Thesis on Crude Pricing
Although global crude supply led by non-OPEC supply is on the rise and demand weak, we do not expect benchmark crude prices to soften below USD100/bbl for the forecast period. Our thesis is based on (1) near doubling of upstream capital cost over 2008; (2) budgetary obligations of OPEC countries led by Saudi Arabia to maintain a minimum crude price of USD100/bbl. and (3) estimates by IEA, EIA and OPEC pointing to crude prices of USD100 to USD110/bbl over the next 2 years. We have built-in average Dubai Fateh crude price of USD105/100 per bbl over FY15E/FY16E respectively and hence our product prices and crack spreads thereon are based on this thesis
Exhibit 5: Crude price required to balance Saudi Arabia’s fiscal budget
Source: PIRA, Industry reports, Centrum Research Estimates
Our Thesis on Product Pricing and GRM - Based on Historical Linear Relationship
GRMs are primarily a function of product slate and product crack spreads. We have built-in lower GRM of USD4.2/6 per bbl in FY15E/FY16E which provides upside risk as we have not considered the full benefit of MRPL’s ability to process low cost crude, high-end product mix and cost savings post SPM. We have derived GRM and product prices using the historical linear relationship between crude and product prices. We highlight that our GRMs are possibly the lowest on the street.
Exhibit 6: Relationship of Dubai Fateh crude and Gasoline pricing
Exhibit 7: Relationship of Dubai Fateh crude and Diesel pricing
Source: Bloomberg, Company, Centrum Research Estimates Source: Bloomberg, Company, Centrum Research Estimates
Exhibit 8: Relationship of Dubai Fateh crude and Jet Fuel/Kerosene pricing
Exhibit 9: Relationship of Dubai Fateh crude and Naphtha pricing
Source: Bloomberg, Company, Centrum Research Estimates Source: Bloomberg, Company, Centrum Research Estimates
40
60
80
100
120
140
CY06
CY07
CY08
CY09
CY10
CY11
CY12
CY13
CY14
E
CY15
E
(USD
/bbl)
Saudi Arabia threshold price Brent price
If budget expenses grow by 12% each year (mean for 10 years)
y = 1.0679x + 6.1529R² = 0.9837
0
50
100
150
200
- 20.0 40.0 60.0 80.0 100.0 120.0 140.0
Gasolin
e price
s (USD
/bbl)
Dubai Fateh crude price (USD/bbl)
Gasoline-Crude relation
Gasoline Linear (Gasoline)
y = 1.1632x + 2.5585R² = 0.9858
0
50
100
150
200
- 20.0 40.0 60.0 80.0 100.0 120.0 140.0
Diesel p
rice
s (USD
/bbl)
Dubai Fateh crude price (USD/bbl)
Diesel-Crude relation
Diesel Linear (Diesel)
y = 1.1534x + 4.56R² = 0.981
0
50
100
150
200
- 50.0 100.0 150.0
Jet K
erosene price
s (USD
/bbl)
Dubai Fateh crude price (USD/bbl)
Jet Fuel / Kerosene-Crude relation
Jet Kerosene Linear (Jet Kerosene)
y = 0.9234x + 5.147R² = 0.9808
0
50
100
150
- 20.0 40.0 60.0 80.0 100.0 120.0 140.0
Nap
htha price
s (USD
/bbl)
Dubai Fateh crude price (USD/bbl)
Naphtha-Crude relation
Naptha Linear (Naptha)
Apart from rising geo-political tensions leading to supply cuts, OPEC’s share in global oil supply at 40-42% in the medium term, enables it to manage supply and keep prices at desired levels.
4

5 MRPL
Exhibit 10: Relationship of Dubai Fateh crude and Fuel Oil pricing
Exhibit 11: Relationship of Dubai Fateh crude and LPG pricing
Source: Bloomberg, Company, Centrum Research Estimates Source: Bloomberg, Company, Centrum Research Estimates
y = 0.8817x - 0.4249R² = 0.9443
0
20
40
60
80
100
120
140
- 20.0 40.0 60.0 80.0 100.0 120.0 140.0
Nap
htha price
s (USD
/bbl)
Dubai Fateh crude price (USD/bbl)
Fuel Oil -Crude relation
Fuel Oil Linear (Fuel Oil)
y = 0.6204x + 8.1223R² = 0.9279
0
20
40
60
80
100
120
- 50.0 100.0 150.0
Nap
tha price
s (USD
/bbl)
Dubai Fateh crude price (USD/bbl)
LPG-Crude relation
LPG Linear (LPG)
5

6 MRPL
Industry Overview: MRPL well placed to ride over competition
OPEC estimates global excess production from new refinery additions over incremental ‘call on’ refining every year by 0.4-0.8 mb/d over CY14 to CY18. However, incremental product surplus would be gradual over CY14 to CY18 and OPEC expects 2 mb/d of surplus naphtha/gasoline by CY18, which represent almost half of the total product surplus of 4 mb /d. MRPL, has 9% product weightage of naphtha/gasoline to export markets and hence remains relatively immune. Further, increasing refining closures, cancellation of large refining projects in China in Dec-13/Jan-14 and a few project delays in the Middle East will address product imbalances and allay concerns. We believe MRPL with its high-end product slate, diverse product offerings, balanced sales mix between domestic and exports, low opex, favourable logistics and a host of tax benefits will remain competitive to tide over industry challenges.
Global Market dynamics
Global refining complexity vis-à-vis MRPL places MRPL well to ride over global competition:
Exhibit 12: MRPL ranks high on scale of Nelson Complexity Index
Source: Industry, Centrum Research Estimates
Exhibit 13: MRPL refining complexity among highest in its class in India
Source: Essar Oil, Centrum Research Estimates
9.5
0
2
4
6
8
10
12
14
Valero
Exxo
n
Reliace
Chev
ron
Essar O
il
BP
Citgo
Shell
Marathon
Conoco
BORL Bina
MRPL
Premco
r
HEM
L
Sunoco
Teso
ro
HPCL
S-Oil
Fuji Oil
JX Group
Form
osa
IOCL
Petro China
Petronas
Sinopec
GS caltex
BPCL
SK Engrgy
(Nelso
n Complexity In
dex
)
2
4
6
8
10
12
14
16
0 100,000 200,000 300,000 400,000 500,000 600,000 700,000
(Nelso
n Complexity In
dex
)
Capacity (bpd)
Legends :Indian Private SectorNOC 1NOC 2NOC 3NOC 4NOC 5
MRPL
Nelson complexity index at 9.5 scores high among NOC in India and ranks MRPL at 12
6

7 MRPL
Global capacity additions vs. requirement and trend in historical utilization rate
Exhibit 14: Historical global refining capacity and throughput
Source: Centrum Research Estimates
� As indicated in the Exhibit 14, global spare refining capacity has historically trended between 19 to 23 mb/d over CY10 to CY13 and as such this trend will continue over the next 3-4 years despite new capacity additions; as refinery closures and cancellation of new projects gather pace which would to a large extent neutralise the impact of capacity addition. Global product imbalances are a recurring phenomenon. Historically, MRPL with 5.5 Nelson complexity index (pre phase-III commissioning) has reported an average GRM of USD5/bbl (preceding 5 years) which reflects its product and pricing competitiveness. The decline in MRPL’s GRM in FY13 and YTD has been due to partial commissioning of Phase-III leading to subdued product mix, higher fuel loss and unplanned outages. This downward trend is set to reverse from FY15E.
� The closure of more than 4 mb/d of capacity between CY08 and CY12 mainly across Europe, the US and Japan has primarily removed surplus (often idled) capacity in the sector and had limited positive impact on margins. Closure of a further 3.9 mb/d by CY15 and 5.9 mb/d by CY18, may lead to an improvement in refining utilizations and hence a possible uptick in GRM cannot be ruled-out.
Exhibit 15: Global refinery capacity addition from existing projects CY12-CY18
Source: OPEC, Centrum Research Estimates
OPEC estimates global excess production from new refinery additions over incremental ‘call on’ refining every year at 0.4-0.8 mb/d over CY14 to CY18. There is evidently ‘no sink’ visible that is anywhere near capable of absorbing potential surpluses of the US & Canada, Europe, Middle East and Asia (led by China), which together will rise from 1.3 mb/d in CY13 to 2.8 mb/d by CY15 and 3.7 mb/d by CY18. OPEC expects Europe and OECD Asia region to face the highest level of closures which would ease competition pressure and correct product imbalances to an extent.
17
18
19
20
21
22
23
70
75
80
85
90
95
100
CY10 CY11 CY12 CY13
(Mb/d)
(mb/d)
Global Crude Throughput Global Refinery Capacity Global Spare Capacity (RHS)
0
1
2
3
US & Canada
Latin America
Africa Europe Russia & Caspian
Middle East China Other Asia Pacific
(mb/d)
Spare refining capacity has historically trended between 19 to 23 mb/d, a trend likely to continue in the medium term – MRPL product mix and strategy gives it an edge
China and Middle East region to lead the pack in global refinery capacity additions
7

8 MRPL
Exhibit 16: Additional cumulative global refinery crude-runs, potential and required
Source: OPEC, Centrum Research Estimates
* Potential: based on expected distillation capacity expansion and closures.
** Required: based on projected demand increase.
Exhibit 17: Assumed crude distillation capacity closures to aid plug-in of surplus capacity
Source: OPEC, Centrum Research Estimates
Potential production from new projects exceeds the incremental ‘call on refining’ every year by 0.4–0.8 mb/d between CY13 and CY18, making for a cumulative overhang of 4 mb/d by 2018. This outlook presages both a period of severe international competition for product markets and the need to continue refinery closures on a significant scale.
Complex Refining Capacity – A competitive edge
Complex refining capacity (post phase III commissioning) along with polypropylene gives MRPL the edge to deliver high-end value products. Globally, the trend of shifting to complex refining will gather pace over CY13 –CY18. However, MRPL is ahead of the curve which enables higher crack spreads and cost competitiveness. To maintain its competitive edge and cost competitiveness over the next 3-6 years, MRPL is also planning to increase its refining capacity from 15 MT to 18 MT and then to 21 MT, which we have not built into our estimates. (Refer exhibit12on complexity levels).
0
2
4
6
8
10
CY13 CY14 CY15 CY16 CY17 CY18
(mb/d)
Potential-based on projects Required - Reference Case
0
1
2
3
US & Canada Latin America Europe Russia & Caspian Asia Pacific
mb/d
Potential production from new projects exceeds incremental ‘call on refining’ making for a cumulative overhang of 4 mb/d by CY18 – Impact on MRPL is just 9% of its product portfolio and is relatively immune to it
Closure of 5.9 mb/d is expected by CY18 of which Europe would account for 2.5 mb/d. This will certainly open up new export markets for MRPL
8

9 MRPL
Exhibit 18: Global capacity requirement by process type, CY12-18
Source: OPEC, Centrum Research Estimates
The Reference Case projections by OPEC highlight a continuing need to increase conversion capacity relative to distillation. Against a conversion to distillation ratio of 40% that applies globally today, both existing projects and total additions of almost 13 mb/d of conversion capacity requirements through 2035 exhibit a conversion to distillation ratio of 64%. Substantial additions to desulphurization capacity will also be necessary to meet future specifications for sulphur content. These are estimated at close to 27 mb/d by CY35.
Low global refining complexity level leads to lower incremental supply of middle distillates
Exhibit 19: Incremental supply for middle distillates remains low - Augurs well for MRPL
Source: OPEC, Centrum Research Estimates
0
1
2
3
4
5
6
7
8
9
Crude distillation Conversation Octane units Desulphurization
mb/d
(0.5)
0.0
0.5
1.0
1.5
2.0
World USA & Canada Europe Middle East Asia Pacific Other region
(mb/d)
Gasoline/Naphtha Middle distillates Residual fuel Other products
Against a conversion to distillation ratio of 40% currently, it will move to 64% over CY13-35.
Despite product surplus, Asia Pacific region is expected to witness deficit, which augurs well for MRPL
9

10 MRPL
MRPL product slate bias towards range of middle and light distillates gives it an edge
Exhibit 20: Distillate mix - pre and post Phase-III commissioning
Source: Company, Centrum Research Estimates
� While there is some uncertainty and flexibility in product yields that will result from any one refining project, balances show a continuation of projects that produce too much of gasoline/naphtha.
� Exhibit 19 indicates a cumulative surplus of naphtha/gasoline of 2 mb/d by CY18, almost half of the total surplus. However, with estimated low product crack spreads of USD 11 / (2.5) per bbl for Gasoline/ Naphtha respectively and with 9% (16% overall product weightage) product exposure to export markets, impact on MRPL is likely to be muted and hence will remain immune to such product imbalances in global trade.
� It is also important to note that for much of the CY13–CY18 period, the excess of potential output over required additions is around 1 mb/d in the Middle East and 0.5 mb/d in the Asia-Pacific, much of which is present in China. Thus, the outlook in the Middle East, as well as in Asia-Pacific, is for refinery production potential to continue to run ahead of required output to meet regional demand increase.
Worries of local demand curb Chinese refinery expansion boom – To soothe competition
� With Chinese oil demand growth dropping to six-year low in CY13 of ~280 kb/d, Chinese and global oil majors are reconsidering their refinery investment plans. Less than a year ago, ~ 4.3 mb/d of primary distillation capacity was scheduled for completion in CY18. However, growing concerns and risks of over-supply in the Chinese fuel markets and weak demand have led to at least four projects being cancelled in recent months.
� In Jan-14, news emerged that BP had dropped plans to invest in Petro China’s 200 kb/d Quinzhou refinery. Similarly, PetroChina has delayed setting-up its Jieyang refinery (400 kb/d) from Dec-13 to CY17 whereas its 200 kb/d Kunming refinery has been postponed to CY16 from earlier schedule of CY14.
Capacity ramp-up in Middle East poses no real competition threat
� Although up-coming refineries being set-up in Middle East are complex refineries, a skewed product mix with a biased product surplus in Gasoline and a ramp-up in diesel may pose competition. However, with a negative crack spread on Naphtha and 9% exposure to global markets for sale of HSD, MRPL is relatively insulated to such product competition from the Middle East.
� Trend of Crude through-put in CY13 and Q1CY14 imply that so far it remains broadly within its historical broad range of 5.4 to 6 mb/d as trended between CY08 and CY12.
� Going forward, new refinery additions, stabilization issues and frequent power outages may keep refinery utilisations under check. Power outages forced all of Kuwait’s refineries (capacity of 930 kb/d) to shut-down in Jan-14 whereas recent (Nov-Dec 13) data suggests a steep drop in Saudi Arabia’s refinery operations compared with expectations of an increase in runs as the new 400 kb/d Jubail refinery ramped up.
0%
10%
20%
30%
40%
50%
60%
70%
Light distillates Middle distillates Heavy distillates
Current Post expansion
A shift towards GRM accretive light and middle distillates with its share improving to ~85% vs 78% currently will boost GRM. Also globally, the over-supply of middle distillates over CY13-CY18 is very marginal – Positive for MRPL
Muted impact is seen over excess supply of 2mb/d of Naphtha/Gasoline – which accounts for almost half of the global surplus over CY13-18. Negative crack spread on Naphtha and alternative domestic market available for Gasoline – negates the impact of oversupply on MRPL
10

The net effect on a global scale is for continued imbalances. The excess for gasoline/naphtha is the greatest, followed by residual fuel (on a much smaller scale), and then, this year, distillates. While this implies margins relative to crude for naphtha/gasoline are likely to remain muted, those for distillates may also now be less strong in the medium-term as the global supply/demand system adjusts. We have factored-in impact of increasing competition and hence built-in a low GRM of USD6/bbl in FY16E versus preceding 5-year average GRM (pre-expansion) of USD5/bbl.
Further refinery shut-downs in Europe – provides scope to explore new export markets
Exhibit 21: Europe to witness the maximum refining closures with weak demand and low complexity level
Source: Centrum Research Estimates
Recent global refining trend and annual change in crude throughputs corroborate to above investment arguments as product crack spreads remains nearly intact
Exhibit 22: Global refining crude throughput Exhibit 23: YoY change in global refining crude throughput
Source: IEA, Company, Centrum Research Estimates Source: IEA, Company, Centrum Research Estimates
Global refining trend in CY13 and Jan-14 remains buoyant and above average as compared to CY08-CY-12 period, whereas crack spreads for most products for the same period have remained robust.
The recent annual YoY decline in crude throughput in case of OECD region was led by sharp refinery shutdowns in Europe owing to weak local demand and global competition. In contrast, in case of non-OECD region, crude through-put has been on the rise led by China and Middle-East. The YoY rise in China and Middle East in Jan-14 is attributed to new refineries commissioned. The decline in Other Asian region is owing to a string of planned shut-downs in India led by RIL’s Jamnagar Refinery and IOC’s Mathura refinery.
(1.2)
(0.8)
(0.4)
0.0
0.4
0.8
1.2
1.6
2.0
2QCY12 Q3CY12 Q4CY12 Q1CY13 Q2CY13 Q3CY13 Q4CY13 Jan-14
(mb
/d)
America Europe Asia Oceania China
Other Asia Middle East Latin America Other
Nelson Complexity Index
11
MRPL
11

12 MRPL
Domestic Market Dynamics
Historical and projected demand of petroleum products in India
� As per Platts, India is the largest exporter of petroleum products in Asia since Aug-09. Except for LPG where imports have been the highest, India has primarily been an exporter of Jet Fuel, Petrol, Diesel and Fuel Oil. In the XIIth plan, PPAC projects moderation in consumption of certain light and middle distillates.
� Over the XIIth plan, except for ATF, all products are likely to witness moderation in demand CAGR as compared to the growth trend in the XIth plan. The demand CAGR for HSD and LPG is estimated to moderate to 5% each, MS and ATF at 8% each whereas Naphtha and SKO are expected to report negative CAGR of 2% and 3% respectively.
Exhibit 24: Annual trend in domestic demand of products Exhibit 25: Plan-wise CAGR growth in demand for products
Source: PPAC, Centrum Research Estimates Source: PPAC, Centrum Research Estimates
Exhibit 26: Import and export of Petrol by India Exhibit 27: Import and export of Diesel by India
Source: PPAC, Centrum Research Estimates Source: PPAC, Centrum Research Estimates
Exhibit 28: Import and export of Jet Fuel by India Exhibit 29: Import and export of Kerosene by India
Source: PPAC, Centrum Research Estimates Source: PPAC, Centrum Research Estimates
0
15
30
45
60
75
90
LPG
MS
Nap
htha
/NGL ATF
SKO
HSD
LDO
Lubes
FO/LSH
S
Bitumen
Pet C
oke
Others
(MT)
FY13 FY14E FY15E FY16E FY17E (0.2)
(0.2)
(0.1)
(0.1)
0.0
0.1
0.1
0.2
LPG
MS
Nap
htha
/NGL ATF
SKO
HSD
LDO
Lubes
FO/LSH
S
X Plan XI Plan XII Plan
0.0
4.0
8.0
12.0
16.0
20.0
(0.5)
0.0
0.5
1.0
1.5
2.0
FY01
FY02
FY03
FY04
FY05
FY06
FY07
FY08
FY09
FY10
FY11
FY12
FY13
(MT)
(MT)
Petrol
Imports Exports (RHS)
0.0
5.0
10.0
15.0
20.0
25.0
0.0
0.5
1.0
1.5
2.0
2.5
3.0
3.5
FY01
FY02
FY03
FY04
FY05
FY06
FY07
FY08
FY09
FY10
FY11
FY12
FY13
(MT)
(MT)
Diesel
Imports Exports (RHS)
0.0
1.0
2.0
3.0
4.0
5.0
0.0
0.3
0.6
0.9
1.2
FY01
FY02
FY03
FY04
FY05
FY06
FY07
FY08
FY09
FY10
FY11
FY12
FY13
(MT)
(MT)
Jet Fuel
Imports Exports (RHS)
(0.1)
0.0
0.1
0.1
0.2
0.2
0.3
0.0
0.5
1.0
1.5
2.0
2.5
3.0
FY01
FY02
FY03
FY04
FY05
FY06
FY07
FY08
FY09
FY10
FY11
FY12
FY13
(MT)
(MT)
Kerosene
Imports Exports (RHS)
12

13 MRPL
Exhibit 30: Import and export of Naphtha by India Exhibit 31: Import and export of Fuel Oil by India
Source: PPAC, Centrum Research Estimates Source: PPAC, Centrum Research Estimates
Exhibit 32: Import and export of LPG by India
Source: PPAC, Centrum Research Estimates
MRPL share in domestic consumption in FY16E vs FY13 – Nearly stable
Exhibit 33: MRPL share in domestic consumption of products – Stable in FY16E vs FY13
Source: PPAC, Centrum Research Estimates
MRPL has been an exporter of petroleum products for the last 15 years. Though most contracts (except STC Mauritius) are on short term basis, its cost competitiveness and diverse product mix absorbs any unanticipated decline in product GRM. Also, flexibility (post phase-III commissioning) to change the production of low-end and loss making Fuel Oil to near zero from 16% currently and 5% product weightage factored-in by us; coupled with favourable logistics that saves on freight cost and a host of tax benefits have made it competitive.
0.0
2.0
4.0
6.0
8.0
10.0
12.0
0.0
2.0
4.0
6.0
8.0
FY01
FY02
FY03
FY04
FY05
FY06
FY07
FY08
FY09
FY10
FY11
FY12
FY13
(MT)
(MT)
Naphtha
Imports Exports (RHS)
0.0
2.0
4.0
6.0
8.0
10.0
0.0
1.0
2.0
3.0
4.0
FY01
FY02
FY03
FY04
FY05
FY06
FY07
FY08
FY09
FY10
FY11
FY12
FY13
(MT)
(MT)
Fuel oil
Imports Exports (RHS)
(0.1)
0.0
0.1
0.1
0.2
0.2
0.3
0.0
2.0
4.0
6.0
8.0
FY01
FY02
FY03
FY04
FY05
FY06
FY07
FY08
FY09
FY10
FY11
FY12
FY13
(MT)
(MT)
LPG
Imports Exports (RHS)
0%
5%
10%
15%
20%
25%
30%
0
10
20
30
40
50
60
70
80
90
LPG Motor Spirit Naphtha AviationTurbine Fuel
SKO /Kerosene
High SpeedDiesel
(MT)
FY13 Consumption FY16E Consumption
MRPL share in FY13 consumption MRPL share in FY16E consumption
13

14 MRPL
Surplus domestic refining capacity in XII Plan – To continue going forward as well
Over FY13 to FY17E, refinery capacity as a percentage of consumption is likely to reflect a mixed trend until FY16E. Excess refining capacity (at 100% utilization) over domestic demand and consumption is likely to increase to142% in FY17E vs. 137% in FY13. Hence, we expect domestic capacity utilization to moderate in FY17E and remain stable over the forecast period.
Exhibit 34: Trend of surplus domestic refining capacity to continue in XIIth plan and beyond
Source: PPAC, Centrum Research Estimates
MRPL maintains equal balance between domestic and export sales. With the commissioning of phase-III, Management is confident of maintaining this sales mix as high end product slate augurs well for domestic and export markets. Company has guided for nearly USD3-4/bbl expansion in core GRM. However, we have been conservative and factored-in part benefits. The guidance in GRM expansion is owing to high-end products that would be available for domestic market which offers protected refining margins. Stable Polypropylene prices (preceding 3 years) and hence crack spreads would also boost earnings which augurs well for MRPL.
Historical sales and earnings mix of MRPL – Domestic vs Exports
Exhibit 35: Historical sales mix Exhibit 36: Historical earnings mix of domestic and exports
Source: Company, Centrum Research Estimates Source: Company, Centrum Research Estimates
60%
80%
100%
120%
140%
160%
0
50
100
150
200
250
300
FY07
FY08
FY09
FY10
FY11
FY12
FY13
FY14
E
FY15
E
FY16
E
FY17
E
(MT)
Refining Capacity Consumption Refining Capacity as % of consumption (RHS)
0%
10%
20%
30%
40%
50%
60%
0
5
10
15
20
FY05
FY06
FY07
FY08
FY09
FY10
FY11
FY12
FY13
FY14
E
FY15
E
FY16
E
((MT)
Domestic sales Export sales Exports as % of Total - RHS
(10)
(8)
(6)
(4)
(2)
0
2
4
6
(4)
(2)
0
2
4
6
8
Q1F
Y13
Q2F
Y13
Q3F
Y13
Q4F
Y13
Q1F
Y14
Q2F
Y14
Q3F
Y14
(Rs bn)
(Rs bn)
PBIT - exports PBIT - domestic RHS
India will continue to remain a net exporter for petroleum products in XIIth plan and beyond
14

15 MRPL
Cost Competitiveness
Exhibit 37: OPEX per bbl vs global peers
Source: Company, Centrum Research Estimates
Exhibit 38: Independent performance review of MRPL on benchmarking it to Asia Pacific peer supports our thesis
MRPL BPCL-Kochi IOCL - Panipat CPCL NRL
Competitiveness:
Net Cash Margin 4 4 3 4 3
Worldwide Supply Cost 4 4 3 4 3
Efficiency Indicators (benchmarked to Asia Pacific)
Operational Availability 3 4 1 4 2
Process Utilization 3 3 2 3 4
Cash Opex 3 4 2 4 2
Energy 4 4 4 4 4
Maintenance 1 1 1 2 2
Non Maintenance Personnel 4 4 4 4 4
Quartile1 Quartile2 Quartile3 Quartile4
Source: Petrotech 2014, Centrum Research Estimates
Exhibit 39: Tax benefits for MRPL
Item Incentive Impact
Plant & Machinery Exemption from entry tax during the initial period of four years from the date of commencement of project implementation
To lower project cost
Crude oil Exemption from entry tax on the crude oil required for third phase (3mmt) for 15 years from the start of production
Boost GRM by USD1/bbl
CST Exemption for 15 years on sales made out of phase-III throughput Boost GRM by USD0.4/bbl
CST
Interest free soft loans at 100% of eligible gross VAT during first three years and thereafter at 60% of gross VAT on sale of PP, petcoke, LSHS, Naphtha, LPG (incremental production), mixed xylene and reformate to non-SEZ for 15 years and to be repaid in 15 equal instalments with maximum limit of Rs5 bn per annum
Annual interest free loans of Rs 3bn per annum.
Income Tax holiday Tax benefits as zero tax entitlement for Phase-III earnings under section 80 IB and deferred tax assets of Rs15bn as on date to reduce cash flows on account of tax.
Boost GRM
Source: Company, Centrum Research Estimates
-
0.5
1.0
1.5
2.0
2.5
FY05 FY06 FY07 FY08 FY09 FY10 FY11 FY12 FY13 FY14E FY15E FY16E
(USD
/bbl)
As against cash opex cost of USD3-4/bbl prevalent in America, Europe and Singapore. MRPL opex at USD1-1.4/bbl remains very competitive.
15

16 MRPL
Sensitivity Analysis
Exhibit 40: Sensitivity Analysis on EBITDA for FY16E
Sales Volume (MT)
GRM 13.8 14.3 14.8 15.3 15.8
5 -29% -25% -22% -18% -14%
5.5 -19% -15% -11% -7% -3%
6 -9% -4% 0% 4% 9%
6.5 1% 6% 11% 16% 20%
7 11% 17% 22% 27% 32%
Source: Company, Centrum Research Estimates
Exhibit 41: Sensitivity Analysis on implied EV/EBITDA(x) (based on Exhibit-40) for FY16E
Sales Volume (MT)
GRM 13.8 14.3 14.8 15.3 15.8
5 5.4 5.2 4.9 4.7 4.5 5.5 4.8 4.5 4.3 4.1 4.0 6 4.2 4.0 3.9 3.7 3.5
6.5 3.8 3.6 3.5 3.3 3.2 7 3.5 3.3 3.2 3.0 2.9
Source: Company, Centrum Research Estimates
Upside Risks
� Changes in business model leading to higher earnings yield
� Lower taxes
Downside Risks
� Earnings are highly sensitive to GRM and sales volume. As indicated in Exhibit 40, at constant volumes of 14.8MT, an increase or decrease of USD1/bbl in GRM will lead to potential increase or decrease in EBITDA earnings by 22%.
� Lower GRM. However, since we have been conservative in our GRM assumptions, potential risk is negated.
� Further delay in commissioning of Phase-III. The project has been delayed for more than 2 years and probability of further delay looks remote. Further, we have conservatively built-in benefits of Phase-III from Q3FY15 vs. company guidance of Q1FY15, which provides additional margin of safety.
� Skewed product mix.
� Lower capacity utilization.
� Implementation of Export Parity Pricing (EPP). As per industry sources, MoPNG is unlikely to implement it owing to severe financial stress on government owned companies. In case of MRPL, the adverse impact on GRM is unlikely to be more than USD1/bbl. Since, we have factored-in low GRM; this risk to a very large extent gets mitigated.
� Competition from upcoming IOCL- Paradip refinery may require diversion of product sales from the domestic market to exports.
� Lack of water facility may hamper operations. Currently, MRPL has 6.5 MGD of supplies from MSEZ reservoir and a further 6.5 MGD of tertiary water supply from sewage facility, which the Management has guided as stable and adequate.
� Materialization of contingent liabilities.
16

17 MRPL
Financial Analysis - Standalone
Despite our earnings being below Bloomberg consensus we see healthy return ratios and free cash flow. We present key snapshot of financial analysis (1) Core earnings – EBITDA/EBIT to grow at 55% /105% CAGR over FY13-16E vs. -18%/-42% CAGR over FY10-13; Growth in PAT is led by positive turnaround in earnings as benefits of Phase-III are reaped; (2) With improvement in product yield, fuel losses and tax incentives linked to Phase-III, EBITDA, EBIT and PAT margins set to bounce back over the forecast period with a potential to rise further as earnings have been conservative; (3) Return ratios (RoE, RoIC and RoCE) are on a high as positive turnaround in earnings is imminent; and (4) Free cash flow to turn positive led by earnings bounce and moderation in capex cycle over forecast period;
Exhibit 42: Margins to bounce back as Phase-III sets-up Exhibit 43: Return ratios on an up-move
Source: Company, Centrum Research Estimates Source: Company, Centrum Research Estimates
Exhibit 44: Free cash flow bounces back Exhibit 45: EPS set for strong recovery
Source: Company, Centrum Research Estimates Source: Company, Centrum Research Estimates
(2)
(1)
0
1
2
3
4
5
6
7
8
FY07
FY08
FY09
FY10
FY11
FY12
FY13
FY14
E
FY15
E
FY16
E
(%)
EBITDA margin % EBIT margin % PAT margin %
(20)
(10)
0
10
20
30
40
50
FY07
FY08
FY09
FY10
FY11
FY12
FY13
FY14
E
FY15
E
FY16
E
(%)
RoE % RoCE % ROIC %
(20)
(15)
(10)
(5)
-
5
10
15
(30,000)
(20,000)
(10,000)
0
10,000
20,000
30,000
FY03
FY04
FY05
FY06
FY07
FY08
FY09
FY10
FY11
FY12
FY13
FY14
E
FY15
E
FY16
E
(Rs)
(Rs mn)
Free cash flow (Rs mn) LHS Free cash flow/share (Rs) RHS (5.0) (4.0) (3.0) (2.0) (1.0) -
1.0 2.0 3.0 4.0 5.0 6.0 7.0 8.0
FY07
FY08
FY09
FY10
FY11
FY12
FY13
FY14
E
FY15
E
FY16
E
(Rs)
17
18 MRPL
Valuations
Sum of the parts
We have arrived at a target price of Rs60 using SOTP valuation. The core business has been valued as the average of fair price derived under DCFF, EV/EBITDA (x), P/E(x) and P/B(x) methodology. We have assigned a fair multiple to derive the value under EV/EBITDA, PE and P/B.
Methodology Fair Multiple assigned to Mar-16E
Fair price (Rs)
Valuation Base
DCFF NA 67 WaCC at 10.4% and 2% terminal growth
EV/EBITDA (x) 5.1 66 Net debt at Rs43.2bn, tax rate at 23% and 2% terminal growth
P/E (x) 7.8 53 CoE at 13.3% and 2% terminal growth
P/B(x) 1.4 57 CoE at 13.3% and 2% terminal growth
Fair price 60 Average of price under DCF, EV/EBITDA(x), P/E(x) and P/B(x)
Source: Company, Bloomberg, Centrum Research Estimates
Valuation and recommendation
We have assigned a Buy rating to MRPL with a target price of Rs60 to reflect: (1) Attractive valuation of 3.9x FY16E EV/EBITDA (below current mean -SD); (2) Over-hang of delay in power plant subsiding, as the plant has been recently commissioned; (3) Completion of phase III expansion after nearly three years’ delay; (4) Benefits of higher complexity level likely to reflect from Q1FY15/Q2FY15 although we have conservatively factored-in a lag to Q3FY15; and (5) The stock price trading at trough levels on P/B(x) and with an average 20% discount when compared to global independent refiners.
Exhibit 46: Centrum Estimates vs. Bloomberg Consensus
(Rs mn) Centrum Estimates Bloomberg consensus Chg %
FY14E Chg% FY15E
Chg% FY16E FY14E FY15E FY16E FY14E FY15E FY16E
Sales 681,975 702,984 752,580 716,923 741,663 742,411 (4.9) (5.2) 1.4
EBITDA 7,598 17,416 31,018 13,016 33,949 36,248 (41.6) (48.7) (14.4)
PAT (2,340) 962 11,827 (1,649) 12,204 14,715 NM (92.1) (19.6)
Source: Bloomberg estimates as on 24 March 2014, Centrum Research Estimates
Our earnings have been below consensus primarily owing to lower GRM factored-in as compared to the street which has been factoring GRM of USD5-7/bbl over FY15-16E. This apart, we highlight that the positive turnaround in the company’s financials will certainly have wide variances among street estimates and hence we believe that any inference over such variance must not be drawn.
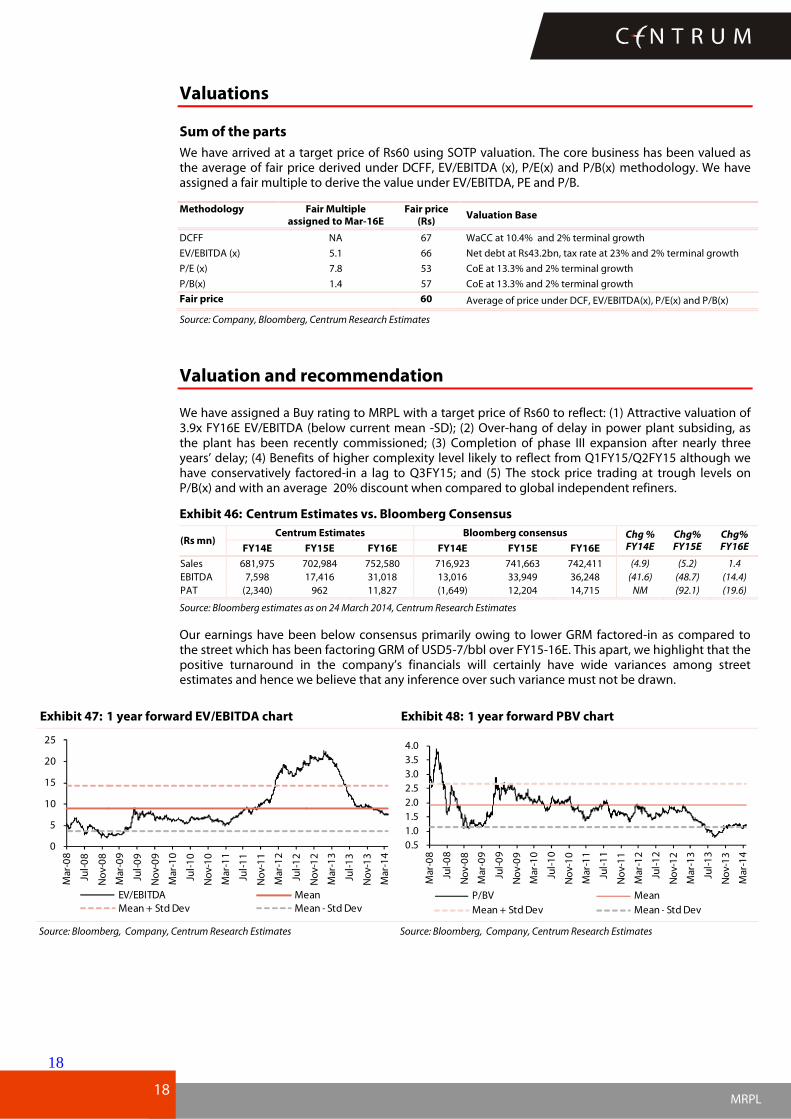
Exhibit 47: 1 year forward EV/EBITDA chart Exhibit 48: 1 year forward PBV chart
Source: Bloomberg, Company, Centrum Research Estimates Source: Bloomberg, Company, Centrum Research Estimates
0
5
10
15
20
25
Mar-08
Jul-08
Nov-08
Mar-09
Jul-09
Nov-09
Mar-10
Jul-10
Nov-10
Mar-11
Jul-11
Nov-11
Mar-12
Jul-12
Nov-12
Mar-13
Jul-13
Nov-13
Mar-14
EV/EBITDA MeanMean + Std Dev Mean - Std Dev
0.5 1.0 1.5 2.0 2.5 3.0 3.5 4.0
Mar-08
Jul-08
Nov-08
Mar-09
Jul-09
Nov-09
Mar-10
Jul-10
Nov-10
Mar-11
Jul-11
Nov-11
Mar-12
Jul-12
Nov-12
Mar-13
Jul-13
Nov-13
Mar-14
P/BV Mean
Mean + Std Dev Mean - Std Dev
18

19 MRPL
Exhibit 49: Domestic and Global peer comparison
Company Mkt. Cap (Rs mn)
CAGR FY14-FY16E (%) EBITDA Margin (%) P/E (x) EV/EBITDA (x) RoE (%) Div Yield (%)
Rev. EBITDA PAT FY14E FY15E FY16E FY14E FY15E FY16E FY14E FY15E FY16E FY14E FY15E FY16E FY14E FY15E FY16E
MRPL 76,416 4.6 55.2 NM 1.1 2.5 4.1 NM NM 6.4 17.7 7.5 3.9 (5.4) 1.5 17.3 - - 2.3
CPCL* 9,776 13.8 DNA DNA 1.6 2.5 2.7 (3.7) 3.2 3.6 9.8 5.9 5.9 (5.2) 17.7 15.4 0.0 9.4 8.7
Essar Oil* 71,679 5.5 14.5 DNA 3.9 4.9 5.2 (86.8) 5.9 4.6 6.8 5.6 5.4 (5.4) 38.0 36.0 0.0 0.0 0.0
RIL* 2,926,163 5.1 11.9 11.8 8.3 9.5 10.7 12.6 10.9 9.7 9.5 8.0 6.9 12.0 12.5 12.6 1.1 1.2 1.3
BPCL* 313,819 7.4 (6.6) 9.9 2.5 2.5 2.6 14.9 13.9 12.2 8.4 8.3 7.7 12.2 12.3 12.9 2.5 2.4 2.5
Global Peers**
Valero Energy Corp 28,654 (6.4) 0.5 19.7 4.0 5.5 5.7 13.1 8.7 8.5 6.1 4.3 3.8 11.2 15.3 14.8 1.6 1.8 1.9
HollyFrontier Corp 9,760 (4.8) (25.0) (29.3) 7.9 9.7 10.8 13.4 11.5 10.4 6.2 5.6 5.0 12.1 13.6 13.9 6.5 6.0 6.0
Phillips 66 45,805 4.0 31.7 2.2 3.8 4.1 4.5 13.8 10.5 9.9 7.3 6.3 5.9 16.9 17.6 18.5 1.7 2.1 2.3
Tesoro Corp 6,599 0.3 (3.5) 0.0 3.8 6.5 7.7 16.6 9.1 7.8 6.8 4.7 3.8 10.3 13.6 16.7 1.8 2.0 2.1
Exxon Mobil Corp 407,536 (0.7) 7.6 (15.7) 17.6 18.4 18.9 12.8 12.6 12.4 5.5 5.7 5.6 18.9 17.8 16.9 2.6 2.8 2.9
Source: *Bloomberg Estimates as on 24 March 2014, Centrum Research Estimates, **Mkt. Cap is in USD mn and earnings are on CY basis; DNA: Details Not Available
19
20 MRPL
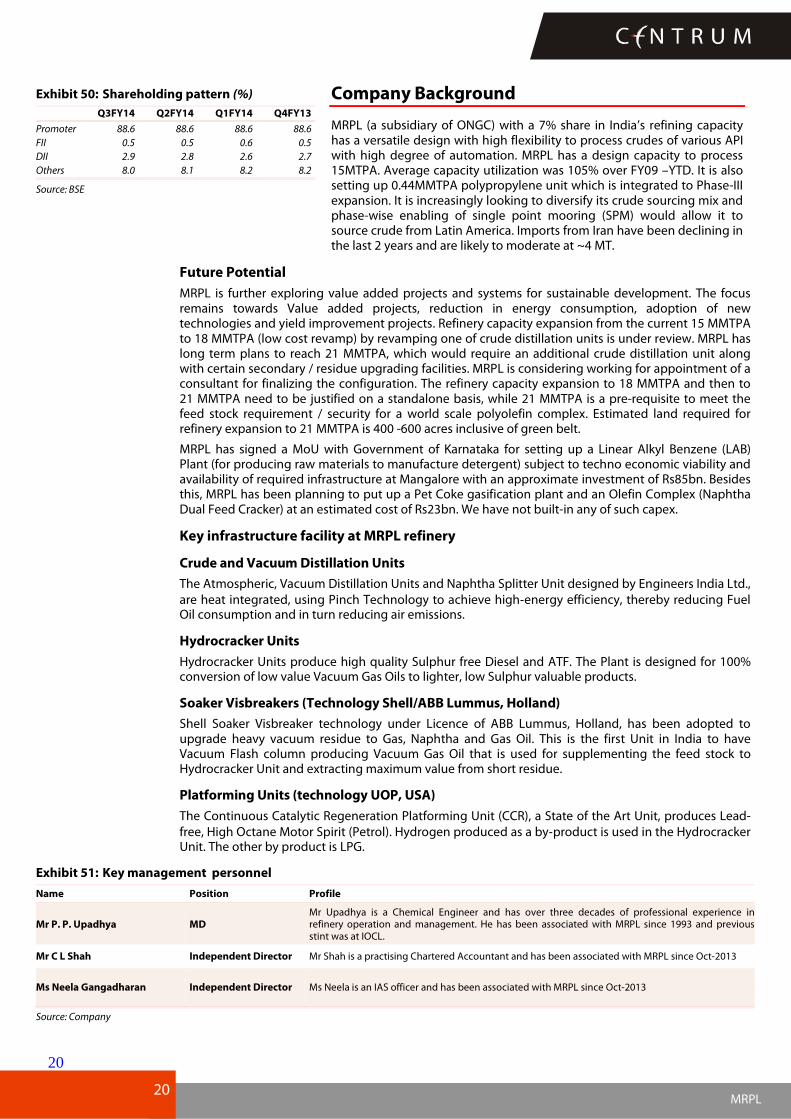
Exhibit 50: Shareholding pattern (%)
Q3FY14 Q2FY14 Q1FY14 Q4FY13
Promoter 88.6 88.6 88.6 88.6
FII 0.5 0.5 0.6 0.5
DII 2.9 2.8 2.6 2.7
Others 8.0 8.1 8.2 8.2
Source: BSE
Company Background
MRPL (a subsidiary of ONGC) with a 7% share in India’s refining capacity has a versatile design with high flexibility to process crudes of various API with high degree of automation. MRPL has a design capacity to process 15MTPA. Average capacity utilization was 105% over FY09 –YTD. It is also setting up 0.44MMTPA polypropylene unit which is integrated to Phase-III expansion. It is increasingly looking to diversify its crude sourcing mix and phase-wise enabling of single point mooring (SPM) would allow it to source crude from Latin America. Imports from Iran have been declining in the last 2 years and are likely to moderate at ~4 MT.
Future Potential
MRPL is further exploring value added projects and systems for sustainable development. The focus remains towards Value added projects, reduction in energy consumption, adoption of new technologies and yield improvement projects. Refinery capacity expansion from the current 15 MMTPA to 18 MMTPA (low cost revamp) by revamping one of crude distillation units is under review. MRPL has long term plans to reach 21 MMTPA, which would require an additional crude distillation unit along with certain secondary / residue upgrading facilities. MRPL is considering working for appointment of a consultant for finalizing the configuration. The refinery capacity expansion to 18 MMTPA and then to 21 MMTPA need to be justified on a standalone basis, while 21 MMTPA is a pre-requisite to meet the feed stock requirement / security for a world scale polyolefin complex. Estimated land required for refinery expansion to 21 MMTPA is 400 -600 acres inclusive of green belt.
MRPL has signed a MoU with Government of Karnataka for setting up a Linear Alkyl Benzene (LAB) Plant (for producing raw materials to manufacture detergent) subject to techno economic viability and availability of required infrastructure at Mangalore with an approximate investment of Rs85bn. Besides this, MRPL has been planning to put up a Pet Coke gasification plant and an Olefin Complex (Naphtha Dual Feed Cracker) at an estimated cost of Rs23bn. We have not built-in any of such capex.
Key infrastructure facility at MRPL refinery
Crude and Vacuum Distillation Units
The Atmospheric, Vacuum Distillation Units and Naphtha Splitter Unit designed by Engineers India Ltd., are heat integrated, using Pinch Technology to achieve high‐energy efficiency, thereby reducing Fuel Oil consumption and in turn reducing air emissions.
Hydrocracker Units
Hydrocracker Units produce high quality Sulphur free Diesel and ATF. The Plant is designed for 100% conversion of low value Vacuum Gas Oils to lighter, low Sulphur valuable products.
Soaker Visbreakers (Technology Shell/ABB Lummus, Holland)
Shell Soaker Visbreaker technology under Licence of ABB Lummus, Holland, has been adopted to upgrade heavy vacuum residue to Gas, Naphtha and Gas Oil. This is the first Unit in India to have Vacuum Flash column producing Vacuum Gas Oil that is used for supplementing the feed stock to Hydrocracker Unit and extracting maximum value from short residue.
Platforming Units (technology UOP, USA)
The Continuous Catalytic Regeneration Platforming Unit (CCR), a State of the Art Unit, produces Lead-free, High Octane Motor Spirit (Petrol). Hydrogen produced as a by‐product is used in the Hydrocracker Unit. The other by product is LPG.
Exhibit 51: Key management personnel
Name Position Profile
Mr P. P. Upadhya MD Mr Upadhya is a Chemical Engineer and has over three decades of professional experience in refinery operation and management. He has been associated with MRPL since 1993 and previous stint was at IOCL.
Mr C L Shah Independent Director Mr Shah is a practising Chartered Accountant and has been associated with MRPL since Oct-2013
Ms Neela Gangadharan Independent Director Ms Neela is an IAS officer and has been associated with MRPL since Oct-2013
Source: Company
20

21 MRPL
Quarterly financials
Exhibit 52: Quarterly financials
Particulars (Rs mn) Q4FY12 Q1FY13 Q2FY13 Q3FY13 Q4FY13 Q1FY14 Q2FY14 Q3FY14
Net Sales 1,58,384 1,28,099 1,63,101 1,79,921 1,85,795 1,52,659 1,87,623 1,86,547
Other operating income 2,356 37 3,010 108 792 28 24 - Consumption of raw material 1,45,354 1,34,980 1,57,409 1,74,049 1,87,565 1,44,123 1,81,988 1,91,812 Increase/Decrease in stock 3,817 (1,873) (7,254) 3,002 (5,036) 5,276 (2,739) (4,250) Total operating expenses 1,50,553 1,41,065 1,51,532 1,80,718 1,84,367 1,56,143 1,82,813 1,89,133 EBITDA 10,187 (12,930) 14,579 (689) 2,221 (3,456) 4,835 (2,585)
Depreciation 1,248 1,375 1,456 1,550 1,663 1,688 1,761 1,845 Interest 375 1,102 701 777 706 779 926 928 Other Income 330 458 195 84 168 265 310 938 PBT 8,894 (14,948) 12,617 (2,932) 20 (5,657) 2,458 (2,464) Tax (including deferred tax) 2,897 257 796 664 1,084 - 100 13 RPAT 6,020 (15,205) 11,851 (3,596) (619) (4,539) 2,358 (2,477)
YoY Growth (%) Net Sales 27.6 (4.2) 39.8 39.1 17.3 19.2 15.0 3.7
EBITDA 12.6 NM NM NM NM NM NM NM
PAT 8.5 NM NM NM NM NM NM NM
Margins (%) EBITDA 6.4 (10.1) 8.9 (0.4) 1.2 (2.3) 2.6 (0.3)
PAT 3.8 (11.9) 7.2 (2.0) (0.6) (3.7) 1.3 (1.3)
Key operational parameters Crude Throughput (MT) 3.4 2.9 3.6 3.8 4.1 3.3 3.7 3.8 Fuel loss (%) 5.6 8.3 10.6 5.5 10.2 2.4 8.9 9.6
Product Sales (MT) 3.2 2.7 3.2 3.6 3.7 3.2 3.4 3.4 Core GRM 9,150 (4,920) 12,840 2,910 3,270 420 2,930 5,500
Operating Margin 4,580 2,410 5,790 5,040 3,530 2,740 1,450 (1,620) Inventory Gain/(losses) 4,570 (7,330) 7,050 (2,130) (260) (2,320) 1,480 7,120 Reported GRM (USD/bbl) 7.1 (4.2) 9.2 1.9 2.0 2.9 5.0 (0.6)
Source: Company, Centrum Research Estimates
In Q3FY14, MRPL reported a loss of Rs2.5bn owing plant outages, pending stabilization of CPP and hence secondary units which led to high fuel loss. Earnings will remain volatile in Q4FY14/Q1FY15 as secondary units would undergo pre-commissioning activities. Forex loss and gains are primarily on MTM basis and owing to timing differences.
Key performance indicators
Exhibit 53: Key performance indicators
Key Variable FY12 FY13 FY14E FY15E FY16E
Capacity (MT) 15 15 15 15 15
Capacity utilization (%) 85 96 95 96 106
Product sales (MT) 11.95 13.17 13.20 13.50 14.80
GRM (USD/bbl) 5.60 2.45 2.5 4.2 6.0
Dubai Fateh Crude Price (USD/bbl) 110 107 105 105 100
Source: Centrum Research Estimates
21

22 MRPL
Financials-Standalone
Exhibit 54: Income Statement
Y/E March (Rs mn) FY12 FY13 FY14E FY15E FY16E
Revenues 5,37,655 6,56,943 6,81,975 7,02,984 7,52,580
Purchase/CoGS 5,10,865 6,42,840 6,67,310 6,77,075 7,12,004
% of revenues 95.0 97.9 97.8 96.3 94.6
Operating expenses 2,591 3,962 4,850 6,066 6,827
% of revenues 0.5 0.6 0.7 0.9 0.9
Employee Costs 1,609 1,846 2,218 2,427 2,731
% of revenues 0.3 0.3 0.3 0.3 0.4
EBITDA 22,589 8,295 7,598 17,416 31,018
EBITDA Margin (%) 4.2 1.3 1.1 2.5 4.1
Depreciation & Amortisation 4,339 6,044 7,937 11,380 11,486
EBIT 18,251 2,251 -339 6,036 19,532
Interest expenses 2,067 3,286 4,101 5,867 5,299
Other Income (2,961) (4,232) 1,133 1,133 1,133 PBT (excluding exceptional item)
13,223 (5,266) (3,308) 1,302 15,366
Provision for tax 4,116 2,801 150 340 3,539
Effective tax rate (%) 31 (53) (5) 26 23
Net Profit 9,107 (8,067) (3,458) 962 11,827
Min. int./ share from asso. - - - - -
Rep. PAT 9,085 (7,569) (2,340) 962 11,827
Exceptional item (22) 498 1,118 - -
Adj. PAT after excp. 9,107 (8,067) (3,458) 962 11,827
Source: Company, Centrum Research Estimates
Exhibit 55: Key Ratios
Y/E March FY12 FY13 FY14E FY15E FY16E
Growth Metrics (%)
Revenue 38.0 22.2 3.8 3.1 7.1
EBITDA 13.1 (63.3) (8.4) 129.2 78.1
Rep. Profit (22.8) NM NM NM NM
Profitability Metrics (%)
EBITDA Margin 4.2 1.3 1.1 2.5 4.1
PBIT Margin 3.4 0.3 (0.0) 0.9 2.6
PBT Margin 2.5 (0.7) (0.3) 0.2 2.0
PAT Margin 1.7 (1.2) (0.5) 0.1 1.6
Return Ratio (%)
ROE 13.2 (11.8) (5.4) 1.5 17.3
ROCE 10.6 (2.6) 0.6 3.5 10.6
ROIC 16.4 3.4 (0.3) 3.5 12.9
Turnover Ratio (days)
Inventory period 53.1 37.3 40.2 40.2 41.1
Debtors period 23.5 22.1 23.4 23.1 22.7
Creditors period 96.7 75.4 80.3 80.3 80.3
Net working capital 2.6 (2.0) 1.5 4.1 8.7
Solvency Ratio (x)
Debt-equity 0.5 0.9 1.2 1.2 1.1
Net debt-equity 0.2 0.6 0.9 0.8 0.6
Current Ratio 1.0 1.0 1.0 1.1 1.1
Interest coverage 7.4 (0.6) 0.2 1.2 3.9
Dividend
Dividend per share 1.0 - - - 1.0
Dividend payout ratio (%) 19.2 - - - 14.8
Dividend yield (%) 2.3 - - - 2.3
Per share (Rs)
Basic EPS - Adjusted 5.2 (4.6) (2.0) 0.5 6.7
Fully diluted EPS - Adjusted 5.2 (4.6) (2.0) 0.5 6.7
Fully diluted EPS - Reported 5.2 (4.3) (1.3) 0.5 6.7
CEPS 7.7 (0.8) 3.2 7.0 13.3
Book value 41.2 36.9 35.6 36.2 41.8
Valuation (x)
P/E 8.4 NA NA NM 6.4
P/BV 1.1 1.2 1.2 1.2 1.0
EV/EBITDA 4.1 14.2 17.7 7.5 3.9
EV/Sales 0.2 0.2 0.2 0.2 0.2
Mcap/Sales 0.1 0.1 0.1 0.1 0.1
Source: Company, Centrum Research Estimates
Exhibit 56: Balance Sheet
Y/E March (Rs mn) FY12 FY13 FY14E FY15E FY16E
Equity Share Capital 17,527 17,527 17,527 17,527 17,527
Share Ap. Money Pend. Allot. - - - - -
Reserves 54,766 47,151 44,846 45,985 55,796
Shareholders' fund 72,293 64,677 62,373 63,511 73,323
Debt 38,919 57,808 76,829 78,359 77,115
Deferred Tax/non current Liability
4,552 7,344 15,000 8,000 -
Total Capital Employed 1,15,764 1,29,830 1,54,202 1,49,870 1,50,439
Gross fixed assets 90,243 1,13,385 1,96,685 2,14,725 2,16,725
Accumulated depreciation (49,644) (55,578) (63,515) (74,895) (86,381)
CWIP 70,892 75,545 18,040 2,000 2,000
Net Fixed Assets 1,11,491 1,33,352 1,51,210 1,41,830 1,32,344
Investments 423 150 150 150 150
Inventories 78,176 67,153 75,017 77,328 84,821
Sundry Debtors 34,593 39,727 43,646 44,543 46,907
Cash & bank balances 22,347 16,059 18,868 24,858 33,878
Loans and advances 13,276 9,448 15,685 16,169 20,320
Other current assets 1,241 1,125 1,159 1,195 1,279
Total current assets 1,49,633 1,33,511 1,54,376 1,64,093 1,87,205
Creditors 1,42,461 1,35,729 1,50,035 1,54,656 1,65,568
Other Current liabilities & prov. 3,322 1,455 1,500 1,547 3,693
Net current assets 3,850 (3,673) 2,842 7,890 17,945
Deferred Tax Asset/Others - - - - -
Total Assets 1,15,764 1,29,830 1,54,202 1,49,870 1,50,439
Source: Company, Centrum Research Estimates
Exhibit 57: Cash Flow
Y/E March (Rs mn) FY12 FY13 FY14E FY15E FY16E
PBT 13,202 (4,768) (2,190) 1,302 15,366
Total tax paid (3,036) (9) 7,506 (7,340) (11,539)
Depreciation 4,339 6,044 7,937 11,380 11,486
Chg in debtors (9,326) (5,134) (3,919) (897) (2,364)
Chg in inventory (37,202) 11,023 (7,865) (2,311) (7,493)
Chg in loans & advances (5,672) 3,828 (6,237) (483) (4,151)
Change in other current assets (956) 116 (35) (36) (84)
Chg in creditors 45,586 (6,732) 14,306 4,622 10,911 Change in other current/ non-current liabilities
(273) (1,867) 45 46 2,146
Net chg in working capital (7,843) 1,234 (3,705) 942 (1,035)
CF from op. activities (a) 6,662 2,502 9,549 6,284 14,279
Capital expenditure (30,262) (27,795) (25,795) (2,000) (2,000)
Chg in investments 525 273 - - -
CF from invest. activities (b) (29,737) (27,522) (25,795) (2,000) (2,000)
Debt raised/(repaid) 23,349 18,889 19,021 1,530 (1,243)
Dividend (incl. tax) (2,037) - - - (2,037)
Others (40) (157) 35 177 22
CF from fin. activities (c) 21,272 18,732 19,056 1,707 (3,258)
Net chg in cash (a+b+c) (1,803) (6,288) 2,810 5,990 9,020
Source: Company, Centrum Research Estimates
22
23 MRPL
Financials-Standalone (Historical)
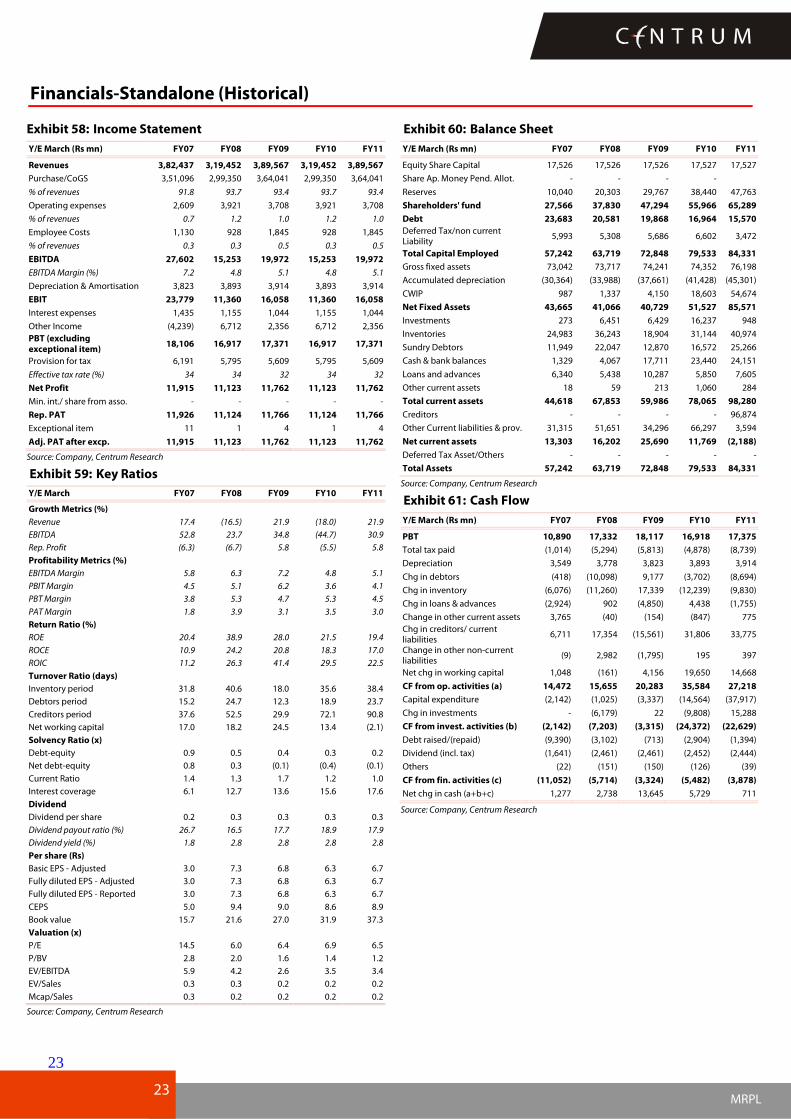
Exhibit 58: Income Statement
Y/E March (Rs mn) FY07 FY08 FY09 FY10 FY11
Revenues 3,82,437 3,19,452 3,89,567 3,19,452 3,89,567
Purchase/CoGS 3,51,096 2,99,350 3,64,041 2,99,350 3,64,041
% of revenues 91.8 93.7 93.4 93.7 93.4
Operating expenses 2,609 3,921 3,708 3,921 3,708
% of revenues 0.7 1.2 1.0 1.2 1.0
Employee Costs 1,130 928 1,845 928 1,845
% of revenues 0.3 0.3 0.5 0.3 0.5
EBITDA 27,602 15,253 19,972 15,253 19,972
EBITDA Margin (%) 7.2 4.8 5.1 4.8 5.1
Depreciation & Amortisation 3,823 3,893 3,914 3,893 3,914
EBIT 23,779 11,360 16,058 11,360 16,058
Interest expenses 1,435 1,155 1,044 1,155 1,044
Other Income (4,239) 6,712 2,356 6,712 2,356 PBT (excluding exceptional item)
18,106 16,917 17,371 16,917 17,371
Provision for tax 6,191 5,795 5,609 5,795 5,609
Effective tax rate (%) 34 34 32 34 32
Net Profit 11,915 11,123 11,762 11,123 11,762
Min. int./ share from asso. - - - - -
Rep. PAT 11,926 11,124 11,766 11,124 11,766
Exceptional item 11 1 4 1 4
Adj. PAT after excp. 11,915 11,123 11,762 11,123 11,762
Source: Company, Centrum Research
Exhibit 59: Key Ratios
Y/E March FY07 FY08 FY09 FY10 FY11
Growth Metrics (%)
Revenue 17.4 (16.5) 21.9 (18.0) 21.9
EBITDA 52.8 23.7 34.8 (44.7) 30.9
Rep. Profit (6.3) (6.7) 5.8 (5.5) 5.8
Profitability Metrics (%)
EBITDA Margin 5.8 6.3 7.2 4.8 5.1
PBIT Margin 4.5 5.1 6.2 3.6 4.1
PBT Margin 3.8 5.3 4.7 5.3 4.5
PAT Margin 1.8 3.9 3.1 3.5 3.0
Return Ratio (%)
ROE 20.4 38.9 28.0 21.5 19.4
ROCE 10.9 24.2 20.8 18.3 17.0
ROIC 11.2 26.3 41.4 29.5 22.5
Turnover Ratio (days)
Inventory period 31.8 40.6 18.0 35.6 38.4
Debtors period 15.2 24.7 12.3 18.9 23.7
Creditors period 37.6 52.5 29.9 72.1 90.8
Net working capital 17.0 18.2 24.5 13.4 (2.1)
Solvency Ratio (x)
Debt-equity 0.9 0.5 0.4 0.3 0.2
Net debt-equity 0.8 0.3 (0.1) (0.4) (0.1)
Current Ratio 1.4 1.3 1.7 1.2 1.0
Interest coverage 6.1 12.7 13.6 15.6 17.6
Dividend
Dividend per share 0.2 0.3 0.3 0.3 0.3
Dividend payout ratio (%) 26.7 16.5 17.7 18.9 17.9
Dividend yield (%) 1.8 2.8 2.8 2.8 2.8
Per share (Rs)
Basic EPS - Adjusted 3.0 7.3 6.8 6.3 6.7
Fully diluted EPS - Adjusted 3.0 7.3 6.8 6.3 6.7
Fully diluted EPS - Reported 3.0 7.3 6.8 6.3 6.7
CEPS 5.0 9.4 9.0 8.6 8.9
Book value 15.7 21.6 27.0 31.9 37.3
Valuation (x)
P/E 14.5 6.0 6.4 6.9 6.5
P/BV 2.8 2.0 1.6 1.4 1.2
EV/EBITDA 5.9 4.2 2.6 3.5 3.4
EV/Sales 0.3 0.3 0.2 0.2 0.2
Mcap/Sales 0.3 0.2 0.2 0.2 0.2
Source: Company, Centrum Research
Exhibit 60: Balance Sheet
Y/E March (Rs mn) FY07 FY08 FY09 FY10 FY11
Equity Share Capital 17,526 17,526 17,526 17,527 17,527
Share Ap. Money Pend. Allot. - - - -
Reserves 10,040 20,303 29,767 38,440 47,763
Shareholders' fund 27,566 37,830 47,294 55,966 65,289
Debt 23,683 20,581 19,868 16,964 15,570
Deferred Tax/non current Liability
5,993 5,308 5,686 6,602 3,472
Total Capital Employed 57,242 63,719 72,848 79,533 84,331
Gross fixed assets 73,042 73,717 74,241 74,352 76,198
Accumulated depreciation (30,364) (33,988) (37,661) (41,428) (45,301)
CWIP 987 1,337 4,150 18,603 54,674
Net Fixed Assets 43,665 41,066 40,729 51,527 85,571
Investments 273 6,451 6,429 16,237 948
Inventories 24,983 36,243 18,904 31,144 40,974
Sundry Debtors 11,949 22,047 12,870 16,572 25,266
Cash & bank balances 1,329 4,067 17,711 23,440 24,151
Loans and advances 6,340 5,438 10,287 5,850 7,605
Other current assets 18 59 213 1,060 284
Total current assets 44,618 67,853 59,986 78,065 98,280
Creditors - - - - 96,874
Other Current liabilities & prov. 31,315 51,651 34,296 66,297 3,594
Net current assets 13,303 16,202 25,690 11,769 (2,188)
Deferred Tax Asset/Others - - - - -
Total Assets 57,242 63,719 72,848 79,533 84,331
Source: Company, Centrum Research
Exhibit 61: Cash Flow
Y/E March (Rs mn) FY07 FY08 FY09 FY10 FY11
PBT 10,890 17,332 18,117 16,918 17,375
Total tax paid (1,014) (5,294) (5,813) (4,878) (8,739)
Depreciation 3,549 3,778 3,823 3,893 3,914
Chg in debtors (418) (10,098) 9,177 (3,702) (8,694)
Chg in inventory (6,076) (11,260) 17,339 (12,239) (9,830)
Chg in loans & advances (2,924) 902 (4,850) 4,438 (1,755)
Change in other current assets 3,765 (40) (154) (847) 775 Chg in creditors/ current liabilities
6,711 17,354 (15,561) 31,806 33,775
Change in other non-current liabilities
(9) 2,982 (1,795) 195 397
Net chg in working capital 1,048 (161) 4,156 19,650 14,668
CF from op. activities (a) 14,472 15,655 20,283 35,584 27,218
Capital expenditure (2,142) (1,025) (3,337) (14,564) (37,917)
Chg in investments - (6,179) 22 (9,808) 15,288
CF from invest. activities (b) (2,142) (7,203) (3,315) (24,372) (22,629)
Debt raised/(repaid) (9,390) (3,102) (713) (2,904) (1,394)
Dividend (incl. tax) (1,641) (2,461) (2,461) (2,452) (2,444)
Others (22) (151) (150) (126) (39)
CF from fin. activities (c) (11,052) (5,714) (3,324) (5,482) (3,878)
Net chg in cash (a+b+c) 1,277 2,738 13,645 5,729 711
Source: Company, Centrum Research
23

24 MRPL
Appendix A
Disclaimer
Centrum Broking Limited (“Centrum”) is a full-service, Stock Broking Company and a member of The Stock Exchange, Mumbai (BSE) and National Stock Exchange of India Ltd. (NSE). Our holding company, Centrum Capital Ltd, is an investment banker and an underwriter of securities. As a group Centrum has Investment Banking, Advisory and other business relationships with a significant percentage of the companies covered by our Research Group. Our research professionals provide important inputs into the Group's Investment Banking and other business selection processes.
Recipients of this report should assume that our Group is seeking or may seek or will seek Investment Banking, advisory, project finance or other businesses and may receive commission, brokerage, fees or other compensation from the company or companies that are the subject of this material/report. Our Company and Group companies and their officers, directors and employees, including the analysts and others involved in the preparation or issuance of this material and their dependants, may on the date of this report or from, time to time have "long" or "short" positions in, act as principal in, and buy or sell the securities or derivatives thereof of companies mentioned herein. Centrum or its affiliates do not own 1% or more in the equity of this company Our sales people, dealers, traders and other professionals may provide oral or written market commentary or trading strategies to our clients that reflect opinions that are contrary to the opinions expressed herein, and our proprietary trading and investing businesses may make investment decisions that are inconsistent with the recommendations expressed herein. We may have earlier issued or may issue in future reports on the companies covered herein with recommendations/ information inconsistent or different those made in this report. In reviewing this document, you should be aware that any or all of the foregoing, among other things, may give rise to or potential conflicts of interest. We and our Group may rely on information barriers, such as "Chinese Walls" to control the flow of information contained in one or more areas within us, or other areas, units, groups or affiliates of Centrum. Centrum or its affiliates do not make a market in the security of the company for which this report or any report was written. Further, Centrum or its affiliates did not make a market in the subject company’s securities at the time that the research report was published.
This report is for information purposes only and this document/material should not be construed as an offer to sell or the solicitation of an offer to buy, purchase or subscribe to any securities, and neither this document nor anything contained herein shall form the basis of or be relied upon in connection with any contract or commitment whatsoever. This document does not solicit any action based on the material contained herein. It is for the general information of the clients of Centrum. Though disseminated to clients simultaneously, not all clients may receive this report at the same time. Centrum will not treat recipients as clients by virtue of their receiving this report. It does not constitute a personal recommendation or take into account the particular investment objectives, financial situations, or needs of individual clients. Similarly, this document does not have regard to the specific investment objectives, financial situation/circumstances and the particular needs of any specific person who may receive this document. The securities discussed in this report may not be suitable for all investors. The securities described herein may not be eligible for sale in all jurisdictions or to all categories of investors. The countries in which the companies mentioned in this report are organized may have restrictions on investments, voting rights or dealings in securities by nationals of other countries. The appropriateness of a particular investment or strategy will depend on an investor's individual circumstances and objectives. Persons who may receive this document should consider and independently evaluate whether it is suitable for his/ her/their particular circumstances and, if necessary, seek professional/financial advice. Any such person shall be responsible for conducting his/her/their own investigation and analysis of the information contained or referred to in this document and of evaluating the merits and risks involved in the securities forming the subject matter of this document.
The projections and forecasts described in this report were based upon a number of estimates and assumptions and are inherently subject to significant uncertainties and contingencies. Projections and forecasts are necessarily speculative in nature, and it can be expected that one or more of the estimates on which the projections and forecasts were based will not materialize or will vary significantly from actual results, and such variances will likely increase over time. All projections and forecasts described in this report have been prepared solely by the authors of this report independently of the Company. These projections and forecasts were not prepared with a view toward compliance with published guidelines or generally accented accounting principles. No independent accountants have expressed an opinion or any other form of assurance on these projections or forecasts. You should not regard the inclusion of the projections and forecasts described herein as a representation or warranty by or on behalf of the Company, Centrum, the authors of this report or any other person that these projections or forecasts or their underlying assumptions will be achieved. For these reasons, you should only consider the projections and forecasts described in this report after carefully evaluating all of the information in this report, including the assumptions underlying such projections and forecasts.
The price and value of the investments referred to in this document/material and the income from them may go down as well as up, and investors may realize losses on any investments. Past performance is not a guide for future performance. Future returns are not guaranteed and a loss of original capital may occur. Actual results may differ materially from those set forth in projections. Forward-looking statements are not predictions and may be subject to change without notice. Centrum does not provide tax advice to its clients, and all investors are strongly advised to consult regarding any potential investment. Centrum and its affiliates accept no liabilities for any loss or damage of any kind arising out of the use of this report. Foreign currencies denominated securities are subject to fluctuations in exchange rates that could have an adverse effect on the value or price of or income derived from the investment. In addition, investors in securities such as ADRs, the value of which are influenced by foreign currencies effectively assume currency risk. Certain transactions including those involving futures, options, and other derivatives as well as non-investment-grade securities give rise to substantial risk and are not suitable for all investors. Please ensure that you have read and understood the current risk disclosure documents before entering into any derivative transactions.
This report/document has been prepared by Centrum, based upon information available to the public and sources, believed to be reliable. No representation or warranty, express or implied is made that it is accurate or complete. Centrum has reviewed the report and, in so far as it includes current or historical information, it is believed to be reliable, although its accuracy and completeness cannot be guaranteed. The opinions expressed in this document/material are subject to change without notice and have no obligation to tell you when opinions or information in this report change.
This report or recommendations or information contained herein do/does not constitute or purport to constitute investment advice in publicly accessible media and should not be reproduced, transmitted or published by the recipient. The report is for the use and consumption of the recipient only. This publication may not be distributed to the public used by the public media without the express written consent of Centrum. This report or any portion hereof may not be printed, sold or distributed without the written consent of Centrum.
The distribution of this document in other jurisdictions may be restricted by law, and persons into whose possession this document comes should inform themselves about, and observe, any such restrictions. Neither Centrum nor its directors, employees, agents or representatives shall be liable for any damages whether direct or indirect, incidental, special or consequential including lost revenue or lost profits that may arise from or in connection with the use of the information.
This document does not constitute an offer or invitation to subscribe for or purchase or deal in any securities and neither this document nor anything contained herein shall form the basis of any contract or commitment whatsoever. This document is strictly confidential and is being furnished to you solely for your information, may not be distributed to the press or other media and may not be reproduced or redistributed to any other person. The distribution of this report in other jurisdictions may be restricted by law and persons into whose possession this report comes should inform themselves about, and observe any such restrictions. By accepting this report, you agree to be bound by the fore going limitations. No representation is made that this report is accurate or complete.
24

25 MRPL
The opinions and projections expressed herein are entirely those of the author and are given as part of the normal research activity of Centrum Broking and are given as of this date and are subject to change without notice. Any opinion estimate or projection herein constitutes a view as of the date of this report and there can be no assurance that future results or events will be consistent with any such opinions, estimate or projection.
This document has not been prepared by or in conjunction with or on behalf of or at the instigation of, or by arrangement with the company or any of its directors or any other person. Information in this document must not be relied upon as having been authorized or approved by the company or its directors or any other person. Any opinions and projections contained herein are entirely those of the authors. None of the company or its directors or any other person accepts any liability whatsoever for any loss arising from any use of this document or its contents or otherwise arising in connection therewith.
Centrum and its affiliates have not managed or co-managed a public offering for the subject company in the preceding twelve months. Centrum and affiliates have not received compensation from the companies mentioned in the report during the period preceding twelve months from the date of this report for service in respect of public offerings, corporate finance, debt restructuring, investment banking or other advisory services in a merger/acquisition or some other sort of specific transaction.
As per the declarations given by them, Mr. Sachin Mehta, research analyst and and/or any of his family members do not serve as an officer, director or any way connected to the company/companies mentioned in this report. Further, as declared by him, he has not received any compensation from the above companies in the preceding twelve months. He does not hold any shares by him or through his relatives or in case if holds the shares then will not to do any transactions in the said scrip for 30 days from the date of release such report. Our entire research professionals are our employees and are paid a salary. They do not have any other material conflict of interest of the research analyst or member of which the research analyst knows of has reason to know at the time of publication of the research report or at the time of the public appearance.
While we would endeavour to update the information herein on a reasonable basis, Centrum, its associated companies, their directors and employees are under no obligation to update or keep the information current. Also, there may be regulatory, compliance or other reasons that may prevent Centrum from doing so.
Non-rated securities indicate that rating on a particular security has been suspended temporarily and such suspension is in compliance with applicable regulations and/or Centrum policies, in circumstances where Centrum is acting in an advisory capacity to this company, or any certain other circumstances.
This report is not directed to, or intended for distribution to or use by, any person or entity who is a citizen or resident of or located in any locality, state, country or other jurisdiction where such distribution, publication, availability or use would be contrary to law or regulation or which would subject Centrum Broking Limited or its group companies to any registration or licensing requirement within such jurisdiction. Specifically, this document does not constitute an offer to or solicitation to any U.S. person for the purchase or sale of any financial instrument or as an official confirmation of any transaction to any U.S. person unless otherwise stated, this message should not be construed as official confirmation of any transaction. No part of this document may be distributed in Canada or used by private customers in United Kingdom.
The information contained herein is not intended for publication or distribution or circulation in any manner whatsoever and any unauthorized reading, dissemination, distribution or copying of this communication is prohibited unless otherwise expressly authorized. Please ensure that you have read “Risk Disclosure Document for Capital Market and Derivatives Segments” as prescribed by Securities and Exchange Board of India before investing in Indian Securities Market.
Rating Criteria
Rating Market cap < Rs20bn Market cap > Rs20bn but < 100bn Market cap > Rs100bn
Buy Upside > 25% Upside > 20% Upside > 15%
Hold Upside between -25% to +25% Upside between -20% to +20% Upside between -15% to +15%
Sell Downside > 25% Downside > 20% Downside > 15%
Member (NSE, BSE, MCX-SX), Depository Participant (CDSL) and SEBI registered Portfolio Manager
Registration Nos.
CAPITAL MARKET SEBI REGN. NO.: BSE: INB011454239, NSE: INB231454233
DERIVATIVES SEBI REGN. NO.: NSE: INF231454233 (TRADING & SELF CLEARING MEMBER)
CDSL DP ID: 12200. SEBI REGISTRATION NO.: IN-DP-CDSL-661-2012
PMS REGISTRATION NO.: INP000004383
MCX – SX (Currency Derivative segment) REGN. NO.: INE261454230
Website: www.centrum.co.in
Investor Grievance Email ID: [email protected]
Compliance Officer Details:
Mr. Ashok Devarajan; Tel: (022) 4215 9000; Email ID: [email protected]
Centrum Broking Limited
Registered Office Address
Bombay Mutual Building ,
2nd Floor,
Dr. D. N. Road, Fort, Mumbai - 400 001
Correspondence Address
Centrum House
6th Floor, CST Road, Near Vidya Nagari Marg, Kalina,
Santacruz (E), Mumbai 400 098.
Tel: (022) 4215 9000
25