ms solutions - separation science
TRANSCRIPT

MS SolutionsSeparation Science ‘MS Solutions’ is the premier online resource for analytical scientists working with mass spectrometry across Europe, the USA and the Middle East. Covering MS method fundamentals, practicalities and troubleshooting it offers chromatographers and analytical chemists a genuine e-learning platform and searchable archive resource.
e-learn.sepscienceasia.com/mssolutions Issue 11
Tech TipNIST 11What’s New and What Value Does it Offer? Part 1
The NIST 11 Mass Spectral database, the successor to the NIST 08, is a fully evaluated collection of electron ionization (EI) Mass Spectra, which also includes a growing number of MS/MS Spectra and GC data. In this multi-part article, David Sparkman looks at history and current status of NIST 11 and explains its value to analytical scientists.Click here to read more...
Featured ApplicationsAn Improved SPE/LC/MS/MS Platform for the Simultaneous Quantitation of Multiple Amyloid beta Peptides in Cerebrospinal Fluid for Preclinical or Biomarker Discovery
Analysis of 258 Pesticides in Vegetable Matrix using Triple Quadrupole GC-MS/MS
Developing New Methods for Pesticides in Dietary Supplements
Analysis of Cholesterol Lowering Drugs (Statins) Using Dried Matrix Spots Technology
Non-Targeted Screening of Lipophilic Marine Biotoxins by Liquid Chromatography – High-Resolution Mass Spectrometry
Analysis of Phthalate Esters in Children’s Toys Using GC-MSClick titles to learn more

NIST 11
What’s New and What Value Does it Offer? Part 1The NIST 11 Mass Spectral Database, the successor to the NIST 08, is a fully evaluated collection of electron ionization (EI) Mass Spectra, which also includes a growing number of MS/MS Spectra and GC data. In this multi-part article, David Sparkman looks at history and current status of NIST 11 and explains its value to analytical scientists.
In 1971, shortly after the acquisition of its initial six GC/MS instruments, the newly formed United States Government’s Environmental Protection Agency (EPA) awarded a development contract to Battelle-Memorial Institute in Columbus, Ohio. This contract was to create a system that automatically transmitted data over voice-grade telephone lines from minicomputers connected to GC/MS instruments in field laboratories to a program running on a large-scale remote time-sharing computer, where a search was performed against m/z value and intensity pairs stored as fields in each individual spectrum, which constituted records in the database. The mass spectral search software was based on the Hites and Biemann search developed at MIT[1] where the m/z value and the intensity of the two most intense peaks in a window of every 14 m/z units (starting at m/z 5) was used for the comparison. The names of compounds whose spectra were similar to the spectrum of the unknown were automatically printed at the user’s terminal. These names were printed in order of the similarity of their spectra to the spectrum of the unknown. A numerical similarity scale of 0 to 1 was established and included with the printout. The goal was to be able to provide a tentative identification without the need of a highly trained mass spectrometrist. The EPA Database was made up of spectra from
the Mass Spectrometry Data Centre (MSDC), an agency of the British government located at Aldermaston, England. This collection of spectra included a number of smaller collections: the American Petroleum Institute’s file of mass spectra, the Dow Chemical Company’s collection, an American Society for Testing and Materials (ASTM) collection, and several other smaller sets of spectra. This original collection had ~10,600 spectra including an unknown number of replicate spectra, some of which may have been duplicates. The EPA added 600 spectra of identified pollutants. A significant limitation of the EPA system, which was also a limitation of the first database search programs used on the minicomputer data systems provided by mass spectrometer manufacturers, was that a spectrum of the compound needed to be submitted for a spectrum (and any associate information; i.e., elemental composition, nominal mass, Chemical Abstracts Registry number (CASrn), structure, etc.) of that compound in the database to be returned. At about the same time, the National Heart and Lung Institute (NHLI) of the National Institutes of Health (NIH), another agency of the U.S. Government, was implementing a similar mass spectral identification system using a somewhat updated MSDS Database (a.k.a. the Aldermaston collection) where m/z-intensity pairs of a sample
O. David Sparkman
spectrum were entered one at a time using a remote terminal and voice-grade telephone lines connected to the mainframe storing the database. It was not necessary that the terminal (which functioned as a keyboard and printer) be connected to the GC/MS systems. The number of spectra in the database having m/z-intensity pairs with an intensity within a specified range of the entered values, was reported back to the user. Another pair was entered and the number of spectra having both pairs would be reported. This process would be repeated until there were a reasonable number of spectra, and the user would then request a printout of the name of each compound. This search algorithm became known as the Any Peaks Search which is still a key component of the NIST Mass Spectral (MS) Search Program. The NIH systems had several major advantages over the
Figure 1
(ar20110516) 2-Pentanone20 30 40 50 60 70 80 90 100
0
50
100
27 29 39 41
43
4458 71
86
87
20 30 40 50 60 70 80 90 1000
50
100
26
27
28
29
3139 41
43
44 55
5758 71
86
20 30 40 50 60 70 80 90 1000
50
100
26
27
29
30 39 41 43 53 56
57
5886
87
A
B
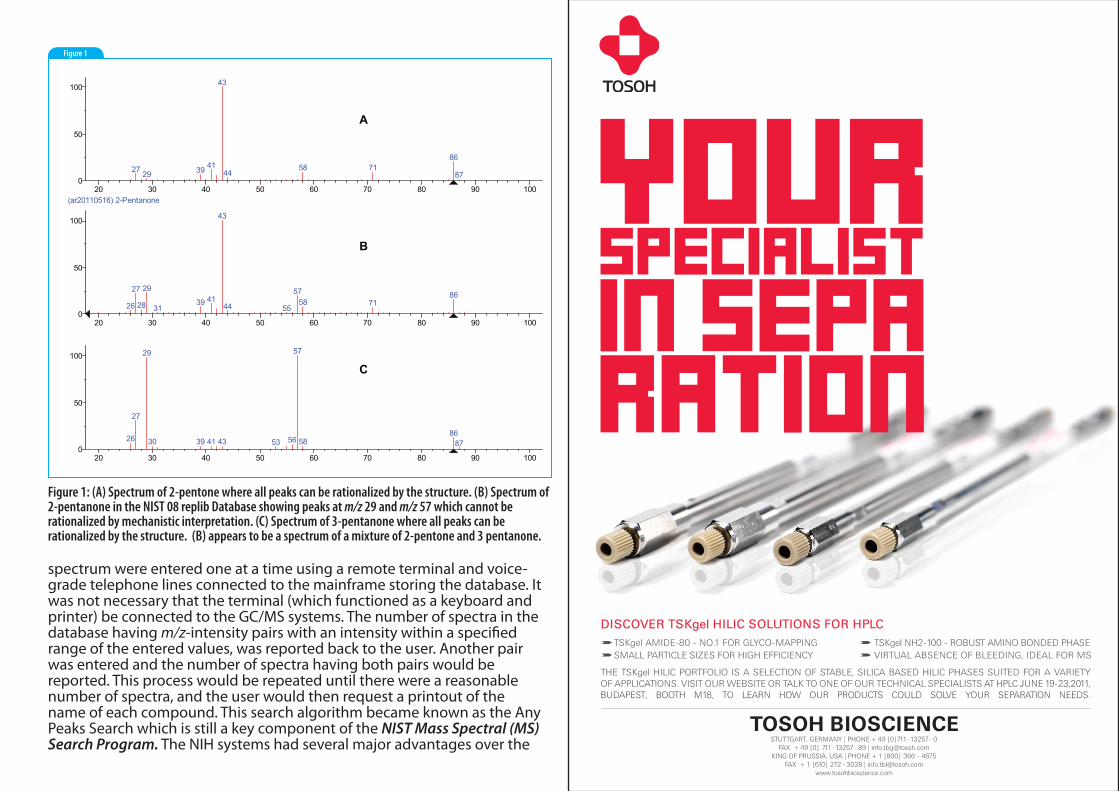
C
Figure 1: (A) Spectrum of 2-pentone where all peaks can be rationalized by the structure. (B) Spectrum of 2-pentanone in the NIST 08 replib Database showing peaks at m/z 29 and m/z 57 which cannot be rationalized by mechanistic interpretation. (C) Spectrum of 3-pentanone where all peaks can be rationalized by the structure. (B) appears to be a spectrum of a mixture of 2-pentone and 3 pentanone.
Discover TsKgel HiLic soLuTions for HPLc
The TSKgel hILIC porTfoLIo IS a SeLeCTIon of STabLe, SILICa baSed hILIC phaSeS SuITed for a varIeTy of appLICaTIonS. vISIT our webSITe or TaLK To one of our TeChnICaL SpeCIaLISTS aT hpLC June 19-23,2011, budapeST, booTh M18, To Learn how our produCTS CouLd SoLve your SeparaTIon needS.
TSKgel aMIde-80 - no.1 for gLyCo-MappIngSMaLL parTICLe SIzeS for hIgh effICIenCy
TSKgel nh2-100 - robuST aMIno bonded phaSevIrTuaL abSenCe of bLeedIng, IdeaL for MS
STuTTgarT, gerMany | phone + 49 [0]711 · 13257 - 0 fax + 49 [0] 711 · 13257 - 89 | [email protected]
KIng of pruSSIa, uSa | phone + 1 [800] 366 - 4875 fax + 1 [610] 272 - 3028 | [email protected]
www.tosohbioscience.com
EPA system. The database could not only be searched by the Any Peaks method, but could also be searched by the nominal mass of a compound, a complete or partial elemental composition of a molecular ion, losses from a molecular ion, MSDS classification codes, or any combinations of these. The system also allowed for complete spectra to be output at the user’s terminal either in a text or graphic format. Being able to retrieve the database spectrum in a graphical format allowed a comparison between the spectrum of the unknown and the database spectrum. This was especially helpful when there was not a spectrum of the unknown in the database and it was necessary to make comparisons to identify structural moieties in the unknown. This system was considered to be directed towards the experienced mass spectrometrist due to the fact that judgments were necessary. Circa 1975, these two systems were merged. The database, which was now maintained by MSDC, was put on a commercial time-sharing computer system supported by a well developed communications network accessible by local telephone calls from many cities in the U.S. and overseas. [2] This project not only involved the original parties but was expanded to include the U.S. Federal Drug Administration (FDA). The merged database consisted of an expanded version of the original MSDC file, a collection acquired from John Wiley & Sons (the Wiley Registry of Mass Spectra), and spectra collected by EPA all of which resulted in ~30K spectra. The goal was to use other donations and contracts administered by the three U.S. Government agencies to develop a collection of ~50K spectra. This merged system allowed for the EPA transmittal of complete spectra and also the NIH multiple-function searches all using voice-grade telephone lines. This was known as the MSSS (Mass Spectral Search System). At the same time, the EPA Database of ~12,500 spectra was made available by a yearly subscription (of a magnetic tape) from the U.S. National Bureau of Standards (NBS), which later had its name changed to the National Institute of Standards and Technology (NIST). There was only one spectrum per compound. The complete spectra (spectra having all the peaks that had been acquired) on that tape were condensed by the instrument manufacturers to the two most intense peaks in a 14 m/z unit windows and used with second-generation GC/MS data systems that had two disk drives instead of the original DECtape. The only way a database spectrum could be retrieved would be through a database search of a spectrum of that compound that had been generated with the GC-MS.
Evolution of NIST’s Distribution of EI Mass SpectraBy 1978, the NIST/EPA/NIH Mass Spectral Database contained 25,556 spectra; a 1980 release had 34,363 spectra; by 1992 the Database had grown to 74,828 spectra, 12,593 of which were selected replicates. The NIST 11*
Separation Science Europe 2011 Conference and Exhibition is a genuinely educational scientific event aimed at scientists, engineers and technical experts from the diverse analytical instrumentation industries. This two-day, single-stream event will comprise a world leading scientific programme covering issues of vital importance to application chromatographers and analytical chemists working in pharmaceutical, food analysis, environmental, petrochemical and clinical laboratories.
Taking place at the world famous Royal Institution of Great Britain, London, Separation Science Europe 2011 represents a genuine learning experience for all analysts looking to improve their knowledge and skills in sample preparation, chromatography and mass spectrometry.
www.sepscience.com/conferences
SEPARATION SCIENCE EUROPE 2011 New Horizons in Separation and Detection Techniques10-11 October, The Royal Institution, London, UK
Supported by
HPLC Troubleshooting: Listen to the Chromatogram John W. Dolan (LC Resources, USA)
Improving Electrospray LODs by Use of Narrow Bore HPLC Columns Frederick E. Klink (Mass-spec-training.com, California USA)
Novel Derivatization Strategies for Targeted LC-MS Henk Lingeman (VU University Amsterdam, Netherlands)
Computational Approaches to Chromatographic Method Development Roman Szucs (Pfizer, UK)
Modern GCMS Analysis – Faster, Higher, BroaderSusanne Kräher (Shimadzu Europa GmbH, Germany)
Analytical Methodologies in Modern Doping Control LaboratoriesJim Healy (Limerick Institute of Technology, Irealnd)
Using Temperature in HPLC – Turning on the HeatAnthony Edge (Thermo Fisher Scientific, UK)
The Ever-Shrinking HPLCHan Gardeniers (University of Twente, Netherlands)
It’s all about SelectivityDiane Turner (Anthias, UK)
A Comparison of Recommended Strategies for Reversed Phase HPLC Method DevelopmentOona McPolin (Mourne Training Services, UK)
For sponsorship enquiries contact Dean Graimes ([email protected])
To register for the conference visit www.sepscience.com/conferences or contact Jackie Tan ([email protected])
Key preSenTaTionS incluDe:
NEW HORIZONS IN SEPARATION AND DETECTION TECHNIQUES
*The NIST/EPA/NIH Mass Spectral Database has been distributed under many different names. In 1998, NIST began using the format NISTYY, where YY were the last two digits of the distribution year. There has been a NIST 98, NIST 02, NIST 05, NIST 08, and now NIST 11. Agilent used a naming convention that contained NBS (the erstwhile acronym for NIST) and the number of spectra; i.e., \NSB128K.L.

Database contains 243,893 EI spectra of 212,961 compounds. Prior 1992, the Database contained only one spectrum per compound. This spectrum was considered to be the best quality spectrum for that compound in the NIST Archive Database; however, due to variances in EI spectra produced by different types of instrument (magnetic sector double-focusing vs transmission quadrupole; quadrupole ion trap vs time-of-flight, etc.) and that often times averages of several acquired spectra were compared against the Database, it was decided to include replicate spectra from different sources (different instruments and different laboratories using the same make and model of an instrument) for important compounds that exhibited such differences, but that had been evaluated and were judged to be quality spectra. The NIST 11 Database of EI spectra contains 30,932 replicate spectra of 19,788 compounds. The NIST Database is divided into two files: one contains only a single spectrum, which is considered the “best” spectrum for each compound. This file is actually a folder with the name \mainlib. The other file (also actually a folder) contains all the replicate spectra and has the name \replib. A compound may have only one replicate spectrum or it may have several replicate spectra. Three spectra in the \mainlib each have seven replicate spectra. For example, cocaine has a \mainlib spectrum and five \replib spectra where as N,N-dimethyl-N’-[3-(trifluoromethyl)phenyl]-urea has only one replicate. Although the EPA/NIH Database was made available to instrument manufacturers through NBS (later known as NIST), the stewardship remained with the EPA until 1988. At that time, EPA turned the stewardship over to NIST. Based on what is known as the Standard Reference Data Act of 1968 (Public Law 90 -396) passed by the U.S. Senate and House of Representatives (90th Congress H. R. 6279, July 11, 1968) and signed into Law by the President of the United States, the U.S. Secretary of Commerce (NIST is part of the Department of Commerce) is mandated to collect and publish standard reference data and sell such data to recover the cost of the collection and publication of these data. This law is the reason that NIST charges its distributors, who in turn, charge their customers, royalties for the use of these mass spectral data. All based on this law, NIST began a program to ensure the quality of these data and to facilitate its ease of use. At the time that NIST assumed stewardship of the Database, it was decided that the Database needed to be evaluated to assure that the spectra were actually what was stated. Because of the limitation of mass spectral search systems on instrument manufacturers data systems being able to only display a database spectrum when a sample spectrum was searched against the database, NIST needed to developed a search program to aid its workers to view and evaluate the data. This program was developed along the lines of the features available in the MSSS that was accessible on a time-share basis; however, it could be used with a personal computer. The first version of the NIST Mass Spectral (MS) Search Program
Figure 2
120 130 140 150 160 170 180 190 200 210 220 230 240 250 260 270 280 290 300 310 320 330 340 350 360 370 380 390 400 410 420 4300
50
100
129.10
147.10 167.10
184.10
193.20
212.20
230.20
258.10
276.10
294.10
313.30340.30
358.20
370.30386.30
404.20
412.80
H2N
O
NH
S O
O
NH
NH2
O
OH
NH2
H2N
O
NH
S O
O
NH
NH2
O
OH
NH2
120 130 140 150 160 170 180 190 200 210 220 230 240 250 260 270 280 290 300 310 320 330 340 350 360 370 380 390 400 410 420 4300
50
100
y1-18
y1 167.10
184.10
193.20
b2-64
a2-18
b2-18
b2
b2+18
313.30p-82
p-64
370.30p-36
p-18
412.80
H
was released in 1989. The Program was quickly embraced by the mass spectrometry community because it allowed for easy access to all the data in the Database. The Program continued to evolve as DOS-based software until 1995 when the first Windows-based version was developed. This Windows programs progressed through several version until 2001 when the current Windows version 2 was released. Enhancements and changes required to accommodate changes in the Windows computer operating system were made and released with each new version of the Database. Beginning with the release of the Database in 1998, NIST set as a goal to have a new release of the data every three years and consequently a new version of the Program. The next release was NIST 02 in 2002 with version 2.0a. Version 2.0g has been released with NIST 11. In 1990, as NIST continued to acquire spectra from outside sources and measure spectra in its laboratories using a Hewlett Packard (now Agilent Technologies) GC Mass Selective Detector (MSD), and later a JEOL GCmate
Figure 2: Two displays of the same mass spectrum from the NIST 11 MS/MS Database of a tripeptide. The top spectrum illustrates the normal peak labeling and the bottom spectrum illustrates the optional labeling of y and b ions.

(double-focusing instrument), an evaluation of the spectra in the Database began. This resulted in all the spectra in NIST 98 (released in 1998) have been fully evaluated (129,136 spectra, including 21,270 replicate spectra). NIST 98 was released with version 1.6d of the MS Search Program and then, version 1.7a in March of 2001. Even after the fully evaluated Database was released, spectra reported by users to have anomalies or to be of questionable quality were revaluated. Generally, these spectra were replaced by carefully measured spectra if the compounds where available or they were removed if the reported problems were found to be valid. All new spectra procured or measured were submitted to the same validation process. A good example of problems uncovered even after the complete evaluation is see in Figure 1. Figure 1(A) is the NIST 08 EI mass spectrum from the \mainlib of 2-pentanone. Figure 1(B) is the first replicate spectrum for the same compound in NIST 08. Figure 1(C) is the spectrum of 3 pentanone. It is obvious that the spectrum in Figure 1(B) is of a mixture of the two compounds. The spectrum shown in Figure 1(B) which appeared in NIST 08 was removed from NIST 11. This spectrum had been accepted in error in the original evaluation process and had to be removed when the problem was exposed. Beginning with the release of NIST 05 in 2005, GC method/retention index (RI) data and mass spectra obtained using MS/MS were distributed along with the EI spectra. The GC method/retention index data were mainly a compilation from the scientific literature. In addition to the reported RI and the detailed GC method [column type (packed or capillary)], dimensions (length and diameter), stationary phase and its loading (% for packed; film thickness for capillary), acquisition temperature (isothermal or programmed along with ramp rates and hold times), and mobile phase, type and flow rate) the literature citation is included with the title of the article. NIST 05 contained 121,112 records for 25,728 compounds measured on polar stationary phases with 12,433 compounds having spectra in the EI Database. NIST 08 contained 293,247 records of 44,008 compounds measured on both polar and nonpolar stationary phases with 21,940 compounds having spectra in the EI Database. NIST 11 contains 346,757 records of 70,835 compounds measured on polar and nonpolar stationary phases with 38,648 compounds having spectra in the EI Database. NIST 05 had 5,191 spectra obtained of 1,920 ions using MS/MS techniques. NIST 08 had 14,802 spectra of 5,308 ions; and, NIST 11 contains 95,409 spectra of 12,568 ions. Spectra of both positive and negative ions were measured. Measurements were made using both tandem-in-time (quadrupole ion traps) and tandem-in-space (tandem quadrupoles and Q-TOF) instruments. Multiple collision energies were used and recorded. The MS/MS Database contains spectra for all the di- and tri-peptides. These spectra can be displayed in a graph format with peaks labeled as to m/z values or as to the type of ion (y and b), see Figure 2. When spectra acquired
using MS/MS techniques have m/z values greater than unity, the spectra are display with these accurate m/z values using the current version of the MS Search Program. Both the GC method/retention index (RI) and MS/MS databases are available standalone with Search Programs from distributors. The Search Programs provided with the standalone GC method/retention index (RI) database is substantially different from MS Search but has a similar user interface. This program offers a greater flexibility of interrogation of these data than is available with MS Search. The MS/MS standalone data is distributed with v.2.0g of the MS Search Program.
Part 2 of this article will be available later this month. Part 2 will look at the NIST Mass Spectral Search Program v.2.0g used with NIST 11.
References1. Hertz, HS; Hites, RA; Biemann, K “Identification of Mass Spectra by Computer-Searching a File of Known Spectra” Anal. Chem. 1971, 43, 681–691. 2. Heller, S.R., Milne, G.W.A. (1979) The EPA-NIH Chemical Information System. Env. Sci, Tech. 12, 7, 798-803.
O. David Sparkman is currently an Adjunct Professor of Chemistry at the University of the Pacific in Stockton, California; Consultant to the National Institute of Standards and Technology Mass Spectrometry Data Center; President of ChemUserWorld.com; and a former American Chemical Society Instructor and American Society for Mass Spectrometry Member-at-large for Education. At the University of the Pacific he teaches courses in mass spectrometry and analytical chemistry and manages the mass spectrometry facility. Over the past 28 years, he has developed and taught five different ACS courses in mass spectrometry. He is the author of Mass Spectrometry Desk Reference. 1st and 2nd editions; Introduction to Mass Spectrometry, 4th ed. with J. Throck Watson and Gas Chromatography Mass Spectrometry: A Practical Guide, 2nd ed, with Zelda Penton. He also provides general consulting services in mass spectrometry for a number of instrument manufacturers, manufacturing companies, and government agencies.

An Improved SPE/LC/MS/MS Platform for the Simultaneous Quantitation of Multiple Amyloid beta Peptides in Cerebrospinal Fluid for Preclinical or Biomarker DiscoveryCompany: WatersA previous application note described in detail the development of a fast, flexible SPE/LC/MS/MS platform for the quantification of multiple amyloid beta peptides from human or monkey CSF for the use in biomarker or preclinical disovery setting. In this note, the mass spectrometry platform has been updated from the Xevo TQ MS to the Xevo TQ-S system. This change facilitated both a 4X reduction in required sample size and a 4-5X increase in assay sensitivity.
Analysis of 258 Pesticides in Vegetable Matrix using Triple Quadrupole GC-MS/MSCompany: BrukerA method for analysis of 258 pesticides has been developed on Scion TQ triple quadrupole mass spectrometer. The method setup is streamlined with the new software approach of Compound Based Scanning (CBS). The matrix-matched calibration results have demonstrated good sensitivity, linearity and precision of Scion TQ.
Developing New Methods for Pesticides in Dietary SupplementsCompany: RestekNew requirements for dietary supplements to be manufactured under cGMP regulations have created a need for methods to detect pesticides in these complex, largely botanical products. QuEChERS offers a simple, cost-effective approach that can reduce matrix interferences as well as variation among technicians. Here we demonstrate a procedure that incorporates a QuEChERS extraction, cSPE cleanup and GCTOFMS, resulting in good recoveries for a wide range of pesticide chemistries in dandelion root powder.
Featured Applications
Application Note # CA 281751 Analysis of 258 Pesticides in Vegetable Matrix using Triple Quadrupole GC-MS/MS
Abstract:A method for analysis of 258 pesticides has been developed on Scion TQ triple quadrupole mass spectrometer. The method setup is streamlined with the new software approach of Compound Based Scanning (CBS). The matrix-matched calibration results have demonstrated good sensitivity, linearity and precision of Scion TQ.
IntroductionThere are nearly one thousand pesticides used in modern agricultural practice, and the residues of pesticides in the food from plant origins have been an increasing concern for consumers worldwide. Monitoring programs based analytical methodologies are established to ensure that the pesticide levels in plant foods are in compliance with national and international laws. However, the diversity of pesticides and complexity of food sample matrix present ongoing challenges for analytical chemists to meet the increasingly stringent requirements for sensitivity, precision and throughput.
Gas chromatography (GC) coupled to a triple quadruple mass spectrometer (GC-MS/MS) operated in multiple reaction monitoring (MRM) mode is an ideal technique for multi-residue analysis in complex matrix samples[1]. In MRM mode, a precursor ion of a target residue is isolated in the first quadrupole (Q1), followed by collision induced dissociation (CID) in the second quadrupole (Q2), and one or two selected product ions are filtered through the third quadrupole (Q3) to reach the detector. MRM can greatly enhance the sensitivity through increased specificity and selectivity by reducing the background signals from matrix. Moreover, multiple MRMs from co-eluted residues can be monitored simultaneously.
This application note describes a GC-MS/MS method for detection of 258 pesticides in a vegetable matrix after extraction using the QuEChERS (Quick Easy Cheap Effec-tive Rugged and Safe) method. The ease of method setup, and the sensitivity, linearity and precision of the GC-MS/MS system are demonstrated.
Download
Restek Corporation, 1-800-356-1688 or 1-814-353-1300 www.restek.com
New requirements for dietary supplements to be manufactured under cGMP regulations have created aneed for methods to detect pesticides in these complex, largely botanical products. QuEChERS offers a sim-ple, cost-effective approach that can reduce matrix interferences as well as variation among technicians.Here we demonstrate a procedure that incorporates a QuEChERS extraction, cSPE cleanup and GC-TOFMS, resulting in good recoveries for a wide range of pesticide chemistries in dandelion root powder.
IntroductionRecently the FDA announced that makers of dietary supplements (e.g. vitamins, herbal and botanical pills,etc.) will have to adhere to current Good Manufacturing Practices (cGMPs), marking a major shift in reg-ulatory oversight and testing for the industry. Previously, compliance was voluntary, but in 2003, due topublic and industry concern, the FDA proposed requiring dietary supplement manufacturers to adhere tocGMP standards. The final rule was issued in June 2007 and is in full effect June 2010 [1]. Basic GMPsrequire implementing comprehensive procedures to ensure product quality and safety. Since many dietarysupplements are largely derived from botanical sources, they must be tested for pesticide contaminants inorder to meet cGMP regulations. As a result of this requirement, labs are working to develop and validatemethods, an endeavor which is complicated by the wide range of pesticides and matrices to be tested.
Labs can begin method development with the FDA Pesticide Analytical Manual (PAM), which includesprocedures for plant materials. While PAM Method 303 is an appropriate starting point, it has several dis-advantages, including high solvent consumption, manual procedures that contribute to analytical varia-tion, and the inability to extract polar pesticides. As an alternative, we developed a QuEChERS-basedmethod for analyzing pesticides in dietary supplements that has several advantages over PAM 303 (TableI). QuEChERS is an approach that was developed by the USDA Eastern Regional Research Center as asimple, rapid, effective, yet inexpensive way to extract pesticide residues from fruits and vegetables, fol-lowed by a novel dispersive solid phase extraction (dSPE) cleanup of the extract. Because of these bene-fits, the approach has become popular and has been expanded to include numerous other matrices. Wechose QuEChERS as an alternative to PAM 303 because of its speed, simplicity, and low solvent use, aswell as its ability to produce good extraction efficiencies for relatively polar pesticides [2].
Based on preliminary studies, we knew that while the extraction part of QuEChERS would be successful,the dSPE cleanup step probably did not have the capacity to handle the matrix complexity of most dietarysupplements. Thus, we compared dSPE to a cartridge solid phase extraction (cSPE) cleanup and establisheda procedure that uses a QuEChERS extraction, cSPE cleanup, and GC-TOFMS for accurate determinationsof 46 pesticides in dandelion root powder. This approach saves time and can reduce analyst variation byminimizing manual preparation with prepackaged extraction salts and snap-and-shoot standards. Asshown in Figure 1, it also uses much less solvent, salt, and sorbent, making it a greener, more cost-effectivemethod than PAM 303.
Table I Decrease costs and increase reproducibility with a GMP-friendly QuEChERSapproach to analyzing pesticides in dietary supplements.
Applications Note
Developing New Methods forPesticides in Dietary Supplements
Advantages of the QuEChERS Approach
Chromatography Products
PAM 303 QuEChERS Benefits of Method + cSPE QuEChERS + cSPE
Solvent used (mL) 1,850 92 20x less solvent;cleaner, greener,& cost-effective
# of Solvents 4 3Salt and sorbent used (g) 35 6.6 5x less salt/sorbentGlassware/lab • Separatory funnel • Centrifuge Fast, easy batchequipment (1L capacity) • SPE manifold processing
• Filter apparatus• Florisil column
Manual preparation • Salt solution None—prepackaged Highly reproducible;• Standards salts and cSPE less manual prep means• Florisil column cartridge are less human error
ready to use
Download
Download

Recommend a ColleagueIf you have a work colleague, collaborator or staff member who would benefit from this monthly publication then send us their details below.
Recommend
Read the latest
www.sepscience.com
Advances in Clinical Proteomics – a workshop reportMadalina Oppermann
Laboratory Deviations Related to HPLC Analysis and How to Avoid ThemOona McPolin
Reversed-Phase Analysis of Alkylbenzene Sulfonates
Measuring Antibody-Antigen Interactions with the Calypso
Improved Blood Alcohol Analysis by Resolution of Propanal from Ethanol Using Two Unique GC Column Phases, Zebron ZB-BAC1 and ZB-BAC2
Improved Drug Impurity ID Efficiency under CMC using 2-D LC/MS
Automated Pyrolyser
Thermo Fisher Scientific Launches LIMS for Clinical Laboratories
Tosoh Bioscience celebrates 40 years of SEC/GPC expertise
Bruker Release of the SCION Series
Hand-held device simplifies VOC and SVOC sampling from air
An
Tu
EuropeVolume 3, Issue 8
Advances in Clinical Proteomics
Laboratory Deviations Related to HPLC Analysisand How to Avoid Them
Analysis of Cholesterol Lowering Drugs (Statins) Using Dried Matrix Spots TechnologyCompany: Agilent TechnologiesDried blood spot (DBS) technology combined with the analytical capability of modern mass spectrometers (LC-MS/MS) has recently emerged as an important method for the quantitative bioanalysis of small molecules. It is increasingly being looked at as a microsampling approach for preclinical and clinical pharmacokinetic/toxicokinetic studies. The primary advantage of DBS is the significant reduction in blood volume requirements, leading to cost and ethical benefits.
Non-Targeted Screening of Lipophilic Marine Biotoxins by Liquid Chromatography – High-Resolution Mass SpectrometryCompany: Thermo Fisher ScientificMarine biotoxins are produced by naturally occurring microalgae, whose populations can increase significantly under certain environmental conditions to form a harmful algal bloom. This report describes the use of the Thermo Scientific Exactive benchtop LC/MS system powered by Orbitrap technology for screening lipophilic marine biotoxins commonly found in shellfish. The method was optimized using a standard mixture of marine biotoxins, and then applied to a mussel tissue extract.
Analysis of Phthalate Esters in Children’s Toys Using GC-MSCompany: ShimadzuAs of February 2009, the US Consumer Product Safety Improvement Act, Section 108, mandated that all manufacturers of children’s toys analyse their products for Phthalate Esters. The method to be used is in accordance with the US Consumer Product Safety Commission (CPSC). In this study, six phthalate esters in children’s toys were measured using the GCMS-QP2010 Ultra. The simultaneous Scan/SIM data acquisition technique was utilized, with the SIM data used for quantitation. The data showed excellent calibration curve linearity and repeatability. In two of the toy samples, unregulated plasticizers were identified by scan data, illustrating the efficiency of simultaneous Scan/SIM measurement.
Non-Targeted Screening of Lipophilic MarineBiotoxins by Liquid Chromatography –High-Resolution Mass SpectrometryPearl Blay, Joseph P.M. Hui, Jeremy E. Melanson,
National Research Council of Canada, Institute for Marine Biosciences, Halifax, Nova Scotia, Canada
James S. Chang, Thermo Fisher Scientific, San Jose, CA, USA
Introduction
Marine biotoxins are produced by naturally occurringmicroalgae, whose populations can increase significantlyunder certain environmental conditions to form a harmfulalgal bloom (HAB). During the incidence of a bloom,marine biotoxins pose a significant food safety risk whenbioaccumulated in shellfish that are ingested by humans.Therefore, adequate testing for biotoxins in shellfish isrequired to ensure public safety and long-term viability of commercial shellfish markets.
The lipophilic marine toxins class includes thedinophysistoxins, azaspiracids, pectenotoxins, andyessotoxins. The compounds are structurally diverse, asshown in Figure 1, and thus do not contain a common UVchromophore or reactive functional group for fluorescencederivatization. Therefore, LC-MS is the method of choicefor their analyses and several MRM-based methods havebeen reported.1-3
In response to the need for non-targeted methods thatcan potentially detect unknowns, high-resolution LC-MShas been successfully implemented for screening andquantification in food safety applications.4-6 The lower-cost,higher-mass accuracy, and ease-of-use of modern quadrupoletime-of-flight (QTOF) and Thermo Scientific Orbitrapbased mass spectrometers have made high-resolutionsystems viable alternatives to triple-quadrupole systemsfor routine analysis. After full-spectrum data acquisition,specificity is typically achieved by extracting narrow masswindows (ie. 2–5 ppm) centered around a list of target
analytes. Using this approach, it has been demonstratedthat a resolving power of 50,000 or greater is required forcorrect mass assignments in complex matrices.6 Thisreport describes the use of the Thermo Scientific Exactivebenchtop LC/MS system powered by Orbitrap™ technologyfor screening lipophilic marine biotoxins commonly foundin shellfish.7 The method was optimized using a standardmixture of marine biotoxins, and then applied to a musseltissue extract.
Experimental
Chemicals and Materials
Certified calibration solutions and mussel tissue referencematerials were purchased from the NRC CertifiedReference Materials Program (Halifax, Nova Scotia,Canada). Certified calibration solutions were used for thefollowing biotoxins: okadaic acid (OA), dinophysistoxin-1(DTX1), dinophysistoxin-2 (DTX2), pectenotoxin-2(PTX2), azaspiracid-1 (AZA1), azaspiracid-2 (AZA2),azaspiracid-3 (AZA3), and yessotoxin (YTX). As a testsample, a mussel tissue containing certified levels of OAand DTX1 was used (CRM-DSP-Mus-b).
HPLC grade acetonitrile and formic acid (98%) werepurchased from EMD chemicals (Gibbstown, NJ, USA).Distilled-in-glass grade methanol was acquired from CaledonLaboratories (Georgetown, ON, Canada), and ammoniumformate (≥ 99.0%) was from Fluka (St. Louis, MO, USA).
Key Words
• Exactive
• Hypersil GOLD
• LiquidChromatography
• Marine Biotoxin
• Non-TargetedScreening
• OrbitrapTechnology
Application Note: 52154
Figure 1: Chemical structures of the primary analogs of the regulated lipophilic marine biotoxins
Download
Download
Introduction
"Phthalate esters" is a general term for esterified compounds of phthalic acid and alcohol. Phthalate esters are used as plasticizers to make materials more flexible and elastic. Numerous types of phthalate esters have been developed, differing in the carbon number of the alcohol. The phthalate esters are added based on the desired property, such as insulation, heat resistance, or weatherproofing. In recent years, regulations on phthalate esters in toys have been investigated in various countries with the aim of protecting the health of infants and children.
EU Directive 2005/84/EC and the US Consumer Product Safety Improvement Act, Section 108, regulate the following 6 phthalate esters: dibutyl phthalate (DBP), butyl benzyl phthalate (BBP), di-2-ehtylhexyl phthalate (DEHP), di-octylphthalate (DnOP), diisononyl phthalate (DINP), and di-isodecyl phthalate (DIDP).This article introduces the results of simultaneous Scan/SIM measurements of 6 phthalate esters in children's toys, performed in accordance with analysis method CPSC-CH-C1001-09.3, prescribed by the US Consumer Product Safety Commission (CPSC).
Experiment
Reagents Preparation of Reagents
Phthalate ester standard mixture 3 (0.1 mg/mL of dibutyl phthalate (DBP), butyl benzyl phthalate (BBP), di-2-ehtylhexyl phthalate (DEHP), di-n-octylphthalate (DnOP), diisononyl phthalate (DINP), and di-isodecyl phthalate (DIDP) respectively) was purchased from Kanto Chemical Co., Inc. Benzyl benzoate (BB) was purchased from Wako Pure Chemical Industries, Ltd. for use as the internal standard. The organic solvents used at the preparation stage were all suitable for the analysis of residual agricultural chemicals.
Phthalate ester standard solutions were prepared by diluting phthalate ester standard mixture 3 with cyclohexane to create a series of standards with concentrations of 0, 0.25, 0.5, 1, 5, and 10 µg/mL respectively. An internal standard, BB, at a concentration of 1 µg/mL was added to each of the standard solutions. BB was also diluted to a concentration of 7.5 µg/mL with cyclohexane, for use as an internal standard solution added to the extracted samples.
Abstract
As of February 2009, the US Consumer Product Safety Improvement Act, Section 108, mandated that all manufacturers of children’s toys analyze their products for Phthalate Esters. The method to be used is in accordance with the US Consumer Product Safety Commission (CPSC). In this study, six phthalate esters in children's toys were measured using the GCMS-QP2010 Ultra. The simultaneous Scan/SIM data acquisition technique was utilized, with the SIM data used for quantitation. The data showed excellent calibration curve linearity and repeatability. In two of the toy samples, unregulated plasticizers were identified by scan data, illustrating the efficiency of simultaneous Scan/SIM measurement.
Keywords: GC-MS, phthalate esters, toys, CPSC method, Scan/SIM
C146-E152
Yuki Sakamoto, Katsuhiro Nakagawa, Haruhiko Miyagawa
GC/MS Technica l Report No.4
Analysis of Phthalate Esters in Children's Toys Using GC-MS
Download