mulitmodal planning branch - codot.gov · (cmaq), transportation alternatives program (tap), and...
TRANSCRIPT

4201 E. Arkansas Ave., Room 262, Denver, CO 80222-3400 P 303.757.9525 F 303.757.9656 www.coloradodot.Info
Purpose: This memo summarizes the options for RPP fund distribution including the STAC recommendation from March for this program. Action Requested: Recommendation for allocation formula for RPP to be presented to TC for action in May. Background: Both STAC and the TC have discussed RPP at meetings over the past several months. A number of options have been considered and data to support various factors has been shared with both STAC and the TC. At the STAC meeting in March the options included in Attachment A were considered. STAC reviewed the February staff recommendation of 50% population/35% lane miles/15% truck VMT and after lengthy discussion reached a compromise recommendation of 20% population/25% VMT/40% lane miles/15% truck VMT. A motion was passed unanimously in favor of this option. Details: STAC originally recommended 45% VMT/40% lane miles/ 15% truck VMT. The 45/40/15 formula is a historic formula developed in the mid 1990s that was used to allocate several programs, including RPP, for a number of years. At the time of its development, the 45/40/15 formula was thought to represent a “fair” allocation between different parts of the state. STAC recommended the 45/40/15 formula based on a general sentiment that it remained a “fair” allocation. Some members, however, expressed a desire to alter the formula should the RPP budget increase beyond the $10 million proposed at the time. Staff continued to work on formula alternatives and, based on input from Commissioners as to what might constitute an appropriate balance, developed the staff recommendation. The staff recommendation takes into account the entire state highway system, the importance of freight corridors, and the synergy between populaton and travel demand The staff recommendation was presented to STAC in February. At the March STAC meeting, the STAC reached a compromise recommendation. The compromise recommendation is based on the 45/40/15 formula but adds population to the formula by splitting the 45% VMT into 20% population and 25% VMT.
Mulitmodal Planning Branch 4201 E. Arkansas Ave. Denver, CO 80222-3400
TO: Transportation Commission FROM: Debra Perkins-Smith, Director, Division of Transportation Development DATE: April 16, 2014 RE: RPP workshop
04 RPP and FASTER Safety Workshop: Page 1 of 19

4201 E. Arkansas Ave., Room 262, Denver, CO 80222-3400 P 303.757.9525 F 303.757.9656 www.coloradodot.Info
Attachment A to this memo is a table that includes formula options considered, the February staff recommendation, and the March STAC final recommendation. Also attached is a letter from Intermountain TPR related to the STAC final recommendation. Next Steps: At Commission this month you will be asked to approve the formulas for distribution of funds for Surface Transportation-Metro (STP-M), Congestion Mitigation and Air Quality Improvement Program (CMAQ), Transportation Alternatives Program (TAP), and Metropolitan Planning (Metro-PL). In May, TC will be requested to approve the formulas for distribution of RPP and FASTER Safety funds. CDOT regions will use these formulas in Program Distribution for the 2016-2040 Statewide Transportation Plan and for the 2016 STIP.
04 RPP and FASTER Safety Workshop: Page 2 of 19

Initial STACRecommendation
Nov. 201345/40/15
Final STACRecommendationMarch 201425/20/40/15
StaffRecommendation
Feb. 201450/35/15 50/50 30/30/40 70/30 60/40 100% VMT 45 (Pop)/40/15 40/40/20 40 (Pop)/40/20 25/25/35/15
VMT 45.0% 25.0% 30.0% 70.0% 60.0% 100.0% 40.0% 25.0%Lane Miles 40.0% 40.0% 35.0% 50.0% 40.0% 30.0% 40.0% 40.0% 40.0% 40.0% 35.0%Truck VMT 15.0% 15.0% 15.0% 15.0% 20.0% 20.0% 15.0%Population 20.0% 50.0% 50.0% 30.0% 45.0% 40.0% 25.0%TOTAL 100.0% 100.0% 100.0% 100.0% 100.0% 100.0% 100.0% 100.0% 100.0% 100.0% 100.0% 100.0%
Region 1 31.8% 32.7% 35.5% 32.9% 34.9% 36.5% 33.6% 45.3% 33.8% 31.3% 33.0% 34.4%Region 2 18.4% 19.1% 19.9% 20.4% 19.1% 17.4% 18.0% 15.5% 20.0% 18.5% 19.9% 19.0%Region 3 17.0% 16.1% 14.3% 15.2% 15.4% 16.1% 16.8% 13.8% 14.9% 17.1% 15.2% 15.5%Region 4 23.9% 23.8% 23.2% 23.3% 22.6% 22.0% 22.8% 19.6% 23.7% 24.3% 24.1% 23.4%Region 5 8.8% 8.3% 7.1% 8.2% 8.0% 8.0% 8.8% 5.8% 7.6% 8.8% 7.8% 7.8%TOTAL 100.0% 100.0% 100.0% 100.0% 100.0% 100.0% 100.0% 100.0% 100.0% 100.0% 100.0% 100.0%
DRCOG MPO 33.7% 35.2% 39.1% 36.4% 38.1% 39.0% 35.8% 48.6% 37.1% 33.0% 36.0% 37.2%NFR MPO 4.4% 5.0% 6.0% 5.8% 5.5% 4.8% 4.6% 5.6% 5.8% 4.4% 37.8% 5.3%PPACG MPO 5.3% 6.3% 8.0% 7.5% 7.0% 5.9% 5.5% 7.3% 7.6% 5.3% 5.6% 6.8%GV MPO 1.2% 1.5% 1.9% 1.8% 1.6% 1.3% 1.2% 1.3% 1.8% 1.2% 7.3% 1.6%PACOG MPO 1.2% 1.5% 1.9% 1.9% 1.7% 1.3% 1.3% 1.5% 1.8% 1.2% 1.7% 1.6%
Formula Factors and Weighting*
Formula %s Regions
Formula %s MPOs**
Recommendations Additional Scenarios
Estimates of Portion to MPOs (No direct allocation to MPOs)
*2013 VMT, Lane Miles, and Truck VMT on the State Highway System only. 2010 US Census for population.
RPP Formula Distribution Scenarios4/16/2014
**Historically, RPP has not been suballocated. Regions independently developed targets for the allocation of funds to TPRs or MPOs within the Region. RPP alloction calculations based on formulas and MPO boundaries.
Form
ulaFactors
Region
sMPO
s
RPP- Attachment A
04 RPP and FASTER Safety Workshop: Page 3 of 19

04 RPP and FASTER Safety Workshop: Page 4 of 19
04 RPP and FASTER Safety Workshop: Page 5 of 19

4201 E. Arkansas Ave., Room 262, Denver, CO 80222-3400 P 303.757.9525 F 303.757.9656 www.coloradodot.Info
Purpose: This memo summarizes the presentation for the FASTER Safety mitigation program. Action Requested: Transportation Commission input on the options for FASTER safety mitigation program administration and distribution of funds. Background: FASTER Safety is currently allocated to the Regions for a total of $87M. FASTER Safety funds are for construction, reconstruction or maintenance needed to enhance safety of a state highway. Beginning in FY 15, $40 million of FASTER safety funds will be allocated to asset management programs that directly support safety. The remaining funds will support the FASTER safety mitigation program. The FASTER Safety Program was recently examined by the CDOT Audit Division. The audit report found that CDOT is in compliance with requirements established by the legislature for the program, but that there were areas for improvement including: timely reports to management on funds and expenditures; better link of expenditures to safety improvement metrics; and a consistent project selection process. One recommendation from the FASTER Audit states, “The Director of the Division of Transportation Development and the Chief Engineer should present to the Transportation Commission alternatives to the current allocation method of FASTER safety funds in order to ensure the most critical safety projects are addressed.” A core staff team has developed options for the FASTER safety mitigation program for discussion at this workshop. Additionally, this interdisciplinary team has developed consistent safety metrics for project selection and evaluation. A consistent statewide system for tracking and reporting of project results will also be developed. The FASTER Safety Program was reassessed to better define program goals, consistent project selection criteria, measurable metrics for evaluating projects, and an allocation that addresses the goals. Details: At the October 2013 Statewide Plan Committee meeting, Commissioners discussed the possible use of FASTER safety funds for asset management programs that have clear safety benefits. To increase accountability and transparency, staff proposal is to direct $40M of FASTER safety funds to asset management including bridge, tunnels, culverts, rockfall, and specific maintenance where projects can be prioritized using the Risk Based Asset Management Plan and for which safety benefits be demonstrated and reported. The remaining $47M would remain
Transportation Performance and Multimodal Planning Branch 4201 E. Arkansas Ave. Shumate Bldg. Denver, CO 80222-3400
TO: Transportation Commission FROM: Debra Perkins-Smith, Director, Division of Transportation Development DATE: April 16, 2014 RE: FASTER Safety Mitigation Program
04 RPP and FASTER Safety Workshop: Page 6 of 19

4201 E. Arkansas Ave., Room 262, Denver, CO 80222-3400 P 303.757.9525 F 303.757.9656 www.coloradodot.Info
in the FASTER Safety line item and be applied to the FASTER safety mitigation program. Three potential options for administration of those funds are:
1. Region Allocation 2. Statewide Pool with Region Planning Estimates 3. Statewide Pool for Statewide Program
The staff recommendation is program Option #2 - a Statewide Pool with Region Planning Estimates. Some reasons for this recommendation include:
• statewide pool allows holistic look at safety needs; • region planning estimates allow for multi-year planning parameter for projects; • includes flexibility to adjust region amounts with changing needs; • includes joint statewide/region project selection and consistency in evaluation; • region priorities and statewide safety benefit analysis are combined.
Attachment A is a table with options for distribution methods for FASTER safety funds. The staff recommendation is Option #4 which is based on the National Safety Council weighting for fatalities, injuries, and other crashes. This option uses data from a national safety organization, recognizes the much higher societal and economic cost of fatalities, and provides a reasonable distribution of funds to the regions. FASTER safety funds can be used to address both remedial measures at specific high accident locations and known safety needs, as well as proactive safety measures that help avoid or reduce the potential for future accident occurrence. For either approach, project selection would involve consistent statewide criteria and evaluation processes to identify the most critical needs and most effective safety improvement investments. Consistent statewide tracking and reporting will also be required. Next Steps: Commission direction on a preferred option for the FASTER safety mitigation program and TC adoption of program option and formula in May.
04 RPP and FASTER Safety Workshop: Page 7 of 19

FASTER Safety Mitigation ProgramDivision of Transportation Development
Division of Transportation System Management and Operations
RPP and FASTER Safety Workshop: Page 8 of 19

FASTER Safety Mitigation Program Goals
FASTER Safety Mitigation• Reduce Total Highway Crashes• Reduce Severity of highway crashes (fatality
and injury)
RPP and FASTER Safety Workshop: Page 9 of 19

Process Steps
1. Analyze Crash Data –identify locations for mitigation; develop Statewide “list”
2. Fund Allocation – data based method for assignment of funds3. Candidate Projects – Region develops mitigation projects based on
Statewide list and local knowledge4. Project Selection – use statewide criteria to select projects5. Implementation – Region implements projects6. Monitoring/Reporting – Statewide evaluation and documentation of
benefits achieved from projects
Analysis ImplementationProject Selection
Fund Allocation
Candidate Projects
Monitoring/Reporting
RPP and FASTER Safety Workshop: Page 10 of 19

Assumptions for all options1. All options would address FASTER safety goals2. Any allocation formula can be updated periodically (Plan/STIP cycle)3. Need to plan for at least 2 years of projects, maybe more, at a time4. Will have method to track and report results at statewide level5. Statewide crash mitigation/location list provided6. Use common criteria for selection of projects ( may have different
weighting by area in some options)7. Option needs to address both reactive and proactive projects
RPP and FASTER Safety Workshop: Page 11 of 19

Process Options
• Analyze Crash Data – Statewide crash data and identification of Statewide mitigation locations will be the same for all options.
• Implementation – at Region in all options• Evaluation - Occurs in all options and data will be compiled at the
statewide level.
Variations in Fund Allocation, Candidate Projects, and Project Selection steps.
• Fund Allocation – options for Region Allocation, Statewide pool with Region planning estimates, or Statewide pool only. All distribution methods would be data based.
• Candidate Projects – options for using Statewide location list and other locations identified by the Region, or Statewide location list only
• Project Selection – options for Region selection, Statewide/Region joint selection, or Statewide selection.
RPP and FASTER Safety Workshop: Page 12 of 19
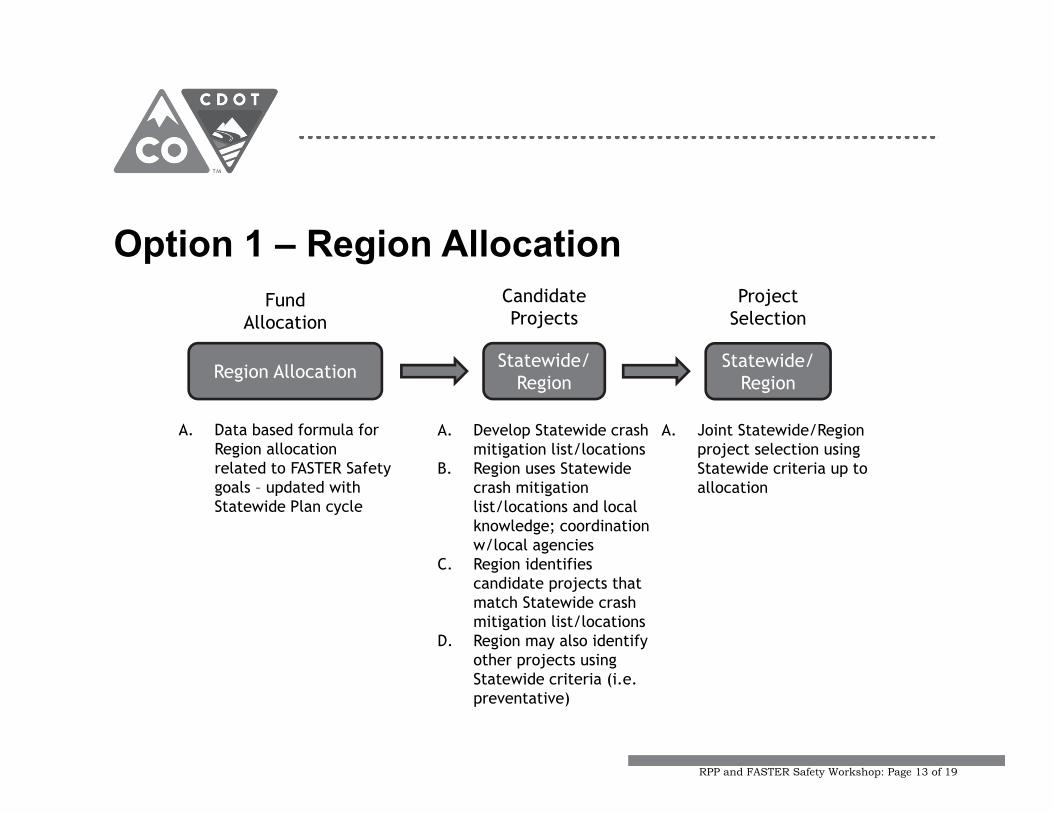
Option 1 – Region Allocation
Region Allocation
FundAllocation
A. Data based formula for Region allocation related to FASTER Safety goals – updated with Statewide Plan cycle
Statewide/Region
Candidate Projects
A. Develop Statewide crash mitigation list/locations
B. Region uses Statewide crash mitigation list/locations and local knowledge; coordination w/local agencies
C. Region identifies candidate projects that match Statewide crash mitigation list/locations
D. Region may also identify other projects using Statewide criteria (i.e. preventative)
Statewide/Region
Project Selection
A. Joint Statewide/Region project selection using Statewide criteria up to allocation
RPP and FASTER Safety Workshop: Page 13 of 19

Option 2 – Statewide Pool w/Region Planning Estimates
Statewide Pool w/Region Planning
Estimates
FundAllocation
A. Data based Region Planning Estimate related to FASTER Safety goals
B. Planning estimate for planning purposes, but is flexible
Statewide/Region
CandidateProjects
A. Develop Statewide crash mitigation list/locations
B. Region uses Statewide crash mitigation list/locations and local knowledge; coordination w/local agencies
C. Region identifies candidate projects that match Statewide crash mitigation list/locations
D. Region may also identify other projects using Statewide criteria (i.e. preventative)
Statewide/Region
Project Selection
A. Joint Statewide/Region project selection using Statewide criteria and considering Region priorities
RPP and FASTER Safety Workshop: Page 14 of 19

Option 3 – Statewide Pool for Statewide Program
A. Statewide project selection using Statewide criteria, and Region input
Statewide
Project Selection
A. Develop Statewide crash mitigation list/locations
B. Region uses the Statewide crash mitigation list/locations and local knowledge; coordination w/local agencies
C. Region identifies candidate projects that match the Statewide crash mitigation list/locations
Statewide/Region
CandidateProjects
A. All funds in Statewide pool
B. No Region division of funds
Statewide Pool
FundAllocation
RPP and FASTER Safety Workshop: Page 15 of 19

All Region projects will be evaluated using these criteria:
A. Reduce existing crashes
B. Reduce existing crash severity
C. Address existing system for safety weakness
D. Encourage cooperative safety effort with local agency
E. Enhance other highway safety features and/or functions
F. Provide proven safety measures for a systematic/preventative location
G. Improve pedestrian/bicycle safety
H. Existing project (leveraging funding opportunities with proposed safety project)
I. Benefit/Cost Analysis
Statewide FASTER Safety Mitigation Selection Criteria
RPP and FASTER Safety Workshop: Page 16 of 19
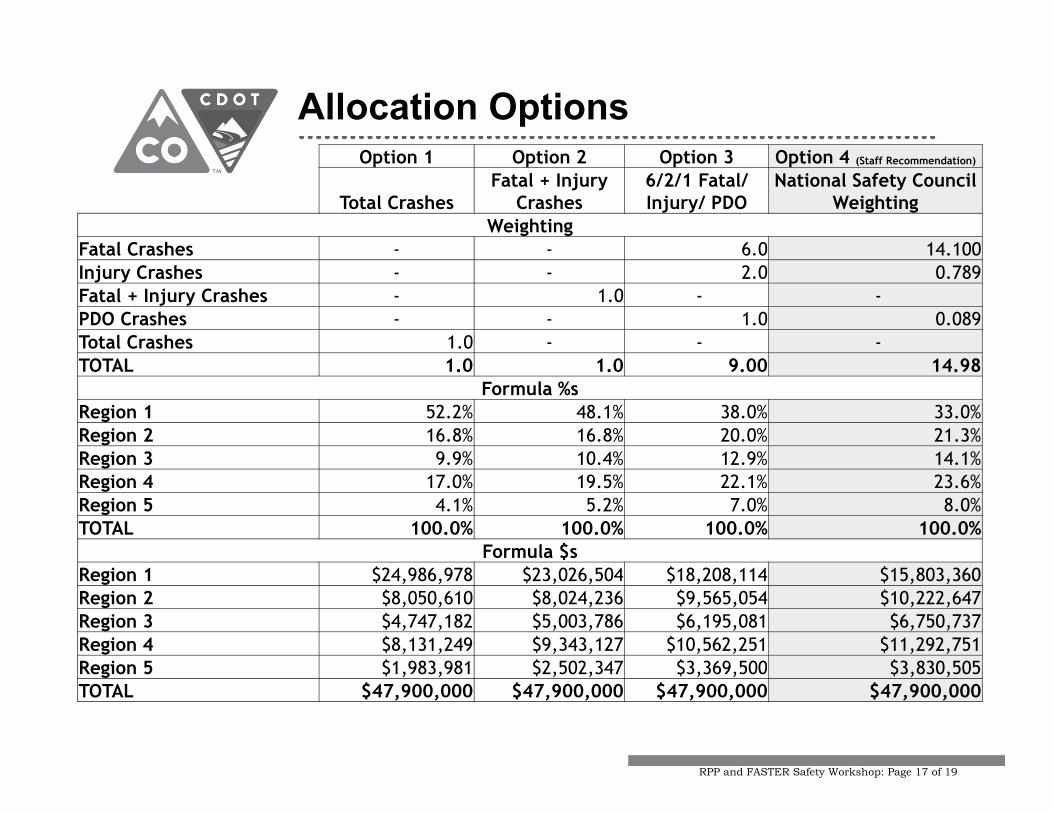
Allocation OptionsOption 1 Option 2 Option 3 Option 4 (Staff Recommendation)
Total CrashesFatal + Injury
Crashes6/2/1 Fatal/ Injury/ PDO
National Safety Council Weighting
WeightingFatal Crashes - - 6.0 14.100Injury Crashes - - 2.0 0.789Fatal + Injury Crashes - 1.0 - -PDO Crashes - - 1.0 0.089Total Crashes 1.0 - - -TOTAL 1.0 1.0 9.00 14.98
Formula %sRegion 1 52.2% 48.1% 38.0% 33.0%Region 2 16.8% 16.8% 20.0% 21.3%Region 3 9.9% 10.4% 12.9% 14.1%Region 4 17.0% 19.5% 22.1% 23.6%Region 5 4.1% 5.2% 7.0% 8.0%TOTAL 100.0% 100.0% 100.0% 100.0%
Formula $sRegion 1 $24,986,978 $23,026,504 $18,208,114 $15,803,360 Region 2 $8,050,610 $8,024,236 $9,565,054 $10,222,647 Region 3 $4,747,182 $5,003,786 $6,195,081 $6,750,737 Region 4 $8,131,249 $9,343,127 $10,562,251 $11,292,751 Region 5 $1,983,981 $2,502,347 $3,369,500 $3,830,505 TOTAL $47,900,000 $47,900,000 $47,900,000 $47,900,000
RPP and FASTER Safety Workshop: Page 17 of 19

Discussion of Options
RPP and FASTER Safety Workshop: Page 18 of 19

Option 1 Option 2 Option 3** Option 4***
Total CrashesFatal + Injury
Crashes6/2/1 Fatal/ Injury/ PDO
National Safety Council
Weighting
Fatal Crashes ‐ ‐ 6.00 14.100 Injury Crashes ‐ ‐ 2.00 0.789 Fatal + Injury Crashes ‐ 1.00 PDO Crashes ‐ ‐ 1.00 0.089 Total Crashes 1.00 ‐ TOTAL 1.00 1.00 9.00 14.98
Region 1 52.2% 48.1% 38.0% 33.0%Region 2 16.8% 16.8% 20.0% 21.3%Region 3 9.9% 10.4% 12.9% 14.1%Region 4 17.0% 19.5% 22.1% 23.6%Region 5 4.1% 5.2% 7.0% 8.0%TOTAL 100.0% 100.0% 100.0% 100.0%
Region 1 24,986,978$ 23,026,504$ 18,208,114$ 15,806,309$ Region 2 8,050,610$ 8,024,236$ 9,565,054$ 10,221,687$ Region 3 4,747,182$ 5,003,786$ 6,195,081$ 6,750,001$ Region 4 8,131,249$ 9,343,127$ 10,562,251$ 11,292,024$ Region 5 1,983,981$ 2,502,347$ 3,369,500$ 3,829,978$ TOTAL 47,900,000$ 47,900,000$ 47,900,000$ 47,900,000$
****Based on FY 15 Budget amounts.
FASTER Safety Mitigation ProgramAllocation Options
4/16/2014
Weighting
Formula %s
**Fatal crashes weighted 6X PDO crashes, Injury crashes weighted 2X PDO crashes.***Weighting based on National Safety Council Average Economic Cost per Death ($1,410,000), Injury ($78,900) or PDO ($8,900).
Formula $s****
*2008‐2012 on and off‐system crash data, CDOT Safety and Traffic Engineering Branch
RPP and FASTER Safety Workshop: Page 19 of 19