multi-criteria evaluation and geographic …...4 multi-criteria evaluation and geographic...
TRANSCRIPT

Multi-Criteria Evaluation and Geographic Information Systems for Land-Use Planning and Decision Making
Tania López-Marrero, Antonio González-Toro, Tamara Heartsill-Scalley, and L. Annie Hermansen-Báez
E C O S Y S T E M S E R V I C E S
EL YUNQUE
2 Multi-Criteria Evaluation and Geographic Information Systems for Land-Use Planning and Decision Making
IntroductionForest ecosystems are increasingly being influenced by human activity, including rapid expansion of urban land cover, which may alter forest processes, functions, and the services forests provide. Land-use planning is one of the policy instruments that may be used for the conservation of natural resources. Effective land-use planning includes the identification of geographical areas that are important for the support of ecosystem functions and services. Identification of these areas allows for planning uses and activities that sustain ecosystems and their services.
The availability and use of geographic digital data and decision-making tools have increased the development of geographic analyses that can assist in decision making and land-use planning. Multi-criteria evaluation (MCE) analysis (the implementation of decision-making rules to identify and enable the combination of many criteria, in the form of GIS layers, into a single map) and Geographic Information Systems (GIS) are two examples of tools that aid in the development of geographic data and maps for different purposes, such as conserving land for forestry or agricultural uses.
Urban expansion has been identified as one of the main factors affecting El Yunque National Forest (El Yunque) and its services (see “Participatory Listing, Ranking, and Scoring of Ecosystem Services and Drivers of Change”, another publication within the “El Yunque Ecosystem Services” series for more information). We used MCE analysis and GIS tools to develop a map that shows areas in which protection against urban expansion would help to ensure the continued provision of the forest’s ecosystem services. The map was developed for the area covered by the eight municipalities that have a portion of El Yunque within their boundaries. The map can assist land-use planners, forest managers, and natural resources specialists, among others, in making land-use decisions around El Yunque.
This guide provides step-by-step instructions of how this map was developed. It specifically provides GIS users working with natural resources and environmental topics with a tool to conduct geographic analysis and produce maps to assist in the management and planning of land use and natural resources. This guide also demonstrates the potential of the resulting map for land-use decision making, management, and planning.
MaterialsThe materials to be used for developing a map using MCE analysis will depend on whether the process will involve
the input of stakeholders or if it will be conducted solely by an analyst (as will be explained below). In our study, we received input from stakeholders (scientists and forest managers) knowledgeable about forest ecosystem services and the effects of urbanization on these services. For the first phase of the process (the listing and prioritizing of factors), we used a large piece of paper (36 x 24 inches) and markers. For the second phase (GIS analysis), we used the GIS software Idrisi and various GIS layers. The GIS layers represent each of the factors to be used in the GIS analysis. To conduct the analysis, the GIS analyst has to make sure that adequate GIS data are available, otherwise the analyst has to develop the GIS layers.
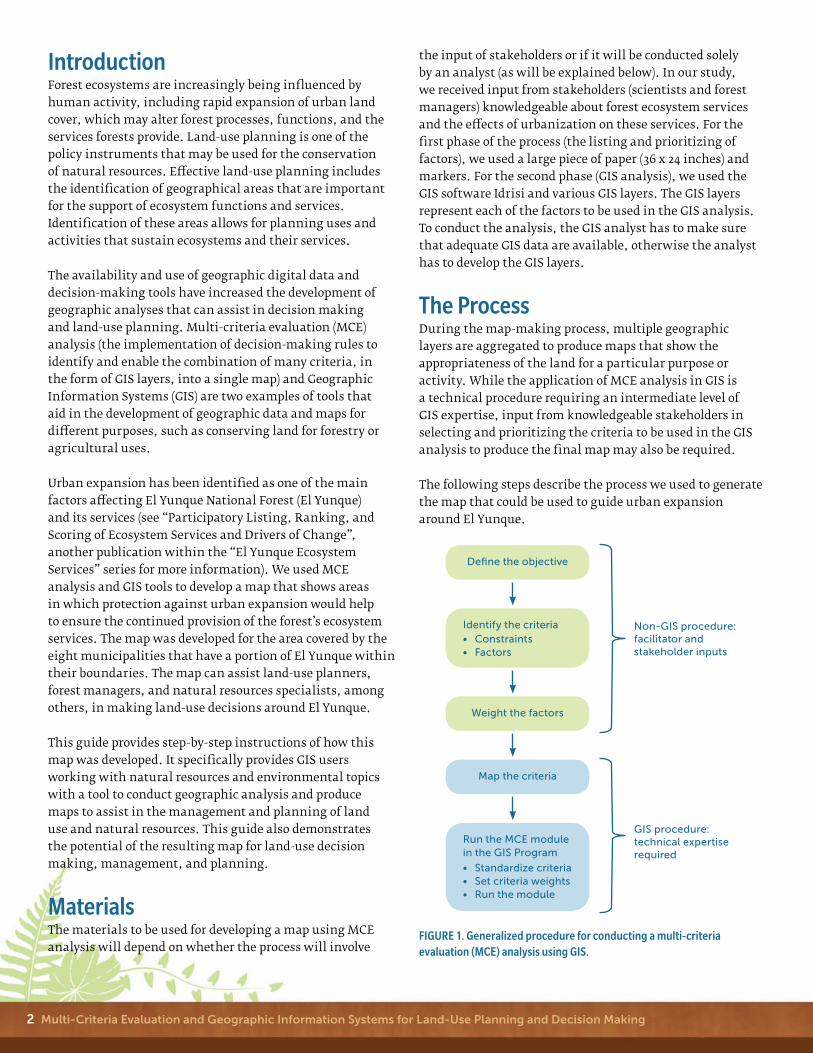
The ProcessDuring the map-making process, multiple geographic layers are aggregated to produce maps that show the appropriateness of the land for a particular purpose or activity. While the application of MCE analysis in GIS is a technical procedure requiring an intermediate level of GIS expertise, input from knowledgeable stakeholders in selecting and prioritizing the criteria to be used in the GIS analysis to produce the final map may also be required.
The following steps describe the process we used to generate the map that could be used to guide urban expansion around El Yunque.
Define the objective
Weight the factors
Map the criteria
Identify the criteria
Run the MCE modulein the GIS Program
Non-GIS procedure:facilitator and stakeholder inputs
GIS procedure:technical expertiserequired
FIgure 1. generalized procedure for conducting a multi-criteria evaluation (MCe) analysis using gIS.
• Constraints• Factors
• Standardize criteria• Set criteria weights• Run the module

Multi-Criteria Evaluation and Geographic Information Systems for Land-Use Planning and Decision Making 3
Stating the ObjectiveThe first step in conducting an MCE analysis is to define the objective of the analysis. In this project, the objective was to identify lands wherein protection from urban expansion would help to ensure the continued provision of El Yunque’s ecosystem services.
Identifying the Criteria and Assigning WeightThe next steps are to identify the criteria that will support the stated objective and determine which criteria are more important than others in supporting that objective. There are two types of criteria for MCE analysis: constraints and factors.
• Constraints are criteria that exclude areas from the analysis. In this project, the constraints were defined by an analyst. Since the objective of the MCE analysis was to identify areas to protect from urban expansion, the constraints in this case consisted of areas that were already covered by built-up land, and areas that have a formal conservation status or designation, such as nature reserves and state forests (since urban development is not permitted in protected areas).
• Factors are criteria that influence (enhance or detract) the viability of the objective under consideration. The selection of factors for an MCE analysis can be done in several ways. Factors can be selected based on existing literature, they can be defined by an analyst, or they can be defined by a group of experts. In this project, we used the third option in order to have the input of stakeholders with knowledge of forest ecosystem services and the urban effects on such services. A group of scientists and forest managers who work in El Yunque participated in focus groups to identify and prioritize the criteria that were subsequently used in the GIS analysis to produce the map.
The following steps were used for this phase of the analysis:
1. A facilitator explained the objective of the MCE analysis to the participants, which consisted in producing a map that would identify areas around El Yunque wherein protection from urban expansion would be beneficial in order to support the forest’s ecosystem services. This facilitator does not have to be a GIS specialist but must understand the overall process of the analysis.
2. The participants were asked to collectively make a list of the factors to be incorporated into a GIS analysis to produce the map.
3. The facilitator wrote all the factors on a large sheet of paper for the participants to review and add to if necessary.
4. The facilitator then drew a matrix on a large sheet of paper with all the factors listed on top (columns) and the same factors listed on the left side (rows) of that matrix. Such pairwise matrices provide a means of prioritizing lists of elements when a simple consensus is difficult to attain. The purpose of the matrix in this project was to assist in the factors’ prioritization process (next step).
5. The facilitator initiated completion of the matrix by asking participants to collectively compare the first factor listed on the left side of the matrix with the second factor listed on the top side and identify which one was more important in determining the stated objective. For each pairwise comparison, the facilitator gave time for the participants to discuss and decide each factor’s importance. After the participants decided which factor was the most important factor of the pair being compared, the facilitator wrote that factor in the intersecting cell. For example, when comparing the factors “distance from rivers” and “distance from forest,” if “distance from rivers” was considered more important, then this factor was written in the intersecting cell. The facilitator repeated this process until each combination of factors was compared and the matrix was filled. Since the matrix is symmetrical, only the upper half of the matrix needed to be filled in (Box 1).
6. The facilitator calculated a total score for each factor, based on the number of times the factor was identified as most important. The score for each factor was written in the last column of the matrix.
7. The facilitator used the calculated scores to derive proportional weights for each factor, the total adding up to one. First, the facilitator added up all the scores, and then the facilitator divided the score of the factor in question by the total score of all factors to determine the weight for that specific factor (Box 2). Each weight is a proxy of the relative importance each factor has in determining the objective of the analysis. The participants reviewed the final weights to see if they agreed with the results. These weights were subsequently used by the GIS analyst to conduct the analysis and develop the final map, as will be explained later in this guide.
Mapping the Criteria To create the map, a GIS specialist generated a GIS layer for each criterion, whether constraint or factor, identified in the previous steps. Factors are usually measured and represented geographically on a continuous scale, such as distance from rivers; nevertheless, they can also be
4 Multi-Criteria Evaluation and Geographic Information Systems for Land-Use Planning and Decision Making
categorical, such as type of land cover. Constraints are always Boolean layers (a GIS layer with only two categories, usually having values of ones and zeros), where areas to be excluded from the analysis must have a value of zero, and those to be included must have a value of one (Figure 2).
1. The GIS specialist created two GIS vector layers (shapefiles) representing the two constraints for the MCE analysis: one of the areas with urban land cover in the year 2010 and another one of the areas that already had a conservation status. GIS layers were created for the whole area covered by the eight municipalities that have a portion of El Yunque within their boundaries.
2. The GIS specialist created GIS vector and raster layers for all six factors identified by stakeholders: distance from rivers, distance from El Yunque’s boundaries, forest land cover in 2010, the northeast portion of the study area, landscape connectivity, and wetland land cover in 2010.
3. The GIS specialist converted all vector layers to raster format since the GIS software used to conduct the analysis (Idrisi) is a raster-based GIS.
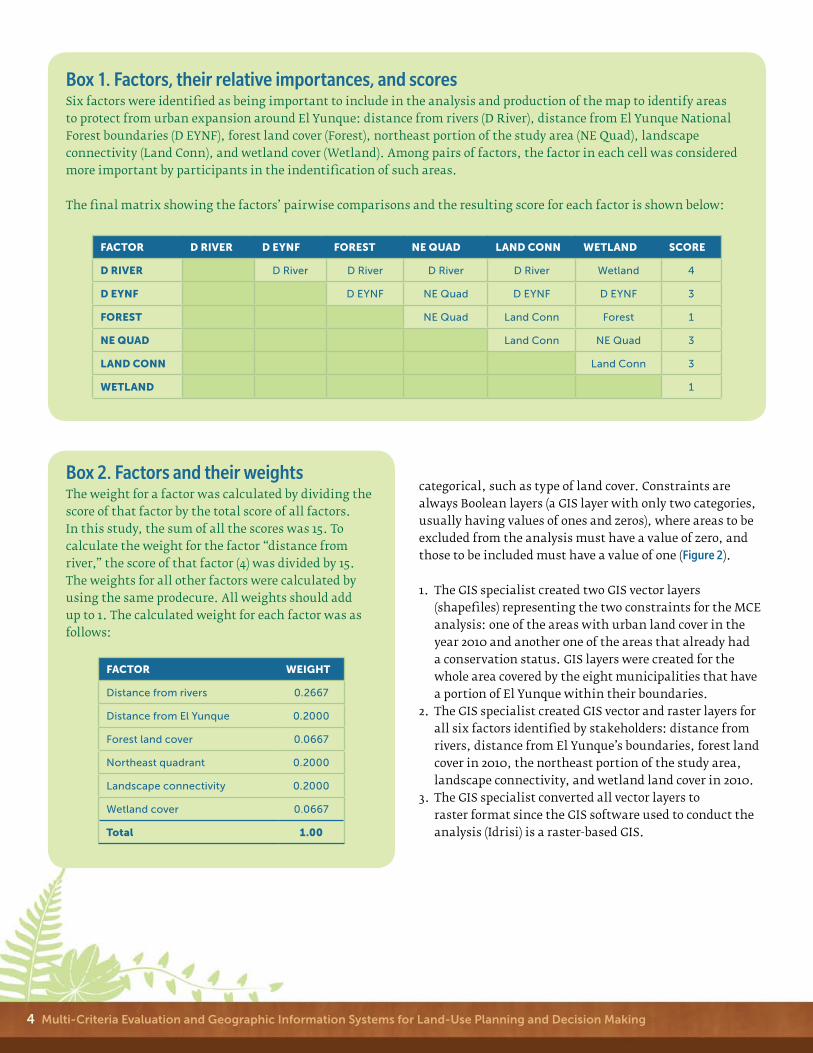
Box 1. Factors, their relative importances, and scoresSix factors were identified as being important to include in the analysis and production of the map to identify areas to protect from urban expansion around El Yunque: distance from rivers (D River), distance from El Yunque National Forest boundaries (D EYNF), forest land cover (Forest), northeast portion of the study area (NE Quad), landscape connectivity (Land Conn), and wetland cover (Wetland). Among pairs of factors, the factor in each cell was considered more important by participants in the indentification of such areas.
The final matrix showing the factors’ pairwise comparisons and the resulting score for each factor is shown below:
Box 2. Factors and their weightsThe weight for a factor was calculated by dividing the score of that factor by the total score of all factors. In this study, the sum of all the scores was 15. To calculate the weight for the factor “distance from river,” the score of that factor (4) was divided by 15. The weights for all other factors were calculated by using the same prodecure. All weights should add up to 1. The calculated weight for each factor was as follows:
Factor D river D eYNF Forest Ne QuaD LaND coNN WetLaND score
D river D River D River D River D River Wetland 4
D eYNF D EYNF NE Quad D EYNF D EYNF 3
Forest NE Quad Land Conn Forest 1
Ne QuaD Land Conn NE Quad 3
LaND coNN Land Conn 3
WetLaND 1
Factor Weight
Distance from rivers 0.2667
Distance from El Yunque 0.2000
Forest land cover 0.0667
Northeast quadrant 0.2000
Landscape connectivity 0.2000
Wetland cover 0.0667
total 1.00

Multi-Criteria Evaluation and Geographic Information Systems for Land-Use Planning and Decision Making 5
! ! ! !
!!
! ! ! !!
!!
!!
!!!
!!
!!
!!!!
!!!!!!!!!!!
!!
!!!!!!!!!!
!!
!!
! ! ! !
!!
!!
!!
! ! ! !
!!
! ! ! ! ! ! ! ! ! ! !
El Yunque boundary
El Yunque Proclamation
Municipal boundaries
!
!
!
!
km0 2.5 5
Protected areas
Urban areas
Protection againsturban expansion
More
Less
219
199
191181168
152142
129
23
255
218
198190180
167151
141
128
–
–
–––
––
–
–
FIgure 2B. A Boolean image showing developed and non-developed urban areas (red and black, respectively).
Applying the MCE Analysis into a GISThe final procedure to generate the map is to run the MCE module in the GIS software. We used the Idrisi GIS software to conduct the analysis and produce the map. Similar multi-criteria evaluation methods within a GIS environment can be carried out using other GIS software packages. For example, the GIS software ILWIS (Spatial Multiple Criteria Evaluation Tool) and ArcGIS (Weighted Overlay Analysis, LUCIS Model) have similar applications. The methodology described in this publication could also be adapted to be used in other GIS packages.
The following four steps are technical steps carried out by the GIS analyst following the Decision Support Wizard of Idrisi.
1. In the first two windows of the Decision Support Wizard, the GIS analyst specifies the objective of the analysis and indicates the file names for the GIS layers representing the constraints and factors.
2. Each factor is standardized by the program to a common measurement scale of 0 to 255, where a value of 0 indicates that the factor does not suit the analysis’s objective and a value of 255 indicates that it does perfectly.
3. The GIS analyst enters the weights already calculated for each factor (step 7 in the section “Identifying the Criteria and Assigning Weight”) using the option “User-defined Weight” in the Decision Wizard.
4. After all the parameters of steps 1 through 3 are entered in the Wizard, the program runs the MCE module to create the final map (Figure 3).
FIgure 2A. A continuous image of distance from rivers (areas closer to rivers are in darker green, areas farther away are in lighter green).
FIgure 2. examples of continuous and Boolean gIS layers.
FIgure 3. An output map from the multi-criteria evaluation (MCe) and gIS analysis around el Yunque. As the values increase (darker greens in the map), the more critical it becomes to protect the areas from urban expansion and to conserve the land or plan for uses that ensure the provision of the forest’s ecosystem services. For visualization purposes, the continuous data were classified into nine categories.

6 Multi-Criteria Evaluation and Geographic Information Systems for Land-Use Planning and Decision Making
Applications of MCe and gIS Analyses in Land-use Decision Making around el YunqueThe map resulting from the multi-criteria evaluation (MCE) and GIS analyses provides geographic information that can be used by decision makers, who must make many, and sometimes conflicting, land-use decisions. The resulting map can act as a tool in helping decision makers visualize choices and evaluate land-use alternatives. One benefit of this type of analysis is that the map produces continuous geographic data, which reflect relative importance, instead of mere “yes or no” binary data, which can limit alternatives and options (Figure 4). A continuous map offers users the advantage of evaluating geographic data and making decisions based on a range of relative importance values shown on the map. We should stress, however, that the map should not be used as a stand-alone tool for decision making. Instead, we recommend this mapping process as one among many tools available to aid in the decision-making process regarding land use. Box 3 shows a scenario of a potential application of the map produced in this study along with other geographic information a land-use planner can use for decision making.
Yunque’s functions and services. The map can also assist in identifying areas where forest managers may put into place programs or regulations to reduce or mitigate development patterns that can affect ecosystem services.
Finally, we should stress that the analyses and resulting map presented in this publication had the sole objective of identifying areas for land-use planning that can support El Yunque and its ecosystem services. This project’s objective and subsequent results are not intended to be used in the analysis and decision-making processes within other protected areas in the region, nor for areas that are currently under development pressures but that are considered important conservation areas (such as the Northeastern Ecological Corridor along the study area’s northeast coastline). To provide information and develop maps to support the conservation and comprehensive land-use management of other areas and their ecosystem services, the steps and procedures presented in this guide must be carried out first, specifically for the area of interest.
ConclusionUsing MCE and GIS helped us to develop a map showing areas where it is most critical to plan for land uses that can help ensure the continued provision of El Yunque’s
FIgure 4B. A continuous map showing areas supporting a certain purpose or activity (darker green areas are relatively more appropriate for the purpose or activity than lighter ones).
FIgure 4A. A binary map showing two categories: the specified purpose is allowed (green) or not (white).
FIgure 4. examples of binary and continuous maps that identify areas for a certain purpose or activity.
Box 3. Potential application of the mapA municipal planner is asked to evaluate a construction project in a parcel near El Yunque. The project’s proponent provides the planner with the geographic coordinates of the proposed project. The planner can make use of different geographic information to make a decision regarding the approval (or disapproval) for the project, taking into consideration whether the project will have an effect on El Yunque and its ecosystem services. For instance, the planner can analyze land-cover maps, maps that show critical habitats for endangered species, and the map produced in this study, among others. With those pieces of information, the land-use planner is better equipped to make an informed decision and to support his or her recommendations.
The map can also be used as a baseline to further identify, plan, and implement potential land uses in an area that can help ensure the continued provision of El Yunque’s ecosystem services. Areas with high values in the map, for instance, could be areas that would particularly benefit from protection from urban expansion and that may be critical to conserve or plan for other uses (for example, reforestation, sustainable agriculture) that support El
Multi-Criteria Evaluation and Geographic Information Systems for Land-Use Planning and Decision Making 7
ecosystem services, rather than allow urban expansion that has the potential to limit these same services. With the input of stakeholders, a number of geographic and environmental factors were identified for use in the generation of the map. In this study, data regarding distance from rivers, distance from the forest boundary, forest and wetland land-cover types, the northeastern portion of the study area, and landscape connectivity were important factors for identifying areas in need of protection against urban expansion, and were consequently used to generate the map. The resulting map can be used as a tool for aiding in the decision-making process regarding land-use planning and management around El Yunque.
MCE analysis and GIS provide important analytical tools for land-use planning and decision making. The use of these two practical applications allows the integration of a variety of geographic datasets to produce an output map for a specific purpose. Land uses for other purposes or for site selection for a particular activity can be determined using the tools presented in this guide. MCE analysis and GIS have been successfully applied in resource planning and management, including the demarcation of vegetative buffers, the identification of potential areas for forest plantation, the selection of the best lands for agricultural production, and the assessment of areas susceptible to landslides. While the resulting maps are site specific, the concepts and procedures are applicable elsewhere.
Suggested Readings
Application of Multi-Criteria evaluation Analysis in gISCastellanos-Abella, E.A.; Van Westen, C.J. 2008. Qualitative landslide susceptibility assessment by multicriteria analysis: a case study from San Antonio del Sur, Guantánamo, Cuba. Geomorphology. 94: 453–466.
Ceballos-Silva, A.; López-Blanco, J. 2003. Delineation of suitable areas for crops using a multi-criteria evaluation approach and land/use/cover mapping: a case study in central Mexico. Agricultural Systems. 77: 117–136.
Eastman, J.R. 2009. IDRISI Taiga: Guide to GIS and image processing. Manual version 16.02 (Chapter 13). Worcester, MA: Clark Labs, Clark University. 342 p.
Hossain, M.S.; Chowdhury, S.R.; Das, N.G. [and others]. 2009. Integration of GIS and multicriteria decision analysis for urban aquaculture development in Bangladesh. Landscape and Urban Planning. 90: 119–133.
Malczewski, J. 1999. GIS and multicriteria decision analysis. New York: John Wiley & Sons, Inc. 392 p.
Van der Merwe, J.H. 1997. GIS-aided evaluation and decision-making for regulating urban expansion: a South African case study. GeoJournal. 43: 135–151.
Van der Merwe, J.H.; Lohrentz, G. 2001. Demarcating coastal vegetation buffers with multicriteria evaluation and GIS at the Saldanha Bay, South Africa. Ambio. 30(2): 89–95.
Participatory Pairwise MatricesCatley, A.; Burns, J.; Abebe, D. [and others]. 2008. Pair-wise ranking and matrix scoring. In: Participatory impact assessment: a guide for practitioners. Boston, MA: Feinstein International Institute, Tufts University: 36–38. https://wikis.uit.tufts.edu/confluence/display/FIC/Participatory+Impact+Assessment. [Accessed on September 4, 2010.]
Kumar, S. 2002. PRA Relation Methods: Pair-wise ranking method. In: Methods for community participation: a complete guide for practitioners. London: Intermediate Technology Publications: 246–258.
Russell, T. 1997. Pair-wise ranking made easy. PLA Notes. 28: 25–26.
AcknowledgementsWe would like to acknowledge the people who contributed to the development of this project: Edward A. Macie (USFS State and Private Forestry), William Gould (USFS International Institute of Tropical Forestry), Jorge R. Ortiz-Zayas (UPR Institute of Tropical Ecosystem Studies), Carolyn Pabón (USFS El Yunque National Forest), and Pedro Ríos (USFS El Yunque National Forest).
This project was funded through the USFS Urban and Community Forestry Program.
We thank Nora Álvarez Berrios (University of Puerto Rico), Edgardo González (Centro para la Conservación del Paisaje), Carmen Guerrero (Iniciativa para un Desarrollo Sustentable), and Marianne Meyn (Misión Industrial de Puerto Rico) for reviewing this publication. Christine Sweeney is acknowledged for editing this publication. Raghu Consbruck (IFAS Communications, University of Florida) is acknowledged for the design and layout of this publication. Iván Vicéns (International Institute of Tropical Forestry) is acknowledged for his photos on the front cover.
Other publications in the “El Yunque Ecosystem Services” series• El Yunque Ecosystem Services: A Participatory Research
Approach• Land Cover within and around El Yunque National Forest• Expansion of Urban Land Cover around El Yunque
National Forest• Urbanization Trends and Zoning around El Yunque
National Forest• Landowner Incentives for Conservation around El Yunque
National Forest • Participatory Listing, Ranking, and Scoring Ecosystem
Services and Drivers of Change• Participatory Mapping of Land-Cover Change
To view these publications online visit www.interfacesouth.org/projects/el-yunque or www.interfacesouth.org/products/fact_sheets
For the Spanish version of this and other publications in the “El Yunque Ecosystem Services” series visitwww.interfacesouth.org/projects/el-yunque/?set_language=es or www.interfacesouth.org/products/fact_sheets/?set_language=es
How to cite this publicationLópez-Marrero, T.; González-Toro, A.; Heartsill-Scalley, T.; Hermansen-Báez, L.A. 2011. Multi-Criteria Evaluation and Geographic Information Systems for Land-Use Planning and Decision Making. [Guide]. Gainesville, FL: USDA Forest Service, Southern Research Station. 8 p.
For more informationFor more information or if you have questions, contact Annie Hermansen-Báez, 352-376-3271, [email protected]