multi-million ounce gold project located in nevadasolidusau.com/assets/docs/solidusgold_corporate...
TRANSCRIPT
September 2016
Northumberland Multi-Million Ounce Gold Project Located in Nevada

This presentation includes certain forward-looking statements and forward-looking information (together, “forward-looking statements”). All statements other than statements of historical fact included in this release, including, without limitation, statements regarding the acquisition of the Northumberland Project, the private placement announced on September 15, 2016 (the “Offering”), exploration and development plans and other future plans and objectives of SolidusGold Inc. (the “Company”) and potential mineralization on the Northumberland Project are forward-looking statements. There can be no assurance that such statements will prove to be accurate and actual results and future events may vary from those anticipated in such statements. Important risk factors that could cause actual results to differ materially from the Company's plans or expectations include failure to obtain TSX Venture Exchange acceptance of the acquisition of the Northumberland Project and the Offering (together, the “Transaction”), failure to remove conditions to completion of the Transaction, failure to raise sufficient funds on the proposed terms or at all and risks associated with mineral exploration, including the risk that actual results of exploration will be different from those expected by management and the risk that potential mineralization will not be upgraded or verified, and the other risks disclosed in this presentation. The forward-looking statements in this presentation were developed based on the assumptions and expectations of management, including that TSX Venture Exchange acceptance for the Transaction will be obtained, conditions will be satisfied, required fundraising will be completed, the other assumptions disclosed in this presentation and that the risks described above will not materialize. There can be no assurance that the Transaction will complete. The Company expressly disclaims any intention or obligation to update or revise any forward-looking statements whether as a result of new information, future events or otherwise, except as otherwise required by applicable securities legislation. This presentation does not constitute an offer to sell or the solicitation of an offer to buy, nor shall there be any sale of these securities, in any jurisdiction in which such offer, solicitation or sale would be unlawful prior to registration or qualification under the securities laws of such jurisdiction, including the United States. The securities referenced in this press release have not been and will not be registered under the United States Securities Act of 1933, as amended (the "U.S. Securities Act"), or any state securities laws and may not be offered or sold within the United States or to, or for the account or benefit of, a "U.S. person," as such term is defined in Regulation S under the U.S. Securities Act, unless an exemption from such registration requirements is available. A qualified person has not done sufficient work to classify the historical estimate reported in the ‘Technical Report on the Northumberland Project, Nye County, Nevadan USA: Resources Update 2008, Amended August 8, 2008’ (the “Northumberland Report”), prepared by Fronteer Gold Inc. (formerly Fronteer Development Group Inc.) as current mineral resources or mineral reserves and accordingly the Company is not treating it as a current estimate of mineral resources or reserves. However, the Company believes that the historical estimate is relevant and reliable, as it was prepared by a reputable mining company utilizing modern quality assurance program and quality control measures and drilling procedures. In order to upgrade or verify the historical estimate as current mineral resources the Company anticipates that it will need to perform confirmatory drilling, including twin holes and additional infill drilling, on both the oxide and sulfide portions of the mineralization. The historical resource uses the categories set out in sections 1.2 of National Instrument 43-101. There are no more recent estimates available to the Company. The historical estimate was not prepared by Newmont or Newmont Mining Corporation. Please refer to the key assumptions section of the SolidusGold news release dated September 15, 2016 for further details or the historical resource estimate disclosure on slide 31 of the Appendix. The presentation has been prepared by SolidusGold management and does not represent an offer or recommendation to buy or sell the securities of SolidusGold. Investors should always consult their investment advisors prior to making any investment decisions. Rick Van Nieuwenhuyse, Chairman of the Board and Interim Chief Executive Officer of the Company, is a Qualified Person for the purposes of National Instrument 43-101 and has reviewed and approved the information of a scientific and technical nature contained in this presentation. Mr. Van Nieuwenhuyse has reviewed, but has not verified, the historical resource report for the Northumberland Project. Cautionary Note to U.S. Readers Concerning Mineralization Estimates: The estimates of mineralization shown in this presentation have been prepared in accordance with the definition standards on mineral reserves of the Canadian Institute of Mining, Metallurgy and Petroleum referred to in Canadian National Instrument 43-101 Mineral Disclosure Standards (“NI 43-101”). The definitions of mineralization used in NI 43-101 differ from the definitions in U.S. Securities and Exchange Commission (“SEC”) Industry Guide 7. We advise U.S. readers that while these terms are recognized and required by Canadian regulations, these terms are not defined terms or the same as defined terms under SEC Industry Guide 7 and are normally not permitted to be used in reports and registration statements filed with the SEC. U.S. Readers are cautioned not to assume that any estimates of mineral reserves and resources shown in this presentation meet SEC Industry Guide 7 standards.
2
Forward Looking Statements

3
Northumberland Acquisition • SolidusGold Inc. to acquire a 100% interest in the Northumberland Gold Project in Nevada from
Newmont Mining Corp. for a cash purchase price of US$20M • Closing expected by end of November, 2016
• Historical resource estimate released by Fronteer in 2008* • Oxide: 538,000 oz Au @ 1.23 g/t Au (Indicated) • Sulfide: 1,721,000 oz Au @ 2.34 g/t Au (Indicated) + 775,000 oz Au @ 3.49 g/t Au (Inferred)
• US$17.5M spent to date at Northumberland over the past 8 years by Newmont and Fronteer • Significant additional drilling (~18,600 metres) has been completed since the initial resource
estimate; results yet to be included in an updated resource for Northumberland • Concurrent metallurgical work by Newmont has advanced understanding of recovery potential for
both oxide and sulfide mineralization • Fronteer was acquired by Newmont in 2011 for $2.3 billion, which included Fronteer’s Long Canyon and
Northumberland Projects • Analysts valued Northumberland at the time between ~$150-$300M • Northumberland was originally acquired by Fronteer through its acquisition of New West Gold in
Sept. 2007 for $181M • Newmont currently focused on ‘near-mine’ exploration and development; Northumberland does not
currently meet Newmont’s minimum scale threshold for production • Evaluation by the SolidusGold team recognizes significant exploration upside potential
* This resource is an historical estimate and a qualified person has not done sufficient work to classify the historical estimate as
current mineral resources or mineral reserves. As a result the historical estimate is not being treated as a current mineral resource.

4
Northumberland Overview
Extensive Land Package in Key Mining Jurisdiction
Large land package located in top ranked mining jurisdiction; core area of private land will facilitate permitting
Established infrastructure, road access, and workforce in the area Structurally aligned with Kinross’s Round Mountain operation, 30 miles to the SW
Significant Known Mineralization
Historic resource estimate by Fronteer reported multi-million ounce potential Mineralization remains open for expansion; additional target areas warrant follow-up Significant drill intercepts: FNU035 - 7.1g/t over 37.5m, FNU009 - 2.73g/t over 64.0m
Two-Pronged Project Development Plan
Initial focus on expanding open-pittable oxide mineralization and updating historic resource estimate
Secondary focus on exploring/expanding deeper underground sulfide resource potential Concurrently expand, refine and confirm metallurgical work for treatment of refractory sulfide
resources; Newmont retains ROFO to process sulfide mineralization from Northumberland
Scarcity Factor in a Rising Gold Market
Right neighbourhood, right geologic setting One of only a handful of remaining large-scale gold exploration assets in North America held by a
junior Strong valuation upside potential in relation to peers

5
Peer Scarcity
Source: SNL Financial, Haywood Securities Inc.
• Heightened M&A and few new discoveries have reduced the population of large-scale North American development projects (>3Moz, >0.5 g/t)
• Majority of remaining peers located in challenging climate and/or permitting jurisdictions
Project Stage Location StatusMel iadine Construction Nunavut Acquired by MajorLong Canyon Construction Nevada Acquired by MajorHai le Construction South Carol ina Acquired by IntermediateRainy River Construction Ontario Acquired by IntermediateBrucejack Construction Bri ti sh Columbia $2.5B Mkt Cap (Pretium)Hope Bay Construction Nunavut $1.4B Mkt Cap (TMAC)Blackwater Feas ibi l i ty Bri ti sh Columbia Acquired by IntermediateCoffee Feas ibi l i ty Yukon Acquired by MajorGoldrush Feas ibi l i ty Nevada Owned by MajorHardrock Feas ibi l i ty Ontario Acquired by IntermediateCote Feas ibi l i ty Ontario Acquired by MajorHammond Reef Feas ibi l i ty Ontario Acquired by MajorHorne 5 Feas ibi l i ty Quebec $150M Mkt Cap (Fa lco)Back River Feas ibi l i ty Nunavut $280M Mkt Cap (Sabina)Dubl in Gulch Feas ibi l i ty Yukon $320M Mkt Cap (Victoria)Castle Mounta in Feas ibi l i ty Cal i fornia $195M Mkt Cap (NewCastle)Stibni te Feas ibi l i ty Idaho $145M Mkt Cap (Midas)Springpole Feas ibi l i ty Ontario Recently AcquiredMagino Feas ibi l i ty Ontario Acquired by IntermediateUpper Beaver Feas ibi l i ty Ontario Acquired by MajorGoldlund Exploration Ontario Recently AcquiredCariboo Exploration Bri ti sh Columbia $215M Mkt Cap (Barkervi l le)Premier Exploration Bri ti sh Columbia $340M Mkt Cap (Ascot)Northumberland Exploration Nevada $60M Mkt Cap (SolidusGold Pro-Forma)
6
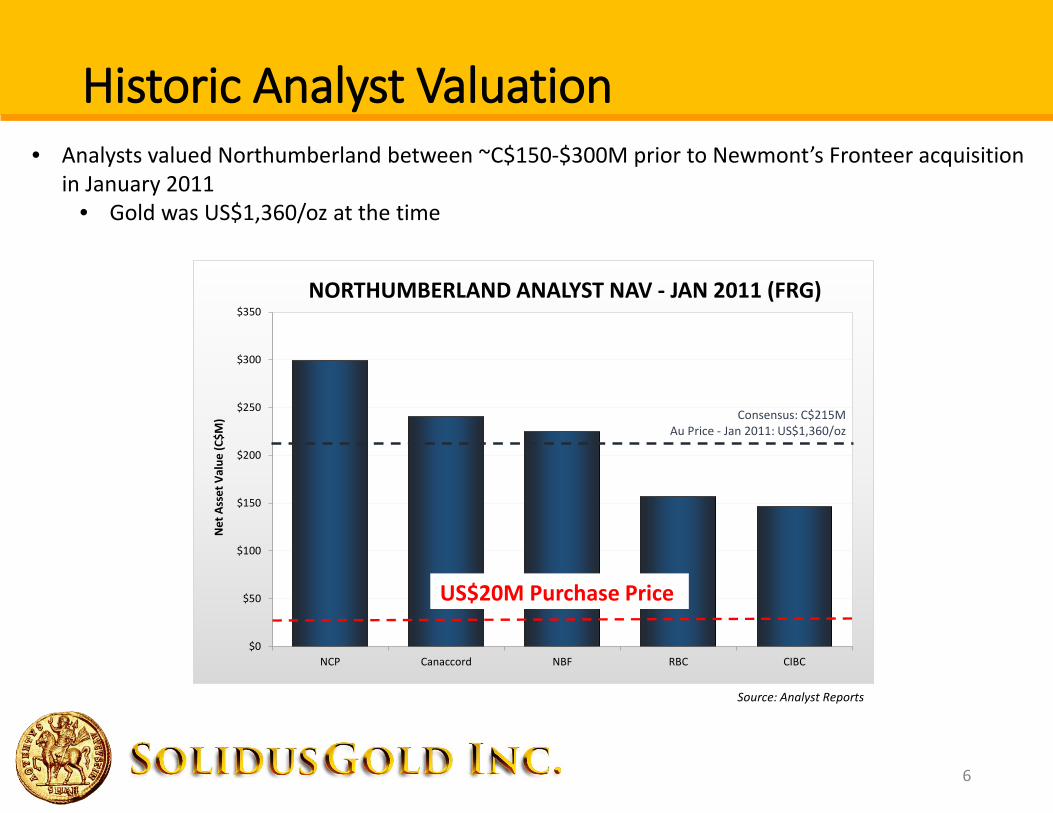
Historic Analyst Valuation • Analysts valued Northumberland between ~C$150-$300M prior to Newmont’s Fronteer acquisition
in January 2011 • Gold was US$1,360/oz at the time
Source: Analyst Reports
$0
$50
$100
$150
$200
$250
$300
$350
NCP Canaccord NBF RBC CIBC
Net
Ass
et V
alue
(C$M
)
NORTHUMBERLAND ANALYST NAV - JAN 2011 (FRG)
Consensus: C$215MAu Price - Jan 2011: US$1,360/oz
US$20M Purchase Price

$0
$25
$50
$75
$100
$125
$150
EV p
er o
z (C$
/oz)
NORTH AMERICAN GOLD DEVELOPERS
7
Key Market Comparables
$14/oz
$300
/oz
$175
/oz

Corporate Information
9
Management & Board
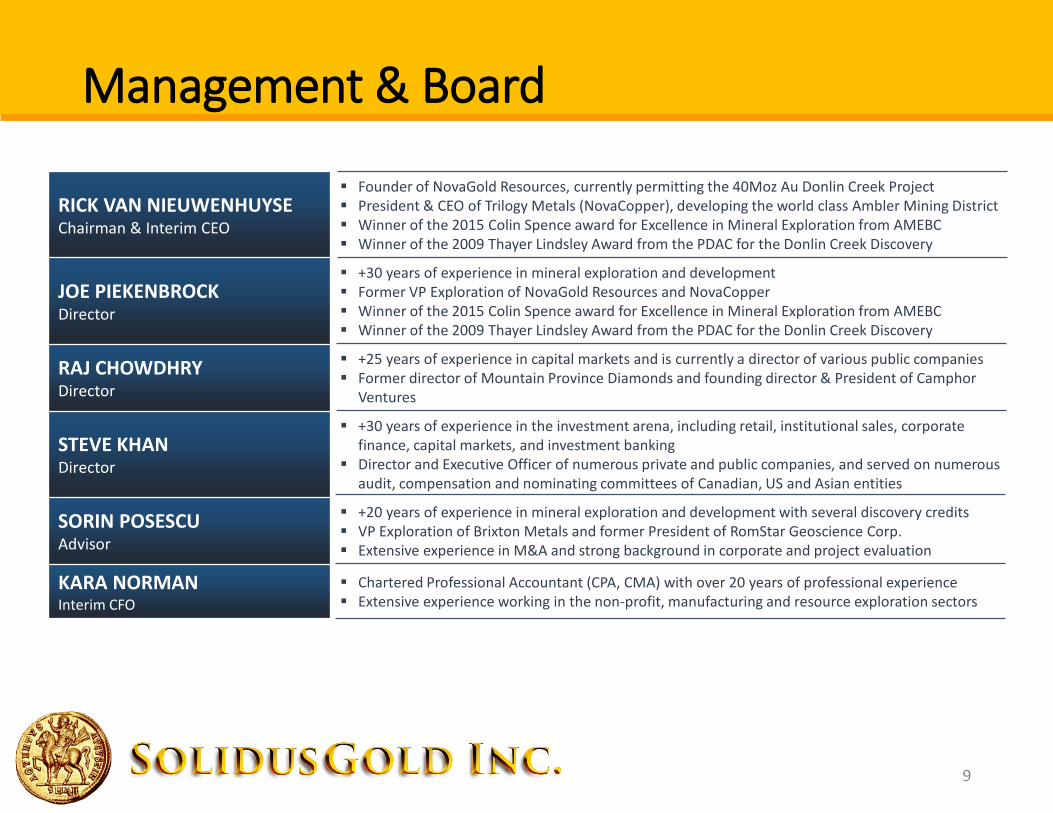
RICK VAN NIEUWENHUYSE Chairman & Interim CEO
Founder of NovaGold Resources, currently permitting the 40Moz Au Donlin Creek Project President & CEO of Trilogy Metals (NovaCopper), developing the world class Ambler Mining District Winner of the 2015 Colin Spence award for Excellence in Mineral Exploration from AMEBC Winner of the 2009 Thayer Lindsley Award from the PDAC for the Donlin Creek Discovery
JOE PIEKENBROCK Director
+30 years of experience in mineral exploration and development Former VP Exploration of NovaGold Resources and NovaCopper Winner of the 2015 Colin Spence award for Excellence in Mineral Exploration from AMEBC Winner of the 2009 Thayer Lindsley Award from the PDAC for the Donlin Creek Discovery
RAJ CHOWDHRY Director
+25 years of experience in capital markets and is currently a director of various public companies Former director of Mountain Province Diamonds and founding director & President of Camphor
Ventures
STEVE KHAN Director
+30 years of experience in the investment arena, including retail, institutional sales, corporate finance, capital markets, and investment banking
Director and Executive Officer of numerous private and public companies, and served on numerous audit, compensation and nominating committees of Canadian, US and Asian entities
SORIN POSESCU Advisor
+20 years of experience in mineral exploration and development with several discovery credits VP Exploration of Brixton Metals and former President of RomStar Geoscience Corp. Extensive experience in M&A and strong background in corporate and project evaluation
KARA NORMAN Interim CFO
Chartered Professional Accountant (CPA, CMA) with over 20 years of professional experience Extensive experience working in the non-profit, manufacturing and resource exploration sectors

10
Capital Structure
• SolidusGold to raise C$40M via subscription receipts at C$0.35
• Subscription receipts will automatically convert into common shares of SolidusGold upon closing of the Northumberland acquisition
• Financing expected to close mid-October
• Northumberland acquisition to
close no later than the end of November
* Excludes exercise of the Over-Allotment Option; Market Cap calculated at financing price ** Before transaction costs
PRO-FORMA CAPITALIZATION*
163,679,306 Shares Outstanding
Warrants
Market Cap
3,316,000
$57.3M
Cash (post-Acquisition) $14.5M**
Options 3,580,000

Northumberland Project

12
Nevada • Geopolitically stable mining jurisdiction • Largest gold producing state in the US
Northumberland Gold Project • Located 30 miles from Kinross’s Round Mountain
Mine (185koz Au production in H1/16) • Excellent infrastructure • Historical resources located on private land with no
underlying royalties • Only 7 other gold development projects in Nevada
>3Moz, >0.6 g/t Au • Barrick (4): Goldrush, Turquoise Ridge,
Goldstrike, Cortez • Newmont (1): Long Canyon • Kinross (1): Bald Mountain • Waterton (1): Ruby Hill
Gold Development in Nevada

13
Northumberland History Over $17.5M spent by Newmont and Fronteer during 2008 – 2016
Historic 2007
– 2008
2007 – 2008 • Northumberland acquired by Fronteer Gold through its acquisition of
New West Gold in Sept. 2007 for $181M • Newmont earn-in on Northumberland • US$9M in exploration incurred by Newmont prior to property exchange
agreement between Newmont and Fronteer, resulting in Fronteer owning 100% of Northumberland
• Historical resource estimate released by Fronteer in 2008
2008 – 2011 • US$15M spent by Fronteer at Northumberland on
exploration, development, and permitting activities • Fronteer had budgeted an additional US$11M in
2011 work programs prior to Newmont’s acquisition
• Fronteer completed ~14,800 metres of drilling
2011 • Newmont acquired 100% of Northumberland through
acquisition of Fronteer in April 2011
2011 – 2016 • Newmont completed ~3,800 metres of drilling • Completed metallurgical analyses
2009 -
2010
2011 -
2012
2013 -
2014
2015 -
2016
14
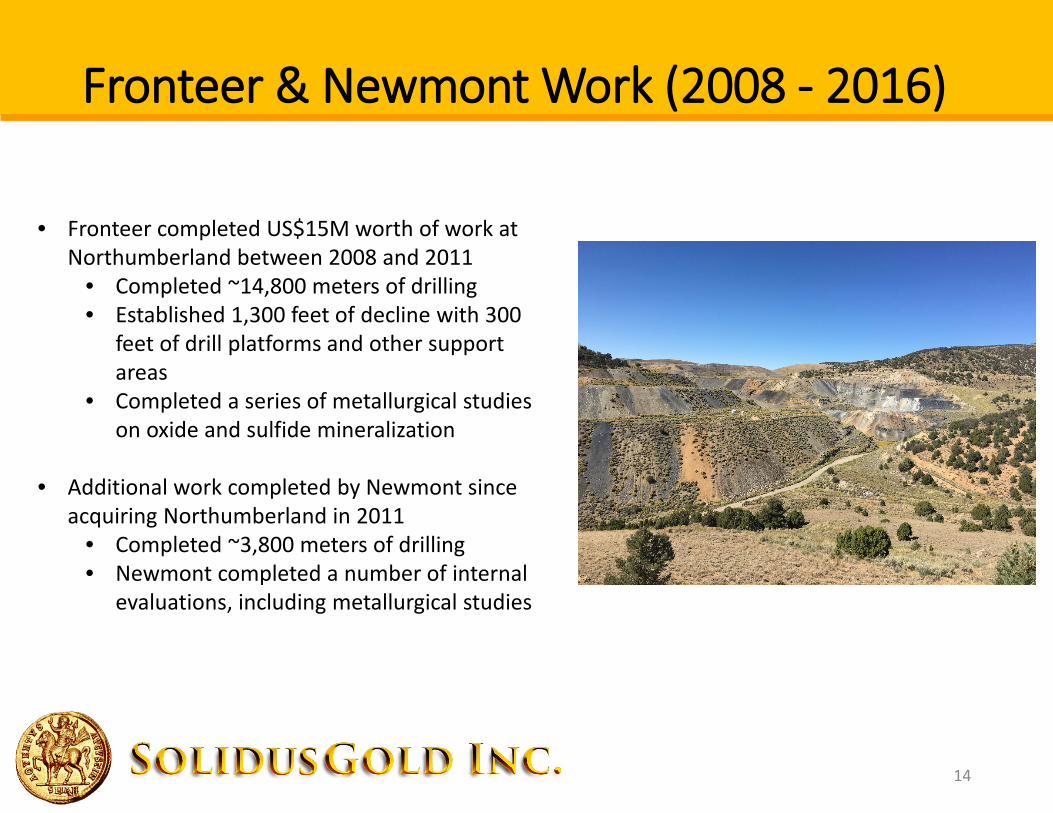
Fronteer & Newmont Work (2008 - 2016)
• Fronteer completed US$15M worth of work at Northumberland between 2008 and 2011
• Completed ~14,800 meters of drilling • Established 1,300 feet of decline with 300
feet of drill platforms and other support areas
• Completed a series of metallurgical studies on oxide and sulfide mineralization
• Additional work completed by Newmont since
acquiring Northumberland in 2011 • Completed ~3,800 meters of drilling • Newmont completed a number of internal
evaluations, including metallurgical studies

15
Historic Indicated Resource*: 2,259,000 oz Au @ 1.92 g/t Au OP Oxide - 538,000 oz Au @ 1.23 g/t Au OP Sulfide - 1,687,000 oz Au @ 2.32 g/t Au UG Sulfide - 34,000 oz Au @ 3.35 g/t Au Historic Inferred Resource*: 776,300 oz Au @ 3.49 g/t OP Oxide - 1,300 oz Au @ 2.38 g/t Au OP Sulfide - 111,000 oz Au @ 2.59 g/t Au UG Sulfide - 664,000 oz Au @ 3.70 g/t Au
Northumberland Historic Resource Outline
Source: Fronteer Development Group 43-101 Technical Report dated July 28, 2008 Amended August 8, 2008 See Appendix for complete resource statement
Historic Resources
* This resource is an historical estimate and a qualified person has not done sufficient work to classify the historical estimate as
current mineral resources or mineral reserves. As a result the historical estimate is not being treated as a current mineral
resource.

16
• >18,000 metres of drilling by Newmont and Fronteer completed after release of historic resource estimate in 2008 – including high-grade sulfide highlights:
• FNU-035 37.5m @7.10 g/t Au and 13.1m @ 10.62 g/t Au
• FNU-030 18.3m @ 9.52g/t Au including 12.9m@ 12.37 g/t Au
• FNU-043 16.9m @ 6.06 g/t Au including 7.6m @ 8.93 g/t Au
• NUG-05 33.5m @ 5.96 g/t Au
Northumberland Expansion

17
Geology
• Typical Carlin style mineralization
• Favourable host rocks (Silurian/Devonian Roberts Mountain)
• Favourable alteration (silification, jasperoidal, decalcification)
• Favourable structural setting (anticline, low angle thrusting, fault intersections, and sills)
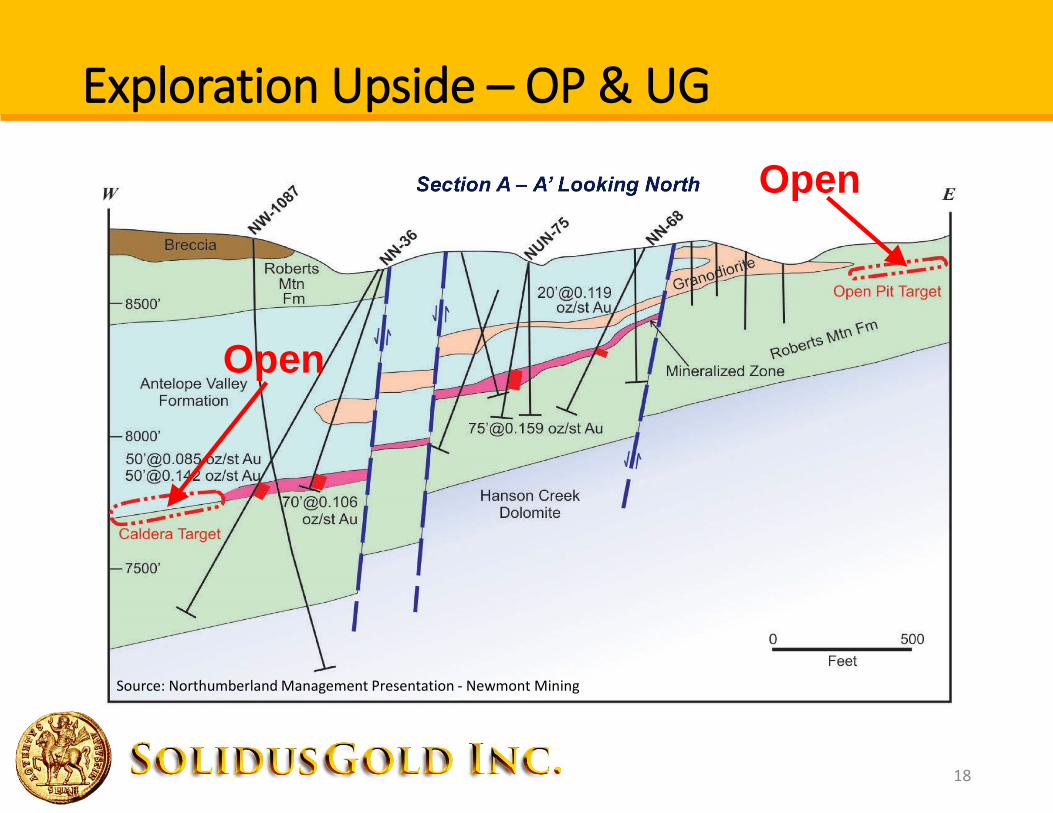
18
Open
Open
Source: Northumberland Management Presentation - Newmont Mining
Exploration Upside – OP & UG

19
Exploration Upside – New Targets
Ind.
* This resource is an historical estimate and a qualified person has not done sufficient work to classify the historical estimate as current mineral resources or
mineral reserves. As a result the historical estimate is not being treated as a current mineral resource.

20
Metallurgy • Initial focus on surface oxide leach potential; historic oxide production with demonstrated
success • Significant additional work completed by Newmont on gold extraction from refractory sulfides
since acquisition • Flotation to concentrate successfully demonstrated in Newmont testing • 3 operating autoclaves in the region (Newmont and Barrick); toll mill potential with
Newmont having a first call on any production from Northumberland
SULFIDE GRADE TYPE* FLOTATION
RECOVERY TO CONCENTRATE
ROASTER ALKALINE AUTOCLAVE
ACID AUTOCLAVE
High Grade Underground SSR 90% 90% 85% 94%
High Grade Underground CSR 90% 90% 70% 70%
Moderate Grade Surface SSR 90% 90% 85% 94%
Moderate Grade Surface CSR 90% 90% 70% 70%
OXIDE GRADE TYPE HEAP LEACH OXIDE MILL
Moderate Grade Surface Oxide 110% of AuCN, Max = 80% 120% AuCN, Max = 90%
* SSR = Sulfide Sulfur Refractory; CSR = Carbon Sulfur Refractory Source: Northumberland Management Presentation – Newmont

21
• Located in Nye County, approximately 96 miles from the town of Tonopah by road on State Highway 376
• Broad land package comprised of over 3,885 acres of private patented mining claims; total controlled ground is over 24,000 acres
• Lower site is 30 miles from Kinross’s Round Mountain Mine
• In-state operating autoclaves:
• Gold Quarry (Newmont) • Twin Creeks (Newmont) • Goldstrike (Barrick)
Northumberland Location
Northumberland
Gold Quarry
Twin Creeks
Goldstrike

22
Existing Infrastructure
• Significant infrastructure at site: • Road access via 22 mile gravel road • Kinross producing 30 miles away • Two open pits / 5 heap leach pads • Secured portal that accesses 1,350 ft of
decline with 300 ft of drill platforms and other support areas
• Various vehicles, generators, buildings etc.

23
Permitting
• Historical resources are located on private land
• Private land results in easier permitting process, less claim fees and lower landholding costs
• Opportunity to fast track permitting
• Existing Newmont exploration permits on private and USFS lands are designed and bonded for future surface disturbance
• Solidus will engage with the regulatory agencies and update the existing exploration permits if necessary

24
12 Month Plan & Budget
• Review drilling database, geological model and update exploration permits if necessary
• Replacement of surety arrangements • Explore and expand the open-pit oxide and
underground sulfide mineralization • Drill confirmatory holes to validate previous
drill results • Drill test the oxide and sulfide exploration
upside • Initiate an updated resource estimate to
include drilling done by Fronteer, Newmont and SolidusGold
• Advance metallurgical understanding of the sulfide and transitional mineralization; initiate internal scoping level studies
FINANCING – USE OF PROCEEDS*
C$26M (US$20M)
Northumberland acquisition
Project Review
Phase 1 + 2 Drilling
C$0.75M
C$8M
Metallurgy C$0.75M
Working Capital C$2.5M
Total Financing C$40M
Est. Bond Replacement C$2M
* Excludes exercise of the Over-Allotment Option. In the event that the Over-Allotment Option is exercised, in part or in full, any additional
proceeds will be added as working capital.

25
• Multi-million ounce gold asset with significant
upside potential
• Near-term focus on developing oxide resources; longer-term focus on continued expansion of the larger underground sulfide portions of the deposit
• Located in a world class, mining friendly jurisdiction – Nevada USA
• Strong management team and board with track record of major discoveries and project development
• Rising gold price environment combined with unique asset opportunity
Why Invest in SolidusGold?

26
Contact Details
SolidusGold Inc. 10th Floor, 595 Howe Street
Vancouver BC, V6C 2T5
Email: [email protected]
www.solidusau.com

Appendix

28
Historic Resource Estimation
INDICATED
Resource Type Cut-off Tonnes
Gold Silver AuEq* Au g/t Au opt g/t opt oz g/t opt oz oz
Open Pit Oxide 0.3 0.01 13,627,000 1.23 0.036 538,000 7.31 0.213 3,202,000 602,000 Open Pit Sulfide 1.0 0.03 22,575,000 2.32 0.068 1,687,000 8.01 0.234 5,815,000 1,803,000 Underground 2.5 0.07 316,000 3.35 0.098 34,000 4.43 0.129 45,000 35,000 TOTAL 36,518,000 1.92 0.06 2,259,000 7.72 0.23 9,062,000 2,440,000
INFERRED
Resource Type Cut-off Tonnes
Gold Silver AuEq* Au g/t Au opt g/t opt oz g/t opt oz oz
Open Pit Oxide 0.3 0.01 17,000 2.38 0.069 1,300 10.98 0.320 6,000 1,400 Open Pit Sulfide 1.0 0.03 1,335,000 2.59 0.075 111,000 7.69 0.224 330,000 118,000 Underground 2.5 0.07 5,574,000 3.70 0.108 664,000 5.95 0.174 1,067,000 685,000 TOTAL 6,926,000 3.49 0.10 776,300 6.30 0.18 1,403,000 804,400
Source: Fronteer Development Group 43-101 Technical Report dated July 28, 2008 and amended August 8, 2008 * AuEq calculated at an Au:Ag ratio of 50:1, and assumes 100% recovery of both metals
Note: This resource is an historical estimate and a qualified person has not done sufficient work to classify the historical estimate as current mineral resources or mineral reserves. As a result the historical estimate is not being treated as a current mineral resource.
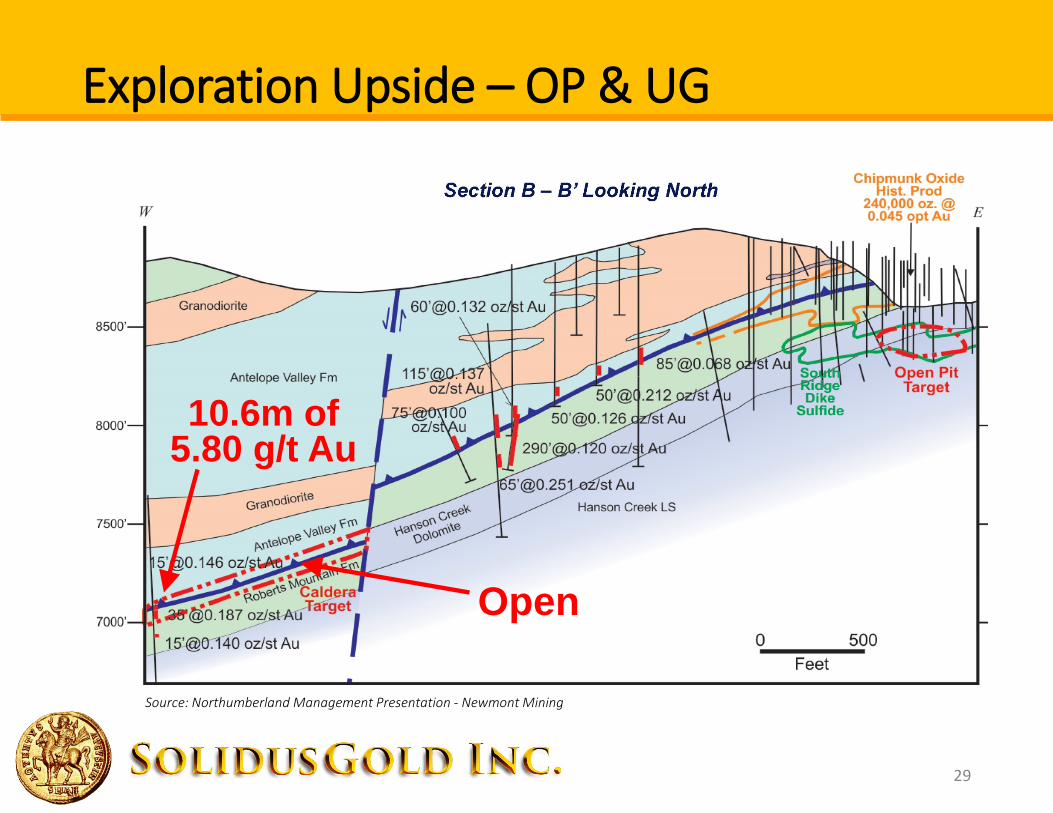
29
10.6m of 5.80 g/t Au
Open
Source: Northumberland Management Presentation - Newmont Mining
Exploration Upside – OP & UG

30
Exploration Upside – New Targets

The following disclosure is sourced directly from the Northumberland Report. Please see the Northumberland Report for the referenced tables and additional information. Northumberland Report - Key assumptions, parameters and methods used to prepare the historical resource estimate: Resource Classification Gold resources were classified on the basis of: (i) geological confidence, (ii) the average distance of the model blocks to composite samples used in the estimate, and (ii) the minimum number of composites used to estimate the block grades (Table 17.16). The average distances are those measured in the unwrinkled block model, and correspond to approximately ¼ the variogram range for Measured, ½ the range for Indicated and the full range for inferred. In all cases the classified blocks lie at least partially within a defined mineral zone. In cases where a block was coded to both high and low grade domains, the classification parameters for the highest tonnage domain in the block were used. No silver resources are classified as Measured due to the lack of time spent studying the geology of its occurrence, the high silver CV's, and the generalized nature of the estimation. Silver was not modeled independently of the gold, so that only silver lying within the limits of the modeled gold zones was estimated. Significant additional silver lies outside of the gold zones and therefore was not estimated. This is far from an optimum method of estimating silver grades and tons, but it does serve to provide some insight into the magnitude of the silver mineralization associated directly with the gold. There is a good possibility that when estimated properly, the grades and tons will change. The Northumberland resource contains approximately 27 million tonnes at a grade of 1.77 g/t Au (0.05 opt), or approximately 1.5 million ounces Au, that was formerly assigned to the "Measured" category to reflect the high confidence levels in that portion of the resource. However, due to less rigorous sampling of the silver contained in these blocks, the silver grade estimates do not meet the requirements of a "Measured" classification and the combined gold-silver resource is here amended and re-classified as "Indicated". Fronteer is currently collecting the necessary information to upgrade the combined gold-silver resource to the "Measured" category. The gold resources are tabulated using three gold-grade cut-offs that are applied to the block model on the basis of reasonably expected mining methods, metallurgical characteristics, and comparisons with similar mining operations in Nevada. A cut-off grade of 0.3 g/t Au (0.01 opt) is applied to blocks that can reasonably be considered to be available for potential open-pit extraction and heap-leach processing; all blocks above an elevation of 2,286 m (7,500 ft) with a cyanide extraction ratio of 50% or higher are deemed to be potentially mineable by open-pit methods and oxidized sufficiently to be amenable to heap leaching. The 2,286 m (7,500-ft) elevation limits blocks potentially available to open-pit mining. This elevation is supported by internal scoping-level economic studies undertaken by Jim Ashton, Senior Engineer, Fronteer. The 0.01 cut-off grade for oxide material is derived from comparable open-pit heap-leach operations in Nevada. Two cut-off grades are used for sulfide material, which will likely require oxidation prior to cyanide leaching. The sulfide material is identified by cyanide extraction ratios less than 50%. Sulfide blocks that lie above 2,286 m (7,500 ft) can reasonably be considered available for potential open-pit extraction and are compiled using a cut-off grade of 1.0 g/t Au (0.03 opt). This cut-off was chosen with consideration given to the Fronteer internal economic analyses mentioned above. Blocks lying below 2,286 m (7,500 ft) will likely require more costly underground mining methods and are compiled using a cut-off grade of 2.5 g/t Au (0.07 opt). The gold grades for each block represent the weighted average of the grades estimated for each of the mineral domains included in the block; they are not diluted to full blocks but rather to the mineralized zone only. Similarly, the tons of a block are derived from that portion of the block below surface topography and within the gold mineral domains. The silver resources are compiled from all gold resource blocks based on the gold cut-off grades discussed above; no silver cut-off is applied. The Indicated and Inferred gold and silver resources are summarized in Table 17.17. The gold resources at additional cut-offs are listed in Table 17.18. Other Mineralization In addition to the resources reported in Table 17.17, there are approximately 80 million tons grading 1.5 g/t Au (0.04 opt) at a cut-off of 0.3 g/t Au (0.01opt) [which] were estimated in the model but excluded from the resources. This additional gold mineralization is not currently considered to have reasonable prospects for economic extraction. The portion of this material that lies above 2,286 m (7,500 feet) warrants re-evaluation, if silver mineralization is properly modeled, which may lead to added value, or if positive changes are realized in such factors as commodity prices, operating-cost efficiencies, or metallurgical advances. In addition to the other gold mineralization described above, a significant amount of silver lies outside of the gold mineral domains and therefore was not estimated. Block Model A 3D block model was created using Gemcom software to capture all of the relevant data for resource estimation. Block codes were assigned for each grade envelope in each deposit along with the percentage of each domain falling within the block. Each block was assigned a gold and silver grade, a density, oxidation indicator, and an extraction ratio, according to the estimation process and modeling described below. Block model dimensions are given in Table 17.11. A separate unwrinkled block model was created for each layer at an arbitrary elevation below the actual deposit to capture the grade estimates. The unwrinkled block model dimensions were chosen to mimic the original block model in the X and Y directions, but with half the vertical thickness to account for the reduced uniform thickness of 100 ft. The unwrinkled block dimensions are: 25 feet in the X direction, 40 feet in the Y direction and 10 feet in the Z direction. Grade Estimation Gold grades were estimated using Ordinary Kriging in a single pass for each of the unwrinkled block model layers. Each block was assigned a high grade value and a low grade value using only those composites coded from each respective domain. The estimation parameters for the samples used in the grade estimates are given in Table 17.12. These parameters were derived from the variography for each separate domain and represent approximately 90% of the full range defined by each respective variogram model. Silver grades were estimated in a single pass by Inverse Distance Squared weighting in the unwrinkled block models, using the same search parameters as those used for gold. All grade estimates in the unwrinkled block models were back-transformed into real space and used to update the real space block model. A single back-transformed grade value was used to populate each block with a nearest neighbour interpolation. Density and Oxidation Modeling Specific gravity ("SG") measurements of mineralized Northumberland material were made by WSMC using the immersion method and the Marcy direct-reading pulp-density scale. For the immersion method, selected samples of core were cleaned with a brush and sprayed with a thin lacquer (Krylon) to prevent the samples from absorbing water during the test (Lanier, 1992b). Hip chain string was used to suspend the samples, which were weighed suspended in air and in tap water. Bulk specific gravity was then calculated using the following equation: SG = A / (A - B), where: A = weight in air; and B = weight in water. A comparison was made of 30 Marcy measurements with determinations on the same samples using the immersion method. The Marcy and immersion method measurements averaged 2.59 and 2.61, respectively (Lanier, 1997). In addition to the WSMC data, Core Laboratories, Inc. of Dallas, Texas determined the SG of 19 samples for Cyprus. A total of 295 SG, or tonnage factor ("TF"), measurements collected from mineralized Northumberland samples were used to determine densities. The SG results vary principally by lithology and oxidation. Since a lithologic model of Northumberland has not been created, average TF's were estimated for each deposit based on the percentage of each lithology in the deposit. Lithologic codes of all samples assigned to gold domains were used to estimate the relative amounts of mineralized dolostone, limestone, siltstone/silty limestone, jasperoid, hornfels, and intrusions in each deposit (Table 17.13). The average TF values for each of the lithologies were then weight-averaged to determine the 'unfactored' TF for each deposit. These values were increased by a 2% factor in oxidized rocks and 1% in unoxidized rocks in order to account for unmeasured void spaces, such as open fractures (Table 17.14). In order to assign the tonnage factors to the blocks, an oxidation model was estimated using the oxidized ("2"), mixed ("1"), and unoxidized ("0") codes in the drill sample database. Oxidation trends within the deposits mimic the stratigraphy. Drill hole geologic codes were therefore contoured to create a digital surface representing the base of the Roberts Mountains Formation. The relative vertical distance of the blocks to the Roberts Mountains surface were calculated and stored in the block model. The block model was then used to code the relative vertical distance to the 10-ft oxidation composites. These procedures normalize true elevations of the composites and blocks to the Roberts Mountains surface, effectively flattening the undulating stratigraphy for the purposes of the oxidation estimation. The oxide code was interpolated using the inverse-distance-cubed method that recognized the relative distances stored in the composites as the elevation values. Each geologic area was interpolated separately with unique search parameters. The search ellipses were highly anisotropic, with relatively long axes in the horizontal directions and short minor axes in the vertical direction in order to honor the stratigraphic control. The lengths of the major and semi-major axes of the search ellipses ranged from 550ft in geologic area 1 to 440ft in areas 4 and 5, while the minor axes used ranges of 35ft to 50ft. A minor amount of blocks were not estimated in the Zanzibar deposit. These blocks were set to zero (unoxidized). The oxide codes were interpolated to assign blocks oxidation codes to the first decimal place. All blocks greater than or equal to 1.5 were assigned oxidized tonnage factors, while the remaining blocks were assigned unoxidized tonnage factors. Metallurgical Modeling Portions of the Northumberland gold-silver mineralization are amenable to direct cyanidation, while other portions require metallurgical treatment that includes oxidation prior to cyanidation (see Section 16). Due to the significant difference in costs involved in the recovery of gold and silver from these two styles of mineralization, unique grade cut-offs are necessary for the purposes of resource reporting. A generalized metallurgical model was therefore developed to define both the mineralization that is amenable to direct cyanidation and the mineralization that requires oxidation prior to cyanidation. These types of mineralization were identified on the basis of gold cyanide extraction ratios, which are defined as the ratios of cyanide leach assays to original fire assays expressed in percent. The metallurgical modeling, therefore, has been completed solely for the purposes of tabulating the Mineral Resources at appropriate cut-offs. Additional work, including the possible development of a new metallurgical model, would need to be completed prior to taking these resources to reserves. Variography performed on gold cyanide extraction ratio data indicated maximum ranges of about 700 to 800ft in both global and directional variograms, with most of the relationship between samples accounted for at a range of 550ft. Cyanide extraction ratios were estimated by the inverse-distance-cubed ("ID3") method using the parameters in Table 17.15. Relative elevations of the 10-ft composites to the Roberts Mountains surface were used in a similar fashion as the oxidation estimation described above. Cyanide extraction ratios derived from gold assays of less than 0.005 oz Au/ton were not used in the composites, as these low assay values can lead to spuriously high cyanide extractions and otherwise rather meaningless ratios. Only cyanide extraction ratios within the mineral domains were composited. Approximately 90% of the blocks were estimated by the inverse-distance interpolation. The equation of a best-fit line derived from the relationship between cyanide extraction ratios and logged oxidation code was applied to the interpolated oxidation codes to calculate the cyanide extraction ratios for the unestimated blocks. The data used to derive the best-fit line were constrained to samples that: (1) have a minimum fire assay value of 0.01 oz Au/ton; (2) lie within the gold mineral domains; and (3) have a maximum extraction ratio of 115%. The minimum fire assay limit is imposed in order to remove many of the spurious extraction ratios well in excess of 100% and otherwise meaningless ratios, which are common at grades of less than 0.01 oz Au/ton. Only data lying within the mineral domains were used in the estimation. While the best fit line reflects the expected positive relationship between increasing oxidation and increasing extraction values, the correlation is not strong (correlation coefficient = 0.49). This is partially due to the subjectivity associated with various loggers assigning codes of 1, 2, and 3 in the description of oxidation state. The interpolated extraction ratios were capped at 100%.
31
Historical Resource Estimate Disclosure