multidisciplinary design exploration of wing shape for silent ... · one of the views of this...
TRANSCRIPT

25th AIAA Applied Aerodynamics Conference, 25–28 June 2007, Hyatt Regency Miami, Miami, Florida
Multidisciplinary Design Exploration of Wing Shape for SilentSupersonic Technology Demonstrator
Kazuhisa Chiba∗, Yoshikazu Makino†, and Takeshi Takatoya‡
Japan Aerospace Exploration Agency, Tokyo 182-8522, Japan
Multidisciplinary design exploration with multi objectives has been performed for thewing shape of a silent supersonic technology demonstrator among aerodynamics, structures,and boom noise. Aerodynamic evaluation was carried out by solving Euler equations oncomputational fluid dynamics, and composite structural evaluation was performed by usingNASTRAN for strength and vibration requirements on computational structural dynamics.The intensity of sonic boom was evaluated by a modified linear theory. The optimizationproblem had five objective functions as the minimizations of the pressure/friction drags andthe boom intensity at supersonic condition, and the composite structural weight as well asthe maximization of the lift at subsonic low speed condition. The three-dimensional wingshape defined by 58 design variables was optimized on particle swarm optimization andgenetic algorithm hybrid method. In the structural evaluation, the combination optimiza-tion of stacking sequences of laminated composites was performed for inboard and outboardwings with strength and vibration requirements. Consequently, 75 non-dominated solutionswere obtained. Moreover, data mining was performed to obtain the design knowledge fordeciding a compromise solution. The data mining revealed the knowledge in the designspace, such as the tradeoff information among the objective functions, and the correlationsbetween objective functions and design variables. A compromise solution was successfullydetermined by using the obtained design knowledge.
I. Introduction
Since the flight experiment of the non-powered supersonic experimental scaled airplane NEXST-1 wassucceeded in October 20051, the silent supersonic technology demonstrator (S3TD) then has been re-
searching and developing as a next step in Japan Aerospace Exploration Agency (JAXA)2. The initial 0thshape of S3TD was already designed to focus on low boom and low pressure drag. However, its shape hasinsufficient performace regarding lift at low speed. Therefore, the second shape with a primary purpose oflift-performance improvement is re-designed to keep low boom intensity(the first shape was for minor changeto re-design low-boom geometry). One of the views of this demonstrator is to design using multidisciplinarydesign optimization (MDO) system.
In the past multi-objective aerodynamic optimization for a supersonic transport (SST)3, the wing withlarge sweepback angle was generated to reduce the drag and boom intensity as well as to maintain the lift.However, its wing is not practically designed because of no consideration regarding structures. No matterhow an single disciplinary optimization is performed, there is insufficient knowledge to make use of a practicaldesign. That is, multidisciplinary exploration is needed to design and develop a practical aircraft.
As a multi-objective (MO) problem has tradeoffs as an optimum set (called as Pareto-optimal solutionsor non-dominated solutions), an MO optimization should be performed to identify such tradeoffs efficiently.MO evolutionary algorithms (MOEAs) were applied to MO optimizations to sample multiple non-dominatedsolutions because evolutionary algorithms (EAs) sought optimum solutions in parallel using a population ofdesign candidates. In this study, the hybrid method between MO particle swarm optimization (PSO) andadaptive range MOGA was applied to a large-scale and real-world problem to search both global and localoptimum solutions efficiently.
∗Project Researcher, Aviation Program Group. Member AIAA.†Senior Researcher, Aviation Program Group. Member AIAA.‡Senior Researcher, Aviation Program Group.Copyright c© 2007 by the American Institute of Aeronautics and Astronautics, Inc. All rights reserved.
1 of 19
American Institute of Aeronautics and Astronautics Paper 2007-4167

Moreover, the design knowledge is acquired from MO optimization result by performing data mining.Data mining is a role of the post-process for MO optimization, and essential for the solving of MO opti-mization. Although design optimization problems are important for engineering, the most important pointis the extraction of the knowledge in design space from optimization result. The result obtained by MOoptimization problem using EAs is not a sole solution but an optimum set. That is, as MO optimizationresult is insufficient information for practical design because designers need a conclusive shape. Therefore,data mining techniques can be applied to efficiently obtain fruitful design knowledge. As the combinationbetween the optimization and data mining is a sequence process, it is called as multidisciplinary designexploration (MDE) instead of MDO in the present study. Although the previous MDE was performed for atransonic regional jet aircraft4, this MDE system had two problems which the wing planform was fixed, andno composite material was considered. Its MDE was dominated by aerodynamics due to these problems.
The objective of the present study is to perform the practical MDE for the S3TD airplane, i.e., tooptimize the three-dimensional wing shape for the S3TD airplane using computational fluid dynamics (CFD)and computational structural dynamics (CSD) evaluation tools, on a PSO/GA hybrid method. Especially,wing planform is design to improve lift performance and also to restrain low boom performance. Moreover,the design knowledge for S3TD airplane is obtained by using data mining, a compromise solution is thendetermined through the designers’ discussion using the design knowledge.
II. Multidisciplinary Design Optimization
A. Objective Functions
The following five objective functions were defined. First three objective functions are for aerodynamics,fourth is for hoise, and last is for structures.
1. The minimization of the pressure drag at supersonic cruising condition: S ·CDp (Mach number of 1.6,altitude of 16km, and target CL of 0.132 for the 0th shape of S3TD. S · Csupersonic
L = const. S denotesthe one-sided wing reference area.
2. The minimization of the friction drag at supersonic condition: S · CDf.
3. The maximization of the lift at subsonic condition: S ·CL (Mach number of 0.2 and angle of attack of10.0deg).
4. The minimization of sonic boom intensity Iboom at supersonic condition. This objective function valuewas defined as |∆Pmax| + |∆Pmin| at the location with largest peak of sonic-boom signature acrossboom carpet.
5. The minimization of a composite structural weight Wc for wing using fiber angle of ply and a numberof ply with the fulfillment of the strength and vibration requirements.
B. Constraints
As the objective functions were defined to have tradeoff relations, no constraint for flight condition wasconsidered. The geometrical constraints were considered for wing shape definition. The ridge line betweenwing and fuselage should be extracted. Moreover, the chord length c should satisfy croot > ckink > ctip. Inaddition, the constraint of maximum thickness at each spanwise location is considered. When an individualcorresponds to a constraint, another individual is generated because the individual cannot take form as anairplane. This operation is run over until the provided population size is set.
C. Geometry Definition
The design variables were related to planform, airfoil shape, wing twist, and position relative to the fixedfuselage on the 0th shape. A wing planform with a kink was determined by seven design variables as shownin Fig. 1. Airfoil shapes were defined at the wing root, kink, and tip using thickness distributions andcamber lines. The thickness distributions were described by Bezier curves using nine control points with10 design variables, and linearly interpolated in the spanwise direction. The camber line distributions wereparameterized using Bezier curves with four control points with four design variables, and incorporated
2 of 19
American Institute of Aeronautics and Astronautics Paper 2007-4167

linearly in the spanwise direction. Wing twist was represented by using B-splines using six control pointswith six design variables. The twist position was 80% chordwise location so that the straight hinge line foraileron was secured. The position of the wing root relative to the fuselage was parameterized by z coordinateof the leading edge, angle of attack, and dihedral. The entire computational geometry was thus defined byusing 58 design variables summarized in Table 1. Although the S3TD has the components of fuselage, mainwing, engine, and tail wing, the wing-body configuration was considered shown in Fig 2. In the presentstudy, a robust surface mesh was automatically generated in the following steps; a) generation of the winggeometry, b) extraction of the intersection line between the body and wing, c) deletion of the wing geometrywhich is inside the body, and they are united, d) generation of the mesh point distributions along createdridges, and e) generation of unstructured surface mesh using advancing front method5,6.
Table 1. Detail of design variables.
serial number correspondent design variable1, 2 span length inboard, outboard3 - 5 chord length root, kink, tip6, 7 sweepback angle inboard, outboard8 z coordinate root leading edge9 angle of attack for attachment to fuselage10 dihedral angle
11 - 22 camber control points root, kink, tip23 - 52 thickness control points root, kink, tip53 - 58 twist control points
kink_lengthroot_length
span
_len
gth_
inne
r
sweepback_angle_inner
sweepback_angle_outer span
_len
gth_
oute
rtip_length
Figure 1. Wing planform definition using seven design variables.
D. Optimizer
A hybrid method between PSO7,8 and GA9,10 was employed. Recent optimization work often uses a responsesurface model(RSM) based on kriging surrogate model to restrain evaluation time11–13. However, when theproblem with many design variables is considered, the many initial sample points are needed to maintainthe accuracy of response surface14 (10 times number of design variables is generally needed for initial samplepoints). In the present study, RSM is not selected to avoid the problem of large evaluation time for initialsamples.
GAs have generally not for a capability to search local optima but for a faculty of global search. Onthe other hand, PSO is efficient to search for local optima because it deals with the coordinates of designvariables directly. The hybridization between them may produce both capabilities. As PSO and GA usemutation (called as perturbation in PSO) for the maintenance of solution diversity and the prevention of
3 of 19
American Institute of Aeronautics and Astronautics Paper 2007-4167

Figure 2. 0th shape without engine and tail wing onunstructured mesh colored by the pressure distribu-tion.
Figure 3. Deformed shape of 0th shape colored bythe displacement for height direction.
convergence to a local optima, the convergence to Pareto solutions becomes worse. The PSO/GA hybridmethod improves of diversity and enriches the quality of the obtained solutions. It is notable that PSOmeans MOPSO, GA denotes adaptive range MOGA (ARMOGA) in this study.
1. Particle Swarm Optimization
The PSO method evolved from a simple simulation model of the movement of social groups such as birds andfish, in which it was observed that local interactions underlie the group behavior and individual membersof the group can profit from the discoveries and experiences of other members. PSO is the algorithm usingplural points such as GA. PSO learns the personal best Pbest for exploiting the best results found sofa byeach of the particles, and the global best Gbest found so fa by the whole swarm for encouraging furtherexploration and information sharing between the particles. In PSO, each solution (particle) xn in the swarmof N particles is endowed using the following equations.
x(t+1)n = x(t)
n + χv(t)n + ε(t) (1a)
v(t+1)n = wv(t)
n + c1r1(Pbestn − x(t)) + c2r2(Gbestn − x(t)) (1b)
where χ ∈ [0, 1] is a constriction factor which controls the velocity’s magnitude. w, c1, and c2 are parameters.r1 and r2 are two uniformly distributed random numbers in the range [0, 1]. t denotes the searching cyclewhich is similar to the generation in GA. n denotes each individual. x is the vector for design variable, andv denotes the velocity vector. ε denotes perturbation. Although original PSO introduces a normal pertur-bation, a Laplacian density p(ε) ∝ exp(−|ε|/0.1) is used in the present study. The Laplacian distributionyields occasional large perturbations enabling wider exploration.
2. Multi-Objective PSO
The MOPSO is developed by using the method proposed by Alvarez-Banitez et al8. The determinationmanner of Pbest and Gbest is essential, because the result of MO problem has plural optimum solutions.Especially, the determination of Gbest is important. In this study, the manner is employed which determinesthe Gbest based on the Pareto dominance concepts.
The non-dominated solutions for exploration are held as the archive A. Xa and Ax define as Xa ≡ {x ∈X|a ≺ x} and Ax ≡ {a ∈ A|a ≺ x}, respectively. Gbest is determined by using Xa as follows;
Gbestn =
{a ∈ A with probability ∝ |Xa|−1 if x ∈ A
a ∈ AX with probability ∝ |Xa|−1 otherwise(2)
Pbest is updated unless the present position is dominated by the position of last generation.
4 of 19
American Institute of Aeronautics and Astronautics Paper 2007-4167

3. Operators for GA
The real-coded MOGA was used in this study because the value of design variables is directly employed for thechromosome of individual. Regarding crossover, the blended crossover method (BLX-α)15, and the principalcomponent analysis-BLX-α method (PCA-BLX-α)16 were used, and then the quarter of the population sizewas assigned to each crossover method. The other population was assigned to PSO. When the mutation rateis high, an EA search is close to a random search and results in slow convergence. Therefore, the mutationrate was defined by using the inverse of the number of design variable in this study.
E. Evaluation Method
The present exploration system prepared two evaluation modules for aerodynamics, structures, and boomnoise. As the structures module used the result of aerodynamic evaluation, these phases were carried out oneby one. The master processing element (PE) managed PSO/GA, while the slave PEs computed aerostructuralevaluation processes. Slave processes did not require synchronization. It took roughly seven days at least toevaluate one generation.
1. Aerodynamic Evaluation
In the present study, TAS-Code, parallelized unstructured Euler/Navier-Stokes solver using domain decom-positions and message-passing interface (MPI) library, was employed to evaluate S · CDp
and S · CL. Thethree-dimensional Euler equations were solved with a finite-volume cell-vertex scheme on the unstructuredmesh5. The Harten-Lax-van Leer-Einfeldt-Wada Riemann solver17 was used for the numerical flux compu-tations. The Venkatakrishnan’s limiter18 was applied when reconstructing the second order accuracy. Thelower-upper symmetric-Gauss-Seidel implicit scheme19 was applied for time integration.
Euler computations were performed under subsonic and supersonic flight conditions, respectively. Takingadvantage of the parallel search in PSO/GA, the present optimization was parallelized. Moreover, the CFDcomputation was also parallelized on the scalar machine.
The following Prandtle-Hoerner’s equation was used for the estimation of S · CDf to avoid huge com-putational time due to Navier-Stokes computation.This empirical equation is often employed for practicaldesigns in business.
CDf= Cf (Re,M) · Swet
Sref
=0.455
(log10 Re)2.58· (1 + 0.15M2)−0.58 · Swet
Sref
(3)
2. Structural Evaluation
In the present MDE system, structural optimization of a wing stacking sequences of laminated compositeswas performed to realize minimum Wc with constraints of strength and vibration requirements. The vibrationrequirement was defined instead of flutter one. Given the wing outer mold line for each individual, finiteelement model (FEM) was generated from aerodynamic evaluation result of supersonic cruising condition,such as coordinates, pressure coefficient, and normal vector (x, y, z, Cp, xnormal, ynormal, and znormal) shownin Fig. 3. The strength and vibration characteristics were evaluated by using the commercial software MSC.NASTRANTM. Wing had inner and outer boards. Inboard wing was composed of multi-frame structure,such as frame, rib, and spar. Outboard wing compounded from full-depth honeycomb sandwich structure.
The design variables were six, such as stacking sequences (fiber angle of a ply θ and number of ply n)of the skin in outboard wing, the skin in inboard wing, and the frames in inner wing. θ was defined assymmetrical stacking [0/θ/−θ/90]ns. It is notable that n is set on ∀n ∈ N ≤ 25. When n was greater than25, the individual cannot fulfill the structural requirements. A rank has penalty in the optimizer. Note thatθ was set on 15, 30, 45, 60, and 75degs.
First, strength analysis was carried out until six design variables fulfill the strength requirement ateach node of FEM mesh on each stacking sequences. Then, oscillation analysis was performed using thecombinations of the design variables satisfied with the strength requirement until they fulfill the vibrationrequirements (greater than 8Hz for bending-first-mode and also greater than 50Hz for twist-first-mode). Thecomputational condition was set on the symmetrical maneuver +6G and the margin of safety was set on1.25. The speed of sound and the air density was set under the condition of altitude of 16km.
5 of 19
American Institute of Aeronautics and Astronautics Paper 2007-4167

3. Sonic Boom Evaluation
The computer-aided design(CAD)-based Automatic Panel Analysis System (CAPAS) was used to evaluateIboom. CAPAS was a conceptual aerodynamic design tool in JAXA. This tool comprised four design processesas follows; 1) geometry definition of airplane component, 2) combination of all components in an airplaneconfiguration using an application program interface (API) for the CATIATMV4, 3) generation of paneland aerodynamic analysis using panel method, 4) sonic-boom analysis using a modified linear theory. Asan aerodynamic evaluation module in CAPAS was a low-fidelity because a geometry was inaccurate due torough computational panel, the aerodynamic performance in CAPAS was used only to evaluate Iboom.
III. Optimization Results
The population size was set on 16. It took roughly six hours of CPU time of JAXA’s super computer sys-tem 20 PEs for an Euler computation. The total evolutionary computation of 12 generations was performed,and 75 non-dominated solutions were obtained. Here, the derived non-dominated solutions are focused be-cause a compromise solution is selected from them. The evolution might not converge yet. However, theresult was satisfactory because several non-dominated solutions achieved improvements over the 0th shape.Furthermore, sufficient number of solutions was searched so that data mining of the design space can beperformed. This can provide useful knowledge for designers.
Figure 4 shows the non-dominated solutions projected on two-dimensional plane between two objectives.This figure indicates the following tradeoff information. There are tradeoffs between S · CL and Wc. Es-pecially, there are severe tradeoffs between S · CDp and S · CL, and S · CDf
and S · CL. Whereas, there isno tradeoff between S · CDp and S · CDf
. The relations are obscure between the other combinations of theobjective functions. This figure shows that the 0th shape is one of the non-dominated solutions, and it ison the edge of the objective-function space. Because two values of design variables to describe 0th shape,such as the span length and sweepback angle of inboard wing, are near the edge of the defined design space.As several non-dominated fronts are regrettably obscure, data mining deals with the correlations among theobjectives.
A. Comparison among the Extreme Solutions regarding the Objective Functions
There are three extreme solutions, which means the champions for each objectives, named as non-dominatedsolution(NDS) A, B, and C. NDS-A denotes an individual which S ·CDp and Iboom were minimized. NDS-Bis an individual which S ·CDf
and Wc were minimized. NDS-C is an individual which S ·CL was maximized.It is notable that the individuals without fulfillment of strength/vibration requirements were eliminatedfrom the candidates. The planform shapes are shown in Fig. 5, and their geometrical characteristics aresummarized in Table 2. Note that AR, Swetted
wing , and Nply denote the aspect ratio, wetted area of one-sidewing, and number of ply (for the skin of outboard wing, the skin of inboard wing, and the multi frames ofinboard wing), respectively. AR defines b2/(Sref · 2), b is a full span length.
NDS-A shows that a large swept angle of leading edge holds the front boom. Therefore, the minimizationsof S · CDp and Iboom are achieved, simultaneously. But, because the eigenvalue of twist first mode becomeslow, the ply should be stacked for the skin of inboard wing. NDS-B reveals that the smallest wing areaachieves the minimization of S · CDf
, and the smallest wing area and the low swept angle of leading edgerealize the minimization of Wc. But, as the angle of attack at supersonic cruising condition must be highto secure the target CL, the separation might be triggered. Furthermore, high landing speed must be alsosecured because of a small wing area. NDS-C shows that a large wing area achieves the maximization of liftat subsonic condition. But, the drags and Wc become high due to the large wing area. The wing planformsof these solutions indicate that the wing area gives strong effects on the objective functions in this study.The shapes of these extreme solutions show that the optimizer can explore to the edge of the design space,efficiently. Consequently, the extreme solutions cannot design practically, and a compromise geometry willbe decided using the knowledge in the design space.
IV. Data Mining
Although a design optimization is important for engineering, the most significant point is the extractionof the knowledge in design space. The results obtained by MO optimization are not a sole solution but an
6 of 19
American Institute of Aeronautics and Astronautics Paper 2007-4167

(a) S · CDp vs. S · CDf (b) S · CDp vs. S · CL
(c) S · CDp vs. Iboom (d) S · CDfvs. S · CL
(e) S · CDfvs. Iboom (f) S · CL vs. Iboom
(g) S · CL vs. Wc(h) Iboom vs. Wc
Figure 4. Derived non-dominated solutions on two dimensional planes between the objective functions. Theorange arrow denotes the optimum direction.
7 of 19
American Institute of Aeronautics and Astronautics Paper 2007-4167

(a) NDS-A (b) NDS-B (c) NDS-C
Figure 5. Comparison among the wing planform of the extreme solutions colored by Cp distribution on CFDand displacement on CSD.
Table 2. Geometrical characteristic values of the extreme solutions.
Individual CLdesign αcruise[deg] AR Swettedwing [m2] Nply
out skin/Nplyin skin/Nply
in rib
NDS-A 0.1300 3.94 2.92 10.81 16/88/32NDS-B 0.3103 6.85 2.86 4.15 8/24/8NDS-C 0.0632 1.76 3.08 22.52 56/48/56
optimum set. That is, as multi-objective optimization result is insufficient information for practical designbecause designers need a conclusive shape. However, the result of MO optimization can be accounted as ahypothetical design database. Data mining as a post-process for an optimization is essential to obtain thefruitful design knowledge efficiently20–22. In the present study, functional analysis of variance (ANOVA) andself-organizing map (SOM) were used for data mining technique.
A. Analysis of Variance
ANOVA23 is one of the data mining techniques showing the effect of each design variable to the objective andthe constraint functions in a quantitative manner. ANOVA uses the variance of the model due to the designvariables on the approximation function. By decomposing the total variance of model into the variance dueto each design variable, the influence of each design variable on the objective function can be calculated. Thedecomposition is accomplished by integrating out the variables of model y. y denotes an estimated value ofunknown function y. The total mean (µtotal) and the variance (σ2
total) of model y are as follows:
µtotal ≡∫
· · ·∫
y (x1, x2, · · · , xn) dx1dx2 · · · dxn (4a)
σ2total =
∫· · ·
∫[y (x1, x2, · · · , xn) − µtotal]
2dx1dx2 · · · dxn (4b)
The main effect of variable xi and the two-way interaction effect of variable xi and xj are given as follows:
µ (xi)
≡∫
· · ·∫
y (x1, x2, · · · , xn) dx1dx2 · · · dxi−1dxi+1 · · · dxn
− µtotal
(5)
8 of 19
American Institute of Aeronautics and Astronautics Paper 2007-4167

µi,j (xi, xj)
≡∫
· · ·∫
y (x1, x2, · · · , xn) dx1dx2 · · · dxi−1dxi+1 · · · dxj−1dxj+1 · · · dxn
− µi (xi) − µj (xj) − µtotal
(6)
µ(xi) and µi,j(xi, xj) quantify the effect of variable xi and interaction effect of xi and xj on the objectivefunction. The variance due to the design variable xi is obtained as follows:
σ2xi
=∫
[µi (xi)]2dxi (7)
The proportion of the variance P due to design variable xi to total variance of model can be expressed bydividing Eq. (7) with Eq. (4b).
P =σ2
xi
σ2total
=
∫[µi (xi)]
2dxi∫
· · ·∫
[y (x1, x2, · · · , xn) − µtotal]2dx1dx2 · · · dxn
(8)
This value indicates13 the effect of design variable xi on the objective function y.
B. Self-Organizing Map
1. General SOM Algorithm
SOM24 is an unsupervised learning, nonlinear projection algorithm from high to low-dimensional space. Thisprojection is based on self-organization of a low-dimensional array of neurons. In the projection algorithm,the weights between the input vector and the array of neurons are adjusted to represent features of the highdimensional data on the low-dimensional map. The close two patterns are in the original space, the closer isthe response of two neighboring neurons in the low-dimensional space. Thus, SOM reduces the dimensionof input data while preserving their features.
2. Batch-SOM
In this study, SOMs are generated by using commercial software Viscovery R© SOMine 4.0 plusa producedby Eudaptics GmbH. Although SOMine is based on the general SOM concept and algorithm, it employs anadvanced variant of unsupervised neural networks, i.e., Kohonen’s Batch SOM25,26. The algorithm consistsof two steps that are iterated until no more significant changes occur: search of the best-matching unit ci
for all input data {xi} and adjustment of weight vector {mj} near the best-matching unit. The Batch-SOMalgorithm can be formulated as follows:
ci = arg min ‖xi − mj‖ (9a)
m∗j =
∑i
hjcixi∑i
hjci
(9b)
where m∗j is the adjusted weight vector. The neighborhood relationship between two neurons j and k
is defined by the Gaussian-like function hjk = exp(−d2jk/r2
t ). Where djk denotes the Euclidean distancebetween the neuron j and the neuron k on the map, and rt denotes the neighborhood radius which isdecreased with the iteration steps t.
The standard Kohonen algorithm adjusts the weight vector after all each record is read and matched.On the contrary, the Batch-SOM takes a ‘batch’ of data (typically all records), and performs a ‘collected’adjustment of the weight vectors after all records have been matched. This is much like ‘epoch’ learning
a“Eudaptics” available online at http://www.eudaptics.com [cited 16 June 2004].
9 of 19
American Institute of Aeronautics and Astronautics Paper 2007-4167

in supervised neural networks. The Batch-SOM is a more robust approach, since it mediated over a largenumber of learning steps. In the SOMine, the uniqueness of the map is ensured by the adoption of theBatch-SOM and the linear initialization for input data. Much like some other SOMs27, SOMine creates amap in a two-dimensional hexagonal grid. Starting from numerical, multivariate data, the nodes on the gridgradually adapt to the intrinsic shape of the data distribution can be read off from the emerging map on thegrid. The trained SOM is systematically converted into visual information4,20.
3. Cluster Analysis
Once SOM projects input space on a low-dimensional regular grid, the map can be utilized to visualize andexplore properties of the data. When the number of SOM units is large, to facilitate quantitative analysisof the map and the data, similar units need to be grouped, i.e., clustered. The two-stage procedure —first using SOM to produce the prototypes which are then clustered in the second stage — was reported toperform well when compared to direct clustering of the data27.
Hierarchical agglomerative algorithm is used for clustering here. The algorithm starts with a clusteringwhere each node by itself forms a cluster. In each step of the algorithm two clusters are merged: those withminimal distance according to a special distance measure, the SOM-Ward distance. This measure takes intoaccount whether two clusters are adjacent in the map. This means that the process of merging clusters isrestricted to topologically neighbored clusters. The number of clusters will be different according to thehierarchical sequence of clustering. A relatively small number will be chosen for visualization, while a largenumber will be used for generation of codebook vectors for respective design variables.
V. Data-Mining Results
Although SOM looks down the global knowledge in design space like a bird-eye view, it has a disadvantagethat it is possible to overlook the design knowledge due to a large number of design variables. In this study,data mining by SOM was performed after key design variables were addressed by ANOVA.
A. Knowledge by ANOVA
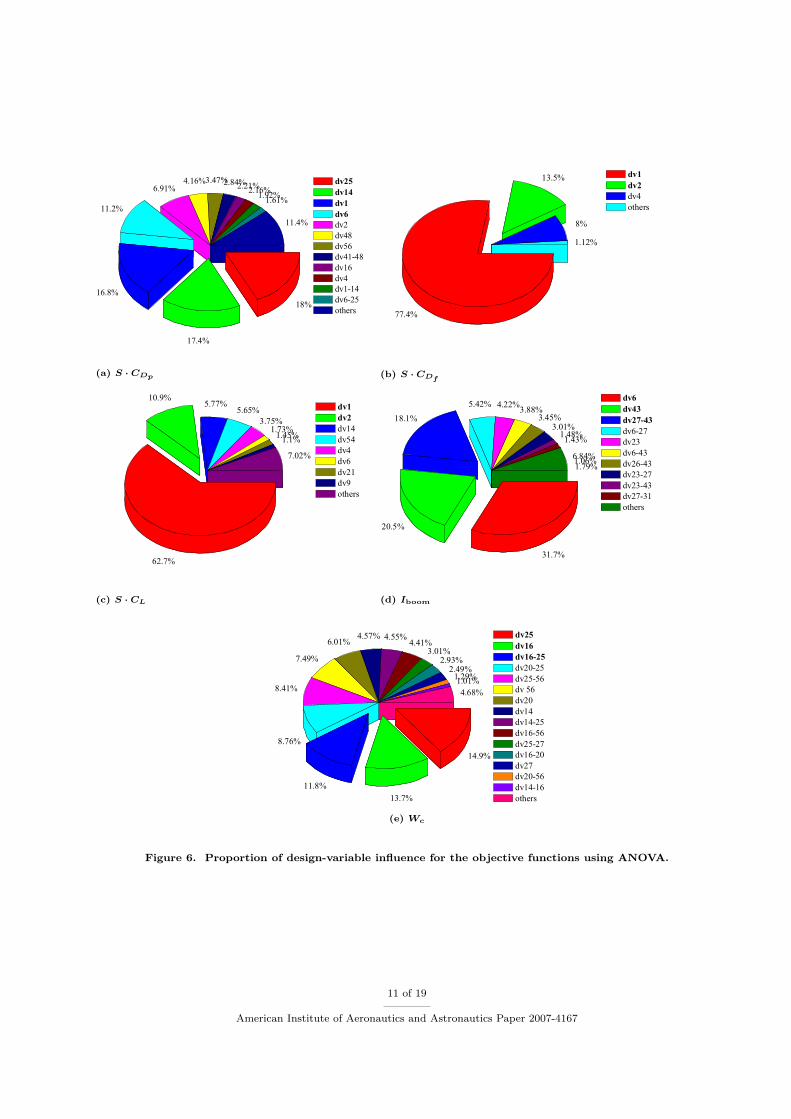
The variance of the design variables and their interactions by ANOVA are shown in Fig. 6. Their proportionsare shown which were larger than 1% to the total variance. It is notable that ANOVA was analyzed to excepta individual with great value leap for Iboom, and 16 individuals without fulfillment of structural requirements.The symbol ‘dv’ denotes design variable and ‘-’ means the interaction between two design variables.
Figure 6a shows that dv25, dv14, dv1, and dv6 give the effect on S ·CDp . Dv25 describes the leading-edgebluntness at root. As the wing thickness at root is largest due to the long chord length, the leading-edgebluntness at root is most effective on S ·CDp . Dv14 represents the height of rearward camber at root. Dv14decides the angle which the flow takes on the rearward wing. As the curvature of camber line becomes largewhen the value of dv14 becomes high, S · CDp increases. Dv1 describes the inboard span length. As wettedarea increases when dv1 becomes high, S · CDp
increases.Figure 6b shows that dv1, dv2, and dv4 give the effects on S · CDf
. It reveals that the span length andthe chord length at kink are effective to S · CDf
. In this study, as the Prandtle-Hoerner’s equation givesS · CDf
, it becomes high when the individual has a large wetted area. Moreover, in this study, the chordlength at root does not fluctuate largely. The design variables represented a large chord length at kink giveeffects on the increase of the wing area.
Figure 6c reveals that dv1 and dv2 give effects on S · CL. The span length of inboard wing decides theS · CL. The mechanism that S · CL increases due to the span length is similar to that of S · CDf
increase.Figure 6d shows that dv6 and dv43 give effects on Iboom. The dv6 describes the leading-edge sweepback
angle of inner wing. As the Iboom at the front boom becomes weak when this angle becomes large, the totalof Iboom thus decreases.
Figure 6e shows that dv25 and dv16 give effects on Wc. Dv25 describes the leading-edge bluntness at root.As the wing becomes thin near the leading edge when leading edge has sharpness, the strength becomes weakand also the natural frequency becomes low. Since the number of ply should increase to fulfill the structuralrequirements, Wc increases. Dv16 describes the frontward camber height at kink. The curvature of camberline multiplies strength and increases natural frequency. Camber height gives effect on Wc
10 of 19
American Institute of Aeronautics and Astronautics Paper 2007-4167
(a) S · CDp (b) S · CDf
(c) S · CL (d) Iboom
(e) Wc
Figure 6. Proportion of design-variable influence for the objective functions using ANOVA.
11 of 19
American Institute of Aeronautics and Astronautics Paper 2007-4167
B. Knowledge by SOM
The resulting 75 non-dominated solutions have been projected onto the two dimensional map of SOM. Figure7 shows the colored SOM by the objective functions with 11 clusters taking the five objective functions intoconsideration. Figure 7a shows that left area collects the designs with high S · CDp , and also right areacollects the designs with low S · CDp
. Figure 7b shows that upper left area collects the designs with highS ·CDf
, and also upper right area collects the designs with low S ·CDf. Figure 7c shows the similar coloring
pattern compared with Fig. 7b. Figure 7d shows that lower right area collects the designs with high Iboom.There is no clear pattern regarding low Iboom. Figure 7e shows that upper left area collects the designswithout fulfillment of the structural requirements, and also right area collects the designs with low Wc. Thisresult is summarized in Fig. 8.
Figure 7 reveals the following tradeoff and correlation information. There is no tradeoff between S ·CDp
and S ·CDf. On the other hand, there is strong tradeoffs between S ·CL and S ·CDp , and S ·CL and S ·CDf
.There is no correlation between Iboom and the other objectives, that is, Iboom does not depend on the otherobjectives in the design space. In this study, there is no tradeoff between S · CDp and Iboom because thefuselage is fixed. The nose geometry is generally effective to the tradeoff between them. There is correlationamong Wc and S ·CDp
, S ·CDf, and S ·CL when Wc becomes low. Moreover, since the cluster on the upper
right corner in Fig. 7 has low values of all objectives, there is a sweet spot when S · CL is tolerable. But,the primary objective of this MDO is to improve the lift performace at low speed. The knowledge regardingthis sweet sport suggests that the other four objectives are corrupted compared with 0th shape even whenany compromise solution improved lift performance at low speed is selected.
Figure 9 shows the SOMs colored by CDp and CL. Figure 9a shows that upper right area collects the highCDp , and upper center area and lower right areas collect the low CDp . Figure 9b shows that lower left areacollects high CL, and right area collects low CL, however, the color pattern is unclear. As the comparisonamong Fig. 7a, 7c, and Fig. 9 shows the different color pattern, the optimum direction disagrees betweenCDp and S ·CDp , and between CL and S ·CL. When S ·CDp and S ·CL is considered, the optimum directionis dominated by wing area.
The SOMs can be also contoured by 58 design-variable values. Figure 10 shows the SOMs colored bythe characteristic design variables addressed by ANOVA. These colored SOMs reveal ‘how’ design variablesoperate on the objective functions. Figure 10a shows that left area collects high dv1. Also, upper right areacollects low dv1. Therefore, when the span length of inboard wing becomes high, S ·CDp , S ·CDf
, and S ·CL
become high, and also when it becomes low, S ·CDp , S ·CDf, S ·CL, and Wc become low. Figure 10b shows
that upper left area collects high dv2. Therefore, when the span length of outboard wing becomes high,S · CDf
, S · CL, and Wc becomes high. As Fig. 10c shows that upper right area collects high dv6, S · CDp
and Iboom becomes low when the sweepback angle of inboard wing becomes high. Figure 10d shows that leftarea roughly collects high dv14, but this color pattern is insufficient to mention the correlation. Therefore,the rearward camber height at root does not have a large effect on S · CDp . Figure 10e shows that uppercenter area collects low dv16. Therefore, Wc tends to become high when the frontward camber height at kinkbecomes low. Figure 10f shows that dv25 does not fluctuate so much and there is no clear contour pattern.Therefore, the leading-edge bluntness at root does not give large effect on the objectives. As Fig. 10g showsthat there is incoherent color pattern, there is no correlation between the leading-edge bluntness at tip andIboom.
The color patterns between two or more SOMs give the qualitative effects. SOM needs to be interpretedwhile the physical meaning of design variables is considered.
C. Decision of a Compromise Solution
The 75 non-dominated solutions are extracted using SOM to determine a compromise solution. The ap-plicable solutions to the following conditions are firstly excluded from 75 non-dominated solutions; 1) Thestructural requirements are not fulfilled, 2) S · CL is low, or wing area is low (this means the constraintfor the landing speed.), 3) S · CDp
and S · CDfare impractically large. As a result of this operation, 24
non-dominated solutions as the practical designs are sorted. The SOM is re-generated using derived 24non-dominated solutions taking the five objective functions into consideration. The derived SOM with thetop views of the sorted 24 non-dominated solutions and its colored maps by the objectives are shown inFig. 11. The compromise solution is determined from these individuals taking the balance of the five objec-tive functions and the low-boom competence as the primary objective of S3TD into consideration on SOM.
12 of 19
American Institute of Aeronautics and Astronautics Paper 2007-4167

(a) S · CDp(b) S · CDf
(c) S · CL (d) Iboom
(e) Wc
Figure 7. SOMs colored by the objective functions taking the five objective functions into consideration.
Figure 8. SOM of the derived non-dominated solutions in the five dimensional objective function space.Shadow region denotes that there is impractical individuals for design.
13 of 19
American Institute of Aeronautics and Astronautics Paper 2007-4167

(a) CDp (b) CL
Figure 9. SOMs colored by the aerodynamic characteristics.
D. Comparison between 0th Shape and Selected Compromise Solution
The comparison of the planform between the 0th shape and the selected compromise solution (called as‘compromise’) is shown in Fig. 12. Also, their airfoils of 0th and compromise shapes near the junctionrelative to the fuselage, kink, and tip are shown. It is notable that 0th shape has no twist and its airfoil isdescribed by NACA64A series. The thickness ratios are respectively defined as 6% at root, 5% at kink, and3% at tip. The installed angle of wing is −0.5deg relative to the fuselage. 0th shape design was focused onreducing sonic boom. Their characteristics and performance are summarized in Tables 3 and 4. As S · CL
is maximization objective, compromise has a larger wing area than that of 0th shape. And, inner wing areaof compromise becomes large to secure the structural strength. The sweepback angle has more gentle notto give the effects on Iboom so that the wing area and structural strength are also secured. But, the chordlength near kink becomes short to achieve low Wc and S · CDf
. Therefore, the number of ply increases toaugment the eigen frequency. Compromise has the supersonic leading edge near root to reduce the effect onIboom of the front boom. Also, compromise has the blunt leading edge near kink to improve the strength,eigen frequency, and subsonic aerodynamic performance. Data-mining results show that the sharp leadingedge near tip gives effect on Iboom. But, the wing area gives strong effect on the objectives. Therefore, theknowledge regarding the airfoil shape is unreliable.
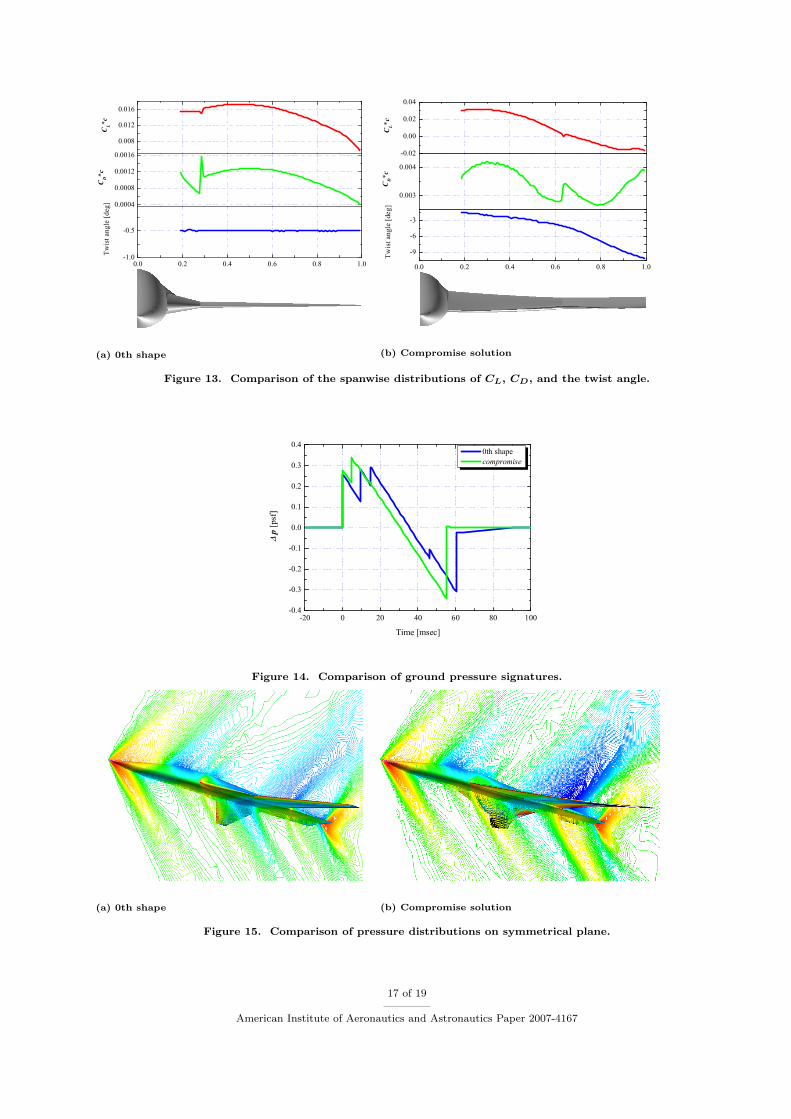
The location in the design space for 0th shape and compromise is shown in Fig 4. 0th shape has lowS · CDp and S · CL due to a small wing area, and it locates on the edge in the design space. Also, it haslow Iboom due to focusing on low-boom design. Compromise locates low Iboom region as well as compromiseof the other objectives. These location in Fig. 4 shows the aerodynamic performance strictly depends onthe wing area. Figure 13 shows the spanwise distributions of CL and CD, and twist angle for 0th andcompromise shapes. This figure shows that the twist angle of compromise on outer wing is large. That is,outboard is not worked as wing, and down force occurs. CD becomes still larger due to inverted camber linenear the kink. As data-mining results reveal that the design variables regarding twist down and invertedcamber line give no effects on the objective functions, the re-design of these design variables can improvethe aerodynamic performance without corrupting the other objectives. The knowledge regarding the airfoilshape is insufficient. The primary reason is that its effect is weak to the aerodynamic performance comparedwith the wing planform. The secondary reason is that only a small number of the generations was performed.
The boom intensity as the primary objective function is finally compared between 0th and compromise.Figure 14 shows their ground pressure signatures. Although Iboom performance of 0th shape is better, com-promise also keeps non-N-shaped signature to restrain the initial peak. Compromise has better performanceof S · CL for the constraint of landing speed as well as the restraint of Iboom. In this study, the rearwardboom intensity cannot be discussed because the assumed fuselage-wing configuration ignores an engine na-celle and vertical/horizontal tail wings. But, CFD visualization of Cp distribution on symmetrical planeshown in Fig. 15 reveals that shock wave occurs in the vicinity of wing trailing edge. It is necessary that thefull configuration is optimized to design the geometry restrained rearward boom intensity and to obtain thedesign knowledge regarding cross section shape.
14 of 19
American Institute of Aeronautics and Astronautics Paper 2007-4167

(a) dv1 (b) dv2
(c) dv6 (d) dv14
(e) dv16 (f) dv25
(g) dv43
Figure 10. SOMs colored by the characteristic design variables indicated by ANOVA.
15 of 19
American Institute of Aeronautics and Astronautics Paper 2007-4167

S · CDp S · CDf S · CL Iboom Wc
Figure 11. Derived SOM with the top views of sorted 24 individuals and their colored maps by the objectivefunctions.
(a) 0th shape (b) Compromise solution
Figure 12. Comparison of wing shape colored by Cp and displacement distributions, and Cp distributions nearthe junction relative to the fuselage, kink, and tip.
16 of 19
American Institute of Aeronautics and Astronautics Paper 2007-4167
(a) 0th shape (b) Compromise solution
Figure 13. Comparison of the spanwise distributions of CL, CD, and the twist angle.
Figure 14. Comparison of ground pressure signatures.
(a) 0th shape (b) Compromise solution
Figure 15. Comparison of pressure distributions on symmetrical plane.
17 of 19
American Institute of Aeronautics and Astronautics Paper 2007-4167

Table 3. Comparison of geometrical characteristic values between 0th shape and compromise solution.
Individual CLdesign αcruise[deg] AR Swettedwing [m2] Nply
out skin/Nplyin skin/Nply
in rib
0th shape 0.132 2.33 3.81 10.41 8/72/24compromise 0.0898 3.61 3.18 15.68 56/88/24
Table 4. Comparison of the objective and aerodynamic-performance values between 0th shape and compromisesolution.
Individual S · CDp (CDp) S · CDfS · CL (CL) Iboom Wc
0th shape 0.0656 (0.0118) 0.0482 3.896 (0.7029) 0.615 88.74compromise 0.1777 (0.0218) 0.0584 4.719 (0.5794) 0.676 214.58
VI. Conclusions
The multidisciplinary design exploration for S3TD wing has been performed using optimization and datamining taking five objective functions regarding aerodynamics, structures, and boom noise into considerationon PSO/GA hybrid method. Consequently, 12 generation was evolved and 75 non-dominated solutions wereacquired. The knowledge in the design space was obtained regarding the tradeoffs and correlation amongthe objective functions. Furthermore, the particular design variables, which give effects on the objectivefunctions, was revealed. The design knowledge is essential for successful decision of a compromise solution.The selected compromise solution improves in lift performance as well as the restraint of sonic boom intensity.Since wing area and planform shape give strong effects on the objective functions due to the definition of thepresent optimization problem, a next-step MDO will be carried out for practical design of wing cross-sectiongeometry.
Acknowledgments
We would like to thank all members of the supersonic transport team in aviation program group, JAXA forproviding useful advice. The Euler/NASTRAN computations were performed using the Central NumericalSimulation System of Numerical Simulator III in JEDI center, JAXA.
References
1Ohnuki, T., Hirako, K., and Sakata, K., “National Experimental Supersonic Transport Project,” Proceedings on 25thInternational Council of the Aeronautical Sciences, ICAS 2006-1.4.1, Hamburg, Germany, 2006.
2Murakami, A., “Silent Supersonic Technology Demonstration Program,” Proceedings on 25th International Council ofthe Aeronautical Sciences, ICAS 2006-1.4.2, Hamburg, Germany, 2006.
3Sasaki, D., Obayashi, S., and Nakahashi, K., “Navier-Stokes Optimization of Supersonic Wings with Four ObjectivesUsing Evolutionary Algorithm,” Journal of Aircraft , Vol. 39, No. 4, 2002, pp. 621–629.
4Chiba, K., Obayashi, S., Nakahashi, K., and Morino, H., “High-Fidelity Multidisciplinary Design Optimization ofAerostructural Wing Shape for Regional Jet,” AIAA Paper 2005-5080, 2005.
5Ito, Y. and Nakahashi, K., “Direct Surface Triangulation Using Stereolithography Data,” AIAA Journal , Vol. 40, No. 3,2002, pp. 490–496.
6Kumano, T., Jeong, S., Obayashi, S., Ito, Y., Hatanaka, K., and Morino, H., “Multidisciplinary Design Optimization ofWing Shape for a Small Jet Aircraft Using Kriging Model,” AIAA Paper 2006-0932, 2006.
7Kennedy, J. and Eberhart, R., “Particle Swarm Optimization,” Proceedings of the Fourth IEEE International Conferenceon Neural Networks, 1995, pp. 1942–1948.
8Alvarez-Benitez, J. E., Everson, R. M., and Fieldsend, J. E., “A MOPSO Algorithm Based Exclusively on ParetoDominance Concepts,” The 3rd International Conference on Evolutionary Multi-Criterion Optimization, LNCS 3410 , Springer-Verlag Heidelberg, Guanajuato, Mexico, 2005, pp. 459–473.
9Fonseca, C. M. and Fleming, P. J., “Genetic Algorithms for Multiobjective Optimization: Formulation, Discussion andGeneralization,” Proceedings of the Fifth International Conference on Genetic Algorithms, 1993, pp. 416–423.
10Obayashi, S., Takahashi, S., and Takeguchi, Y., “Niching and Elitist Models for MOGAs, Parallel Problem Solving fromNature,” The 5th International Conference onParallel Problem Solving from Nature, LNCS 1498 , Springer, Berlin, Heidelberg,New York, 1998, pp. 260–269.
18 of 19
American Institute of Aeronautics and Astronautics Paper 2007-4167

11Simpson, T. W., Mauery, T. M., Korte, J. J., and Mistree, F., “Kriging Models for Global Approximation in Simulation-Based Multidisciplinary Design Optimization,” AIAA Journal , Vol. 39, No. 12, 2001, pp. 2233–2241.
12Keane, A. J., “Statistical Improvement Criteria for Use in Multiobjective Design Optimization,” AIAA Journal , Vol. 44,No. 4, 2006, pp. 879–891.
13Jeong, S., Murayama, M., and Yamamoto, K., “Efficient Optimization Design Method Using Kriging Model,” Journal ofAircraft , Vol. 42, No. 2, 2005, pp. 413–420.
14Keane, A. J., “Wing Optimization Using Design of Experiment, Response Surface, and Data Fusion Methods,” Journalof Aircraft , Vol. 40, No. 4, 2003, pp. 741–750.
15Eshelman, L. J. and Schaffer, J. D., “Real-Coded Genetic Algorithms and Interval Schemata,” Foundations of GeneticAlgorithms 2 , Morgan Kaufmann, San Mateo, CA, 1993, pp. 187–202.
16Takahashi, M. and Kita, H., “A Crossover Operator Using Independent Component Analysis for Real-Coded GeneticAlgorithms,” Proceedings of IEEE Congress on Evolutionary Computation 2001 , 2001, pp. 643–649.
17Obayashi, S. and Guruswamy, G. P., “Convergence Acceleration of an Aeroelastic Navier-Stokes Solver,” AIAA Journal ,Vol. 33, No. 6, 1994, pp. 1134–1141.
18Venkatakrishnan, V., “On the Accuracy of Limiters and Convergence to Steady State Solutions,” AIAA Paper 93-0880,1993.
19Sharov, D. and Nakahashi, K., “Reordering of Hybrid Unstructured Grids for Lower-Upper Symmetric Gauss-SeidelComputations,” AIAA Journal , Vol. 36, No. 3, 1998, pp. 484–486.
20Obayashi, S. and Sasaki, D., “Visualization and Data Mining of Pareto Solutions Using Self-Organizing Map,” The2nd International Conference on Evolutionary Multi-Criterion Optimization, LNCS 2632 , Springer-Verlag Heidelberg, Faro,Portugal, 2003, pp. 796–809.
21Holden, C. M. E. and Keane, A. J., “Visualization Methodologies in Aircraft Design,” AIAA Paper 2004-4449, 2004.22Chiba, K., Obayashi, S., and Nakahashi, K., “Design Exploration of Aerodynamic Wing Shape for Reusable Launch
Vehicle Flyback Booster,” Journal of Aircraft , Vol. 43, No. 3, 2006, pp. 832–836.23Jones, D. R., Schonlau, M., and Welch, W. J., “Efficient Global Optimization of Expensive Black-Box Functions,” Journal
of Global Optimization, Vol. 13, No. 4, 1998, pp. 455–492.24Kohonen, T., Self-Organizing Maps, Springer, Berlin, Heidelberg, 1995.25Deboeck, G. and Kohonen, T., Visual Explorations in Finance with Self-Organizing Maps, London, Springer Finance,
1998.26Pampalk, E., Rauber, A., and Merkl, D., “Content-Based Organization and Visualization of Music Archives,” Proceedings
of the 10th International conference on Multimedie, ACM Press, NY, 2002, pp. 570–579.27Vesanto, J. and Alhoniemi, E., “Clustering of the Self-Organizing Map,” IEEE Transactions on Neural Networks, Vol. 11,
No. 3, 2000, pp. 586–600.
19 of 19
American Institute of Aeronautics and Astronautics Paper 2007-4167