multifamily research - the real deal · 2017-11-01 · investment trends multifamily 2017 outlook...
TRANSCRIPT
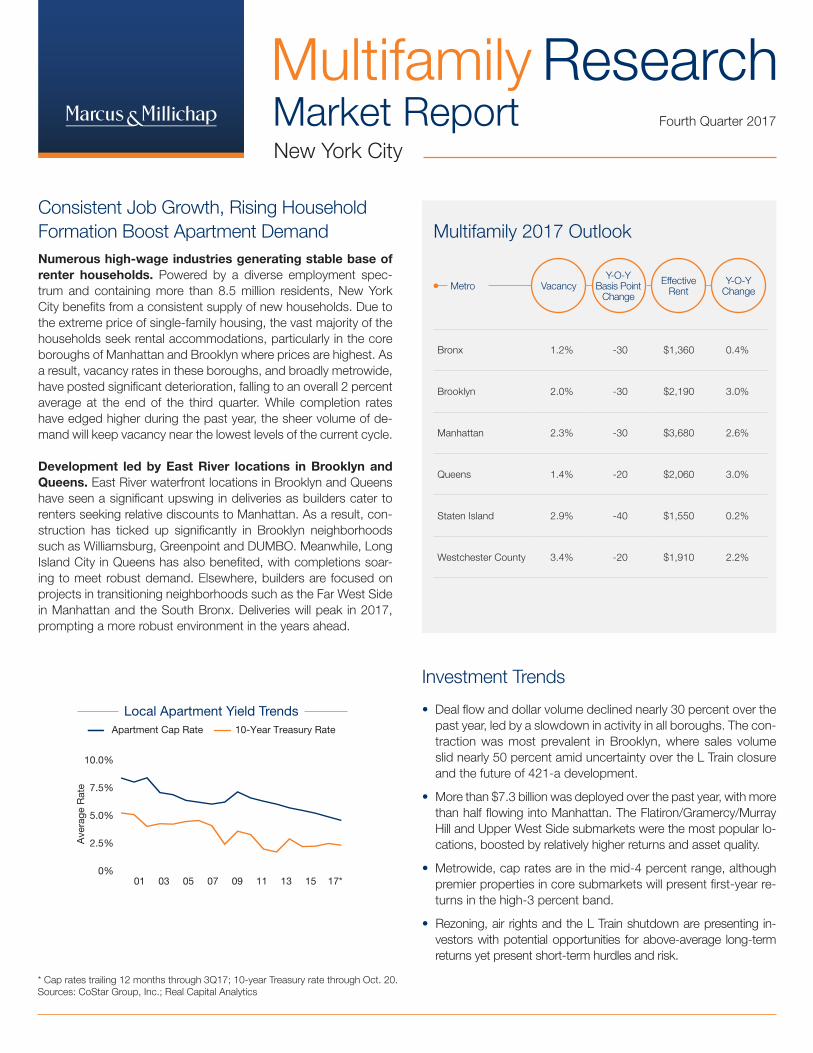
Bronx 1.2% -30 $1,360 0.4%
Brooklyn 2.0% -30 $2,190 3.0%
Manhattan 2.3% -30 $3,680 2.6%
Queens 1.4% -20 $2,060 3.0%
Staten Island 2.9% -40 $1,550 0.2%
Westchester County 3.4% -20 $1,910 2.2%
Consistent Job Growth, Rising Household Formation Boost Apartment DemandNumerous high-wage industries generating stable base of renter households. Powered by a diverse employment spec-trum and containing more than 8.5 million residents, New York City benefits from a consistent supply of new households. Due to the extreme price of single-family housing, the vast majority of the households seek rental accommodations, particularly in the core boroughs of Manhattan and Brooklyn where prices are highest. As a result, vacancy rates in these boroughs, and broadly metrowide, have posted significant deterioration, falling to an overall 2 percent average at the end of the third quarter. While completion rates have edged higher during the past year, the sheer volume of de-mand will keep vacancy near the lowest levels of the current cycle.
Development led by East River locations in Brooklyn and Queens. East River waterfront locations in Brooklyn and Queens have seen a significant upswing in deliveries as builders cater to renters seeking relative discounts to Manhattan. As a result, con-struction has ticked up significantly in Brooklyn neighborhoods such as Williamsburg, Greenpoint and DUMBO. Meanwhile, Long Island City in Queens has also benefited, with completions soar-ing to meet robust demand. Elsewhere, builders are focused on projects in transitioning neighborhoods such as the Far West Side in Manhattan and the South Bronx. Deliveries will peak in 2017, prompting a more robust environment in the years ahead.
• Deal flow and dollar volume declined nearly 30 percent over the past year, led by a slowdown in activity in all boroughs. The con-traction was most prevalent in Brooklyn, where sales volume slid nearly 50 percent amid uncertainty over the L Train closure and the future of 421-a development.
• More than $7.3 billion was deployed over the past year, with more than half flowing into Manhattan. The Flatiron/Gramercy/Murray Hill and Upper West Side submarkets were the most popular lo-cations, boosted by relatively higher returns and asset quality.
• Metrowide, cap rates are in the mid-4 percent range, although premier properties in core submarkets will present first-year re-turns in the high-3 percent band.
• Rezoning, air rights and the L Train shutdown are presenting in-vestors with potential opportunities for above-average long-term returns yet present short-term hurdles and risk.
Investment Trends
Multifamily 2017 Outlook
Vacancy EffectiveRent
Y-O-Y Change
Y-O-Y Basis Point
ChangeMetro
Multifamily ResearchMarket Report Fourth Quarter 2017
New York City
Employment Trends
Yea
r-ov
er-Y
ear
Cha
nge
Borough United States
17*16151413
Uni
ts (t
hous
and
s)
Completions and AbsorptionCompletions Absorption
0%
1%
2%
3%
4%
0
3
6
9
12
17*16151413
Vacancy Rate Trends
Borough United States
Vac
ancy
Rat
e
0%
2%
4%
6%
8%
17*16151413
Rent TrendsMonthly Rent Y-O-Y Rent Change
Mon
thly
Eff
ectiv
e R
ent Y
ear-over-Year C
hange
$3,000
$3,200
$3,400
$3,600
$3,800
0%
2%
4%
6%
8%
17*16151413
Pricing Trends
Ave
rage
Pric
e p
er U
nit
(000
s)
$300
$400
$500
$600
$700
17*16151413
Ave
rage
Rat
e
Local Apartment Yield TrendsApartment Cap Rate 10-Year Treasury Rate
0%
2.5%
5.0%
7.5%
10.0%
17*1513110907050301
* Cap rates trailing 12 months through 3Q17; 10-year Treasury rate through Oct. 20.Sources: CoStar Group, Inc.; Real Capital Analytics

* Forecast
Manhattan
1.9% increase in total employment in 2016
• Manhattan establishments added 47,200 employees during 2016, expanding total employment by 1.9 percent. The borough will create 30,000 positions in 2017, a 1.2 percent growth rate.
• Since the current expansion began in 2009, more than 318,000 positions have been created in the borough, a 14.4 percent rise in total employment.
EMPLOYMENT:
50 basis point decrease in vacancy Y-O-Y
• A slower construction schedule, coupled with net ab-sorption of more than 7,600 rentals, trimmed the vacancy rate to 2.3 percent.
• All submarkets recorded vacancy declines, reversing the previous trend toward marginally higher vacancy rates. The Downtown Manhattan submarket performed best, with vacancy declining 130 basis points to 2.4 percent.
VACANCY:
5,400 units completed Y-O-Y
• Over the past year, the pace of deliveries moderated, sliding from more than 6,100 completions in the previ-ous yearlong period.
• Development has centered on the Chelsea/Far West Side submarket, led by The Eugene at 435 W. 31st St. The 844-unit building contains amenities such as a bas-ketball court and golf simulator.
CONSTRUCTION:
1.4% increase in effective rents Y-O-Y
• The average effective rent ticked up 1.6 percent to $3,569 per month, driven by broad performance throughout the borough. The most affordable rents are in Uptown Man-hattan at $3,111 per month.
• The Downtown Manhattan submarket recorded the fast-est appreciation over the last year, rising 2 percent to $4,195 per month, the highest level in the borough.
RENTS:
CURRENT TRENDS
Employment Trends
Yea
r-ov
er-Y
ear
Cha
nge
Borough United States
17*16151413
Uni
ts (t
hous
and
s)
Completions and AbsorptionCompletions Absorption
0%
1%
2%
3%
4%
0
3
6
9
12
17*16151413
Vacancy Rate Trends
Borough United States
Vac
ancy
Rat
e
0%
2%
4%
6%
8%
17*16151413
Rent TrendsMonthly Rent Y-O-Y Rent Change
Mon
thly
Eff
ectiv
e R
ent Y
ear-over-Year C
hange
$3,000
$3,200
$3,400
$3,600
$3,800
0%
2%
4%
6%
8%
17*16151413
Pricing Trends
Ave
rage
Pric
e p
er U
nit
(000
s)
$300
$400
$500
$600
$700
17*16151413
Ave
rage
Rat
e
Local Apartment Yield TrendsApartment Cap Rate 10-Year Treasury Rate
0%
2.5%
5.0%
7.5%
10.0%
17*1513110907050301
3Q17 – 12-MONTH PERIOD

Multifamily Research | Market Report
SA
LES
TR
EN
DS
• A declining transaction environment has sponsored a significant focus on transitioning neighborhoods or smaller properties in order to boost returns. Broadly, cap rates remain in the high-3 percent band.
• Average prices per unit were in the mid- to high-$600,000 range, driven by sales in Tribeca, East Vil-lage and the Upper East Side.
Outlook: Changes in zoning and air rights are providing new opportunities for investors seeking higher returns, although capital commitments remain high to undertake structural improvements for redevelopment.
Transitioning Neighborhoods Draw Investors Amid Slowing Transaction Environment
SU
BM
AR
KE
T TR
EN
DS
Lowest Vacancy Rates 3Q17
Submarket VacancyRate
Y-O-Y Basis Point
Change
Effective Rents
Y-O-Y %Change
Uptown Manhattan 2.0% -50 $3,111 1.4%
Midtown South Manhattan 2.2% -10 $4,079 0.7%
Downtown Manhattan 2.4% -130 $4,195 2.0%
Midtown Manhattan 3.3% -70 $4,009 1.8%
Manhattan 2.3% -50 $3,569 1.4%
* Trailing 12 months through 3Q17Pricing trend sources: CoStar Group, Inc.; Real Capital Analytics
DEMOGRAPHIC HIGHLIGHTS
50% Own
3Q17 POPULATION AGE 20-34(Percent of total population)
Metro 30%U.S. 21%
50% Rent
FIVE-YEAR POPULATION GROWTH*
24,800
FIVE-YEAR HOUSEHOLD GROWTH*
26,000POPULATION OF AGE 25+
PERCENT WITH BACHELOR DEGREE+**
Metro 37%U.S. Average 29%
3Q17 MEDIAN HOUSEHOLD INCOME
Metro $76,733U.S. Median $58,218
$$
2Q17 TOTAL HOUSEHOLDS✴
✴ NYC Metropolitan Statistical Area**2016* 2017-2022
Employment Trends
Yea
r-ov
er-Y
ear
Cha
nge
Borough United States
17*16151413
Uni
ts (t
hous
and
s)
Completions and AbsorptionCompletions Absorption
0%
1%
2%
3%
4%
0
3
6
9
12
17*16151413
Vacancy Rate Trends
Borough United States
Vac
ancy
Rat
e
0%
2%
4%
6%
8%
17*16151413
Rent TrendsMonthly Rent Y-O-Y Rent Change
Mon
thly
Eff
ectiv
e R
ent Y
ear-over-Year C
hange
$3,000
$3,200
$3,400
$3,600
$3,800
0%
2%
4%
6%
8%
17*16151413
Pricing Trends
Ave
rage
Pric
e p
er U
nit
(000
s)
$300
$400
$500
$600
$700
17*16151413
Ave
rage
Rat
e
Local Apartment Yield TrendsApartment Cap Rate 10-Year Treasury Rate
0%
2.5%
5.0%
7.5%
10.0%
17*1513110907050301
* Forecast
Brooklyn
1.9% increase in total employment in 2016
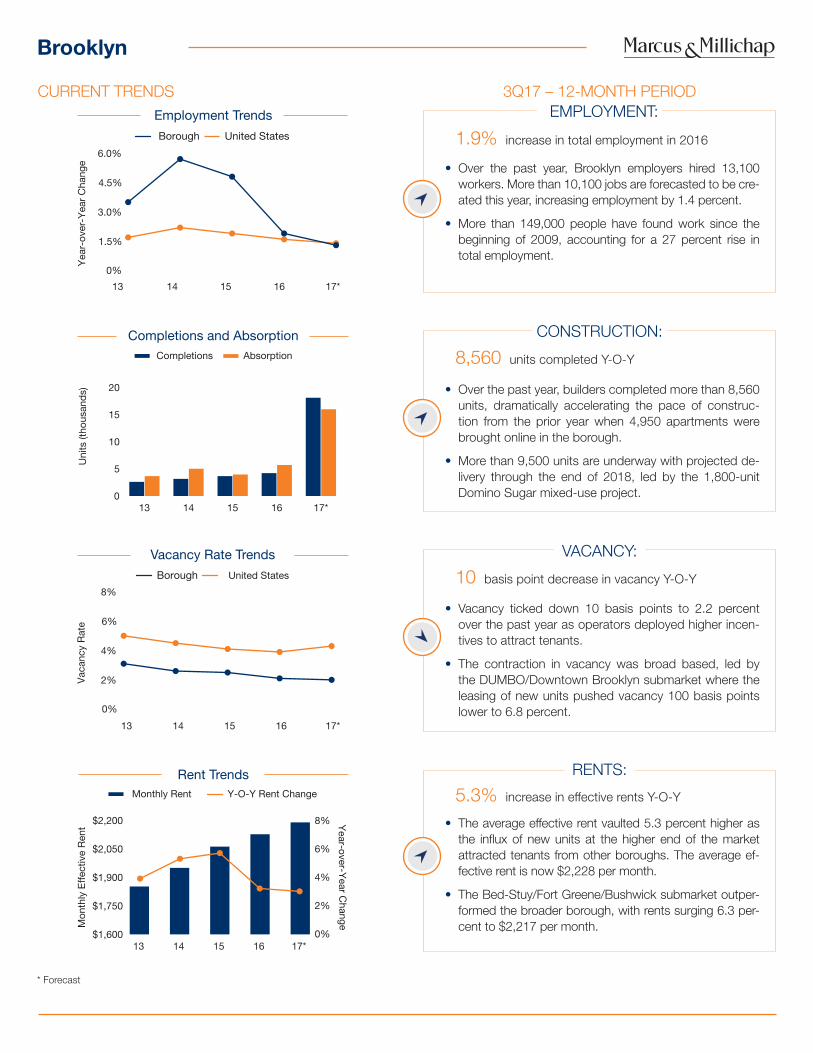
• Over the past year, Brooklyn employers hired 13,100 workers. More than 10,100 jobs are forecasted to be cre-ated this year, increasing employment by 1.4 percent.
• More than 149,000 people have found work since the beginning of 2009, accounting for a 27 percent rise in total employment.
EMPLOYMENT:
10 basis point decrease in vacancy Y-O-Y
• Vacancy ticked down 10 basis points to 2.2 percent over the past year as operators deployed higher incen-tives to attract tenants.
• The contraction in vacancy was broad based, led by the DUMBO/Downtown Brooklyn submarket where the leasing of new units pushed vacancy 100 basis points lower to 6.8 percent.
VACANCY:
8,560 units completed Y-O-Y
• Over the past year, builders completed more than 8,560 units, dramatically accelerating the pace of construc-tion from the prior year when 4,950 apartments were brought online in the borough.
• More than 9,500 units are underway with projected de-livery through the end of 2018, led by the 1,800-unit Domino Sugar mixed-use project.
CONSTRUCTION:
5.3% increase in effective rents Y-O-Y
• The average effective rent vaulted 5.3 percent higher as the influx of new units at the higher end of the market attracted tenants from other boroughs. The average ef-fective rent is now $2,228 per month.
• The Bed-Stuy/Fort Greene/Bushwick submarket outper-formed the broader borough, with rents surging 6.3 per-cent to $2,217 per month.
RENTS:
CURRENT TRENDSEmployment Trends
Yea
r-ov
er-Y
ear
Cha
nge
Borough United States
17*16151413
Uni
ts (t
hous
and
s)
Completions and AbsorptionCompletions Absorption
0%
1.5%
3.0%
4.5%
6.0%
0
5
10
15
20
17*16151413
Vacancy Rate Trends
Borough United States
Vac
ancy
Rat
e
0%
2%
4%
6%
8%
17*16151413
Rent TrendsMonthly Rent Y-O-Y Rent Change
Mon
thly
Eff
ectiv
e R
ent Y
ear-over-Year C
hange
$1,600
$1,750
$1,900
$2,050
$2,200
0%
2%
4%
6%
8%
17*16151413
Pricing Trends
Ave
rage
Pric
e p
er U
nit
(000
s)
$200
$240
$280
$320
$360
17*16151413
3Q17 – 12-MONTH PERIOD

Multifamily Research | Market Report
SA
LES
TR
EN
DS
• The significant construction pipeline weighed on property appreciation over the past year, with prices roughly unchanged near $320,000 per unit. Assets in Williamsburg, Bed-Stuy and Greenpoint represented the bulk of transactions.
• Properties are offering first-year returns in the mid-4 percent range, moving 30 basis points higher or lower depending on asset quality and locations.
Outlook: Premier assets along the East River are gen-erating significant tenant and investor demand. Caution has emerged as a result of the L Train shutdown.
Prices Tread Water Amid Supply Growth; East River Properties Garner Interest
SU
BM
AR
KE
T TR
EN
DS
Lowest Vacancy Rates 3Q17
Submarket VacancyRate
Y-O-Y Basis Point
Change
Effective Rents
Y-O-Y %Change
Ditmas Park/Flatbush 0.60% 0 $1,836 0.70%
Southern SE Brooklyn 0.90% -20 $1,705 3.70%
Crown Hts/Prospect Lefferts Gardens
1.30% -20 $1,540 1.20%
Southwest Brooklyn 1.50% -40 $1,593 2.70%
Bed-Stuy/Fort Greene/Bushwick
2.80% 40 $2,217 6.30%
Park Slope/Prospect Heights
3.60% -20 $2,253 5.10%
Williamsburg/Greenpoint/Navy Yard
4.30% 20 $3,140 2.50%
DUMBO/Downtown Brooklyn
6.80% -100 $3,558 4.60%
Brooklyn 2.2% -10 $2,228 5.3%
* Trailing 12 months through 3Q17Pricing trend sources: CoStar Group, Inc.; Real Capital Analytics
DEMOGRAPHIC HIGHLIGHTS
50% Own
3Q17 POPULATION AGE 20-34(Percent of total population)
Metro 26%U.S. 21%
50% Rent
FIVE-YEAR POPULATION GROWTH*
66,800
FIVE-YEAR HOUSEHOLD GROWTH*
48,000POPULATION OF AGE 25+
PERCENT WITH BACHELOR DEGREE+**
Metro 31%U.S. Average 29%
3Q17 MEDIAN HOUSEHOLD INCOME
Metro $55,126U.S. Median $58,218
$$
2Q17 TOTAL HOUSEHOLDS✴
✴ NYC Metropolitan Statistical Area**2016* 2017-2022
Employment Trends
Yea
r-ov
er-Y
ear
Cha
nge
Borough United States
17*16151413
Uni
ts (t
hous
and
s)
Completions and AbsorptionCompletions Absorption
0%
1.5%
3.0%
4.5%
6.0%
0
5
10
15
20
17*16151413
Vacancy Rate Trends
Borough United States
Vac
ancy
Rat
e
0%
2%
4%
6%
8%
17*16151413
Rent TrendsMonthly Rent Y-O-Y Rent Change
Mon
thly
Eff
ectiv
e R
ent Y
ear-over-Year C
hange
$1,600
$1,750
$1,900
$2,050
$2,200
0%
2%
4%
6%
8%
17*16151413
Pricing Trends
Ave
rage
Pric
e p
er U
nit
(000
s)
$200
$240
$280
$320
$360
17*16151413

QUEENS
STATEN ISLAND
2,900 units completed Y-O-Y
• Construction accelerated over the last year, rising from 2,090 units in the prior year. The Long Island City sub-market was the most active, with more than 1,750 apartments brought to market during the period.
• The 790-rental Eagle Lofts project in Long Island City will be delivered in the latter half of 2017, representing the biggest project underway.
CONSTRUCTION:
67 units completed Y-O-Y
• Developers completed one project over the past year at 533 Bay St., down from 571 rentals in the previous yearlong period.
• The future pipeline remains benign, with one building underway at 5 Bay St. The 116-unit, 13-story offering is slated for a 2019 delivery date.
CONSTRUCTION:
3.7% increase in effective rents Y-O-Y
20 basis point increase in vacancy Y-O-Y
VACANCY AND RENT:
• The average effective rent climbed 3.7 percent to $2,027 per square foot, accelerating rent growth from the previ-ous year, when effective rents rose 3.3 percent.
INVESTMENT HIGHLIGHTS:
• Deal flow moderated over the past year as average prices per unit pushed up to nearly $300,000. Assets in Long Island City garnered the highest prices, reaching above $400,000 per door.
• Cap rates remain in the low-4 percent band, driven by ro-bust demand for apartments and relatively higher returns than offerings in Manhattan and Brooklyn.
• Net absorption of more than 2,350 rentals fell short of development during the past year, pushing vacancy up to 1.8 percent.
4.4% increase in effective rents Y-O-Y
150 basis point decrease in vacancy Y-O-Y
VACANCY AND RENT:
• The average effective rent advanced 4.4 percent to $1,504 per square foot as a lack of optionality and ex-tremely low vacancy prompted higher prices.
• Deal flow contracted significantly over the past year de-spite rapidly improving local fundamentals. No properties over 50 units exchanged ownership, indicating primarily private party and syndicate demand.
• Buyers paid roughly $144,000 per unit on average, ranging from approximately $90,000 to $200,000 per door. Smaller properties dominated local activity.
INVESTMENT HIGHLIGHTS:
• Limited new supply and net absorption that exceeded 350 units prompted a sharp contraction in vacancy, fall-ing 150 basis points to 2.6 percent.
* Forecast
Uni
ts (t
hous
and
s)
Supply and DemandCompletions Vacancy
Vacancy Rate
14 15 16 17*130
2
4
6
8
0%
1%
2%
3%
4%
Absorption
Uni
ts
Supply and DemandCompletions Vacancy
Vacancy Rate
14 15 16 17*130
150
300
450
600
0%
1%
2%
3%
4%
Absorption
Uni
ts (t
hous
and
s)Supply and Demand
Completions Vacancy
Vacancy Rate
14 15 16 17*130
2
4
6
8
0%
1%
2%
3%
4%
Absorption
Uni
ts (t
hous
and
s)
Supply and DemandCompletions Vacancy
Vacancy Rate
14 15 16 17*130
1
2
3
4
0%
1%
2%
3%
4%
Absorption
Uni
ts (t
hous
and
s)
Supply and DemandCompletions Vacancy
Vacancy Rate
14 15 16 17*130
2
4
6
8
0%
1%
2%
3%
4%
Absorption
Uni
ts
Supply and DemandCompletions Vacancy
Vacancy Rate
14 15 16 17*130
150
300
450
600
0%
1%
2%
3%
4%
Absorption
Uni
ts (t
hous
and
s)
Supply and DemandCompletions Vacancy
Vacancy Rate
14 15 16 17*130
2
4
6
8
0%
1%
2%
3%
4%
Absorption
Uni
ts (t
hous
and
s)
Supply and DemandCompletions Vacancy
Vacancy Rate
14 15 16 17*130
1
2
3
4
0%
1%
2%
3%
4%
Absorption
3Q17 – 12-MONTH PERIOD

VACANCY AND RENT:
2,050 units completed Y-O-Y• Development accelerated moderately over the past year,
rising from 1,780 completions in the prior 12 months.
• The pipeline remains elevated, with more than 2,500 rentals underway in the borough. Projects are concen-trated in the South Bronx and Fordham/West Bronx submarkets.
CONSTRUCTION:
900 units completed Y-O-Y
• The pace of construction rose moderately over the last year, accelerating from 745 rentals in the prior year.
• There are more than 900 units currently underway with completion dates through 2018. The Yonkers/Mt. Ver-non/New Rochelle submarket is most active, with more than 400 apartments slated for delivery.
CONSTRUCTION:
WESTCHESTER COUNTY
2.9% increase in effective rents Y-O-Y
20 basis point decrease in vacancy Y-O-Y
• Tightening vacancy contributed to a rise in average ef-fective rents, reaching $1,917 per month, a 2.9 percent increase over the last four quarters.
• Transaction volume remained consistent during the last four quarters, boosted by significantly higher prices and cap rates that are more than 100 basis points above the boroughs of New York City.
• Average prices per unit reached the high-$190,000 range, a substantial boost over the previous yearlong pe-riod. Cap rates remain in the mid-6 percent band.
INVESTMENT HIGHLIGHTS:
• County vacancy ticked down 20 basis points to 2.9 per-cent over the past year as net absorption outstripped supply growth during the period.
1.2% increase in effective rents Y-O-Y
40 basis point decrease in vacancy Y-O-Y
VACANCY AND RENT:
• A high percentage of affordable housing is weighing on effective rent growth, with rents rising 1.2 percent to $1,377 per month on average.
• Dollar volume and transactions activity contracted over the past year, although rapid appreciation pushed av-erage prices per unit to more than $180,000. Proper-ties in the Riverdale/Kingsbridge submarket exceeded $250,000 per unit.
• Cap rates remain in the low-5 percent range, offering more than 100 basis points more than other boroughs.
INVESTMENT HIGHLIGHTS:
• Demand continues to outstrip supply growth, even as construction rises, prompting a vacancy reduction to just 1.1 percent countywide.
BRONX
* ForecastSources: CoStar Group, Inc.; Real Capital Analytics
Uni
ts (t
hous
and
s)
Supply and DemandCompletions Vacancy
Vacancy Rate
14 15 16 17*130
2
4
6
8
0%
1%
2%
3%
4%
Absorption
Uni
ts
Supply and DemandCompletions Vacancy
Vacancy Rate
14 15 16 17*130
150
300
450
600
0%
1%
2%
3%
4%
Absorption
Uni
ts (t
hous
and
s)
Supply and DemandCompletions Vacancy
Vacancy Rate
14 15 16 17*130
2
4
6
8
0%
1%
2%
3%
4%
Absorption
Uni
ts (t
hous
and
s)
Supply and DemandCompletions Vacancy
Vacancy Rate
14 15 16 17*130
1
2
3
4
0%
1%
2%
3%
4%
Absorption
Uni
ts (t
hous
and
s)Supply and Demand
Completions Vacancy
Vacancy Rate
14 15 16 17*130
2
4
6
8
0%
1%
2%
3%
4%
Absorption
Uni
ts
Supply and DemandCompletions Vacancy
Vacancy Rate
14 15 16 17*130
150
300
450
600
0%
1%
2%
3%
4%
Absorption
Uni
ts (t
hous
and
s)
Supply and DemandCompletions Vacancy
Vacancy Rate
14 15 16 17*130
2
4
6
8
0%
1%
2%
3%
4%
Absorption
Uni
ts (t
hous
and
s)
Supply and DemandCompletions Vacancy
Vacancy Rate
14 15 16 17*130
1
2
3
4
0%
1%
2%
3%
4%
Absorption
3Q17 – 12-MONTH PERIOD
Multifamily Research | Market Report
CA
PIT
AL
MA
RK
ETS
The information contained in this report was obtained from sources deemed to be reliable. Every effort was made to obtain accurate and complete information; however, no representation, warranty or guarantee, express or implied, may be made as to the accuracy or reliability of the information contained herein. Note: Metro-level employment growth is calculated based on the last month of the quarter/year. Sales data includes transactions valued at $1,000,000 and greater unless otherwise noted. This is not intend-ed to be a forecast of future events and this is not a guaranty regarding a future event. This is not intended to provide specific investment advice and should not be considered as investment advice.
Sources: Marcus & Millichap Research Services; Bureau of Labor Statistics; CoStar Group, Inc.; Experian; National Association of Realtors; Moody’s Analytics; Real Capital Analytics; MPF Research; TWR/Dodge Pipeline; U.S. Census Bureau
National Multi Housing Group
Visit www.NationalMultiHousingGroup.com
John SebreeFirst Vice President, National DirectorNational Multi Housing GroupTel: (312) [email protected]
Prepared and edited by
Aaron MartensResearch Analyst | Research Services
For information on national apartment trends, contact:
John ChangFirst Vice President | Research ServicesTel: (602) 707-9700 [email protected]
Price: $750
© Marcus & Millichap 2017 | www.MarcusMillichap.com
J.D. ParkerSenior Vice President | Division [email protected]
Manhattan Office:
John KruegerRegional ManagerTel: (212) 430-5100 | Fax: (212) 430-5110 [email protected]
260 Madison Avenue, Fifth FloorNew York, NY 10016
By WILLIAM E. HUGHES, Senior Vice President, Marcus & Millichap Capital Corporation• Monetary policy in transition. Despite the Fed raising its
benchmark short-term rate three times in seven months and signaling another rise before the end of the year, long-term rates have remained stable. The yield on the 10-year U.S. Treasury bond remained in the low- to mid-2 percent range throughout the third quarter of 2017. The Federal Reserve wants to nor-malize monetary policy and, in addition to raising its funds (or overnight lending) rate, has announced it will begin to taper its balance sheet by allowing an initial $10 billion in securities to mature without reinvestment. By reducing its acquisitions of securities, 10-year Treasury rates should drift upward, thereby widening the spread between short- and long-term rates.
• Increase in interest rates over the course of the year, push-ing up the cost of capital. While commercial real estate funda-mentals remain strong, rising costs associated with debt financing will tighten the spread between cap rates and lending benchmarks. This environment could weigh on transaction activity as investors evaluate their yield options. Cap rates have remained relatively sta-ble over the last year, but upward movement in Treasury rates has amplified the expectation gap between buyers and sellers.
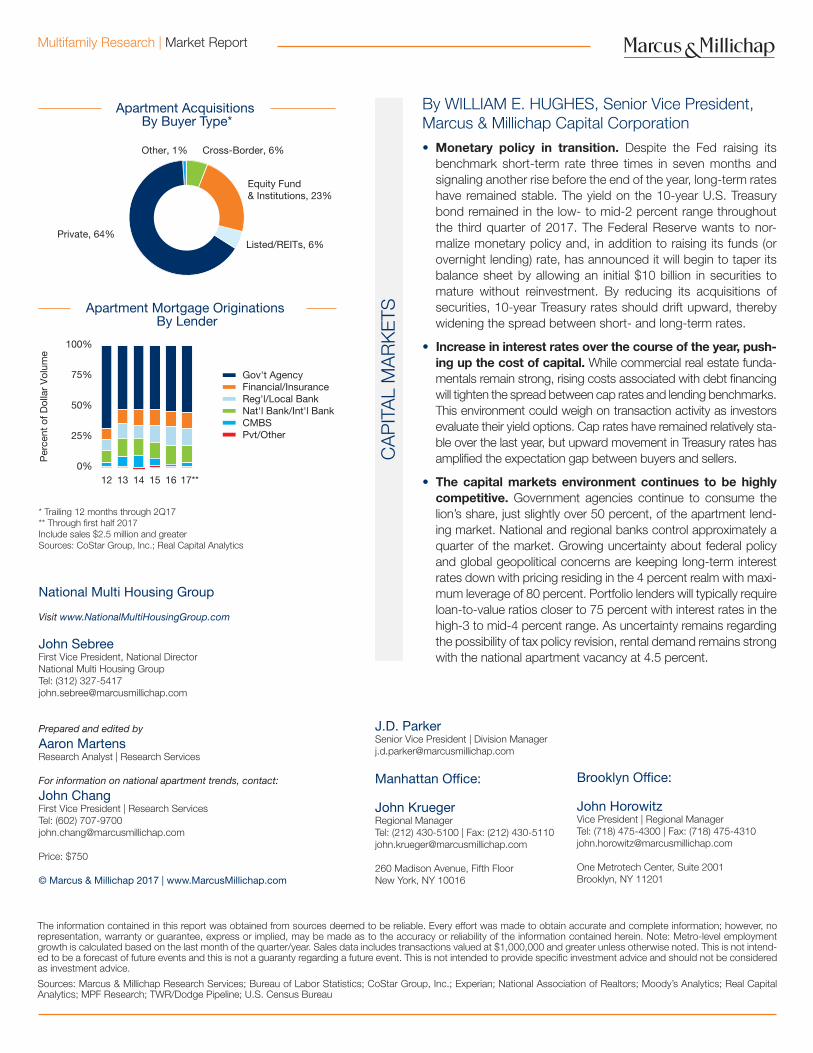
• The capital markets environment continues to be highly competitive. Government agencies continue to consume the lion’s share, just slightly over 50 percent, of the apartment lend-ing market. National and regional banks control approximately a quarter of the market. Growing uncertainty about federal policy and global geopolitical concerns are keeping long-term interest rates down with pricing residing in the 4 percent realm with maxi-mum leverage of 80 percent. Portfolio lenders will typically require loan-to-value ratios closer to 75 percent with interest rates in the high-3 to mid-4 percent range. As uncertainty remains regarding the possibility of tax policy revision, rental demand remains strong with the national apartment vacancy at 4.5 percent.
Per
cent
of D
olla
r V
olum
e
Apartment Mortgage Originations By Lender
Apartment Acquisitions By Buyer Type*
Listed/REITs, 6%
Equity Fund& Institutions, 23%
Other, 1% Cross-Border, 6%
Private, 64%
0%
25%
50%
75%
100%
17**1615141312
Gov't AgencyFinancial/InsuranceReg'l/Local BankNat'l Bank/Int'l BankCMBSPvt/Other
* Trailing 12 months through 2Q17** Through first half 2017Include sales $2.5 million and greaterSources: CoStar Group, Inc.; Real Capital Analytics
Brooklyn Office:
John HorowitzVice President | Regional ManagerTel: (718) 475-4300 | Fax: (718) [email protected]
One Metrotech Center, Suite 2001Brooklyn, NY 11201