multiple choices after school: findings from the extended
TRANSCRIPT

Multiple Choices After School: Findings from the Extended-Service Schools Initiative
Multiple Choices After School:Findings from the Extended-Service Schools Initiative
Jean Baldwin Grossman, Marilyn L. Price, Veronica Fellerath, Linda Z. Jucovy, Lauren J. Kotloff, Rebecca Raley, Karen E. Walker
June 2002

Jean Baldwin Grossman, Marilyn L. Price, Veronica Fellerath,
Linda Z. Jucovy, Lauren J. Kotloff, Rebecca Raley, Karen E. Walker
Multiple Choices After School:Findings from the Extended-Service Schools Initiative
June 2002

Multiple Choices After School: Findings from the Extended-Service Schools Initiative
Board of Directors
Siobhan Nicolau, ChairPresidentHispanic Policy Development Project
Gary WalkerPresidentPublic/Private Ventures
Amalia BetanzosPresidentWildcat Service Corporation
Yvonne ChanPrincipalVaughn Learning Center
Mitchell S. FromsteinChairman EmeritusManpower Inc.
Susan FuhrmanDean, Graduate School of
EducationUniversity of Pennsylvania
Christine L. James-BrownPresidentUnited Way of Southeastern
PennsylvaniaJohn A. Mayer, Jr.
Retired, Chief Financial OfficerJ.P. Morgan & Co.
Matthew McGuireInvestment OfficerOffice of the New York State
Comptroller Milbrey W. McLaughlin
David Jacks Professor of Educationand Public Policy
Stanford UniversityMaurice Lim Miller
DirectorFamily Independence Initiative
Anne Hodges MorganConsultant to Foundations
Jeremy NowakChief Executive OfficerThe Reinvestment Fund
Marion PinesSenior Fellow, Institute for
Policy StudiesJohns Hopkins University
Isabel Carter StewartExecutive DirectorChicago Foundation for Women
Cay StrattonDirectorNational Employment Panel,
London U.K.
Research AdvisoryCommittee
Jacquelynne S. EcclesChairUniversity of Michigan
Ronald FergusonKennedy School of Government
Robinson HollisterSwarthmore College
Alan KruegerPrinceton University
Reed LarsonUniversity of Illinois
Katherine S. NewmanKennedy School of Government
Laurence SteinbergTemple University
Thomas WeisnerUCLA
Public/Private Ventures is a national nonprofitorganization that seeks to improve the effectivenessof social policies and programs. P/PV designs, testsand studies initiatives that increase supports, skillsand opportunities of residents of low-income com-munities; works with policymakers to see that the lessons and evidence produced are reflected in policy; and provides training, technical assistanceand learning opportunities to practitioners based on documented effective practices.

Multiple Choices After School: Findings from the Extended-Service Schools Initiative
Acknowledgments
The Extended-Service Schools Initiative (ESS) and itsevaluation were created and funded by the Wallace-Reader’s Digest Funds. We thank the Funds for theirgenerous support, both financial and in-kind, whichhave made the initiative, the evaluation and thisreport possible. Thomas Brock, Laura Pires-Hester,Ian Beckford, Sheila Murphy and Edward Pauly havebeen enormously helpful for both their good ideasand their willingness to provide assistance whenneeded at various times during the project.
Although there are many people to thank for makingthis report possible, the staffs at the schools whoworked long hours to keep their programs going,facilitate our presence in their communities and col-lect data for this report deserve special thanks. Theyinclude the project directors: Paula Bonell, Mary E.Walsh, Tim Garvin, Allan Stein, Meg O’Leary,Christine Gingerella, Doris Baylor, Rosalie Buzzas,Mary Willoughby, Altha Manning and JacquelynElmore; the school coordinators: Louise Matson, RitaScholl, Matt Kjorstad, Charles Dillard, Hedy Walls,Bill Matthews, Janelle Keyser, Juli Lewandowski, LynnKirsch, Chris Bolin, Kim McKelvey, KennethMcFarland, Elder Willie Ferrell, Russell Newman,Jernell Smith, Carolyn Carson, Aimee Picard, EricaHerman, Nancy Sturgeon and Michael Jones; andthe data clerks at the schools: Fay Holland, MollyCranston, Alphonse Bolden, Maggie Cook, Nate Joy,Latrell Boddie, Doretha Rice, Sonia Castillo, NoraThompson, Liz Warter and Sheila Chandler. In addi-tion, school building and district staffs greatly facili-tated our research by generously opening the doorsof their schools over the past four years. Without allof these individual efforts, this report could neverhave been written.
Our research team involved a wonderful collabora-tion among P/PV staff, MDRC staff and four on-siteresearchers—Kathleen Lord, Emily Harris, JanetMadzey-Akale and Maryrose Dolezal—who did anexpert job of conducting observational assessmentsof program activities and interviews with participat-ing youth and their parents. At MDRC, several peo-ple warrant special thanks. James Kemple’s sageadvice has been critical at every step of the project—the design, implementation, analysis and writing.Alexa Shore worked to gather and analyze the partic-ipation, survey and cost data. Judy Scott expertlymanaged and analyzed this complex data set.Clareann Grimaldi and Jon Vaupel also were instru-mental in the design and implementation of the datacollection system used by the ESS sites that are thefocus of this report.
Many people generously gave their time to read ear-lier drafts of the report and provide us with com-ments. They are Thomas Brock, Glee Holton,Gordon Ambach, Mark Emery, Kathi Grasso, Adrianade Kanter, Betsy Warner, Joy Dryfoos, RobertHalpern, Karen Pittman, Jacqueline Eccles, ReginaldClark, Deborah Lowe Vandell, Joanne Weeks, SharonDuPree, Sheri DeBoe Johnson and Jane Quinn.
At P/PV, Michelle Casino and Audrey Walmsley pro-vided invaluable administrative support. MaxineSherman copyedited the text and guided the reportthrough the design process with Malish & Pagonis,and through its final publication and dissemination.

Multiple Choices After School: Findings from the Extended-Service Schools Initiative
Contents Executive Summary . . . . . . . . . . . . . . . . . . . . . . . . . . . . . . .i
I. Introduction . . . . . . . . . . . . . . . . . . . . . . . . . . . . . . . . .1
II. It Starts With a Vision . . . . . . . . . . . . . . . . . . . . . . . . . .5
III. Who Comes to the After-School Programs? . . . . . . . .11
IV. The Quality of Activities Offered in the Programs . . . .19
V. Benefits to Participants . . . . . . . . . . . . . . . . . . . . . . .29
VI. The Cost and Funding of After-School Programs . . . .35
VII. Conclusions . . . . . . . . . . . . . . . . . . . . . . . . . . . . . . .45
References . . . . . . . . . . . . . . . . . . . . . . . . . . . . . . . . . . .51
Appendices
A. The Extend-Service School Models . . . . . . . . . . . . . . .57
B. Research Overview and Outcome Measures . . . . . . . . .59
C. The ESS Cost Study . . . . . . . . . . . . . . . . . . . . . . . . . .67
Tables
1. Selected Family and Background Characteristics of ESS Participants . . . . . . . . . . . . . . .13
2. Participation in a Typical Semester of ESS, Overall and by Grade . . . . . . . . . . . . . . . . . . . . . . . . .15
3. Youth and Parent Reports: Why Youth Did Not Attend ESS More Often . . . . . . . . . . . . . . . . . . . . . . .17
4. Average Scores on Quality Dimensions for Types of Activities . . . . . . . . . . . . . . . . . . . . . . . . . . . .22
5. Youth and Parent Reports: Staying Out of Trouble . . . .31
6. The Relationship Between ESS and Staying Out of Trouble . . . . . . . . . . . . . . . . . . . . . . . .31
7. Youth and Parent Reports: School Attitudes and Behaviors . . . . . . . . . . . . . . . . . . . . . . . . . . . . . .32
8. The Relationship Between ESS and School Attitudes and Behaviors . . . . . . . . . . . . . . . . .32
9. Youth and Parent Reports: Social Benefits . . . . . . . . . .33
10. Youth and Parent Reports: Skills, Possibilities and Self-Confidence . . . . . . . . . . . . . . . . . . . . . . . . . .33
11. Cost Profile of 10 After-School Programs . . . . . . . . . . .36
12. Range of Component Costs Across 10 After-SchoolPrograms . . . . . . . . . . . . . . . . . . . . . . . . . . . . . . . . .38
Figures
1. Extended-Service Schools Adaptation Sites . . . . . . . . . .4
2. Average Distribution of After-School Program Costs . . . . . . . . . . . . . . . . . . . . . . . . . . . . . .37
3. Average Cash and Non-Cash Expenditures Across 10 After-School Programs . . . . . . . . . . . . . . . . . . . . . .37
4. Average Funding Sources . . . . . . . . . . . . . . . . . . . . . .41
Executive Summary i
Communities across the nation are realizing thatafter-school programs help children become respon-sible, productive citizens of tomorrow, while helpingtheir parents be responsible, productive citizenstoday. As a result, new programs are springing up allover the country. With the passage of the No ChildLeft Behind Act in January 2002, the issue of after-school programming will be on the minds and theagendas of more people than ever before.
This act converted the 21st Century CommunityLearning Centers (21st CCLC) from a federally to astate administered program. Every state is eligible toreceive a portion of the billion dollars appropriatedfor the program, giving all the states a concrete fund-ing opportunity to address the after-school needs ofschool-aged children. With this opportunity willcome the need to make many decisions about thegoals, design and content of the after-school pro-gramming, decisions that will influence which chil-dren and youth participate, what they experienceand how they may benefit. This report aims to putpolicymakers and program operators on firmerground as they make these decisions by sharing les-sons learned about the design and content of exist-ing school-based, after-school programs.
In 1997, amidst the growing interest in after-schoolprograms, the Wallace-Reader’s Digest Fundslaunched the Extended-Service Schools (ESS)Initiative, which supported the creation of 60 after-school programs in 20 communities around thecountry. Each community adapted one of fournationally recognized models that had been success-fully developed and implemented in other citiesaround the country. These models—the Beacon,Bridges to Success, Community Schools and the WestPhiladelphia Improvement Corporation—all seek topromote academic and non-academic developmentof young people during their out-of-school hours,but differ in organizational structure and manage-ment and, to a lesser extent, in programmaticemphasis. At the same time, the models share severalkey features. They all operate their programs inschool buildings; involve partnerships between com-munity-based organizations (and/or universities) andschools; and offer a range of activities to the childrenand youth who participate, including academic andenrichment activities, and sports and recreation. Inaddition, in all four models, the financial resources
Executive Summary
ii Multiple Choices After School: Findings from the Extended-Service Schools Initiative
are under the control of the partnering organizationrather than the school.
As a result of this “sameness” within variation, ESSprovided an almost unique opportunity to identifyand examine overarching issues involved in providingopportunities to youth in their after-school time—issues that transcend local context and the formal ele-ments of specific models. In particular, the ESSinitiative allowed a focus on four central questions:
• Which children and youth came to the after-school programs? Why did they come? Were theprograms attracting the young people whocould most benefit from participation?
• What were the characteristics of high-qualityactivities in these programs—activities that pro-moted the positive development of the childrenand youth who attended?
• What benefits did the children and youth gainfrom participation?
• What was the cost to operate the after-schoolprograms, and what were the ways to financethem?
Starting in May 1998, Public/Private Ventures(P/PV) and the Manpower Demonstration ResearchCorporation (MDRC) began the evaluation of thislarge-scale initiative. We used a multi-methodapproach designed to provide both an understand-ing of the breadth of programming experiences andthe ability to more deeply delve into particular issues.To learn about the activities of all the ESS programs,we asked all the school site coordinators and city-level program directors to complete annual organiza-tional surveys summarizing what their programs weredoing. To gain deeper insight into individual sitesand learn about promising practices, we conductedmultiple in-depth site visits to 10 cities during 1999-2000, interviewing staff, partners, students, parentsand key city officials.
We also intensively focused on programs in a total of10 schools in six of these cities. During 2000-2001, wecollected computerized attendance records fromthose programs and gathered cost data. We adminis-tered a baseline questionnaire to fourth- to eighth-grade students between Fall 1999 and the end of2000 as they enrolled in the program or theresearch. In Spring 2001, we administered a follow-up survey to fourth- to eighth-grade students who
had ever enrolled in ESS and were still in the school(although not necessarily currently participating inESS). A telephone survey of a sample of those stu-dents’ parents was also conducted to learn about theprogram from their perspective. And, finally, in 3 ofthe 10 schools, we conducted multiple observationsof the after-school activities.
What Have We Learned?
We found that, across all of the sites, the school-based, after-school programs could be put in placefairly quickly. It typically took from six to ninemonths for programs to find organizational partnersand staff, assess community needs, pool additionalcommunity and financial resources, identify activityproviders and recruit participants. The initial plan-ning time was critical and, importantly, the ESS pro-grams each received a grant of $25,000 to $50,000, aswell as technical assistance, to help support thisprocess. Over the next three years, the programsmatured and demand for their services grew.Programs became better able to identify and addresscore goals, honed their recruiting strategies and, forthe most part, developed strong relationships withtheir host schools. They also began to more directlyfocus on addressing program quality, rather than justprogram provision. Still, they continued to face oper-ational challenges. These included funding con-straints, staff shortages and retention, and difficultyin creating and implementing approaches for moni-toring and assessing program quality.1
The remaining pages of this executive summaryfocus on key findings from the 10 intensive-study,after-school programs.
Who Participated?
1. Demand for the programs was substantial.Parents enrolled their children in large num-bers. Among the 10 programs we intensivelystudied, eight considered themselves to be oper-ating at capacity—serving as many students asthey could within their available resources—bytheir second year of operations. In fact, interestin the after-school programs was so high, rela-tive to available resources, that three of thoseprograms capped their enrollments; and one
Executive Summary iii
program, in its effort to meet the demand forregistration, limited the number of days a weekfor which each youth could register. Across theeight sites that collected participation data onall youth who were enrolled in ESS, slightlymore than half of the schools’ total populationswere attending the after-school programs.
2. On average, students participated in ESS for 20days in a typical semester. They also tended toparticipate over an extended period of time,not just a single semester.Students who enrolled in ESS attended slightlyunder two days each week, on average. Whilethis participation rate could suggest that stu-dents might not be attending often enough forprograms to achieve their goals of strengthen-ing youth’s academic and social skills, it isimportant to understand that many of the par-ticipants attended these programs over anextended period of time. More than a third(35%) of the enrollees participated all foursemesters that were covered by this study and,overall, 84 percent participated in two or moresemesters. These participation patterns suggestthe possibility of a cumulative effect of lessintensive participation over time. In addition,for many youth, ESS was only one aspect oftheir participation in organized after-schoolactivities, and those other activities also have thepotential of providing supports and opportuni-ties for positive development.
3. Higher-needs students and older youth weremore difficult to attract to the after-school programs.In ESS, as has also been found in other after-school programs, younger children attendedmore frequently than older youth. In addition,the students who were most easily recruited forthe program tended to be those who werealready “joiners.” As the programs developed,staff began to more specifically target some oftheir recruitment strategies toward attractingthe most high-needs youth—the “non-joiners”—students who were failing courses, were disen-gaged from school and had behavior problems.However, the challenges of attracting andretaining older and higher-needs studentsremained an ongoing issue for the programs.
4. Programs that required registration for agreater number of days per week were able tomore intensively serve participants, but thoseprograms served fewer students overall.Required four- or five-day-a-week enrollmentincreased both the number of scheduled daysand days attended, but allowing youth to regis-ter for only a few days a week meant that pro-grams could serve greater numbers and,perhaps also, more diverse groups of youth. TheESS programs also found that required five-day-a-week enrollment resulted in low attendancerates unless they had a well-articulated andenforced attendance policy.
What Was the Quality of the After-SchoolActivities?
1. The ESS activities were, on the whole, welldesigned and well implemented; and differentkinds of activities provided opportunities foryouth to develop in different areas.Among the 30 activities that we observed, allbut two provided at least some developmentalsupports and opportunities for youth, althoughthe types of supports varied. Academic activitieslike homework help and tutoring are a “given”in school-based, after-school programs, andwhen done well, they provide youth with strongadult support that is valuable even beyond theactivities’ immediate purpose of building aca-demic skills. Among the ESS programs, how-ever, the enrichment activities provided youthwith the richest environment for positive devel-opment. In addition to fostering strong adult-youth relationships, they provided opportunitiesfor cooperative peer interaction and collabora-tive learning, and for youth to develop decision-making and leadership skills. A number of theseactivities also incorporated such academic skillsas writing, math and problem solving.
2. It was not the topic or skill that was beingaddressed, but the ability of the staff memberleading the session that was the key to high-quality activities.While youth came to the activities with some ini-tial interest in them, that interest was mostlikely to be heightened and sustained when spe-cific practices were in place. These included the
iv Multiple Choices After School: Findings from the Extended-Service Schools Initiative
activity leader’s ability to create a positive socialenvironment, where both adult-youth and peerrelationships were warm and friendly, and a sup-portive but challenging intellectual environmentwhere the adult actively motivated youth,pushed them to achieve beyond their (theyouth’s) initial expectations, encouraged themto persevere and praised their accomplishments.It did not seem to matter whether the activityleader was a youth worker from a community-based organization (CBO) or a teacher from theschool. Teachers could be as warm and respon-sive to youth as were experienced staff fromCBOs, and the latter were just as successful ininstructing youth as were the teachers.
What Were the Benefits to Participants?
1. Participation in school-based, after-school pro-grams was associated with behavior that couldhelp youth stay out of trouble.One key goal of after-school programs is to pro-vide youth with productive ways to use their out-of-school time and, thus, reduce theiropportunities for risk-taking behavior. Our find-ings are consistent with ESS having this effect.Youth who attended the after-school programsreported less often that they had started drink-ing alcohol, and indicated more often thanyouth who did not attend ESS that they handledtheir anger in socially appropriate ways.
2. Participation in the after-school programs wasassociated with positive effects on school atti-tudes and behaviors, but it is too early to knowwhether it has an impact on students’ gradesand test scores.A second important goal of after-school pro-grams is improved academic outcomes foryouth. Because most of the ESS programs werenew and students participated, on average,fewer than two days a week and only for a year,we did not expect to find changes in grades.Thus, we instead examined indicators of aca-demic improvement, such as youth’s sense ofcompetence in school and their level of effort.We found that youth who attended ESSreported more often that they really paid atten-tion in class and were very proud to belong totheir school, and they less often reported that
they had started skipping school during theperiod between the baseline and follow-up surveys.
It is important to note that some of theapparent benefits associated with risk-takingbehavior and school attitudes may reflect thefact that better-behaved and more academicallyinclined students participate in school-based,after-school programs. However, in the tele-phone survey, 80 to 90 percent of parentsagreed with statements that ESS was helpingtheir child make new friends and get along bet-ter with their peers, stay out of trouble, likeschool more and try harder in school, learnnew skills and become more self-confident.
How Much Did the Programs Cost?
1. The costs were reasonable but varied considerably.The 10 intensive-study ESS programs cost, onaverage, approximately $150,000 per schoolyear (excluding the use of the space) to serve63 youth each day after school for five days aweek. This translates into an average cost perday per youth slot of about $15 when all activi-ties were in session. Among the 10 programs,however, this cost ranged from $8 to $36. Thisrange resulted from a variety of factors, includ-ing requirements of the community setting (forexample, the need to provide transportationhome for participants at the end of the day);the programs’ administrative structure; thekinds of activities offered and the staff-to-youthratio; and investment in such factors asfundraising and the future sustainability of theprogram.
2. Schools and school districts were essentialsources of support.Both school districts and individual schools thathosted the programs made important cash andredirected (non-cash) contributions. In the 10intensive-study ESS sites, these partners con-tributed, on average, more than 20 percent ofthe cost of the program, including some or allof the cost of transportation, custodial assis-tance and snacks for participants. This contribu-tion was in addition to the rent-free use of theschool building.

Executive Summary v
3. About 60 percent of the programs’ budgetneeds were funded by cash grants. Raising thesefunds to sustain the programs over timeremains challenging for the sites.The cash budget is the core of the program—itpays the salaried staff who administer the pro-gram and leverage the redirected contributionsfrom schools, CBOs and other partners. For theESS sites, a large percentage of their cashbudget came through support from theWallace-Reader’s Digest Funds. Sustaining theprograms over time, after this initial fundingends, is likely to be an ongoing challenge.Strong leadership—whether it comes from aCBO, the school district or another partneringorganization—will be a key to success. Thus far,several strategies have seemed promising: start-ing out the initiative in the Bridges to Successmodel, which has funding from the UnitedWay; having strong lead agencies for whom theESS initiative fits a need; and developing strongpartnerships with other providers and funders.Some sites have collaborated with other youth-serving initiatives to work toward the ultimategoal of dedicated state funding, but this is along-term strategy. More immediately, they arelikely to have to rely heavily on local resourcesfor youth programs, and the availability of thoseresources varies across cities.
What are the Policy Implications ofthese Findings?
1. Locating the programs in schools serving low-income families was an effective means of tar-geting low-income children. However, specialefforts are required if programs are going to beable to attract older youth and the most high-needs students in those schools.In ESS, participants reflected the demographicsof their schools. Across the sites, the childrenand youth were overwhelmingly low-income,with almost three-quarters eligible for free orreduced-price lunch. However, while locatingprograms in schools where students have identi-fiable needs can go a long way toward effec-tively targeting services, the sites found thatengaging older and higher-needs youth was achallenge. It seems likely that after-school
programs, in general, would benefit from moreinformation on attracting and serving thesepopulations.
2. Choices about program requirements and con-tent influence which children and youth enrollin the after-school activities and how often theyattend.
Program characteristics affect participation pat-terns. At the ESS sites, planners had to makedecisions about the goals and design of theirprograms that ultimately had an effect on whichchildren and youth chose to participate andhow often they attended. These decisionsinevitably involved some trade-offs. For exam-ple, planners who decided that the programshould serve, in part, as child care for parentswere more likely to require, or at least allow,five-day-a-week enrollment. However, programsthat designed their activities in a more flexiblemanner (for example, art on Mondays, judo onTuesdays, etc.) and permitted registration forfewer days per week touched the lives of largernumbers of youth and may have attracted youthwith more diverse interests. In addition, moreflexible programs are likely to be more attrac-tive to older youth and those who want to par-ticipate in other activities, such as sports.
Survey responses of ESS participants andtheir parents suggest that there are no easyanswers for program planners as they maketheir decisions. Substantial proportions of boththe youth and parents said the youth did notattend ESS more often because they had otherthings to do elsewhere. Some of these youthand their parents did not want to commit tomore intensive participation in a single pro-gram. At the same time, however, a significantnumber of parents said that restrictive enroll-ment policies limited the amount of time theirchildren might otherwise have participated inESS. Clearly, no approach serves the needs ofevery child or parent equally well, but the find-ings emphasize that planners could benefit bygetting input from their communities.

vi Multiple Choices After School: Findings from the Extended-Service Schools Initiative
3. To provide a range of developmental supportsand opportunities to children and youth, after-school programs should offer a variety of activi-ties staffed by skilled leaders.Activities of all types—be they academic, enrich-ment, community service or sports—can pro-vide children and youth with valuabledevelopmental supports and opportunities. Byparticipating in a range of challenging andinteresting activities, young people have thechance to develop new skills and interests, buildpositive and supportive relationships with adultsand peers, and develop a sense of matteringthrough making decisions and taking on leader-ship roles. Staff practices and behaviors are thecritical ingredient. Staff in high-quality activitiesset up physically and emotionally safe environ-ments in which they heighten and sustain theyouth’s interest, making the activity challenging,as well as promoting learning and self-discoveryin multiple areas (academic, social, personal).And yet, low wages and part-time hours drivenby too-tight budgets, along with the limited sup-ply of qualified youth workers, combine tomake staff shortages and retention one of thelargest continuing challenges for after-schoolprograms.
4. Cost depends as much on program choices,opportunities and local conditions as on thenumber of children served.The cost per youth slot per day ranged from $8to $36 across the 10 intensive-study programs,suggesting that there is no one “right” cost ofan after-school program. In fact, the cost ofindividual after-school programs depended on anumber of factors, including decisions aboutthe types of activities provided, the staff-to-youthratio, and the extent of investment in such fac-tors as fundraising and the future sustainabilityof the program. Looking across programs at ahigh or low level of expenditures in each ofthese areas, policymakers and practitionersshould ask, “What does the program and thecommunity gain from higher expenditures?”;and, “What does the program and the commu-nity do without by holding expenditures at thelow end of the range?”
5. As after-school programs multiply, the challengeof raising both cash and non-cash funding islikely to increase as more programs competefor limited resources.The experience of the ESS sites suggests thereare challenges involved in finding sustainablesources of cash funding. While policymakersacknowledge the need to subsidize after-schoolprograms in poor communities (as evidencedby the 21st CCLC funds, some state and localfunds, and much philanthropic support), thecurrent system still requires programs to liveyear to year scrambling for funds. There are fewlong-term and stable financial resources forafter-school programs.
While much of the focus on planning andsustaining programs tends to be on raising cashfunding, the non-cash portion of the budgetcannot be taken for granted. Across the 10intensive-study programs, 40 percent of thebudget, on average, was obtained through con-tributions from partner organizations. However,as after-school programs grow to scale, this formof support is likely to become more tenuous.For example, while school district contributionsto the after-school programs grew over thecourse of the initiative, districts in several of theESS cities felt the pressure of providing “free”services without additional income. A similardilemma exists for CBOs. Currently, manyCBOs share their resources with fledgling after-school programs. However, CBOs’ resources arelimited. While the marginal cost of contributingto one after-school program may be small, con-tributing to many after-school programs in a citywould require expanded resources for CBOs.
6. Policymakers need to shift their thinking fromcreating the program to expanding the set ofoptions available in a community.As children become older, they begin to searchfor a wider range of experiences. This expan-sion in their worlds is developmentally appro-priate, but it means that the participation ratesof older youth in any particular program—be itESS or something else—will likely be relativelylow. They are most likely to benefit if they, andtheir parents, are able to put together a mosaicof positive experiences—broadening the rangeof activities, widening their geographic hori-zons, and increasing their network of adults and
Executive Summary vii
peers. If there are several opportunities in theircommunity that attract them, they can still bewell served even though no one program seemsto be engaging them intensively. As a recentlyreleased National Academy of Science reportemphasizes, “The diversity of young people,their particular needs and their surroundingenvironments argue against the notion that asingle [type of] program will fit all situations.”2
Given the increasing challenges to children’s livesand the increasingly more complex sets of skills andabilities that are required for success in the work-place of the twenty-first century, we need to revisithow and where we make investments in our nation’schildren. This report has examined one type ofinvestment—school-based, after-school programs runby CBOs in collaboration with schools. We foundthat these programs, which are not strictly academic,appear to help participants work on many of thecompetencies they will need for their future. Whenwell planned and implemented, such programs canbe a substantial option within a potentially larger net-work of diverse programming that provides a rangeof opportunities for all children and youth.
Endnotes1. The ESS sites’ planning and early implementation experiences are
examined in Extended-Service Schools: Putting Programming in Place.Karen E. Walker, Jean Grossman and Rebecca Raley. Philadelphia:Public/Private Ventures, December 2000.
2. Jacquelynne Eccles and Jennifer A. Gootman. Community Programsto Promote Youth Development. Washington, D.C.: National AcademyPress, 2001.

viii Multiple Choices After School: Findings from the Extended-Service Schools Initiative

Introduction 1
I. Introduction Since the mid-1990s, there has been rapidly increas-ing public attention to after-school programming.The most visible federal effort, the 21st CenturyCommunity Learning Centers (21st CCLC), hasgrown from $40 million in 1998 to the billion dollarssigned into law in January 2002. State legislatureshave also been quite active. During the past fewyears, legislatures collectively created 215 statutesthat support out-of-school-time initiatives, and almosttwo-thirds of states directed state funds to localschool districts to support after-school programs.1 Asof this year, all states will become involved with after-school programs because the 21st CCLC funds willnow be awarded and administered by state educationagencies.
Why has there been this explosion of public interestin after-school programming? First, the compositionof the workforce has changed over the last genera-tion. There are now more than 50 million workingparents. When their children were preschool ages,they created strong political pressure for the govern-ment to provide child care and preschool funding.Now their children are in school—and in recordnumbers. In 1999, the number of children enrolledin school returned to its all-time high of 49 million(set in 1970), and enrollment growth is expected tocontinue.2
Thus, it is not surprising that 8 in 10 voters believethat organized after-school programs are a necessityin their communities, and two-thirds of voters saythey are willing to pay $100 more per year in statetaxes to help fund the programs. These parentsemphasize that they want their children to be in asafe environment and involved in constructive activi-ties with adult supervision.3 Policymakers share thoseconcerns. Research suggests that when young peopleare on their own without an adult presence duringthe after-school hours, they are less safe, more vul-nerable to becoming victims or perpetrators ofcrime, and more likely to become engaged in suchhigh-risk activities as experimenting with alcohol,drugs and sex.4
A second powerful force stimulating interest in after-school time is the significant pressure that schools,public officials and politicians have felt to improvestudent performance. Many school districts havebeen eliminating “social promotion” policies andimplementing stricter academic standards in their
2 Multiple Choices After School: Findings from the Extended-Service Schools Initiative
place. The recently passed federal legislation, the“No Child Left Behind Act,” reflects this concern.Among other things, it mandates annual testing inreading and math for students in grades 3 through 8,and offers rewards for schools where students suc-ceed on those tests and the possibility of sanctionsfor schools where students fail.
While, traditionally, schools have educated andsocialized children without working closely with oth-ers in the community, they are rapidly realizing thatthey alone cannot achieve the desired educationalgoals. The needs of the children that schools servehave substantially grown over the last generation.The changing nature of the workplace is demandingthat students develop skills far beyond reading andmath, including strong communication and problem-solving skills and the ability to work well in teams andto show leadership. At the same time, more childrenare coming to school with more problems that makeit difficult for them to learn. Faced with overcrowdedclassrooms, mandates to meet required curricularguidelines, and a myriad of learning and behavioralneeds among their students, teachers have littleopportunity to give these children the kind of one-to-one attention that is necessary if they are going to beable to master concepts, develop self-confidence andexperience success in school.
For years, parents who could afford it, and who hadaccess, used local youth programs—enrichment activ-ities, clubs, sports teams and faith-based youthgroups—to help support their children’s develop-ment. Now, parents and the general public areincreasingly seeing after-school programs not assomething extra, but as an essential support foryoung people as they grow and develop. Schoolbuildings would seem a natural location for theseprograms. They are situated in the communities, andtheir facilities—gyms, classrooms, auditoriums,libraries and computer labs—are appropriate for awide range of activities. In addition, being located inschools would provide programs with ready access topotential participants and offer legitimacy to parentswho might feel hesitant about allowing their childrento participate in programs elsewhere.
The Extended-Service Schools Initiative
In 1997, amidst this growing interest in after-schoolprograms, the Wallace-Reader’s Digest Fundslaunched the Extended-Service Schools Initiative(ESS), which supported the creation of 60 after-school programs in 20 communities around thecountry. Each community adapted one of fournationally recognized models that had been success-fully developed and implemented in other citiesaround the country.
The models—Beacon, Bridges to Success,Community Schools and West PhiladelphiaImprovement Corporation (WEPIC)—all seek to promote the well being and positive development ofyoung people in their out-of-school hours, but theydiffer in organizational structure and managementand, to a lesser extent, programmatic emphasis. Atthe same time, these models share three commonfeatures. They all:
• Operate their programs in school buildings.• Involve partnerships between community-based
organizations (and/or universities) and schools.The financial resources are under the controlof the partnering organization rather than theschool.
• Offer a range of activities to the children andyouth who participate, including academic andenrichment activities, and sports and recre-ation.
(See Appendix A for a description of each model.)
While they vary in structural and even philosophicalways, the models, thus, share essential common ele-ments. The ESS programs built from these modelsincorporate these commonalities and differences and,in addition, vary widely in size and location. As a resultof this “sameness” within variation, ESS provides analmost unique opportunity to identify and examineoverarching issues involved in providing opportunitiesto youth in their after-school time—issues that tran-scend local context and the formal elements of spe-cific models. In particular, the ESS initiative allows afocus on the following central questions:
• Which children and youth come to after-schoolprograms? Why do they come? Are the

Introduction 3
programs attracting the young people whocould most benefit from participation?
• What are the characteristics of high-qualityactivities in these programs—activities that pro-mote the positive development of the childrenand youth who attend?
• What benefits do the children and youth, andtheir families, gain from participation?
• What is the cost to operate after-school pro-grams and what are the ways to finance them?
Answers to these questions will be most directly appli-cable to after-school programs that share the featurescommon to the ESS sites: programs that are school-based and led by a community-based organization(or university) in partnership with a school, and thatoffer a range of academic and other developmentalactivities to participants. However, much of the dis-cussion should also be useful in considering othertypes of after-school programs, whether they are runby the schools themselves in their buildings oroffered by community-based organizations (CBOs) incommunity centers.
The ESS Evaluation
Starting in May 1998, Public/Private Ventures(P/PV) and the Manpower Demonstration ResearchCorporation (MDRC) began the evaluation of thislarge-scale initiative to provide practitioners, fundersand policymakers with a rich set of lessons about howlocal, school-based collaborations unfold and whatthey do. The evaluation used a multi-methodapproach designed to provide both an understand-ing of the breadth of programming experiences andthe ability to delve more deeply into particular issues.(See Appendix B for a complete description of theresearch methodology.)
To learn about the activities of all the ESS programs,we asked all the school site coordinators and city-level program directors to complete annual organiza-tional surveys summarizing what their programs weredoing. To gain deeper insight into individual sitesand learn about promising practices, we conductedmultiple in-depth site visits to 10 cities during 1999-2000, interviewing staff, partners, students, parentsand key city officials.
We also focused intensively on a total of 10 programsin six of these cities, where we made additional visitsduring 2000-2001. We collected computerized atten-dance records from the programs; gathered costdata; and administered a baseline questionnaire toall fourth- through eighth-grade students betweenFall 1999 and the end of 2000 as they enrolled in theprogram.5 In Spring 2001, we administered a follow-up survey to fourth- through eighth-grade studentswho had ever enrolled in ESS and were still in theschool (although not necessarily currently participat-ing in ESS). A telephone survey of a sample of thosestudents’ parents was also conducted to learn aboutthe program from their perspective.
Lastly, in three of those 10 schools, we conductedmultiple observations of the activities and open-ended interviews with 30 child-teacher-and-parent tri-ads to collect in-depth information about the qualityof the activities and the ways the program fit into thelives of children (see Figure 1, for the locations ofthe ESS programs and the locations of the six citieswhere we conducted the intensive research.)
The Organization of this Report
Two previous reports discussed early findings fromthe evaluation, focusing on the ESS sites’ planningand early implementation periods, and their initialchallenges and accomplishments.6 This reportfocuses on the experiences “on the ground” of thestill young but maturing programs.
The next chapter, Chapter II, draws on informationfrom across all of the ESS sites to provide back-ground information about the after-school programs.The following chapters more sharply focus on the 10programs which we examined in greater depth.Chapter III describes who participated in the pro-grams, how often they came and why. Chapter IVlooks closely at the activities offered in three of thoseprograms in order to describe qualities of partici-pants’ after-school experiences that most likelyappear to contribute to positive youth development.Chapter IV also discusses the ways in which, andextent to which, those qualities were manifested inthe after-school activities we observed.

4 Multiple Choices After School: Findings from the Extended-Service Schools Initiative
Chapter V discusses benefits to the children andyouth who participated in the after-school activities atthe 10 intensive research sites. Chapter VI examinesthe costs and funding of those programs, as well asstrategies the sites are using to develop funding tosustain their programs into the future. A final chapteroffers conclusions and a discussion of lessons learned.
Figure 1:Extended-Service Schools Adaption Sites
Beacons
Denver. COMinneapolis, MN*Oakland, CASavannah, GA*
Bridges to Success
Flint, MIMissoula, MT*Greensboro,NCPhiladelphia, PAJacksonville, FLCentral falls, RI*Mesa, AZ
Community Schools
Boston, MA*Long Beach, CASalt Lake City, UT
WEPIC
Albuquerque, NMAtlanta, GAAurora, CO*Birmingham, ALDenver, COLexington, KY
* Indicates cities where the 10 intensive research ESS programs are located.

It Starts With a Vision 5
II. It Starts With a Vision It used to be that anyone walking into a school at 2:30p.m. would see students and teachers finished for theday and preparing for a mass exodus. But now, inschools across the country, the afternoon bell marksnot an end, but the beginning of an extended day.
At 2:30 p.m., a visitor who steps inside one of the 60schools hosting ESS programs—in this particular case,a middle school—might see students flooding out intothe hallways, their noise level marking the end of theirtraditional school day. Some quickly head for home,but many others remain. These students make briefstops at their lockers and then head for the schoolcafeteria, where they pick up a healthy snack andcheck-in with their friends for a few minutes.
From 3 to 4 p.m., the students are back on task. Fiftystay in the cafeteria to participate in Power Hour, atime for finishing homework with the help of work-study students from the local university. Othersreturn to their classrooms for tutoring. Working withtheir school-day teachers, who are paid extra to staylate, small groups of four to seven students receivethe focused attention they need to master the con-cepts that have been introduced during the schoolday. Today, an additional 10 students are exemptfrom homework time because they have theirmonthly Youth Council meeting. The council’sagenda includes discussions about advertising fortheir upcoming community clean-up day of serviceand brainstorming to generate fundraising ideas forfinancing pizzas at their proposed teen dance night.
At 4 p.m., students in each of these groups againshift gears to spend the following hour in a fun activ-ity of their choice. In one room, 18 students join theGame Club instructor to play chess, backgammonand monopoly. In the gym, an athletic instructorfrom the local YMCA helps students organize intoteams and begin a lively game of flag football.
At the same time, in the school’s home economicsroom, girls who are both new to the school and newto the country participate in what they call theirSweet 13 Club. Designed by program staff who recog-nized the challenges of assimilation faced by theschool’s population of new immigrants, the clubgives the girls an opportunity to make food, craftsand jewelry, as well as share in conversations abouttheir transition experiences.
6 Multiple Choices After School: Findings from the Extended-Service Schools Initiative
Other offerings today include a Computer Club,Science Club and Drill Team. The Drill Team is espe-cially popular—participants are working on a routinefor the end of the year Family Showcase, a nightwhen family members are invited to the school to cel-ebrate their children’s accomplishments.
It is 5 p.m. when the students finally pack their bagsand head outside to catch the school’s late bus homeor wait for parents to pick them up. And while theESS programs are all different in the specific pro-gramming they offer, they do, across the sites, pro-vide similar kinds of constructive activities within thesafe and familiar environments of school buildings.
The following pages present an overview of thoseprograms across all of the ESS sites. To provide acontext for the discussions in the remainder of thereport, this chapter briefly describes what wasinvolved in getting the programs started, their goalsand offerings, the roles of partners and key staff, andhow the programs have matured over time.7
How Were the After-School ProgramsStarted?
The after-school programs began with a vision, a rela-tively small amount of money, committed partnersand a lot of persistence. Initial planning time wascritical. The ESS programs each received a grant of$25,000 to $50,000 for a six- to nine-month planningperiod that allowed them to convene partners, assesscommunity needs, strengthen relationships acrossorganizations, pool additional community and finan-cial resources, and make early decisions about pro-gram implementation. Once implemented, programsoperated the first year on an additional $80,000 to$300,000.
Technical assistance can facilitate program start-upand implementation; and, importantly, all of the ESSprograms received technical assistance as part oftheir involvement in the initiative. The organizationsthat had originally developed each of the four mod-els essentially acted as management consultants, shar-ing after-school resources with cities and helping toaddress specific concerns.8 At the request of a pro-gram partner, staff from these organizations wouldvisit programs, assess operations and make recom-mendations about how to address challenges. During
the planning stage, they also gave local ESS plannersthe opportunity to visit active programs in othercities, and this helped to transmit a concrete visionof how after-school programs operate. In addition,they also hosted annual cross-site conferences thatpromoted sharing of information and generatedenthusiasm on the part of participants.
Why Were Partnerships Important?
Partnerships were central to developing ESS at eachsite and were expected to serve several importantfunctions. These included:
• Drawing on the existing resources and youth-serving expertise of multiple organizations;
• Avoiding service duplication and service gapsamong youth-serving organizations; and
• Creating a stronger foundation for sustainability.
Among the sites, the composition of these partner-ships varied to some extent, at least in part becauseeach of the four ESS models had a differentapproach to promoting after-school collaborations(see box).
Collaborative Focus of the Models
The ESS programs are based on four different, nation-ally recognized models of after-school programs.Each model, in turn, is built on a somewhat differentapproach to collaboration:
Beacon:Schools + fiscal CBO + lead agency CBO
Bridges to Success:Schools + CBOs + local United Way
Community Schools:Schools + CBO + a university
WEPIC:Schools + a university

It Starts With a Vision 7
What Types of Schools Host thePrograms?
Because out-of-school supervision needs are greatestfor younger youth, almost all of the after-school pro-grams were implemented in elementary and middleschools. Across the ESS programs, six take place inhigh schools, while 24 are in middle schools or jun-ior high schools, and 22 are located in elementaryschools.9
These ESS schools are typical of urban schools acrossthe country. They serve high proportions of minorityand low-income youth, students’ academic perform-ance is reported to be low, and turnover among prin-cipals is relatively high—almost two-thirds of theschools have had two or more principals in the pastfive years. However, the neighborhoods in which theschools are situated can look very different from oneanother. For example, a middle school in Aurora,Colorado, is situated in a low-income, largelyHispanic neighborhood marked by wide streets andsmall one-level homes with modest yards and narrowdriveways. A middle school in North Philadelphia,also predominately Hispanic, is located on a heavilytrafficked bus route surrounded by small businesses,fast food chains and unbroken lines of rowhomesscarred by the occasional abandoned house.
In some of the larger school systems, likeMinneapolis, students are bused to school from manydifferent neighborhoods. This transportation factoradded an additional dimension of challenge to thetask of recruiting youth and arranging for them tostay after school. In smaller school districts and ele-mentary schools, the fact that many students livedwithin walking distance alleviated, to some extent,this possible barrier to participation.10
What Are the Goals of the Programs?
Across the ESS sites, project directors and site coordi-nators identified a number of major goals for theirprograms, including:
• Improving youth’s academic performance;• Providing an opportunity for youth to use their
out-of-school time safely and productively;• Providing an opportunity for youth to develop
positive relations with peers and adults;
Whatever the model on which a particular site basedits program, partners were initially attracted to ESSfor a variety of different reasons. Roughly a thirdcame because they viewed ESS as an opportunity tostrengthen school-community partnerships. Anotherthird viewed ESS as an opportunity to expand whattheir own organizations were doing—ESS held prom-ise for generating additional funding and physicalresources, such as the use of school space for activi-ties. The final third came to the partnerships simplybecause they were invited.
Over the course of the planning period and firstyear of implementation, some of these initial part-ners decided to be more involved than others, and afew eventually decided not to participate. However,the reasons behind organizations’ initial motivationto become involved did not predict their futureinvolvement.
Ultimately, many organizations became partners inthe initiative. CBOs represented a range of youth-serving groups, including the Girl Scouts, BoyScouts, Big Brothers Big Sisters, the YMCA, andCampfire Boys and Girls. Institutions and agenciessuch as art museums, city libraries, and parks andrecreation services also joined the partnerships.Other partners included the mayor’s office, countyplanning and grants offices, local businesses androtary clubs—all of which were potential sources ofcontributed support or of assistance with fundraising.In some cases, partners played dual roles as bothproviders and funders of service.
Because ESS programs operate within school build-ings, schools were especially critical partners. Theywere the gatekeepers to school space; contributedsignificant amounts of support, even beyond the useof their facilities; and often assisted in programdevelopment and youth recruitment by sharing cur-riculum ideas and supporting in-school student refer-ral systems for ESS. In addition, administrators at theschool district level were positioned to promote pro-gram expansion to other schools and, in some cases,to funnel state education dollars into programs.

8 Multiple Choices After School: Findings from the Extended-Service Schools Initiative
• Having parents become more involved in theirchildren’s lives and schooling;
• Keeping youth off the streets and out of trou-ble; and
• Providing youth with athletic and cultural expe-riences to enrich their lives.
What Activities Do the After-SchoolPrograms Offer?
To meet these goals, ESS planners in each cityworked creatively with their host schools to fill gaptimes for children and youth. Although called “after-school” programs, ESS activities also run before andduring the school day and throughout the year,including when school is not in session. All of theESS programs offer after-school activities. In addi-tion, 70 percent offer summer programs; just overhalf offer weekend activities; and 37 percent offeractivities during the school day, generally duringlunch time. Twenty percent of the programs offeractivities during school-year vacations, and 14 per-cent offer before-school activities.
This report focuses exclusively on the programs dur-ing the after-school hours. It is important to notethat these programs are very diverse. In fact, one ofthe advantages of school-based, after-school pro-grams is that they can be tailored to the specific pop-ulation of each particular school. But at the sametime, the types of activities in which youth engage aregenerally similar across the sites.
In almost all of those programs, academic activitiesare a primary focus—they include tutoring, home-work help, and specific academic classes like environ-mental science and computers.11 Cultural enrichmentactivities such as art, music, sports and recreationalactivities like karate and open-gym time are also sta-ples in most programs. ESS staff have recognized theimportance of giving youth recreational or downtime after school, and those activities are oftenoffered immediately after academic sessions liketutoring and homework help because they give stu-dents an incentive to complete schoolwork.
Free-time activities such as snack-time or teen hang-out time are offered at more than half of the pro-grams, as are community service activities andspecific classes to promote youth leadership and
decision-making. However, fewer hours are spent onthese. Free-time activities sometimes run for just 15 to30 minutes a day, and community service projects likecleaning a park or visiting a home for senior citizensare often offered just one day a month. Activitiesdesigned to help students with career preparationare the least common. This is primarily because themajority of youth served by ESS are not yet in highschool, the time when career preparation activitiesare most important.12
How Do the Sites Attempt to InvolveParents?
Parents have been involved in the ESS initiative in anumber of ways. As the programs were beingplanned, sites attempted to recruit parents to be partof that process.13 In addition, many of the sites seepart of their mission as serving the larger commu-nity, not just school-aged youth. During the first yearof ESS, activities for youth were the main focus.However, as these activities got off the ground andstabilized, programming for parents and other com-munity residents received increasing attention. Bythe third year of the initiative, almost half (46%) ofthe ESS programs were offering adult classes, whichhave included academic support courses like GEDpreparation, English-as-a-Second Language, parent-ing skills and health education. Several programsalso offer enrichment classes such as sewing, aerobicsand tennis. At some of the sites, staff planned theiradult classes by conducting parent surveys that askedabout activity preferences.
Beyond offering these separate weekend and eveningsessions for parents, program staff worked to involveparents in their children’s experiences in the after-school programs. While recognizing that parentinvolvement is typically one of the most difficult chal-lenges faced by schools, ESS staff found that main-taining contact with parents helps promote studentengagement, positive behavior and stronger aca-demic performance. They also found this type of out-reach is consistently valued by school principals.
Programs have implemented different strategies toengage parents. Some sites send home newsletters,call parents with updates and concerns, or chat withparents who come to pick up their children. A fewprograms regularly invite parents to the school for

It Starts With a Vision 9
coffee and snacks, and some hold family celebrationsor parties once or twice a year. Family celebrationsserved to showcase student accomplishmentsthrough performances and awards presentations,and staff feel this approach makes parents’ time atthe school especially positive.
How Are the Programs Staffed?
Strong staffing is a core element of effective after-school programs. Across the sites, staff include:
• A program director. The program directoradministers one or more after-school programsin a city and is responsible for the broaderexternal tasks of forming partnerships, oversee-ing other staff, managing the budget, and rais-ing funds to implement, sustain and expand theprogramming. Approximately three-fifths of theESS cities have full-time program directors; theothers have part-time directors. Strong full-timedirectors with skills in diplomacy, networkingand staff leadership seem pivotal in generatingprogram stability and success.
• A site coordinator. At the school-level, most pro-grams hired a full- or part-time site coordinator,who is responsible for implementing andadministering the program at the school. Thisinvolves leading recruitment and enrollmentefforts, planning and scheduling the youthactivities, identifying activity providers, commu-nicating with parents, and providing daily over-sight of the program, including handling thelogistics of arranging transportation home forparticipants and covering custodial needs.Because coordinators are usually located in anoffice at the school, they also serve as strategicintermediaries between school staff and part-nering agencies.
• Activity providers. Whether teaching jewelrymaking, running a math club, coaching frisbee-golf or leading a book group, enthusiastic andcaring activity providers bring the after-schoolprograms to life. They include staff from part-nering agencies, teachers from the school, inde-pendent professionals, community residentsand college students. Typically working just 2 to
10 hours a week, they are often hired relativelyinexpensively, yet play a vital role.
One essential task the programs face is orient-ing the activity providers toward positive youthdevelopment philosophies and practices. Thesefront-line staff spend more time with youth thando other program personnel but are sometimesonly in the school a few hours a week. To ensureprogram quality, directors and site coordinatorshave to maintain ongoing communication withthe activity providers, sponsor trainings and con-duct regular activity reviews.
Across the sites, a panoply of additional staff supportthe after-school programs. Some have full-time sup-port staff to handle clerical work and provideadministrative aide. In addition, some sites contractwith school security officers and janitors to allow forcontinued safety and clean-up at the end of theschool day.
The sites also receive essential administrative supportfrom their lead agencies—the CBOs or universitieswith whom they are collaborating. In general, theagencies contribute 2 to 10 hours a week; and thisassistance from account managers, payroll staff, datacollection specialists, grant writers and administrativeassistants helps programs with fundraising and theirongoing financial operations.
Finally, programs also recruit volunteers to fill gapsin services. These include VISTA and AmeriCorpsvolunteers who help coordinate and provide youthactivities; high school and college tutors who runhomework and academic support sessions; andadult volunteers who serve as mentors for higher-needs youth.
Almost three-quarters (71%) of the programs reporthaving 11 or more volunteers contribute their timeduring the course of a program year. The presenceof these volunteers has helped lower the adult-stu-dent ratio during activities and provided additionalopportunities for youth to form relationships withadults or young adults. However, programs alsoreported facing challenges in connection with theirvolunteers, including clearly defining volunteer roles,providing training and support so the volunteers canperform well in those roles, and having the volun-teers show up consistently. These challenges are fairly

10 Multiple Choices After School: Findings from the Extended-Service Schools Initiative
typical for organizations that rely on volunteers forthe provision of ongoing, direct services.
How Have the Programs Matured?
During the three years the sites have been up andrunning, they have been strengthening their rela-tionships with the schools and improving the qualityof their programming.
In our two earlier reports, we documented the chal-lenges of developing relationships between schoolsand the agencies running after-school programs.14
Most of the youth-serving organizations began asguests in the schools, and it took time for schoolsand agencies to develop common understandingsabout the roles of the after-school programs and howthey would operate.
Creating ways of sharing and maintaining schoolspace was especially critical. After-school programsneeded regular access to classrooms and other spacefor activities, while schools needed assurance thatthose spaces would be well maintained. The costs ofadded wear and tear on school facilities caused bytheir additional use was not anticipated in the origi-nal grant proposals. Some programs addressed theissue by renegotiating custodians’ schedules so theywould be available in the evening; some madearrangements to hire custodians for additionalhours. Establishing these logistics proved essential forstrengthening the school-program relationships.
By their third year of operations, only two of the pro-grams were experiencing any real difficulty in work-ing with school districts; and almost three-quarters ofthe programs reported that the school districts were“willing or very willing” to accommodate the needsof ESS. In many cases, these relationships had grownstronger over time. More than three-fifths (61%) ofthe programs said school district support hadincreased over the past two years.
The developing relationships were apparent toschool personnel and ESS staff alike. Principals saidthey were pleased with their level of communicationwith program staff and, in several cases, noted thatthey considered ESS staff to be school staff. In thoseschools, along with some others, ESS staff wereinvited to attend school faculty meetings.
Similarly, after-school staff reported feeling more wel-comed in the school and said that they worked hardto keep school administrators up to date on their pro-gram operations. The vast majority (83%) of site coor-dinators met informally at least once a month with theprincipal or assistant principal, and three-fifths alsohad regularly scheduled formal meetings. ESS staffalso noted that their programs had become morewidely recognized in the schools, helped, in part, byaccess to the schools’ public-address systems and byestablishing procedures that encouraged teachers andcounselors to refer youth to the programs.
As the ESS sites have matured, they have also becomemore able to identify and address their core pro-gramming goals. In the survey administered inSpring 2001, 55 percent of site coordinators reportedthat over the course of three years, their programsincreased their focus on youth development, and 49percent reported an increased focused on academics.(The answers were not mutually exclusive.)
A number of programs also became more investedin developing ways to monitor activity quality, byusing three approaches: programs established for-mal proposal review systems for selecting whichactivities would be allowed to run; site coordinatorsconducted formal or informal activity observationsand then gave feedback to staff; and provider staffand students were given opportunities at the end ofsessions to evaluate the strengths and weaknesses ofspecific activities.
However, establishing and maintaining formal sys-tems created additional work for coordinators, whowere already very busy. For this reason, even duringtheir third year, some programs had still not set up asystem of assessing activity quality and, instead, reliedon informal student, staff and parent commentsabout how activities were going.
During the past three years, the programs’ growthwas marked by both challenges and accomplish-ments. The following chapters focus on findingsfrom 10 of the programs to examine what they haveaccomplished and how, and where the ongoing chal-lenges reside.

Who Comes to the After-School Programs? 11
The most fundamental goals of the ESS programswere to serve as safe places for children and youth inthe after-school hours, and to provide opportunitiesand supports that would help them develop aca-demic and social skills. Thus, participation pat-terns—who came to the programs and how oftenthey came—are the first indication of how well theprograms would be able to accomplish their goals.
A number of factors can affect participation patterns.The most obvious have to do with program charac-teristics. The ESS planners all had to make decisionsabout the goals and design of their programs thatultimately had an effect on which children and youthchose to participate and how often they attended.
At each site, planners had to decide, for example,whether the program should function, in part, aschild care for parents; whether some activities, suchas tutoring, would be required for everyone whoenrolled; and whether students would be required toenroll for five days a week of activities or couldchoose to attend only on the days that offered theactivities most appealing to them.
Viewed in this context, parents’ choosing to registertheir children for ESS and youth’s participation canbe interpreted as signals of how well the programs’structures and activities fit with the particular needsand desires of the communities they served. (Seesidebar on next page for an overview of sites’ recruit-ment strategies, another factor that influences partic-ipation.)
While information on the extent to which youth par-ticipate in after-school programs is now beginning toemerge,15 much remains to be understood concern-ing the factors that affect participation and how tobest increase the likelihood of meaningful levels ofattendance. As community-designed, school-basedprograms, the ESS sites’ early experiences with par-ticipation patterns seem likely to provide lessons thatcan be useful to new and developing after-school pro-grams around the country.
III. Who Comes to the After-School Programs?

12 Multiple Choices After School: Findings from the Extended-Service Schools Initiative
The chapter draws on information concerning 1,511first to eighth graders who enrolled in the ESS partic-ipation study at the 10 intensive research sitesbetween Fall 1999 and December 2000. Data includeprogram-provided participation records, demo-graphic information provided by parents on theenrollment forms, and responses to surveys com-pleted by the youth and their parents.16
Who Enrolled?
Even as relatively new options, the ESS programsseem to have been attractive to the children and par-ents in their schools. As early as the 1999-2000 schoolyear (in most cases, the second year of operations), 8of the 10 programs considered themselves to be oper-ating at capacity—serving as many students as theycould within their available resources. Interest in theafter-school programs was so high, relative to availableresources, that three of those programs capped theirenrollments during one or both of the years coveredby this study. And one program, in its effort to meetthe demand for registration, limited the number ofdays a week for which youth could register.
Across the 10 sites, programs served an average of 63youth a day. In most of the sites, however, differentyouth attended on different days of the week, so thenumber of individual youth served is much higher. Infact, across the eight sites that collected participationdata on all youth who were enrolled in ESS (not justthose enrollees who were registered for this study),slightly more than half of the schools’ total popula-tions were participating in the after-school programs.
In general, the ESS participants reflected the popu-lations of their schools. As Table 1 illustrates, acrossthe schools, participants were quite diverse andfrom families that had a range of income and edu-cational achievement. At the same time, the siteswere generally successful in reaching out to low-income families for whom free, school-based pro-grams such as ESS may be a valuable resource,providing safe, supervised places for their children tobe after school, as well as an array of perhaps other-wise unaffordable activities. Almost three-quarters offamilies had incomes of $30,000 or less, and almostthe same proportion were eligible for free orreduced price lunch.
Recruiting Students for the After-SchoolPrograms
Recruitment strategies have an obvious influence onwho participates; and in developing their strategies,ESS staff were sensitive to the obstacles that couldprevent youth from enrolling in programs. The mostobvious barriers are that parents may not be awarethat the programs exist, unaware of key features suchas whether the activities are free or unsure how to goabout registering their children.
Thus, ESS staff conducted outreach and registrationactivities in a variety of ways, with the aim of maxi-mizing students’ and parents’ knowledge of the pro-grams and increasing the convenience of theregistration process. Their strategies included:
• Mailing notices about ESS to parents and sendingnotices home with the children over a period thatgenerally extended for two or three weeks beforeand after the start of activities.
• Providing information about ESS through directcontact by calling parents at home or talking tothem when they came to pick up their children atschool.
• Holding open houses in the evening where parentscould hear about activities in the upcoming semes-ter and sign their children up on the spot.
• Holding information and registration sessions inpublic housing complexes where many of the stu-dents lived.
• Translating notices into appropriate languages incommunities where children’s parents spoke lan-guages other than English.
The following chapter thus explores four fundamen-tal questions:
• Which children and youth participated in theafter-school activities?
• How often did they attend?• What factors helped account for the patterns of
participation?• What are the implications of these findings for
policy and practice?

Table 1:Selected Family and Background Characteristics of ESSParticipants
GenderFemale 54.7%
Male 45.3%
Average age in years 10.3
Ethnicity*White 40.1%African-American 32.7%Hispanic 19.4%Asian/Pacific Islander 7.7%Native American 3.0%Other 3.8%
Child lives in single-parent household 41.1%
Parent educationNot a high school graduate 22.4%Some college/community college 30.0%College/community college graduate 23.7%
Annual household income$14,000 or less 37.5%$30,000 or less 73.9%
Child receives free/ reduced-price lunch 71.8%
* Ethnicity categories are not mutually exclusive and, thus, do notadd up to 100 percent.
Source: Intake data collected from parents or guardians at the timeof enrollment into study.
Who Comes to the After-School Programs? 13
less likely to have time to focus on the details of theprogram and registration.
Staff and partners at the ESS programs were keenlyaware of the characteristics of students who were lesslikely to enroll in the after-school activities. Oneteacher noted:
I think some of them don’t have good reading skillsso they don’t want to do another hour of readingafter school.
And a staff member at a partnering agency said:
With the after-school program, it’s seemed to onlyhit the kids with highly functional parents who aregetting the applications back...It’s the kid that does-n’t have a parent who can read that we’re missing.
In contrast, as one principal said, students who dotend to enroll are those who “would take advantageof any opportunity there was.” And one teachernoted:
They [the most likely ESS participants] are moreconfident...They’re bigger risk takers. I thinkthey’ve had more opportunities outside of school.They’ve had Brownies or Scouts...They’ve gonecamping, and they want to do it again.
To engage greater numbers of the most high-needsyouth, ESS staff developed targeted strategies tospecifically address some of their barriers to partici-pation (see sidebar on next page). These efforts doseem to have resulted in gains, at least as suggestedby an increase in the proportion of ESS youth whowere eligible for free or reduced-price lunch.During the two years of this study, the number ofenrollees in that category increased from 66 to 72percent—a percentage that almost preciselyreflected the demographics of the schools. Butdespite these successes, programs recognize that theyouth most in need of academic and developmentalsupport typically still do not join, and they continueto look for new approaches for reaching them.
The Special Challenges of Attracting High-Needs Youth
Although they were successful in recruiting low-income youth who reflected the demographics oftheir schools, the ESS programs felt they needed todo more to attract and serve the most high-needsyouth—those who were disengaged from school, fail-ing courses and exhibiting negative behaviors. Theseyouth are typically difficult to draw in and retain inafter-school programs. They are less likely than youthwith fewer problems to be comfortable in organizedprograms, and may resist school-based activities ifthey are experiencing problems with learning. Inaddition, their parents may also be under stress and

14 Multiple Choices After School: Findings from the Extended-Service Schools Initiative
How Often Did Youth Attend?
Two of the major policy concerns driving the interestin after-school programs are the desire to provideyouth with academic and developmental supportsand opportunities, and to keep them safe during theafter-school hours. Thus, it is important to knowwhether enrollees are attending often enough tomake these goals attainable.
Table 2 describes youth’s attendance rates and patternsacross the 10 programs in the study. In a typical semes-ter, participants were, on average, registered for 33 daysof the program, or roughly three days a week, and theyattended almost two-thirds (63%) of those days. Thisattendance rate translates to 20 days of participation persemester, or about two days a week. However, averagesfor the 10 schools were strongly affected by high levelsof participation at one school. If that school is excluded,the average number of scheduled days drops from 33 to27, and average days present drops from 20 to 15.
It is important to note that many youth participated inESS over time, not just for one semester. More than athird (35%) attended the after-school program for allfour semesters of the study. Nearly half (49%) partici-pated for three semesters, and 84 percent participatedduring two semesters. Thus, there was opportunity for acumulative effect from the program’s activities and sup-ports.17 But there were also gaps in registration whenformer participants did not re-enroll. This was particu-larly true from one school year to the next, when springenrollees did not return for the following fall semester.While we do not have direct information on why stu-dents did not continue in ESS from semester to semes-ter, one likely contributing reason is the high level ofstudent mobility that characterizes schools in poorneighborhoods.
When considering the extent of participation in ESSand its potential benefits, it is also important to keepin mind that many of the youth were engaged inother activities in addition to ESS. In fact, partici-pants reported they typically spent one or two moredays a week in organized after-school activities in set-tings other than school. However, even while theysaid they spent much of their after-school time insupervised settings, a non-trivial proportion of theirtime was unsupervised—more than half of the youthtypically spent some part of their after-school hourseach week without adult supervision. (The way youthspend their after-school time will be discussed morefully later in this chapter.)
What Factors Help Explain ParticipationPatterns?
Across the 10 sites, there was wide variation in thenumber of days youth attended the after-school pro-grams during a typical semester. The average numberof days that youth scheduled for ESS ranged from18.6 to 84.6 across the 10 programs; their attendancerates varied from 34.4 percent to 73.9 percent; andthe number of days they actually attended rangedfrom 10 to 62.
Three key, sometimes interrelated factors seemed tocontribute to these variations: the ages of the youth;choices made by programs about whether they wouldrequire five-day-a-week enrollment; and preferencesof both youth and their parents concerning how theyouth spend their after-school hours.
Strategies for Attracting High-Needs Youth
ESS programs developed several strategies toincrease their ability to attract high-needs youth. Forexample, some programs:
• Worked closely with teachers and other schoolstaff to identify and encourage such students toenroll. In addition, at some sites, teachers recom-mended the program to parents during parent-teacher conferences.
• Reserved enrollment slots for high-needs youthwho were referred to the program in this way. Thiswas essential in programs where the number ofregistrants was capped, Otherwise, all slots mightbe filled by youth whose families were more com-fortable and familiar with organized activities and,thus, quicker to register.
• Hired staff to lead activities that had personal char-acteristics to draw in youth who were disengagedin school. These staff tended to be representativeof participants in gender and race, and closer tothem in age.
Some programs also offered opportunities for less-structured activities, such as open-gym activities orteen rooms, to attract youth who might feel morecomfortable in a casual environment.
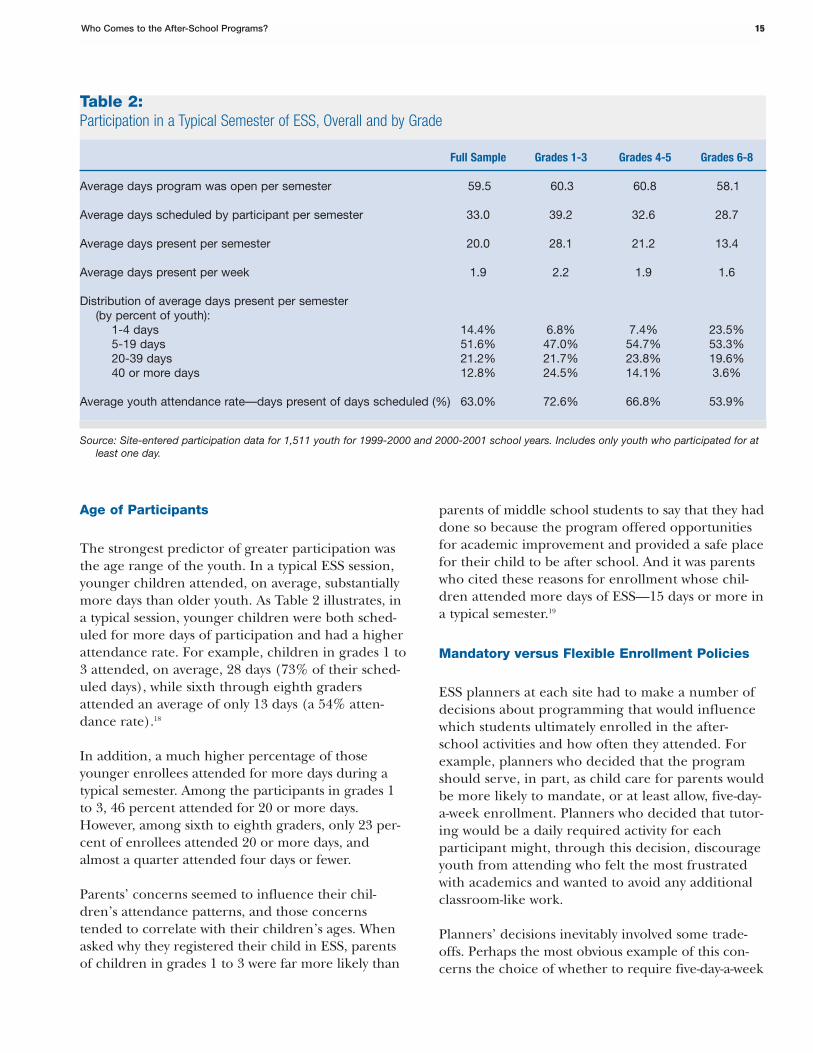
Table 2:Participation in a Typical Semester of ESS, Overall and by Grade
Full Sample Grades 1-3 Grades 4-5 Grades 6-8
Average days program was open per semester 59.5 60.3 60.8 58.1
Average days scheduled by participant per semester 33.0 39.2 32.6 28.7
Average days present per semester 20.0 28.1 21.2 13.4
Average days present per week 1.9 2.2 1.9 1.6
Distribution of average days present per semester(by percent of youth):
1-4 days 14.4% 6.8% 7.4% 23.5%5-19 days 51.6% 47.0% 54.7% 53.3%20-39 days 21.2% 21.7% 23.8% 19.6%40 or more days 12.8% 24.5% 14.1% 3.6%
Average youth attendance rate—days present of days scheduled (%) 63.0% 72.6% 66.8% 53.9%
Source: Site-entered participation data for 1,511 youth for 1999-2000 and 2000-2001 school years. Includes only youth who participated for atleast one day.
Who Comes to the After-School Programs? 15
Age of Participants
The strongest predictor of greater participation wasthe age range of the youth. In a typical ESS session,younger children attended, on average, substantiallymore days than older youth. As Table 2 illustrates, ina typical session, younger children were both sched-uled for more days of participation and had a higherattendance rate. For example, children in grades 1 to3 attended, on average, 28 days (73% of their sched-uled days), while sixth through eighth gradersattended an average of only 13 days (a 54% atten-dance rate).18
In addition, a much higher percentage of thoseyounger enrollees attended for more days during atypical semester. Among the participants in grades 1to 3, 46 percent attended for 20 or more days.However, among sixth to eighth graders, only 23 per-cent of enrollees attended 20 or more days, andalmost a quarter attended four days or fewer.
Parents’ concerns seemed to influence their chil-dren’s attendance patterns, and those concernstended to correlate with their children’s ages. Whenasked why they registered their child in ESS, parentsof children in grades 1 to 3 were far more likely than
parents of middle school students to say that they haddone so because the program offered opportunitiesfor academic improvement and provided a safe placefor their child to be after school. And it was parentswho cited these reasons for enrollment whose chil-dren attended more days of ESS—15 days or more ina typical semester.19
Mandatory versus Flexible Enrollment Policies
ESS planners at each site had to make a number ofdecisions about programming that would influencewhich students ultimately enrolled in the after-school activities and how often they attended. Forexample, planners who decided that the programshould serve, in part, as child care for parents wouldbe more likely to mandate, or at least allow, five-day-a-week enrollment. Planners who decided that tutor-ing would be a daily required activity for eachparticipant might, through this decision, discourageyouth from attending who felt the most frustratedwith academics and wanted to avoid any additionalclassroom-like work.
Planners’ decisions inevitably involved some trade-offs. Perhaps the most obvious example of this con-cerns the choice of whether to require five-day-a-week

16 Multiple Choices After School: Findings from the Extended-Service Schools Initiative
registration or to allow, or even mandate, more flexi-ble scheduling.
Programs that require registration for five days aweek have, not surprisingly, resulted in more days ofattendance for participants than flexible programsthat permit registration for fewer days.
However, there are also suggestions that, overall,greater numbers of low-income students participate
Increasing Attendance Rates
After-school programs that require five-day-a-weekenrollment often struggle with low attendance rates.However, one ESS program has been able to achievea high attendance rate (72%) despite its five-day-a-week mandate. There are several factors that con-tribute to its success. The program:
• Serves children in grades k-5. Elementaryschool-age students typically attend their sched-uled after-school activities more frequently than doolder youth. In part, this may be because the chil-dren have to attend when their working parentsrely on the program for child care.
• Enforces a strict attendance policy. The programcommunicates its expectation that enrolled stu-dents will participate every day. It limits slots to117 children and has a waiting list of others whowant to enroll. Thus, children scheduled but notattending are literally depriving other students andfamilies of services.
• Provides a strong link between the after-schoolactivities and the in-school experiences of stu-dents. The program has a strong academic focus,and many of the participants are recommended bytheir teachers based on academic and youthdevelopment needs.
In addition, the program is required by one of its fund-ing sources to charge participants’ families a fee, withamounts varying based on a family’s ability to pay.(The average rate is approximately $20 per week, butsome families pay as little as $2.) Since parents arepaying for the program’s services, they may take extrameasures to ensure that their children attend.
Finally, the program provides bus transportation homeeach day, although bus schedules require that stu-dents needing transportation leave more than an hourbefore the program ends.
when they have the option of scheduling activities forfewer than five days a week.20
The 10 ESS programs included in this study arespread across the continuum of “five-day-a week” to“flexible” approaches to registration, and their placeon the continuum may explain some of the variationin patterns exhibited across the schools that extendbeyond differences in the ages of participants.
Three of the 10 programs offered activities five daysa week and generally did not permit registration onlyfor selected days. In those programs, participants, onaverage, attended for more days than at the othersites. However, two of the three also had the lowestattendance rates (average attendance of lower than40%) among all 10 programs.
These low rates of attendance suggest that schedulingfor five days without enforcing an attendance policyincreases the likelihood that youth will not show upregularly. However, other factors might also have con-tributed. The five-day-a-week site with high attendancerates was an elementary school, while participants atthe other two sites were middle school students.Unlike the elementary school program, the middleschool sites did not have a well-articulated—andenforced—attendance policy. In addition, the middleschool programs did not provide transportation homeat the end of the after-school day, a factor that coulddiscourage attendance on days when alternate formsof transportation were unavailable. (See sidebar for adescription of the elementary school program’s strate-gies for achieving high attendance rates.)
The other seven programs allowed selective registra-tion for activities offered only on certain days (or, inthe case of one site, limited registration to fewer daysthan the program was open). This flexible enroll-ment policy helped programs meet the demand forservices and, perhaps, allowed them to increase thevariety of their offerings. The programs would, forexample, schedule a dance class on Monday andWednesday and a chess club on Tuesday andThursday. Parents would then register their childrenfor specific activities and not others; and, as a result,the children often enrolled for fewer days than theprograms were open.
These practices increased the number of youth whoparticipated in the programs, and they may also have

Who Comes to the After-School Programs? 17
helped attract a greater range of youth because theycould enroll only for the specific activities thatappealed to them. The tradeoff, however, was thatindividual youth participated for fewer days eachweek and, thus, were less often in the “safe haven” ofafter-school programming, with its potential for pro-viding academic and developmental supports andopportunities. In addition, flexible enrollment poli-cies may limit the after-school program’s usefulnessto parents with child care needs.
Interestingly, among parents who completed a surveyin Spring 2001, a high percentage (42%) cited theeffect of program policies limiting participation as akey reason for their child not attending more fre-quently, suggesting that, in sites which limited enroll-ment, many parents would have liked their childrento be able to enroll for more days.
Youth’s and Parents’ Explanations of Why YouthDid Not Attend More Often
Youth, of course, have a voice in how they spend theirtime after school, and these preferences also seemedto affect participation rates. In the Spring 2001 sur-veys, ESS enrollees and their parents were asked whythe youth did not attend more often, including whythey did not schedule ESS for more days a week andwhy they did not attend a higher percentage of theirscheduled activities. Table 3 lists their most frequentresponses (they could give multiple reasons).
The youth who attended ESS the fewest days in atypical session were significantly more likely to havegiven the first reason for their non-attendance—they had other things to do elsewhere. (See sidebarfor what those “other things” included.) While theygenerally expressed positive attitudes about the ESSactivities as interesting and as valued sources of newlearning and skills, they also made it clear thatthere were a number of ways they spent their after-school time and that these could draw them awayfrom ESS.
It is important to note that it was older youth,rather than children, who were more inclined togive the second reason for non-attendance—theywere not interested in the activities. Alternativeactivities available to them are likely to be more var-ied than for younger children; for example, theymay have more types of team sports to choose from.And older youth indicated more often than youngerchildren that they simply went home or to a friend’shouse after school. In addition, parents of olderchildren may allow them to more frequently “optout” of organized activities. Children in grades 1 to3 are, obviously, far less likely than middle-schoolersto make independent choices about how to spendtheir after-school time.
Table 3: Youth and Parent Reports:Why Youth Did Not Attend ESS More Often
Youth ReportHad other things to do elsewhere 28%Not interested in activities, or
friends did not attend 18%Did not have a way to get home 15%Did not like treatment by staff or other students 11%
Parent ReportMy child had other things to do elsewhere 42%My child did not like the activities,
or friends did not attend 23%My child did not like treatment by staff or by
other students 15%No transportation available for getting home
after the program 15%
How ESS Youth Allocated Their After-School Hours
Fourth to eighth graders responding to a survey inSpring 2001 described how they spent their after-school hours during the previous week. They reportedthat they spent:
• 1.8 days, on average, in organized activities, suchas ESS, at their school.
• 1.4 days in organized activities at locations otherthan the school.
• .5 days in school for other reasons, such as usingthe library or talking to a teacher.
• 3.2 days at their own or a friend’s home, or at thehome of a sitter or relative.
(Numbers add up to greater than five days becauseyouth may have spent time in different ways in a single day.)

18 Multiple Choices After School: Findings from the Extended-Service Schools Initiative
As Table 3 indicates, parents’ explanations for whytheir children did not more often attend ESS gener-ally supported reasons given by the youth. Two ofthese reasons for non-attendance—the child not lik-ing the activities and a lack of transportation home—were predictors of attendance patterns. Both werecited significantly more often by the parents of chil-dren with low attendance.
What are the Implications of theseFindings for Policy and Practice?
Even in their early years of operations, the ESS pro-grams succeeded in attracting significant numbers ofthe young people in their schools and, in fact, werein most cases filled to the capacity of their resources.The participants generally mirrored the populationsof their schools—for the most part, they were chil-dren from low-income families. The ESS programs’successes and challenges in recruiting participantssuggest the following “lessons” for policymakers andprogram practitioners:
• Some groups of children and youth are more likelythan others to be attracted to school-based, after-school programs. In ESS, as has also been foundin other after-school programs, younger chil-dren attended more frequently than olderyouth. In addition, the students who were mosteasily recruited for the program tended to bethose who were already “joiners.” As the pro-grams developed, staff began to more specifi-cally target some of their recruitment strategiestoward attracting the most high-needs youth(the “non-joiners”), students who were failingcourses, were disengaged from school and hadbehavior problems.
The “safe haven” and academic and develop-mental opportunities offered by after-schoolprograms could be particularly valuable forboth older youth and higher-needs childrenand youth. However, engaging them in struc-tured activities after school at levels that couldhelp lead to skill-building and developmentalprogress is difficult. It seems likely that after-school programs, in general, would benefitfrom more information on attracting and serv-ing older youth and children and youth whohave the greatest needs.
• There are tradeoffs involved in the decision whetherto require participation for four or five days eachweek or to allow youth to schedule their after-schoolactivities more flexibly. In shaping the content andrequirements of their programs, the ESS plan-ners made decisions that influenced how manyyouth and which youth enrolled and how oftenthey attended. Requiring five-day-a-week enroll-ment obviously increased both the number ofscheduled days and days attended, but allowingyouth to register for only a few days a weekmeant that programs could serve a greater num-ber and, perhaps also, a more diverse group ofyouth. The ESS programs also found that requir-ing five-day-a-week enrollment resulted in lowattendance rates unless they had a well-articu-lated and enforced attendance policy.
• While, on average, students participated in theschool-based, after-school programs for 20 days in atypical semester, they also tended to participate overan extended period of time, not just a single semester.The ESS after-school programs generally oper-ated for 11 weeks each semester, and registeredstudents attended slightly less than two dayseach week, on average. While this relativelysmall number of days could suggest that partici-pants may not be attending often enough forprograms to achieve their goals of strengthen-ing youth’s academic and social skills, it isimportant to understand that participants alsoattend these programs over an extended periodof time. In the ESS sites, for example, morethan a third (35%) of the enrollees participatedall four semesters that were covered by thisstudy and, overall, 84 percent participated intwo or more semesters. These participation pat-terns suggest the possibility of a cumulativeeffect of less intensive participation over time.In addition, for many youth, ESS was only oneaspect of their after-school participation inorganized activities, and those other activitiesalso have the potential of providing supportsand opportunities for positive development.
The following chapter explores the quality of theactivities that youth experienced as they participatedin the ESS programs.

The Quality of Activities Offered in the Programs 19
IV. The Quality of Activities Offered in the Programs
The children and youth who came to the after-schoolprograms participated in a range of activities thatincluded remedial academics, academic and culturalenrichment, sports and recreation, and communityservice. (The sidebar on the next page describes thepercentage of time devoted to each type of activityacross all of the ESS sites.)
But what was the quality of these activities? Amongthe goals of ESS was to foster positive youth develop-ment by engaging participants in quality after-schoolprograms that provide the supports and opportuni-ties deemed essential for helping young peopledevelop new skills and interests, build positive rela-tionships with adults and peers, and become involvedin leadership and decision-making roles.
Every activity has the potential to foster positiveyouth development. While individual activities mayplace differing emphases on how they go about pro-viding specific supports and opportunities for youth,practices that promote positive development shouldbe present in some degree across each activity, what-ever the goal or content—whether it focuses ontutoring or other remedial academics; academic orcultural enrichment; community service; or sportsand recreation. “Youth development” is not a type ofactivity but rather a set of practices that should bepresent in any activity.
This chapter examines the quality of the activitiesprovided in the after-school programs. It addressesthe following questions:
• What characteristics of activities are most likelyto contribute to positive youth development?
• To what extent did the activities in ESS provideyouth with these developmental supports andopportunities?
• What are the implications of these findings forpolicy and practice?
To illustrate some of the features of high-qualityactivities, the chapter also describes three specificactivities in more detail.
Information for this chapter is drawn from observa-tions made during the 2000-2001 academic year of 30activities—including academic, enrichment and serv-ice activities—in three after-school programs for mid-dle school students.21

20 Multiple Choices After School: Findings from the Extended-Service Schools Initiative
helps youth benefit from the activity. It con-tributes to a sense of belonging; makes themfeel successful; and shows that the adult is adependable source of social and emotional sup-port in and outside of the activity.
2. Peer support. Activities can provide youth withsupport from their peers, both by contributingto the development of social skills and by pro-viding youth with opportunities to interact withone another in a positive way. Peer supportplays a powerful role in youth development.
3. Decision-making and leadership opportunitiesfor youth. Youth feel their ideas are valued andrespected, and that they are making an impor-tant contribution when they have opportunitiesto make decisions about, and help organize orrun, the activities in which they participate.
4. Youth engagement. If an activity is going to ben-efit youth, they should be challenged to learnand develop new skills. One indicator of theextent to which youth find activities interestingand challenging is their degree of enthusiasmand engagement during the activity. Whilebeing engaged in an activity does not automati-cally mean that youth are benefiting from it,they will not profit from an activity if they arenot engaged—if they are bored, easily dis-tracted or uninterested in completing the task.
It is important to note that most activities are notdesigned to be equally strong in all four of these keydevelopmental features. Some activities that areweaker in one area may be very strong in others. Forexample, a tutorial activity will be less likely toinclude much peer support but may be strong inadult support because of the intense one-on-oneattention that staff give individual youth. Similarly, anactivity that is structured around teams of youthworking together to develop and complete projectsmay be stronger in providing opportunities for peersupport and decision making than in adult-youthrelationships.
Programs that offer a range of activities can create abalance across their offerings so youth ultimatelyexperience all of the key features that contribute topositive development.
What Dimensions of ActivitiesContribute to Positive YouthDevelopment?
Several basic conditions seem necessary if an activityis going to be a positive experience for youth. Staffneed to present the activity’s goals and directions ina way that youth can grasp, and have a firm but posi-tive management style that neither stifles youth withtoo much control nor allows the room to become sochaotic that participants have difficulty doing theirwork. An appropriate staff-youth ratio also con-tributes to an activity’s success, as does having ade-quate space so that youth can work comfortably.
Beyond these common-sense requirements, youthdevelopment theory and practice have identifiedfour key features—or dimensions—of activities thatare important for providing the supports and oppor-tunities that contribute to positive growth andchange in the young people who participate.22
They include:
1. Adult-youth relationships. A positive relation-ship between the activity leader and participants
Types of Activities in the After-SchoolPrograms
Across the ESS sites, students participated in a rangeof activities. This list shows the percentage of totalhours of programming that sites, as a whole, devotedto each type of activity:
Academics 26%
Enrichment* 21%
Sports/recreation 21%
Free-time 11%
Community service 9%
Leadership 9%
Career preparation 3%
* Includes cultural and some academic enrichmentactivities, and visual and performing arts activities.
Source: Survey completed by 54 ESS programs inSpring 2001.
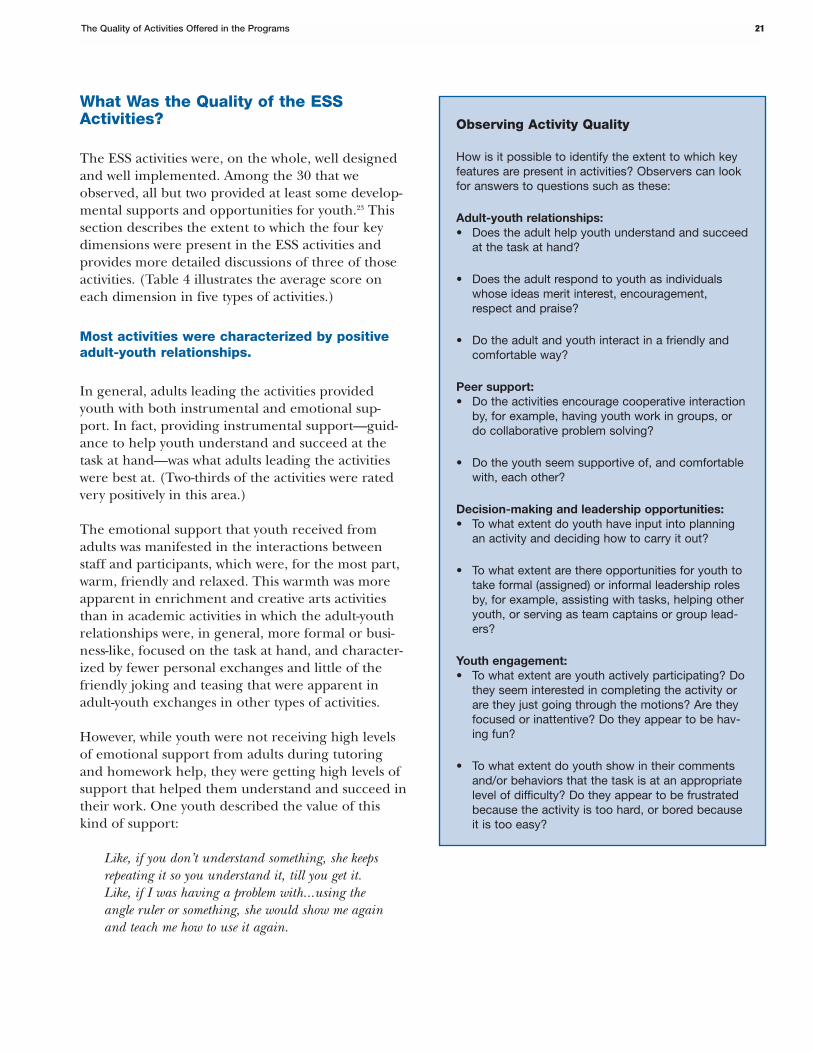
The Quality of Activities Offered in the Programs 21
Observing Activity Quality
How is it possible to identify the extent to which keyfeatures are present in activities? Observers can lookfor answers to questions such as these:
Adult-youth relationships: • Does the adult help youth understand and succeed
at the task at hand?
• Does the adult respond to youth as individualswhose ideas merit interest, encouragement,respect and praise?
• Do the adult and youth interact in a friendly andcomfortable way?
Peer support:• Do the activities encourage cooperative interaction
by, for example, having youth work in groups, ordo collaborative problem solving?
• Do the youth seem supportive of, and comfortablewith, each other?
Decision-making and leadership opportunities:• To what extent do youth have input into planning
an activity and deciding how to carry it out?
• To what extent are there opportunities for youth totake formal (assigned) or informal leadership rolesby, for example, assisting with tasks, helping otheryouth, or serving as team captains or group lead-ers?
Youth engagement:• To what extent are youth actively participating? Do
they seem interested in completing the activity orare they just going through the motions? Are theyfocused or inattentive? Do they appear to be hav-ing fun?
• To what extent do youth show in their commentsand/or behaviors that the task is at an appropriatelevel of difficulty? Do they appear to be frustratedbecause the activity is too hard, or bored becauseit is too easy?
What Was the Quality of the ESSActivities?
The ESS activities were, on the whole, well designedand well implemented. Among the 30 that weobserved, all but two provided at least some develop-mental supports and opportunities for youth.23 Thissection describes the extent to which the four keydimensions were present in the ESS activities andprovides more detailed discussions of three of thoseactivities. (Table 4 illustrates the average score oneach dimension in five types of activities.)
Most activities were characterized by positiveadult-youth relationships.
In general, adults leading the activities providedyouth with both instrumental and emotional sup-port. In fact, providing instrumental support—guid-ance to help youth understand and succeed at thetask at hand—was what adults leading the activitieswere best at. (Two-thirds of the activities were ratedvery positively in this area.)
The emotional support that youth received fromadults was manifested in the interactions betweenstaff and participants, which were, for the most part,warm, friendly and relaxed. This warmth was moreapparent in enrichment and creative arts activitiesthan in academic activities in which the adult-youthrelationships were, in general, more formal or busi-ness-like, focused on the task at hand, and character-ized by fewer personal exchanges and little of thefriendly joking and teasing that were apparent inadult-youth exchanges in other types of activities.
However, while youth were not receiving high levelsof emotional support from adults during tutoringand homework help, they were getting high levels ofsupport that helped them understand and succeed intheir work. One youth described the value of thiskind of support:
Like, if you don’t understand something, she keepsrepeating it so you understand it, till you get it.Like, if I was having a problem with...using theangle ruler or something, she would show me againand teach me how to use it again.

Table 4:Average Scores on Quality Dimensions for Types of Activities(scale of 1 to 5, with 5 as the highest)
Community Remedial Academic Performing Arts Visual ArtsService Academics and Cultural
Enrichment
Instrumental Support* 3.2 3.9 4.4 3.2 4.3Comfortable Adult-youth relationships 3.3 3.2 4.3 3.6 4.1Cooperative peer behavior 3.3 2.6 4.0 3.7 2.1Comfortable Peer relationships 3.5 3.0 3.9 3.9 3.8Decision-making 2.3 1.1 3.0 2.7 1.9Leadership 3.3** 1.2 2.0 2.3 1.1Youth engagement 3.2 3.4 4.1 4.1 4.1Number of activities*** 4 5 8 7 3
* “Instrumental support” refers to the extent to which the adult helped youth understand and succeed at tasks involved in the activity.** One activity significantly raised the average “leadership” rating in this category.*** The chart includes 27 of the 30 activities we observed. Three are excluded because they did not fit any of the categories of activities. They
include a sports activity, a discussion group on various teen issues, and an activity that crossed multiple categories.
22 Multiple Choices After School: Findings from the Extended-Service Schools Initiative
The academic activities were very task-oriented: theirpurpose was to complete homework and/or master aspecific set of academic concepts or skills. Thus,whether or not they were taught by a teacher, theyincorporated aspects of the classroom. More than halfof the academic activities were led by teachers, whichmight seem to suggest that the activities were lesswarm and friendly because teachers maintained theformal and task-oriented teacher-student relationshipthat exists during the school day. However, teacher-led enrichment activities in other areas, such as cre-ative arts, were just as warm and friendly asnon-teacher led activities in those categories.
In general, the after-school activities providedyouth with a supportive peer environment.
In more than half of the activities we observed, thequality of peer interactions was very positive. Youthseemed comfortable together, laughed and joked, andseemed to enjoy each other’s company. Importantly,one of the things that seemed to affect the qualityof peer interactions in an activity was the quality ofthe adult’s relationships with the youth, suggestingthat the adult sets the tone for peer relations. (Seethe boxed description of a chess club that illustratesthis connection.)
But while the interactions among youth were, for themost part, quite positive, only a third of the activities
provided opportunities for high levels of peer coop-eration. Small group projects provided the mostopportunities for youth collaboration and teamwork,while academic activities and visual art activitieswhere youth worked on their individual projects pro-vided few opportunities for this kind of cooperativeinteraction.
Activities provided far fewer opportunities fordecision making and leadership.
Overall, only a few of the ESS activities providedopportunities for decision-making: six were rated 4or better, while 15 received ratings of less than 2 inthis area. Youth-driven and open-ended activities (thefinal product or goal was not predetermined by anadult) offered youth the most decision-makingopportunities. These were generally cooperativegroup activities where youth worked together onprojects.
However, some of the art activities, while carried outindividually, were also open-ended and, thus, pro-vided many decision-making opportunities for partic-ipants. For example, during one activity where youthwere working in clay, the instructor asked them topick a theme for their projects and explained thatthe individual clay pieces they made would be relatedto the theme and would be displayed at an art showat the end of the semester. After discussing various

The Quality of Activities Offered in the Programs 23
What Works?
Chess Club: Strong Adult-Youth Relationships Creating Positive Peer Dynamics
What it is: The chess club, an activity for sixth to eighthgraders, is led by a teacher at the school. Sessions takeplace four days a week, are attended by about 20 youth(almost all of them male) and lasts for two and a half tothree hours. As a member of a state chess league, the clubalso competes weekly with other middle and high schoolchess clubs.
Why it is being highlighted: This activity illustrates howthe quality of the adult-youth relationship can set the tonefor positive peer dynamics. It also exemplifies how an adultcan heighten and sustain youth’s interest in an activity andmake the activity challenging. That, in turn, motivates andengages the youth.
How it works: The teacher wants to develop the students’chess skills and love of the game. He has a library of 60chess books that the youth can borrow and he helps themselect books appropriate to their level. He also bought acomputer program to help the kids build their skills.
To develop their skills, the youth sit at a long table andplay in pairs or against the teacher, who plays against sev-eral youth at a time on different chessboards while moni-toring all the other games. He communicates anenthusiasm for the game and a belief that the players canbecome better with experience. When a youth wins agame, the teacher praises his great moves. He then chal-lenges him to further develop by asking him to play with amore advanced player. The good players seem to takepride in being called on to help others learn the game.When a less experienced player loses a game, the teacherturns the youth’s attention not to the loss but to his poten-tial to win by pointing out that the winner had far moreexperience. “You are just starting out,” he says, “and youalmost won!”
Why it works: The teacher uses chess as a vehicle fordeveloping character, perseverance and problem-solvingskills that can be applied to situations beyond the chess-board. He:
• Fosters the strategic problem-solving skills that chessrequires by giving constant encouragement and positivefeedback, but rarely tells youth what moves to make.Instead, he encourages players to learn from their mis-takes and the mistakes of their opponents. In fact, inthe chess club, there are no “mistakes,” only opportuni-ties to learn. During one practice session, after a stu-dent lost a game, the teacher gathered the othersaround the chessboard to discuss the move that con-tributed to the loss and asked the group to think of amove that would be better—thus turning losing into avaluable lesson from which everyone could benefit. Theweekly competitions with other schools are similarlyused as learning experiences.
• Creates a supportive environment. Chess is a competi-tive game, but the teacher takes pains to instill a love ofthe game and a spirit of teamwork rather than a com-petitive ethos. He sets a positive example by beingpolite and respectful to the youth and, similarly, discour-ages them from making negative comments about eachother. When, in one session, one youth criticizedanother’s move, the teacher quickly responded, “Wedon’t do that [criticize others]. Everyone makes moveslike that.” Youth pick up on this and treat each otherwith respect.
As a result of the teacher’s skill in motivating the youth, hisability to help them develop their skills and the team spiritthat fills the room, youth are highly engaged in this activity.They focus intensely on their own games and, when theyare finished, watch their peers play. In fact, the youth areso engaged that sometimes the teacher has to escort themout of the door at 5 p.m. when the activity is scheduled toend, because otherwise they would stay even later.

24 Multiple Choices After School: Findings from the Extended-Service Schools Initiative
ideas, the group settled on an “Enchanted Forest” asthe theme for their clay art. Each participant decidedwhat figure, related to this theme, he or she wouldcreate from clay. After the instructor provided thegroup with some guidelines about working with clay,she encouraged additional problem solving and deci-sion-making by asking them to think through thetechnical challenges presented by their individualpieces, such as how to get their figures to stand orhow to prevent a figure’s horns from breaking.
As with decision-making, only a few activities providedleadership opportunities for youth. These occurred inonly seven of the activities; and when they did, inmost instances, were informal and involved youthteaching or demonstrating a technique to their peers.Sometimes staff asked one youth to help another;more often, youth did this themselves without beingasked. Activities that encouraged youth to collaborateprovided informal leadership opportunities moreoften. Allowing youth to work together appears toencourage youth with “natural” leadership tendenciesto spontaneously help or teach their peers. (See theboxed description of Lego Robotics for an example.)
One of the few activities that intentionally providedsignificant leadership opportunities was a serviceactivity that took place in a k-8 school, where eighthgraders were being trained to work as assistants orjunior staff in the after-school programming for firstto fifth graders. The eighth graders were given realresponsibility for the younger children—for example,helping the children with tasks in their after-schoolactivities and accompanying them from place to placewithin the school.
Perhaps not surprisingly, we found a negative rela-tionship between the amount of instrumental supportprovided by the adult and leadership opportunitiesfor youth, suggesting that leadership roles are morelikely to emerge when the staff hold back a bit and/or call on youth to provide instructional assistance.
On the whole, youth participated actively in thesessions and appeared interested and engaged.
Overall, youth appeared to be highly engaged in the after-school activities. Of the 30 activities we ob-served, 27 received positive or very positive ratings
in this area. During these activities, youth activelyparticipated, seemed interested in completing theproject or other work connected with the activity,and were focused and attentive most of the time.
Sessions in which youth were easily distracted orcomplained of being bored were rare, but were moreoften observed in the remedial academic and com-munity service activities. For the remedial academicactivities, the most obvious reason why youthappeared less engaged may be that in most cases,they chose activities of interest to them; but in thecase of homework help and tutoring, they were lesslikely to choose out of interest and, in fact, may havebeen struggling with the subject matter being taught.
Among the different types of activities, it seemedmost difficult for sites to design and implement serv-ice projects that were challenging and engaging.While we observed only four service activities, threeof them were relatively unchallenging and did notseem to hold youth’s interest. In one, for example,youth volunteered at an animal shelter, but becausethe rules of the shelter were so restrictive (for obvi-ous safety reasons), they did little else than play withthe animals and walk the dogs. In another serviceactivity, youth visited residents in a home for the eld-erly, where they helped make greeting cards, passedout refreshments and led the residents to dinner.Neither of the projects seemed to take advantage ofthe learning possibilities that were inherent in theservice activities; and youth were generally lessengaged than they were during other types of activi-ties, particularly the enrichment classes.
Specific practices seem to be associated with highlevels of youth engagement. Youth are most engagedwhen they are participating in activities where thesocial environment of the room is positive (whenadult-youth and peer relationships are warm andfriendly) and the adult actively tries to motivate andchallenge youth. Adults who provided this motiva-tion were able to explain the relevance and impor-tance of the activity or the skills they weredeveloping, challenge youth to push beyond theircomfort level, encourage them to persevere andpraise their accomplishments.
Interestingly, youth engagement was not correlatedwith youth decision-making, suggesting that theinterpersonal and skill-building dimensions of an

The Quality of Activities Offered in the Programs 25
What Works?
Lego Robotics: Youth Working Together to Solve Problems and Make Decisions
Why it works: The open-ended, youth-driven, small-groupstructure of the activity fosters high levels of collaboration,creative problem solving and decision-making. Staff:
• Act as a resource to the youth rather than direct theirwork or instruct them. They provide assistance, over-seeing each team’s work and supplying help and infor-mation as needed. But they also step back to let theyouth make substantive decisions.
• Emphasize peer-based learning. The team-based struc-ture of the activity promotes cooperative work skills. Buteven when youth work separately to develop particularskills, their individual efforts bear on each other becauseeach youth eventually brings this knowledge to his orher team. In addition, staff actively encourage youth toturn to their peers, rather than the adult, for help in solv-ing technical questions or other problems. This empha-sis on peer-based learning creates a supportive peerculture.
• Promote formal and informal leadership opportunities.The assignment of specific responsibilities within theteams allows youth to take turns being the expert on anissue that the whole group needs information about. Inaddition, one youth sometimes emerges as the teamleader, making decisions and delegating responsibilitiesto other group members.
The youth-driven nature of the activity, coupled with itstechnical challenges, makes it highly motivating andengaging to participants—and an excellent vehicle forexpanding their social and problem-solving skills. Youthfocus on their work with little direction from staff. Theyappear motivated to complete their robots, and they seemto enjoy the challenge of being responsible for organizingtheir work.
What it is: The aim of this activity is to use Legos, laptopcomputers and other electronic materials to constructrobots and program the robots to perform various tasks.Participants, who are middle-school youth, work in teamsof three or four to construct their robots. Activity leadersare teachers in the school.
Why it is being highlighted: Lego Robotics is a goodexample of a successful youth-driven, collaborative activitythat provides opportunities for peer cooperation, decision-making and leadership. Among the activities observed,these were the aspects of positive youth development thatwere least often present. When they did appear, it wasgenerally in project-based, group activities where the adultleaders gave youth flexibility in deciding what their finishedproduct would be and how they would get there. Suchactivities are often difficult to implement—they require bothcreativity and highly developed group facilitation skills onthe part of adults.
How it works: The activity encourages experimentationand creative problem solving. Staff provide general guide-lines, but it is the youth who are responsible for makingmost of the decisions about their project. Each team hasto implement its own design ideas—deciding what sort ofrobot to build and what tasks to try to program into therobot. Youth on each team also determine how to organizetheir work and divide responsibility for building and pro-gramming the robot.
At the beginning of each afternoon’s session, staff set outthe goal for the day, but then allow each team to decide onits own approach to the work. In one early session, forexample, staff explained that the day’s goal was to exploreand play with the new materials (such as the Legos), andbegin experimenting with robot construction. Some youthdecided to look through catalogs for ideas they could lateruse in the semester; some began to put robot partstogether; and others started to play with the differentmaterials to determine their usefulness. This emphasis onexperimentation allowed for a range of approaches andresulted in each team developing different, but equallyeffective, techniques.

26 Multiple Choices After School: Findings from the Extended-Service Schools Initiative
activity may be more important to middle-school-ageyouth than their degree of input into the activity.Thus, while they may be engaged in activities theyhelp shape, they can also be engaged in activities inwhich they have had little say, providing that theactivities take place in a motivating and supportiveinterpersonal environment.
Overall, the enrichment activities were fullest indevelopmental supports and opportunities.
As a whole, the enrichment activities provided youthwith the richest environment for positive develop-ment. The average ratings for adult-youth relation-ships, cooperative peer interaction and decision-making were all higher for this type of activity. Inaddition, project-based activities like Lego Roboticsfostered spontaneous informal leadership. A numberof the activities, like Lego Robotics and Chess Club,also incorporated academic skills such as math andproblem solving.
Creative arts activities scored as high on youthengagement as did the enrichment activities and wereindividually strong in their provision of developmen-tal opportunities. Creative activities that appeared tobe particularly effective included an acting class thatprovided the opportunity for youth to write theirown improvisations and plays, and a drawing classwhere the instructor helped youth develop theirdrawing skills while relating the techniques they were learning to the work of famous artists.
Remedial academic activities generally offeredfewer kinds of developmental supports andopportunities.
These activities (homework help and tutoring) pro-vided fewer opportunities for peer interaction anddecision-making than did other types of activities,and they also rated relatively low in youth engage-ment. But they achieved their purpose. Staff leadingthe activities seemed skilled at providing youth withthe support they needed to complete tasks success-fully. More important, youth who participated inthese activities reported that the sessions reallyhelped them catch up on their learning and com-plete their homework. Most of these youth werestruggling in school, and the sessions provided a use-ful service. As one student said:
I think it’s helpful, ‘cause you can have teachersthat like know what they’re doing, that gave youthe work, or you can ask students that understandthe work that you have, that could help you easierthan if you were at home.
Another pointed out that the teacher always checkedat the after-school session to be sure he had com-pleted his homework “so you won’t like get away anddon’t do it.”
The smaller class size of the after-school sessions wasalso important to students. As a youth in a middle-school math club noted:
Like the different things you don’t know aboutmath, you learn it...I mean, ‘cause it’s too manypeople in one room [in the school-day math class],and [the teacher] can’t pay attention to each one.
(See the boxed description of this math club.)
Even for youth who are doing well in school, home-work activities can be a useful experience. As one girlwho is a successful student reported, she attendedbecause she liked to get her homework out of theway and also because she was given the opportunityto help other youth, an experience she valued.
What are the Implications of theseFindings for Policy and Practice?
As the discussion above suggests, there was some vari-ation in the kinds of supports and opportunities pro-vided to youth across the different categories ofactivities. At the same time, there was also variationin quality among activities within each category.These variations suggest some key lessons for policy-makers and practitioners as they attempt to developand implement high-quality, after-school programs:
• Any type of activity can be rich in developmentalopportunities, depending on how it is delivered. It was not the topic or skill that was being ad-dressed, but the abilities of the staff memberleading the session that were the key to high-quality activities. While youth came to the activi-ties with some initial interest in them, thatinterest was most likely to be heightened andsustained when specific practices were in place.

The Quality of Activities Offered in the Programs 27
What Works?
Math Club: Youth Development Principles Enhancing Remedial Academic Activities
What it is: Taught by the school’s sixth-grade mathteacher, the after-school club helps students who arestruggling in her class to master the math taught duringthe school day. The after-school sessions are offered threedays a week. Class size is limited to 10 to 12 youth; and,to accommodate as many students as possible in thissmall group setting, students are allowed to attend onlyone session a week.
Why it is being highlighted: Among the academic activi-ties in the after-school programs, the math club stands outbecause it demonstrates how positive youth developmentpractices can be incorporated into a remedial academicactivity.
How it works: The teacher’s goals are to improve theyouth’s understanding of math and build their confidencein their math ability. Her approach to remediation goesbeyond simply reviewing the week’s work or providingextra practice. Instead of relying on pencil and paper mathproblems, she uses a variety of approaches—includingmath games, puzzles and other hands-on activities—todemonstrate and reinforce math concepts. This allows stu-dents to explore what they have been learning during theschool day in more detail and apply the concepts in a vari-ety of ways, leading to a deeper understanding. In addi-tion, the variety of the activities helps keep the youthfocused and engaged.
Why it works: Because it is taught by the youth’s class-room teacher, the activity has a direct connection to theschool day, and the youth can see its impact immediately.But the real key is the quality of the adult-youth interac-tions. The teacher communicates her warmth and concernfor youth’s academic success through ongoing encour-agement and the praise she gives when they succeed,praise designed to change their negative views of theirmath ability. She:
• Challenges and supports the youth. She boosts theirmath self-confidence by structuring the tasks andinstructional pace so youth are successful. As shemoves them through each activity, she makes sure theycan succeed at the tasks, then challenges them to trysomething a bit more difficult. During one session, forexample, when she saw that the youth at one worksta-tion were proceeding without difficulty, she encouragedthem to try something more challenging at the com-puter on which they were working. When they suc-ceeded, she said, “See how smart you are.”
• Is, in the words of one observer, “a master at givingclear explanations.” She takes care to make sure everystudent grasps the concepts she is covering. “Are yousure you understand?” she asks. “All of you?” And afterpresenting each afternoon’s instructions, she walksaround the classroom to check on individual studentsand help those who need it.
• Takes advantage of the small size of the after-schoolgroup. The math club provides opportunities for her toget to know her students better and to be particularlyattentive to their individual learning styles. She is alsoable to have more personal exchanges than might bepossible during the day. These exchanges can help herform a closer bond with the students, understand theirneeds and teach more effectively during the school day.In one case, for example, after praising a student forsuccessfully completing his math work that afternoon,she asked him, “What can I do to help you duringclass? Are others distracting you?”
In her responsiveness to the youth, and her ability to chal-lenge and support them and build their confidence in theirmath skills, the teacher of the math club blends importantyouth development principles and effective teaching-learn-ing strategies into a successful remedial math activity.

28 Multiple Choices After School: Findings from the Extended-Service Schools Initiative
These included a positive social environment,where both adult-youth and peer relationshipswere warm, friendly and supportive, but chal-lenged intellectual environment where theadult actively motivated youth, pushed them toachieve beyond their (the youth’s) initial expec-tations, encouraged them to persevere andpraised their accomplishments. It did not seemto matter whether the adult was a youth workerfrom a CBO or a teacher from the school.Teachers could be as warm and responsive toyouth as were experienced staff from CBOs,and the latter were just as successful in instruct-ing youth as were the teachers.
• Different kinds of activities provide opportunities foryouth to develop in different areas. Academic activ-ities like homework help and tutoring are a“given” in school-based, after-school programsand, when done well, they provide youth withstrong adult support that is valuable evenbeyond the activities’ immediate purpose ofbuilding academic skills. Among the ESS pro-grams, however, the enrichment activities pro-vided youth with the richest environment forpositive development. In addition to fosteringstrong adult-youth relationships, they providedopportunities for cooperative peer interactionand collaborative learning and for youth todevelop decision-making and leadership skills.A number of these activities also incorporatedacademic skills such as writing, math and prob-lem solving.
The following chapter discusses the ways in whichparticipation in the ESS after-school activities benefited youth.

Benefits to Participants 29
V. Benefits to Participants After-school programs attract youth by offering themfun and interesting activities. Once there, the relation-ships they form with program staff and their peers(along with their innate interest in the activities) keepthem coming. Program staff can then create an envi-ronment that stretches youth—heightening orexpanding their interest and helping them masternew tasks or skills.24 One writer theorizes that, throughrepeated opportunities to experience “the sparks ofexcitement and absorption” in everyday life, youthdevelop initiative—the ability to motivate themselvesfrom within and direct effort toward a goal.25
Good after-school activities can offer these absorbingexperiences that help youth develop initiative. Inaddition, learning new things or improving a skillcan give youth a sense of achievement and compe-tence that, in turn, improves their sense of self.Improving youth’s willingness to be persistent in theafter-school setting could theoretically also spill overto the academic environment—perhaps even if theafter-school activities are not academically focused.
Beyond those potential benefits, after-school pro-grams can fill important social deficits experiencedby some youth. In these settings, youth receive posi-tive adult and peer attention that can reduce theirneed to use negative behaviors in order get attentionfrom parents, teachers and peers. The tone set bystaff members can also teach youth to socialize inmore appropriate or mature ways. In addition, priorresearch has shown that forming positive attach-ments to, and obtaining guidance from, responsibleadults can reduce the tendency of some youth toengage in risk-taking behaviors.26
Because they are school-based, the ESS programsmay have some additional, school-related outcomes.Participating in a fun program at school may leadyouth to come to school more often, like schoolmore and/or increase their sense of belonging in theschool community. These positive school-related atti-tudes and behaviors are hypothesized to furtherincrease the probability that youth’s academic per-formance would be enhanced.
Because the ESS programs are relatively young, it isnow possible only to get an early sense as to whetherthe services the programs provide to youth are likelyto positively affect them. A rigorous investigation oftheir impacts using a comparison group will be

30 Multiple Choices After School: Findings from the Extended-Service Schools Initiative
appropriate only after programs are more establishedand have had time to fine tune their operations. Thus,in this chapter we report on our initial indications.
The chapter addresses the following questions:
• To what extent did the after-school programschange the way youth used their after-schooltime?
• What were the potential behavioral, academicand personal benefits for youth?
• What were the benefits for the youth’s parents?• What are the implications of these findings for
policy and practice?
We investigated the potential benefits using two dif-ferent strategies. In surveys administered in Spring2001, we asked youth about the ways they felt ESShad helped them, and we also asked parents aboutthe ways they felt the programs had helped their chil-dren. In addition, for some outcomes, we examinedESS’s possible effects by comparing changes in theattitudes and behaviors of youth who participated inthe after-school program and those who did not par-ticipate. It is important to note that the relationshipsbetween participation in ESS and the degree ofchange in youth indicate only that there is an associa-tion between the two; they do not indicate cause andeffect. (See Appendix B for a fuller discussion of themethodology.)
Did the Programs Change the WayYouth Used Their After-School Time?
One important question about after-school programsis whether they increase youth’s productive use oftheir after-school hours. After all, when the ESS pro-grams opened, youth and parents could have justsubstituted those programs for other activities, suchas clubs and sports teams, in which the youth werealready participating.
As discussed in the chapter on participation, ESStended to attract youth who were already “doers.”During the year before they enrolled in ESS, approx-imately 70 percent of them had gone to some organ-ized after-school activities—18 percent went tosomething once a week; 24 percent, two or threetimes a week; and 28 percent, four or five times aweek. However, almost 30 percent had participatedin no organized activities during the previous year.
The youth who had previously been the mostinvolved in organized activities—those who partici-pated two to five days a week before enrolling inESS—primarily substituted ESS for their other activi-ties. However, for the 48 percent of ESS participantswho had previously taken part in organized activitieseither one or no days a week, ESS represented a sub-stantial increase in their productive use of time dur-ing the after-school hours. Youth who had previouslyparticipated in no organized activities were enrolledin ESS an average of 2.2 days a week; and youth withone day of previous activities were enrolled in ESS anaverage of 1.8 days a week. Both of those groups alsoreported attending more than a day a week of otherafter-school activities.
What Were the Apparent Benefits forYouth?
Students who participated in the school-based, after-school programs seemed to experience positivechange in four key areas: staying out of trouble;improving their school attitudes and behavior;strengthening their social networks; and learningnew skills, seeing new possibilities and improvingtheir self-confidence.
Staying Out of Trouble
One particularly important outcome desired forafter-school programs is that they decrease the risk-taking behavior of youth. By providing them withstructured, supervised activities, the time they haveto get into trouble is decreased. In addition, thesocial rules and tone implemented by staff can teachyouth to deal more appropriately with negotiation,social conflict and anger.
When we asked parents and youth if ESS helpedthem stay out of trouble and more appropriately dealwith conflict, both groups—but especially the par-ents—believed ESS was very useful in this regard (seeTable 5).
In addition to asking parents and youth about thesebehavioral characteristics, we measured changes inthe youth’s behavior over time. In 1999-2000, whenthey first entered the ESS program, youth answered adetailed survey about their beliefs, attitudes andbehaviors. An average of 13 months later, in Spring

Benefits to Participants 31
2001, they were asked these same questions again.Changes in youth’s responses from the initial to thefollow-up survey suggest that youth who attendedESS were more likely to react in a more sociallyappropriate manner to social challenge and were lesslikely to have begun to drink alcohol.
This change is illustrated in Table 6, which considerstwo theoretical groups of youth. Youth in the twogroups are similar, and their responses to questionsabout behaviors and attitudes on the initial, pre-ESSsurvey, in 1999-2000, were identical. One group thenattended ESS two days a week, the approximate aver-age number of days that youth participated acrossthe 10 intensive research sites. The other group didnot go to ESS.
On the second survey, administered 13 months later,73 percent of the youth who went to ESS indicatedthat they handled their anger in socially appropriateways, through their responses to questions aboutwhether they hit or yelled when they were angry,tried to talk things out with the person with whomthey were angry or talked to an adult about the prob-lem. Among similar youth who did not go to ESSduring the research period, 53 percent indicatedthey handled their anger in socially appropriate ways.In addition, 9 percent of these ESS participantsreported they had started drinking alcohol over theresearch period, as opposed to 16 percent of similaryouth who did not go to ESS.27
School Attitudes and Behaviors
Most program operators, teachers and fundersbelieve that youth’s participation in after-school activ-ities, such as those offered by the ESS programs, canpositively affect academic attitudes and efforts and,ultimately, performance. Despite these assumptionsand hopes, however, the links between youth devel-opment activities and academic outcomes are notfully understood. Teachers, principals and programstaff have repeatedly told us that an important bene-fit of after-school programming is that it makes theyouth more ready to learn (to sit still, pay attentionand try harder) when they are in school. Many alsoexpect that the help youth get on homework will alsolead to better performance in school.
Data are just emerging about how after-school pro-gramming affects academics. Most of the after-schoolprograms that have been shown to have an impacton academics are those that mandate five-day-a-weekattendance. And even then, grades have been slow tochange. In one study, for example, the authors foundthat youth in after-school programs did begin toattend school more often but, at first, there was noimpact on grades.28
Given that most of the ESS programs were new andthe levels of participation were well below five days aweek, it was not thought likely that we would observechanges in grades or test scores. However, to gaugewhether ESS was starting to have positive academic
Table 5:Youth and Parent Reports: Staying Out of Trouble
Youth Report:ESS…
helps me stay out of trouble 65%helps me learn how to say no to things that
I know are wrongor that make me uncomfortable 62%
helps me deal calmly with people who are being mean or starting fights 48%
Parent Report:ESS…
helps my child stay out of trouble 84%helps my child settle arguments
without fighting 72%
Table 6:The Relationship Between ESS and Staying Out of Trouble*
Days Per Week of ESS0 days 2 days Difference
Percent indicating they handle anger in socially appropriate manners 53 73 +20
Percent reporting they started drinking alcohol 16 9 -7
*Based on statistical analysis of the baseline and follow-up surveys.

32 Multiple Choices After School: Findings from the Extended-Service Schools Initiative
effects, we asked parents and youth if they thoughtthe program helped the youth do better in school. Inaddition, we measured some “leading indicators” ofacademic improvement (a sense of academic masteryand the level of school effort) to ensure that we didnot miss an important change if one had occurred.
As Table 7 illustrates, approximately two-thirds of theyouth believed the program helped them do betterin school, and it was even more likely that the par-ents found the program helpful to their children inthis way. However, only half of the youth reportedthat they liked school better because of the program.As one of the parents in our interview study sug-gested, the youth may like going to school becausethat allowed them to go to ESS after the traditionalschool day, but they did not necessary like the schoolday better. The youth did, however, feel that ESShelped them understand that hard work can pay off.
Interestingly, the parents’ survey responses are con-sistent with the expected pathway of change thatcould ultimately lead to increased academic success.High percentages of parents felt that ESS helpedtheir children like school more and try harder inschool, factors that may lead to learning more anddoing better.
When we examined how the youth’s academic atti-tudes and behaviors changed over time, we found aconsistent story. Youth who participated in ESS activi-ties experienced a greater increase in their sense ofbelonging at school and paid more attention in class.
Again, consider the two groups of similar youth. AsTable 8 illustrates, among the youth who did not goto ESS during the 13 months between the initial andfollow-up surveys, 20 out of 100 reported that theystarted skipping school, 29 said they really paid atten-tion in class, and 76 said they were very proud tobelong to their school. Among similar youth whowent to ESS two days a week, only 11 out of 100reported starting to skip school; 49 said they reallypaid attention in class; and 84 said they were veryproud to belong to their school.
Social Benefits
With schools squeezing in as much learning as possi-ble during the day, times that have traditionally beenavailable to students for socializing, such as lunchand recess, have been shortened or eliminated, leav-ing youth with fewer opportunities to socially interactwith one another. And yet, during the late elemen-tary school and middle school years, learning toappropriately interact with peers is a pressing devel-opmental task.
After-school activities offer youth time to be with awide range of their peers. By providing them withopportunities for these social interactions, the pro-grams offer youth a chance to improve their socialcompetence and get to know, and get along with, amore diverse group of peers. For some youth whoare socially isolated, perhaps because they are new tothe school or because other factors have made it dif-
Table 7:Youth and Parent Reports: School Attitudes and Behaviors
Youth Report:ESS…
helps me do better in school 65%helps me like school more 50%helps me learn that hard work pays off 71%
Parent Report:ESS…
helps my child do better in school 79%helps my child like school more 86%helps my child try harder in school 82%helps my child complete homework 71%
Table 8: The Relationship Between ESS and School Attitudes and Behaviors*
Days Per Week of ESS0 days 2 days Difference
Percent reporting they started skipping school 20 11 -9
Percent reporting they really paid attention in class 29 49 +20
Percent reporting they felt very proud to belong to their school 76 84 +8
* Based on statistical analysis of the baseline and follow-up surveys

Benefits to Participants 33
ficult for them to regularly interact with peers, partic-ipation in the after-school programs may lead totheir feeling less socially isolated.
Indeed, as Table 9 illustrates, a benefit of ESS thatwas commonly cited by both youth and parents isthat the program helps the youth make friends andget along better with their peers. In addition, 61 per-cent of the participants said that being in ESS helpedthem feel “less shy around adults,” suggesting thattheir experiences in the program are helping themmore easily interact with adults.
Skills, Self-Confidence and Life’s Possibilities
The final set of outcomes we examined includedlearning new skills, seeing new possibilities in lifeand gaining self-confidence. Both parents and youthfrequently cited these benefits (see Table 10). In fact,
more than 9 out of 10 parents felt their child learnednew skills and expanded their interests. Both parentsand youth overwhelming felt that ESS helped theyouth feel better about himself or herself.
What Were the Benefits to Parents oftheir Children’s Participation in ESS?
In addition to directly benefiting youth, we expectedthat participation in the after-school activities couldpositively influence the quality of the parent-childrelationship through a number of routes. First, it hasthe potential of decreasing parental stress by provid-ing after-school care—a benefit that would be of par-ticular importance to the large majority of theparents who were employed (69% had full-time jobsand 12% held part-time jobs). The after-school activi-ties could also eliminate a major source of parent-child tension by providing opportunities for studentsto complete their homework before going homeafter school and, in addition, could supply youthwith support from other adults so they are lessdemanding of parental attention.
In addition, research on mentoring has found thatclose connections with non-parent adults can fosterimprovements in youth’s ability to connect with oth-ers.29 Through consistently warm and accepting inter-actions with program staff, youth can begin torecognize the potential that exists in close relation-ships and open themselves up more to the peoplearound them, particularly their parents.
Responses on the parent survey administered inSpring 2001 suggest that the after-school programswere having some of these beneficial outcomes:
Table 9:Youth and Parent Reports: Social Benefits
Youth Report:ESS…
helps me make friends 73%helps me be less shy around kids 63%helps me learn about other
cultures 52%
Parent Report:ESS…
helps my child make new friends 92%helps my child get along better
with other children 86%
Table 10:Youth and Parent Reports: Skills, Possibilities and Self-Confidence
Youth Report:I see that I have choices and possibilities in life that I didn’t know I had 74%The after-school program helps me do things I didn’t think I could do 72%It helps me feel good about myself 69%
Parent Report:The after-school program helps my child learn new skills or develop new interests 91%The after-school program helps my child feel more self-confident 88%

34 Multiple Choices After School: Findings from the Extended-Service Schools Initiative
• 80 percent of parents said they were less wor-ried about their child’s safety after school.
• 57 percent said their child’s participationhelped them manage their own work schedule.
• 47 percent said it let them attend classes or jobtraining more easily.
• 45 percent said it helped them get a better jobor do better at their job.
In addition, 86 percent of parents said the programwas helping them to more appreciate their child’stalents, and 74 percent said the program helpedtheir child get along with family members.
What are the Implications of theseFindings for Policy and Practice?
In this chapter, we examined the relationshipbetween participation in school-based, after-schoolprograms and a range of academic, behavioral, socialand attitudinal outcomes. Like other studies, weasked parents and youth what effects they believedaccrued from participating in the ESS programs. Tocomplement the opinion data we obtained from par-ents and youth, we also examined, for some out-comes, how youth’s attitudes and behaviors changedfrom the time they first started their ESS participa-tion (between Fall 1999 and December 2000, untilSpring 2001). We developed a comparison betweenyouth who went to ESS an average of twice a weekand youth who did not attend the after-school pro-gram at all. Our findings suggest these lessons forpolicymakers and practitioners:
• Participation in school-based, after-school programsis associated with behavior that could help youthstay out of trouble. One key goal of after-schoolprograms is to provide youth with productiveways to use their out-of-school time and, thus,reduce their opportunities for risk-taking behav-ior. Our findings are consistent with ESS havingthis effect. Youth who attended the after-schoolprograms reported less often that they hadstarted drinking alcohol, and more often indi-cated that they handled their anger in sociallyappropriate ways. In addition, in the survey ofparents, more than 80 percent agreed that“helping my child stay out of trouble” was amajor benefit of ESS.
• Participation in the after-school programs is associ-ated with positive effects on school attitudes andbehaviors, but it is too early to know whether it hasan impact on students’ grades and test scores. A sec-ond important goal of after-school programs isimproved academic outcomes for youth.Because most of the ESS programs were newand students participated, on average, fewerthan two days a week, we did not expect to findchanges in grades and, thus, instead examinedindicators of academic improvement, such asyouth’s sense of competence in school and theirlevel of effort. We found that youth whoattended ESS reported more often that theyreally paid attention in class and were veryproud to belong to their school, and they lessoften reported that they had started skippingschool during the period between the baselineand follow-up surveys. In addition, in their ownsurvey responses, more than 80 percent of par-ents agreed that participation in ESS “helps mychild try harder in school,” and 70 percent ofthe youth similarly agreed that their participa-tion in the after-school program “helps melearn that hard work pays off.”
As earlier studies have also found,30 participants andtheir parents reported other social, academic andpersonal benefits. Between 80 and 90 percent of par-ents agreed that the after-school programs helpedtheir child make new friends, learn new skills andincrease their self-confidence. Although youth citedfewer benefits than their parents, approximately 70percent of them agreed that participation in ESShelped them make friends, see new life choices andfeel better about themselves.
The Cost and Funding of After-School Programs 35
VI. The Cost and Funding of After-School Programs
In contemplating new after-school initiatives, policy-makers naturally ask, “How much does it cost to runone of these programs?” This deceptively simplequestion can have many answers, depending on whatis included or excluded when defining “cost.”
This chapter attempts to provide full and usefulanswers to the question by costing out 10 after-schoolprograms using the same criteria and including thesame cost components, regardless of whether pro-grams paid in cash or received contributions.31
Because of this equal treatment, it is possible to esti-mate the average cost of an after-school program,examine the different cost components and look atthe factors that drive the costs. The discussionfocuses on programs that are running four or fivedays a week, and it does not include planning andstart-up costs. In addition, it is important to note thatthe cost study did not examine the relationshipbetween costs and benefits to youth who participatedin ESS at these schools.
The chapter examines the following questions:
• What is the approximate cost of a typical after-school program? What is the approximate dailycost for each youth slot?
• What are the major cost components? Which ofthose costs will most likely be paid through thecash budget? Which could most likely be cov-ered through redirected contributions frompartner agencies?
• What factors drive costs?• What are the major funding sources and what
strategies are sites using to become sustainable?• What are the implications of these findings for
policy and practice?
Answers to these questions can provide a frameworkfor policymakers and program planners as they assem-ble the building blocks to finance new after-schoolprograms or re-evaluate the funding of existing ones.While the data are drawn from 10 ESS sites, themethod of estimating costs should be applicable tomost in-school, after-school programs. It can also beadapted for after-school programs in other settings,where some of the factors driving costs may vary.32

36 Multiple Choices After School: Findings from the Extended-Service Schools Initiative
What Does It Cost to Run an After-School Program
Ten geographically dispersed after-school programsof different types cost an average of approximately$150,000 during the school year. The typical pro-gram provided youth services from September toJune for five days a week during the two or threehours after the school day ended and served 63youth per day.
As Table 11 illustrates, across the 10 sites, the totalcost of an after-school program during the schoolyear ranged from a low of $63,118 to a high of$265,742. The range in costs is not simply a reflec-tion of the number of youth served. A useful budget-ing tool in planning after-school programs is a unitcost measure. Ideally, after-school programs planyouth activities, snacks and transportation for thenumber of youth who actually attend rather than thenumber of youth who are scheduled to attend.Therefore, this study estimated the cost per day ofone youth slot when the programs were fully opera-tional.33 Among the 10 programs, the average unitcost per day for a youth slot was $15. However, as wewill later discuss, the unit cost varied from a low of $8to a high of $36 across the 10 programs.34
The following section looks at the various compo-nents—the building blocks of after-school programbudgets—that contribute to these costs.
What Were the Largest CostComponents?
Figure 2 illustrates the average distribution of costcomponents across the 10 ESS programs. Althoughthe programs adapted different models and serveddifferent age groups, some clear budgeting patternsemerged. Across the sites, the largest cost compo-nent was the administration of programs, which rep-resented 54 percent of total costs. Although, at firstglance, it might appear that the after-school pro-grams were top heavy with administration, this is notnecessarily the case. A later section examines whatdrove those costs, which include professional salariesand the time and expertise contributed by top-leveladministrators who helped build the programs’ infra-structure.
As one might expect, the cost of providing youthactivities—hiring adults to lead the after-school activi-ties and providing the equipment and materials—isone of the most expensive items (on average, 35% oftotal cost). At the same time, the cost of the remain-ing services was a smaller part of total costs than pro-gram planners might have initially thought. The totalcost of providing transportation, snacks and custodialhelp—all essential components of an after-schoolprogram—accounted for only about 11 percent ofprograms’ expenses.
What Was the Division Between CashExpenditures and Costs Covered ByPartner Agencies?
After-school programs covered their expenses in twoways: through cash expenditures and redirected con-tributions, which include expenditures covered bypartner organizations, the value of contributed time,and other services, such as bus transportation andcustodial assistance.35
Across the 10 ESS programs, cash budgets covered,on average, about 60 percent of the total cost. Schooldistricts and other partner organizations covered theremaining costs with redirected contributions. Onaverage, after-school programs’ cash expenditureswere about $89,000, or approximately $9 of the $15cost per day per youth slot. The programs’ additional$61,000 of expenses were covered by the redirectedcontributions, or approximately $6 of the cost per
Table 11:Cost Profile of 10 After-School Programs
Average Range
Total cost $149,620 $63,118-$265,742
Number of weeks 33 30-36Number of days
per week 4.7 3-5Number of youth
served daily 63 25-88Total cost per day of
one youth slot $15 $8-$36

The Cost and Funding of After-School Programs 37
Figure 2:Average Distribution of After-School Program Costs
Figure 3:Average Cash and Non-Cash Expenditures Across 10After-School Programs
Administrative Salaries 47%
Snacks 3%Transportation 6%Custodians 2%
Youth Activities 35%
Other AdministrativeCosts 7%
20,000
40,000
60,000
80,000
100,000
120,000
140,000
$160,000
Redirected TotalCash
$89,059
$56,268
$4,773$28,018
$23,316
$79,584
$52,666
$17,371
$24,648
$12,597
$60,561
$149,620
Admininistration (salaries and other)
Youth Activities
Custodians, Transportation and Snacks
day per youth slot.36 Thus, on average, 40 percent ofthe after-school programs’ costs came from redi-rected contributions. However, it is important to notethat the percentage of costs covered by these contri-butions ranged from 5 percent to 58 percent amongthe 10 programs.
Program costs can be organized into three major cat-egories: administration; youth activities; and supportservices, including custodial help, transportation andsnacks. In general, cash expenditures and redirectedcontributions covered different areas of costs. Cashexpenditures went primarily for salaries for adminis-trators and leaders of youth activities. The combinedsupport services of custodial help, transportation andsnacks accounted for only about 5 percent of thecash expenditures. Redirected contributions prima-rily covered the costs of additional administrativeexpertise, salaries of youth leaders, custodial help,transportation and snacks. Figure 3 illustrates theaverage cash and non-cash expenditure in each ofthese categories.
Administrative Costs
Almost all of the administrative cash cost was forsalaries—programs spent an average of $48,000 onthis item. As described in Chapter II, a typical after-school site had a program director and a site coordi-nator. In some cases, there was also one or moreon-site support staff. Where the program director wasa full-time job, the annual salary with fringe benefitsranged from $34,000 to $60,000. In those cases, thedirector administered from three to six after-schoolprograms throughout the city. Where the positionwas a part-time job, the director usually worked 20hours a week and was responsible for three or fourprograms. In some cities with only one or two after-school programs, an executive-level administratorfrom a college or a CBO filled the program direc-tor’s role.
Site coordinator salaries ranged from $5,000 to$39,000, depending on the number of hours workedand the salary scale for that program. In addition,some programs hired support staff, although theirsalaries were a small component of administrativecosts. Among the 10 programs, support staff rangedfrom a full-time program staff person to minimum-wage, part-time assistants to stipended high school-age youth workers (often high school students who

38 Multiple Choices After School: Findings from the Extended-Service Schools Initiative
had previously attended the program), to no supportstaff at all.
In addition to the costs of paying salaries, the pro-grams needed another $8,000 to cover other cashexpenditures, such as office expenses, staff trainingand public relations.
The redirected contributions that covered adminis-trative costs took the form of contributions of admin-istrative time and expertise. After-school programsreceived assistance from administrators in their spon-soring community organization, partner communityorganizations, the school districts and colleges.
The cost of these contributed hours was a significantportion of the overall administrative cost, and itsimportance could extend beyond administrative serv-ices, such as handling the payroll and doing thefinancial reporting. For example, although programdirectors spent some of their time nurturing partner-ships and doing fundraising, another method ofdeveloping funding was to obtain the services of agrant writer, and this was usually a contributed serv-ice. Although fundraising increased the cost of pro-grams in the short term, the programs oftensucceeded in expanding their funding base andsecuring the sustainability of their activities for thenext several years.
Youth Activities
The major cost associated with the youth activities wasthe salaries of the activity providers, who includedteachers from the schools, staff from CBOs and otheradults. The programs spent an average of $28,000 incash expenditures on youth activities, almost all ofwhich went to pay hourly wages to the activity leaders.Most of the redirected contributions in this area simi-larly went to cover the salaries of activity providerswho were on the staff of partner agencies.
Support Services
Although bus transportation, snacks and custodialhelp—all essential components of after-school pro-grams—can be expensive items, the majority of sitesobtained these services by developing strong partner-ships with their host schools and school districts.School districts covered most or all of the cost of
snacks, buses for transportation home and additionalcustodial hours beyond the usual school requirements.
On average, after-school programs spent approxi-mately $5,000 in cash expenditures on all threeitems. Eight of the 10 programs incurred no cashexpenditures for custodial help, and half of the pro-grams were able to obtain snacks through theDepartment of Agriculture’s nutrition program attheir schools. Most school districts rearranged busschedules to accommodate the after-school pro-grams, so programs often paid only for bus trans-portation for field trips.
What Makes Some Programs Cost More(or Less) Than Others?
The total cost of the 10 after-school programs rangedfrom approximately $63,000 to $266,000. As Table 12illustrates, there was a similarly large range across eachof the component parts of the programs’ budgets.And while the average number of youth served dailyvaried widely among the programs—from 25 to 88—the range in costs was not simply a function of num-bers of youth served. In fact, the daily cost per youthslot ranged from $8 to $36, with an average of $15.
The cost of individual after-school programs dependedon a number of factors: program’s choices and oppor-tunities; basic requirements of their community setting(for example, the need for transportation); and theirrelative ability to plan accurately for the actual numberof youth who would be participating. In addition, someprograms had higher costs because they were very suc-cessful in forming partnerships and, thus, were able toleverage additional resources for youth activities or forfundraising and other efforts to develop and sustain
Table 12:Range of Component Costs Across 10 After-School Programs
Low Average High
Program Administration $36,000 $80,000 $145,000Youth Activities $22,000 $53,000 $98,000Transportation $0 $9,000 $34,000Snacks $1,000 $5,000 $11,000Custodians $0 $3,000 $11,000

The Cost and Funding of After-School Programs 39
their programs. Their higher costs, in other words,were a function of having greater resources thatallowed them to do more.
Choices and Opportunities
Programs costs are affected by the choices madeabout administrative structure, the types of activitiesprovided and the staff-to-youth ratio, as well as thedegree of focus on factors such as fundraising andthe future sustainability of the program. Lookingacross programs at the high or low level of expendi-tures for these components, one can ask, “What didthe program gain?” or “What did the program dowithout?”
1. Administrative structure. The largest cost com-ponent of all 10 after-school programs wasadministration, and the two key staff positionswhose salaries are included in this cost are theprogram director and the site coordinator.While those positions were almost always cov-ered through cash expenditures, many of theprograms were also able to leverage additionaladministrative expertise from partner agenciesthat contributed staff time.
What appears to matter most in administrativecosts is that sufficient resources are expendedon the internal management of the after-schoolprogram, and on developing and maintainingexternal partnerships and working to create asolid base of funding. Ideally, the site coordina-tor was a full-time position and the programdirector was budgeted for a sufficient numberof hours to fulfill the essential role of develop-ing partnerships, raising funds and performingthe numerous other tasks that are necessary forsustaining programs.
When either the program director’s or sitecoordinator’s role was allocated too few hoursin the budget or left unfilled for months at atime, the after-school programs suffered.Problems that surfaced included a drop inyouth attendance and a lack of system buildingfor future sustainability. In addition, while thetime contributed by partner agencies increasedtotal program costs, it also had the positiveeffect of building the infrastructure of the after-school programs.37
2. Activity leaders’ salaries. A key factor in the costof activity leaders was the extent to which theschool’s regular teachers were involved in theafter-school program and how their salarieswere covered. Some of the after-school pro-grams hired non-teacher activity leaders whocould work at a pay scale that was lower thanteachers’ union-mandated hourly salaries. Insome cases, however, programs specificallysought the expertise of certified teachers (aprogrammatic choice) even if it meant payinghigher salaries. In other instances, the teachers’higher hourly salaries were easily coveredbecause redirected funds for this purpose wereavailable through the school district (an oppor-tunity). Finally, in some school districts, teach-ers were paid lower hourly salaries for work inthe after-school programs than they receivedduring the regular school day.
In addition, decisions to hire other staff for theafter-school programs, beyond the regular activ-ity leaders, also increased costs. One program,for example, had a physical education teacheras a part-time member of the after-school staff.Another program had the part-time, con-tributed services of a police officer from a com-munity relations department.
3. Serving more youth for fewer days. To meet theneeds of their particular communities, plannersat some of the sites chose to have their after-school programs serve a large number of youthless intensively—each youth attended for fewerdays per week. Sites that made this decisionincurred higher administrative costs becausethey had to handle the transportation andother logistics of having a different group ofyouth scheduled for each day.
4. Breadth and types of youth activities. Some pro-grams offered activities, particularly perform-ance and visual arts activities, that were morecostly to run but enriched the program.Typically, they were able to do this because oftheir success in forming partnerships and lever-aging resources. One site, for example, offeredan art activity—funded through redirected con-tributions from a partner organization—thatwas led by working artists who were paid a rela-tively high hourly rate.

40 Multiple Choices After School: Findings from the Extended-Service Schools Initiative
5. Staff-to-youth ratio. Some after-school programshad higher costs because of decisions to providementoring or one-on-one tutoring, or to simplyhave more staff available to interact with youth.In some cases, programs hired high schoolyouth or college students to supplement theirstaff. One program benefited from the con-tributed services (calculated as part of the totalcost) of graduate students on assistantships whomentored and tutored individual youth. Whenprograms hired high school youth, the addedexpense was minimal because they receivedminimum wage salaries or stipends. Thoseyouth, who had formerly attended the after-school program as middle-school students,could serve as role models for participants, aswell as improving the staff-to-participant ratio.In addition, working in the after-school pro-grams provided them with opportunities forleadership development.
Required Support Services
Program costs also were influenced by communitycontext, such as whether youth could walk home orrequired busing. Some of the programs incurredcosts for transporting almost all youth home on adaily basis, while others that served a local neighbor-hood had none of these costs at all. Most school dis-tricts covered all or part of the cost of daily busing (aredirected contribution); the programs paid fortransportation for field trips from their cash budget.
Across the programs, there was a range of costs forother required services, including snacks and custo-dial help. Costs of participants’ snacks varied,depending on whether the after-school programsobtained them through the schools’ free andreduced-price lunch program. The actual cost washigher per snack when the food came as a redirectedcontribution through this program, but the sites didnot have to rely on scarce cash resources to cover thecosts. There was also a range of costs for custodialhelp. One school, for example, promoted one of itscustodians (at a cost of approximately $7,500 annu-ally) so he could be assigned to a later, one-personshift to cover the after-school program’s needs. Inanother school, custodians already worked the lateshift, so no cost was incurred when the school re-arranged cleaning assignments to accommodate theafter-school program.
Accurate Planning
Finally, the after-school programs’ ability to planeffectively for the actual number of youth who partici-pated each day had an effect on costs. Programs costmore if resources were under-utilized. Sites thatplanned activities, hired teachers and arranged trans-portation, not for the number of registered youth,but for the number of youth expected to attend,avoided paying for resources that ended up not beingused. As they became more familiar with participationpatterns, some of the programs solved the problem ofunder-utilization of resources by allowing over-enroll-ment for activities—they knew that only a percentageof the youth would attend. Other programs began tokeep waiting lists and replaced dropouts from anactivity with newly registered youth.
How Were the Programs Funded?
The ESS after-school programs received most of theirresources from foundations, school districts, govern-ment agencies and CBOs. Figure 4 shows, on aver-age, how the 10 intensive study programs werefunded for the 1999-2000 school year. Almost halfthe funding, 45 percent, came from foundationgrants, and more than 86 percent of that foundationmoney was from the Wallace-Reader’s Digest Funds.38
Foundation funding was usually given in the form ofcash grants and was primarily used to pay salaries.
School districts (and schools) contributed 21 percentof the funds, government agencies at federal, stateand local levels gave 17 percent and CBOs provided10 percent. While most of the support from CBOscame from program’s sponsoring organizations, sev-eral sites obtained significant additional resourcesfrom local, non-sponsoring CBOs. By design, youthattended the program at no cost to their families, sosites received no income from participant fees.39
The sidebar provides an overview of both the rev-enue and expenses of the average after-school pro-gram discussed in this chapter.

The Cost and Funding of After-School Programs 41
What Strategies Are Sites Using toSustain Their Programs?40
The ESS sites have, in general, developed strong rela-tionships with school districts, and many of themhave expanded their funding base to include govern-ment funds such as 21st Century CommunityLearning Center grants and state funding. However,they still face the task of sustaining their programsbeyond their grants from the Wallace-Readers’ DigestFunds, which were intended to get the sites up andrunning but not to sustain them over the long-run.
Recognizing that replacing those initial funds wasgoing to be challenging, sites began their efforts todo so as early as their second year of operations.
As with most programs, their primary strategyfocused on writing proposals for available state, foun-dation and federal funds. However, while they havegenerally been successful in this strategy, they alsohope to lessen their dependence on grants, whichare time-limited and often provide only relativelysmall amounts of funds. They, thus, have broadenedtheir fundraising strategies in several ways.
Foundations 45%
Business 1%Colleges 6%
CBOs 10%
Government 17%
Schools 21%
Figure 4: Average Funding Sources (including cash and redirected contributions)
Average Revenue and Expenses ofan After-School Program School Year 1999-2000
FUNDS
Revenue
Cash GrantsFoundations $66,073CBOs 5,286School districts 10,440Government (all levels) 5,458Businesses 1,803Subtotal: cash revenue $89,059
Redirected ContributionsCBOs $ 9,207School districts 21,268Colleges 9,470Government (all levels) 20,427Businesses 190Subtotal: redirected contributions $60,561
Total Revenue $149,620
Expenses
Program AdministrationSalaries $69,694Office expenses 3,427Outreach/training/conferences/travel 6,462Subtotal: program administration $79,584
Youth ServicesYouth activities (salaries, supplies, etc.) $52,666Custodians 3,455Transportation 9,267Snacks 4,649Subtotal: youth services $70,036
Total Expenditures $149,620
Fund balance, end of school year $0
Source: Cost data for 10 ESS after-school programs in the 1999-2000 school year.

42 Multiple Choices After School: Findings from the Extended-Service Schools Initiative
Expanding to Additional Schools
On the face of it, expanding a program would seemto be a paradoxical way to raise funds; but in three ofthe cities where the intensive research sites arelocated, planners considered starting after-schoolprograms in additional schools as a way of strength-ening their fundraising potential. ESS leaders sawthis move as politically smart—as a way to increasevisibility and attract funders who were interested inhaving broader coverage across a city. In addition,they perceived this approach as a way to coordinateefforts among after-school providers instead of hav-ing competition among them. To date, however,their efforts are in the early stages and only one ofthe cities has received funding for expansion.
Raising Renewable Public Funds
One approach for sustaining after-school programs isto raise dedicated, renewable public funds from astate, county or city. One site has successfullyaccessed federal Child Care and Development Fundsfor low-income children whose parents use the pro-gram as child care and who meet the income eligibil-ity requirements. In two other ESS cities, initiativeleaders have taken part in broad collaborative effortsto get legislation written to provide more funds instate budgets for youth development and after-schoolprograms. However, while efforts to pass legislationto support after-school programs may provide signifi-cant resources in the future, the cities have not yetmet with success. Going to the state legislature to getpublic funds is a long-term strategy, and one thatinvolves a considerable investment of time andresources.
Building on Local Partnerships
The design of ESS called for CBOs to play a leadingrole, and it was hoped that this role would includeinvolvement in developing a funding base that couldsustain the programs over time. To this end, the sitesare drawing on their partnerships in a number of dif-ferent ways. Four of the 10 intensive research sites(located in two cities) are built on the Bridges toSuccess model, in which local United Ways are keypartners. In those cases, the United Ways have pro-vided funds for the initiative, and this relationshipholds potential for continuing in the long term.
Other sites have, for the most part, also developedstrong partnerships that could contribute to long-term sustainability. In one case, for example, a part-nering organization (the Boys & Girls Clubs) joinedwith ESS because it was an opportunity to expand itsprogramming into schools, thus helping the organi-zation fulfill its mission of serving youth in a varietyof settings; and this partner has expressed its willing-ness to shoulder additional costs, if necessary, tokeep its current ESS program operating.
In two other ESS cities where the intensive researchsites are located, the school district has been a partic-ularly strong partner and led the way for sites toaccess to federal and state funds. Another site,located in a small city, has benefited from a pre-exist-ing and very successful collaborative of local non-profit organizations, state and county social serviceagencies, the health department, the school districtand the mayor’s office. Formed in the early 1990swith the common goal of providing services to thecity’s youth, the collaborative had a history of plan-ning initiatives and raising funds that made it anideal partnering group for ESS planners. The collab-orative was instrumental in helping to initially getESS funded in the city, and it has been an ongoingsource of support. It is through this collaborative thatESS has access to a grant writer, a county employeewho identifies potential sources of funds and writesmany of the proposals.
What are the Implications of theseFindings for Policy and Practice?
This chapter has “broken down” the cost compo-nents of after-school programs to help policymakersand practitioners “build up” new programs based onlocal choices and needs. Our findings suggest thesekey “lessons”:
• After-school program costs are reasonable but varyconsiderably, depending as much on programchoices, opportunities and local conditions as on thenumber of children served. In examining the costsof 10 ESS sites, we found that an after-schoolprogram can be run for an average of approxi-mately $150,000 per school year, serving 63youth each day for five days a week. This trans-lates into a unit cost (cost per day per youthslot) of about $15. Among the 10 programs,

The Cost and Funding of After-School Programs 43
However, as after-school programs grow to scale,this form of support is likely to become moretenuous. For example, while school district con-tributions to the after-school programs grewover the course of the initiative, districts in sev-eral of the ESS cities are feeling the pressure ofproviding “free” services without additionalincome. (In fact, two districts experiencedbudget reductions during the cost studyperiod.) Providing additional custodial hoursfor a limited number of after-school programscan sometimes be achieved with little or noadded expense to the district. However, as thenumber of after-school programs increases,there will be a demand for added custodialstaff. In addition, while the ESS programs wereexempt, some school districts charge commu-nity programs for the use of the school build-ing. And even where districts consider theschools a community resource already paid forby tax dollars, there may be a point at whichschool dollars can no longer cover the expand-ing costs connected with increased use of theirbuildings. At that point, the districts will have tocharge for services or find new tax revenue.41
Making after-school programs part of the offi-cial school district budgets, funded by taxes, hasnot yet happened.
A similar dilemma exists for CBOs. Currently,many CBOs share their resources with fledglingafter-school programs. These local CBOs gener-ally have relatively stable funding and an admin-istrative infrastructure that enable them to assistnew programs with many redirected contribu-tions, including administrative expertise inmanagement and finances, and staff to leadafter-school activities. However, CBOs’ resourcesare limited. While the marginal cost of con-tributing to one after-school program may besmall, contributing to many after-school pro-grams in a city would require expandedresources for CBOs, including the hiring ofadditional staff.
After-school programs, while rapidly growing, cur-rently provide services for only a small percent ofeligible youth. The experience of the ESS sites sug-gests the challenges involved in finding sustainablesources of cash funding. As after-school programsmultiply, the challenges are likely to increase for all
however, the cost ranged from $8 to $36 peryouth slot per day. The unit cost depended asmuch on the after-school programs’ choicesand their initiative in leveraging additional redi-rected contributions, as on the number ofyouth who actually participated each day.
• Schools and school districts are essential sources ofsupport. They made important cash and redi-rected contributions to the programs. In the 10ESS sites studied, these partners contributed,on average, more than 20 percent of the cost ofthe program, including some or all of the costof transportation, snacks and custodial assis-tance. This contribution was in addition to therent-free use of the school building.
• About 60 percent of the ESS programs’ budget needswere funded by cash grants. Raising these funds tosustain the programs over time is a challengingundertaking. The cash budget is the core of theprogram—it pays the salaried staff that adminis-ter the program and leverage the redirectedcontributions. For the ESS sites, a large percent-age of their cash budget came through supportfrom the Wallace-Reader’s Digest Funds.Sustaining the programs over time, after initialfunding ends, is likely to be an ongoing chal-lenge. Strong leadership—whether it comesfrom a CBO, the school district or another part-nering organization—will be a key to success.Thus far, several strategies have seemed promis-ing: starting out the initiative in the Bridges toSuccess model, with its United Way funding;having strong lead agencies for whom the ESSinitiative fits a need; and developing strongpartnerships with other providers and funders.Some sites have collaborated with other youth-serving initiatives to work toward the ultimategoal of dedicated state funding, but this is along-term strategy. More immediately, they arelikely to have to heavily rely on local resourcesfor youth programs, and the availability of thoseresources varies across cities.
• While much of the focus on planning and sustainingprograms tends to be on raising cash funding, thenon-cash portion of the budget cannot be taken forgranted. Across the 10 ESS sites, 40 percent ofthe budget, on average, was obtained throughcontributions from partner organizations.

44 Multiple Choices After School: Findings from the Extended-Service Schools Initiative
providers as more programs compete for limitedresources. In addition, schools and CBOs may needto cut back on their contributions unless theyreceive additional funding.
Conclusions 45
VII. Conclusions With the passage of the “No Child Left Behind Act”in January 2002, the issue of after-school program-ming will be on the minds and agendas of more peo-ple than ever before. This act converted the 21stCentury Community Learning Centers from a feder-ally to a state administered program. Every state iseligible to receive a portion of the billion dollarsappropriated for the program, giving all the states aconcrete funding opportunity to address the after-school needs of school-aged children. With thisopportunity will come the need to make many deci-sions about the goals, design and content of theafter-school programming, decisions that will influ-ence which children and youth participate, what theyexperience and how they may benefit.
This report has aimed to put policymakers and pro-gram operators on firmer ground as they make thesedecisions by providing concrete information fromexisting school-based, after-school programs. Whilewe by no means have all the answers, we hope policy-makers and program operators will be able to makebetter-informed decisions so that children and youthare better served.
What have we learned?
1. School-based, after-school programs can be put inplace fairly quickly and improve over time.
In our first report on ESS, we found that it typicallytook from six to nine for programs to find organiza-tional partners and staff, assess community needs,pool additional community and financial resources,identify activity providers, and recruit participants.42
The initial planning time was critical and, impor-tantly, the ESS programs each received a grant of$25,000 to $50,000 as well as technical assistance, tohelp support this process. Over their first three yearsof operations, almost all of the programs developedstrong relationships with their host schools, and theybecame better able to identify and address coregoals. They also began to focus more on addressingprogram quality, rather than just program provision.
2. Demand for the programs is substantial.
Polls notoriously overestimate demand. But in thecase of after-school programs, parents not only saythey want them for their children, they enroll theirchildren in large numbers. Among the 10 programs

46 Multiple Choices After School: Findings from the Extended-Service Schools Initiative
we intensively studied, eight considered themselvesto be operating at capacity—serving as many studentsas they could within their available resources—bytheir second year of operations. In fact, interest inthe after-school programs was so high, relative toavailable resources, that three of those programscapped their enrollments, and one program, in itseffort to meet the demand for registration, limitedthe number of days a week for which each youthcould register. Across the eight sites that collectedparticipation data on all youth who were enrolled inESS (not just those enrollees who were registered forthis participation study), slightly more than half ofthe schools’ total populations were attending theafter-school programs.
3. Locating the programs in schools serving low-income families is a very effective means of target-ing services to low-income children and youth.However, special efforts are required if programsare going to be able to attract older youth and themost high-needs students in those schools.
The students served by ESS reflected the demograph-ics of their schools. While, across the sites, partici-pants were a diverse group of children and youth,they were overwhelmingly low-income, with almostthree-quarters eligible for free or reduced-pricelunch. However, while locating programs in schoolswhere students have identifiable needs can go a longway toward effectively targeting services, it is more dif-ficult to attract older youth to the after-school pro-grams and to recruit the most high-needs childrenand youth—the students who have the most difficultylearning, are most disengaged from school andexhibit negative behaviors. In ESS, as has also beentrue in other after-school programs, younger childrenmore frequently attended than middle-school stu-dents. In addition, despite efforts to develop recruit-ment strategies targeted to the most high-needschildren and youth, the programs found it challeng-ing to attract them to the after-school activities.
4. Choices about program requirements and contentinfluence which children and youth enroll in theafter-school activities and how often they attend.
Program characteristics affect participation patterns.At the ESS sites, planners had to make decisionsabout the goals and design of their programs thatultimately had an effect on which children and youth
chose to participate and how often they attended.These decisions inevitably involved some trade-offs.For example, planners who decided that the pro-gram should serve, in part, as child care for parentswere more likely to mandate, or at least allow, five-day-a-week enrollment. Planners who decided thattutoring would be a daily required activity for eachparticipant might, through this decision, have dis-couraged youth from attending who felt the mostfrustrated with academics and wanted to avoid anyadditional classroom-like work.
One key decision was whether to require five-day-a-week registration or to allow more flexible schedul-ing. Five-day-a-week programs could fully serveparents’ child care needs and increase the numberof days any particular student attended and, thus,potentially have a larger effect on developmental andacademic outcomes. However, programs thatdesigned their activities in a more flexible manner(for example, art on Mondays, judo on Tuesdays,etc.) and permitted registration for fewer days perweek touched the lives of a larger number of youthand may have attracted a wider range of youth.
Survey responses of ESS participants and their par-ents suggest that there are no easy answers for pro-grams as they make their decisions. Substantialproportions of both the youth and parents said theyouth did not attend ESS more often because theyhad other things to do elsewhere. Some of theseyouth and their parents did not want to commit tomore intensive participation in a single program. Atthe same time, however, a significant number of par-ents said that restrictive enrollment policies—wheretheir children were allowed to register for only a fewdays a week—limited the amount of time they mightotherwise have participated in ESS.
5. The costs are reasonable.
The 10 geographically dispersed, after-school pro-grams of different types we studied had an averageunit cost of $15 per youth slot per day when all activi-ties were in session. The typical program ran fromSeptember to June for five days a week during two orthree hours after the school day ended, and served63 youth per day. Excluding the cost of using theschool space, programs ran for an average of approx-imately $150,000 for the year, with about 60 percent

Conclusions 47
of the cost being covered by cash grants and theother 40 percent through redirected contributions.
6. Cost varies considerably, depending as much onprogram choices, opportunities and local condi-tions as on the number of children served.
While the average unit cost of the 10 programs was$15 per youth per day, this unit cost ranged from $8to $36 across the 10 programs. The cost of individualafter-school programs depended on a number of fac-tors: decisions about administrative structure, thetypes of activities provided and the staff-to-youthratio; basic requirements of the community setting(for example, the need for transportation); and theextent of investment in such factors as fundraisingand the future sustainability of the program. Lookingacross programs at a high or low level of expendi-tures in each of these areas, one should ask, “Whatdoes the program gain by higher expenditures?” and “What does the program do without by holdingexpenditures at the low end of the range?”
7. The current funding system provides few long-term and stable financial resources for after-school programs.
While policymakers acknowledge the need to subsi-dize after-school programs in poor communities (asevidenced by the 21st CCLC funds, some state andlocal funds, and much philanthropic support), thecurrent system still requires programs to live year toyear, scrambling for funds. The most frequentresponses to this situation among the ESS sites wereto under-staff the programs and divert staff time tofundraising. While under-staffing was the most com-mon response, it was also the least effective way tomeet budget constraints. Staff quality is the key todelivering high-quality programming. When therewere not enough staff to do the job, work wentundone—including program development, stafftraining and supervision. Additional funding to sup-port more complete staffing is critical, but programsoften found it difficult to undertake sustainedfundraising efforts because that is full-time work, andthey were already dealing with staff shortages. Sitesthat were able to explicitly focus resources onfundraising were more successful in expanding theirfunding base and securing their sustainability for sev-eral years. Those programs, however, cost more in
the short term because of the expenses incurred inundertaking this kind of development work.
The experience of the ESS sites suggests the chal-lenges involved in finding sustainable sources of ade-quate funding. As after-school programs multiply, thechallenges are likely to increase for all providers asmore programs compete for limited resources. Inaddition, programs may find it more difficult to gen-erate non-cash support as schools and CBOs will beasked to provide growing amounts of redirected con-tributions—something they may not be able to dounless they receive additional funding.
8. After-school activities have the potential to pro-vide a wide range of developmental supports andopportunities to children and youth. It is how staffdeliver the activities, not the topic or skill beingaddressed, that determines the strength of thosedevelopmental opportunities.
Activities of all types—be they academic, enrichment,community service or sports—can provide childrenand youth with valuable developmental supports andopportunities. By participating in a range of challeng-ing and interesting activities, young people have thechance to develop new skills and interests, build posi-tive and supportive relationships with adults andpeers, and develop a sense of mattering through mak-ing decisions and taking on leadership roles.
Staff practices and behaviors are the critical ingredi-ent. Staff in high-quality activities set up physically andemotionally safe environments in which they heightenand sustain youth’s interest, make the activity chal-lenging, and promote learning and self-discovery.Academic activities like homework help are a “given”in school-based, after-school programs and, whendone well, provide youth with strong adult supportthat has value beyond the immediate purpose of build-ing academic skills. At the same time, however, othertypes of activities seem to more readily lend them-selves to providing richer developmental opportunitiesto youth. These include well-implemented enrichmentactivities and open-ended, youth-driven projects inwhich participants work together in teams. Thus, pro-grams should consider offering a range of activities fortheir after-school participants, rather than focusingnarrowly on academics.

48 Multiple Choices After School: Findings from the Extended-Service Schools Initiative
9. Participation in the after-school programs wasassociated with improved school attitudes andbehaviors and with a greater likelihood of stayingout of trouble.
Two often-expressed goals of school-based, after-school programs are to reduce youth’s risk-takingbehavior and to improve their academic outcomes.When we examined outcomes related to risky behav-ior, we found that those who attend ESS programsreported less often that they had started drinkingalcohol and indicated more often that they handledtheir anger in socially appropriate ways. However, wecannot definitively say that the programs causedthese changes.
Because most of the ESS programs were new and stu-dents participated, on average, fewer than two days aweek, we did not expect to find changes in gradesand, thus, instead examined indicators of academicimprovement, such as youth’s sense of competencein school and their level of effort. We found thatyouth who attended ESS reported less often that theyhad started skipping school and reported more oftenthat they really paid attention in class and were veryproud to belong to their school. Again, while thesechanges were associated with participation in ESS, wedo not know whether the programs caused them.
Some of the apparent benefits may reflect the factthat better-behaved and more academically inclinedchildren and youth participate in school-based, after-school programs. However, participants and theirparents both echoed the benefits. Approximately 70percent of the participants cited making friends, see-ing new life choices, feeling better about themselvesand learning that hard work pays off as importantbenefits of attending the after-school programs.Parents even felt more positively about the benefitsof their children’ participation. Among the parents,80 to 90 percent said that ESS was helping their childmake new friends and get along better with theirpeers, stay out of trouble, like school more and tryharder in school, learn new skills and become moreself-confident.
In addition, parents felt that they also benefited.Almost half said that having their children in the ESSprogram helped them attend classes or job trainingmore easily, or helped them get a better job or dobetter at their job. In addition, 80 percent of parents
said they were less worried about their children’ssafety after school because of ESS.
However, after-school programs are not a panacea.Especially when considering older youth, who appearless likely to attend school-based, after-school pro-grams, policymakers may need to shift their thinkingfrom creating the program to expanding the set ofoptions available in a community.
As children become older, they begin to search for awider range of experiences. This expansion in theirworlds is developmentally appropriate, but it meansthat the participation rates of older youth in any par-ticular program—be it ESS or something else—willlikely be relatively low. They are most likely to benefitif they, and their parents, are able to put together amosaic of positive experiences—broadening therange of activities, widening their geographic hori-zons, and increasing their network of adults andpeers. If there are several opportunities in their com-munity that attract them, they can still be well servedeven though no one program seems to be engagingthem intensively. As a recently released NationalAcademy of Science report emphasizes, “The diversityof young people, their particular needs and their sur-rounding environments argue against the notion thata single [type of] program will fit all situations.”43
Programs that promote development—academic,physical, emotional and social—happen now in manyplaces, including schools, youth centers, churchesand libraries. And many of the children and youthwho participated in ESS attended other organizedactivities as well. In general, however, children andyouth in low-income communities have limited accessto high-quality, developmentally challenging activities,particularly in comparison to what is available inmore affluent neighborhoods. In addition to havingfewer resources, the young people in these communi-ties are vulnerable to more problems associated withpoverty and more risk factors, such as crime, drug useand diminishing opportunities for work.
Given the increasing challenges to children’s livesand the increasingly more complex sets of skills andabilities that are required for success in the work-place of the twenty-first century, we may need torevisit how and where we make investments in ournation’s children. This report has examined one typeof investment—school-based, after-school programs

Conclusions 49
run by CBOs in collaboration with schools. We foundthese programs, which are not strictly academic,appear to help participants work on many of thecompetencies they need for their future. When wellplanned and implemented, such programs can be asubstantial option within a potentially larger networkof diverse programming that provides a range ofopportunities for all children and youth.

50 Multiple Choices After School: Findings from the Extended-Service Schools Initiative

References 51
References
Carnegie Council on Adolescent Development1992 A Matter of Time: Risk and Opportunity in the Nonschool Hours.
Washington, D.C.: Carnegie Council on AdolescentDevelopment.
Eccles, Jacquelynne, and Bonnie Barber1999 “Student Council, Volunteering, Basketball, or Marching Band:
What Kind of Extracurricular Involvement Matters? Journal ofAdolescent Research, Vol. 14, No. 1, January. Thousand Oaks,Calif.: Sage Periodical Press.
Eccles, Jacquelynne, and Jennifer A. Gootman2001 Community Programs to Promote Youth Development. Washington,
D.C.: National Academy Press.
Gambone, Michelle Alberti1997 Launching a Resident-Driven Initiative: Community Change for Youth
Development (CCYD) from Site-Selection to Early Implementation.Philadelphia: Public/Private Ventures.
Gambone, Michelle Alberti, and Amy J.A. Arbreton1997 Safe Havens: The Contributions of Youth Organizations to Healthy
Adolescent Development. Philadelphia: Public/Private Ventures.
Grossman, Jean Baldwin, Karen E. Walker, and Rebecca Raley2001 Challenges and Opportunities in After-School Programs: Lessons for
Policymakers and Funders. Philadelphia: Public/Private Ventures.
Halpern, Robert, Julie Spielberger, and Sylvan Robb2000 Evaluation of the MOST (Making the Most of Out-of-School Time)
Initiative: Final Report. Chicago: Chapin Hall Center forChildren, University of Chicago.
Huang, Denise, Barry Gribbons, Kyung Sung Kim, Charlotte Lee, andEva L. Baker2000 A Decade of Results: The Impact of the LA’s BEST After-School
Enrichment Program on Subsequent Student Achievement andPerformance. Los Angeles: UCLA Center for the Study ofEvaluation, Graduate School of Education and InformationStudies.
Jamieson, Amie, Andrea Curry, and Gladys Marinez2001 School Enrollment in the United States—Social and Economic
Characteristics of Students, October 1999. Washington, D.C.:Bureau of the Census.
Langford, Barbara Hanson2001 State Legislative Investments in School-Age Children and Youth.
Washington D.C.: The Finance Project.
Larson, W.2000 “Toward A Psychology Of Positive Youth Development.”
American Psychologist, 55, 170-183. Washington, D.C.: AmericanPsychological Association Press.
Marshall, N.L., C.G. Coll, F. Marx, et al.1997 “After-School Time and Children’s Behavioral Adjustment.”
Merrill-Palmer Quarterly, Vol. 43:497-514. Detroit: Wayne StateUniversity Press.
Pettit, G.S. Pettit, R.D. Laird, J.E. Bates, and K.A. Dodge1997 “Patterns of After-School Care in Middle Childhood: Risk
Factors and Developmental Outcomes. Merrill-Palmer Quarterly,Vol. 43: 515-38. Washington, D.C.: Carnegie Council onAdolescent Development.
Reisner, Elizabeth R., Richard N. White, Jennifer Birmingham, andMegan Welsh2001 Building Quality and Supporting Expansion of After-School Projects:
Evaluation Results from the TASC After-School Program’s Second Year.Washington, D.C.: Policy Studies Associates, Inc.
Rhodes, Jean E., Jean Baldwin Grossman, and Nancy L. Resch2000 “Agents of Change: Pathways Through Which Mentoring
Relationships Influence Adolescents’ Academic Adjustment.”Child Development, 71, 1662-1671. Chicago: The University ofChicago Press.
Snyder, Howard N., and Melissa Sickmund1999 Juvenile Offenders and Victims: 1999 National Report. Washington,
D.C.: National Center for Juvenile Justice.
Tierney, Joseph P., Jean Baldwin Grossman, and Nancy L. Resch1995 Making A Difference: An Impact Study of Big Brothers Big Sisters.
Philadelphia: Public/Private Ventures.
U.S. Department of the Treasury1999 Investing in Childcare. Washington, D.C.: U.S. Department of
the Treasury.
Vandell, D.L., and J. Posner1999 “Conceptualization and Measurement of Children’s After-
School Environments,” in S.L. Friedmand and T.D. Wachs(eds.). Assessment of the Environment Across the Lifespan.Washington D.C.: American Psychological Association Press.
Vygotsky, L.S.1978 Mind in Society. Cambridge, Mass.: Harvard University Press.
Walker, Karen E., and Amy J.A. Arbreton2001 Working Together to Build Beacon Centers in San Francisco:
Evaluation Findings from 1998-2000. Philadelphia:Public/Private Ventures.
Walker, Karen E., Jean Baldwin Grossman, and Rebecca Raley2000 Extended-Service Schools: Putting Programming in Place.
Philadelphia: Public/Private Ventures.
Warren, Constancia1999 Evaluation of the New York City Beacons: Phase 1 Findings. New
York: Academy for Educational Development.

52 Multiple Choices After School: Findings from the Extended-Service Schools Initiative
Endnotes 53
Endnotes
1. Barbara Hanson Langford. State Legislative Investments in School-AgeChildren and Youth. Washington D.C.: The Finance Project, 2001.
2. See Investing in Childcare. Washington, D.C.: U.S. Department ofthe Treasury. 1999; and Amie Jamieson, Andrea Curry, and GladysMarinez. School Enrollment in the United States—Social and EconomicCharacteristics of Students, October 1999. Washington, D.C.: Bureau ofthe Census P20-533, 2001, p.3.
3. “Afterschool Alert, Poll Report: A Report on Findings of aNationwide Poll of Registered Voters on Afterschool Programs.”Afterschool Alliance, 2001. www.afterschoolalliance.org.
4. See Howard N. Snyder, and Melissa Sickmund. Juvenile Offendersand Victims: 1999 National Report. Washington, D.C.: NationalCenter for Juvenile Justice, 1999; D.L. Vandell, and J. Posner.“Conceptualization and Measurement of Children’s After-SchoolEnvironments,” in S.L. Friedmand and T.D. Wachs (eds.).Assessment of the Environment Across the Lifespan. Washington D.C.:American Psychological Association Press, 1999; N.L. Marshall etal. “After-School Time and Children’s Behavioral Adjustment.”Merrill-Palmer Quarterly, Vol. 43:497-514, 1997; G.S. Pettit et. al.“Patterns of After-School Care in Middle Childhood: Risk Factorsand Developmental Outcomes. Merrill-Palmer Quarterly, Vol. 43:515-38; and A Matter of Time: Risk and Opportunity in the NonschoolHours. Washington, D.C.: Carnegie Council on AdolescentDevelopment, 1992.
5. The six cities and their 10 schools were chosen because they hadthe capacity to collect the necessary data. They include three ele-mentary schools, four middle schools, and three mixed elemen-tary and middle-school programs. Very few cities operated highschool programs.
6. See Karen E. Walker et al. Extended-Service Schools:PuttingProgramming in Place. Philadelphia: Public/Private Ventures, 2000;and Jean Baldwin Grossman, Karen E. Walker, and Rebecca Raley.Challenges and Opportunities in After-School Programs:Lessons forPolicymakers and Funders. Philadelphia: Public/Private Ventures,2001. Both are available at www.ppv.org.
7. The chapter draws from information covered in the evaluation’stwo previous reports, as well interviews and organizational surveydata from Spring 2001, the programs’ third year of operations.
8. The founding organizations that provided technical assistance foreach model were the Fund for the City of New York’s YouthDevelopment Institute (Beacon programs); United Way ofAmerica and the Institute for Educational Leadership (Bridges toSuccess programs); the Children’s Aid Society in New York Cityand Fordham University’s National Center for Communities andSchools (Community Schools programs); and the University ofPennsylvania’s Center for Community Partnerships (WEPIC pro-grams). In addition, technical assistance from the Finance Projecthelped ESS programs connect to a broader network of after-schoolresources and identify a wide array of potential funding sources.Finance Project staff also visited each program to help themdevelop and implement a plan for long-term sustainability.
9. The data are from 52 programs that responded to a survey inSpring 2001.
10. See Grossman et al., Challenges and Opportunities in After-SchoolPrograms, for a discussion of the transportation issues the pro-grams faced during their early implementation period.
11. During summer, other vacation, in-school and during-school pro-grams, activity emphasis is naturally somewhat different than inprogramming during the after-school hours. During summer ses-sions, for example, there is relatively less time spent on academicactivities (although they are still an important offering) and rela-tively more time devoted to cultural enrichment and sports andrecreation. Activities offered during the regular school day focusalmost exclusively on academic help and sports and recreation.
12. A few of the ESS sites also provide additional services. Eleven pro-grams offer health services to students, and in some cases, theseservices also extend to parents. Two programs offer legal aid serv-ices. In conceptualizing extended-service schools, funders and pol-icymakers sometimes envision these supplemental services asbeing part of what school centers can offer. Because schools arewidely recognized public facilities in the hearts of communities,they appear to be ideal places for services like social work referraland health clinics. However, these types of services require carefulplanning and constitute an added expense. Not surprisingly, then,only a few of the ESS programs have attained the capacity toinclude them.
13. For a full discussion of the planning process and who wasinvolved, see Walker et al., Extended-Service Schools: PuttingProgramming in Place.
14. See Walker et al., Extended-Service Schools: Putting Programming inPlace, and Grossman et al., Challenges and Opportunities in After-School Programs.
15. Discussions of participation include Building Quality and SupportingExpansion of After-School Projects: Evaluation Results from the TASCAfter-School Program’s Second Year. Policy Studies Associates, Inc.,2001; and Evaluation of the MOST (Making the Most of Out-of-SchoolTime) Initiative: Final Report. Robert Halpern, Julie Spielberger andSylvan Robb. Chapin Hall Center for Children, 2000.
16. These youth are a subset of the total number of youth enrolled inthe ten programs. For youth to become part of the research study,their parents had to sign a permission slip and complete a formproviding demographic information and the reasons why theychose to register their children in ESS. Parents of approximately50 percent of the youth enrolled in ESS registered their childrenin the study.
17. One recent study that examines youth’s ongoing participation inafter-school programs suggests that effects take several semestersto materialize. See Denise Huang et al. A Decade of Results: TheImpact of the LA’s BEST After-School Enrichment Program On SubsequentStudent Achievement and Performance. Los Angeles: UCLA Center forthe Study of Evaluation, Graduate School of Education andInformation Studies, June 2000.
18. In its evaluation of programs operated by The After SchoolCorporation (TASC), Policy Studies Associates, Inc. similarlyfound that the proportion of students attending at least three daysa week was greater for programs serving elementary schools(81%) than for those serving middle schools (40%) or combinedelementary-middle schools (74%). See Building Quality andSupporting Expansion of After-School Projects.

19. In reporting why they enrolled their child in ESS, 83 percent of allparents surveyed said it was because the child wanted to getinvolved; 53 percent saw the program as offering their childopportunities for academic improvement; and 48 percent saw theprogram as a safe place for their child to be after school.
20. Another study points to some of the issues faced by planners asthey decide whether their programs should have mandatory five-day-a-week or flexible enrollment policies. A study of the SanFrancisco Beacons Initiative in its formative years found that par-ticipation during a typical month varied, in part, by the degree towhich attendance was mandatory. At three centers that includedprograms with mandatory attendance, one-fourth to one-third ofthe youth came 13 or more times during a typical month, oralmost every day the program was open. At the other centers,attendance was lower. For example, at one of the centers with lowattendance, roughly 79 percent of the youth came six or fewertimes in the typical month—on average, once a week or less. SeeKaren E. Walker and Amy J.A. Arbreton. Working Together to BuildBeacon Centers in San Francisco: Evaluation Findings from 1998-2000.Philadelphia: Public/Private Ventures, 2001.
21. Each of the 30 activities was observed two or three times. Eachtime, the researcher observed the entire activity and used anobservation instrument that required her to rate such features asthe quality of adult-youth relationships, peer relationships, deci-sion-making and leadership opportunities for youth, and youthengagement. Ratings were averaged over the two or three observa-tions to come up with a mean score for each characteristic.Characteristics were rated on a 5-point scale, with 5 being thehighest. Ratings of 2 or less meant not just the absence of a posi-tive dimension but the presence of something negative.
22. See, for example, Michelle Alberti Gambone. Launching a Resident-Driven Initiative: Community Change for Youth Development (CCYD)from Site-Selection to Early Implementation. Philadelphia:Public/Private Ventures, 1997; and Michelle Alberti Gambone andAmy J.A. Arbreton. Safe Havens: The Contributions of YouthOrganizations to Healthy Adolescent Development. Philadelphia:Public/Private Ventures, 1997.
23. In both of these poorly implemented activities, staff did not leadeffectively. In one, a recreational dance activity, staff were presentin the room, but did not instruct youth and barely interacted withthem. While this did not interfere with the girls’ enjoyment of theactivity (they taught each other dance steps and appeared to behaving fun), the adults did not take advantage of opportunities toprovide youth with developmental supports and opportunities.The second activity was chaotic both times it was observed.Misbehaving youth completely disrupted the activity because staffwere not effective in controlling the youth’s behavior.
24. L.S. Vygotsky. Mind in Society. Cambridge, Mass.: HarvardUniversity Press, 1978.
25. W. Larson. “Toward A Psychology Of Positive Youth Development.”American Psychologist, 55, 170-183, 2000.
26. See Joseph P. Tierney, Jean Baldwin Grossman, and Nancy L.Resch. Making A Difference: An Impact Study of Big Brothers Big Sisters.Philadelphia: Public/Private Ventures, 1995; and J.E. Rhodes, J.B.Grossman, and N.L. Resch. “Agents of Change: Pathways ThroughWhich Mentoring Relationships Influence Adolescents’ AcademicAdjustment.” Child Development, 71, 1662-1671, 2000.
27. The numbers in Table 6, and later in Table 8, represent estimatedoutcomes for two groups of youth who are identical in theirobservable characteristics but differ in the amount of time theyhave participated in ESS. The predicted outcome levels are basedon statistical analysis of the youth’s characteristics, their experi-ences and their outcomes as reported in the baseline and follow-up surveys. We discuss only outcomes that differ statistically by ESSparticipation at a 90 percent level of confidence. See Appendix Bfor more details about the methodology.
28. See Huang, A Decade of Results. In addition, a study of older youthhas found that participation in all forms of high school extracur-ricular activities (including sports, academic clubs, performingarts and school involvement activities) were associated with highergrade point averages in twelfth grade. See Jacquelynne Eccles andBonnie Barber. “Student Council, Volunteering, Basketball, orMarching Band: What Kind of Extracurricular InvolvementMatters?” Journal of Adolescent Research, Vol. 14, No. 1, 10-43,January 1999.
29. See Tierney et al., 1995; and Rhodes et al., 2000.
30. See Reisner, Elizabeth R. et al. Building Quality and SupportingExpansion of After-School Projects. Washington, D.C.: Policy StudiesAssociates, Inc., 2001; and Warren, Constancia. Evaluation of theNew York City Beacons: Phase 1 Findings. New York: Academy forEducational Development, 1999.
31. The 10 schools include three elementary schools, four middleschools, and three mixed elementary and middle-school pro-grams. The cost figures for each program cover the 1999-2000school year. Costs are for after-school programs only so that all 10programs can be compared on the same basis. Thus, while someof the ESS sites provided school-day activities, evening programsfor older teens or parents, separate weekend programs and sum-mer programs, these costs are excluded. In general, most costscover 10 months—for example, when salary costs are considered,only 10 months of a site coordinator’s salary is included. In addi-tion, the cost of using school buildings or other facilities isexcluded. See Appendix C for more details about the methodol-ogy.
32. The most obvious example of the different factors driving costs fornon-school-based, after-school programs is the probable lack ofaccess to free use of school space for programming. Thus, rentmight become a significant cost. But there are other, smaller fac-tors as well, including, for example, providing snacks through afederally funded nutrition program that schools, but not CBOs,can access.
33. Sometimes, after-school programs did not run a full schedule ofyouth activities until the second or third week of the program’ssemester. Likewise, some activities were of shorter duration andended before the after-school program semester ended. A “fully-operational program” refers to those weeks when all activities werein session.
The youth slot cost is calculated for those weeks. A “slot” may befilled by the same youth each day or by different youth on differ-ent days. For example, one youth attends on Monday andWednesday and another youth participates on Tuesday andThursday; together, the two youth occupy one youth slot.
34. The unit cost is estimated, as follows: the cost of the program perweek is calculated by dividing the average total program cost($149,620) by the average number of weeks of programming (33
54 Multiple Choices After School: Findings from the Extended-Service Schools Initiative

Endnotes 55
weeks). The average cost per week across all 10 programs was$4,534. The average weekly cost is then divided by the averagenumber of days per week that programs offer youth activities (4.7days). The average daily program cost is then divided by 63, theaverage number of youth who attend the program each day (oneproxy for this number is the number of snacks that a site serveseach day), resulting in the cost per day per youth slot of $15.
35. This study does not include the value of volunteer time in theredirected contributions.
36. Two recent studies have also examined the cost per day per youthslot in after-school programs. A cost analysis of Los Angeles’ LA’sBEST after-school programs, which were also operated in schoolfacilities, found an estimated cash cost of under $5 per day for oneyouth slot. Even with the addition of redirected contributions, theLA’s BEST unit cost is far below the ESS unit cost. There are sev-eral possible explanations. The most plausible one is that the pro-grams benefited from economies of scale—the LA’s BEST systemoperates more than 80 after-school programs and enrolls approxi-mately 15,000 youth during the after-school hours. This study wasreported at www.lasbest.org.
The study of the MOST (Making the Most of Out-of-School Time)initiative estimated an average weekly cost of about $80 per childper week for a five-day-a-week program, which is slightly morethan the ESS unit cost of $15 per youth slot per day. Although thestudy relied exclusively on program-supplied budgets, which werenot entirely comparable, many of the budgets counted expensescovered by redirected contributions. Unlike the ESS cost study,some of these budgets included rent for the use of facilities. SeeHalpern et al., Evaluation of the MOST (Making the Most of Out-of-School Time) Initiative.
37. In addition to these other factors, the four programs that oper-ated under the Beacon’s model tended to have higher administra-tive costs because they had an extra layer of administrativestructure. While the other models have two administrative layers(the lead agency and ESS program staff), there are three layers inthe Beacon’s model. A local intermediary provides technical assis-tance and acts as the fiscal agent for all Beacons in a city. Then,there is an individual lead agency for each Beacon program. Thethird layer is Beacon program staff.
38. The Wallace-Reader’s Digest Funds gave a substantial cash grant toeach ESS site in the initiative with the condition that school dis-tricts provide space and that sponsoring organizations obtainsome matching support.
39. One of the sites, in Boston, did charge families a fee for theirchildren’s participation because this was required by one of theirfunders.
40. Information in this section is based on interviews with key part-ners in the cities where the 10 intensive research programs arelocated and on responses to a survey sent to all of the ESS com-munities in Spring 2001.
41. Using tax revenues to help support after-school programs is not anentirely new idea. For example, in Minneapolis, the school districtwas able to contribute state-funded Area Learning Center dollarsto pay teachers of youth activities in the ESS programs.
42. See Walker et al., Extended-Service Schools: Putting Programming inPlace.
43. Eccles, Jacquelynne and Jennifer A. Gootman. Washington, D.C.:National Academy Press, 2001.

56 Multiple Choices After School: Findings from the Extended-Service Schools Initiative

Appendices 57
Appendix AThe Extended-Service School Models
The Extended-Service Schools (ESS) Initiative waslaunched in 1997 by the Wallace-Reader’s Digest Funds tocreate 60 extended-service schools in 20 cities across thecountry. Each city adapted one of four nationally recog-nized models that had been successfully developed andimplemented in other communities in the U.S. The mod-els are:
1. The Beacon, a collaboration of a school and commu-nity-based organizations (CBOs).
2. Bridges to Success, a collaboration of a school, sev-eral CBOs and a local United Way.
3. Community Schools, a collaboration of a school, aCBO and a university.
4. West Philadelphia Improvement Corporation(WEPIC), a collaboration of a school and a university.
The Beacon
Originally implemented in New York City Public Schools,primarily in middle schools.
Mission: To develop and operate school-based communitycenters; to create “safe havens” for youth and families inpoor neighborhoods; to promote youth development andresiliency.
Activities: A diverse array of youth development activities infive core areas: education, recreation and enrichment,career development, leadership development, and health.Activities take place during non-school hours and empha-size several factors important to youth resiliency: caringadult relationships, engaging activities, high expectations,youth’s opportunity to make a contribution, and continuity.
Governance: Each Beacon Center has a lead agency thatmanages all activities at the school. A local organizationprovides technical assistance in organizational develop-ment as well as youth development practices. An oversightcommittee, consisting of school district staff and executivestaff from key CBOs, provides general policy and manage-ment oversight. Each school has a school-level decision-making body that includes parents and other communityrepresentation.
Bridges to Success
Originally implemented in Indianapolis, Indiana.
Mission: To increase the educational success of students bybetter meeting the non-educational needs of children andtheir families through a partnership of education, humanservice and community service delivery systems, with along-range vision of establishing schools as “lifelong learn-ing centers” and focal points of their communities.
Activities: Vary according to site, but each site has an over-arching goal of promoting positive youth developmentduring non-school hours. Activities include educationalenrichment, career development, arts and culture, life-skills, counseling, case management, health and mentalhealth services, and recreation.
Governance: The Local United Way agency acts as the leadorganization and fiscal agent. A local governance structuremade up of United Way, school district, social service andcommunity representatives develops citywide program-ming strategies and oversees implementation. School-levelcouncils assess the needs and assets of the community, anddesign and implement program interventions. The coun-cils include a program coordinator, school principal andother school staff, parents, students and local partners.
Community Schools
Originally implemented in elementary and middle schoolsin the Washington Heights section of New York City by theChildren’s Aid Society.
Mission: “Educational excellence, combined with neededhuman services, delivered through school, parent andcommunity partnerships.” “Seamless integration of school-day activities with extended-day programs.”
Activities: A wide range of youth development programsduring the school day and in non-school hours. Socialservices, such as on-site clinics, legal assistance and casemanagement, are also provided. Parent education is animportant component of the Community Schools.
Governance: Co-management of school facilities by theschool and a CBO. Management staff from the CBO havespace in the school administrative office so they can fre-quently interact with school principals.
Additional characteristics of the ESS national adaptation:Local universities play a key role in technical assistanceand planning. An oversight committee, consisting of uni-versity staff, executive staff from key CBOs, and school dis-trict staff, provide general policy and management

58 Multiple Choices After School: Findings from the Extended-Service Schools Initiative
oversight. In addition, each school should have a school-level decision-making body that includes parents and othercommunity representation.
West Philadelphia Improvement Corporation(WEPIC)
Originally implemented in Philadelphia.
Mission: A school-based school and community revitaliza-tion program to produce comprehensive, university-assisted community schools that serve, educate andactivate all members of the community, revitalizing thecurriculum through a community-oriented, real-world,problem-solving approach.
Activities: Academically based community service, such asgraduate and undergraduate interns working in schools toprovide educational assistance and mentoring to youth.
Governance: School principals and staff play key decision-making roles, such as deciding what substantive areas willbe addressed through the initiative. Community councilsprovide guidance on program content.

Appendices 59
Appendix BResearch Overview and OutcomeMeasures
This appendix first provides an overview of the evalua-tion and data collection for the ESS study, then describesin detail the outcome measures used and how we exam-ined the relationship between change in outcomes andparticipation.
Evaluation Overview
In May 1998, Public/Private Ventures (P/PV) and theManpower Demonstration Research Corporation (MDRC)began the evaluation of the Extended-Service Schools(ESS) Initiative, with the aim of providing practitioners,funders and policymakers with a rich set of lessons abouthow local school-based collaborations unfold and whatthey do. Our goals were to understand what it took tooperate these ambitious programs; what practices con-tributed to high-quality, sustainable programming; whoparticipated and how often; and what effects the programhad on those participants.
The evaluation encompassed a multi-method approachdesigned to provide us with both an understanding of thebreadth of programming experiences and the ability tomore deeply delve into particular issues. To learn aboutthe activities of the ESS programs in all 17 cities involvedin the initiative, we asked the school coordinators and city-level program directors to complete annual organizationalsurveys summarizing what their programs were doing. Togain deeper insight into why sites were doing what theywere doing and to learn more about promising practices,we conducted multiple in-depth site visits to 10 citieswhose programs were operating fairly well by Fall 1998.During these visits, we interviewed staff, partners, students,parents and key city officials.
In 10 schools (located in six of those cities), we also col-lected computerized attendance records on program par-ticipants, gathered cost data, and administered baselinequestionnaires and follow-up surveys to fourth- to eighth-grade students who were enrolled in the ESS study.1 Tolearn about the program from the parents’ perspective, wealso conducted telephone surveys of ESS parents in these
Table B.1: Research Activities by City
Organizational Implementation Participation ActivitySurvey Site Visits and Cost Data, Observations
Youth and and In-DepthParent Surveys Interviews
Central Falls X X X X
Minneapolis X X X X
Missoula X X X X
Aurora X X X
Boston X X X
Savannah X X X
Atlanta X X
Denver Beacons X X
Jacksonville X X
Long Beach X X
Albuquerque X
Denver WEPIC X
Flint X
Greensboroand Highpoint X
Mesa X
Oakland X
Philadelphia X
Salt Lake City X

60 Multiple Choices After School: Findings from the Extended-Service Schools Initiative
six cities. Last, in three of the middle schools, we collectedin-depth, qualitative information through multiple observa-tions of all the ESS after-school activities and open-endedinterviews with 34 children and 25 of their parents. (TableB.1, summarizes the research conducted in each ESS city.)
Data
The 10 research schools enrolled youth in the study for 18months—from the beginning of the Fall 1999 ESS sessionthrough December 2000, which was the end of the Fall2000 session. Enrollment in the study required that par-ents or guardians sign a permission slip and complete anintake form that provided demographic information andthe reasons why they chose to register their children inESS. During this period, we collected 2,047 intake formsfor children and youth in grades 1 through 8 whose par-ents or guardians consented to allow them to participatein the evaluation. (Table B.2, describes the distribution ofthe enrollees by school.)
Of these enrollees, 1,708 actually attended at least one dayof ESS. Eighty-eight percent (1,511) attended at least oneday during the 1999-2000 or 2000-2001 school years, whilethe others attended only during the summer. The partici-pation chapter is based on the 1,511 enrollees whoattended ESS at least once during the school year.
Baseline and Follow-up Surveys. Information in the bene-fits chapter (Chapter V) is drawn from 371 fourth toeighth graders who completed both a baseline and a fol-low-up survey. Among the 1,708 enrollees who attended atleast one day of ESS, 1,144 were in fourth to eighth grade.Of these youth, 69 percent (786) completed a baseline sur-
vey after they began attending activities. In Spring 2001, afollow-up survey was administered to students who werethen in fourth to eighth grade and who had ever enrolledin ESS and were still in the school (but not necessarily par-ticipating in ESS). Because many of the original enrolleeshad left the school, only 674 youth completed the follow-up survey. Of this group, 371 had also completed a base-line survey. On average, 12.5 months had elapsed betweentheir baseline and the follow-up survey.
Parent Survey. The parent survey was administered to 221ESS parents from a pool of 336 who primarily spokeEnglish or Spanish, whose child was in fourth grade orhigher or at least nine years old at the time of the survey,and whose child had attended ESS at least one day duringthe 2000-2001 school year.
Activity Observation. A total of 30 activities were observedin three middle schools. All the activities offered during the2000-2001 academic year were observed in Calcutt (CentralFalls), Porter (Missoula) and Webster (Minneapolis).Webster is a k-8 school; however, we observed only the activ-ities for fifth through eighth graders.
Each activity was observed two or three times during theprogram cycle (fall and winter-spring semesters). Eachtime, the researcher observed the entire activity.Researchers used an observation instrument that requiredthem to rate the quality of a set of constructs or dimen-sions, and describe the behaviors and practices theyobserved for each dimension. Ratings for the variousdimensions were then averaged over the two or threeobservations to come up with a mean score for eachdimension for that activity.
Table B.2: Distribution of ESS Study Enrollment by School
School Total Number of Enrollments Received Total Number Of Baseline Surveys Received (For Children In 4th-8th Grades)
Shuman (6-8) 178 106
Scott-Tompkins (k-8) 151 27
Gardner (k-5) 176 32
Lincoln (k-6) 234 54
Webster (k-8) 336 123
C.S. Porter (6-8) 267 241
Hawthorne (k-5) 262 66
Calcutt (6-8) 202 58
Veterans (k-5) 93 33
North (6-8) 148 46
Total 2,047 786

Appendices 61
Outcome Measures
After hypothesizing the outcome areas potentially affectedby participation in an after-school program, we reviewedthe existing social-psychological and behavioral measures,using those that were appropriate for the study populationand developing our own when the existing measures werenot adequate.
The final follow-up questionnaires included 16 outcomemeasures of behaviors and social-psychological constructsacross three outcome areas—risk and non-risk behaviors,school attitudes and behaviors, and adult support. Sevenoutcomes assessed anti-social activities (including one psy-chological scale of conflict management), and five stressedpro-social activities. Three social-psychological constructsand one behavioral measure assessed academic outcomes.(Table B.3 presents the social-psychological and behavioral
Table B.3: Outcome Measures
School Attitudes and Behaviors
Youth were asked how true each of these statements wasfor them, on a four-point scale ranging from “not true at all”to “very true.”
Belonging:a. I am proud of belonging to this school.
Efficacy:a. I’m certain I can master the skills taught in school this
year.b. I can do even the hardest work in my classes if I try.c. I can do almost all the work in school if I don’t give
up.d. Even if my school work is hard, I can learn it.e. I’m certain I can figure out how to do even the most
difficult school work.
Effort:a. I don’t try very hard in school.b. I often come to class unprepared.c. I work very hard on my school work.d. I pay attention in class.
How many times over the past four weeks, have you nothad your homework done on time?
Non-Family Adult Support
Youth were asked how many adults outside of their parentsand relatives:
a. Pay attention to what’s going on in your life?b. Say something nice to you when you do something
good?c. You could go to if you need some advice about per-
sonal problems?d. You could go to if you are really upset or mad about
something?
* T.D. Cook, H.D. Hunt and R.F. Murphy. “Comer’s SchoolDevelopment Program in Chicago: A Theory-BasedEvaluation.” American Educational Research Journal, 37(2),535-597, 2000.
Risk and Non-Risk Behaviors
To tap antisocial behavior, we primarily relied on questionsused in previous P/PV research studies, but we alsoadapted questions developed by Thomas Cook for an evalu-ation of a middle school reform project.* The single itemquestions assessed anti-social behaviors, including thenumber of times the youth used alcohol, hit someone, tooksomething from the school, damaged property, was involvedin a fight, and was sent to the principal’s office. The pro-social items were related to activities that youth might expe-rience in a structured after-school program. The specificitems were:
Risk Behavior:How many times in the past 4 weeks have you:
a. Hit someone?b. Skipped a class?c. Damaged school property?d. Drunk alcohol?e. Taken stuff at school that wasn’t yours?f. Been sent to the principal’s office?
Conflict Management:When I have a problem or argument with another student:
a. I yell at them. b. I ignore them.c. I talk to an adult about it.d. I push or hit the other person so that it doesn’t hap-
pen again.e. I control my anger.f. I talk things over with them.g. When other children try to hit me or push me around, I
fight back.h. I fight or argue with adults.
Non-Risk Behavior:How many times in the past four weeks have you:
a. Written a poem, story or play, or written in a journal ordiary, not for school?
b. Read a book from beginning to end that wasn’tassigned for school?
c. Taken art, dance or music classes (not during theschool day)?
d. Done volunteer work? e. Performed in front of others (such as reading a poem,
singing, dancing or giving a speech)?
Table B.4: Cronbach Alphas for the Baseline (BQ) and Follow-Up (FQ) Variables
Scale Number of Cronbach’s Standardized components Alpha Alpha
BQ: School belonging 5 0.741 0.746
BQ: School efficacy 5 0.755 0.757
BQ: School effort 4 0.531 0.557
BQ: School engagement 5 0.618 0.619
BQ: Hope for future 5 0.700 0.717
BQ: School liking 3 0.780 0.783
BQ: Instrumental support by friends 3 0.808 0.808
BQ: Self-esteem support by friends 3 0.851 0.852
BQ: Conflict management 8 0.741 0.743
BQ: Parent involvement in school 5 0.720 0.721
BQ: Instrumental support by adults 3 0.801 0.799
BQ: Self-esteem support by adults 4 0.848 0.851
FQ: School efficacy 5 0.814 0.813
FQ: School effort 4 0.479 0.494
FQ: Conflict management (short) 7 0.757 0.758
FQ: Instrumental support by adults (short) 2 0.855 0.855
FQ: Self-esteem support by adults (short) 2 0.770 0.770
62 Multiple Choices After School: Findings from the Extended-Service Schools Initiative
measures included on the follow-up questionnaires.) Therest of this section discusses the measures used, the pretestof the survey instrument, and the reliability of theincluded measures.
Review and Pretest
Two psychologists, Jacqueline Eccles, of the University ofMichigan, and Deborah Lowe Vandell, of the University ofWisconsin, reviewed the baseline questionnaire for its suit-ability for addressing the study’s research hypotheses. Afterfurther review by P/PV research staff, the baseline ques-tionnaire was pre-tested with children in a Philadelphiaschool-based, after-school program. The follow-up ques-tionnaire was pre-tested at both a Philadelphia and aPrinceton, New Jersey, school-based, after-school program.
Reliabilities
The reliability of a scale refers to its stability, i.e., how con-sistently the scale measures an underlying construct. Were-evaluated the internal consistency reliabilities of eachscale for our study sample, both at baseline and at follow-up, to help assess whether the scales “worked” as measuresof specific outcomes for the ESS sample.
Cronbach’s alpha is a statistic used to assess internal con-sistency reliability, the degree to which scale items eachmeasure a common underlying attribute.2 Values of alpharange from 0 (indicating no internal consistency—that theitems have literally nothing in common) to 1 (indicatingperfect consistency among the items—that each item isperfectly correlated with the scale as a whole). We con-sider values of .60 or above to be acceptable.
Alpha values were calculated for all scales used as outcomemeasures. Internal consistencies were all acceptable, rang-ing from .53 to .85 at the baseline variables, and from .48to .86 at the follow-up variables. The only follow-up scalewith alphas less than .60 (indeed less than .75) was SchoolEffort. This scale was eliminated, and the single item, “Ipay attention in class” was used to gauge school effort. Thereliability coefficients at both baseline and follow-up arelisted in Table B.4.
Analysis of Behavioral and Attitudes Changes
Our strategy entailed comparing (correlating) the changesover time in experiences, attitudes and behaviors of chil-dren who participated in the after-school program formany hours and those who participated for relatively few

Appendices 63
hours. We hypothesized that children who attended morehours of structured and supervised activities would showmore developmental gains than children who participatedin fewer structured and supervised activities.
Because the hypothesis related to both activities availablein ESS and to structured activities available elsewhere, weneeded a measure of how much of both the childrenreceived. The participation data collected by the ESS staffonly provided information on the children’s attendance inESS, not other activities. Thus, we did not use those data.Instead, on the follow-up survey, we asked the children totell us how many days a week and how many sessions (fall,winter-spring) they attended various types of after-schoolactivities for school year 2000-2001. These included bothschool-based (i.e., ESS) and non-school-based (at achurch, mosque or other religious organization, some-place else for an after-school program or organized sport).To check the reliability of these self-reported data, we com-pared the self-reported ESS data with the participationdata. Students systematically overestimated days of actualattendance by a factor of 1.42; their reports were closer toactual days scheduled than actual days attended. Thus, wemultiplied all self-reported data (ESS and other) by .7.The correlation of the self-reports and the staff-reports ofESS participation was .62.
Analytic Strategies
Our analysis of the relationship between participation inESS and other after-school activities on various outcomesrelied heavily on multivariate analysis. In general, the mul-tivariate model took the following form:
(1) Y2 = a + b1Y1 + b2X + b3ESSDAYS + b4OASDAYS + e2
where:Y2 = the follow-up value of the variableof interest
Y1 = the baseline value of the variableof interest
X = a vector of explanatory variables
ESSDAYS = the number of days the childreported attending ESS duringschool year 2000-2001 divided by21 to put the variable in days-per-week units3
OASDAYS= the number of days the childreported attending other after-school activities during school year2000-2001 divided by 21 to put thevariable in days-per-week units
a, bi = coefficients
ei = a stochastic disturbance term witha mean of zero and a constant variance
The explanatory variables (X) included in the model werethe baseline measures listed in Table B.5. They includesuch items as age, gender and race/ethnicity; variablesthat describe the youth’s home environment, such as livingwith only one parent, indication of low household income,religiosity, the parent’s education and parenting character-istics such as the quality of their relationship with the childand their involvement in schooling; and dummy variablesfor the school. This specification made it possible to moreprecisely estimate the relationship of ESS participation tooutcomes by controlling for any differences in theseobserved characteristics that may occur between high-attending youth and lower-attending youth.4 The relation-ship of ESS participation to the change in the outcome,adjusting for any change due to starting conditions as theyouth enrolled in the program, is the coefficient on thevariable ESSDAYS, b3.
Table B.5: Control Variables in Statistical Analyses
Basic Set of Variables Included in the Analyses
The number of weeks between the baseline and the follow-up survey
Demographics:Race dummies: black, Hispanic, other non-white race MaleAge at intake
Family and Parent Characteristics:Lives in a low-income familyLives in a single-parent householdParent is a high school dropoutParent graduated from high school but did not go
to collegeWhether the family moved two or more times in the two
years prior to intakeHow often child goes to religious institution
Parental Relationship Characteristics:Quality of the parent-child relationship (IPA)How involved the parent is in the child’s schooling
Personal Characteristics:Self-reported gradesNo friends who believe school is importantCome to ESS for academic reasons
School Dummy:Lincoln, Webster, Scott-Tompkins, Shuman, Calcutt,
Veterans, Hawthorne, Porter, Gardner, North
In-School Attitude and Behavior AnalysesSchool liking scaleSchool engagement

64 Multiple Choices After School: Findings from the Extended-Service Schools Initiative
A potential drawback of this dose/response analysis strat-egy is that participation patterns may be the result of fac-tors that we do not measure and are unable to control for.Part of the outcome difference between the high-attendersand low-attenders, therefore, could be a result of self-selec-tion, not program participation.
To discuss results more easily, all the scale outcomes (suchas response to social challenge) were converted intodichotomous variables indicating a positive response (1=ifthe scale was 3.0 or above, 0=if it was less than 3.0). Theuse of ordinary least squares (OLS) was not warrantedwhen the dependent variable was dichotomous, such as inthe case of whether a participant initiated alcohol use.5 Insuch cases, logistic regression analysis, using maximumlikelihood estimation, was used to estimate the treatmentimpact by specifying a linear function for the logit (thelogarithm of the odds) of having a positive response (e.g.,initiating alcohol use):
(4) log (p/[1-p]) = a + b22X + b3ESSDAYS + b4OASDAYS + e2
where:p = the probability that Y2 = 1
1-p = the probability that Y2 = 0
All the variables are defined as in equation (1), but on alogit scale.
As describe above, all the explanatory variables controllingfor pre-existing differences among the youth wereincluded in the logit models.6
Only those youth who, at baseline, had reported never hav-ing used alcohol were included in the logistic regressionanalyses estimating the relationship of ESS to the initiationof alcohol use. Therefore, the baseline assessment of theseoutcome variables was not included in these models.
The numbers reported in Chapter V, Tables 6 and 8, are thepredicted probabilities of an outcome for an individual withthe mean characteristic for every independent variable inthe logit regressions, except for the number of days of ESSthe youth attended.7 The first predicted probability assumesthe hypothetical individual did not attend ESS at all, whilethe second assumes he or she attended two days a week.
In summary, a variety of analytic strategies were used toevaluate the relationship of ESS participation to thechanges in various outcomes. The fundamental approachused a variable that measured the number of days thechild attended ESS in school year 2000-2001 (as well as avariable that measured the number of days the childattended other after-school activities in school year 2000-2001) in a multivariate analysis. Table B.6 describes thecomplete set of estimated impacts.

Appendices 65
Table B.6: The Complete Set of Estimated Impacts of Participating in ESS on Outcomes(The percent changes are derived from the estimated odds ratios)
Outcome Change in the Likelihood of Reacting Positively if Child Goes 1 More Day a Week to ESS
Reacting to Social Challenge Positively 54%***
Likelihood Over the Past 4 Weeks of Having:
Hit Someone -1%
Vandalized School Property -24%
Been Sent to the Principal -23%
Stolen Things In School -22%
Started to Drink -28%*
Been Bullied -30% (p=.11)
Not Finished Homework -13%
Volunteered 58%***
Performed 16%
Wrote something 27%*
Read for Pleasure 4%
Having a Positive Sense of School Belonging 25%
Having a Very High Sense of School Belonging 27%*
Paying Attention in Class, mostly -3%
Paying Attention in Class, almost always 52%***
Having a Good Sense of Academic Mastery 17%
Having Parental Involvement 21%
Skipping School -16%
Starting to Skip School -31%**
Having More Adult Confidantes -4%
Having More Adults who Provide Emotional Support -12%
* The probability that this number is really zero is less than .10.** The probability that this number is really zero is less than .05.*** The probability that this number is really zero is less than .01.Source: Logit run 2-08-02.

66 Multiple Choices After School: Findings from the Extended-Service Schools Initiative

Appendices 67
Appendix CThe ESS Cost Study
The Extended-Service Schools (ESS) cost study estimatesthe cost and funding of 10 after-school programs in the sixintensive research cities.8 The study estimates the cost ofserving all youth who attended the after-school program,whether or not the youth had enrolled in the ESS evalua-tion study. This appendix explains the framework of thecost study, describes how cost data were collected and pro-vides details on cost estimate decisions.
Definitions
After-School Programs. In addition to providing after-school activities, some ESS programs also conducted activi-ties during evenings, weekends or regular school hours. Tocompare costs across programs, we defined an after-schoolprogram as that part of the ESS program that served youth(k-8) during the after-school hours until 6 p.m., Mondaythrough Friday. Using the same definition for each of the10 ESS sites, we calculated the cost of only the after-schoolprogram. We included all operating costs, whether coveredby cash grants or by redirected (contributed) resources.
Cash Grants, Redirected (Non-Cash) Contributions andFunders. Cash expenditures are covered by the after-school programs’ cash grants. Redirected contributions areexpenditures of partner organizations on behalf of theafter-school program. This includes the value of con-tributed time if the person was salaried by the partnerorganization.
We credited as the funder the organization that gave thecash or non-cash contribution to the after-school program,regardless of the origin of the funds. Therefore, if extracustodial hours to cover after-school program needs werepaid for by the school district, then the school district wasthe funder. Our rationale for this was that original fundingsources (e.g., federal money that went to the state andthen to the school, etc.) were not always clear. Anotherreason was that after-school programs often could notapply directly to the original funding source, and so theyreceived these funds from partners who were willing toshare their resources or provide access. For example, thefree and reduced-price school lunch (and snack) programcan only be accessed through a school. Therefore, whenan after-school program received snacks through theschool nutrition program (federal funding from the U.S.Department of Agriculture), the cost of the snacks wascounted as a redirected contribution from the school.
Cost Study Timeframe and ProratingExpenditures
The cost study covers the 1999-2000 school year, which wasdefined as 10 months (usually September through June)during the after-school hours (until 6 p.m.). Some pro-grams’ fiscal records covered calendar years rather thanschool years. In such cases, we used expenditures for aschool semester in the prior or the following year as thecost, provided that the after-school program at that timewas similar to the one during the 1999-2000 school year.
Excluded Costs
The cost of summer programs was excluded from the coststudy. When there was a summer program but expendi-tures could not be isolated, we excluded two months(16.7%) of annual expenditures for the summer program.This allowed for preparation time, in addition to theactual summer programming, which usually ran for fewerthan eight weeks. Likewise, when ESS programs had regu-larly scheduled evening (usually for older youth or par-ents) or weekend activities, a pro-rated expenditureamount was assigned to these activities and the cost of theprogram was reduced by that amount. This usually meantexcluding part of some staff salaries, based on the percentof staff hours spent on evening or weekend activities. Inestimating the cost of after-school programs that had aschool-day component, we excluded the cost of the activi-ties and a pro-rated amount of staff salaries.
The other major excluded cost was the use of facilities. Allsites had the use of a school building, but many sites alsoused other facilities, such as a pool, gym or communitycenter. If a program paid rent to any facility, the cost wasexcluded because most of the after-school programs didnot pay rent or overhead cost for the use of any facility. Inaddition, even when a site paid rent to a facility, for exam-ple for office space, it did not capture the full cost of thespace. The cost chapter discusses the contributed value ofschool buildings and other facilities, but the cost of usingthe facility (rent, overhead, etc.) is not added into the esti-mated costs of individual after-school programs. However,when a major portion of the sites’ activities took placesomewhere else (for example, one site used a recreationcenter and another used a YMCA pool), the cost study didcapture the redirected contribution of staff time to theafter-school program.
The cost study also did not include planning or startupcosts. The 1999-2000 school year was chosen for the studybecause all the programs were in operation that year.(During the prior year, 1998-1999, the programs hadreceived a planning grant from the Wallace-Reader’sDigest Funds to initiate a new program or expand a pre-existing one.)

68 Multiple Choices After School: Findings from the Extended-Service Schools Initiative
Finally, the cost study also excluded the value of volunteertime. However, where volunteers led youth activities, thecost of their stipend and/or transportation allowance wasincluded.
Collection of Cost Data
We obtained cost and funding information by requestingfinancial documents from the sites and by conductinginterviews.
Financial Documents
We collected cost and funding documentation from severalsources for each site and then reconciled the figures. Weobtained annual financial reports from individual after-school programs, community-based organizations (CBOs)that sponsored individual after-school programs and CBOsthat administered one or more ESS programs in a city.Two after-school programs did not have annual financialreports for their complete cash budget so we constructedthem from available financial records. We also obtainedsites’ accountability reports to the Wallace-Reader’s DigestFunds (the key foundation funder) that compared eachafter-school program’s yearly budget to actual expendi-tures from the Wallace-Reader’s Digest Funds grant.
Interviews
We visited each site to interview key staff at the after-schoolprograms, as well as fiscal managers and local partners thatmade cash and/or non-cash contributions to the pro-grams. In particular, we interviewed program directors, sitecoordinators and some providers regarding expenditureson behalf of the after-school programs. During the inter-views, we also asked for estimates of the time that adminis-trators contributed to the program for planning, fiscalmanagement, fundraising or other services. After each sitevisit, we wrote detailed cost memos documenting theseinterviews.
Criteria for Collecting Cost Data
After-school programs creatively combined cash grants andredirected (non-cash) contributions from many sources,but sometimes documentation was sparse. In attempting tocapture the full operating cost of a program, we set severalcriteria for our collection of information:
• Be comprehensive. The goal was to learn about all expenditures (including contributed time, services and supplies) that benefited the after-school program.
• Track down hidden costs. We looked for hiddencosts in three ways: (1) asking how each componentof the after-school program was paid for if it did notappear on a financial report; (2) identifying poten-tial cost areas when some programs listed expendi-tures that other programs did not (for example, weasked, “Who trained the site coordinator?” when notraining costs were listed for a site); and (3) usingour knowledge of sites from prior visits to raise ques-tions about how specific enriched activities werefinanced. For example, one after-school programhad an enriched dance program (youth traveled toother cities to give performances), but the program’scash budget only showed an hourly teacher paymentand minimal supplies. Interviewing the danceteacher revealed an additional grant that she hadindividually obtained and contributed to the pro-gram.
• Focus on major expenditures. Salaries were a majorcost of after-school programs. Therefore, we spenttime clarifying the number of staff and the numberof hours per week they were employed, so that salaryestimates would be as accurate as possible.
• Attempt to capture all redirected-contributions,including undocumented contributions. School dis-tricts, partner CBOs, government agencies and col-leges made significant non-cash contributions to theafter-school programs. If possible, we obtained docu-mentation on these contributions. However, manyredirected contributions were made with a “hand-shake” and were not broken out in reports.Therefore, we sometimes relied on in-person inter-views with the contributors to obtain this information.
• Include the cost of contributed administrative time.While some after-school programs had more thanone salaried staff person (cash cost) involved inadministrative tasks, other programs employed fewerstaff, or had part-time staff, but administrators inpartner agencies contributed their time to performadministrative tasks for the programs. To capture thefull administrative cost, the study also included thecost of this contributed administrative time. Forexample, when an after-school program benefitedfrom a regular time contribution from a partner,such as the time spent by a school principal, weincluded a percentage of that person’s estimatedsalary. However, we only counted time contributionsthat were at least 5 percent, on a regular basis, of theperson’s work week.

Appendices 69
Calculating The Unit Cost: The Daily Cost of aYouth Slot in a Fully Operational Program
The daily cost per youth slot for a fully operational pro-gram provides a unit measure for capacity cost estimates.In other words, the unit cost can be used to estimate howmuch it would cost to serve X number of youth for Y dayswhen a program is fully operational—that is, during theweeks when all activities are in session.
We followed these steps to calculate the unit cost. The costof the program per week was calculated by dividing theaverage total program cost ($149,620) by the average num-ber of weeks of programming (33 weeks). The average costper week across all 10 programs was $4,534. The averageweekly cost was then divided by the average number ofdays per week that programs offered youth activities (4.7days). The average daily program cost was then divided by63, the average number of youth who attended the pro-gram each day, resulting in the cost per day per youth slotof $15.
The average total cost of the 10 after-school programs is asimple mean—that is, there was no weighting of programsaccording to the number of youth served or any other cri-teria. A week of programming was any week when youthactivities took place at least one day. A program’s numberof days per week was the number of scheduled days perweek, disregarding holidays or incomplete weeks. In otherwords, it was the number of days per week when a pro-gram was fully operational.
We used two methods for measuring the average numberof youth who attended the program each day. For 7 of the10 programs, we were able to use the number of snacksthat a site served each day when it was fully operational.The snack number was usually obtained by interviewingsite coordinators, although in some cases we also obtainedsupporting documentation. We were unable to obtainsnack information for the other three programs. However,for each of those programs we had individual attendancedata for November 1999 (a fully operational month),which we used to estimate the average number of youthwho attended each day.

70 Multiple Choices After School: Findings from the Extended-Service Schools Initiative
Appendix Endnotes
1. The six cities (and schools within the cities) were: Aurora,Colorado (North Middle School); Boston, Massachusetts (GardnerSchool); Central Falls, Rhode Island (Calcutt Middle School,Veterans Memorial Elementary School); Minneapolis, Minnesota(Lincoln Community School, Webster Open School); Missoula,Montana (Hawthorne Elementary School, C. S. Porter MiddleSchool); and Savannah, Georgia (Scott-Tompkins, Shuman MiddleSchool). The cities and schools were chosen because they had thecapacity to collect the necessary data. Very few cities operatedhigh school programs. Thus, the participation and outcomes datawere collected on only elementary and middle school students.
2. L.J. Cronbach. “Coefficient Alpha and the internal Structure ofTests.” Psychometrika, Vol. 16. , pp. 297-334, 1951. Alpha is the pro-portion of a scale’s total variance attributable to a commonsource.
3. Students attended, on average, 21 weeks during the school year.
4. This model is a more robust specification than one that analyzeschanges in outcomes. An analysis of change scores assumes thatthe amount of change and baseline level of the outcome measureare perfectly related. If that assumption is violated, an analysis ofchange scores is a misspecification of the model and the resultingestimates of the coefficients are incorrect. The model estimate forthe analysis reported here controls for baseline level if thisassumption is violated, and is equivalent to the change scoremodel if this assumption holds.
5. For details about the problems involved in estimation withdichotomous variables, see T. Amemiya. “Qualitative ResponseModels: A Survey.” Journal of Economic Literature, 19(4), 483-536,1981.
6. Occasionally, control variables had to be deleted from a particularlogistic regression in order to get the estimation process to con-vert.
7. The predicted probability is calculated as the inverse of (1+ e-Zb)where b is the vector of estimated logit coefficients and Z is a vec-tor of control variables in the logit regression, evaluated at theirmean except for ESSDAYS.
8. The intensive research cities and the 10 schools within the sixcities were Aurora, Colorado (North Middle School); Boston(Gardner School); Central Falls, Rhode Island (Calcutt MiddleSchool, Veterans Memorial Elementary School); Minneapolis(Lincoln Community School, Webster Open School); Missoula,Montana (Hawthorne Elementary School, C.S. Porter MiddleSchool); Savannah (Scott-Tompkins, Shuman Middle School).
Des
ign:
Mal
ish
& P
agon
is -
ww
w.m
alis
hand
pago
nis.
com

72 Multiple Choices After School: Findings from the Extended-Service Schools Initiative
Public/Private Ventures2000 Market StreetSuite 600Philadelphia, PA 19103Tel: 215-557-4400Fax: 215-557-4469Url: http://www.ppv.org