multiple measures assessment project (mmap)
TRANSCRIPT
Multiple Measures Assessment Project
(MMAP)
http://www.rpgroup.org/projects/multiple-measures-assessment-project
August 10, 2016
Yuba College


Intake Assessment
Certification
Learning

y = f(x)

Yuba Community College District Mission
(emphasis added)
…provide rigorous, high quality degree and certificate curricula in lower division arts and sciences and in vocational and occupational fields as well as business-focused training for economic development. An essential and important function of the District is to provide remedial instruction, English as a second language instruction, and support services which help students succeed at the postsecondary level. Additionally, an essential function of the District is to provide adult noncredit educational curricula in areas defined by the State.
Yuba College Selected Goals(emphases added)
•Foster a culture of evidence-informed decision making, including SLO development/assessment and other measures of student success.
•Research and utilize effective modes of delivery for our courses and services.
•Design our programs in such a way as to allow students to complete their educational goals in a timely manner.
•Evaluate our programs, services and processes to ensure continuous quality improvement.

28%
53%
0%
10%
20%
30%
40%
50%
60%
70%
80%
90%
100%
Two(ENGL 105, N=515)
One(ENGL 51, N=267)
Pe
rce
nt S
ucce
ssfu
lly C
om
ple
tin
g
Tra
nsfe
r L
eve
l
Levels Below Transfer Level
Transfer English Throughput Rates for Fall 2012 Cohort Through Spring 2015
http://datamart.cccco.edu/Outcomes/BasicSkills_Cohort_Tracker.aspx

4%11%
31%
0%
10%
20%
30%
40%
50%
60%
70%
80%
90%
100%
Three(MATH 111,
N=319)
Two(MATH 50, N=273)
One(MATH 52, N=350)
Pe
rce
nt S
ucce
ssfu
lly C
om
ple
tin
g
Tra
nsfe
r L
eve
l
Levels Below Transfer Level
Transfer Math Throughput Rates for Fall 2012 Cohort Through Spring 2015
http://datamart.cccco.edu/Outcomes/BasicSkills_Cohort_Tracker.aspx

67%63% 65%
24%32%
44%
0%
20%
40%
60%
80%
100%
Pre-Algebra/Elementary Algebra(back one or more
levels)
Intermediate Algebra(repeating same level)
Transfer Level(moved up 1+ levels)
Level of First Community College (CC) Course
Level of and Success in First College Math for Students whose Last High School Course was Algebra 2 with Grade of B or Better (n=35,806)
College Success Rate Percent Enrolled at CC Level
CST=275 CST=301 CST=334
Acc=57 Acc=84 Acc=97
Male=37% Male=42% Male=49%
URM=69% URM=58% URM=44%
MMAP Project Overview• Collaborative effort of CCCCO Common Assessment Initiative (CAI)
designed to develop, pilot, and assess implementation of placement tool using multiple measures through joint efforts of Cal-PASS Plus, RP Group and now 50 CCCs
• Develop multiple measures models for English, Mathematics, ESL and Reading
• Identify, analyze and validate multiple measures, including high school transcript data, non cognitive variable data, and self-reported HS transcript data
• Engage pilot colleges to conduct local replications, test models and pilot their use in placement, and provide feedback
• bit.ly/MMAP2015

Why Multiple Measures?
• Historically, tests alone have had relatively low predictive validity
• Multiple measures
• provide a more complete picture of student ability
• provide a way to increase the accuracy of placement, particularly reducing underplacement
• http://bit.ly/CCRCPlacementAccuracy
• are required by law
• MM is supported by statewide senate

Regulations (emphases added)
• § 55003. Policies for Prerequisites, Corequisites and Advisories on Recommended Preparation
–(f) Content review with statistical validation is defined as conducting a content review (as defined in subdivision (c) of section 55000) and the compilation of data according to sound research practices which shows that a student is highly unlikely to succeed in the course unless the student has met the proposed prerequisite or corequisite.
• § 55502. Definitions.
–(i) “Multiple measures” are a required component of a district's assessment system and refer to the use of more than one assessment measure in order to assess the student. Other measures that may comprise multiple measures include, but are not limited to, interviews, holistic scoring processes, attitude surveys, vocational or career aptitude and interest inventories, high school or college transcripts, specialized certificates or licenses, education and employment histories, and military training and experience.
Models for Combining Data
•Compensatory (blended)
–Ex: Test score augmented by points from survey responses
•Conjunctive (both/and)
–Ex: Test score of at least 80% and minimum grade point average of at least 2.5
•Disjunctive (either/or)
–Ex: Higher placement of either test or prior high school achievement
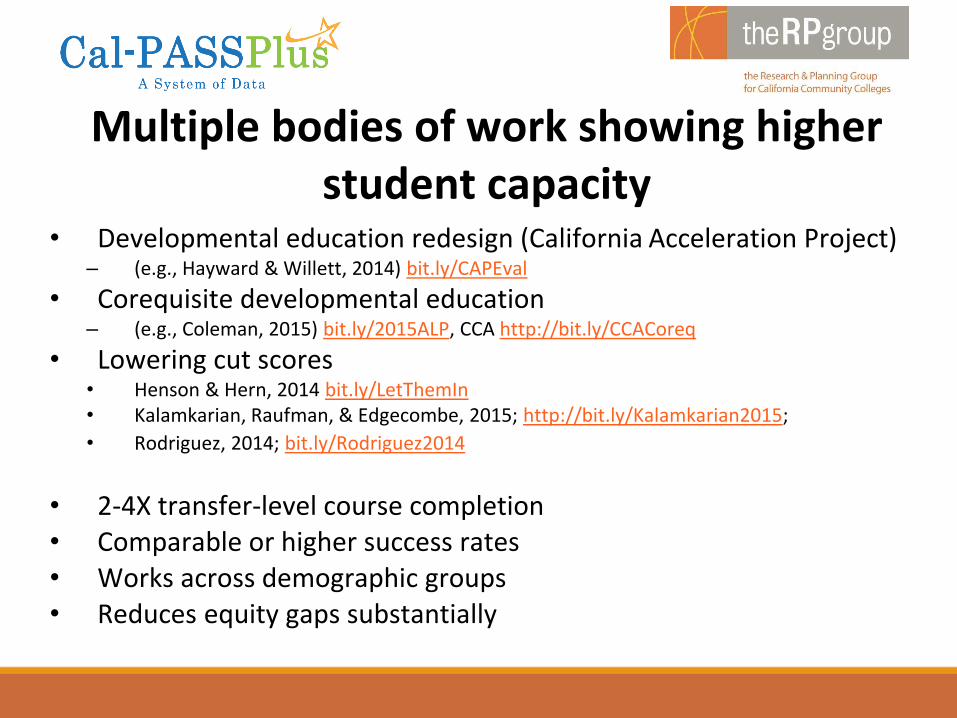
Multiple bodies of work showing higher student capacity
• Developmental education redesign (California Acceleration Project)– (e.g., Hayward & Willett, 2014) bit.ly/CAPEval
• Corequisite developmental education– (e.g., Coleman, 2015) bit.ly/2015ALP, CCA http://bit.ly/CCACoreq
• Lowering cut scores• Henson & Hern, 2014 bit.ly/LetThemIn• Kalamkarian, Raufman, & Edgecombe, 2015; http://bit.ly/Kalamkarian2015;
• Rodriguez, 2014; bit.ly/Rodriguez2014
• 2-4X transfer-level course completion• Comparable or higher success rates• Works across demographic groups• Reduces equity gaps substantially

Data Set for Models
• CCC students enrolled in an English, Math, Reading or ESL class with matching high school data in CalPASS
• Bulk of first CCC enrollments from 2008 through 2014 • Data files include:
• High school course grades, unweighted GPA, course type• Assessment data, where avail. (ACCUPLACER, CST, EAP)• CCC data (course grades, course level)• Other derived info. (e.g., delay, CCC math class type)
•Rules were developed with the subset of students who had four years of high school data (about 25% of total sample)

Variables Explored in the Models
• High School Cumulative GPA (primary predictor)• Grades in high school courses• CST scores• Advanced Placement course taking• Taking higher level courses (math)• Delay between HS and CCC (math)• HS English types (Expository, Remedial, ESL)• HS Math level (Elem. Alg., Int. Alg., Pre-Calc.)

Transfer Level Course Direct Matriculant Non-Direct Matriculant
College Algebra
(STEM)
HS 11 GPA >=3.2 OR
HS 11 GPA >=2.9 AND
Pre-Calculus C (or
better)
HS 12 GPA >=3.2 OR
HS 12 GPA >=3.0 AND
Pre-Calculus or Statistics
(C or better)
Statistics (Non STEM) HS 11 GPA >=3.0 OR
HS 11 GPA >=2.3 AND
Pre-Calculus C (or
better)
HS 12 GPA >=3.0 OR
HS 12 GPA >=2.6 AND
Pre-Calculus C (or better)
English HS 11 GPA >=2.6 HS 12 GPA >=2.6
Transfer Level Rule Sets

Transfer Level English Tree

Statistics Tree – Direct Matriculants

Potential Statewide Transfer Level Placement

Projected impact on course success rates(completion of course with C or better)

24%30%
41%
53%
40%
51%
73% 74%
0%
10%
20%
30%
40%
50%
60%
70%
80%
90%
100%
Afr Am Latino Asian White
Transfer Level English Placement
Current Disjunctive MM

15%21%
41%
51%
22%
32%
53%
65%
0%
10%
20%
30%
40%
50%
60%
70%
80%
90%
100%
Afr Am Latino Asian White
Transfer Level Math Placement
Current Disjunctive MM
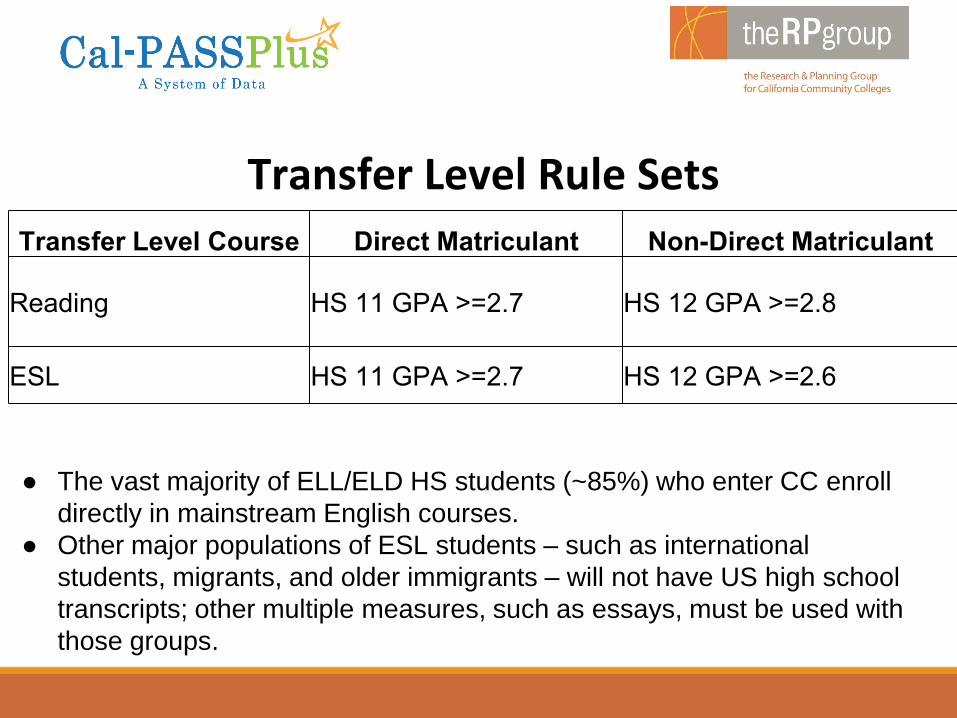
Transfer Level Course Direct Matriculant Non-Direct Matriculant
Reading HS 11 GPA >=2.7 HS 12 GPA >=2.8
ESL HS 11 GPA >=2.7 HS 12 GPA >=2.6
Transfer Level Rule Sets
● The vast majority of ELL/ELD HS students (~85%) who enter CC enroll
directly in mainstream English courses.
● Other major populations of ESL students – such as international
students, migrants, and older immigrants – will not have US high school
transcripts; other multiple measures, such as essays, must be used with
those groups.

8/10/2016 CAÑADA COLLEGE 27
123
259
66
170
54%
66%
0%
10%
20%
30%
40%
50%
60%
70%
0
50
100
150
200
250
300
2014 College Level English 2015 College Level English
# o
f S
tud
en
tsProgression from Placement to Enrollment
English: 2014 vs. 2015
Placed Enrolled Progression
2014: COMPASS 2015: MMAP + COMPASS

English 100 Course Outcomes by Grade Distribution
8/10/2016 CAÑADA COLLEGE 28

8/10/2016 CAÑADA COLLEGE 29
191
245
70116
37%
47%
0%
10%
20%
30%
40%
50%
60%
70%
0
50
100
150
200
250
300
2014 College Level Math 2015 College Level Math
# o
f S
tud
en
tsProgression from Placement to Enrollment
Math: 2014 vs. 2015
Placed Enrolled Progression
2014: COMPASS 2015: MMAP + COMPASS

Math Course Outcomes by Course Number
8/10/2016 CAÑADA COLLEGE 30

Common Concerns about MMAP
• High school grades are inflated • Students placed via MMs will not be successful
• Our courses will have lower pass rates
• Our test is different
• Students would be better off in remedial coursework
• Students will only get a “C” in transfer-level work
• Students who get a “C” in transfer-level won’t be able to transfer
• High school GPA is only good for recent graduates
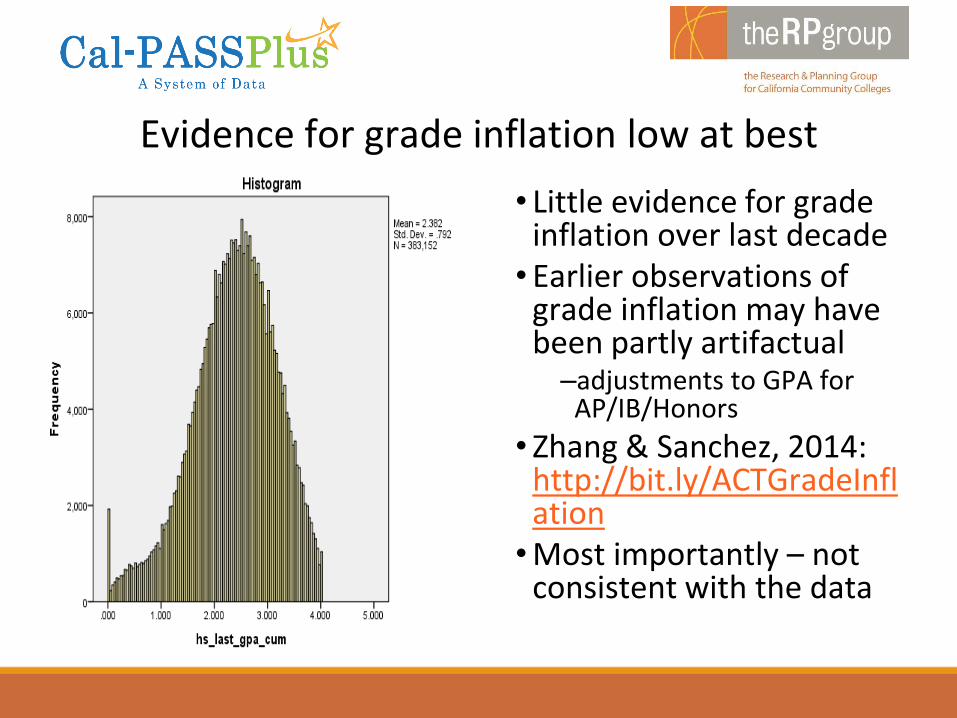
Evidence for grade inflation low at best
• Little evidence for grade inflation over last decade
• Earlier observations of grade inflation may have been partly artifactual
–adjustments to GPA for AP/IB/Honors
• Zhang & Sanchez, 2014: http://bit.ly/ACTGradeInflation
• Most importantly – not consistent with the data

Sierra College: Higher success rates for students placed via MMs

Our tests are different - Compass
Course Compass Test Compass HSGPAHSGPA + Compass
English 1 Writing Skills .31 .57 .62
Arithmetic Pre-Algebra .57 .34 .66
Algebra Pre-Algebra .36 .65 .80
Intermediate Algebra Algebra .47 .66 .84
College Algebra Algebra .41 .76 .88
College Algebra College Algebra .51 .76 .94
http://bit.ly/COMPASSValidation (Table 4 - Median Logistic R)
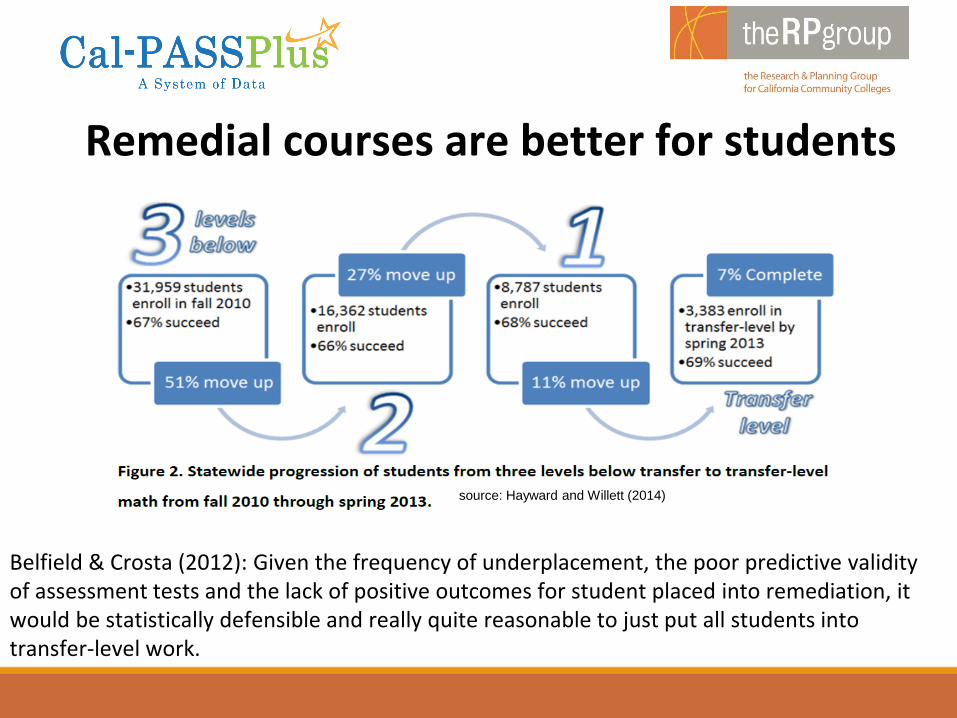
Remedial courses are better for students
Belfield & Crosta (2012): Given the frequency of underplacement, the poor predictive validity of assessment tests and the lack of positive outcomes for student placed into remediation, it would be statistically defensible and really quite reasonable to just put all students into transfer-level work.
source: Hayward and Willett (2014)
Main Findings
• Acceleration effects were large and robust
• Acceleration worked for students of all backgrounds
• Acceleration worked for students at all placement levels
• Implementation Mattered™
40Evaluating CAP, RP
Group, April 2015

CAP Acceleration increased odds of sequence completion
41Evaluating CAP, RP
Group, April 2015
1.51.2
2.3
4.5
0
0.5
1
1.5
2
2.5
3
3.5
4
4.5
5
All English CAPpathways
Low-accelerationEnglish pathways
High-accelerationEnglish pathways
All Math CAPpathways
Acceleration Odds Ratio (Effect Size) for English CAP Colleges

Pathway-specific results: English
44Evaluating CAP, RP
Group, April 2015
0.82 0.90
1.041.16
1.35
2.162.34
2.53
2.812.96
0
0.5
1
1.5
2
2.5
3
3.5A
lph
a.1
†
Iota
†
Rho
Pi‡
Om
ega†
Epsilo
n*
Beta
†*‡
Alp
ha.2
*
Gam
ma*
Ze
ta*
Accele
rato
in O
dd
s R
ati
o
College Pseudonym
Acceleration effect size (odds ratio) by college-specific English pathways (lighter bars with asterisks (*) are
significant at p < 0.01).

Pathway-specific results: Math
45Evaluating CAP, RP
Group, April 2015
0.94
2.77 3.06 3.12
5.03 5.11
7.25
17.76
0
2
4
6
8
10
12
14
16
18
20
Lambda Nu* Mu* Delta* Theta* Beta* Eta* Kappa*
Acceleration effect size (odds ratio) by college-specific math pathways (lighter bars with
asterisks (*) are significant at p < 0.01).

CAP: Completion of transfer-level math for traditional and accelerated pathways by ethnicity
10%
23%
14%
18%
41%39%
35%
44%
0%
10%
20%
30%
40%
50%
African American Asian American Hispanic White
Tra
nsfe
r-le
vel
Math
Co
mp
leti
on
in
2
ye
ars
Comparison Acceleration

Will only get a “C” in transfer course
Percent of sample in leaf
Success rate
Internal Node/ Split
Leaf

Distribution of Statistics Node 8 (Circled)

Students who get a “C” in transfer-level won’t be able to transfer
Irvine Valley College, first course enrolled in, Spring 2000 to Fall 2011 who took an English course. N= 28,279, transfer within 4 years.
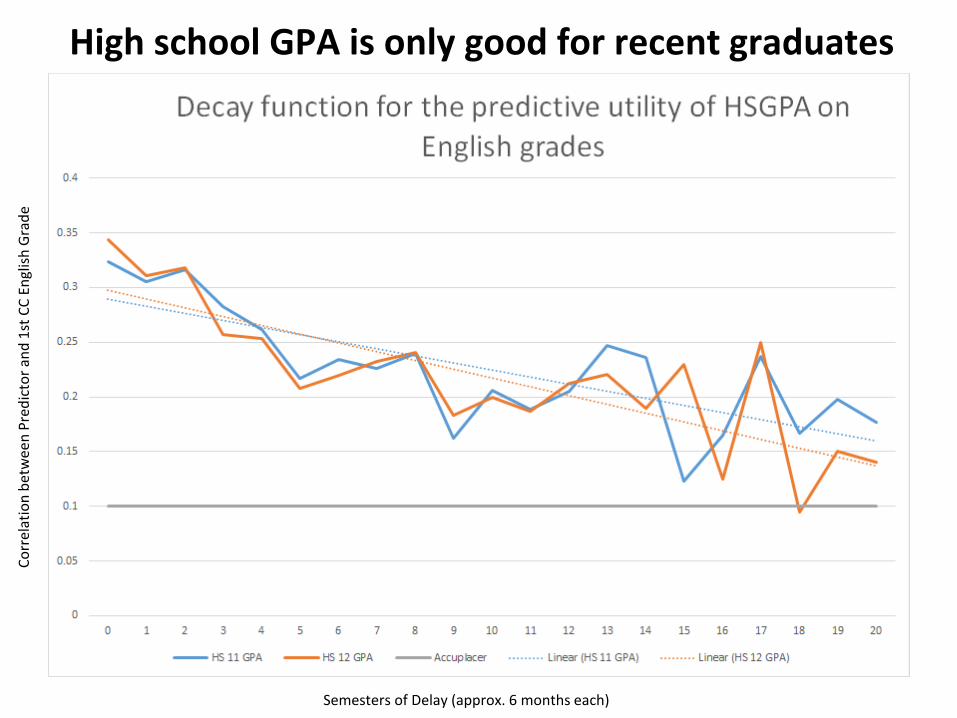
Co
rrel
atio
n b
etw
een
Pre
dic
tor
and
1st
CC
En
glis
h G
rad
e
High school GPA is only good for recent graduates
Semesters of Delay (approx. 6 months each)
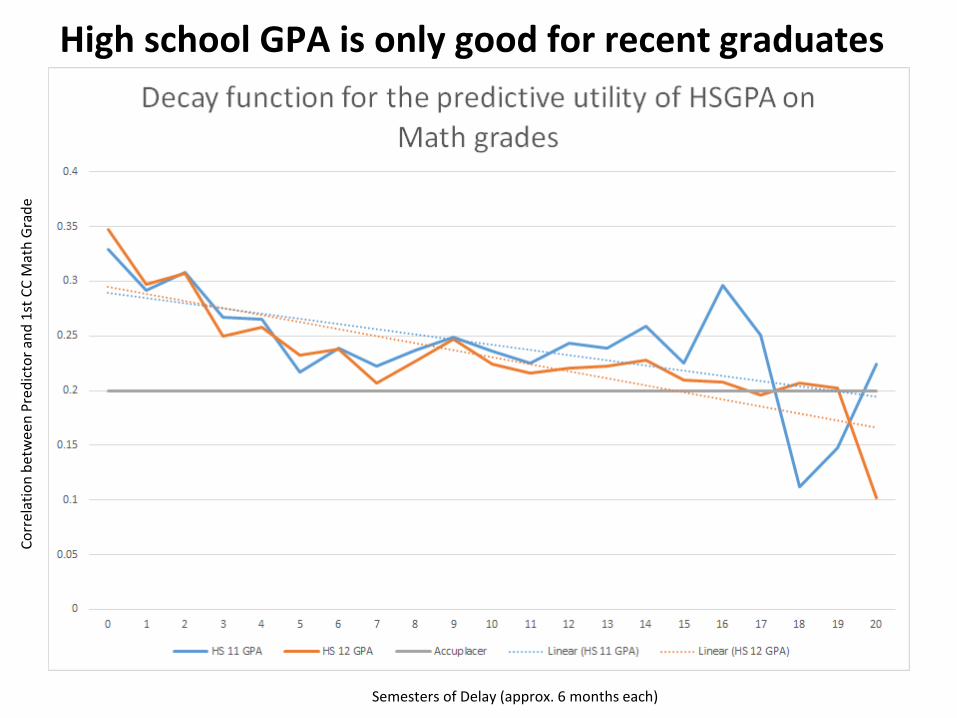
Co
rrel
atio
n b
etw
een
Pre
dic
tor
and
1st
CC
Mat
h G
rad
e
Semesters of Delay (approx. 6 months each)
High school GPA is only good for recent graduates
MMAP Pilot Colleges• NCV and Self-Report Piloting
• Implementation
• Outcomes
• Evaluation methods
–Success rates
–Throughput rates
–Student and instructor surveys
• Next steps

How do we get started?
•MMAP Getting Started Guide and Welcome Packet: http://bit.ly/MMAPStart
–Convene locally appropriate decision-making group(s)
–Identify/recruit key stakeholders/decision-makers
–Discuss existing research and local implementation options
–Review webinars, especially on how to implement: http://bit.ly/MMAPWebinars
–Work with Cal-PASS Plus to identify feeder district patterns, download retrospective data &/or upload new applicants for K-12 data

Group Work
•Who should be involved by function (i.e. Department Faculty, A&R, IT, Research, etc.)?
•What committees may be involved?
•What resources are needed?
•What funding sources are available?
•When is the next meeting?

Loris FagioliThe RP [email protected]
Mallory NewellThe RP [email protected]
Terrence WillettThe RP Group [email protected]
Craig HaywardThe RP [email protected]
John HettsEducational Results [email protected]
Ken SoreyEducational Results [email protected]
Daniel LamoreeEducational Results [email protected]
Peter BahrUniversity of [email protected]
Contacts