multiple representations 4.1.1 through 4.1
TRANSCRIPT
Algebra Connections Parent Guide 22
2 4–2
2
4
6
8
10
12
–2
x
y
MULTIPLE REPRESENTATIONS 4.1.1 through 4.1.7
The first part of Chapter 4 ties together several ways to represent the same relationship. The basis for any relationship is a consistent pattern that connects input and output values. This course uses tile patterns to help visualize algebraic relationships. (Note: In this course we consider tile patterns to be continuous relationships and graph them with a continuous line or curve.) These relationships may also be displayed on a graph, in a table, or as an equation. In each situation, all four representations show the same relationship. Students learn how to use each format to display relationships as well as how to switch from one representation to another. We use the diagram at right to show the connections between the various ways to display a relationship and call it the “representations web.” See the Math Notes box on page 161.
Example 1
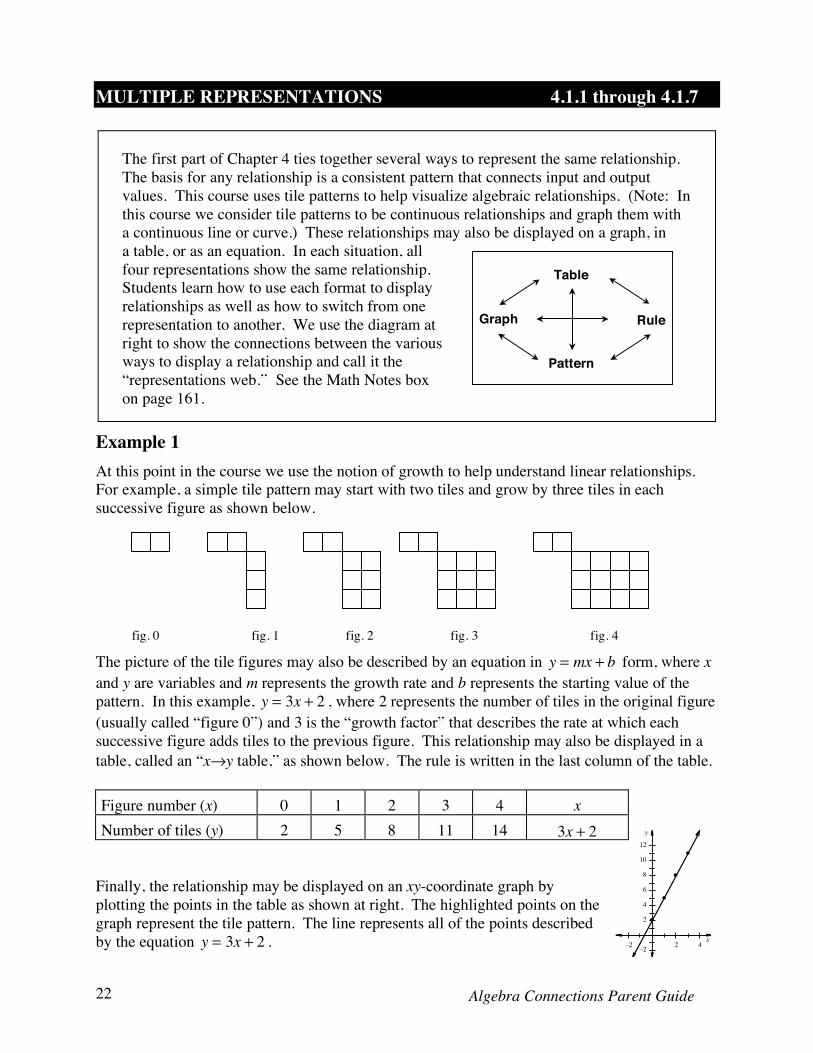
At this point in the course we use the notion of growth to help understand linear relationships. For example, a simple tile pattern may start with two tiles and grow by three tiles in each successive figure as shown below.
fig. 0 fig. 1 fig. 2 fig. 3 fig. 4
The picture of the tile figures may also be described by an equation in y = mx + b form, where x and y are variables and m represents the growth rate and b represents the starting value of the pattern. In this example, y = 3x + 2 , where 2 represents the number of tiles in the original figure (usually called “figure 0”) and 3 is the “growth factor” that describes the rate at which each successive figure adds tiles to the previous figure. This relationship may also be displayed in a table, called an “x→y table,” as shown below. The rule is written in the last column of the table. Figure number (x) 0 1 2 3 4 x Number of tiles (y) 2 5 8 11 14 3x + 2
Finally, the relationship may be displayed on an xy-coordinate graph by plotting the points in the table as shown at right. The highlighted points on the graph represent the tile pattern. The line represents all of the points described by the equation y = 3x + 2 .
Graph Rule
Pattern
Table

Chapter 4: Multiple Representations 23
2 4
5
10
15
20
y
x
Example 2 Draw figures 0, 4, and 5 for the tile pattern below. Use the pattern to predict the number of tiles in figure 100, describe the figure, write a rule that will give the number of tiles in any figure, record the data for the first six tiles (figures 0 through 5) in a table, and graph the data.
fig. 0 fig. 1 fig. 2 fig. 3 fig. 4 fig. 5 Each figure adds four tiles: two tiles to the top row and two tiles to the lower portion of the figure. Figure 0 has two tiles, so the rule is y = 4x + 2 and figure 100 has 4(100) + 2 = 402 tiles. There are 202 tiles in the top row and 200 tiles in the lower portion of figure 100. The table is:
Figure number (x) 0 1 2 3 4 5 x Number of tiles (y) 2 6 10 14 18 22 4x + 2
The graph is shown at right.
Example 3 Use the table below to determine the rule in y = mx + b form that describes the pattern.
input (x) -2 -1 0 1 2 3 4 5 x output (y) -8 -5 -2 1 4 7 10 13
The constant difference between the output values is the growth rate, that is, the value of m. The output value paired with the input value x = 0 is the starting value, that is, the value of b. So this table can be described by the rule: y = 3x ! 2 . Note: If there is no constant difference between the output values for consecutive integer input values, then the rule for the pattern is not in the form y = mx + b .
+3 +3 +3 +3 +3 +3 +3

Algebra Connections Parent Guide 24
2
2
4
–2
–4
–6
x
yExample 4 Use the graph at right to create an x→y table, then write a rule for the pattern it represents. First transfer the coordinates of the points into an x→y table.
input (x) 0 1 2 3 x output (y) 5 1 -3 -7
Using the method described in Example 3, that is, noting that the growth rate between the output values is -4 and the value of y at x = 0 is 5, the rule is: y = !4x + 5 . Problems 1. Based on the tile pattern below, draw figures 0, 4, and 5. Then find a rule that will give the
number of tiles in any figure and use it to find the number of tiles in figure 100. Finally, display the data for the first six figures (numbers 0-5) in a table and on a graph.
fig. 0 fig. 1 fig. 2 fig. 3 fig. 4 fig. 5 2. Based on the tile pattern below, draw figures 0, 4, and 5. Then find a rule that will give the
number of tiles in any figure and use it to find the number of tiles in figure 100. Finally, display the data for the first six figures (numbers 0-5) in a table and on a graph.
fig. 0 fig. 1 fig. 2 fig. 3 fig. 4 fig. 5

Chapter 4: Multiple Representations 25
Use the patterns in the tables and graphs to write rules for each relationship. 3.
input (x) -3 -2 -1 0 1 2 3 4 5 output (y) -11 -8 -5 -2 1 4 7 10 13
4. input (x) -3 -2 -1 0 1 2 3 4 5 output (y) 10 8 6 4 2 0 -2 -4 -6
5. 6.
2 4–2–4
2
4
–2
–4
–6
y
x
2 4–2–4
2
4
6
–2
x
y
Algebra Connections Parent Guide 26
2 4
5
10
15
20
x
y
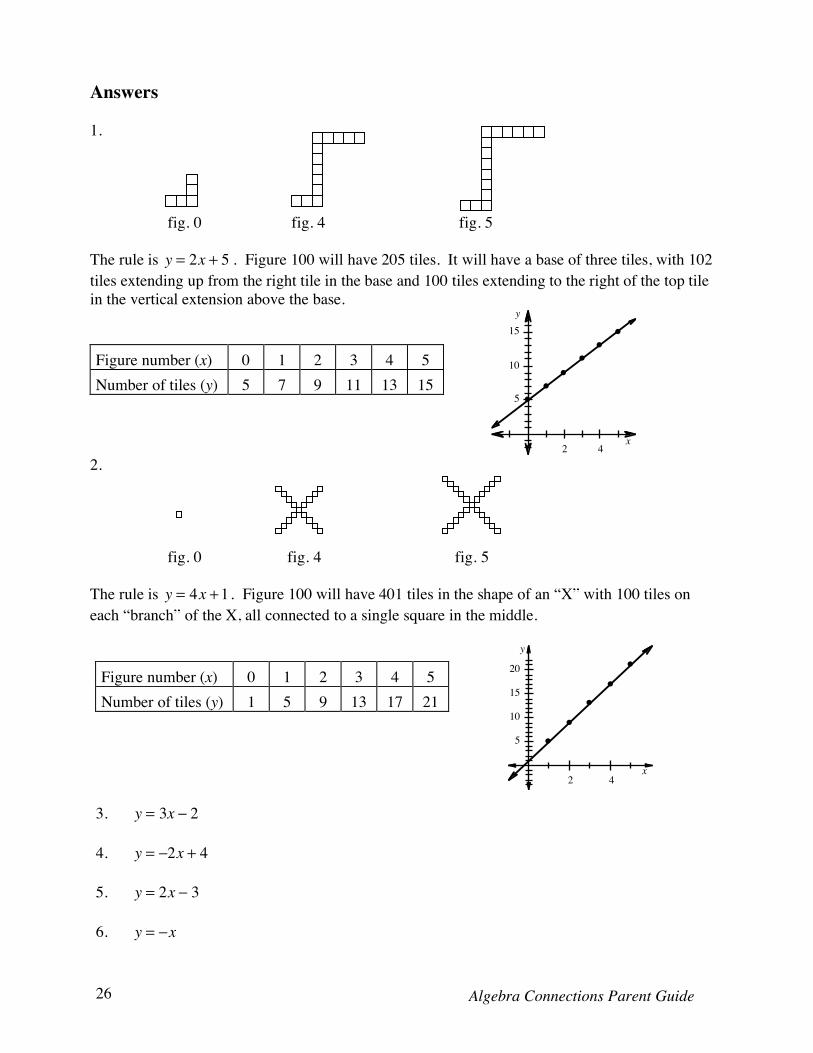
Answers 1. fig. 0 fig. 4 fig. 5 The rule is y = 2x + 5 . Figure 100 will have 205 tiles. It will have a base of three tiles, with 102 tiles extending up from the right tile in the base and 100 tiles extending to the right of the top tile in the vertical extension above the base.
2. fig. 0 fig. 4 fig. 5 The rule is y = 4x +1 . Figure 100 will have 401 tiles in the shape of an “X” with 100 tiles on each “branch” of the X, all connected to a single square in the middle.
Figure number (x) 0 1 2 3 4 5 Number of tiles (y) 1 5 9 13 17 21
3. y = 3x ! 2 4. y = !2x + 4 5. y = 2x ! 3 6. y = !x
Figure number (x) 0 1 2 3 4 5 Number of tiles (y) 5 7 9 11 13 15
2 4
5
10
15
x
y

Chapter 4: Multiple Representations 27
SOLVING LINEAR SYSTEMS: 4.2.1 through 4.2.3 THE EQUAL VALUES METHOD
Two lines on an xy-coordinate grid intersect at a point unless they are parallel or the equations are different forms of the same line. The point of intersection is the only pair of (x, y) values that will make both equations true. One way to find the point of intersection is to graph the two lines. However, graphing is both time-consuming and, in many cases, not exact, because the result is only a close approximation of the coordinates. When two equations are written in the y = mx + b form, we can take advantage of the fact that both y values are the same (equal) at the point of intersection. For example, if two lines are described by the equations y = !2x + 5 and y = x !1 , and we know that both y values are equal, then the other two sides of the equations must also be equal to each other. We say that both right sides of these equations have “equal values” at the point of intersection and write!2x + 5 = x !1 . We can solve this equation in the usual way and find that x = 2 . Now we know the x-coordinate of the point of intersection. Since this value will be the same in both of the original equations at the point of intersection, we can substitute x = 2 in either equation to solve for y: y = !2(2) + 5 so y = 1 or y = 2 !1and y = 1. So the two lines in this example intersect at (2, 1).
Example 1 Find the point of intersection for y = 5x +1 and y = !3x !15 . Substitute the equal parts of the equations. Solve for x.
5x +1 = !3x !15
8x = !16
x = !2
Replace x with !2 in either original equation y = 5(-2) + 1 or y = -3(-2) - 15
and solve for y. y = 5(!2) +1
y = !10 +1
y = !9
or y = !3(!2) !15
y = 6 !15
y = !9
The two lines intersect at (-2, -9).

Algebra Connections Parent Guide 28
Example 2 Highland has a population of 12,200 that has been increasing at a rate of 300 people per year. Lowville has a population of 21,000 which is declining by 250 people per year. Assuming that the rates do not change, in how many years will the populations be equal? The first step in the solution is to write an equation in y = mx + b form that describes the population conditions in each city. In this example, let x equal the number of years from now and y be the population at any particular time. Then the equation to represent Highland's population x years from now is y = 300x +12200 . Similarly, the equation representing Lowville's population x years from now is y = !250x + 21000 . As usual, the rate of change is the value of m and the starting population is the value of b. Now that we know that y = 300x +12200 and y = !250x + 21000 , the next step is to use the “Equal Values” method to write one equation using x , then solve for x.
300x +12200 = !250x + 21000
550x = 8800
x = 16
Use the value of x to find y. y = 300(16) +12200
= 17000
The solution is (16, 17000). This means that 16 years from now, both cities will have the same population of 17,000 people. Problems
Use the Equal Values method to find the point of intersection (x, y) for each pair of linear equations. 1. y = x ! 6
y = 12 ! x
2. y = 3x ! 5
y = x + 3
3. x = 7 + 3y
x = 4y + 5
4. x = !3y +10
x = !6y ! 2
5. y = x + 7
y = 4x ! 5
6. y = 7 ! 3x
y = 2x ! 8
7. Jacques will wash the windows of a house for $15.00 plus $1.00 per window. Ray will
wash them for $5.00 plus $2.00 per window. Let x be the number of windows and y be the total charge for washing them. Write an equation that represents how much each person charges to wash windows. Solve the system of equations and explain what the solution means and when it would be most economical to use each window washer.

Chapter 4: Multiple Representations 29
8. Cross Country Movering (CCM) charges $2000 plus $0.90 per pound to move a house full of furniture from Maryland to California. GlobalCity (GC) charges $3500 plus $0.40 per pound for the same move. Write two equations that represent each company's charges. What do your variables represent? Solve the system of equations, then decide who you would hire and why.
9. Misha and Noraa want to buy season passes for a ski lift but neither of them has the $225
needed to purchase a pass. Noraa decides to get a job that pays $6.25 per hour. She has nothing saved right now but she can work four hours each week. Misha already has $80 and plans to save $15 of her weekly allowance. Who will be able to purchase a pass first?
10. Ginny is raising pumpkins to enter a contest to see who can grow the heaviest pumpkin. Her
best pumpkin weighs 22 pounds and is growing 2.5 pounds per week. Martha planted her pumpkins late. Her best pumpkin weighs 10 pounds but she expects it to grow 4 pounds per week. Assuming that their pumpkins grow at these rates, in how many weeks will their pumpkins weigh the same? How much will they weigh? If the contest ends in seven weeks, who will have the heavier pumpkin at that time?
11. Larry and his sister, Betty, are saving money to buy their own laptop computers. Larry has
$215 and can save $35 each week. Betty has $380 and can save $20 each week. When will Larry and Betty have the same amount of money?
Answers 1. (9, 3) 2. (4, 7) 3. (13, 2)
4. (22, -4) 5. (4, 11) 6. (3, -2) 7. Let x = number of windows, y = cost. Jacques: y = 1x +15 ; Roy: y = 2x + 5 . The
solution is (10, 25), which means that the cost to wash 10 windows is $25. For fewer than 10 windows use Roy; for more than 10 windows, use Jacques.
8. Let x = pounds, y = amount charged. CCM: y = 0.90x + 2000 ; GC: y = 0.40x + 3500 .
The solution is (3000, 4700). For fewer than 3000 pounds, use CCM.
9. Let x = weeks, y = total savings. Misha: y = 15x + 80 ; Noraa: y = 25x . The solution is (8, 200). Both of them will have $200 in 8 weeks, so Noraa will have $225 in 9 weeks and be able to purchase the lift pass first. An alternative solution is to write both equations, then substitute 225 for y in each equation and solve for x. In this case, Noraa can buy a ticket in 9 weeks, Misha in 9.67 weeks.
10. Let x = weeks and y = weight of the pumpkin. Ginny: y = 2.5x + 22 ; Martha: y = 4x +10 .
The solution is (8, 42), so their pumpkins will weigh 42 pounds in 8 weeks. Ginny would win (39.5 pounds to 38 pounds for Martha).
11. Let x = weeks, y = total money saved. Larry: y = 35x + 215 ; Betty: y = 20x + 380 . The
solution is (11, 600). They will both have $600 in 11 weeks.