4. water quality impact 4.1 introduction 4.1.1 this section
TRANSCRIPT

Drainage Services Department Tai Po Sewage Treatment Works Stage V Environmental Impact Assessment Study
Final EIA Report
P:\A04202\REPORTS\Final\Final_Final\html\final vol 1\chap4.htm i MEMCL
4. WATER QUALITY IMPACT 4.1 Introduction 4.1.1 This section presents the findings of the assessment of potential water quality impacts
associated with the construction and operation of the Project. Suitable mitigation measures have been recommended to minimise potential adverse impacts and to ensure the acceptability of any residual impact (that is, after mitigation).
4.1.2 Under the Tolo Harbour Effluent Export Scheme (THEES), the treated sewage effluent from
TPSTW is collected in the Tai Po effluent pumping station and pumped to the effluent pumping station at Sha Tin Sewage Treatment Works (STSTW). Then, together with the treated effluent of STSTW, the combined effluent is pumped into Kai Tak Nullah for discharge into Victoria Harbour. In addition, treated, partially treated or untreated sewage effluent may be discharged into Tolo Harbour under emergency condition or during the THEES maintenance period. Treated effluent may also be occasionally overflowed into the Tolo Harbour during storm events under normal operation of the Project. The discharge locations of the Project within Tolo Harbour are shown in Figure 4.7. They are the outfalls for emergency bypass of sewage effluent pumping stations at Sha Tin and Tai Po. As such, the Project would have potential impact on both Victoria Harbour and Tolo Harbour.
4.2 Environmental Legislation, Policies, Plans, Standards and Criteria 4.2.1 The criteria for evaluating water quality impacts in this EIA Study include:
• Technical Memorandum on Environmental Impact Assessment Process (Environmental
Impact Assessment Ordinance) (EIAO-TM); • Water Pollution Control Ordinance (WPCO); • Technical Memorandum on Standards for Effluents Discharged into Drainage and
Sewerage Systems, Inland and Coastal Waters (TM-DSS); • Hong Kong Planning Standards and Guidelines (HKPSG); • Water Supplies Department (WSD) Water Quality Criteria; and • Practice Note for Professional Persons (ProPECC), Construction Site Drainage (PN 1/94). Environmental Impact Assessment Ordinance (EIAO)
4.2.2 This Project is a Designated Project (DP) under Schedule 2, Part I, F.1 of the EIAO. The
EIAO-TM was issued by the Environmental Protection Department (EPD) under Section 16 of the EIAO. It specifies the assessment method and criteria that have been followed in this Study. Reference sections in the EIAO-TM provide the details of the assessment criteria and guidelines that are relevant to the water quality impact assessment, including:
• Annex 6 Criteria for Evaluating Water Pollution; and • Annex 14 Guidelines for Assessment of Water Pollution.

Agreement No CE 43/2001 (EP) Tai Po Sewage Treatment Works – Stage V Drainage Services Department Final EIA Report
MAUNSELL
4-2
Water Quality Objectives (WQOs) 4.2.3 The WPCO provides the statutory framework for the protection and control of water quality
in Hong Kong. According to the ordinance and its subsidiary legislation, Hong Kong waters are divided into ten Water Control Zones (WCZs). Corresponding statements of Water Quality Objectives (WQOs) are stipulated for different water regimes (marine waters, inland waters, bathing beaches, secondary contact recreation subzones and fish culture subzones) based on their beneficial uses. The effluent from TPSTW would impact the marine water quality within Victoria Harbour and Tolo Harbour and Channel. Their corresponding WQOs are listed in Table 4.1 and Table 4.2.
Table 4.1 Summary of Water Quality Objectives for Victoria Harbour WCZ
Parameters Objectives Sub-Zone Offensive Odour, Tints
Not to be present Whole zone
Visible foam, oil scum, litter
Not to be present Whole zone
Dissolved Oxygen (DO) within 2 m of the seabed
Not less than 2.0 mg/L for 90% of samples Marine waters
Depth-averaged (DA) DO
Not less than 4.0 mg/L for 90% of samples Marine waters
pH To be in the range of 6.5 - 8.5, change due to human activity not to exceed 0.2
Marine waters
Salinity Change due to human activity not to exceed 10% of ambient
Whole zone
Temperature Change due to human activity not to exceed 2 oC Whole zone Suspended solids (SS)
Not to raise the ambient level by 30% caused by human activity
Marine waters
Unionised Ammonia (UIA)
Annual mean not to exceed 0.021 mg/L as unionised form
Whole zone
Nutrients Shall not cause excessive algal growth Marine waters Total Inorganic Nitrogen (TIN)
Annual mean depth-averaged inorganic nitrogen not to exceed 0.4 mg/L
Marine waters
Toxic substances Should not attain such levels as to produce significant toxic, carcinogenic, mutagenic or teratogenic effects in humans, fish or any other aquatic organisms.
Whole zone
Human activity should not cause a risk to any beneficial use of the aquatic environment.
Whole zone
Source: Statement of Water Quality Objectives (Victoria Harbour (Phases One, Two and Three) Water Control Zone).

Agreement No CE 43/2001 (EP) Tai Po Sewage Treatment Works – Stage V Drainage Services Department Final EIA Report
MAUNSELL
4-3
Table 4.2 Summary of Water Quality Objectives for Tolo Harbour and Channel WCZ
Parameters Objectives Sub-Zone Offensive Odour, Tints
Not to be present Harbour subzone, Buffer subzone, Channel subzone
Visible foam, oil, grease, scum, litter
Not to be present Harbour subzone, Buffer subzone, Channel subzone
Not less than 2 mg/L within two metres of the bottom, or not less than 4 mg/L in the remainder of the water column
Harbour subzone
Not less than 3 mg/L within two metres of the bottom, or not less than 4 mg/L in the remainder of the water column
Buffer subzone
Dissolved Oxygen (DO)
Not less than 4 mg/L at any point in the water column Channel subzone Not to cause the normal pH range to be extended by more than ± 0.5 pH units at any time.
Harbour subzone
Not to cause the normal pH range to be extended by more than ± 0.3 pH units at any time.
Buffer subzone
pH
Not to cause the normal pH range to be extended by more than ± 0.1 pH units at any time.
Channel subzone
Should not reduce light transmission by more than 20% of the normal level at any location or any time.
Harbour subzone
Should not reduce light transmission by more than 15% of the normal level at any location or any time.
Buffer subzone
Light Penetration
Should not reduce light transmission by more than 10% of the normal level at any location or any time.
Channel subzone
Salinity Not to cause the normal salinity range to be extended by more than ± 3 parts per thousand at any time.
Harbour subzone, Buffer subzone, Channel subzone
Temperature Not to cause the natural daily temperature range to be extended by greater than ± 1.0 oC at any location or time. The rate of temperature change shall not exceed 0.5 oC per hour at any location, unless due to natural phenomena.
Harbour subzone, Buffer subzone, Channel subzone
Settleable Material Bottom deposits or submerged objects should not adversely influence bottom-living communities, alter the basic Harbour geometry or shipping channels, present any hazard to shipping or diving activities, or affect any other beneficial use of the waters.
Harbour subzone, Buffer subzone, Channel subzone
Bacteria Not exceed 610 per 100 mL, calculated as the geometric mean of all samples collected in one calendar year.
Secondary contact recreation subzone and fish culture zone

Agreement No CE 43/2001 (EP) Tai Po Sewage Treatment Works – Stage V Drainage Services Department Final EIA Report
MAUNSELL
4-4
Parameters Objectives Sub-Zone Chlorophyll-a Not to cause the level of chlorophyll-a in waters of the
subzone to exceed 20 mg m-3, calculated as a running arithmetic mean of 5 daily measurements for any single location and depth
Harbour subzone
Not to cause the level of chlorophyll-a in waters of the subzone to exceed 10 mg m-3, calculated as a running arithmetic mean of 5 daily measurements for any single location and depth
Buffer subzone
Not to cause the level of chlorophyll-a in waters of the subzone to exceed 6 mg m-3, calculated as a running arithmetic mean of 5 daily measurements for any single location and depth
Channel subzone
Toxic substances Should not attain such a level as to produce significant toxic effects in humans, fish or any other aquatic organism.
Harbour subzone, Buffer subzone, Channel subzone
Source: Statement of Water Quality Objectives (Tolo Harbour and Channel Water Control Zone).
Hong Kong Planning Standards and Guidelines (HKPSG) 4.2.4 The HKPSG, Chapter 9 (Environment), provides additional guidelines against water pollution
for sensitive uses such as aquaculture and fisheries zones, bathing waters and other contact recreational waters.
Water Supplies Department (WSD) Water Quality Criteria
4.2.5 Besides the WQOs set under the WPCO, WSD have also specified a set of water quality
criteria for flushing water at seawater intakes shown in Table 4.3.
Table 4.3 WSD’s Water Quality Criteria for Flushing Water at Sea Water Intakes
Parameter (in mg/L unless otherwise stated) Target Limit
Colour (HU) < 20 Turbidity (NTU) < 10 Threshold Odour Number (odour unit) < 100 Ammonia Nitrogen (NH3-N) < 1 Suspended Solids (SS) < 10 Dissolved Oxygen (DO) > 2 5-day Biochemical Oxygen Demand (BOD5) < 10 Synthetic Detergents < 5 E. coli (no/100 mL) < 20,000

Agreement No CE 43/2001 (EP) Tai Po Sewage Treatment Works – Stage V Drainage Services Department Final EIA Report
MAUNSELL
4-5
Cooling Water Intake Standards 4.2.6 Based on the WDII EIA(1 ), a SS limit of 40 mg/L has been adopted as the assessment
criterion for Admiralty Centre intake and MTRC South intake (Point 9 and Point 8 respectively in Figure 4.3) . No information on the SS limit is available for other cooling water intakes.
Technical Memorandum
4.2.7 Besides setting the WQOs, the WPCO controls effluent discharging into any WCZ through a
licensing system. The TM-DSS issued under Section 21 of the WPCO, gives guidance on permissible effluent discharges based on the type of receiving waters (foul sewers, storm water drains, inland and coastal waters). The limits control the physical, chemical and microbial quality of effluent. Any sewage from the proposed construction activities should comply with the standards for effluent discharged into the foul sewers and coastal waters of the Tolo WCZ, as shown in Table 1 and Table 7, respectively, of the TM-DSS.
Practice Note
4.2.8 A practice note for professional persons was issued by the EPD to provide guidelines for
handling and disposal of construction site discharges. The ProPECC PN 1/94 “Construction Site Drainage” provides good practice guidelines for dealing with ten types of discharge from a construction site. These include surface runoff, groundwater, boring and drilling water, bentonite slurry, water for testing and sterilisation of water retaining structures and water pipes, wastewater from building construction, acid cleaning, etching and pickling wastewater, and wastewater from site facilities. Practices given in the ProPECC PN 1/94 (Appendix 4.3) should be followed as far as possible during construction to minimise the water quality impact due to construction site drainage.
Assessment Criteria for Coral Impact
4.2.9 Possible indirect impact on subtidal habitat may arise due to water quality deterioration.
Hard corals are known to be at particular risk of deleterious impacts from sedimentation through smothering and clogging of their respiratory and feeding apparatus. Similarly, more turbid water may reduce the amount of light reaching beneath the water surface which may also be detrimental to hard corals. With less light, growth rates of hermatypic hard corals (the only type of coral to possess photosynthetic algae called zooanthellae) may be reduced. The effects of increased sediment levels in the water column also extend to other marine groups apart from the corals. For instance, fauna inhabiting soft substrata may also be smothered if sedimentation rates are very high.
4.2.10 Corals possess mechanisms for rejecting sediment from their surfaces, but employment of
these mechanisms expend energy and may cause stress ultimately leading to bleaching (expulsion of zooxanthellae) or tissue necrosis. The vulnerability of different corals to sedimentation effects is not the same. Corals with horizontal plate-like or massive growth
(1) Territory Development Department (July 2001). Agreement No. CE 74/98, Wan Chai Development Phase
II, Comprehensive Feasibility Study, Environmental Impact Assessment Report, Volume I – Text.
Agreement No CE 43/2001 (EP) Tai Po Sewage Treatment Works – Stage V Drainage Services Department Final EIA Report
MAUNSELL
4-6
forms are more vulnerable than corals that grow with plates arranged vertically or with upright branches. Coral with convex surfaces or possessing tall polyps are also less sensitive. Sensitivity to sediment loading also varies markedly between species of the same genus (Hawker and Connell 1992) and may even vary between individual colonies of the same species as individual colonies change their growth form to best cope with different sedimentation regimes where they live (Pastorok and Bilyard 1985). Hawker and Connell (1992) indicated that a 30% increase in long-term background SS levels may lead to a 20% reduction in annual growth rate in hard corals.
4.2.11 Since potential impacts on corals may arise through increased turbidity (i.e. elevation in SS)
and excessive sediment deposition, the magnitude of impacts on corals was assessed based on both of these water quality parameters.
4.2.12 According to Pastorok and Bilyard(2) and Hawker and Connell(3), a sedimentation rate higher
than 0.1 kg/m2/day would introduce moderate to severe impact upon corals. This criterion has been adopted in other recently approved EIA such as Eastern Waters MBA Study(4), West Po Toi MBA Study(5) and Tai Po Gas Pipeline Study(6). This sedimentation rate criterion is considered to offer sufficient protection to corals and is anticipated to guard against unacceptable impacts. This protection has been confirmed by previous EM&A results which have indicated no adverse impacts to corals have occurred when this assessment criterion has been adopted.
4.2.13 The WQO for suspended solids in the Victoria Harbour WCZ states that waste discharges
shall not raise the ambient level by 30%. This was adopted in this Study as the criterion for assessing the SS impacts on corals in Victoria Harbour.
4.2.14 There is no marine WQO for suspended solids within the Tolo Harbour and Channel WCZ.
To assess impacts associated with SS in the Tolo Harbour, a criterion of 10 mg/L has been adopted and is considered suitable for use in this EIA Study. Using this criterion, if SS levels exceed 10 mg/L at coral sites, adverse impacts would be predicted (and suitable mitigation pursued). This criterion was adopted in the approved Submarine Gas Pipeline EIA (6) as well as several other studies (7). Moreover, based on previous EM&A monitoring results where
(2) Pastorok, R.A. and Bilyard, G.R. (1985). “Effects of sewage pollution on coral-reef communities.”
Marine Ecology Progress Series 21: 175-189. (3) Hawker, D. W. and Connell, D. W. (1992). “Standards and Criteria for Pollution Control in Coral Reef
Areas” in Connell, D. W and Hawker, D. W. (eds.), Pollution in Tropical Aquatic Systems, CRC Press, Inc. (4) Hyder (1997). Sand Dredging and Backfilling of Borrow Pits at the Potential Eastern Waters Marine
Borrow Area, EIA Report, CED, 1997. (5) ERM-Hong Kong, Limited (2001). Focused Cumulative Water Quality Impact Assessment of Sand
Dredging at the West Po Toi Marine Borrow Area Final Report. (6) ERM-Hong Kong, Limited (2003). The Proposed Submarine Gas Pipelines from Cheng Tou Jiao Liquefied
Natural Gas Receiving Terminal, Shenzhen to Tai Po Gas Production Plant, Hong Kong, EIA Report, The Hong Kong and China Gas Company Limited, 2003
(7) Studies that have adopted the SS elevation criterion of 10 mg L-1 include: Sai Kung Sewage Treatment Works EIA Study;
Civil Engineering Department (1997) Sand dredging and backfilling of Borrow Pits at the potential Eastern Waters Marine Borrow Area EIA Report;
Civil Engineering Department (1998) Environmental Impact Assessment of backfilling Marine Borrow Areas at East Tung Lung Chau;
CLP Power (2001) Environmental consultancy services for the proposed 11 kV cable circuits from Tsai Mong Tsai to Kiu Tsui;

Agreement No CE 43/2001 (EP) Tai Po Sewage Treatment Works – Stage V Drainage Services Department Final EIA Report
MAUNSELL
4-7
this assessment criterion has been adopted, no adverse impacts on corals have occurred. In summary, the SS criterion of 10 mg/L would be sufficiently protective to guard against unacceptable impacts on corals within the Tolo Harbour.
Assessment Criteria for Fish Cultural Zone
4.2.15 Literature reviews indicate that lethal responses had not been reported in adult fish at a SS
concentration of below 125 mg/L (8). The AFCD consultancy Study on Fisheries and Marine Ecological Criteria for Impact Assessment (9) provides the guideline values for different parameters for protection of local marine fisheries resources. The guideline values for relevant parameters are given in Table 4.4 below.
Table 4.4 Assessment Criteria for Local Marine Biota and Fisheries Resources
Parameter Continuous Concentration
(mg/L)
Maximum Concentration
(mg/L)
Minimum Concentration
(mg/L) Ammonia, at pH 8.0 (Total ammonia as NH3-N)
0.7 1.2 -
Dissolved Oxygen 5 - 2 Total Suspended Solids Site Specific 50 -
4.2.16 The guidelines derived for Hong Kong above were compared with those established for other
countries, as well as tolerance and responses of marine species reported in the literature. 4.2.17 The continuous concentration values derived for each of the water quality parameters are
required to protect local marine biota from chronic effects of pollution. Thus, these continuous concentration values should be maintained throughout the operational phase of any development projects. The maximum concentration (minimum concentration for DO) values, which aim at a lower level of protection, offer protection to short-term acute effects, and thus should be complied with during both the construction and operational phases.
4.3 Description of the Environment
Water Quality at Victoria Harbour 4.3.1 The marine water quality monitoring data routinely collected by EPD were used to establish
the baseline condition. The EPD monitoring stations in Victoria Harbour include VM1, VM2, VM4, VM5, VM6, VM7 (Figure 4.1). A summary of EPD monitoring data collected in 2002
CLP Power (2002) Environmental consultancy services for the proposed 132 kV cable circuits from A Kung Wan to
Sai Kung Pier; The Hongkong Electric Co (2002) 132 kV submarine cable installation for Wong Chuk Hang – Chung Hom Kok 132
kV circuits. (8) References cited in BCL (1994) Marine Ecology of the Ninepin Islands including Peddicord R and McFarland V
(1996) Effects of suspended dredged material on the commercial crab, Cancer magister. in PA Krenkel, J Harrison and JC Burdick (Eds) Dredging and its Environmental Effects. Proc. Speciality Conference. American Society of Engineers.
(9) City University of Hong Kong, Final Report, Agreement No. CE 62/98, Consultancy Study on Fisheries and marine Ecological Criteria for Impact Assessment, AFCD, July 2001.

Agreement No CE 43/2001 (EP) Tai Po Sewage Treatment Works – Stage V Drainage Services Department Final EIA Report
MAUNSELL
4-8
is presented in Table 4.5 for VM1, VM2 and VM4 that are closest to the outfall of Kai Tak Nullah. As the Harbour Area Treatment Scheme (HATS) Stage I was commissioned in late 2001, the data shown in Table 4.5 represent the situation after the commissioning of HATS Stage 1.
Table 4.5 Summary Statistics of 2002 Marine Water Quality in the Vicinity of the outfall of Kai Tak Nullah
EPD Monitoring Station Parameter VM1 VM2 VM4
WPCO WQOs (in marine waters)
Temperature (oC) 22.8 (16.2 - 27.2)
22.9 (16.2 - 27.4)
23.0 (16.2 - 27.3)
Not more than 2 oC in daily temperature range
Salinity (ppt) 32.7 (31.4 - 33.4)
32.4 (30.4 - 33.4)
32.2 (30 - 33.4)
Not to cause more than 10% change
81.7 (60.1 - 96.5)
83.8 (62.1 - 107.1)
80.6 (64.3 - 100.4)
- Dissolved Oxygen (DO) (% saturation) Bottom 76.4
(29 - 96.2) 77.6
(30.3 - 105.6) 73.6
(29.9 - 99.8) -
5.8 (4.2 - 7.2)
6.0 (4.2 - 7.1)
5.7 (4.4 - 6.8)
Not below 4 mg/L for 90% of the samples
DO (mg/L)
Bottom 5.5 (2.1 - 7.4)
5.6 (2.2 - 7.1)
5.3 (2.1 - 6.9)
Not below 2 mg/L for 90% of the samples
pH value 8.0 (7.6 - 8.2)
8.0 (7.8 - 8.2)
8.0 (7.7 - 8.2)
6.5 - 8.5 (± 0.2 from natural range)
Secchi disc (m) 2.2 (1.0 - 3.5)
2.1 (1.0 - 3.1)
2.0 (1.0 - 2.5)
-
Turbidity (NTU) 10.5 (6.3 - 14.2)
9.6 (6.4 – 14.0)
10.4 (6.7 – 15.0)
-
Suspended Solids (SS) (mg/L)
7.0 (3.1 - 15.2)
5.8 (2.4 - 9.9)
7.1 (2.6 - 13.8)
Not more than 30% increase
Silica (as SiO2) (mg/L)
0.7 (0.2 - 1.1)
0.6 (0.1 - 1.2)
0.6 (0.2 - 1.2)
-
5-day Biochemical Oxygen Demand (BOD5) (mg/L)
0.8 (0.4 - 2.1)
1.1 (0.5 - 2.3)
1.0 (0.5 – 2.0)
-
Nitrite Nitrogen (NO2-N) (mg/L)
0.02 (0.01 - 0.04)
0.02 (0.01 - 0.04)
0.02 (0.01 - 0.05)
-
Nitrate Nitrogen (NO3-N) (mg/L)
0.06 (0.03 - 0.11)
0.07 (0.03 - 0.13)
0.08 (0.03 - 0.15)
-
Ammonia Nitrogen (NH3-N) (mg/L)
0.10 (0.01 - 0.22)
0.13 (0.02 - 0.26)
0.15 (0.04 - 0.33)
-
Unionised Ammonia (UIA) (mg/L)
0.003 (0.000 - 0.009)
0.004 (0.001 - 0.010)
0.005 (0.002 - 0.01)
Not more than annual average of 0.021 mg/L
Total Inorganic Nitrogen (TIN) (mg/L)
0.18 (0.08 - 0.35)
0.23 (0.09 - 0.40)
0.25 (0.12 - 0.51)
Not more than annual water column average of 0.4 mg/L
Total Nitrogen (Total-N) (mg/L)
0.32 (0.20 - 0.49)
0.38 (0.19 - 0.55)
0.42 (0.25 - 0.71)
-
Ortho-Phosphate (Ortho-P) (mg/L)
0.01 (0.00 - 0.03)
0.02 (0.00 - 0.04)
0.02 (0.00 - 0.04)
-
Total Phosphorus (Total-P) (mg/L)
0.04 (0.03 - 0.06)
0.04 (0.02 - 0.06)
0.04 (0.02 - 0.07)
-
Chlorophyll-a (µg/L)
2.8 (0.7 - 12.7)
3.6 (0.7 - 11.3)
4.2 (0.7 - 16.8)
-
E. coli (cfu/100 mL)
436 (28 – 4,310)
664 (33 – 8,033)
3612 (1,361 – 6,023)
-

Agreement No CE 43/2001 (EP) Tai Po Sewage Treatment Works – Stage V Drainage Services Department Final EIA Report
MAUNSELL
4-9
EPD Monitoring Station Parameter VM1 VM2 VM4
WPCO WQOs (in marine waters)
Faecal Coliform (cfu/100 mL)
2283 (79 – 8,005)
5758 (90 – 26,930)
8222 (33,42 – 15,212)
-
Note: 1. Except as specified, data presented are depth-averaged values calculated by taking the means of three depths: Surface, mid-depth, bottom.
2. Data presented are annual arithmetic means of depth-averaged results except for E. coli and faecal coliforms that are annual geometric means.
3. Data in brackets indicate the ranges.
4.3.2 Full compliance with the WQO for depth-averaged (DA) and bottom dissolved oxygen (DO), depth-averaged (DA) total inorganic nitrogen (TIN) and unionised ammonia (UIA) was achieved at VM1, VM2 and VM4 in 2002.
Trend of Water Quality in Victoria Harbour
4.3.3 As reported in the “Marine Water Quality in Hong Kong in 2001” issued by the EPD, there
was an increasing trend of E. coli at VM1, VM2 and VM4. These findings reflect widespread and marked increase in faecal pollution in Victoria Harbour at the time before the commissioning of HATS Stage I.
4.3.4 A significant long-term increase in seawater temperature was also observed at VM1, VM2,
and VM4. It was estimated that the temperature (surface and depth-averaged) at these stations experienced an average rise of 1 oC in the past 14 to 16 years.
4.3.5 As reported in the “Marine Water Quality in Hong Kong in 2002” issued by the EPD, the
implementation of HATS Stage I in late 2001 has resulted in a very substantial water quality improvement at the eastern end of the harbour (VM1 and VM2) and moderate improvements in mid harbour station (VM4). In 2002, there was a very significant reduction of E.coli at Stations VM1 and VM2 by more than 90% while VM4 experienced an E.coli reduction of 40%. The level of ammonia nitrogen (NH3-N) at VM1 and VM2 also substantially decreased by about 50%.
Water Quality at Tolo Harbour and Channel
4.3.6 The EPD monitoring stations closest to the Sha Tin and Tai Po effluent pumping station
emergency bypasses are TM2 and TM3 respectively (Figure 4.2a), that are located within the Harbour Subzone. A summary of the EPD monitoring data collected at TM2 and TM3 in 2002 is presented in Table 4.6 (10).
(10) Environmental Protection Department (2002). Marine Water Quality in Hong Kong in 2002.

Agreement No CE 43/2001 (EP) Tai Po Sewage Treatment Works – Stage V Drainage Services Department Final EIA Report
MAUNSELL
4-10
Table 4.6 Summary Statistics of 2002 Marine Water Quality in the Vicinity of the Sha Tin and Tai Po Effluent Pumping Station Emergency Bypass outfalls
EPD Monitoring Station Parameter TM2 TM3
WPCO WQOs (in marine waters)
Temperature (oC) 24.8 (16.8 - 29.7)
24.8 (16.9 - 29.7)
Not more than 1 oC change from natural daily range
Salinity (ppt) 30.7 (25.4 - 32.5)
31.3 (27.5 - 32.8)
Not to cause more than 3 ppt change from the normal range
97.1 (75.7 - 126.4)
109.3 (80.3 - 158)
- Dissolved Oxygen (DO) (% saturation) Bottom 99.7
(71.7 - 126.3) 95.4
(55.5 - 132.8) -
DO (mg/L) 6.8 (5 - 8.6)
7.6 (5.5 - 10.6)
Harbour and Buffer subzones: not less than 4 mg/L other than within 2 m of the bottom; Channel subzone: not less than 4 mg/L
Bottom 6.8 (4.7 - 8.6)
6.7 (3.8 - 9.7)
Harbour subzone: not less than 2 mg/L within 2 m of the bottom; Buffer subzone: not less than 3 mg/L within 2 m of the bottom
pH value 8.2 (7.8 - 8.5)
8.2 (7.9 - 8.6)
Harbour subzone: not to exceed by ± 0.5 pH units; Buffer subzone: not to exceed by ± 0.3 pH units; Channel subzone: not to exceed by ± 0.1 pH units
Secchi disc (m) 1.2 (1 - 2)
1.5 (1 - 2.5)
-
Turbidity (NTU) 8.3 (6.3 - 14.1)
7.7 (4.7 - 12.9)
-
Suspended Solids (SS) (mg/L)
4.0 (1.7 - 8.1)
4.8 (1.2 - 28.6)
-
Silica (as SiO2) (mg/L)
0.9 (0.1 - 2.4)
0.7 (0.1 - 1.5)
-
5-day Biochemical Oxygen Demand (BOD5) (mg/L)
2.2 (1.3 - 2.8)
2.0 (1.1 - 2.6)
-
Nitrite Nitrogen (NO2-N) (mg/L)
0.01 (0.00 - 0.04)
0.01 (0.00- 0.04)
-
Nitrate Nitrogen (NO3-N) (mg/L)
0.07 (0.00 - 0.3)
0.02 (0.00 - 0.14)
-
Ammonia Nitrogen (NH3-N) (mg/L)
0.07 (0.01 - 0.16)
0.05 (0.01 - 0.11)
-
Unionised Ammonia (UIA) (mg/L)
0.005 (0.000 - 0.013)
0.004 (0.001 - 0.010)
-
Total Inorganic Nitrogen (TIN) (mg/L)
0.15
(0.01 - 0.42)
0.08 (0.02 - 0.29)
-
Total Nitrogen (Total-N) (mg/L)
0.39
(0.23 - 0.62)
0.30
(0.21 - 0.48)
-
Ortho-Phosphate (Ortho-P) (mg/L)
0.01 (0.00 - 0.01)
0.01 (0.00 - 0.02)
-
Total Phosphorus (Total-P) (mg/L)
0.03
(0.02 - 0.05)
0.03
(0.02 - 0.04)
-
Chlorophyll-a (µg/L)
11.15
(2.7 - 29)
11.22
(2.5 - 37)
Harbour subzone: not to exceed 20 µg/L; Buffer subzone: not to exceed 10 µg/L; Channel subzone: not to exceed 6 µg/L

Agreement No CE 43/2001 (EP) Tai Po Sewage Treatment Works – Stage V Drainage Services Department Final EIA Report
MAUNSELL
4-11
EPD Monitoring Station Parameter TM2 TM3
WPCO WQOs (in marine waters)
E. coli (cfu/100 mL)
70
(6 - 490)
173 (1 - 1669)
Geometric mean not to exceed 610 per 100 mL at the secondary contact recreation subzone and fish culture zones
Faecal Coliform (cfu/100 mL)
439
(35 - 1878)
838
(10 - 6155)
-
Note: 1. Except as specified, data presented are depth-averaged values calculated by taking the means of three depths: Surface, mid-depth, bottom.
2. Data presented are annual arithmetic means of depth-averaged results except for E. coli and faecal coliforms that are annual geometric means.
3. Data in brackets indicate the ranges. 4. Chlorophyll-a level is calculated as a running arithmetic mean of five daily measurements for any single location
and depth.
4.3.7 Full compliance with WQO for chlorophyll a, depth-averaged (DA) and bottom DO was
achieved at TM2 and TM3 in 2002.
Trend of Water Quality in Tolo Harbour and Channel 4.3.8 The levels of nitrogen nutrients, orthophosphate phosphorus and total phosphorus, silica and
chlorophyll-a in Tolo Harbour continued to decline in 2002. 4.3.9 As reported in “Marine Water Quality in Hong Kong in 2001” issued by EPD, there was a
general decline in 5-day biochemical oxygen demand (BOD5) and significant decrease in nitrate nitrogen (NO3-N), total inorganic nitrogen (TIN) and orthophosphate phosphorus (Ortho-P) nutrients in the inner Tolo Harbour after the implementation of the Tolo Harbour Action Plan in 1986, following a series of measures taken by the Government to reduce pollution and improve water quality in Tolo Harbour.
4.4 Water Sensitive Receivers 4.4.1 The water sensitive receivers (WSRs) within Victoria Harbour and Tolo Harbour have been
identified in accordance with the HKPSG and the EIAO-TM.
Sea Water Intakes 4.4.2 There are 15 WSD saltwater intakes at the waterfront of Victoria Harbour that may be
impacted by the Project. Their locations are shown in Figure 4.3. 4.4.3 There are 2 WSD saltwater intakes within Tolo Harbour, namely Tai Po and Shatin (Figure
4.4). 4.4.4 Saltwater is also extracted from Tolo Harbour by the Marine Laboratory of the Hong Kong
Chinese University (CUHK) to provide “fresh” seawater for aquatic life within the laboratory. The location of this intake point is shown in Figure 4.4.

Agreement No CE 43/2001 (EP) Tai Po Sewage Treatment Works – Stage V Drainage Services Department Final EIA Report
MAUNSELL
4-12
Cooling Water Intakes 4.4.5 A number of existing and planned cooling water intakes are / will be located along the
waterfront of Central, Wan Chai and Causeway Bay. These intakes supply cooling water to the air conditioning systems of certain commercial buildings in Central, Wan Chai and Causeway Bay. Their locations are shown in Figure 4.3.
Fish Culture Zone
4.4.6 There are several fish culture zones (FCZ) within Tolo Harbour and Channel, including:
• Yim Tin Tsai FCZ;
• Yim Tin Tsai (East) FCZ;
• Lo Fu Wat FCZ; and
• Yung Shue Au FCZ. 4.4.7 The locations of these FCZs are shown in Figure 4.4.
Beaches 4.4.8 There are several non-gazetted beaches within Tolo Harbour and Channel (Figure 4.4),
namely:
• Lung Mei
• Sha Lan
• Hoi Ha
• Wu Kai Sha 4.4.9 There is also a water sport centre at Tai Mei Tuk next to Plover Cove Reservoir (Figure 4.4).
Marine Ecological Sensitive Receivers 4.4.10 Key marine ecological sensitive receivers within the Victoria Harbour include Green Island
and Junk Bay coral communities (as shown in Figure 4.3) which are located more than 9 km west and 4.7 km east of the outfall of Kai Tak Nullah, respectively.
4.4.11 There are several marine ecological sensitive receivers and SSSIs within Tolo Harbour and
Channel, including:
• Hoi Ha Wan Marine Park;
• Mangroves;
• Corals; and
• Ting Kok SSSI 4.4.12 The locations of these marine ecological sensitive receivers and SSSIs are shown in Figure
4.4.

Agreement No CE 43/2001 (EP) Tai Po Sewage Treatment Works – Stage V Drainage Services Department Final EIA Report
MAUNSELL
4-13
4.5 Assessment Methodology 4.5.1 To assess the potential water quality impacts due to the construction and operation of the
Project, the sources and nature of effluent to be generated during construction and operation were identified and their impacts were quantified where practicable.
Construction Phase Impact
4.5.2 The construction of the Project would be land-based and would not involve marine works
such as dredging or filling. The construction works would be designed not to affect normal operation of the TPSTW and the sewage effluent quality. Thus, it is expected that potential water quality impact associated with the Project would be mainly from the on-site construction activities, construction runoff and drainage discharges from the construction site. The potential impact from these activities was reviewed. Practical water pollution control measures / mitigation proposals were recommended to ensure that any effluent discharged from the construction site would comply with the criteria of WPCO.
Operation Phase Impact
4.5.3 The key water quality issue of this Project is the impact of sewage effluent discharged from
TPSTW after commissioning of the Project. The impact was assessed by computer modelling. 4.5.4 Upon completion of the Project, the capacity of TPSTW will be increased from the present
design flow of 88,000 m3 per day to 130,000 m3 per day. The current and the proposed new effluent standards upon commissioning of the Project are summarised in Table 4.7.
Table 4.7 Current and New Effluent Standards upon commissioning
Current Standards New Standards Parameters 95
percentile Maximum 95
percentile Maximum Annual
Average Monthly
Geometric Mean
BOD5 (mg/L) 20 40 20 40 - - SS (mg/L) 30 60 30 60 - - Total-N (mg/L) 25 50 - 35 20 - NH3-N (mg/L) - - - 10 5 - E. coli (no/100 mL)
- - 15,000 - - 1,000
4.5.5 Based on population and flow projection as shown in paragraph 2.4.1, the projected baseflow
of TPSTW has been estimated for use in the water quality modelling as shown below:
Year Projected Baseflow of TPSTW
(m3/day) Effluent Standard
(refer to Table 4.7) 2003 80,178 Current 2010 (Phase 1) 99,021 Current (for E.coli); New (for the rest) 2016 (Phase 2) 130,000 New

Agreement No CE 43/2001 (EP) Tai Po Sewage Treatment Works – Stage V Drainage Services Department Final EIA Report
MAUNSELL
4-14
Summary of Modelling Scenarios
4.5.6 As discussed in Section 4.1.2, the Project would have potential impact on both Victoria
Harbour and Tolo Harbour. Two Delft3D models, namely (1) Victoria Harbour (VH) Fine Grid Model and (2) Tolo Harbour and Mirs Bay (THMB) Fine Grid Model were used to simulate the impacts within Victoria Harbour and Tolo Harbour respectively. Table 4.8 summarises the details of water quality modelling scenarios. Scenarios 1, 2a, 2b, 3a and 3b refer to the water quality simulation for Victoria Harbour. Scenarios 4a, 4b, 4c, 5a, 5b, 5c, 5d, 6a, 6b, 7a and 7b refer to the water quality simulation for Tolo Harbour and Channel. The set-up of these two models is described in Sections 4.5.8 to 4.5.40.

Agreement No CE 43/2001 (EP) Tai Po Sewage Treatment Works – Stage V Drainage Services Department Final EIA Report
MAUNSELL
4-15
Table 4.8 Proposed Baseline and Operation Phase Water Quality Modelling Scenarios Scenario Phase Flow
(m3 per day) Location of Discharge Effluent
Standard BOD5 (mg/L)
TSS (mg/L)
TKN (mg/L)
Total N (mg/L)
NH3-N (mg/L)
E. coli (no/100mL)
Victoria Harbour Model 20 (2) 30 (2) 14.75 (3) 25 (2) 9.95 (4) 296,500 (5) 1 (Year 2003) Baseline (normal, with HATS
Phase I only, without the Project)
80,178 (TPSTW) + 240,000 (STSTW) + Peak flow (1)
Kai Tak Nullah (through the THEES)
TPSTW: Current STSTW: Current 20 (2) 30 (2) 16.53 (6) 25 (2) 11.74 (7) 296,500 (8)
TPSTW: Current 20 (2) 30 (2) 14.75 (3) 25 (2) 9.95 (4) 296,500 (5) 2a (Year 2010) Baseline (normal, without the Project and with HATS Stage I only)
88,000 (TPSTW) + 283,773 (STSTW) (9) + Peak flow(1)
Kai Tak Nullah (through the THEES) STSTW (10) 20 (2) 30 (2) 18.59 (6) 27.99 (11) 7.66 (11) 15,000 (2)
TPSTW: New 20 (2) 30 (2) 16.51 (3) 27.99 (11) 7.66 (11) 296,500 (5) 2b (Year 2010)
Operation (normal, after Project commission and with HATS Stage I only)
99,021 (TPSTW) (12) + 283,773 (STSTW) (9) + Peak flow(1)
Kai Tak Nullah (through the THEES) STSTW (10) 20 (2) 30 (2) 18.59 (6) 27.99 (11) 7.66 (11) 15,000 (2)
TPSTW: Current 20 (2) 30 (2) 14.75 (3) 25 (2) 9.95 (4) 296,500 (5) 3a (Year 2016) Baseline (normal, without Project but with HATS fully commissioned)
88,000 (TPSTW) + 340,000 (STSTW) (13) + Peak flow(1)
Kai Tak Nullah (through the THEES) STSTW (10) 20 (2) 30 (2) 18.59 (6) 27.99 (11) 7.66 (11) 15,000 (2)
TPSTW: New 20 (2) 30 (2) 16.51 (3) 27.99 (11) 7.66 (11) 15,000 (2) 3b (Year 2016)
Operation (normal, after Project commission and with HATS fully commissioned)
130,000 (TPSTW) (14) + 340,000 (STSTW) (13) + Peak flow(1)
Kai Tak Nullah (through the THEES) STSTW (10) 20 (2) 30 (2) 18.59 (6) 27.99 (11) 7.66 (11) 15,000 (2)
Tolo Harbour Model 4a (Year 2016) Baseline condition of Tolo
Harbour No sewage/ effluent discharge into Tolo Harbour(26)
- - - - - - - -
4b (Year 2010) Baseline condition of Tolo Harbour
No sewage / effluent discharge into Tolo Harbour(26)
- - - - - - - -
4c (Year 2003) Baseline condition of Tolo Harbour
No sewage / effluent discharge into Tolo Harbour(26)
- - - - - - - -
TPSTW: New 20 (2) 30 (2) 16.51 (3) 27.99 (11) 7.66 (11) 15,000 (2) 5a (Year 2016)
Operation (normal, after project commission)
Occasional overflow of treated effluent from TPSTW and STSTW (25)
Overflow at STSTW only STSTW (10) 20 (2) 30 (2) 18.59 (6) 27.99 (11) 7.66 (11) 15,000 (2)
TPSTW: New 20 (2) 30 (2) 16.51 (3) 27.99 (11) 7.66 (11) 15,000 (2) 5b (Year 2016)
Operation (normal, after project commission)
Occasional overflow of treated effluent from TPSTW and STSTW (25)
Overflow at TPSTW and STSTW STSTW (10) 20 (2) 30 (2) 18.59 (6) 27.99 (11) 7.66 (11) 15,000 (2)
TPSTW: New 20 (2) 30 (2) 16.51 (3) 27.99 (11) 7.66 (11) 296,500 (5) 5c (Year 2010)
Operation (normal, after Phase 1 commission)
Occasional overflow of) treated effluent from TPSTW and STSTW (24
Overflow at STSTW only STSTW (10) 20 (2) 30 (2) 18.59 (6) 27.99 (11) 7.66 (11) 15,000 (2)

Agreement No CE 43/2001 (EP) Tai Po Sewage Treatment Works – Stage V Drainage Services Department Final EIA Report
MAUNSELL
4-16
Scenario Phase Flow (m3 per day)
Location of Discharge Effluent Standard
BOD5 (mg/L)
TSS (mg/L)
TKN (mg/L)
Total N (mg/L)
NH3-N (mg/L)
E. coli (no/100mL)
TPSTW: New 20 (2) 30 (2) 16.51 (3) 27.99 (11) 7.66 (11) 296,500 (5) 5d (Year 2010)
Operation (normal, after Phase 1 commission)
Occasional overflow of treated effluent from TPSTW and STSTW (24)
Overflow at TPSTW and STSTW STSTW (10) 20 (2) 30 (2) 18.59 (6) 27.99 (11) 7.66 (11) 15,000 (2)
TPSTW: New 20 (2) 30 (2) 16.51 (3) 27.99 (11) 7.66 (11) 15,000 (2) 6a (Year 2016)
Operation (Maintenance of THEES tunnel)
130,000 (TPSTW) (14) + 340,000 (STSTW) (13) + Peak flow(1)
Bypass at STSTW only (for about four weeks) STSTW (10) 20 (2) 30 (2) 18.59 (6) 27.99 (11) 7.66 (11) 15,000 (2)
TPSTW: New 20 (2) 30 (2) 16.51 (3) 27.99 (11) 7.66 (11) 15,000 (2) 6b (Year 2016)
Operation (Maintenance of THEES tunnel)
130,000 (TPSTW) (14) + 340,000 (STSTW) (13) + Peak flow(1)
Bypasses at TPSTW and STSTW (for four weeks) STSTW (10) 20 (2) 30 (2) 18.59 (6) 27.99 (11) 7.66 (11) 15,000 (2)
7a (Year 2016) Operation (emergency – complete power failure) (Dry Season)
130,000 (TPSTW) (14) + Peak flow(1)
Emergency bypass at TPSTW (for 24 hours discharge)
TPSTW: No treatment 273 (dry) (21)
460 (dry) (21)
57 (dry) (21)
57 (dry) (22)
28 (dry) (21)
2x10⁷ (dry) (23)
7b (Year 2016) Operation (emergency – complete power failure) (Wet Season)
130,000 (TPSTW) (14) + Peak flow(1)
Emergency bypass at TPSTW (for 24 hours discharge)
TPSTW: No treatment 170 (wet) (21)
297 (wet) (21)
46 (wet) (21)
46 (wet) (22)
27 (wet) (21)
2x10⁷ (wet) (23)
Remark: (1) “ + Peak flow” means 4-hour storm flow will be combined with the TPSTW dry weather flow pattern. (2) At 95 percentile values of the effluent standards. (3) Estimated from the ratio of TKN : Total N of the monthly analytical data of TPSTW sewage effluent between January 2001 and December 2002. (4) Estimated from the ratio of NH3-N : Total N of the monthly analytical data of TPSTW sewage effluent between January 2001 and December 2002. (5) As there is no record of E. coli concentration of sewage effluent from TPSTW, the 95 percentile value of STSTW E. coli records is used. (6) Estimated from the ratio of TKN : Total N of the monthly analytical data of STSTW sewage effluent between January 2002 and December 2002. (7) Estimated from the ratio of NH3-N : Total N of the monthly analytical data of STSTW sewage effluent between January 2002 and December 2002. (8) 95 percentile value of monthly analytical data of STSTW sewage effluent between January 2002 and December 2002. (9) Projected sewage effluent of STSTW in 2010 based on the Review of North District and Tolo Harbour SMPs Final Interim Report. (10) Effluent standards of STSTW (with UV disinfection) after the commission Stage III Extension. (11) 95-percentile values of the effluent standards. (12) Projected sewage effluent of TPSTW in 2010 after the commission of the Project based on the Review of North District and Tolo Harbour SMPs Final Interim Report. (13) Design capacity (dry weather flow) of STSTW after the STSTW Stage III Extension. (14) Design capacity (dry weather flow) of TPSTW after full commission of the Project. (21) Dry season data were derived from the monthly analytical data for TPSTW between January 2001 and March 2001, while the wet season data were derived from the monthly data between June and
August 2001. (22) According to Metcalf & Eddy, Inc (1991), Wastewater Engineering, Treatment, Disposal, and Reuse (Third Edition, McGraw-Hill, Inc.), the value of Total N is about the same as the value of TKN in
untreated domestic wastewater. The amount of inorganic nitrogen in untreated domestic wastewater is negligible. (23) Design load concentration of TPSTW. (24) Occasional overflow of effluent from TPSTW/STSTW during storm event above the capacity of the Sha Tin Effluent Pumping Station. (25) Occasional overflow of effluent from TPSTW/STSTW during storm event and under ultimate flow conditions above the capacity of the Sha Tin Effluent Pumping Station. (26) Ignoring the impact caused by diffuse pollution in the absence of the Project.

Agreement No CE 43/2001 (EP) Tai Po Sewage Treatment Works – Stage V Drainage Services Department Final EIA Report
MAUNSELL 4-17
4.5.7 A total of 16 modelling scenarios were proposed to address the potential impacts from the Project (see Table 4.9 below). The projected baseflow in Section 4.5.5 and the effluent standards in Table 4.7 were used to estimate the projected pollution load discharged from the Project for different year horizons. The background pollution loading within the Study Area was also input to the model to take into account the cumulative effect. The background pollution load adopted for different years of assessment (i.e. 2003, 2010 and 2016) are discussed in Sections 4.5.34 to 4.5.40. A more detailed description of each modelling scenario and the detailed modelling methodology are provided in the subsequent sections.
Table 4.9 Summary of Modelling Scenarios
Scenario (Refer to Table 4.8) Water Quality Impact Baseline Interim and Operational Phases
Impact within Victoria Harbour when treated effluent is discharged into Victoria Harbour via Kai Tak Nullah under THEES (normal operation mode which applies in all time except under exceptional conditions)
Scenario 1 (2003) Scenario 2a (2010) Scenario 3a (2016)
Scenario 2b (2010) Scenario 3b (2016)
Impact within Tolo Harbour under occasional overflow of treated effluent during storm event or under ultimate flow conditions
Scenarios 5a&5b (2016) Scenarios 5c&5d (2010)
Exceptional condition 1: Impact within Tolo Harbour when all treated effluent is diverted into Tolo Harbour under the shutting down of the THEES tunnel for maintenance
Scenarios 6a&6b (2016)
Exceptional condition 2: Impact within Tolo Harbour when untreated effluent from TPSTW is diverted into Tolo Harbour under emergency situation (complete power failure).
Scenario 4a (2016) Scenario 4b (2010) Scenario 4c (2003)
Scenario 7a& 7b (2016)
Simulation Period
4.5.8 The simulation period of water quality models cover a spin-up period followed by the actual
simulation period. A longer spin-up period was allowed for the THMB Model because of the embayed features of the Tolo Harbour that requires longer ‘warm-up’ period to achieve quasi-steady state. The same spin-up and simulation periods were used for all modelling scenarios and all assessment years. Details are given below.
Victoria Harbour Model
4.5.9 The hydrodynamic simulations driving the water quality model consist of two 15-day full
spring-neap cycles (9 to 24 February 1996 for dry season; and 26 July to 10 August 1996 for wet season). These hydrodynamic simulation periods were selected based on the EPD Update Study (Agreement No. CE 42/97, Update on Cumulative Water Quality and Hydrological Effect of Coastal Developments and Upgrading of Assessment Tool). These hydrodynamic simulation results were used repeatedly for water quality simulation for more than one complete calendar year as shown below:
• Spin-up period of water quality model: 2 December (of the 1st year) to 1 January (of the 2nd year)
• Actual simulation period of water quality model: 1 January (of the 2nd year) to 31 December (of the 2nd year)

Agreement No CE 43/2001 (EP) Tai Po Sewage Treatment Works – Stage V Drainage Services Department Final EIA Report
MAUNSELL 4-18
Tolo Harbour and Mirs Bay Model 4.5.10 The Tolo Harbour and Mirs Bay (THMB) Model was developed by EPD under Agreement
No. WP01-27. The simulation period of the THMB Model cover 2 calendar years for both hydrodynamic model and water quality model as adopted in Agreement No. WP01-27. The spin-up and actual simulation periods for THMB model are shown below.
• Spin-up period: 1 January 2000– 1 January 2001
• Actual simulation period: 1 January 2001 – 31 December 2001 Diurnal Flow Pattern
4.5.11 The projected diurnal flow pattern of TPSTW for 2006 is shown in Table 4.10a which is
based on the Review of North District and Tolo Harbour SMPs Final Interim Report. The percentages in Table 4.10a were applied to the projected daily baseflow in Section 4.5.5 to derive the hourly dry weather diurnal flow from the Project for different year horizons as model inputs. The same 24-hour diurnal flow pattern was used in the model throughout the simulation year.
Table 4.10a Projected Dry Weather Diurnal Flow Pattern of TPSTW in 2006
Hour % of Daily Flow Hour % of Daily Flow Hour % of Daily Flow Hour % of Daily Flow
0:00 4.51% 6:00 2.71% 12:00 4.72% 18:00 4.21%
1:00 4.44% 7:00 3.08% 13:00 4.58% 19:00 4.95%
2:00 3.83% 8:00 4.72% 14:00 4.11% 20:00 4.86%
3:00 3.36% 9:00 4.35% 15:00 4.06% 21:00 5.32%
4:00 2.94% 10:00 4.44% 16:00 4.35% 22:00 5.09%
5:00 2.71% 11:00 3.97% 17:00 4.11% 23:00 4.58%
Scenario 1 (Victoria Harbour Year 2003 Baseline)
4.5.12 This scenario represents the existing condition under normal operation of the TPSTW,
STSTW and THEES in 2003. An average dry weather flow (ADWF) of 80,178 m3 per day and 240,000 m3 per day for TPSTW and STSTW, respectively, were incorporated into the model. Scenario 1 represents the situation when all the effluent from TPSTW and STSTW is discharged into Victoria Harbour via Kai Tak Nullah. Thus, the existing effluent quality standards (see Table 4.8) were employed together with the hourly dry weather diurnal flow to derive the hourly pollution loadings as model inputs.
Scenario 2a (Victoria Harbour Year 2010 Baseline without the Project)
4.5.13 Scenario 2a represents the baseline condition in 2010 without the Project. All the effluent of
TPSTW and STSTW would be discharged into Victoria Harbour via Kai Tak Nullah under normal operation of TPSTW, STSTW and THEES (with HATS Stage 1 commissioned only). The ADWF of STSTW would reach 283,773 m3/day in 2010, while the TPSTW would be operating at its current design capacity (i.e. 88,000 m3/day) without the Project. Stage III Extension of STSTW with UV disinfection would be commissioned by 2010 and the corresponding new effluent standards for STSTW were adopted. The same current effluent

Agreement No CE 43/2001 (EP) Tai Po Sewage Treatment Works – Stage V Drainage Services Department Final EIA Report
MAUNSELL 4-19
standards (Table 4.8) would still be applicable for TPSTW in 2010. The coastline configuration adopted in the Victoria Harbour Model for 2010 is shown in Figure 4.5. In 2010, the outfall of Kai Tak Nullah would be diverted from Kai Tak Nullah Approach Channel to the seafront of Kowloon Bay under the SEKD.
Scenario 2b (Victoria Harbour Year 2010 with the Project)
4.5.14 Scenario 2b represents normal operation of TPSTW and STSTW after the Project
commission in 2010. The difference of Scenario 2b from Scenario 2a would be the increase of effluent flow from TPSTW. The ADWF of TPSTW would reach 99,021 m3/day by 2010 and the new effluent standards (Table 4.7) were adopted for all parameters except for E.coli.
Scenario 3a (Victoria Harbour Year 2016 Baseline without the Project)
4.5.15 Scenario 3a represents the baseline condition in 2016 without the Project. Major differences
of Scenario 3a (2016 baseline) from Scenario 2a (2010 baseline) include (i) the increase of effluent flow from STSTW to reach its full capacity (340,000 m3/day); and (ii) the change in background pollution loading (Sections 4.5.34 to 4.5.40) and (iii) coastline configuration (Figure 4.6a) in Victoria Harbour between 2010 and 2016. In addition, all stages of HATS would be commissioned by 2016 (see Section 4.5.37 and Table 4.11 for details).
Scenario 3b (Victoria Harbour Year 2016 with the Project)
4.5.16 Scenario 3b represents normal operation of TPSTW and STSTW in 2016 after Project
commission. The differences of Scenario 3b from Scenario 3a would be the increase of effluent flow from TPSTW to reach its full capacity (130,000 m3/day) and the use of new effluent standards in Table 4.7.
Scenario 4a, 4b and 4c (Tolo Harbour Year 2016, 2010 and 2003 Baseline)
4.5.17 Scenarios 4a, 4b and 4c represent the baseline conditions of Tolo Harbour where no effluent
from TPSTW and STSTW would be discharged into the harbour in 2016, 2010 and 2003 respectively with different background pollution loadings.
Scenario 5 (Tolo Harbour under Normal Operation)
4.5.18 Scenario 5 simulates the impact from the overflow discharges under normal operation of
TPSTW and STSTW when treated effluent flow exceeds the existing capacities of the effluent pumping stations. The overflow bypasses of Shatin and Tai Po effluent pumping stations are shown in Figure 4.7. The assessment of overflow bypass has taken into account the effect of storm events. Based on the past discharge records for TPSTW in 2001, it is assumed that the low flow periods where storm events are rare would occur in 13 to 24 February and 15 to 27 November (Figure 1 of Appendix 4.6). The recorded average flow of these dry periods was 77,200 m3/day. It is assumed that any days in 2001 with surplus flow above this dry flow value (77,200 m3/day) are wet days with storm events. Figure 2 of Appendix 4.6 shows the surplus flow recorded in 2001. The surplus flow derived from the 2001 data for each wet day was allocated to the dry weather design flow on the same day for different assessment years to take into account the effect of storm events for water quality modelling. Figure 3 of Appendix 4.6 is a sample plot showing the projected daily discharge

Agreement No CE 43/2001 (EP) Tai Po Sewage Treatment Works – Stage V Drainage Services Department Final EIA Report
MAUNSELL 4-20
rate (dry weather flow + surplus flow from storm events) of TPSTW for 2016. It is also assumed that the surplus flow on each such wet day was contributed by a 4-hour storm event. The surplus flow derived from the 2001 data for each wet day was allocated to the dry weather diurnal discharge on the same day between 19:00 and 22:00 (refer to Section 4.5.11) for all the assessment years. When the combined volume of surplus flow (if any) and dry weather diurnal discharges from the TPSTW exceeds the existing capacity of the effluent pumping station of 4752 m3/hour, the effluent would overflow into a storage tank of 6,500 m3 in size. Overflow via the emergency bypass near TPSTW would occur only in the hours where the effluent stored in the storage tank exceeds 6,500 m3. Figure 4 of Appendix 4.6 shows a sample plot of diurnal overflow at Tai Po effluent pumping station for 2010. The effect of the storage tank on the total quantity of overflow discharged into the Tolo Harbour is not so significant for 2016 and was, on the conservative side, not taken into account for all 2016 modelling scenarios. On the other hand, combined flow of effluent transported from TPSTW via the Tai Po effluent pumping station and the effluent from STSTW would also occasionally exceed the capacity of Sha Tin effluent pumping station of 21600 m3/hour, and overflow would then be discharged via the emergency bypass of the station near STSTW. Within the same year, the total daily flow and pollution load overflowed into Tolo Harbour would vary seasonally due to the seasonal change in storm water flow. The daily volume of overflows would also be increased with increasing year of horizon due to the increase in the projected baseflow of STSTW and TPSTW (Table 4.10b). The overflow would occur only occasionally within a day and would be discharged intermittently. It is assumed that the pollution levels in the storm water would be the same as those in the effluent (Table 4.8) and no dilution of the effluent would occur as conservative approach.
Table 4.10b Volume of Overflow Discharges
Scenario Discharge Location
Total Volume of Treated Effluent Overflow discharged in a year (m3/year)
5a (2016 overflow bypass at Shatin only) Sha Tin 10,580,133
Tai Po 9,832,240
Sha Tin 4,656,300
5b (2016 overflow bypass at both Tai Po and Shatin)
Total 14,488,5405c (2010 overflow bypass at Shatin only) Sha Tin 1,946,384
Tai Po 1,299,318
Sha Tin 48,837
5d (2010 overflow bypass at both Tai Po and Shatin)
Total 1,348,155
Scenarios 5a and 5b (Year 2016)
4.5.19 Scenarios 5a and 5b represent the situation of overflow bypass after the Project is completed
in full scale. For Scenario 5a, it was assumed that, with upgrading of the Tai Po effluent pumping station and associated facilities, all effluent from TPSTW can be exported to Sha Tin effluent pumping station. The combined effluent flow from the TPSTW and STSTW and any storm events would occasionally exceed the existing capacity of Sha Tin effluent pumping station and overflow would be discharged via the emergency bypass of the Sha Tin effluent pumping station. The overflow would occur only in 7 hours per day. It was assumed that the duration of overflow (7 hours at STSTW) would be the same every day throughout the model simulation year.

Agreement No CE 43/2001 (EP) Tai Po Sewage Treatment Works – Stage V Drainage Services Department Final EIA Report
MAUNSELL 4-21
4.5.20 Scenario 5b assumed that there would be no upgrading of the existing Tai Po effluent
pumping station and effluent from TPSTW would occasionally exceed the capacity of the station. Part of the treated effluent would then be discharged via the emergency bypass of the station near TPSTW. On the other hand, combined flow from TPSTW and STSTW would also occasionally exceed the capacity of Sha Tin effluent pumping station and overflow would then be discharged via the emergency bypass of the station at STSTW. The overflow would occur in 19 hours per day at TPSTW and 5 hours per day at STSTW throughout the model simulation year. It is noted that this long duration of overflow represents an overestimation owing to the assumption mentioned in 4.5.18 that the storage tank in the TPSTW is ignored. It was assumed that the duration of overflow (19 hours at TPSTW and 5 hours at STSTW) would be the same every day throughout the model simulation year.
Scenarios 5c and 5d (Year 2010)
4.5.21 Scenarios 5c and 5d are basically the same as Scenario 5a and 5b respectively except that the
modelling year was 2010 with a smaller projected baseflow from TPSTW and STSTW (Section 4.5.5). In addition, unlike Scenarios 5a and 5b, Scenarios 5c and 5d had taken into the account the effect of the storage tank at the Tai Po effluent pumping station as discussed in Section 4.5.18 above.
4.5.22 For Scenario 5c, the overflow would occur at STSTW only for 4 hours per day throughout the
model simulation year. It was assumed that the duration of overflow (4 hours at STSTW) would be the same every day throughout the model simulation year.
4.5.23 For Scenario 5d, overflow would occur at TPSTW only during wet days with discharge up to
4 hours per day. No overflow would occur at TPSTW during dry days. The overflow would occur for 2 hours per day at STSTW throughout the model simulation year. It was assumed that the duration of overflow at STSTW would be the same every day throughout the model simulation year.
Scenario 6a and 6b (Year 2016 Four-Week Maintenance Period)
4.5.24 Scenarios 6a and 6b simulate the potential impact during a four-week maintenance of THEES
tunnel in 2016 after Project commission. Fully treated sewage effluent from TPSTW and STSTW would all be discharged into Tolo Harbour via the emergency bypass of Sha Tin effluent pumping station under Scenario 6a and via the emergency bypasses of Tai Po effluent pumping station and Sha Tin effluent pumping station under Scenario 6b for four weeks. The maintenance period was assumed from 25 June to 22 July during which the estimated volume of effluent flow would be the highest. The loading conditions not during maintenance discharges would be the same as those adopted for Scenarios 5a and 5b respectively.
Scenario 7a and 7b (Year 2016 24-hour Emergency Discharge of Untreated effluent from TPSTW only)
4.5.25 Scenarios 7a and 7b simulate the potential impact of untreated effluent discharge from
TPSTW during a 24-hour emergency period after Project commission. These simulations are based on a worst-case assumption of 24-hour discharge. Based on the past record, emergency discharge of untreated effluent had occurred only once since 1995 due to CLP power supply

Agreement No CE 43/2001 (EP) Tai Po Sewage Treatment Works – Stage V Drainage Services Department Final EIA Report
MAUNSELL 4-22
failure to TPSTW Stage IV inlet works. The duration of the emergency discharge was less than 3 hours with a total discharge volume of less than 9,000 m3. For conservative assessment, it was also assumed in the modelling that the emergency condition would occur on the day with the highest effluent flow of the year. Untreated effluent would be discharged via the emergency bypass of TPSTW during the dry season on 1 March (Scenario 7a) and the wet season on 27 June (Scenario 7b). Under these scenarios, it was assumed that there would be no overflow from the Shatin effluent pumping station. The loading conditions not during emergency bypass would be the same as those adopted in Scenarios 5a and 5b respectively.
Hydrodynamic and Water Quality Model
4.5.26 The hydrodynamic and water quality models were developed by Delft Hydraulics, namely
Delft3D-FLOW (for hydrodynamic modelling) and Delft3D-WAQ (for water quality modelling).
4.5.27 Delft3D-FLOW is a 3-dimensional hydrodynamic simulation programme with applications
for coastal, river and estuarine areas. This model calculates non-steady flow and transport phenomena that result from tidal and meteorological forcing on a curvilinear, boundary fitted grid.
4.5.28 Delft3D-WAQ is a water quality model framework for numerical simulation of various
physical, biological and chemical processes in three dimensions. It solves the advection-diffusion-reaction equation for a predefined computational grid and for a wide range of model substances. The hydrodynamic simulation that drives the water quality model is generated from the simulation of Delft3D-FLOW model.
4.5.29 In this study, the Victoria Harbour (VH) Fine Grid Model was used for modelling discharges
during normal operation of both the Project and the THEES. Overflows and emergency discharge at Tolo Harbour were modelled by the Tolo Harbour and Mirs Bay (THMB) Fine Grid Model.
4.5.30 The original Victoria Harbour Model was developed for the Sha Tin Stage III Extension EIA
study under the contract CE 90/97. The model grids (Figure A4-1 in Appendix 4.2) were modified to take account of the existing coastline and the latest information on the planned reclamation layouts under Central Reclamation Phase III (CRIII), Wan Chai Development Phase II (WDII), South East Kowloon Development (SEKD), Yau Tong Bay Development (YTBD), etc. The years of 2003, 2010 (with only HATS Stage I commissioned) and 2016 (with all stages of HATS commissioned) were selected as the time horizons for existing (baseline) and operation phase hydrodynamic and water quality modelling. The coastline configurations in 2010 and 2016 adopted for modelling are shown in Figures 4.5 and 4.6a.
4.5.31 The THMB Model was developed for the EPD under Agreement No. WP01-277. The model
grids were modified to provide higher resolution near the overflow / emergency bypass outfalls and the nearby sensitive receivers (Figure A4-2 in Appendix 4.2). The coastline configuration of the Model was also updated, taking account of the layout of the reclamation at Pak Shek Kok. No further major reclamation within the Tolo Harbour and Channel is expected before 2016. The THMB Model was also refined using the dispersion array function of the water quality model to allow for spatial variation of vertical dispersion in the model. In general, the vertical dispersion of the model has been increased near the river mouths of

Agreement No CE 43/2001 (EP) Tai Po Sewage Treatment Works – Stage V Drainage Services Department Final EIA Report
MAUNSELL 4-23
Shing Mun River and Lam Tsuen River to 0.001 m2 s-1. The dispersion value gradually decreases to 5 x 10⁻⁶ m2 s-1 further away from the river mouths. These settings would enhance vertical mixing at shallow waters near the river mouths that would gradually diminish at deeper waters away from the river mouths. The performance of the refined THMB model has been checked against the EPD data collected at the TM stations and is considered acceptable for use in this EIA for model simulations.
4.5.32 While the boundary conditions of the Victoria Harbour Model were adopted from the Update
Model developed under Agreement No. CE 42/97(11), the boundary conditions of the THMB Model were obtained from the actual forcing of wind, rainfall and temperature. Monthly variations of river discharges, solar radiation, water temperature and wind velocity were incorporated into the models.
4.5.33 The transport of substances and associated water quality processes were incorporated in the
Delft3D-WAQ module. The model includes the physical / biochemical processes of suspended sediment, nutrients, phytoplankton and bacteria. Physical processes such as the exchange of oxygen with the atmosphere and the sedimentation of suspended substances, as well as biochemical processes such as nitrification, algal growth and decay and the decay of organic matter, are also modelled. The key hydrodynamic and water quality modelling parameters are shown in Table 4.10c below.
Table 4.10c Key Modelling Parameters
Parameter Description Velocity Velocity Water Level Water Level Salinity Salinity ModTemp Water Temperature E Coli E. coli Bacteria Oxy Oxygen CBOD5 Carbonaceous 5-day Biochemical Oxygen Demand NO3 Nitrate NH4 Ammonium PO4 Ortho-Phosphorus AAP Adsorbed Ortho-Phosphorus Si Silica Diat Diatoms Green Algae DetC Detritus Carbon DetN Detritus Nitrogen DetP Detritus Phosphorus DetSi Detritus Silica BOD5 5-day Biochemical Oxygen Demand Chlfa Chlorophyll a
(11) Hyder Consulting and CES in association with Delft Hydraulics (1999). Agreement No. CE 42/97, Update
on Cumulative Water Quality and Hydrological Effect of Coastal Developments and Upgrading of Assessment Tool. Report on Calibration and Verification of the Hydrodynamic Model (Final).

Agreement No CE 43/2001 (EP) Tai Po Sewage Treatment Works – Stage V Drainage Services Department Final EIA Report
MAUNSELL 4-24
Parameter Description SS Suspended Solids TotN Total Nitrogen TotP Total Phosphorus NH3 Unionised Ammonia **
** The UIA levels were calculated by the water quality model based on the temperature, salinity and pH characteristics of the water. The pH was entered into the model as a constant process parameter with the value 8.2. This value was derived from the Update Study (Agreement No. CE 42/97) based on previous measurements (EPD monitoring).
Background Pollution Loading Inventory
4.5.34 The years of assessment were 2003 (baseline scenario), 2010 (interim operation scenario) and
2016 (operation scenario). 4.5.35 For the existing baseline scenarios (1 and 4c), the 2003 pollution loading inventory presented
in the Technical Note on Flow and Load Inventory (December 2000) for the EIA of Comprehensive Feasibility Study for the Revised Scheme of South East Kowloon Development (Agreement No. CE 32/99) was adopted. For pollution load within Tolo Harbour and Mirs Bay, the loading inventory derived for the original THMB Model was adopted. Tables A4.1 and A4.2 in Appendix 4.1 show the pollution loading inventory for the Hong Kong SAR in 2003 dry and wet seasons, respectively.
4.5.36 According to the latest population forecast provided by the Planning Department, the
projected 2010 Hong Kong residential population (7,447,700) would be similar to the population forecasts of 2007 Scenario I (7,439,679) but smaller than 2007 Scenario II (7,853,130) adopted in the Update Study. To be consistent with the pollution loading inventory derived for 2016 operation scenario (Section 4.5.42), the pollution loading inventory of 2007 Scenario II was also adopted for the pollution loading inventory of the 2010 operation scenarios (including Scenarios 2a, 2b, 4b, 5c and 5d). The pollution loads and discharge locations were modified to take account of the latest reclamation plans and construction schedules of CRIII, WDII and SEKD. For pollution load within Tolo Harbour, the loading inventory derived for the original THMB Model was adopted. Tables A4.5 and A4.6 in Appendix 4.1 show the pollution loading inventory for the Hong Kong SAR in 2010 dry and wet seasons, respectively.
4.5.37 For the 2016 operation scenarios (including Scenarios 3a, 3b, 4a, 5a, 5b, 6a, 6b, 7a and 7b),
the 2016 pollution loading inventory presented in the Technical Note on Flow and Load Inventory (December 2000) for the EIA of Comprehensive Feasibility Study for the Revised Scheme of South East Kowloon Development (Agreement No. CE 32/99), which was slightly modified from 2012 Scenario II pollution inventory of the Update Study, was adopted for water quality modelling. To take into account of the implementation of HATS and its potential worst case impact upon Victoria Harbour, it was assumed that Option 5d of HATS proposed by the International Review Panel that includes the existing Stonecutters Island Sewage Treatment Works (SCISTW) and the planned sewage treatment works at Sandy Bay and North Point, would have been implemented by 2016. The flows and pollution loading of the treated effluent from these three treatment works are shown in Table 4.11.

Agreement No CE 43/2001 (EP) Tai Po Sewage Treatment Works – Stage V Drainage Services Department Final EIA Report
MAUNSELL 4-25
Table 4.11 Pollution Loading from Stonecutters, Sandy Bay and North Point Sewage Treatment Works under HATS (Option 5d)
Parameters Stonecutters Sandy Bay North Point
Flow (m3 per day) 2198052 132313 456926 BOD (g per day) 35168832 2117008 7310816 SS (g per day) 52753248 3175512 10966224 Organic Nitrogen (g per day) 5495130 330782.5 1142315 NH3-N (g per day) 4396104 264626 913852 E. coli (no. per day) 7.31303 x 10¹⁴ 4.40212 x 10¹³ 1.52022 x 10¹⁴ Copper (g per day) 14995 903 3117 Total Phosphorus (g per day) 4835714 291089 1005237 Ortho-Phosphate (g per day) 3978474 239487 827036 Silicate (g per day) 18022365 1084867 3746448 Total nitrite and nitrate (g per day) 50922602 3065315 10585674
4.5.38 Option 5d in Table 4.11 above assumed that the discharge from HATS would receive
secondary treatment with nitrification. As the HATS study is still on-going and the level of treatment is still being considered, an additional model run has been carried out to address the possible scenario of HATS with chemical enhanced primary treatment with disinfection. The model set-up, modelling results and detailed assessment for this additional scenario are given in Appendix 4.4a.
4.5.39 Similar to year 2003 and 2010, the loading inventory derived for the original THMB Model
was adopted for Tolo catchment for 2016 scenarios as a conservative approach. Tables A4.7 and A4.8 in Appendix 4.1 show the pollution loading inventory for Hong Kong SAR in 2016 dry and wet seasons, respectively.
4.5.40 It should be noted that the pollution loading inventories of 2003, 2010 and 2016 shown in
Appendix 4.1 do not include the pollution loadings of the TPSTW and STSTW, which are incorporated into the water quality model separately under various scenarios.
Uncertainties in Assessment Methodology
4.5.41 Quantitative uncertainties in the water quality modelling should be considered when making
an evaluation of modelling predictions. The worst case conditions were adopted as model input to indicate the maximum extent of the potential environmental impacts. The input data tended to be conservative to provide a margin of tolerance. Some examples of the conservative nature of the input parameters are given below:
• 95 percentiles (%iles) of the treated effluent pollution loadings incorporated in the operation phase water quality modelling are considered very conservative, given that 95 %iles of the pollution loads are about twice their mean values. Thus, the water quality impacts simulated under Scenarios 1, 2a, 2b, 3a, 3b, 5a, 5b, 5c, 5d, 6a and 6b were likely to be higher than the real situation that would happen.

Agreement No CE 43/2001 (EP) Tai Po Sewage Treatment Works – Stage V Drainage Services Department Final EIA Report
MAUNSELL 4-26
• Option 5d of the HATS was adopted in modelling the water quality impact in Victoria Harbour under Scenarios 3a and 3b. This option, which included a submarine outfall close to North Point (that is near the outfall of the reprovisioned Kai Tak Nullah), was chosen as a worst-case scenario to model the possible cumulative impact of the Project and HATS.
4.5.42 Uncertainty in modelling the oxygen profile of the inner Tolo Harbour and Sha Tin Hoi using
the original THMB Model was reported in a previous EPD study(12). The modified THMB Model that was adopted in the current study was adjusted with less stratification throughout the year to enhance the model performance in the inner Tolo Harbour and Sha Tin Hoi.
Possible Changes in Coastline Configuration in Victoria Harbour
4.5.43 As the reclamation limits for some planned coastal developments such as the SEKD, CRIII
and WDII are not yet confirmed and still subject to change at the time when this EIA is prepared, a sensitivity test was conducted under this Study to investigate the effect of possible changes in coastline configuration in Victoria Harbour on the overall conclusion of the water quality assessment. Modelling was undertaken for Scenario 3b (Table 4.8) using an alternate coastline configuration as shown in Figure 4.6b as a sensitivity test. The test results are attached in Appendix 4.4b.
Decommissioning of Wanchai West Outfall
4.5.44 The submarine outfall of Wanchai West sewage screening plant (WCW) has been decommissioned in 2003 and all flow originally discharged via the WCW would be diverted to that of Wan Chai East sewage screening plant (WCE). It is assumed in the model that the sewage flow from Wanchai would be distributed to both WCW and WCE for all the assessment years except 2016 after full commissioning of the HATS. It should be noted that the effects of such change in local distribution of flow amongst WCW and WCE should be localized and would unlikely affect the overall conclusion of the modelling results.
4.6 Identification of Environmental Impacts
Construction Phase
General Construction Activities
4.6.1 The general construction works would be primarily land-based but would have the potential
to cause water pollution. Various types of construction activities may generate wastewater. These include general cleaning and polishing, wheel washing, dust suppression and utility installation. These types of wastewater would contain high concentrations of suspended solids. Impacts could also result from the accumulation of solid and liquid waste such as packaging and construction materials, and sewage effluent from the construction work force involved with the construction. If uncontrolled, these could lead to deterioration in water quality. Increased nutrient level from contaminated discharges and sewage effluent could
(12) WL | Delft Hydraulics (2002). Agreement No. WP01-277, Provision of Service for Enhancement of the
Tolo Harbour & Mirs Bay Model, Final Report.

Agreement No CE 43/2001 (EP) Tai Po Sewage Treatment Works – Stage V Drainage Services Department Final EIA Report
MAUNSELL 4-27
also lead to a number of secondary water quality impacts including localised increase in ammonia and nitrogen concentrations that would stimulate algal growth.
Construction Site Runoff
4.6.2 During a rainstorm, site runoff generated would wash away the soil particles. The runoff is generally characterised by high concentrations of suspended solids. Release of uncontrolled site runoff would increase the SS levels and turbidity in the nearby water environment.
4.6.3 Wind blown dust would be generated from exposed soil surface in the works areas. It is
possible that wind blown dust would fall directly onto the nearby water bodies when a strong wind occurs. Dispersion of dust within the works areas may increase the SS levels in surface runoff causing a potential impact to the nearby sensitive receivers.
Accidental Spillage
4.6.4 There would be a large variety of chemicals to be used for carrying out construction activities. These may include surplus adhesives, spent paints, petroleum products, spent lubrication oil, grease and mineral oil, spent acid and alkaline solutions/solvent and other chemicals. Accidental spillage of chemicals in the works areas may contaminate the surface soils. The contaminated soil particles may be washed away by construction site runoff or storm runoff causing water pollution.
Operation Phase
4.6.5 After commissioning of the Project, more sewage would be received by the TPSTW. Thus,
the total pollution loading of the treated effluent would be increased. Potential impacts are listed in the first column of Table 4.9.
4.7 Prediction and Evaluation of Environmental Impacts
Construction Phase Water Quality Impact General Construction Activities
4.7.1 The effects on water quality from general construction activities are likely to be minimal,
provided that site drainage would be well maintained and good construction practices would be observed to ensure that litter, fuels, and solvents are managed, stored and handled properly.
4.7.2 Based on the Sewerage Manual, Part I, 1995 of the Drainage Services Department (DSD), the
sewage production rate for construction workers is estimated at 0.35 m3 per worker per day. For every 100 construction workers working simultaneously at the construction site, about 35 m3 of sewage would be generated per day. The sewage should not be allowed to discharge directly into the surrounding water body without treatment. Sufficient chemical toilets should be provided for workers. Existing toilets within the TPSTW could also be made available for use as necessary.

Agreement No CE 43/2001 (EP) Tai Po Sewage Treatment Works – Stage V Drainage Services Department Final EIA Report
MAUNSELL 4-28
Construction Runoff and Drainage
4.7.3 Construction run-off and drainage may cause local water quality impacts. Increase in SS arising from the construction site could block the drainage channels and may result in local flooding when heavy rainfall occurs. High concentrations of suspended degradable organic material in marine water could lead to reduction in DO levels in the water column.
4.7.4 It is important that proper site practice and good site management be followed to prevent run-
off with high level of SS from entering the surrounding waters. With the implementation of appropriate measures to control run-off and drainage from the construction site, disturbance of water bodies would be avoided and deterioration in water quality would be minimal. Thus, unacceptable impacts on the water quality are not expected, provided that the recommended measures described in Sections 4.8.1 to 4.8.9 and Appendix 4.3 are properly implemented.
Water Quality Impact under Normal Operation (Victoria Harbour)
4.7.5 For assessment of the potential impact on Victoria Harbour under normal operation of the
Project, the model results are presented as contour plots for DO, BOD5, UIA, TIN, E. coli, SS, sedimentation rate and salinity. All contour plots are presented as annual arithmetic averages except for the E.coli levels which are annual geometric means.
Scenario 1 (Year 2003 baseline)
4.7.6 The water quality simulation results of Scenario 1 are shown in Figures 1-1 to 1-10 in
Appendix 4.2. Tables 4.12 and 4.13 summarise the modelling results at identified water sensitive receivers. This scenario reflects the existing baseline condition for 2003.
4.7.7 Treated effluent from TPSTW and STSTW is transported to Kai Tak Nullah under THEES
and discharged into the embayed Kai Tak Nullah Approach Channel adjacent to the old airport runway. The model predicted non-compliance of the marine WQO for depth-averaged (DA) DO (4 mg/L), bottom DO (2 mg/L), TIN (0.4 mg/L) and NH3–N (0.021 mg/L) within Approach Channel and at Kwun Tong Typhoon Shelter, both of them have very weak tidal circulation and are subject to direct influence of the pollution discharges from Kai Tak Nullah (Figures 1-2, 1-3, 1-5 and 1-6). High levels of E. coli and SS were also predicted within the channel (Figures 1-7 and 1-8).
4.7.8 Non-compliance with WSD criteria for SS and E. coli was also predicted at Cheung Sha Wan
seawater intake (Table 4.13) which was essentially due to the pollutant discharge from nearby stormwater drains.
Scenarios 2a and 2b (Year 2010 “without” and “with” the Project respectively)
4.7.9 The water quality simulation results of Scenarios 2a and 2b are shown in Figures 2a1 to 2a10
and Figures 2b1 to 2b10 in Appendix 4.2. Tables 4.14 to 4.15 summarise the modelling results of Scenarios 2a and 2b at identified water sensitive receivers.
4.7.10 The modelling results of Scenarios 2a and 2b indicate that, after diversion of Kai Tak Nullah
outfall away from the Approach Channel to Kowloon Bay under the SEKD, water quality within Kwun Tong Typhoon Shelter would be greatly improved. Although non-compliance

Agreement No CE 43/2001 (EP) Tai Po Sewage Treatment Works – Stage V Drainage Services Department Final EIA Report
MAUNSELL 4-29
of WQO for TIN and NH3-N was predicted near the waterfront of Kowloon Bay (Figures 2a5, 2a6, 2b5 and 2b6), the patches of exceedances would be very localized and would not adversely affect the identified sensitive receivers. Full compliance with the marine WQO would be achieved at all identified sensitive receivers in 2010 (Table 4.14). However, the predicted SS and E. coli levels at Cheung Sha Wan seawater intake would marginally exceed the WSD criteria (Table 4.15) which was essentially due to the pollutant discharge from the nearby stormwater drains. The same levels of exceedances were predicted under both baseline (Scenario 2a) and operational phase (Scenario 2b).
4.7.11 The comparison between the modelling results of Scenario 2a (without the Project) and
Scenario 2b (with the Project) (Tables 4.14 and 4.15) indicated that there was no obvious difference in the extent of water quality impact between the scenarios. The Project would not contribute any WQO exceedance in 2010.

Agreement No CE 43/2001 (EP) Tai Po Sewage Treatment Works – Stage V Drainage Services Department Final EIA Report
MAUNSELL 4-30
Table 4.12 Predicted Water Quality at Indicator Points for Scenario 1 – Year 2003 (annual average)
DA DO (mg/L)
DA DO 10%tile (mg/L)
Bottom DO (mg/L)
Bottom DO 10%tile (mg/L)
DA TIN (mg/L)
DA UIA (mg/L)
DA SS (mg/L)
DA E. coli (no/100mL)
Marine Fish Culture Zone (Figure 4.8) Ma Wan 5.81 4.94 5.68 4.56 0.23 0.007 7.43 129 Tung Lung Chau 5.81 4.17 5.51 3.22 0.04 0.002 3.86 12 Gazetted Beach (Figure 4.8) Tung Wan 5.82 4.83 5.61 4.38 0.20 0.006 6.89 122 Ting Kau 5.77 4.85 5.66 4.57 0.23 0.007 6.92 291 Typhoon Shelter (Figure 4.8) Rambler Channel 5.67 4.90 5.44 4.50 0.26 0.010 7.06 4550 Yau Ma Tei 6.14 5.35 5.52 4.16 0.22 0.010 6.80 3700 To Kwa Wan 5.88 4.84 5.60 4.13 0.20 0.009 5.63 357 Kwun Tong 4.15 3.35 3.80 2.05 4.02 0.194 18.10 5750 Sam Ka Tsuen 6.03 5.00 5.73 4.23 0.13 0.005 5.03 916 Causeway Bay 6.04 5.34 5.86 4.89 0.17 0.008 5.70 5840 Sau Kei Wan 5.89 4.57 5.66 3.93 0.11 0.005 4.77 2280 EPD Monitoring Station (Figure 4.1) EM1 5.81 4.11 5.63 3.55 0.07 0.003 4.21 174 EM2 5.76 4.03 5.57 3.42 0.05 0.002 4.00 28 EM3 5.74 3.80 5.56 3.37 0.04 0.001 3.76 16 VM1 5.85 4.44 5.68 3.93 0.11 0.005 4.69 1260 VM2 5.87 4.60 5.71 4.09 0.13 0.006 4.87 866 VM4 5.85 4.66 5.68 4.13 0.15 0.007 5.15 4890 VM5 5.84 4.83 5.66 4.31 0.18 0.009 5.57 9250 VM6 5.82 4.85 5.61 4.25 0.19 0.009 5.69 7270 VM7 5.80 4.90 5.56 4.21 0.25 0.013 6.24 33200 VM8 5.77 4.84 5.57 4.38 0.21 0.009 5.92 1380 VM12 5.60 4.66 5.34 4.00 0.24 0.010 6.41 1830 VM13 5.57 4.68 5.37 4.25 0.25 0.009 6.84 2120 VM14 5.68 4.88 5.55 4.59 0.25 0.009 6.91 1920 VM15 5.82 4.95 5.53 4.19 0.21 0.010 5.93 3400 WM1 5.84 4.46 5.63 3.89 0.09 0.003 4.67 207 WM2 5.87 4.74 5.66 4.22 0.14 0.005 5.65 82 WM3 5.61 4.64 5.37 4.14 0.28 0.013 6.35 7990 WM4 5.71 4.64 5.61 4.40 0.21 0.007 6.79 306
Note: Numbers in bold indicated non-compliance of WQO.

Agreement No CE 43/2001 (EP) Tai Po Sewage Treatment Works – Stage V Drainage Services Department Final EIA Report
MAUNSELL 4-31
Table 4.13 Predicted Water Quality at Water Intakes for Scenario 1 – Year 2003 (annual average)
DA DO (mg/L)
DA DO 10%tile (mg/L)
DA TIN (mg/L)
DA UIA (mg/L)
DA SS (mg/L)
DA E. coli (no/100mL)
WSD Salt Water Intake (Figure 4.3) Tsuen Wan (26) 5.79 5.08 0.26 0.009 7.00 2000 Tsing Yi (27) 5.65 4.78 0.25 0.009 6.78 733 Cheung Sha Wan (28) 5.94 4.54 0.42 0.022 10.30 33400 Yau Ma Tei (19) 6.19 5.49 0.19 0.008 6.01 1700 Tai Wan (20) 6.08 5.21 0.16 0.007 5.29 434 Cha Kwo Ling (21) 6.13 5.21 0.19 0.008 5.24 592 Yau Tong (22) 5.85 4.38 0.09 0.004 4.47 236 Kennedy Town (15) 6.03 5.23 0.19 0.008 5.62 1440 Sheung Wan (14) 5.97 5.29 0.22 0.010 5.92 2290 Central Water Front (13) 5.98 5.30 0.21 0.010 5.87 1930 Wan Chai (12a) 6.05 5.39 0.18 0.008 5.66 5030 North Point (25) 6.04 5.09 0.13 0.006 5.10 1260 Quarry Bay (16) 6.00 4.87 0.11 0.005 4.89 773 Sai Wan Ho (17) 6.02 5.05 0.13 0.005 5.06 2030 Siu Sai Wan (18) 6.10 4.78 0.07 0.003 4.47 1200 Cooling Water Intake (Figure 4.3) Princes Building (11) 5.98 5.25 0.19 0.009 5.67 4830 HSBC Intake (10) 6.04 5.38 0.18 0.009 5.70 5310 Queensway Government Offices (9) 6.04 5.38 0.18 0.009 5.70 5310 DCS Zone 1 (23) 6.00 5.32 0.19 0.009 5.79 3740 Telecom House (7) (8) (6b) 6.00 5.32 0.19 0.009 5.79 3740 Great Eagle Centre (4) (5) (6a) 6.05 5.39 0.18 0.008 5.66 5030 Sun Hung Kai Centre (3) 6.26 5.60 0.22 0.012 6.35 21800 Windsor House (1) / Excelsior Hotel / World Trade Centre (2) 6.26 5.60 0.22 0.012 6.35 21800 Note: Numbers in bold indicated non-compliance of WSD standard.

Agreement No CE 43/2001 (EP) Tai Po Sewage Treatment Works – Stage V Drainage Services Department Final EIA Report
MAUNSELL 4-32
Table 4.14 Predicted Water Quality at Indicator Points for Scenario 2a (without the Project) and Scenario 2b (with the Project) in Year 2010 (annual average)
Indicator Point
Scenario DA DO (mg/L)
DA DO 10%tile (mg/L)
Bottom DO (mg/L)
Bottom DO 10%tile (mg/L)
DA TIN (mg/L)
DA UIA (mg/L)
DA SS (mg/L)
DA E. coli (no/100mL)
Fish Culture Zone (Figure 4.9) Ma Wan Without the Project (2a) 5.77 4.9 5.64 4.5 0.24 0.007 7.44 159 With the Project (2b) 5.77 4.79 5.64 4.5 0.24 0.007 7.44 159 Tung Lung Without the Project (2a) 5.82 4.21 5.51 3.23 0.05 0.002 3.91 16 With the Project (2b) 5.82 4.15 5.51 3.24 0.05 0.002 3.91 16 Gazetted Beach (Figure 4.9) Tung Wan Without the Project (2a) 5.85 4.94 5.58 4.41 0.21 0.007 6.75 167 With the Project (2b) 5.85 4.91 5.58 4.36 0.21 0.007 6.75 167 Ting Kau Without the Project (2a) 5.72 4.79 5.6 4.52 0.23 0.007 6.95 316 With the Project (2b) 5.72 4.76 5.6 4.51 0.23 0.007 6.95 316 Typhoon Shelter (Figure 4.9)
Without the Project (2a) 5.62 4.83 5.41 4.48 0.27 0.01 7.11 3650 Rambler Channel
With the Project (2b) 5.62 4.71 5.41 4.46 0.27 0.01 7.11 3650
Yau Ma Tei Without the Project (2a) 6.07 5.18 5.31 3.76 0.26 0.011 7.05 3270 With the Project (2b) 6.08 5.09 5.31 3.76 0.27 0.011 7.06 3270 Kwun Tong Without the Project (2a) 5.96 5.18 5.63 4.29 0.25 0.009 5.59 871 With the Project (2b) 5.96 5.15 5.63 4.29 0.25 0.009 5.59 872
Without the Project (2a) 5.94 4.87 5.65 4.11 0.14 0.005 4.95 990 Sam Ka Tsuen
With the Project (2b) 5.95 4.86 5.65 4.14 0.15 0.005 4.96 990
Without the Project (2a) 5.93 5.22 5.7 4.58 0.2 0.008 5.56 2660 Causeway Bay
With the Project (2b) 5.93 5.21 5.7 4.57 0.2 0.008 5.56 2660
Without the Project (2a) 5.83 4.5 5.61 3.91 0.14 0.006 4.8 2280 Sau Kei Wan With the Project (2b) 5.83 4.5 5.61 3.94 0.14 0.006 4.8 2290 Marina (Figure 4.9)
Without the Project (2a) 5.95 5.27 5.73 4.73 0.21 0.009 5.56 3170 Kellett Island With the Project (2b) 5.95 5.26 5.73 4.72 0.21 0.009 5.57 3170 EPD Monitoring Station (Figure 4.1)
Without the Project (2a) 5.77 4.07 5.6 3.52 0.08 0.003 4.22 195 EM1 With the Project (2b) 5.77 4.13 5.6 3.53 0.08 0.003 4.22 195 EM2 Without the Project (2a) 5.75 4 5.54 3.41 0.06 0.002 4.01 33 With the Project (2b) 5.75 4.05 5.54 3.44 0.06 0.002 4.01 33 EM3 Without the Project (2a) 5.74 3.81 5.56 3.36 0.04 0.001 3.76 21 With the Project (2b) 5.74 3.82 5.56 3.42 0.04 0.001 3.76 21
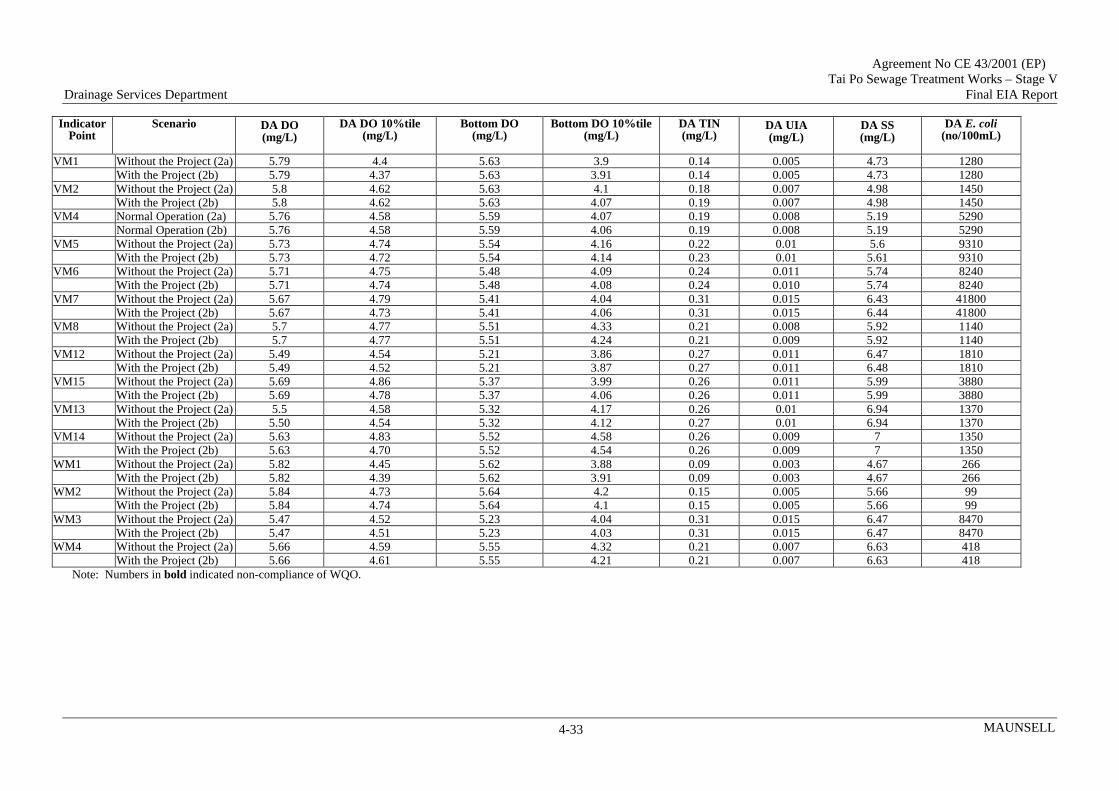
Agreement No CE 43/2001 (EP) Tai Po Sewage Treatment Works – Stage V Drainage Services Department Final EIA Report
MAUNSELL 4-33
Indicator Point
Scenario DA DO (mg/L)
DA DO 10%tile (mg/L)
Bottom DO (mg/L)
Bottom DO 10%tile (mg/L)
DA TIN (mg/L)
DA UIA (mg/L)
DA SS (mg/L)
DA E. coli (no/100mL)
VM1 Without the Project (2a) 5.79 4.4 5.63 3.9 0.14 0.005 4.73 1280 With the Project (2b) 5.79 4.37 5.63 3.91 0.14 0.005 4.73 1280 VM2 Without the Project (2a) 5.8 4.62 5.63 4.1 0.18 0.007 4.98 1450 With the Project (2b) 5.8 4.62 5.63 4.07 0.19 0.007 4.98 1450 VM4 Normal Operation (2a) 5.76 4.58 5.59 4.07 0.19 0.008 5.19 5290 Normal Operation (2b) 5.76 4.58 5.59 4.06 0.19 0.008 5.19 5290 VM5 Without the Project (2a) 5.73 4.74 5.54 4.16 0.22 0.01 5.6 9310 With the Project (2b) 5.73 4.72 5.54 4.14 0.23 0.01 5.61 9310 VM6 Without the Project (2a) 5.71 4.75 5.48 4.09 0.24 0.011 5.74 8240 With the Project (2b) 5.71 4.74 5.48 4.08 0.24 0.010 5.74 8240 VM7 Without the Project (2a) 5.67 4.79 5.41 4.04 0.31 0.015 6.43 41800 With the Project (2b) 5.67 4.73 5.41 4.06 0.31 0.015 6.44 41800 VM8 Without the Project (2a) 5.7 4.77 5.51 4.33 0.21 0.008 5.92 1140 With the Project (2b) 5.7 4.77 5.51 4.24 0.21 0.009 5.92 1140 VM12 Without the Project (2a) 5.49 4.54 5.21 3.86 0.27 0.011 6.47 1810 With the Project (2b) 5.49 4.52 5.21 3.87 0.27 0.011 6.48 1810 VM15 Without the Project (2a) 5.69 4.86 5.37 3.99 0.26 0.011 5.99 3880 With the Project (2b) 5.69 4.78 5.37 4.06 0.26 0.011 5.99 3880 VM13 Without the Project (2a) 5.5 4.58 5.32 4.17 0.26 0.01 6.94 1370 With the Project (2b) 5.50 4.54 5.32 4.12 0.27 0.01 6.94 1370 VM14 Without the Project (2a) 5.63 4.83 5.52 4.58 0.26 0.009 7 1350 With the Project (2b) 5.63 4.70 5.52 4.54 0.26 0.009 7 1350 WM1 Without the Project (2a) 5.82 4.45 5.62 3.88 0.09 0.003 4.67 266 With the Project (2b) 5.82 4.39 5.62 3.91 0.09 0.003 4.67 266 WM2 Without the Project (2a) 5.84 4.73 5.64 4.2 0.15 0.005 5.66 99 With the Project (2b) 5.84 4.74 5.64 4.1 0.15 0.005 5.66 99 WM3 Without the Project (2a) 5.47 4.52 5.23 4.04 0.31 0.015 6.47 8470 With the Project (2b) 5.47 4.51 5.23 4.03 0.31 0.015 6.47 8470 WM4 Without the Project (2a) 5.66 4.59 5.55 4.32 0.21 0.007 6.63 418 With the Project (2b) 5.66 4.61 5.55 4.21 0.21 0.007 6.63 418
Note: Numbers in bold indicated non-compliance of WQO.

Agreement No CE 43/2001 (EP) Tai Po Sewage Treatment Works – Stage V Drainage Services Department Final EIA Report
MAUNSELL 4-34
Table 4.15 Predicted Water Quality at Water Intakes for Scenario 2a (without the Project) and Scenario 2b (with the Project) in Year 2010 (annual average)
Indicator Point Scenario DA DO (mg/L)
DA DO 10%tile (mg/L)
DA TIN (mg/L)
DA UIA (mg/L)
DA SS (mg/L)
DA E. coli (no/100mL)
WSD Salt Water Intake (Figure 4.3) Tsuen Wan (26) Without the Project (2a) 5.74 5.02 0.26 0.009 7.07 1640 With the Project (2b) 5.74 4.81 0.26 0.009 7.08 1640 Tsing Yi (27) Without the Project (2a) 5.64 4.85 0.26 0.009 6.86 1160 With the Project (2b) 5.64 4.71 0.26 0.009 6.86 1160 Cheung Sha Wan (28) Without the Project (2a) 5.94 4.53 0.47 0.024 10.2 29700 With the Project (2b) 5.94 4.53 0.47 0.024 10.2 29700 Yau Ma Tei (19) Without the Project (2a) 6.25 5.42 0.24 0.01 6.44 1470 With the Project (2b) 6.26 5.40 0.24 0.01 6.44 1470 Tai Wan (20) Without the Project (2a) 5.9 4.99 0.29 0.011 5.44 1530 With the Project (2b) 5.9 4.97 0.29 0.011 5.44 1530 Cha Kwo Ling (21) Without the Project (2a) 6.14 5.32 0.16 0.006 5.00 518 With the Project (2b) 6.14 5.28 0.16 0.006 5.00 518 Yau Tong (22) Without the Project (2a) 6.04 5.13 0.15 0.006 4.91 1140 With the Project (2b) 6.04 5.09 0.15 0.006 4.92 1140 Kennedy Town (15) Without the Project (2a) 5.88 5.14 0.22 0.009 5.77 1320 With the Project (2b) 5.89 5.03 0.22 0.009 5.78 1320 Sheung Wan (14) Without the Project (2a) 5.86 5.16 0.25 0.011 5.88 3330 With the Project (2b) 5.86 5.03 0.25 0.011 5.88 3340 Central Water Front (13) Without the Project (2a) 5.86 5.15 0.25 0.011 5.91 2520 With the Project (2b) 5.86 5.22 0.25 0.011 5.91 2520 Wan Chai (12a) Without the Project (2a) 5.97 5.27 0.21 0.009 5.59 5360 With the Project (2b) 5.97 5.25 0.21 0.009 5.59 5360 North Point (25) Without the Project (2a) 5.96 4.95 0.16 0.006 5.11 1180 With the Project (2b) 5.96 4.95 0.16 0.006 5.11 1180 Quarry Bay (16) Without the Project (2a) 5.95 4.96 0.16 0.006 5.07 1910 With the Project (2b) 5.95 4.96 0.16 0.006 5.07 1910 Sai Wan Ho (17) Without the Project (2a) 5.94 4.81 0.15 0.006 4.95 1230 With the Project (2b) 5.94 4.84 0.15 0.006 4.95 1230 Siu Sai Wan (18) Without the Project (2a) 6.08 4.73 0.08 0.003 4.49 1350 With the Project (2b) 6.08 4.72 0.08 0.003 4.49 1350 Cooling Water Intake (Figure 4.3) Princes Building (11) Without the Project (2a) 5.91 5.18 0.23 0.01 5.72 4600 With the Project (2b) 5.91 5.13 0.23 0.01 5.72 4600

Agreement No CE 43/2001 (EP) Tai Po Sewage Treatment Works – Stage V Drainage Services Department Final EIA Report
MAUNSELL 4-35
Indicator Point Scenario DA DO (mg/L)
DA DO 10%tile (mg/L)
DA TIN (mg/L)
DA UIA (mg/L)
DA SS (mg/L)
DA E. coli (no/100mL)
HSBC Intake (10) Without the Project (2a) 5.93 5.23 0.23 0.01 5.77 4570 With the Project (2b) 5.93 5.20 0.23 0.01 5.78 4570
Without the Project (2a) 5.93 5.23 0.23 0.01 5.74 6000 Queensway Government Offices (9) With the Project (2b) 5.93 5.21 0.23 0.01 5.74 6000 DCS Zone 1 (23) Without the Project (2a) 5.93 5.23 0.23 0.01 5.74 6000 With the Project (2b) 5.93 5.21 0.23 0.01 5.74 6000 Telecom House (7) (8) (6b) Without the Project (2a) 5.95 5.27 0.23 0.01 5.7 5160 With the Project (2b) 5.96 5.26 0.23 0.01 5.7 5160
Without the Project (2a) 5.92 5.20 0.22 0.009 5.64 6390 Great Eagle Centre (4) (5) (6a) With the Project (2b) 5.92 5.16 0.22 0.009 5.65 6390 Sun Hung Kai Centre (3) Without the Project (2a) 5.94 5.24 0.22 0.009 5.63 4700 With the Project (2b) 5.95 5.24 0.22 0.009 5.63 4700
Without the Project (2a) 6.16 5.49 0.20 0.008 5.56 2400 Windsor House (1) / Excelsior Hotel / World Trade Centre (2) With the Project (2b) 6.16 5.38 0.20 0.008 5.56 2400
Without the Project (2a) 6.01 5.34 0.22 0.009 5.68 9120 DCS Zone 4 (24) With the Project (2b) 6.01 5.28 0.22 0.009 5.68 9120
Note: Numbers in bold indicated non-compliance of WQO.

Agreement No CE 43/2001 (EP) Tai Po Sewage Treatment Works – Stage V Drainage Services Department Final EIA Report
MAUNSELL 4-36
Scenarios 3a and 3b (Year 2016 “without” and “with” the Project respectively) 4.7.12 The water quality simulation results of Scenarios 3a and 3b are shown in Figures 3a1 to 3a10
and Figures 3b1 to 3b11 in Appendix 4.2. Tables 4.16 to 4.17 summarise the modelling results of Scenarios 3a and 3b at identified water sensitive receivers.
4.7.13 The modelling results of Scenario 2 and Scenario 3 are similar. Non-compliance of WQO for
TIN and NH3-N was predicted near the waterfront of Kowloon Bay in 2016 (Figures 3a5, 3a6, 3b5 and 3b6) but the patches of exceedances would be very localized. Full compliance with the marine WQO would be achieved at all identified sensitive receivers except that the TIN level marginally exceeded the WQO of 0.4 mg/L at the new Marina of SEKD where is a semi-enclosed water body with low flushing capacity (Table 4.16). The predicted SS and E. coli levels at Cheung Sha Wan seawater intake would also marginally exceed the WSD criteria (Table 4.17) which was essentially due to the pollutant discharge from the nearby stormwater drains. The same levels of exceedances were predicted under both baseline (Scenario 3a) and operational phase (Scenario 3b).
4.7.14 The comparison between the modelling results of Scenario 3a (without the Project) and
Scenario 3b (with the Project) (Tables 4.16 and 4.17) indicated that there was no obvious difference in the extent of water quality impact between the scenarios. The model predicted that the Project would not contribute any WQO exceedances in 2016.

Agreement No CE 43/2001 (EP) Tai Po Sewage Treatment Works – Stage V Drainage Services Department Final EIA Report
MAUNSELL
4-37
Table 4.16 Predicted Water Quality at Indicator Points for Scenario 3a (without the Project) and Scenario 3b (with the Project) in Year 2016 (annual average)
Indicator Point
Scenario DA DO (mg/L)
DA DO 10%tile (mg/L)
Bottom DO (mg/L)
Bottom DO 10%tile (mg/L)
DA TIN (mg/L)
DA UIA (mg/L)
DA SS (mg/L)
DA E. coli (no/100mL)
Fish Culture Zone (Figure 4.10) Ma Wan Without the Project (3a) 5.86 4.97 5.74 4.6 0.25 0.006 7.39 44 With the Project (3b) 5.86 4.97 5.74 4.6 0.25 0.006 7.39 44 Tung Lung Without the Project (3a) 5.88 4.37 5.54 3.32 0.05 0.002 3.88 9 With the Project (3b) 5.88 4.37 5.54 3.32 0.05 0.002 3.89 9 Gazetted Beach (Figure 4.10) Tung Wan Without the Project (3a) 6.02 5.06 5.76 4.54 0.24 0.005 6.66 12 With the Project (3b) 6.02 5.06 5.76 4.54 0.24 0.005 6.66 12 Ting Kau Without the Project (3a) 5.86 4.9 5.76 4.63 0.25 0.006 6.86 100 With the Project (3b) 5.86 4.9 5.76 4.63 0.25 0.006 6.86 100 Typhoon Shelter (Figure 4.10)
Without the Project (3a) 5.92 5.07 5.74 4.74 0.29 0.007 6.93 3680 Rambler Channel
With the Project (3b) 5.92 5.07 5.74 4.74 0.29 0.007 6.93 3680
Yau Ma Tei Without the Project (3a) 6.67 5.81 5.94 4.4 0.29 0.007 6.67 3180 With the Project (3b) 6.67 5.81 5.93 4.4 0.29 0.007 6.69 3180 Kwun Tong Without the Project (3a) 6.13 5.27 5.83 4.49 0.28 0.007 5.19 938 With the Project (3b) 6.13 5.27 5.83 4.49 0.29 0.008 5.22 927 Sam Ka Tsuen Without the Project (3a) 6.21 5.26 5.89 4.44 0.16 0.004 4.8 819 With the Project (3b) 6.21 5.26 5.88 4.44 0.17 0.004 4.82 818 Causeway Bay Without the Project (3a) 6.37 5.77 6.13 5.15 0.24 0.005 5.2 978 With the Project (3b) 6.37 5.77 6.13 5.15 0.25 0.005 5.21 977 Sau Kei Wan Without the Project (3a) 6.1 4.93 5.85 4.25 0.17 0.004 4.62 1330 With the Project (3b) 6.1 4.93 5.85 4.25 0.17 0.004 4.63 1330 Marina (Figure 4.10)
Without the Project (3a) 6.4 5.8 6.18 5.32 0.25 0.005 5.18 1110 Kellett Island Marina With the Project (3b) 6.4 5.79 6.18 5.33 0.25 0.005 5.19 1110
Without the Project (3a) 6.12 5.27 5.91 4.67 0.41 0.012 5.42 9370 Marina at SEKD With the Project (3b) 6.11 5.27 5.9 4.67 0.43 0.013 5.46 9280
EPD Monitoring Station (Figure 4.1)
Without the Project (3a) 5.91 4.3 5.69 3.63 0.1 0.002 4.14 71 EM1
With the Project (3b) 5.91 4.3 5.69 3.63 0.1 0.002 4.14 71 EM2 Without the Project (3a) 5.83 4.18 5.59 3.5 0.07 0.002 3.96 12

Agreement No CE 43/2001 (EP) Tai Po Sewage Treatment Works – Stage V Drainage Services Department Final EIA Report
MAUNSELL
4-38
Indicator Point
Scenario DA DO (mg/L)
DA DO 10%tile (mg/L)
Bottom DO (mg/L)
Bottom DO 10%tile (mg/L)
DA TIN (mg/L)
DA UIA (mg/L)
DA SS (mg/L)
DA E. coli (no/100mL)
With the Project (3b) 5.83 4.19 5.59 3.5 0.07 0.002 3.97 12 EM3 Without the Project (3a) 5.78 3.91 5.57 3.39 0.05 0.001 3.74 13 With the Project (3b) 5.78 3.91 5.57 3.39 0.05 0.001 3.74 13 VM1 Without the Project (3a) 6.04 4.79 5.84 4.18 0.17 0.004 4.54 289 With the Project (3b) 6.04 4.79 5.84 4.18 0.18 0.004 4.55 288 VM2 Without the Project (3a) 6.09 5.06 5.89 4.43 0.21 0.005 4.78 319 With the Project (3b) 6.09 5.06 5.89 4.43 0.22 0.005 4.8 314 VM4 Without the Project (3a) 6.1 5.08 5.9 4.45 0.24 0.005 4.87 424 With the Project (3b) 6.1 5.08 5.9 4.46 0.24 0.005 4.89 422 VM5 Without the Project (3a) 6.17 5.33 5.96 4.68 0.26 0.005 5.11 563 With the Project (3b) 6.16 5.33 5.96 4.68 0.27 0.005 5.13 562 VM6 Without the Project (3a) 6.17 5.36 5.94 4.64 0.27 0.005 5.23 420 With the Project (3b) 6.17 5.36 5.94 4.64 0.28 0.005 5.24 419 VM7 Without the Project (3a) 6.18 5.37 5.93 4.64 0.29 0.005 5.35 398 With the Project (3b) 6.18 5.37 5.93 4.64 0.3 0.005 5.36 397 VM8 Without the Project (3a) 6.03 4.98 5.84 4.55 0.27 0.004 5.68 37 With the Project (3b) 6.03 4.98 5.84 4.55 0.27 0.005 5.68 37 VM12 Without the Project (3a) 6.02 5.05 5.82 4.5 0.31 0.006 6.04 249 With the Project (3b) 6.02 5.05 5.81 4.5 0.31 0.006 6.05 249 VM15 Without the Project (3a) 6.24 5.48 5.93 4.65 0.29 0.005 5.48 167 With the Project (3b) 6.24 5.48 5.93 4.65 0.3 0.005 5.49 166 VM13 Without the Project (3a) 5.85 4.85 5.73 4.58 0.29 0.006 6.7 1160 With the Project (3b) 5.85 4.85 5.73 4.58 0.29 0.006 6.71 1160 VM14 Without the Project (3a) 5.89 5.02 5.81 4.8 0.28 0.006 6.83 1260 With the Project (3b) 5.89 5.02 5.81 4.8 0.28 0.006 6.84 1260 WM1 Without the Project (3a) 5.91 4.51 5.68 3.9 0.09 0.002 4.6 13 With the Project (3b) 5.91 4.51 5.68 3.9 0.09 0.002 4.6 13 WM2 Without the Project (3a) 5.98 4.81 5.76 4.27 0.17 0.004 5.57 8 With the Project (3b) 5.98 4.81 5.76 4.27 0.17 0.004 5.58 8 WM3 Without the Project (3a) 5.99 4.97 5.76 4.42 0.42 0.006 6.04 116 With the Project (3b) 5.99 4.97 5.76 4.42 0.43 0.006 6.05 116 WM4 Without the Project (3a) 5.83 4.71 5.73 4.45 0.24 0.005 6.52 29 With the Project (3b) 5.83 4.71 5.73 4.45 0.24 0.005 6.52 29
Note: Numbers in bold indicated non-compliance of WQO.

Agreement No CE 43/2001 (EP) Tai Po Sewage Treatment Works – Stage V Drainage Services Department Final EIA Report
MAUNSELL
4-39
Table 4.17 Predicted Water Quality at Water Intakes for Scenario 3a (without the Project) and Scenario 3b (with the Project) in Year 2016 (annual average)
Indicator Point Scenario DA DO (mg/L)
DA DO 10 %tile (mg/L)
DA TIN (mg/L)
DA UIA (mg/L)
DA SS (mg/L)
DA E. coli (no/100mL)
WSD Salt Water Intake (Figure 4.3)
Tsuen Wan (26) Without the Project (3a) 5.96 5.2 0.28 0.007 6.95 1570 With the Project (3b) 5.96 5.2 0.28 0.007 6.95 1570
Tsing Yi (27) Without the Project (3a) 5.95 5.05 0.28 0.006 6.66 953 With the Project (3b) 5.94 5.05 0.28 0.006 6.67 953
Cheung Sha Wan (28) Without the Project (3a) 6.41 4.93 0.5 0.021 10.5 31200 With the Project (3b) 6.41 4.93 0.51 0.021 10.5 31200
Yau Ma Tei (19) Without the Project (3a) 6.67 5.91 0.27 0.005 5.7 554 With the Project (3b) 6.67 5.91 0.27 0.005 5.71 554
Tai Wan (20) Without the Project (3a) 6.31 5.6 0.29 0.007 5.16 559 With the Project (3b) 6.3 5.6 0.31 0.007 5.19 553
Cha Kwo Ling (21) Without the Project (3a) 6.43 5.67 0.18 0.004 4.85 235 With the Project (3b) 6.43 5.68 0.18 0.004 4.86 234
Yau Tong (22) Without the Project (3a) 6.31 5.49 0.17 0.004 4.76 534 With the Project (3b) 6.31 5.49 0.18 0.004 4.77 533
Kennedy Town (15) Without the Project (3a) 6.24 5.35 0.28 0.004 5.52 275 With the Project (3b) 6.24 5.35 0.28 0.004 5.52 275
Sheung Wan (14) Without the Project (3a) 6.36 5.7 0.3 0.005 5.43 201 With the Project (3b) 6.36 5.7 0.31 0.005 5.44 201
Central Water Front (13) Without the Project (3a) 6.38 5.68 0.3 0.005 5.46 366 With the Project (3b) 6.37 5.68 0.31 0.005 5.48 366
Wan Chai (12b) Without the Project (3a) 6.4 5.79 0.25 0.005 5.19 1150 With the Project (3b) 6.4 5.78 0.26 0.005 5.2 1150
North Point (25) Without the Project (3a) 6.29 5.48 0.2 0.004 4.87 723 With the Project (3b) 6.29 5.48 0.2 0.004 4.88 723
Quarry Bay (16) Without the Project (3a) 6.27 5.49 0.19 0.004 4.83 850 With the Project (3b) 6.27 5.49 0.2 0.004 4.85 850
Sai Wan Ho (17) Without the Project (3a) 6.23 5.31 0.18 0.004 4.74 684 With the Project (3b) 6.23 5.31 0.18 0.004 4.75 684
Siu Sai Wan (18) Without the Project (3a) 6.25 5.13 0.1 0.003 4.41 1240 With the Project (3b) 6.25 5.14 0.1 0.003 4.41 1240

Agreement No CE 43/2001 (EP) Tai Po Sewage Treatment Works – Stage V Drainage Services Department Final EIA Report
MAUNSELL
4-40
Indicator Point Scenario DA DO (mg/L)
DA DO 10 %tile (mg/L)
DA TIN (mg/L)
DA UIA (mg/L)
DA SS (mg/L)
DA E. coli (no/100mL)
Cooling Water Intake (Figure 4.3)
Princes Building (11) Without the Project (3a) 6.38 5.75 0.27 0.005 5.28 436 With the Project (3b) 6.38 5.74 0.28 0.005 5.3 435
HSBC Intake (10) Without the Project (3a) 6.41 5.78 0.27 0.005 5.35 2010 With the Project (3b) 6.41 5.77 0.28 0.005 5.36 2010
Without the Project (3a) 6.4 5.78 0.27 0.005 5.3 1520 Queensway Government Offices (9) With the Project (3b) 6.4 5.77 0.28 0.005 5.32 1510
DCS Zone 1 (23) Without the Project (3a) 6.4 5.78 0.27 0.005 5.3 1520 With the Project (3b) 6.4 5.77 0.28 0.005 5.32 1510
Telecom House (7) (8) (6b) Without the Project (3a) 6.43 5.79 0.27 0.005 5.27 1160 With the Project (3b) 6.43 5.79 0.27 0.005 5.29 1160
Without the Project (3a) 6.37 5.76 0.26 0.005 5.22 967 Great Eagle Centre (4) (5) (6a) With the Project (3b) 6.37 5.76 0.27 0.005 5.23 964
Without the Project (3a) 6.6 5.93 0.24 0.004 5.2 1130 Windsor House (1) / Excelsior Hotel / World Trade Centre (2) With the Project (3b) 6.6 5.92 0.25 0.004 5.22 1130
Without the Project (3a) 6.42 5.81 0.26 0.006 5.31 6280 DCS Zone 4 (24) With the Project (3b) 6.42 5.81 0.26 0.006 5.32 6280
Without the Project (3a) 6.24 5.51 0.56 0.016 5.85 1770 Intake at SEKD With the Project (3b) 6.23 5.5 0.59 0.017 5.92 1700
Note: Numbers in bold indicated non-compliance of WQO.
Agreement No CE 43/2001 (EP)
Tai Po Sewage Treatment Works – Stage V Drainage Services Department Final EIA Report
MAUNSELL 4-41
Water Quality Impact under Normal Operation (Tolo Harbour) 4.7.15 For assessment of the potential impact on Tolo Harbour under normal operation of the Project,
the model results are presented as contour plots for DO, BOD5, UIA, TIN, E. coli, SS, sedimentation rate, chlorophyll-a and salinity. All contour plots are presented as annual arithmetic averages except for the E. coli levels which are annual geometric means. The model results at different sensitive receivers are also summarized in Tables 4.18 and 4.19. The results provided in Table 4.18 are annual average except for the minimum DO (which is the lowest value predicted over the simulation year) and maximum surface 5-day running average chlorophyll-a (which is the peak value predicted in the surface layer over the simulation year). The data shown in Table 4.19 are the results predicted in the middle water layer where the seawater intake points are located. Scenarios 4a, 4b and 4c (Baseline, year 2016, 2010 and 2003 respectively)
4.7.16 The water quality simulation results of Scenarios 4a, 4b and 4c are shown in Figures 4a1 to
4a11, 4b1 to 4b11 and 4c1 to 4c11 in Appendix 4.2. These scenarios reflected the baseline conditions with no sewage effluent discharge from TPSTW and STSTW in 2016, 2010 and 2003, respectively.
4.7.17 The modelling results for Scenarios 4a, 4b and 4c are very similar. In contrast to the EPD
monitoring data, the model tended to overestimate surface DO and underestimate bottom DO concentrations within the inner Tolo Harbour, Sha Tin Hoi and Shing Mun River in certain periods of time, and the reason was not fully understood(13). The model has already been adjusted with less stratification throughout the year to enhance the model performance in the inner Tolo Harbour and Sha Tin Hoi (refer to Section 4.5.31). When undertaking assessment of the DO impacts from the Project, we have focused on the relative differences between the baseline scenario and the operational scenario without any direct interpretation of the absolute values. Based on this assessment method, the model results for DO are considered acceptable for use in the assessment.
4.7.18 Non-compliance with E. coli standard was predicted at close proximity of local outfalls
(Figures 4a7, 4b7 and 4c7). In addition, non-compliance with the chlorophyll-a standard was predicted at all the identified sensitive receivers within the Tolo Harbour (Table 4.18).
Scenarios 5a and 5b (Year 2016 after commissioning of the Project)
4.7.19 These scenarios reflect the water quality impacts due to overflow discharges in 2016. 4.7.20 The contour plots (Figures 5a1 to 5a11 and 5b1 to 5b11 in Appendix 4.2) showed that, in
contrast to baseline Scenario 4a, higher levels of BOD5, TIN, NH3-N, SS, chlorophyll-a and lower levels of DO are predicted in the inner Tolo Harbour and Sha Tin Hoi under Scenario 5a (with overflow discharged at Sha Tin) and Scenario 5b (with overflow discharged at both Tai Po and Sha Tin). When comparing the contour plots between Scenarios 5a and 5b, Scenario 5b appeared to introduce similar extent of water quality impact at Sha Tin Hoi as
(13) WL | Delft Hydraulics (2002). Agreement No. WP01-277, Provision of Service for Enhancement of the
Tolo Harbour & Mirs Bay Model, Final Report.

Agreement No CE 43/2001 (EP)
Tai Po Sewage Treatment Works – Stage V Drainage Services Department Final EIA Report
MAUNSELL 4-42
Scenario 5a, but larger extent of impact at the inner Tolo Harbour near the mouth of Lam Tsuen River. This is reasonable as Scenario 5a assumed that there would be upgrading of the Tai Po effluent pumping station which resulted in a relatively smaller amount of overall pollution load being introduced into the model. The water quality was however not sensitive to the increase in the E.coli loading, as reflected by the contour plots, there is no obvious difference amongst Scenarios 4a, 5a and 5b in terms of the E.coli levels within the Tolo Harbour (Figures 4a7, 5a7 and 5b7).
4.7.21 Figures 5a13 to 5a14 and 5b13 to 5b14 compare the time series of 5-day running average
for surface chlorophyll-a between Scenarios 4 (baseline) and 5 (operational phase) at the EPD stations. These time series plots indicated that the chlorophyll-a levels at all the EPD stations would occasionally exceed the WQO in 2016 under both Scenarios 4 and 5. The plots also showed that the Project would introduce a greater extent of exceedances as compared to the baseline level. When comparing Scenarios 5a and 5b, Scenario 5b would cause a larger degree of impact at Station TM3 which is closest to the overflow bypass at TPSTW. The degree of impacts on chlorophyll-a levels is similar between Scenarios 5a and 5b for the rest of the EPD stations.
Scenarios 5c and 5d (Year 2010 after commissioning of the Phase 1 works of the Project)
4.7.22 These scenarios reflect the water quality impact at an intermediate stage after commissioning
of the Phase 1 works in 2010. 4.7.23 In general, as a significantly smaller amount of treated effluent would be discharged under
Scenarios 5c and 5d as compared to Scenarios 5a and 5b respectively, the Project would introduce a much smaller extent of water quality impact in 2010. The water quality modelling results (Figures 5c1 to 5c11 and 5d1 to 5d11 in Appendix 4.2) for both Scenarios 5c and 5d were similar to the baseline condition for 2010 (Scenario 4b, Figures 4b1 to 4b11).
Summary of WQO Exceedances
4.7.24 Tables 4.18 to 4.19 compare the modelling results at identified sensitive receivers between
Scenarios 4 and 5. 4.7.25 It can be seen from the tables that the chlorophyll-a levels breached the WQO at most of the
identified sensitive receivers under both Scenarios 4 (baseline) and 5 (operational phase). Although the Project did not introduce any new exceedances (the same number of exceedances were also predicted under the baseline conditions), the Project would cause a greater extent of impact on the sensitive receivers as illustrated in Figures 5a13 to 5a14 and Figures 5b13 to 5b14. In comparison with the baseline levels, the increases in chlorophyll-a caused by the Project in 2016 are considered significant at the indicator points (ranging from <1% to 84%). The largest difference of 84% was found at TM3 (inner Tolo Harbour) with an absolute difference of 20 µg/L. It is recognized that as remarked in Table 4.8, the baseline models have ignored the impacts due to continuing diffuse pollution if the Project is not proceeded with. Nevertheless, to cope with the potential impact of effluent from TPSTW (and STSTW) into Tolo Harbour due to overflow discharges during normal operation of the TPSTW, upgrading of the Tai Po effluent pumping station and the Shatin effluent pumping station and the associated facilities is recommended. The upgrading of the Tai Po effluent

Agreement No CE 43/2001 (EP)
Tai Po Sewage Treatment Works – Stage V Drainage Services Department Final EIA Report
MAUNSELL 4-43
pumping station and Sha Tin effluent pumping stations have been considered in a previous consultancy study "Review of North District and Tolo Harbour Sewerage Master Plan Study" conducted by EPD. The Government will be implementing these two upgrading works on a step-by-step basis, taking into account their individual implementation priority and urgency. In fact, they together with this Project (ie. Tai Po sewage treatment works Stage V) and the Stage III upgrading of the Shatin sewage treatment works form a coherent plan, and the STSTW project is already close to completion. Currently, a Category C item in the Public Works Programme (PWP) has been created for the upgrading of the Shatin effluent pumping station and fund bidding in the annual Resources Allocation Exercise is being proceeded with. As for the Tai Po effluent pumping station, EPD has already prepared and submitted for approval a Project Definition Statement for project inception into the PWP. Under the normal procedure, it can subsequently be enlisted as a Category C project for further processing and implementation. The impact for 2010 was to a much lesser extent with the largest increase of about 20% predicted at FC2 and an absolute difference of only 5 µg/L.
4.7.26 The bottom DO levels exceeded the WQO at most of the indicator points (Table 4.18). It is
however important to note that the low levels of bottom DO were likely due to the uncertainties in model performance as discussed in Sections 4.5.42 and 4.7.17. Similar to the extent of chlorophyll-a impact, the Project would cause significant reduction of bottom DO levels at a few sensitive receivers in 2016 but much less so in 2010.
4.7.27 The E.coli levels exceeded the WQO at three indicator points (M3, M6 and MM1). However,
the same degree of exceedances was also predicted at these three stations under the baseline conditions (see Table 4.18). It can be concluded that the Project would introduce minimal E.coli impact for both 2010 and 2016.
4.7.28 The Project would not cause exceedance of the WSD criteria for SS of 10mg/L at the Tai Po
seawater intake in 2010 but there will be a slight exceedance in 2016. The predicted SS level at this intake point was 11.6 mg/L as compared to the corresponding baseline value of 7.58 mg/L (Table 4.19). It should be noted that the 95%ile of the SS discharge standard (30 mg/L) used to calculate the SS loading for water quality modelling is very conservative, given that the 95 %iles are normally about twice their mean values. It should be stressed that from past operation data the actual SS levels in the effluent of the existing TPSTW were much lower than 30 mg/L. From April 2003 to April 2004, the average SS concentration measured in the treated effluent was below 15 mg/L. Thus, the potential SS impacts simulated were likely much higher than the real situation that would happen. It is therefore unlikely that there would be adverse SS impacts at the seawater intake.
Impact on Hoi Ha Wan Marine Park 4.7.29 The contour plots showed that, in contrast to the baseline conditions, higher pollution levels
are predicted in the inner Tolo Harbour and Sha Tin Hoi due to the overflow discharges under normal operation of the Project but no observable differences in the pollution levels are predicted in areas further away from the Buffer Subzone. Therefore, the Project would not cause impact on Hoi Ha Wan Marine Park, within the Channel Subzone, located over 13 km away from the overflow discharge points. As indicated in Table 4.18, only negligible
Agreement No CE 43/2001 (EP)
Tai Po Sewage Treatment Works – Stage V Drainage Services Department Final EIA Report
MAUNSELL 4-44
increases in the pollution levels are predicted at this marine park after commissioning of the Project.

Agreement No CE 43/2001 (EP) Tai Po Sewage Treatment Works – Stage V Drainage Services Department Final EIA Report
MAUNSELL 4-45
Table 4.18 Predicted Water Quality for Scenarios 4 (Baseline), 5 (Operational) and 6 (Maintenance Discharge) Indicator Point Scenario DA DO
(mg/L) Min
Surface DO (mg/L)
Min Middle DO (mg/L)
Min Bottom DO (mg/L)
DA TIN (mg/L)
DA UIA (mg/L)
DA SS (mg /L)
DA E. coli (no/100mL)
Surface max 5-day moving average chlorophyll-a (µg/L)
Peak Value of the Year
Fish Culture Zone (Figure 4.4)
Harbour Subzone
2016 4-week maintenance discharge at STSTW (6a) 7.27 7.70 5.65 1.41 0.21 0.012 9.49 1 48
2016 4-week maintenance discharge at STSTW and TPSTW (6b) 8.83 7.95 5.68 1.06 0.34 0.017 12.50 1 76
2016 Normal with overflow bypass at Shatin only (5a) 7.26 5.15 3.40 0.46 0.13 0.007 7.10 1 27
2016 Normal with overflow bypass at Tai Po and Shatin (5b) 7.77 5.03 3.25 0.00 0.17 0.009 8.32 1 40
2016 Baseline (4a) 7.08 5.25 3.60 1.20 0.11 0.006 6.17 1 23
2010 Normal with overflow bypass at Shatin only (5c) 7.11 5.17 3.56 0.94 0.12 0.007 6.48 1 25
2010 Normal with overflow bypass at Tai Po and Shatin (5d) 7.16 5.15 3.61 0.87 0.12 0.007 6.56 1 29
2010 Baseline (4b) 7.09 5.21 3.53 1.10 0.11 0.006 6.32 1 24
Yim Tin Tsai (FC2)
2003 Baseline (4c) 7.14 5.21 3.46 0.99 0.12 0.006 6.47 1 24
Buffer Subzone
2016 4-week maintenance discharge at STSTW (6a) 7.54 7.44 6.27 2.68 0.14 0.008 8.22 3 36
2016 4-week maintenance discharge at STSTW and TPSTW (6b) 7.66 7.54 6.32 2.39 0.15 0.009 8.90 3 43
2016 Normal with overflow bypass at Shatin only (5a) 7.62 5.80 4.39 2.56 0.09 0.005 6.14 8 20
2016 Normal with overflow bypass at Tai Po and Shatin (5b) 7.76 5.78 4.32 2.23 0.10 0.005 6.67 8 23
2016 Baseline (4a) 7.39 5.81 4.45 2.82 0.07 0.004 5.35 8 16
2010 Normal with overflow bypass at Shatin only (5c) 7.46 5.77 4.46 2.74 0.08 0.004 5.65 8 18
2010 Normal with overflow bypass at Tai Po and Shatin (5d) 7.45 5.76 4.47 2.74 0.08 0.004 5.64 8 18
2010 Baseline (4b) 7.42 5.79 4.41 2.74 0.07 0.004 5.51 8 18
Yim Tin Tsai (East) (FC1)
2003 Baseline (4c) 7.47 5.79 4.36 2.68 0.08 0.004 5.62 8 19
Channel Subzone
2016 4-week maintenance discharge at STSTW (6a) 6.79 6.77 5.76 4.35 0.07 0.004 4.67 1 31
2016 4-week maintenance discharge at STSTW and TPSTW (6b) 6.68 6.78 5.73 4.31 0.07 0.004 4.69 1 30
Lo Fu Wat (FC4)
2016 Normal with overflow bypass at Shatin only (5a) 7.35 6.20 4.59 3.59 0.06 0.003 3.85 1 14
2016 Normal with overflow bypass at Tai Po and Shatin (5b) 7.38 6.21 4.59 3.56 0.06 0.003 3.99 1 15
2016 Baseline (4a) 7.20 6.15 4.56 3.65 0.06 0.002 3.49 1 12

Agreement No CE 43/2001 (EP) Tai Po Sewage Treatment Works – Stage V Drainage Services Department Final EIA Report
MAUNSELL 4-46
Indicator Point Scenario DA DO (mg/L)
Min Surface
DO (mg/L)
Min Middle DO (mg/L)
Min Bottom DO (mg/L)
DA TIN (mg/L)
DA UIA (mg/L)
DA SS (mg /L)
DA E. coli (no/100mL)
Surface max 5-day moving average chlorophyll-a (µg/L)
Peak Value of the Year
2010 Normal with overflow bypass at Shatin only (5c) 7.24 6.19 4.56 3.60 0.06 0.002 3.64 1 13
2010 Normal with overflow bypass at Tai Po and Shatin (5d) 7.22 6.18 4.56 3.61 0.06 0.002 3.62 1 13
2010 Baseline (4b) 7.21 6.17 4.54 3.61 0.06 0.002 3.58 1 12
2003 Baseline (4c) 7.26 6.17 4.54 3.60 0.06 0.002 3.64 1 16
2016 4-week maintenance discharge at STSTW (6a) 7.76 7.25 6.05 4.12 0.08 0.005 7.27 7 29 Yung Shue Au (FC3) 2016 4-week maintenance discharge at STSTW and TPSTW (6b) 7.54 7.26 5.95 3.94 0.08 0.005 7.29 7 28
2016 Normal with overflow bypass at Shatin only (5a) 7.74 6.30 4.36 2.67 0.06 0.003 5.33 20 16
2016 Normal with overflow bypass at Tai Po and Shatin (5b) 7.76 6.29 4.31 2.56 0.06 0.004 5.55 20 17 Yung Shue Au (FC3)
2016 Baseline (4a) 7.55 6.20 4.39 2.89 0.05 0.003 4.73 20 14
2010 Normal with overflow bypass at Shatin only (5c) 7.71 6.23 4.37 2.77 0.06 0.003 5.13 20 16
2010 Normal with overflow bypass at Tai Po and Shatin (5d) 7.69 6.21 4.37 2.77 0.06 0.003 5.10 20 16
2010 Baseline (4b) 7.68 6.20 4.33 2.77 0.06 0.003 5.03 20 16
2003 Baseline (4c) 7.62 6.21 4.32 2.76 0.05 0.003 4.96 20 16
Non-Gazetted Beach and Water Sport Centre (Figure 4.4)
Harbour Subzone
2016 4-week maintenance discharge at STSTW (6a) 11.00 7.12 5.93 2.81 0.35 0.014 12.90 243 100
2016 4-week maintenance discharge at STSTW and TPSTW (6b) 10.30 7.20 6.13 2.55 0.28 0.013 12.40 240 88
2016 Normal with overflow bypass at Shatin only (5a) 8.16 5.13 4.55 2.77 0.11 0.005 6.96 409 36
2016 Normal with overflow bypass at Tai Po and Shatin (5b) 8.12 5.07 4.44 2.54 0.11 0.005 7.22 410 33
2016 Baseline (4a) 7.52 5.25 4.59 3.03 0.08 0.004 5.71 403 23
2010 Normal with overflow bypass at Shatin only (5c) 7.64 5.19 4.62 2.95 0.08 0.004 6.04 404 27
2010 Normal with overflow bypass at Tai Po and Shatin (5d) 7.57 5.18 4.64 2.97 0.08 0.004 5.94 404 25
2010 Baseline (4b) 7.53 5.21 4.55 2.96 0.08 0.004 5.82 403 24
Wu Kai Sha (NB3)
2003 Baseline (4c) 7.72 5.19 4.53 2.82 0.09 0.004 6.12 405 50
Buffer Subzone
2016 4-week maintenance discharge at STSTW (6a) 7.41 7.27 5.93 3.16 0.12 0.007 7.62 76 29
2016 4-week maintenance discharge at STSTW and TPSTW (6b) 7.33 7.28 5.89 2.92 0.12 0.007 7.96 77 31
Tai Mei Tuk water sport center (WSC)
2016 Normal with overflow bypass at Shatin only (5a) 7.54 5.77 4.59 2.52 0.08 0.004 5.71 99 19
2016 Normal with overflow bypass at Tai Po and Shatin (5b) 7.62 5.77 4.54 2.35 0.09 0.005 6.09 100 20

Agreement No CE 43/2001 (EP) Tai Po Sewage Treatment Works – Stage V Drainage Services Department Final EIA Report
MAUNSELL 4-47
Indicator Point Scenario DA DO (mg/L)
Min Surface
DO (mg/L)
Min Middle DO (mg/L)
Min Bottom DO (mg/L)
DA TIN (mg/L)
DA UIA (mg/L)
DA SS (mg /L)
DA E. coli (no/100mL)
Surface max 5-day moving average chlorophyll-a (µg/L)
Peak Value of the Year
2016 Baseline (4a) 7.32 5.77 4.61 2.79 0.07 0.004 4.99 98 17
2010 Normal with overflow bypass at Shatin only (5c) 7.37 5.74 4.62 2.70 0.07 0.004 5.24 98 18
2010 Normal with overflow bypass at Tai Po and Shatin (5d) 7.36 5.73 4.63 2.71 0.07 0.004 5.22 98 18
2010 Baseline (4b) 7.34 5.75 4.57 2.71 0.07 0.004 5.12 98 17
2003 Baseline (4c) 7.39 5.75 4.54 2.65 0.07 0.004 5.24 98 17
2016 4-week maintenance discharge at STSTW (6a) 7.30 5.77 5.55 2.58 0.13 0.008 8.40 5 33
2016 4-week maintenance discharge at STSTW and TPSTW (6b) 7.69 5.83 5.55 2.29 0.15 0.009 9.50 5 40
Sha Lan (NB1)
2016 Normal with overflow bypass at Shatin only (5a) 7.62 4.49 4.30 1.13 0.09 0.005 6.50 10 22
2016 Normal with overflow bypass at Tai Po and Shatin (5b) 7.82 4.40 4.19 0.76 0.10 0.006 7.15 11 25
2016 Baseline (4a) 7.42 4.61 4.43 1.61 0.07 0.004 5.68 10 18
2010 Normal with overflow bypass at Shatin only (5c) 7.48 4.63 4.44 1.45 0.07 0.004 5.99 10 19
2010 Normal with overflow bypass at Tai Po and Shatin (5d) 7.49 4.67 4.46 1.46 0.07 0.004 5.99 10 19
2010 Baseline (4b) 7.46 4.55 4.39 1.49 0.07 0.004 5.85 10 19 Sha Lan (NB1)
2003 Baseline (4c) 7.49 4.47 4.30 1.40 0.07 0.004 5.95 10 19
Channel Subzone
2016 4-week maintenance discharge at STSTW (6a) 5.93 6.42 5.07 3.87 0.06 0.003 2.68 3 10
2016 4-week maintenance discharge at STSTW and TPSTW (6b) 5.91 6.41 5.03 3.84 0.06 0.003 2.69 3 10
2016 Normal with overflow bypass at Shatin only (5a) 7.14 6.13 4.44 3.62 0.05 0.002 2.81 4 9
2016 Normal with overflow bypass at Tai Po and Shatin (5b) 7.14 6.13 4.43 3.60 0.06 0.002 2.85 4 9
2016 Baseline (4a) 7.11 6.10 4.45 3.65 0.05 0.002 2.72 4 9
2010 Normal with overflow bypass at Shatin only (5c) 7.12 6.12 4.42 3.61 0.05 0.002 2.79 4 9
2010 Normal with overflow bypass at Tai Po and Shatin (5d) 7.11 6.12 4.42 3.61 0.05 0.002 2.78 4 9
2010 Baseline (4b) 7.11 6.12 4.42 3.61 0.05 0.002 2.77 4 9
Hoi Ha (NB4)
2003 Baseline (4c) 7.12 6.11 4.42 3.61 0.05 0.002 2.77 4 9
SSSIs (Figure 4.4)
Harbour Subzone
2016 4-week maintenance discharge at STSTW (6a) 7.81 3.69 4.53 1.28 0.21 0.014 12.60 1260 78
2016 4-week maintenance discharge at STSTW and TPSTW (6b) 13.50 4.08 4.37 0.34 0.60 0.028 20.90 1340 130
Mangroves at Tai Po Kau (M3)
2016 Normal with overflow bypass at Shatin only (5a) 7.35 1.64 2.29 0.00 0.19 0.012 10.50 1660 58

Agreement No CE 43/2001 (EP) Tai Po Sewage Treatment Works – Stage V Drainage Services Department Final EIA Report
MAUNSELL 4-48
Indicator Point Scenario DA DO (mg/L)
Min Surface
DO (mg/L)
Min Middle DO (mg/L)
Min Bottom DO (mg/L)
DA TIN (mg/L)
DA UIA (mg/L)
DA SS (mg /L)
DA E. coli (no/100mL)
Surface max 5-day moving average chlorophyll-a (µg/L)
Peak Value of the Year
2016 Normal with overflow bypass at Tai Po and Shatin (5b) 8.65 1.41 2.03 0.00 0.29 0.016 13.00 1690 83
2016 Baseline (4a) 7.19 1.80 2.59 0.00 0.16 0.010 9.50 1650 53
2010 Normal with overflow bypass at Shatin only (5c) 7.20 1.73 2.51 0.00 0.17 0.011 9.76 1660 54
2010 Normal with overflow bypass at Tai Po and Shatin (5d) 7.40 1.69 2.58 0.00 0.18 0.011 10.06 1660 61
2010 Baseline (4b) 7.18 1.76 2.53 0.00 0.17 0.010 9.60 1650 53
2003 Baseline (4c) 7.26 1.74 2.47 0.00 0.17 0.011 9.81 1650 54
2016 4-week maintenance discharge at STSTW (6a) 8.45 6.56 5.77 1.70 0.27 0.013 10.70 5 62
2016 4-week maintenance discharge at STSTW and TPSTW (6b) 9.54 7.65 6.05 1.44 0.39 0.018 13.10 6 87
2016 Normal with overflow bypass at Shatin only (5a) 7.51 4.86 3.70 0.97 0.13 0.007 7.29 4 29
2016 Normal with overflow bypass at Tai Po and Shatin (5b) 8.01 5.14 3.56 0.47 0.17 0.008 8.47 4 42
2016 Baseline (4a) 7.19 4.86 3.84 1.45 0.10 0.005 6.24 4 23
2010 Normal with overflow bypass at Shatin only (5c) 7.24 4.94 3.82 1.30 0.11 0.006 6.53 4 25
2010 Normal with overflow bypass at Tai Po and Shatin (5d) 7.27 5.16 3.87 1.29 0.11 0.006 6.59 4 28
2010 Baseline (4b) 7.19 4.80 3.78 1.35 0.10 0.005 6.35 4 24
Mangroves at Pak Shek Kok (M4)
2003 Baseline (4c) 7.30 4.72 3.72 1.25 0.11 0.006 6.57 4 30
Buffer Subzone
2016 4-week maintenance discharge at STSTW (6a) 7.25 6.03 5.65 2.89 0.11 0.007 8.38 30 30 Ting Kok SSSI (M1) 2016 4-week maintenance discharge at STSTW and TPSTW (6b) 7.36 5.90 5.48 2.61 0.12 0.008 9.09 31 33
2016 Normal with overflow bypass at Shatin only (5a) 7.68 4.85 4.17 1.15 0.08 0.005 6.51 80 21
2016 Normal with overflow bypass at Tai Po and Shatin (5b) 7.80 4.71 4.06 0.79 0.09 0.005 7.04 80 24
2016 Baseline (4a) 7.48 4.98 4.29 1.63 0.06 0.004 5.71 79 17
2010 Normal with overflow bypass at Shatin only (5c) 7.54 4.99 4.28 1.48 0.07 0.004 6.01 79 19
2010 Normal with overflow bypass at Tai Po and Shatin (5d) 7.53 5.01 4.30 1.49 0.07 0.004 6.00 79 19
2010 Baseline (4b) 7.51 4.92 4.24 1.51 0.06 0.004 5.87 79 18
Ting Kok SSSI (M1)
2003 Baseline (4c) 7.55 4.84 4.19 1.42 0.07 0.004 5.98 79 18
2016 4-week maintenance discharge at STSTW (6a) 7.33 7.36 6.14 2.61 0.14 0.008 8.24 8 30
2016 4-week maintenance discharge at STSTW and TPSTW (6b) 7.54 7.47 6.18 2.31 0.16 0.009 9.09 8 29
2016 Normal with overflow bypass at Shatin only (5a) 7.56 5.60 4.40 2.14 0.09 0.005 6.29 16 21
2016 Normal with overflow bypass at Tai Po and Shatin (5b) 7.72 5.56 4.33 1.84 0.10 0.006 6.86 16 24
2016 Baseline (4a) 7.35 5.65 4.47 2.46 0.07 0.004 5.49 16 17
Mangroves at Sha Lan (M2)
2010 Normal with overflow bypass at Shatin only (5c) 7.42 5.60 4.48 2.36 0.08 0.004 5.79 16 18

Agreement No CE 43/2001 (EP) Tai Po Sewage Treatment Works – Stage V Drainage Services Department Final EIA Report
MAUNSELL 4-49
Indicator Point Scenario DA DO (mg/L)
Min Surface
DO (mg/L)
Min Middle DO (mg/L)
Min Bottom DO (mg/L)
DA TIN (mg/L)
DA UIA (mg/L)
DA SS (mg /L)
DA E. coli (no/100mL)
Surface max 5-day moving average chlorophyll-a (µg/L)
Peak Value of the Year
2010 Normal with overflow bypass at Tai Po and Shatin (5d) 7.42 5.59 4.49 2.37 0.08 0.004 5.79 16 18
2010 Baseline (4b) 7.39 5.62 4.42 2.37 0.08 0.004 5.66 16 18
2003 Baseline (4c) 7.43 5.62 4.38 2.30 0.08 0.004 5.76 16 18
2016 4-week maintenance discharge at STSTW (6a) 9.03 7.06 6.29 4.96 0.08 0.004 8.22 1 52
2016 4-week maintenance discharge at STSTW and TPSTW (6b) 8.77 7.06 6.20 4.83 0.08 0.004 8.24 1 51
2016 Normal with overflow bypass at Shatin only (5a) 7.96 6.05 5.18 4.13 0.05 0.003 5.23 1 20
2016 Normal with overflow bypass at Tai Po and Shatin (5b) 8.03 6.08 5.19 4.10 0.06 0.003 5.50 1 20
Mangroves at Nai Chung (M5)
2016 Baseline (4a) 7.61 5.88 5.08 4.15 0.05 0.002 4.50 1 15
2010 Normal with overflow bypass at Shatin only (5c) 7.69 5.96 5.13 4.14 0.05 0.002 4.74 1 17
2010 Normal with overflow bypass at Tai Po and Shatin (5d) 7.66 5.95 5.12 4.14 0.05 0.002 4.71 1 16
2010 Baseline (4b) 7.63 5.87 5.05 4.11 0.05 0.002 4.62 1 15
2003 Baseline (4c) 7.74 5.88 5.05 4.10 0.05 0.002 4.77 1 28
Channel Subzone
2016 4-week maintenance discharge at STSTW (6a) 5.93 6.41 5.87 4.17 0.06 0.003 2.94 1 16
2016 4-week maintenance discharge at STSTW and TPSTW (6b) 5.90 6.41 5.83 4.15 0.06 0.003 2.95 1 16
Hoi Ha Wan Marine Park
2016 Normal with overflow bypass at Shatin only (5a) 7.08 6.08 3.98 4.06 0.06 0.002 2.89 1 10
2016 Normal with overflow bypass at Tai Po and Shatin (5b) 7.08 6.08 3.92 4.05 0.06 0.002 2.93 1 11
2016 Baseline (4a) 7.03 6.07 4.08 4.08 0.06 0.002 2.77 1 10
2010 Normal with overflow bypass at Shatin only (5c) 7.04 6.08 4.55 4.05 0.06 0.002 2.85 1 10
2010 Normal with overflow bypass at Tai Po and Shatin (5d) 7.04 6.08 4.55 4.05 0.06 0.002 2.84 1 10
2010 Baseline (4b) 7.04 6.08 4.03 4.05 0.06 0.002 2.83 1 10
Hoi Ha Wan 2003 Baseline (4c) 7.05 6.07 3.99 4.05 0.06 0.002 2.84 1 10
2016 4-week maintenance discharge at STSTW (6a) 8.22 6.97 6.71 5.17 0.04 0.003 7.83 596 28
2016 4-week maintenance discharge at STSTW and TPSTW (6b) 8.02 6.88 6.64 5.02 0.04 0.003 7.87 596 27
2016 Normal with overflow bypass at Shatin only (5a) 8.12 6.04 4.85 3.55 0.04 0.002 5.74 869 18
2016 Normal with overflow bypass at Tai Po and Shatin (5b) 8.15 6.03 4.81 3.46 0.04 0.003 5.97 870 18
2016 Baseline (4a) 7.88 5.93 4.85 3.69 0.04 0.002 5.10 865 15
2010 Normal with overflow bypass at Shatin only (5c) 8.04 6.00 4.86 3.61 0.04 0.002 5.48 867 17
2010 Normal with overflow bypass at Tai Po and Shatin (5d) 8.02 5.98 4.85 3.61 0.04 0.002 5.45 867 17
Mangroves near Nga Yiu Tau at Three Fathoms Cove (M6)
2010 Baseline (4b) 8.00 5.94 4.81 3.59 0.04 0.002 5.37 867 17

Agreement No CE 43/2001 (EP) Tai Po Sewage Treatment Works – Stage V Drainage Services Department Final EIA Report
MAUNSELL 4-50
Indicator Point Scenario DA DO (mg/L)
Min Surface
DO (mg/L)
Min Middle DO (mg/L)
Min Bottom DO (mg/L)
DA TIN (mg/L)
DA UIA (mg/L)
DA SS (mg /L)
DA E. coli (no/100mL)
Surface max 5-day moving average chlorophyll-a (µg/L)
Peak Value of the Year
2003 Baseline (4c) 7.97 5.93 4.80 3.58 0.04 0.002 5.34 867 16
2016 4-week maintenance discharge at STSTW (6a) 8.29 6.80 6.75 6.09 0.03 0.002 8.17 56 25
2016 4-week maintenance discharge at STSTW and TPSTW (6b) 8.11 6.72 6.61 5.93 0.03 0.002 8.21 56 25
2016 Normal with overflow bypass at Shatin only (5a) 8.23 5.81 4.82 4.17 0.03 0.002 6.06 109 18
Mangroves near Kei Ling Ha Lo Wai at Three Fathoms Cove (M7) 2016 Normal with overflow bypass at Tai Po and Shatin (5b) 8.27 5.79 4.77 4.09 0.03 0.002 6.30 109 18
2016 Baseline (4a) 7.97 5.74 4.84 4.26 0.03 0.002 5.38 108 15
2010 Normal with overflow bypass at Shatin only (5c) 8.14 5.79 4.83 4.21 0.03 0.002 5.79 108 17
2010 Normal with overflow bypass at Tai Po and Shatin (5d) 8.12 5.77 4.82 4.20 0.03 0.002 5.75 108 17
2010 Baseline (4b) 8.10 5.74 4.79 4.18 0.03 0.002 5.68 108 17
2003 Baseline (4c) 8.07 5.72 4.77 4.17 0.03 0.002 5.64 108 16
2016 4-week maintenance discharge at STSTW (6a) 8.48 7.21 6.74 5.05 0.05 0.003 7.81 1 30
2016 4-week maintenance discharge at STSTW and TPSTW (6b) 8.26 7.12 6.67 4.89 0.05 0.004 7.83 1 29
2016 Normal with overflow bypass at Shatin only (5a) 8.18 5.83 5.20 3.91 0.05 0.003 5.57 1 19
2016 Normal with overflow bypass at Tai Po and Shatin (5b) 8.21 5.80 5.18 3.84 0.05 0.003 5.79 1 19
2016 Baseline (4a) 7.93 5.81 5.15 3.99 0.04 0.003 4.93 1 17
Mangroves near Ngau Yu Tau at Three Fathoms Cove (M8)
2010 Normal with overflow bypass at Shatin only (5c) 8.23 5.84 5.18 3.94 0.05 0.003 5.53 1 23
2010 Normal with overflow bypass at Tai Po and Shatin (5d) 8.21 5.84 5.16 3.94 0.05 0.003 5.49 1 22
2010 Baseline (4b) 8.19 5.85 5.11 3.91 0.05 0.003 5.42 1 22
2003 Baseline (4c) 8.02 5.79 5.11 3.91 0.04 0.003 5.17 1 17
2016 4-week maintenance discharge at STSTW (6a) 7.29 6.70 5.82 4.74 0.06 0.003 5.19 1 34
2016 4-week maintenance discharge at STSTW and TPSTW (6b) 7.16 6.69 5.77 4.69 0.06 0.003 5.21 1 32
2016 Normal with overflow bypass at Shatin only (5a) 7.54 6.25 4.84 3.92 0.05 0.002 4.03 1 15
2016 Normal with overflow bypass at Tai Po and Shatin (5b) 7.57 6.26 4.83 3.89 0.06 0.002 4.18 1 16
2016 Baseline (4a) 7.35 6.04 4.77 3.95 0.05 0.002 3.63 1 12
Mangroves near Shek Nga Tau, Tolo Channel (M9)
2010 Normal with overflow bypass at Shatin only (5c) 7.41 6.14 4.79 3.92 0.05 0.002 3.79 1 14
2010 Normal with overflow bypass at Tai Po and Shatin (5d) 7.39 6.11 4.78 3.92 0.05 0.002 3.77 1 13
2010 Baseline (4b) 7.38 6.05 4.75 3.91 0.05 0.002 3.72 1 13 M9
2003 Baseline (4c) 7.43 6.06 4.75 3.91 0.05 0.002 3.80 1 16
2016 4-week maintenance discharge at STSTW (6a) 6.77 6.64 5.42 4.50 0.07 0.004 4.57 1 30
2016 4-week maintenance discharge at STSTW and TPSTW (6b) 6.66 6.64 5.38 4.47 0.07 0.004 4.59 1 29
Mangroves near Ngo Keng Tsui, Tolo Channel (M10) 2016 Normal with overflow bypass at Shatin only (5a) 7.37 6.30 4.59 3.82 0.06 0.002 3.79 1 14

Agreement No CE 43/2001 (EP) Tai Po Sewage Treatment Works – Stage V Drainage Services Department Final EIA Report
MAUNSELL 4-51
Indicator Point Scenario DA DO (mg/L)
Min Surface
DO (mg/L)
Min Middle DO (mg/L)
Min Bottom DO (mg/L)
DA TIN (mg/L)
DA UIA (mg/L)
DA SS (mg /L)
DA E. coli (no/100mL)
Surface max 5-day moving average chlorophyll-a (µg/L)
Peak Value of the Year
2016 Normal with overflow bypass at Tai Po and Shatin (5b) 7.39 6.32 4.58 3.80 0.06 0.003 3.92 1 14
2016 Baseline (4a) 7.22 6.11 4.55 3.86 0.05 0.002 3.45 1 12
2010 Normal with overflow bypass at Shatin only (5c) 7.26 6.20 4.55 3.82 0.06 0.002 3.60 1 13
2010 Normal with overflow bypass at Tai Po and Shatin (5d) 7.25 6.17 4.55 3.83 0.06 0.002 3.58 1 12
2010 Baseline (4b) 7.24 6.12 4.53 3.82 0.06 0.002 3.54 1 12
(M10)
2003 Baseline (4c) 7.28 6.12 4.53 3.82 0.06 0.002 3.60 1 15
EPD Monitoring Station (Figure 4.2a and 4.2b)
Tolo Harbour and Channel
Harbour Subzone
TM2 2016 4-week maintenance discharge at STSTW (6a) 10.30 6.26 3.06 1.17 1.58 0.058 17.90 23 169
2016 4-week maintenance discharge at STSTW and TPSTW (6b) 10.10 6.63 3.63 0.95 1.12 0.045 16.90 18 147
2016 Normal with overflow bypass at Shatin only (5a) 7.83 3.13 2.41 0.65 0.24 0.011 8.74 5 65
2016 Normal with overflow bypass at Tai Po and Shatin (5b) 7.66 3.10 2.38 0.50 0.21 0.010 8.84 4 61
2016 Baseline (4a) 7.14 3.45 2.79 1.33 0.13 0.007 6.97 3 41
2010 Normal with overflow bypass at Shatin only (5c) 7.27 3.34 2.69 1.14 0.15 0.008 7.42 5 44
2010 Normal with overflow bypass at Tai Po and Shatin (5d) 7.16 3.36 2.73 1.20 0.14 0.007 7.22 3 42
2010 Baseline (4b) 7.13 3.41 2.72 1.23 0.14 0.007 7.07 3 41
2003 Baseline (4c) 7.32 3.37 2.64 1.12 0.17 0.008 7.50 4 51
2016 4-week maintenance discharge at STSTW (6a) 7.11 7.84 5.55 1.00 0.23 0.013 9.48 1 52 TM3
2016 4-week maintenance discharge at STSTW and TPSTW (6b) 8.51 8.01 5.24 0.62 0.40 0.019 12.40 1 83
2016 Normal with overflow bypass at Shatin only (5a) 7.13 5.17 2.85 0.58 0.14 0.008 7.05 1 29
2016 Normal with overflow bypass at Tai Po and Shatin (5b) 7.61 5.02 2.63 0.00 0.19 0.010 8.27 1 44
2016 Baseline (4a) 6.95 5.28 3.13 1.34 0.11 0.006 6.13 1 24
2010 Normal with overflow bypass at Shatin only (5c) 6.97 5.20 3.06 1.05 0.12 0.007 6.41 1 26
2010 Normal with overflow bypass at Tai Po and Shatin (5d) 7.02 5.17 3.10 0.98 0.12 0.007 6.49 1 30
2010 Baseline (4b) 6.94 5.24 3.05 1.22 0.12 0.006 6.25 1 25

Agreement No CE 43/2001 (EP) Tai Po Sewage Treatment Works – Stage V Drainage Services Department Final EIA Report
MAUNSELL 4-52
Indicator Point Scenario DA DO (mg/L)
Min Surface
DO (mg/L)
Min Middle DO (mg/L)
Min Bottom DO (mg/L)
DA TIN (mg/L)
DA UIA (mg/L)
DA SS (mg /L)
DA E. coli (no/100mL)
Surface max 5-day moving average chlorophyll-a (µg/L)
Peak Value of the Year
2003 Baseline (4c) 7.01 5.24 2.97 1.15 0.12 0.007 6.43 1 25
2016 4-week maintenance discharge at STSTW (6a) 8.49 7.44 5.82 1.84 0.40 0.016 10.50 5 94
2016 4-week maintenance discharge at STSTW and TPSTW (6b) 8.41 7.63 5.79 1.59 0.36 0.015 10.80 5 84
TM4
2016 Normal with overflow bypass at Shatin only (5a) 7.58 5.28 3.72 1.92 0.12 0.006 6.50 11 32
2016 Normal with overflow bypass at Tai Po and Shatin (5b) 7.66 5.26 3.66 1.64 0.13 0.006 6.96 11 34
2016 Baseline (4a) 7.18 5.43 3.84 2.34 0.09 0.004 5.45 11 22
2010 Normal with overflow bypass at Shatin only (5c) 7.24 5.36 3.80 2.25 0.10 0.005 5.74 11 25
2010 Normal with overflow bypass at Tai Po and Shatin (5d) 7.21 5.36 3.83 2.24 0.10 0.005 5.70 11 24
2010 Baseline (4b) 7.18 5.39 3.79 2.25 0.09 0.005 5.56 11 22
2003 Baseline (4c) 7.30 5.38 3.75 2.00 0.10 0.005 5.80 11 46
Buffer Subzone
TM5 2016 4-week maintenance discharge at STSTW (6a) 6.96 7.40 5.69 2.53 0.15 0.009 7.85 26 32
2016 4-week maintenance discharge at STSTW and TPSTW (6b) 6.98 7.48 5.65 2.24 0.16 0.009 8.42 26 36
2016 Normal with overflow bypass at Shatin only (5a) 7.36 5.80 4.09 2.44 0.10 0.005 6.02 55 20
2016 Normal with overflow bypass at Tai Po and Shatin (5b) 7.45 5.78 3.99 2.24 0.11 0.006 6.49 55 23
2016 Baseline (4a) 7.18 5.81 4.18 2.72 0.08 0.004 5.27 55 17
2010 Normal with overflow bypass at Shatin only (5c) 7.23 5.77 4.17 2.63 0.09 0.005 5.55 55 18
2010 Normal with overflow bypass at Tai Po and Shatin (5d) 7.23 5.76 4.18 2.63 0.09 0.005 5.54 55 18
2010 Baseline (4b) 7.21 5.79 4.13 2.63 0.08 0.005 5.43 55 18
2003 Baseline (4c) 7.25 5.79 4.08 2.57 0.09 0.005 5.53 55 18
TM6 2016 4-week maintenance discharge at STSTW (6a) 7.11 7.36 5.34 3.53 0.20 0.009 7.14 2 63
2016 4-week maintenance discharge at STSTW and TPSTW (6b) 6.93 7.39 5.25 3.35 0.19 0.008 7.22 2 64
2016 Normal with overflow bypass at Shatin only (5a) 7.28 6.08 4.19 3.53 0.09 0.004 5.06 5 24
2016 Normal with overflow bypass at Tai Po and Shatin (5b) 7.31 6.07 4.17 3.36 0.10 0.004 5.32 5 25
2016 Baseline (4a) 7.04 5.95 4.22 3.68 0.08 0.003 4.40 5 16
2010 Normal with overflow bypass at Shatin only (5c) 7.08 6.05 4.21 3.63 0.08 0.004 4.61 5 19
2010 Normal with overflow bypass at Tai Po and Shatin (5d) 7.06 6.04 4.21 3.63 0.08 0.004 4.58 5 18
2010 Baseline (4b) 7.04 5.95 4.18 3.63 0.08 0.004 4.50 5 17
2003 Baseline (4c) 7.12 5.95 4.16 3.57 0.08 0.004 4.64 5 36
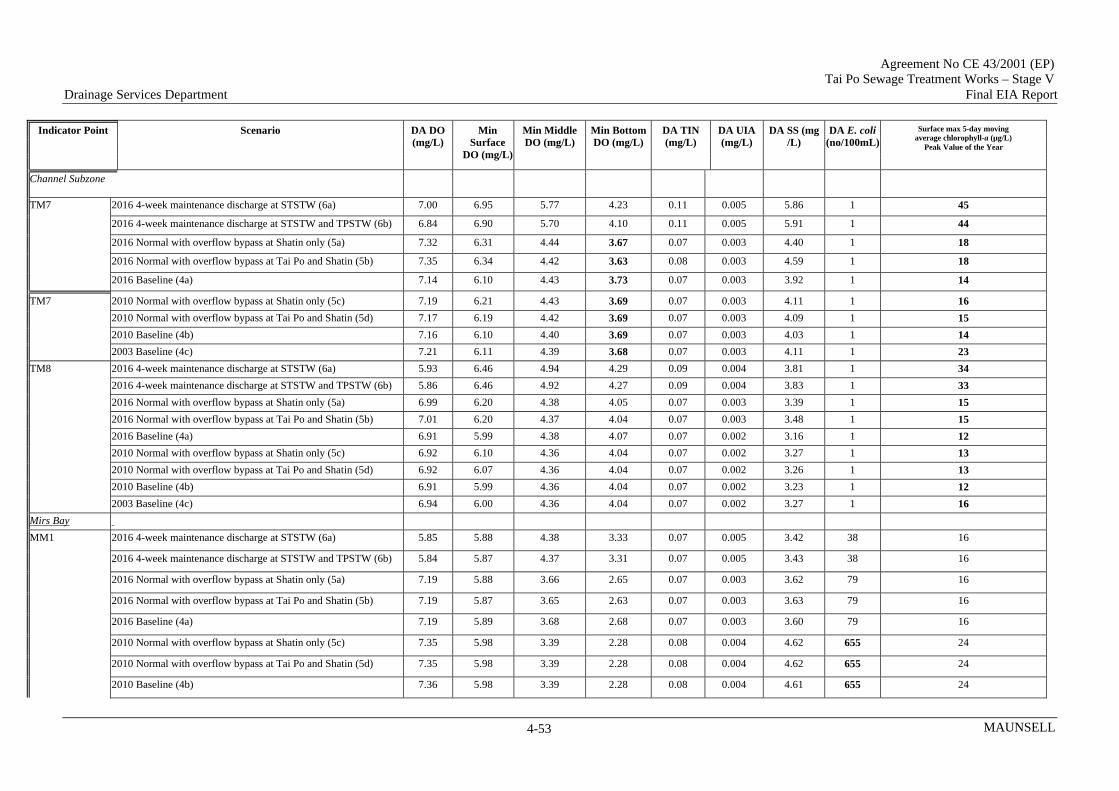
Agreement No CE 43/2001 (EP) Tai Po Sewage Treatment Works – Stage V Drainage Services Department Final EIA Report
MAUNSELL 4-53
Indicator Point Scenario DA DO (mg/L)
Min Surface
DO (mg/L)
Min Middle DO (mg/L)
Min Bottom DO (mg/L)
DA TIN (mg/L)
DA UIA (mg/L)
DA SS (mg /L)
DA E. coli (no/100mL)
Surface max 5-day moving average chlorophyll-a (µg/L)
Peak Value of the Year
Channel Subzone
2016 4-week maintenance discharge at STSTW (6a) 7.00 6.95 5.77 4.23 0.11 0.005 5.86 1 45
2016 4-week maintenance discharge at STSTW and TPSTW (6b) 6.84 6.90 5.70 4.10 0.11 0.005 5.91 1 44
TM7
2016 Normal with overflow bypass at Shatin only (5a) 7.32 6.31 4.44 3.67 0.07 0.003 4.40 1 18
2016 Normal with overflow bypass at Tai Po and Shatin (5b) 7.35 6.34 4.42 3.63 0.08 0.003 4.59 1 18
2016 Baseline (4a) 7.14 6.10 4.43 3.73 0.07 0.003 3.92 1 14
TM7 2010 Normal with overflow bypass at Shatin only (5c) 7.19 6.21 4.43 3.69 0.07 0.003 4.11 1 16
2010 Normal with overflow bypass at Tai Po and Shatin (5d) 7.17 6.19 4.42 3.69 0.07 0.003 4.09 1 15
2010 Baseline (4b) 7.16 6.10 4.40 3.69 0.07 0.003 4.03 1 14
2003 Baseline (4c) 7.21 6.11 4.39 3.68 0.07 0.003 4.11 1 23
2016 4-week maintenance discharge at STSTW (6a) 5.93 6.46 4.94 4.29 0.09 0.004 3.81 1 34
2016 4-week maintenance discharge at STSTW and TPSTW (6b) 5.86 6.46 4.92 4.27 0.09 0.004 3.83 1 33
TM8
2016 Normal with overflow bypass at Shatin only (5a) 6.99 6.20 4.38 4.05 0.07 0.003 3.39 1 15
2016 Normal with overflow bypass at Tai Po and Shatin (5b) 7.01 6.20 4.37 4.04 0.07 0.003 3.48 1 15
2016 Baseline (4a) 6.91 5.99 4.38 4.07 0.07 0.002 3.16 1 12
2010 Normal with overflow bypass at Shatin only (5c) 6.92 6.10 4.36 4.04 0.07 0.002 3.27 1 13
2010 Normal with overflow bypass at Tai Po and Shatin (5d) 6.92 6.07 4.36 4.04 0.07 0.002 3.26 1 13
2010 Baseline (4b) 6.91 5.99 4.36 4.04 0.07 0.002 3.23 1 12
2003 Baseline (4c) 6.94 6.00 4.36 4.04 0.07 0.002 3.27 1 16
Mirs Bay
MM1 2016 4-week maintenance discharge at STSTW (6a) 5.85 5.88 4.38 3.33 0.07 0.005 3.42 38 16
2016 4-week maintenance discharge at STSTW and TPSTW (6b) 5.84 5.87 4.37 3.31 0.07 0.005 3.43 38 16
2016 Normal with overflow bypass at Shatin only (5a) 7.19 5.88 3.66 2.65 0.07 0.003 3.62 79 16
2016 Normal with overflow bypass at Tai Po and Shatin (5b) 7.19 5.87 3.65 2.63 0.07 0.003 3.63 79 16
2016 Baseline (4a) 7.19 5.89 3.68 2.68 0.07 0.003 3.60 79 16
2010 Normal with overflow bypass at Shatin only (5c) 7.35 5.98 3.39 2.28 0.08 0.004 4.62 655 24
2010 Normal with overflow bypass at Tai Po and Shatin (5d) 7.35 5.98 3.39 2.28 0.08 0.004 4.62 655 24
2010 Baseline (4b) 7.36 5.98 3.39 2.28 0.08 0.004 4.61 655 24

Agreement No CE 43/2001 (EP) Tai Po Sewage Treatment Works – Stage V Drainage Services Department Final EIA Report
MAUNSELL 4-54
Indicator Point Scenario DA DO (mg/L)
Min Surface
DO (mg/L)
Min Middle DO (mg/L)
Min Bottom DO (mg/L)
DA TIN (mg/L)
DA UIA (mg/L)
DA SS (mg /L)
DA E. coli (no/100mL)
Surface max 5-day moving average chlorophyll-a (µg/L)
Peak Value of the Year
2003 Baseline (4c) 7.31 5.93 3.43 2.35 0.08 0.004 4.46 625 23
MM2 2016 4-week maintenance discharge at STSTW (6a) 5.63 6.38 4.49 3.16 0.07 0.004 2.58 1 10
2016 4-week maintenance discharge at STSTW and TPSTW (6b) 5.62 6.38 4.48 3.15 0.07 0.004 2.59 1 10
2016 Normal with overflow bypass at Shatin only (5a) 7.01 6.32 4.13 3.00 0.06 0.003 2.91 1 10
2016 Normal with overflow bypass at Tai Po and Shatin (5b) 7.01 6.32 4.12 2.99 0.06 0.003 2.92 1 10
2016 Baseline (4a) 7.01 6.32 4.15 3.02 0.06 0.003 2.89 1 10
2010 Normal with overflow bypass at Shatin only (5c) 7.05 6.36 3.99 2.81 0.07 0.003 3.33 3 12
2010 Normal with overflow bypass at Tai Po and Shatin (5d) 7.05 6.36 3.99 2.81 0.07 0.003 3.33 3 12
2010 Baseline (4b) 7.05 6.36 3.99 2.81 0.07 0.003 3.33 3 12
2003 Baseline (4c) 7.04 6.36 4.01 2.85 0.07 0.003 3.26 3 12
2016 4-week maintenance discharge at STSTW (6a) 5.46 6.18 4.55 3.48 0.07 0.003 2.34 1 10
2016 4-week maintenance discharge at STSTW and TPSTW (6b) 5.45 6.18 4.54 3.47 0.07 0.003 2.35 1 10
2016 Normal with overflow bypass at Shatin only (5a) 6.89 6.18 4.53 3.48 0.07 0.002 2.64 1 10
2016 Normal with overflow bypass at Tai Po and Shatin (5b) 6.89 6.17 4.53 3.47 0.07 0.002 2.65 1 10
2016 Baseline (4a) 6.89 6.18 4.55 3.50 0.07 0.002 2.62 1 10
2010 Normal with overflow bypass at Shatin only (5c) 6.90 6.23 4.48 3.41 0.07 0.002 2.84 12 12
2010 Normal with overflow bypass at Tai Po and Shatin (5d) 6.90 6.23 4.48 3.41 0.07 0.002 2.84 12 12
2010 Baseline (4b) 6.90 6.23 4.48 3.41 0.07 0.002 2.83 12 12
MM3
2003 Baseline (4c) 6.90 6.22 4.49 3.43 0.07 0.002 2.80 11 12
2016 4-week maintenance discharge at STSTW (6a) 5.53 6.18 4.99 3.82 0.06 0.003 2.42 1 10
2016 4-week maintenance discharge at STSTW and TPSTW (6b) 5.53 6.17 4.99 3.82 0.06 0.003 2.43 1 10
MM4
2016 Normal with overflow bypass at Shatin only (5a) 6.88 6.01 4.98 3.82 0.07 0.002 2.55 1 10
2016 Normal with overflow bypass at Tai Po and Shatin (5b) 6.88 6.01 4.97 3.81 0.07 0.002 2.56 1 10
2016 Baseline (4a) 6.87 5.99 4.98 3.83 0.07 0.002 2.52 1 10
2010 Normal with overflow bypass at Shatin only (5c) 6.87 6.01 4.96 3.80 0.07 0.002 2.61 1 11
2010 Normal with overflow bypass at Tai Po and Shatin (5d) 6.87 6.01 4.96 3.80 0.07 0.002 2.61 1 11
2010 Baseline (4b) 6.87 6.01 4.96 3.80 0.07 0.002 2.61 1 11
2003 Baseline (4c) 6.87 6.00 4.96 3.80 0.07 0.002 2.59 1 11
MM5 2016 4-week maintenance discharge at STSTW (6a) 5.56 6.18 5.17 4.02 0.06 0.002 2.95 1 15

Agreement No CE 43/2001 (EP) Tai Po Sewage Treatment Works – Stage V Drainage Services Department Final EIA Report
MAUNSELL 4-55
Indicator Point Scenario DA DO (mg/L)
Min Surface
DO (mg/L)
Min Middle DO (mg/L)
Min Bottom DO (mg/L)
DA TIN (mg/L)
DA UIA (mg/L)
DA SS (mg /L)
DA E. coli (no/100mL)
Surface max 5-day moving average chlorophyll-a (µg/L)
Peak Value of the Year
2016 4-week maintenance discharge at STSTW and TPSTW (6b) 5.55 6.18 5.16 4.02 0.06 0.002 2.95 1 14
2016 Normal with overflow bypass at Shatin only (5a) 6.84 5.78 5.07 4.02 0.07 0.002 2.66 1 10
2016 Normal with overflow bypass at Tai Po and Shatin (5b) 6.85 5.78 5.07 4.02 0.07 0.002 2.68 1 10
2016 Baseline (4a) 6.83 5.78 5.06 4.02 0.07 0.002 2.62 1 10
2010 Normal with overflow bypass at Shatin only (5c) 6.83 5.78 5.05 4.02 0.07 0.002 2.67 1 10
2010 Normal with overflow bypass at Tai Po and Shatin (5d) 6.83 5.78 5.05 4.02 0.07 0.002 2.67 1 10
2010 Baseline (4b) 6.83 5.78 5.05 4.02 0.07 0.002 2.66 1 10
2003 Baseline (4c) 6.83 5.78 5.05 4.02 0.07 0.002 2.66 1 9
MM6 2016 4-week maintenance discharge at STSTW (6a) 5.77 6.31 4.94 4.35 0.06 0.003 2.59 2 9
2016 4-week maintenance discharge at STSTW and TPSTW (6b) 5.75 6.30 4.93 4.33 0.06 0.003 2.60 2 9
2016 Normal with overflow bypass at Shatin only (5a) 7.03 6.18 4.57 4.15 0.06 0.002 2.66 3 9
2016 Normal with overflow bypass at Tai Po and Shatin (5b) 7.03 6.19 4.57 4.15 0.06 0.002 2.68 3 9
2016 Baseline (4a) 7.02 6.17 4.57 4.16 0.06 0.002 2.61 3 9
2010 Normal with overflow bypass at Shatin only (5c) 7.03 6.19 4.56 4.14 0.06 0.002 2.67 3 10
2010 Normal with overflow bypass at Tai Po and Shatin (5d) 7.03 6.19 4.56 4.14 0.06 0.002 2.67 3 10
2010 Baseline (4b) 7.03 6.19 4.56 4.14 0.06 0.002 2.66 3 10
2003 Baseline (4c) 7.02 6.17 4.56 4.14 0.06 0.002 2.64 3 9
2016 4-week maintenance discharge at STSTW (6a) 5.49 6.25 4.29 3.64 0.07 0.004 2.43 1 9
2016 Normal with overflow bypass at Shatin only (5a) 5.48 6.25 4.28 3.62 0.07 0.004 2.44 1 9
MM7
2016 Normal with overflow bypass at Tai Po and Shatin (5b) 6.90 6.18 4.04 3.58 0.06 0.003 2.72 1 9
2016 Baseline (4a) 6.90 6.18 4.03 3.57 0.06 0.003 2.73 1 9
2010 Normal with overflow bypass at Shatin only (5c) 6.91 6.18 4.06 3.60 0.06 0.003 2.70 1 8
2010 Normal with overflow bypass at Tai Po and Shatin (5d) 6.91 6.21 3.94 3.47 0.07 0.003 2.91 1 9
2010 Normal with NO upgrading of Tai Po pumping station (5d) 6.91 6.21 3.94 3.47 0.07 0.003 2.91 1 9
2010 Baseline (4b) 6.91 6.21 3.94 3.47 0.07 0.003 2.91 1 9
2003 Baseline (4c) 6.90 6.20 3.96 3.49 0.07 0.003 2.87 1 9
MM16 2016 4-week maintenance discharge at STSTW (6a) 5.58 5.92 5.63 4.29 0.07 0.002 3.90 1 8
2016 4-week maintenance discharge at STSTW and TPSTW (6b) 5.58 5.92 5.63 4.29 0.07 0.002 3.90 1 8
2016 Normal with overflow bypass at Shatin only (5a) 6.69 5.54 5.06 4.29 0.07 0.002 2.63 1 8
2016 Normal with overflow bypass at Tai Po and Shatin (5b) 6.69 5.54 5.06 4.29 0.07 0.002 2.63 1 8
2016 Baseline (4a) 6.69 5.54 5.06 4.29 0.07 0.002 2.62 1 8
2010 Normal with overflow bypass at Shatin only (5c) 6.69 5.54 5.06 4.29 0.07 0.002 2.63 1 10

Agreement No CE 43/2001 (EP) Tai Po Sewage Treatment Works – Stage V Drainage Services Department Final EIA Report
MAUNSELL 4-56
Indicator Point Scenario DA DO (mg/L)
Min Surface
DO (mg/L)
Min Middle DO (mg/L)
Min Bottom DO (mg/L)
DA TIN (mg/L)
DA UIA (mg/L)
DA SS (mg /L)
DA E. coli (no/100mL)
Surface max 5-day moving average chlorophyll-a (µg/L)
Peak Value of the Year
2010 Normal with overflow bypass at Tai Po and Shatin (5d) 6.69 5.54 5.06 4.29 0.07 0.002 2.63 1 10
2010 Baseline (4b) 6.69 5.54 5.06 4.29 0.07 0.002 2.63 1 8
2003 Baseline (4c) 6.69 5.54 5.06 4.29 0.07 0.002 2.63 1 8
2016 4-week maintenance discharge at STSTW (6a) 5.69 6.36 4.63 4.06 0.07 0.003 2.88 1 22
2016 4-week maintenance discharge at STSTW and TPSTW (6b) 5.67 6.36 4.62 4.05 0.07 0.003 2.89 1 21
MM17
2016 Normal with overflow bypass at Shatin only (5a) 6.92 6.05 4.64 4.05 0.07 0.002 2.83 1 12
2016 Normal with overflow bypass at Tai Po and Shatin (5b) 6.92 6.06 4.63 4.05 0.07 0.002 2.86 1 12
2016 Baseline (4a) 6.89 6.05 4.65 4.06 0.07 0.002 2.73 1 10
2010 Normal with overflow bypass at Shatin only (5c) 6.89 6.06 4.62 4.04 0.07 0.002 2.81 1 11
2010 Normal with overflow bypass at Tai Po and Shatin (5d) 6.89 6.06 4.62 4.04 0.07 0.002 2.81 1 11
2010 Baseline (4b) 6.88 6.06 4.62 4.04 0.07 0.002 2.79 1 10
2003 Baseline (4c) 6.89 6.06 4.62 4.04 0.07 0.002 2.80 1 12
Note: Numbers in bold indicated non-compliance of WQO.

Agreement No CE 43/2001 (EP) Tai Po Sewage Treatment Works – Stage V Drainage Services Department Final EIA Report
MAUNSELL 4-57
Table 4.19 Predicted Water Quality at Water Intakes for Scenario 4 (Baseline) and Scenario 5 (Operational Phase) (annual average)
Indicator Point Scenario DO (mg/L)
TIN (mg/L) UIA (mg/L) SS (mg/L)
E. coli (no/100mL)
WSD SeaWater Intake (Figure 4.4) 2016 4-week maintenance discharge at STSTW (6a) 10.70 0.05 0.002 11.20 20
2016 4-week maintenance discharge at STSTW and TPSTW (6b) 20.10 0.31 0.011 21.80 31
2016 Normal with overflow bypass at Shatin only (5a) 9.17 0.06 0.003 8.66 30
2016 Normal with overflow bypass at Tai Po and Shatin (5b) 11.50 0.15 0.005 11.60 30
2016 Baseline (4a) 8.67 0.05 0.002 7.58 29
2010 Normal with overflow bypass at Shatin only (5c) 6.81 0.15 0.008 7.70 29
2010 Normal with overflow bypass at Tai Po and Shatin (5d) 6.96 0.18 0.010 7.97 31
2010 Baseline (4b) 8.70 0.05 0.002 7.70 29
Tai Po (W1)
2003 Baseline (4c) 8.84 0.05 0.003 7.92 29
2016 4-week maintenance discharge at STSTW (6a) 25.20 1.17 0.027 30.20 10
2016 4-week maintenance discharge at STSTW and TPSTW (6b) 23.50 0.65 0.018 27.60 9
Sha Tin (W2)
2016 Normal with overflow bypass at Shatin only (5a) 11.50 0.20 0.009 13.00 7
2016 Normal with overflow bypass at Tai Po and Shatin (5b) 10.70 0.17 0.009 12.40 7
2016 Baseline (4a) 9.37 0.13 0.007 10.10 7
2010 Normal with overflow bypass at Shatin only (5c) 7.34 0.25 0.014 9.88 7
2010 Normal with overflow bypass at Tai Po and Shatin (5d) 7.14 0.23 0.013 9.55 7
2010 Baseline (4b) 9.38 0.13 0.007 10.20 7 2003 Baseline (4c) 9.88 0.16 0.008 10.90 7
Other seawater intake
2016 4-week maintenance discharge at STSTW (6a) 15.50 0.30 0.009 16.40 2
2016 4-week maintenance discharge at STSTW and TPSTW (6b) 15.20 0.22 0.008 16.60 2
2016 Normal with overflow bypass at Shatin only (5a) 9.85 0.06 0.002 8.40 3
2016 Normal with overflow bypass at Tai Po and Shatin (5b) 10.00 0.06 0.002 8.89 2
2016 Baseline (4a) 8.65 0.03 0.002 6.61 2
2010 Normal with overflow bypass at Shatin only (5c) 7.34 0.11 0.006 6.52 2
2010 Normal with overflow bypass at Tai Po and Shatin (5d) 7.29 0.11 0.006 6.44 2
2010 Baseline (4b) 8.68 0.03 0.002 6.73 2
Marine Biolaboratory (S1)
2003 Baseline (4c) 8.99 0.05 0.002 7.15 2
Agreement No CE 43/2001 (EP) Tai Po Sewage Treatment Works – Stage V Drainage Services Department Final EIA Report
MAUNSELL 4-58
Note: Numbers in bold indicated non-compliance of WQO.

Agreement No CE 43/2001 (EP)
Tai Po Sewage Treatment Works – Stage V Drainage Services Department Final EIA Report
4-59 MAUNSELL
Water Quality Impact During 4-week THEES Maintenance Period and 24-hour Emergency Discharge (Tolo Harbour)
4.7.30 To assess the potential impacts during the periods of emergency discharge or the maintenance
of THEES tunnel, the model results are presented as time series plots for TIN, Chlorophyll-a, SS and E.coli covering the periods before, during and after the emergency or maintenance discharges at selected indicator points. The predicted results for normal operation scenarios are also included in these time series plots for comparison.
Scenario 6 (Year 2016 four-week THEES maintenance period)
4.7.31 A worst scenario assuming the maintenance discharge would continue for a period of 4 weeks
was assessed. During this period, it is likely that the water quality in the inner Tolo Harbour would be significantly affected. Scenario 6 represents a very adverse condition where the discharge would occur from 25 June to 22 July during which the estimated volume of effluent flow would be the highest of the year. However, it should be noted that regular inspection of the THEES tunnel would be conducted only once in every 5 years with duration of about 1 week if no major maintenance and repair works is required. Repair and maintenance works, if necessary, would take about 1 to 2 weeks. As such, the frequency for the occurrence of maintenance discharge would be low (once every 5 years) and that the actual duration of the discharge may also be shorter than 4 weeks.
4.7.32 Figures 6a1, 6c2 and Figures 6b1, 6d2 show the increases in TIN at selected indicator points
under Scenario 6a (discharge at STSTW) and Scenario 6b (discharge at both TPSTW and STSTW) respectively. Selected indicator points include Shatin seawater intake (W2), Pak Shek Kok mangrove site (M4), EPD’s marine monitoring station (TM6), Lo Fu Wat Fish culture zone (FC4), Shing Mun River (SM1 and SM2), Yim Tin Tsai fish culture zone (FC2) and Tai Po seawater intake (W1) as shown in Figure 4.4. As the monitoring points TM6 and FC4 are close to the coral sites at Pak Sha Tau (C1) and Lo Fo Wat South (C2) respectively, the time series plots for TM6 and FC4 could also reflect the impact at C1 and C2 respectively.
4.7.33 For Scenario 6a (discharge at STSTW only), the greatest impact was found at W2 and SM2
which are located nearest to the discharge point (Figures 6a1 and 6c2). The TIN levels at both W2 and SM2 increased dramatically during the maintenance discharge period. The highest TIN level of almost 3.5 mg/L was predicted at W2, and returned to almost the same as the baseline levels of around 0.5 mg/L in about 3 weeks time after termination of the maintenance discharge. The influences on water quality in terms of the increase in TIN at M4, FC4, TM6, SM1, FC2 and W1, which are located further away from the discharge, are significantly smaller, if any.
4.7.34 For Scenario 6b (discharge at both TPSTW and STSTW), the greatest impact was found at
W1 which is nearest to the discharge location at TPSTW (Figures 6b1 and 6d2). The highest TIN levels predicted at W1 was almost 3.5 mg/L as compared to the baseline level of around 0.5 mg/L. However, the recovery of the impact at W1 could be achieved within a shorter period (less than 10 days after the end of maintenance period as compared to the impact at W2 under Scenario 6a (discharge at STSTW only). The impacts at W2 and SM2, nearest to the discharge point at STSTW, under Scenario 6b were similar to the impacts under Scenario 6a but to a lower extent. Again, the predicted impact was significantly lower, if any,

Agreement No CE 43/2001 (EP)
Tai Po Sewage Treatment Works – Stage V Drainage Services Department Final EIA Report
4-60 MAUNSELL
at the rest of the indicator points which are relatively further away from the discharge locations.
4.7.35 Figures 6a4, 6c5 and Figures 6b4, 6d5 show the surface chlorophyll-a results under
Scenario 6a (discharge at STSTW) and Scenario 6b (discharge at both TPSTW and STSTW) respectively. It is considered that the greatest impact would occur at W2, nearest to the discharge at STSTW, for both Scenarios 6a and 6b. The highest chlorophyll-a levels predicted at W2 was almost 250 µg/L as compared to the baseline values of around 50 µg/L for both Scenarios 6a and 6b. The chlorophyll-a levels returned to almost the same as the baseline levels within 3 weeks after the end of the maintenance period. Although the chlorophyll-a levels could reach 330 µg/L at the Shing Mun River (SM1) (Figure 6c5), the relative impact is still considered lower as the baseline levels at this station were also very high (up to 270 µg/L). Figures 6a2, 6c3 and Figures 6b2, 6d3 show the mid-depth chlorophyll-a results under Scenario 6a (discharge at STSTW) and Scenario 6b (discharge at both TPSTP and STSTW) respectively. Figures 6a3, 6c4 and Figures 6b3, 6d4 show the surface chlorophyll-a results under Scenario 6a (discharge at STSTW) and Scenario 6b (discharge at both TPSTP and STSTW) respectively. The chlorophyll-a impacts on the middle and bottom layers showed the same pattern as the impact on the surface layer except that the absolute increases in the chlorophyll-a levels are much lower in the middle and bottom layers.
4.7.36 Figures 6a5, 6c6 and Figures 6b5, 6d6 show the DA SS results under Scenario 6a (discharge
at STSTW) and Scenario 6b (discharge at both TPSTP and STSTW) respectively. The greatest impact was found at W2 and SM2 for both Scenario 6a (discharge at STSTW only) and Scenario 6b (discharge at both TPSTW and STSTW). The highest level of around 50 mg/L was predicted at SM2 for both Scenarios 6a and 6b. It would take about 3 weeks to restore the SS levels after termination of the maintenance discharge.
4.7.37 Figures 6a6, 6a7 and Figures 6b6, 6b7 show the E.coli results at W2, M4, TM6, FC4, W1,
S1, FC2 and NB3 (The locations of these indicator points are shown in Figure 4.4) for Scenarios 6a (discharge at STSTW only) and 6b (discharge at both TPSTW and STSTW). Scenario 6a would cause small increases to the baseline E.coli levels at S1 (Figure 6a7) and minimal impacts at the remaining indicator points. For Scenario 6b, impacts were observed at both S1 and W1 (Figure 6b7). These impacts are however considered small and would be restored within only a few days after termination of the discharge period due to the higher decay rate of E.coli as compared to the other parameters. The time series plots (Figures 6a6 and 6b6) showed that the E.coli impacts at W2 would be minimal under the 4-week maintenance discharge scenarios. The maintenance discharge would only cause minimal increase in the E.coli level at W2 (W2 is located at the mouth of Shing Mun River). It is therefore deduced that the Shing Mun River (which is further away from the Project discharge location) would not be adversely affected by the Project during the THEES maintenance period.
4.7.38 In summary, on the basis of the modelling results, bypass at the STSTW during THEES
maintenance would produce less impact to some nearby sensitive receivers and is recommended as far as practicable. Where not practicable to do so or the particular situation warrants, such as during overhaul of the THEES equipment at Tai Po or pigging of the
Agreement No CE 43/2001 (EP)
Tai Po Sewage Treatment Works – Stage V Drainage Services Department Final EIA Report
4-61 MAUNSELL
submarine pipeline between the Tai Po Effluent Pumping Station and the Shatin Effluent Pumping Station, the bypass will be effected at both TPSTW and STSTW.
Scenario 7 (Year 2016 24-hour emergency discharge of untreated effluent from TPSTW only)
4.7.39 Although there would be untreated effluent discharged into Tolo Harbour under Scenario 7,
such loading within a 24-hour period is much less than the total loading that would result from the discharge of treated effluent continuously for 4 weeks during the THEES maintenance under Scenario 6 for all parameters except for E.coli. The impacts under Scenario 7 would in general be much lower than the impacts under Scenario 6.
4.7.40 When comparing Scenario 7 and Scenario 6, the magnitude of increases in pollution levels
under Scenario 7 would be small. Figures 7a1 to 7a6 and Figures 7b1 to 7b6 showed some examples of the predicted elevations of pollutant levels under Scenario 7a and Scenario 7b respectively at 4 selected indicator points (W2, M4, TM6 and FC4). These 4 indicator points are relatively far away from the discharge point at TPSTW. As expected, the area that would be affected by the emergency discharges would be small under Scenario 7 and the modelling results clearly showed that the impact would be minimal at these distant receivers (W2, M4, TM6 and FC4).
Summary of Impacts
4.7.41 In summary, the model results showed that under THEES maintenance and emergency bypass
situations in 2016, the Project would cause a short-term deterioration of the water quality conditions in the inner part of Tolo Harbour. The degree of impact is related to the quality of the effluent discharged as well as the duration of discharge. The 4-week maintenance period under Scenario 6 would introduce the largest amount of pollution load into Tolo Harbour and would therefore cause the greatest water quality impact. In the model runs, elevations of pollution levels were observed immediately after the discharge of effluent during the maintenance period. The magnitude of impact decreased with increasing distance from the discharge locations. The water quality conditions were predicted to recover within 3 weeks at most after the end of the maintenance period. The potential impacts due to the 24-hour emergency discharges would be less significant. The water quality conditions would quickly recover (within a few days) after the end of the emergency period.
4.7.42 As discussed previously, a worst-case maintenance discharge duration of 4 weeks, during the
period with the highest effluent flow over a year, was assumed in the assessment. Ninety-five percentiles of the treated effluent pollution loads assumed in the model are also considered very conservative. Thus, the actual pollution load discharged during the THEES maintenance period is expected to be lower. The frequency of THEES maintenance would also be very low (only once in every 5 years) and so the elevation of pollution within Tolo Harbour would be a very transient effect.
4.7.43 Dual power supply or ring main supply from CLP, standby equipments and standby treatment
units to TPSTW will be installed under the Project. The chance of plant breakdown is therefore expected to be very remote after the Project completion. No long-term insurmountable water quality impact is expected from these temporary discharges arising during emergency situations.

Agreement No CE 43/2001 (EP)
Tai Po Sewage Treatment Works – Stage V Drainage Services Department Final EIA Report
4-62 MAUNSELL
Impact on Hoi Ha Wan Marine Park 4.7.44 The time series plots clearly show that the magnitude of impact would decrease with
increasing distance from the discharge locations. Hoi Ha Wan Marine Park is located more than 13 km away from the discharge points as compared to the monitoring points such as TM6 and FC4 which are closer to the Project discharge locations (Figure 4.4). The Project should have minimal water quality impact on the Hoi Ha Wan Marine Park during the THEES maintenance period or during emergency discharges.
Impact on Corals
4.7.45 Table 4.20 provides brief descriptions of selected coral communities identified in Tolo
Harbour and Victoria Harbour. Their locations are shown in Figures 4.3 and 4.4.
Table 4.20 Key Coral Sites in Tolo Harbour and Victoria Harbour
Coral site WSR Notes on key coral community attributes Ecological Value
Tolo Harbour (refer to Figure 4.4) Pak Sha Tau*
C1 Scattered boulders on sandy substrate and silt. 2 hard coral species (Oulastrea crispata, Goniastrea sp.) recorded with cover <5%. 1 species of gorgonian (Euplexaura sp.) up to 11-30% cover. 1 black coral species (Antipathes sp.) up to 6-10% cover.
Medium
Lo Fu Wat**
C2, C3 Degraded fringing community with high total & partial mortality. 17 coral species with ~10% cover.
-
Wong Wan Tsui*
C10 Large boulders on sand. 24 hard corals recorded (including Acropora sp., Porites sp., Goniopora spp., Montipora spp., Pavona decussata, Psammocora spp. and faviids such as Cyphastrea spp., Plesiastrea sp. and Oulastrea sp.) with sparse cover (<5%). 2 uncommon hard corals were Goniopora cellulosa and Montipora mollis. 2 black coral species (Antipathes sp. and Cirripathes sp.) up to 31-50% cover.
High
Fung Wong Fat*
C11 Large boulders supporting 27 species of hard coral (including Pavona sp., Porites sp., Goniopora sp., Psammocora spp., Montipora spp., Lithophyllon undulatum, Stylocoeniella guentheri and faviids such as Favia spp., Cyphastrea spp. Leptastrea sp. and ahermatypic Tubastrea sp.) generally < 5% cover. 4 soft corals and gorgonians (Dendronephthya sp., Echinomuricea sp. Echinogorgia sp., Euplexaura sp.) with < 5% cover. 2 black coral species (Antipathes sp. and
High

Agreement No CE 43/2001 (EP)
Tai Po Sewage Treatment Works – Stage V Drainage Services Department Final EIA Report
4-63 MAUNSELL
Coral site WSR Notes on key coral community attributes Ecological Value
Cirripathes sp.) generally with 31-50% cover. Gruff Head* C12 Boulders on sand. 12 hard corals recorded
(including Oulastrea sp., Cyphastrea sp., Turbinaria, sp. Plesiastrea sp. Porites sp., the uncommon Montipora mollis, Psammocora sp. Pavona sp., Goniopora spp. and Hydnophora sp.) with <5% cover. Also 1 gorgonian (Euplexaura sp.) recorded with <5% cover and 2 black coral species (Antipathes sp. and Cirripathes sp.) with 11-30% cover.
High
Victoria Harbour (refer to Figure 4.3) Green Island+
C9 Supports a soft coral/gorgonian community. Soft corals were Dendronephthya sp.. Gorgonians sea whips and fans were Echinogorgia complexa, Expleaxaura curvata and Ellisella gracilis.
Medium
Junk Bay++ C8 Southwest Junk bay harboured a notable area of high soft coral and gorgonian abundance (mainly Dendrophthya sp. and Euplexaura curvata) which have colonised a disused spoil ground. Also the black coral Cirripathes sp. recorded at this location.
Medium/ High
Notes: Coral sensitive receivers are limited to Tolo Channel. There are no longer coral communities of ecological value within Inner Tolo Harbour. Literature source: * ERM (2003) EIA Study on the Proposed Submarine Gas Pipelines from Cheng Tou Jiao Liquified
Natural Gas Receiving Terminal, Shenzhen to Tai Po Gas Production Plant, Hong Kong. ** McCorry D & Blackmore G (2000) Tolo revisited: a resurvey of corals and their metal burdens in Tolo
Harbour and Channel twelve years and one million people later. The Marine flora and Fauna of Hong Kong and Southern China V (ed. B Morton). Proceedings of the Tenth International Marine Biological Workshop: The Marine Flora and Fauna of Hong Kong and Southern China, Hong Kong, 2-26 April 1998. Hong Kong, Hong Kong University Press.
+ Babtie BMT (1997) Green Island Development Studies on Ecological, Water Quality and Marine Traffic Impacts. Initial Ecological and Water Quality Impact Report. Submitted to TDD.
++ M2 Environmental (2000) Tseung Kwan O Port Development at Area 131. Further Ecological Study. Submitted to TDD.
4.7.46 The predicted maximum daily sedimentation rates are presented in Table 4.21 for 2 selected
monitoring points in Tolo Harbour, namely TM6 and FC4. These 2 stations were selected as they are close to the coral sites C1 and C2 respectively, and so could also reflect the conditions at C1 and C2 respectively. The locations of TM6, FC4, C1 and C2 are shown in Figures 4.2a and 4.4. The predicted values at TM6 and FC4 ranged from 4.05 to 4.51 g/m2/day (Table 4.21). All the predicted values including those under baseline conditions, normal operation scenario and 4-week maintenance periods are well below the assessment criterion of 100g/m2/day. The coral sites C1 and C2 are closest to the Project discharge locations as compared to the remaining coral sites. It is therefore expected that there would not be any adverse impacts from sedimentation on the remaining coral sites which are further away from the Project discharge locations. The sedimentation results for the 24-hour

Agreement No CE 43/2001 (EP)
Tai Po Sewage Treatment Works – Stage V Drainage Services Department Final EIA Report
4-64 MAUNSELL
emergency scenarios are not presented in Table 4.21 as the potential impacts due to the 24-hour discharges would be less significant as compared to the 4-week maintenance discharge.
4.7.47 The predicted maximum daily sedimentation rates at the coral sites within the Victoria
Harbour were also very low (range from 4.60 to 6.60 g/m2/day) for all the assessment scenarios as compared to the assessment criterion of 100g/m2/day (Table 4.22).
4.7.48 Contour plots for annual depth-averaged daily sedimentation rates for selected scenarios (2a,
2b, 3a, 3b, 5a, 5b, 5c and 5d) are given in Figures 2a9, 2b9, 3a9, 3b9, 5a9, 5b9, 5c9 and 5d9 respectively in Appendix 4.2. There is no observable difference amongst all the assessment scenarios including the baseline scenarios. It is expected that the Project would not have any adverse impact on the corals in terms of sedimentation.
Table 4.21 Predicted Annual Average Suspended Solids and Maximum Daily
Sedimentation Rates at Corals in Tolo Harbour
Indicator Point (refer to Figure 4.4) Maximum Daily Sedimentation Rate Depth Average Suspended Solids
TM6 / C1 FC4 / C2 TM6 / C1 FC4 / C2 Scenario (g/m2/d) (g/m2/d) (mg/L) (mg/L) 2016 - Baseline (4a) 4.05 4.50 4.40 3.49 2010 - Baseline (4b) 4.06 4.51 4.50 3.58 2016 - Normal Operation (Scen 5a) 4.05 4.50 5.06 3.85 2016 - Normal Operation(Scen 5b) 4.05 4.50 5.32 3.99 2010 - Normal Operation (Scen 5c) 4.06 4.50 4.61 3.64 2010 - Normal Operation (Scen 5d) 4.06 4.51 4.67 3.67 2016 - 4-Week Maintenance (Scen 6a) 4.07 4.51 7.14 4.67 2016 - 4-Week Maintenance (Scen 6b) 4.06 4.51 7.22 4.69
Table 4.22 Predicted Maximum Daily Sedimentation Rates at Corals in Victoria Harbour
Indicator Point (refer to Figure 4.3) Maximum Daily Sedimentation Rate Depth Average Suspended Solids
Scenario C8 (g/m2/d) C9 (g/m2/d) C8 (mg/L) C9 (mg/L)
2010 – Normal Operation without the Project (Scenario 2a) 4.74 6.60 4.33 5.54 2010 – Normal Operation with the Project (Scenario 2b) 4.75 6.60 4.34 5.54
% increase due to the Project 0.2% 0% 0.2% 0%
2016 – Normal Operation without the Project (Scenario 3a) 4.60 6.53 4.26 5.35 2016 – Normal Operation with the Project (Scenario 3b) 4.60 6.53 4.26 5.36
% increase due to the Project 0% 0% 0% 0.2%
WQO requirement % increase not exceeding 30%
4.7.49 The predicted SS impacts at TM6 and FC4 (close to C1 and C2 respectively) during the
THEES maintenance period are illustrated in Figures 6a5 and 6b5 in Appendix 4.2. The time series plots indicated that the SS levels at the coral sites C1 and C2 would comply the assessment criterion of 10 mg/L during the THEES maintenance period except only at TM6 (close to C1) where the SS level would marginally exceed the criterion of 10 mg/L for only a few hours. The annual averaged SS levels predicted at TM6 and FC4 (close to C1 and C2 respectively) were all below the criterion of 10 mg/L as shown in Table 4.21. The rest of the coral sites, namely C3, C5 to C7, C10 to C12, are far away from the maintenance discharge locations and smaller SS impacts are expected. The SS impacts at TM6 and FC4 (close to C1

Agreement No CE 43/2001 (EP)
Tai Po Sewage Treatment Works – Stage V Drainage Services Department Final EIA Report
4-65 MAUNSELL
and C2 respectively) are minimal for the rest of the scenarios (7a and 7c) under 24-hour emergency conditions as illustrated in Figures 7a5 and 7b5 in Appendix 4.2.
4.7.50 It was predicted that the SS level at C1 would marginally exceed the criterion of 10 mg/L for
a few hours due to the maintenance discharge. However, this SS impact should be acceptable considering that the frequency of the THEES maintenance would be low (once every 5 years) and a very adverse scenario was assumed in the model. The 95%ile of the SS discharge standard (30 mg/L) used to calculate the SS loading in the maintenance discharge for water quality modelling is very conservative, given that the 95%ile is normally about twice their mean value. It should be stressed that the actual SS levels in the effluent of the existing TPSTW were much lower than 30 mg/L based on the past records. In addition, a worst-case maintenance discharge duration of 4 weeks during the period with the highest effluent flow over a year was assumed in the assessment. It is recommended that the maintenance of the THEES tunnel should be conducted during winter season or low flow periods if practicable. Maintenance discharges in winter seasons with less stratification and better vertical mixing as well as lower SS levels in the background sources would likely reduce the potential impact at the coral sites. Thus, the potential SS impacts simulated at C1 were likely to be much higher than the real situation that would happen. Moreover, most of the coral species recorded at C1 (Euplexaura sp. and Antipathes sp) were soft corals (not requiring light) that are less sensitive to increase in SS levels. In summary, it is expected that the Project effluent would not cause any adverse SS impact on the identified coral sites within Tolo Harbour.
4.7.51 For the coral sites in Victoria Harbour, namely C8 and C9, there is no observable difference
in the SS levels between the ‘with Project’ scenarios and ‘without Project’ scenarios for both 2010 and 2016. It is expected that the Project would not cause any adverse SS impact at the coral sites within Victoria Harbour. Table 4.22 gives the annual averaged SS levels for the corals in Victoria Harbour. As shown in Table 4.22, the predicted % increases of SS levels due to the implementation of the Project complied very well with the WQO that waste discharges shall not raise the ambient level by 30%.
Impact on Fish Cultural Zones
4.7.52 The major water quality parameter of concern for fish culture zones (FCZs) would be the SS levels. It is noted that, despite the very conservative nature of the assessment, the predicted increases in SS concentrations do not exceed tolerance thresholds established in the literature. Literature reviews indicate that lethal responses had not been reported in adult fish at values below 125 mg/L (refer to Section 4.2.15). On the other hand, guideline values have been identified for fisheries and selected marine ecological sensitive receivers as part of the recent study for AFCD (refer to Section 4.2.15) which were based on international marine water quality guidelines for the protection of ecosystems. The AFCD study recommends a maximum concentration of 50 mg/L (based on half of the ‘no observable effect concentrations’)."
4.7.53 The assessment criterion for SS is that generally it should not exceed a maximum of 50mg/L
at FCZs. The modelling results indicated that the SS levels at all the FCZs within the Tolo Harbour would well comply with the limit of 50 mg/L for all assessment scenarios. The SS level would not be elevated to levels that would cause adverse impacts on the FCZs even for the 4-week maintenance discharge scenario.
Agreement No CE 43/2001 (EP)
Tai Po Sewage Treatment Works – Stage V Drainage Services Department Final EIA Report
4-66 MAUNSELL
4.7.54 The depth-averaged and surface DO would also well comply with the recommended
continuous concentration of 5 mg/L and the minimum concentration of 2 mg/L (refer to Section 4.2.15) for all the assessment scenarios. The predicted ammonia levels would also well comply with the continuous level and maximum level of 0.7 and 1.2 mg/L respectively.
4.7.55 According to water quality modelling predictions, effluent discharge to Tolo Harbour during
the THEES tunnel maintenance would lead to elevation in chlorophyll-a to peak level of 76µg/L at the Yim Tin Tsai FCZ (Table 4.18). This FCZ is located in the vicinity of TPSTW. As shown in Figure 6c5 (see the 3rd plot from the top), this maximum value of above 70 µg/L would occur only in one occasion during the year, and the level would rapidly drop after reaching this peak value.
4.7.56 Though short-lived, the peak chlorophyll-a value of 76µg/L is considered to be high. The
WQ model results for the worst-case scenario indicates there would be a strong pulse of algal growth following the effluent discharge. Under the worst-case scenario, it cannot be ruled out that the discharge during THEES maintenance could stimulate the formation of a harmful algal bloom, which could potentially have severe impacts on fisheries operations and resources at the nearby Yim Tin Tsai FCZ. Baseline chlorophyll-a levels indicate that these waters are already very eutrophic characterised by high standing crop of algae (as measured by chlorophyll a as well as elsewhere by algal density). The phytoplankton community structure (e.g. the lack of dominance by diatoms and high relative abundance of dinoflagellates and nannoflagellates) is also indicative of the continuing eutrophic character of Tolo Harbour waters. It should also be noted that Tolo Harbour phytoplankton harbours many phytoplankton species (48) whose rapid blooming have previously caused red tide in Tolo Harbour. Although the primary concern from algal blooms is oxygen depletion, if the bloom comprises toxin-producing species, the bloom may also harm cultured fish or impact their marketability. However it should be noted that only a minority (about 10%) of blooms consist of species that synthesize phaecotoxins. In actuality, most algal blooms are non-toxic.
4.7.57 Owing to the general susceptibility of Tolo Harbour to red tide as well as the high background
chlorophyll-a level, maintenance discharge assuming worst-case scenario may have deleterious impacts on the Yim Tin Tsai FCZ. There would be a marked augmentation of algae and if this comprises toxin-producing species, the FCZ may suffer impacts. Episodic residual impacts on the FCZ therefore cannot be ruled out. However, in terms of the effects on oxygen levels, water quality model results assuming worst-case scenario indicates that oxygen levels in the surface water, where fish cages are kept, would not be depleted during the maintenance discharge. The predicted peak value of 76µg/L was based on many worst-case assumptions as discussed in Sections 4.5.41 and 4.7.31. Therefore, the actual increase of chlorophyll-a level in the inner Tolo Harbour caused by the maintenance bypass would be much smaller. If the THEES maintenance could be arranged in the effluent low flow period (such as winter) and to avoid the "blooming" season of algae (normally from April to June), the impact on FCZ due to the high chlorophyll-a could be minimised.
Impact on Beaches
4.7.58 The major parameter of concern for beaches would be the E.coli concentrations. The
modelling results indicated that the E.coli elevations caused by the Project would be minimal

Agreement No CE 43/2001 (EP)
Tai Po Sewage Treatment Works – Stage V Drainage Services Department Final EIA Report
4-67 MAUNSELL
at the beaches under normal operation scenarios (Table 4.18). All the beaches within the Tolo Harbour are non-gazetted beaches. The nearest beach to the effluent discharge point is more than 1 km away and would not be adversely affected by the Project in terms of E.coli elevation during normal operation.
4.7.59 Figures 6a6, 6a7, 6b6 and 6b7 showed the E.coli elevations during the THEES maintenance
period at 8 monitoring points (Figure 4.4) nearest to the effluent discharge points. The predicted E.coli elevations are minimal at the selected monitoring points. It is expected that discharge during THEES maintenance would not cause any E.coli impact at the beaches including Sha Lan Beach and Lung Mei Beach which are even further away from the selected monitoring points.
4.7.60 Figures 7a7 and 7b7 showed the E.coli elevations at the two nearest beaches, namely Sha
Lan (NB1) and Wu Kai Sha (NB3), during the 24-hour period of untreated effluent discharge. As shown in the figures, only a small increase in the E.coli level was predicted at Sha Lan Beach and the increase would only last for about a day. It is expected that the Project would not cause any health impact on the beach users in terms of E.coli elevations.
Impact on Seawter Intakes
4.7.61 The Tai Po and Sha Tin seawater intakes are located in close proximity to the effluent
discharge points of TPSTW and STSTW respectively. The overflow discharges during normal operation of the Project would not cause any exceedance of WSD criteria in 2010 after commissioning of the Phase 1 works. For 2016, the overflow discharges from the Project during normal operation would cause marginal exceedance of the WSD criteria for SS at the Tai Po seawater intake. However, as discussed in section 4.7.28, conservative assumptions have been made in the model for the level of SS concentration in the effluent, and actual adverse impact on the seawater intake in 2016 is unlikely.
4.7.62 The Project would cause exceedances of the WSD criteria for SS at both Tai Po and Shatin
seawater intakes under the 4-week THEES tunnel maintenance scenario. The average SS level of 30.2 mg/L was predicted at the Shatin seawater intake point (Table 4.19). Again, the conservative assumption on the SS concentration in the effluent as mentioned in section 4.7.28 is noted. In addition, a worst-case maintenance duration of 4 weeks during the period with the highest effluent flow of the year was assumed in the assessment. Thus, the predicted SS were likely much higher than the actual situation that would happen. It is recommended that silt curtain be installed at both Tai Po and Shatin seawater intakes to reduce the potential impacts during the maintenance discharge period. The silt curtains should be installed at the seawater intakes before planned maintenance of the THEES tunnel. Post project water quality monitoring will be carried out at these 2 seawater intakes after the commissioning of the project. Details of the water quality monitoring requirements are specified in the standalone EM&A Manual. To further minimize the impact on WSD seawater intakes, it is recommended that the maintenance of the THEES tunnel should be conducted during dry seasons or low flow periods and the duration requirement of 4 weeks should be reduced as far as practicable.
4.7.63 Under the worst-case scenario, the model results indicated that the E.coli levels at Tai Po
seawater intake would breach the WSD standard of 20,000 count/100mL due to the
Agreement No CE 43/2001 (EP)
Tai Po Sewage Treatment Works – Stage V Drainage Services Department Final EIA Report
4-68 MAUNSELL
emergency discharge of untreated effluent for 24 hour. Figures 7a7 and 7b7 show the duration of E.coli elevations under the emergency condition. As shown in these figures, the exceedances would last for about 3 days. However, the predicted exceedances were based on a very adverse case of 24-hour discharge of untreated effluent with a total discharge volume of 130,000 m3. Based on past record, emergency discharge of untreated effluent had occurred only once since 1995 due to CLP power supply failure at the TPSTW Stage IV inlet works. The duration of the emergency discharge was less than 3 hours with a total discharge volume of less than 9,000 m3. As dual power supply or ring main supply from CLP, standby equipments and standby treatment units will be installed under the Project, the chance of emergency discharge is expected to be very remote after the completion of the Project.
4.7.64 As a general measure, to minimize any impact on WSD seawater intake due to emergency
bypass or planned maintenance, close communication between DSD and WSD is considered to be an effective means. WSD may also consider, should it appear necessary, to shutdown the Tai Po seawater pumping station for a short period of time in order to minimize any adverse impacts. No long-term insurmountable water quality impact is expected at the WSD seawater intakes arising from the emergency bypass situation or during the THEES maintenance. Impact on Mangroves
4.7.65 It is expected that the effluent discharge from the Project would not cause any adverse impact on the existing mangroves within the Tolo Harbour, as the natural pollution tolerance (or pollution exclusion) displayed by mangroves is well documented. Recent studies of mangroves in Hong Kong and the Futien Nature Reserve in Shenzhen firmly conclude that the mangrove habitats are not adversely affected by high pollution loads, including concentrated sewage effluent. There is also considerable evidence that mangroves are unaffected by dramatic changes in salinity due to the nature of the inter-tidal habitat in which they grow (i.e. salinity levels can fluctuate from freshwater (0 parts per thousand (ppt)) to sea water (34 ppt)).
Summary of Impact
Victoria Harbour
4.7.66 Comparison between the baseline and operational modelling results suggested that the Project
would not cause any adverse impact of marine water quality in Victoria Harbour in terms of DO, TIN, UIA, SS, E.coli levels and sedimentation rates. The Project would not contribute any WQO exceedances for these parameters at any of the identified sensitive receivers in Victoria Harbour.
Tolo Harbour
Normal Operation
4.7.67 Occasional overflow of treated effluent would occur when the combined volume of storm
flow and dry weather diurnal discharges from the TPSTW exceeds the existing capacity of Tai Po effluent pumping station. For 2010 scenario, overflow at TPSTW may occasionally

Agreement No CE 43/2001 (EP)
Tai Po Sewage Treatment Works – Stage V Drainage Services Department Final EIA Report
4-69 MAUNSELL
occur only during storm events and the extent of impact is considered minor. In 2016, the design dry weather flow from TPSTW would exceed the existing capacity of the effluent pumping station even during dry weather. Subject to the actual flow quantities, a much larger amount of treated effluent may be overflowed into the Tolo Harbour as compared to 2010. As discussed in 4.7.20 and 4.7.21, the model predicted that the Project would deteriorate the water quality of Tolo Harbour in terms of DO, TIN, UIA, SS and chlorophyll-a, particularly near the outfalls in 2016. If the existing Tai Po and Sha Tin effluent pumping stations and the associated facilities are upgraded in the future as mentioned in section 4.7.25, the water quality impacts from overflow discharges would be eliminated.
THEES Maintenance Period
4.7.68 The 4-week THEES maintenance discharge would deteriorate the water quality in the inner part of Tolo Harbour. The frequency of THEES maintenance would be very low (only once in every 5 years). The predicted elevations of pollution levels would occur immediately after the occurrence of discharge and would last for only a few weeks after the end of the THEES maintenance period. It should be noted that the predicted water quality impact due to the THEES maintenance discharge was based on many worst-case assumptions. Thus, the potential water quality impacts simulated were likely much higher than the real situation that would happen. Appendix 4.7 compares the historic water quality data measured in Tolo Harbour during periods of the complete closure of the THEES with that prior to and after closure. The comparisons were based on the performance records of the THEES and the monthly EPD water quality monitoring data at Stations TM3 and TM4, which are the closest water quality monitoring stations to the TPSTW. The closure periods of the THEES are 18 May 2001 to 23 June 2001 (36 days), 31 July 2001 to 6 August 2001 (6 days) and 16 July to 6 August 2002 (21 days). It should be noted that previous shutting down of the THEES was due to the defects rectifications during the commissioning of the THEES. Reliability of the system has been improved since mid-2002 and the shut down of the THEES for maintenance is now scheduled only once every 5 years.
4.7.69 Appendix 4.7 compares the water quality data with the percentage of the total flows from the
STSTW and TPSTW which are pumped to Kai Tak Nullah via the THEES tunnel. The percentage operation of the THEES is plotted for easy reference of the time of the closure of the THEES tunnel. Zero percentage operations indicate that the THEES was shutted down and hence all treated effluent was discharged directly to the Tolo Harbour. The total volume of effluent discharged from the 2 STWs during the closure periods are 12,067,777 m3, 2,213,556 m3, and 6,396,518 m3 respectively.
4.7.70 The comparison plots showed that, despite the high volume of effluent discharges, there is no
marked increase in the pollution levels during the periods of closure of the THEES. Also, there is no correlation between the pollution levels in Tolo Harbour and the discharges from Tai Po STW. The monitoring data showed no unacceptable residual water quality impact associated with discharges to Tolo Harbour during closure of the THEES. It should be noted that the discharge volume of 12,067,777 m3 during the first closure period in 2001 is comparable with the assumed future maintenance discharge of 130,000 m3/day and 340,000 m3/day at TPSTW and STSTW respectively for 28 days (total 13,160,000 m3). Therefore, if future THEES maintenance could be arranged in the effluent low flow period (such as winter) and to avoid the "blooming" season of algae (normally from April to June), no unacceptable

Agreement No CE 43/2001 (EP)
Tai Po Sewage Treatment Works – Stage V Drainage Services Department Final EIA Report
4-70 MAUNSELL
long-term residual water quality impact is anticipated. The shut down period of the THEES should be shortened as far as possible to further reduce the water quality impact.
Emergency Discharge of Untreated Effluent
4.7.71 The emergency discharge of untreated effluent would also deteriorate the water quality in the
inner part of Tolo Harbour. The extent of impact would be much lower than that from the maintenance of THEES for all parameters except for E.coli. It was predicted that there would be E.coli exceedance at the Tai Po seawater intake. Under the worst-case scenario, the predicted recovery period for the impact due to emergency bypass of untreated effluent would be short (within a few days). No long-term insurmountable water quality impact is expected from these temporary discharges. It should be noted that the predicted impacts were based on an adverse case of 24-hour discharge of untreated effluent with a total discharge volume of 130,000 m3. As already mentioned in 4.7.63, based on past record, emergency discharge of untreated effluent had occurred only once since 1995 due to CLP power supply failure at TPSTW Stage IV inlet works. The duration of the emergency discharge was less than 3 hours with a total discharge volume of less than 9,000 m3. There has been no complaint received by the AFCD from the nearby fisheries in the past, on any water quality impact associated with the emergency by-pass of untreated effluent. As dual power supply or ring main supply from CLP, standby pumps, standby treatment units and equipment will be installed under the Project, the chance of emergency discharge is expected to be very remote after the Project completion.
4.8 Mitigation of Adverse Environmental Impacts
Construction Phase Construction Site Runoff and General Construction Activities
4.8.1 To minimise the potential water quality impacts from construction site runoff and various
construction activities, the practices outlined in ProPECC PN 1/94 Construction Site Drainage should be adopted. A copy of the ProPECC PN 1/94 is given in Appendix 4.3. It is recommended to install perimeter channels in the works areas to intercept runoff at site boundary prior to the commencement of any earthwork. To prevent storm runoff from washing across exposed soil surfaces, intercepting channels should be provided. Drainage channels are also required to convey site runoff to sand/silt traps and oil interceptors. Provision of regular cleaning and maintenance can ensure the normal operation of these facilities throughout the construction period. Any practical options for the diversion and re-alignment of drainage should comply with both engineering and environmental requirements in order to ensure adequate hydraulic capacity of all drains. Minimum distances of 100 m should be maintained between the discharge points of construction site runoff and the existing WSD saltwater intake at Tai Po.
4.8.2 There is a need to apply to EPD for a discharge licence for discharging effluent from the
construction site. The discharge quality is required to meet the requirements specified in the discharge licence. All the runoff and wastewater generated from the works areas should be treated so that it satisfies all the standards listed in the TM-DSS. Reuse and recycling of the treated effluent can minimise water consumption and reduce the effluent discharge volume.
Agreement No CE 43/2001 (EP)
Tai Po Sewage Treatment Works – Stage V Drainage Services Department Final EIA Report
4-71 MAUNSELL
The beneficial uses of the treated effluent may include dust suppression, wheel washing and general cleaning. It is anticipated that the wastewater generated from the works areas would be of small quantity. Monitoring of the discharge quality of treated effluent should be part of the Environmental Monitoring and Audit (EM&A) programme. Detailed effluent sampling programme for water quality control during construction phase should be submitted to EPD for approval prior to commencement of the construction works. Details of the monitoring requirements are specified in a separate EM&A Manual.
4.8.3 The construction programme should be properly planned to minimise soil excavation, if any,
in rainy seasons. This prevents soil erosion from exposed soil surfaces. Any exposed soil surfaces should also be properly protected to minimise dust emission. In areas where a large amount of exposed soils exist, earth bunds or sand bags should be provided. Exposed stockpiles should be covered with tarpaulin or impervious sheets at all times. The stockpiles of materials should be placed at locations away from any stream courses so as to avoid releasing materials into the water bodies. Final surfaces of earthworks should be compacted and protected by permanent work. It is suggested that haul roads should be paved with concrete and the temporary access roads protected using crushed stone or gravel, wherever practicable. Wheel washing facilities should be provided at all site exits to ensure that earth, mud and debris would not be carried out of the works areas by vehicles.
4.8.4 Good site practices should be adopted to clean the rubbish and litter on the construction sites
so as to prevent the rubbish and litter from spreading from the site area. It is recommended to clean the construction sites on a regular basis.
Sewage from Workforce
4.8.5 The presence of construction workers generates sewage. It is recommended to provide
sufficient chemical toilets in the works areas. The toilet facilities should be more than 30 m from any watercourse. A licensed waste collector should be deployed to clean the chemical toilets on a regular basis. The construction workers can also make use of the existing toilet facilities within the TPSTW as necessary.
4.8.6 Notices should be posted at conspicuous locations to remind the workers not to discharge any
sewage or wastewater into the nearby environment during the construction phase of the project. Regular environmental audit on the construction site can provide an effective control of any malpractices and can achieve continual improvement of environmental performance on site. It is anticipated that sewage generation during the construction phase of the project would not cause water pollution problem after undertaking all required measures.
Accidental Spillage of Chemicals
4.8.7 Contractor must register as a chemical waste producer if chemical wastes would be produced
from the construction activities. The Waste Disposal Ordinance (Cap 354) and its subsidiary regulations in particular the Waste Disposal (Chemical Waste) (General) Regulation should be observed and complied with for control of chemical wastes.
4.8.8 Any service shop and maintenance facilities should be located on hard standings within a
bunded area, and sumps and oil interceptors should be provided. Maintenance of vehicles and

Agreement No CE 43/2001 (EP)
Tai Po Sewage Treatment Works – Stage V Drainage Services Department Final EIA Report
4-72 MAUNSELL
equipment involving activities with potential for leakage and spillage should only be undertaken within the areas appropriately equipped to control these discharges.
4.8.9 Disposal of chemical wastes should be carried out in compliance with the Waste Disposal
Ordinance. The Code of Practice on the Packaging, Labelling and Storage of Chemical Wastes published under the Waste Disposal Ordinance details the requirements to deal with chemical wastes. General requirements are given as follows:
• Suitable containers should be used to hold the chemical wastes to avoid leakage or
spillage during storage, handling and transport. • Chemical waste containers should be suitably labeled, to notify and warn the personnel
who are handling the wastes, to avoid accidents. • Storage area should be selected at a safe location on site and adequate space should be
allocated to the storage area. Operation Phase
4.8.10 The modelling results indicated that pollution levels would quite significantly increase during
THEES maintenance as treated effluent would be discharged into Tolo Harbour. Shutdown of the THEES, if unavoidable, should be shortened as far as possible. However, it should be noted that the frequency of THEES maintenance would be very low (once in every 5 years), and as discussed in 4.7.68 to 4.7.70, historical data do not indicate any particular concern. The predicted elevations of pollution levels would last up to a few weeks after the end of the discharge period. It is recommended that the maintenance of the THEES tunnel should be conducted during winter season or low flow periods and to avoid the "blooming" season of algae (normally from April to June) if practicable. Relevant government departments including EPD and WSD should be informed of the THEES maintenance event prior to any discharge. Furthermore, to mitigate the potential impacts at the Tai Po and Shatin seawater intakes, silt curtains will be installed at these 2 intakes during the period for the maintenance of THEES tunnel. An event and action plan and a detailed water quality monitoring programme for the THEES maintenance discharge is given in a standalone EM&A Manual.
4.8.11 Emergency discharges from the effluent pumping stations and TPSTW would be the
consequence of pump failure, interruption of the electrical power supply or failure of treatment units. Dual power supply or ring main supply from CLP should be provided to prevent the occurrence of power failure. In addition, standby facilities for the main treatment units and standby equipment parts / accessories should also be provided in order to minimize the chance of emergency discharge. The occurrence of such emergency events would therefore be very remote.
4.8.12 To provide a mechanism to minimise the impact of emergency discharges and facilitate
subsequent management of any emergency, an emergency contingency plan has been formulated by DSD to clearly state the response procedure in case of pumping stations or sewage treatment works failure. The existing contingency plan developed by DSD is attached in Appendix 4.5. The plant operators of TPSTW should closely communicate with WSD in order to minimize any impact on WSD seawater intake due to emergency bypass or planned maintenance. WSD may also consider to shutdown the Tai Po seawater pumping

Agreement No CE 43/2001 (EP)
Tai Po Sewage Treatment Works – Stage V Drainage Services Department Final EIA Report
4-73 MAUNSELL
station for a short period of time in order to minimize any adverse impacts, should such be necessary.
4.8.13 It is recommended to perform regular dye test once every 2 years for the detection of any
leakage of the submarine pipeline within Tolo Harbour. The procedures to be followed in the event that pipe leakage is suspected or identified are given in a standalone EM&A Manual.
4.9 Evaluation of Residual Impact
Construction Phase
4.9.1 The construction phase water quality impact would generally be temporary and localised
during construction. No unacceptable residual water quality impacts would be expected during the construction phase of the Project, provided that all the recommended mitigation measures are properly implemented.
Operation Phase
4.9.2 Adverse water quality impact at Victoria Harbour associated with normal operation of the
Project is not expected. The water quality impact at Tolo Harbour would also be acceptable under the 2010 scenario after commissioning of the Phase 1 works. For 2016, the model predicted that the Project would not cause new WQO exceedance but there would be aggravation of the present WQO exceedances. If the capacities of Tai Po and Shatin effluent pumping stations are upgraded, no residual water quality impacts would be expected for the operation of the Project.
4.9.3 The water quality impact due to the THEES maintenance discharge and emergency
discharges is expected to be short-term. Mitigation measures, including dual power supply or ring main supply from CLP, standby equipments and treatment units would be provided to minimise the occurrence of any emergency discharge. In the remote case that it occurs, an emergency contingency plan has been formulated to minimise the impact of emergency discharges and facilitate subsequent management of the emergency. The THEES maintenance period will be shortened as far as possible and will be conducted during winter season or low flow periods and to avoid the "blooming" season of algae (normally from April to June) if practicable. The plant operators of TPSTW should closely communicate with WSD in case of any emergency bypass and THEES maintenance discharge. No insurmountable water quality impact is expected from these temporary discharges provided that all the recommended mitigation measures are properly implemented.
4.10 Environmental Monitoring and Audit 4.10.1 Monitoring of effluent quality is recommended for operational stage and under the
perspective of the WPCO. Parameters to be monitored include pH, BOD5, SS, TIN, NH3-N and E.coli. Details of the requirements for water quality monitoring are presented in a standalone EM&A Manual.
4.10.2 A post project monitoring (PPM) programme will be implemented to confirm the water
quality predictions for Victoria Harbour made in the EIA report. The PPM would consist of

Agreement No CE 43/2001 (EP)
Tai Po Sewage Treatment Works – Stage V Drainage Services Department Final EIA Report
4-74 MAUNSELL
one-year baseline monitoring before commissioning and one-year impact monitoring after commissioning of the Project. The extent of PPM programme is subject to the prevailing environmental conditions at the time before commissioning of the Project. A more detailed description of the PPM requirements for Victoria Harbour is given in the standalone EM&A Manual.
4.10.3 A PPM programme will be also implemented in the Tolo Harbour during the operational
phase. The PPM would involve water quality monitoring at the Tai Po and Shatin seawater intakes during the first wet season (June to August) after full commissioning of the Project. Marine water quality parameters including SS and NH3-N should be monitored. The water quality monitoring frequency should be twice per month and should cover the effects of different tidal status (at least one for high tide and one for low tide) for each seawater intake..
4.10.4 Marine water quality monitoring is recommended in Tolo Harbour during emergency
discharge or THEES maintenance period. Marine water quality parameters such as SS, BOD5, E.coli, chlorophyll-a, TIN and NH3-N should be monitored. A six-month baseline monitoring programme covering both dry and wet seasons is proposed at a frequency of once per month to establish the baseline water quality conditions at selected monitoring points. In case of emergency discharge, daily marine water monitoring should be conducted throughout the whole discharge period until the normal water quality resumes or at least 1 week after the normal plant operation is restored, whichever is longer. For THEES maintenance, marine water quality data should be collected throughout the whole discharge period at a frequency of 3 times per week until the baseline water quality is restored or at least 4 weeks after the end of maintenance period.
4.11 Conclusions
Construction Phase
4.11.1 Minor water quality impact would be associated with land-based construction, including
demolition of existing facilities and installation of new infrastructural works. Impacts may result from the surface runoff and sewage from on-site construction workers. Impacts could be controlled to comply with the WPCO standards by implementing the recommended mitigation measures. Unacceptable residual impacts on water quality would not be expected.
Operation Phase
4.11.2 An assessment of water quality impact due to the operation of the Project was made using the
Delft3D model. Impacts were assessed over a series of one-year simulation periods. Although the model input parameters were conservative, comparison between the baseline and operational water quality modelling results suggested that there should be no adverse impact on the marine water quality in Victoria Harbour during normal operation of the TPSTW after commissioning of the Project. To cope with the potential impact of effluent from TPSTW (and STSTW) into Tolo Harbour due to overflow discharges during normal operation of the TPSTW, inclusion of upgrading of Tai Po effluent pumping station and the associated facilities into the public works programme is being undertaken by EPD. Nevertheless, for 2010 scenario, overflow at TPSTW may occasionally occur only during
Agreement No CE 43/2001 (EP)
Tai Po Sewage Treatment Works – Stage V Drainage Services Department Final EIA Report
4-75 MAUNSELL
storm events and the extent of impact is considered minor. Mitigation measures, including dual power supply or ring main supply from CLP, standby pumps, treatment units and equipment, would be provided to avoid the occurrence of any emergency discharge. An emergency contingency plan has been formulated to minimise the impact of emergency discharges and facilitate subsequent management of the emergency. The THEES maintenance period will be shortened as far as possible and will be conducted during winter season or low flow periods and to avoid the "blooming" season of algae (normally from April to June) if practicable. An event and action plan and a detailed EM&A programme are recommended to collect water quality information and to mitigate the potential impact due to emergency discharge and during THEES tunnel maintenance. The monitoring results shall be employed to identify areas for any further necessary mitigation measures to avoid, rectify and eliminate environmental damage associated with the Project.