multivariate assessment of water quality in the utcubamba
TRANSCRIPT
33 Tecnología y ciencias del agua, 9(5), 33-57, DOI:10.24850/j-tyca-2018-05-02
DOI:10.24850/j-tyca-2018-05-02
Articles
Multivariate Assessment of Water Quality in the Utcubamba Basin (Peru)
Fernando Corroto1
Oscar Gamarra2
Elgar Barboza3
1Instituto de Investigación para el Desarrollo Sustentable de Ceja de
Selva, Universidad Nacional Toribio Rodríguez de Mendoza, Peru, [email protected] 2Instituto de Investigación para el Desarrollo Sustentable de Ceja de
Selva, Universidad Nacional Toribio Rodríguez de Mendoza, Peru,
[email protected] 3Instituto de Investigación para el Desarrollo Sustentable de Ceja de Selva, Universidad Nacional Toribio Rodríguez de Mendoza, Peru,
Correspondence author: Fernando Corroto,
Abstract
The increase in population in the Utcubamba River basin without the corresponding implementation of wastewater treatment systems by
the authorities has led to a decrease in water quality, which constitutes
a threat to public health and the ecosystem preservation. The objective of this work was to reduce the data collected in large
hydrographic basins, both at the sampling stations level and at the level of variables. Sampling was carried out at 43 sites located in the
main channel and major tributaries, and their physicochemical and microbiological quality were analyzed through the determination of 19
variables during three different seasons (early rains, rainfall and drought). Multivariate statistical methods (correlation analysis,
principal component analysis and cluster analysis) were applied to find the cause of natural or anthropogenic sources of pollution and its
distribution in the basin. The results show that the main parameters that spatially affect the basin are a result of high concentrations of
bacteria and chemical compounds such as nitrites, phosphates and ammonium. Finally, the use of multivariate methodologies to analyze

34 Tecnología y ciencias del agua, 9(5), 33-57, DOI:10.24850/j-tyca-2018-05-02
the obtained results allows to reduce the number of variables as well as sampling stations for future evaluations.
Keywords: Water quality, principal component analysis, cluster
analysis, Utcubamba River.
Received: 02/01/2017
Accepted: 15/03/2018
Introduction
The tropical Andes are, hydrologically, one of the most diverse regions
on the planet (Crespo et al., 2011). Generally, high Andean fluvial ecosystems are important in rural and urban sectors (Acosta, Ríos,
Rieradevall, & Prat, 2009), and their basins provide favorable living conditions through the availability of water for agriculture, livestock,
industry and / or human consumption. The water quality in these ecosystems mainly depends on different anthropogenic factors
(Álvarez-Cabria, Barquín, & Peñas, 2016) that modify the natural variability of rivers, affecting their physicochemical (Carrera & Gunkel,
2003; Villamarín, Prat, & Rieradevall, 2014), microbiological (Calizaya-Anco, Avendaño-Cáceres, & Delgado-Vargas, 2013; Chamorro et al.,
2013) and hydromorphological characteristics (Hamilton, Kellndorfer,
Lehner, & Tobler, 2007; Struth, Babault, & Teixell, 2015).
However, the disturbances suffered in the high Andean basins also have a natural origin, such as the strong altitudinal gradient that
characterizes these mountains (Jacobsen, 2004), which together with the seasonal variation in rainfall, generate soil degradation (Correa,
Mello, Chou, Curi, & Norton, 2016) that makes rivers transport a significant amount of material. Both anthropogenic and natural origins
strongly effect the concentration of pollutants in water (Vega, Pardo, Barrado, & Debán, 1998).
Given that seasonal variations at tropical latitudes are very accentuated, and are marked fundamentally by the rainfall regime,
temporal and spatial assessments at the basin level, and the relationship with environmental and human factors, are key to the
design of measures for the sustainable use of water resources in these areas (Velázquez-Machuca, Pimentel-Equihua, & Ortega-Escobar, 2010
). For a correct interpretation of the results obtained from the temporal
35 Tecnología y ciencias del agua, 9(5), 33-57, DOI:10.24850/j-tyca-2018-05-02
and spatial monitoring of water in basins, the application of multivariate statistical tools, such as principal components analysis
(PCA) and cluster analysis (AC), is very effective (Vieira et al., 2012). These methodologies have been used over recent years to analyze
data in diverse aquatic ecosystems (e.g., Picado et al., 2008; Olsen, Chappell, & Loftis, 2012; Wang et al., 2013), with some related
studies in South America (Dos Santos, De Oliveira, Bruns, & Gennari, 2004; Villegas, Paredes, Betancur, & Ribeiro, 2013).
This research was carried out based on data collected in the
Utcubamba River basin (Peru) during three different sampling
campaigns (2014-2015), for the purpose of reducing a wide range of information. This includes annual evaluations in complete river basins,
which are sometimes difficult to interpret and examine. In this way, correspondences between physicochemical and microbiological
variables will be evaluated, as well as the main sources of pollution and their distribution in the Utcubamba River basin.
Methodology
Description of the Study Area
The Utcubamba River basin, situated in northern Peru, in the
Department of Amazonas (Figure 1), is located between 5 32' 36'' and
6 50' 49'' south latitude, and 72 22' 49'' and 78 29' 59'' west
longitude. The main channel is approximately 250 km long and occupies an area of 6 650.07 km2. The source is located in the Punta
de Arena hill (Chachapoyas province) at 4 130 masl, and flows into the Marañón River (Bagua province) at 360 masl.

36 Tecnología y ciencias del agua, 9(5), 33-57, DOI:10.24850/j-tyca-2018-05-02
Figure 1. Study area in the Utcubamba River basin, Amazonas, Peru.
The middle and lower basins are located in ecosystems with seasonally dry tropical forests, which include the valleys of the Marañón,
Chamaya, Chinchipe and Utcubamba rivers (Linares-Palomino, 2004).
The upper basin corresponds to the montane pluvial forests located in the high portion of the eastern slope and the strip between the
Huancabamba and Chinchipe rivers (León, Pitman, & Roque, 2006).
The Utcubamba basin contains a total of 220 048 inhabitants, and its main urban centers are the cities of Leymebamba, Chachapoyas, Pedro
Ruíz Gallo, Bagua Grande, Cajaruro, El Milagro and Bagua (INEI, 2009). The main pollutant loads in the basin come from domestic
wastewater in these large population centers, in addition to livestock and agricultural runoff.
Selection of Sampling Stations
A total of 43 sampling stations were selected (Figure 2) following and
adapting the methodology established by Freshwater Ecology and

37 Tecnología y ciencias del agua, 9(5), 33-57, DOI:10.24850/j-tyca-2018-05-02
Management to evaluate the ecological status of the Mediterranean rivers (Prat, Rieradevall, & Fortuño, 2012). The main tributaries
included were: San Miguel (EM-2), El Chorro (EM-4), Pauca (EM-6), Singache (EM-9), Cedrocucho (EM-11), Yuyac (EM-13), Rumiyacu (EM-
15), Tosán (EM-17), Sonche (EM-20), Cocahuayco (EM-22), El Chido (EM-24), Tingo (EM-27), Magunchal (EM-30), Naranjos (EM-32),
Honda (EM-33), Goncha (EM-37), San Juan (EM-40), and La Peca (EM-41).

38 Tecnología y ciencias del agua, 9(5), 33-57, DOI:10.24850/j-tyca-2018-05-02
Figure 2. Sampling stations (EM) in the Utcubamba River basin,
Amazonas, Peru.
Sampling and Data Collection

39 Tecnología y ciencias del agua, 9(5), 33-57, DOI:10.24850/j-tyca-2018-05-02
Water samples were collected between 2014 and 2015, during three
sampling campaigns that coincided with the early rainy season (throughout the month of October 2014), the rainy season (March
2015), and the dry season (August 2015).
For the collection of samples, the monitoring protocol of the sanitary quality of surface water resources was followed, established by the
General Directorate of Environmental Health of Peru (Digesa, 2007). The physicochemical and microbiological analyses were conducted
according to APHA procedures (APHA, 2005).
The parameters studied were established according to the polluting
activities in the basin, which were 19 in total: dissolved oxygen (DO), electrical conductivity (CE), temperature (T), pH, turbidity (TURB),
nitrates (NITRA), nitrites (NITRI), phosphates (FOSFA), sulfates (SULFA), ammonium (AMO), chemical oxygen demand (COD), 5-day
biochemical oxygen demand (BOD), alkalinity (ALCA), chlorides (CLO), hardness (DUR), total coliforms (CT), fecal coliforms (CF), Escherichia
coli (EC), and fecal enterococci (EF).
Statistical analyses
The data obtained were entered into a Microsoft Excel spreadsheet and analyzed with Past 3.0 software (Hammer, Harper, & Ryan, 2001).
Essentially, two statistical methodologies were used: principal component analysis (PCA) and cluster analysis (CA). The PCA is used
to synthesize information among the established variables, and eliminate collinearity among them, creating new variables (principal
components – PCs) that are not correlated. In this way, the first principal component (PC 1) accounts for the highest proportion of the
variance (Terrades, 2002). The CA is a technique that uses information from a set of variables related to an object, to divide the data into
classes based on their similarity. Once the similarity is measured, they are grouped into homogeneous groups that are different from each
other. For the CA, the Euclidean distance was used as the distance of measurement, and the grouping method used was the Ward method,
through which the variables or the sampling stations could be grouped
in a hierarchical way so as to minimize a certain function and form a new group with the two objects with the lowest distance (Hair,
Anderson, Tatham, & Black, 1999). The main objective of the Ward

40 Tecnología y ciencias del agua, 9(5), 33-57, DOI:10.24850/j-tyca-2018-05-02
method is to unite, at each step of the clustering process, the two classes that result in lower intra-class inertia ( Pardo & Del Campo,
2007).
In conclusion, the overall reasons why these two statistical tests were used are those noted by Vieira et al. (2012), and are summarized
below:
(1) Group the sampling stations according to water quality in order to
optimize the number of sampling stations and thereby reduce the number of samplings for future evaluations.
(2) Identify the correlated variables in order to reduce the number of
variables to be analyzed per sample, thereby reducing the cost of future monitoring.
Finally, the significant differences between the concentrations of the variables analyzed were evaluated with the help of correlation matrices
for the three different sampling campaigns. The correlation coefficient established as significant was below 0.01 (p < 0.01).
Results and discussion
Correlation of Variables and Sources of Contamination
To establish the existing correlation between the variables selected for
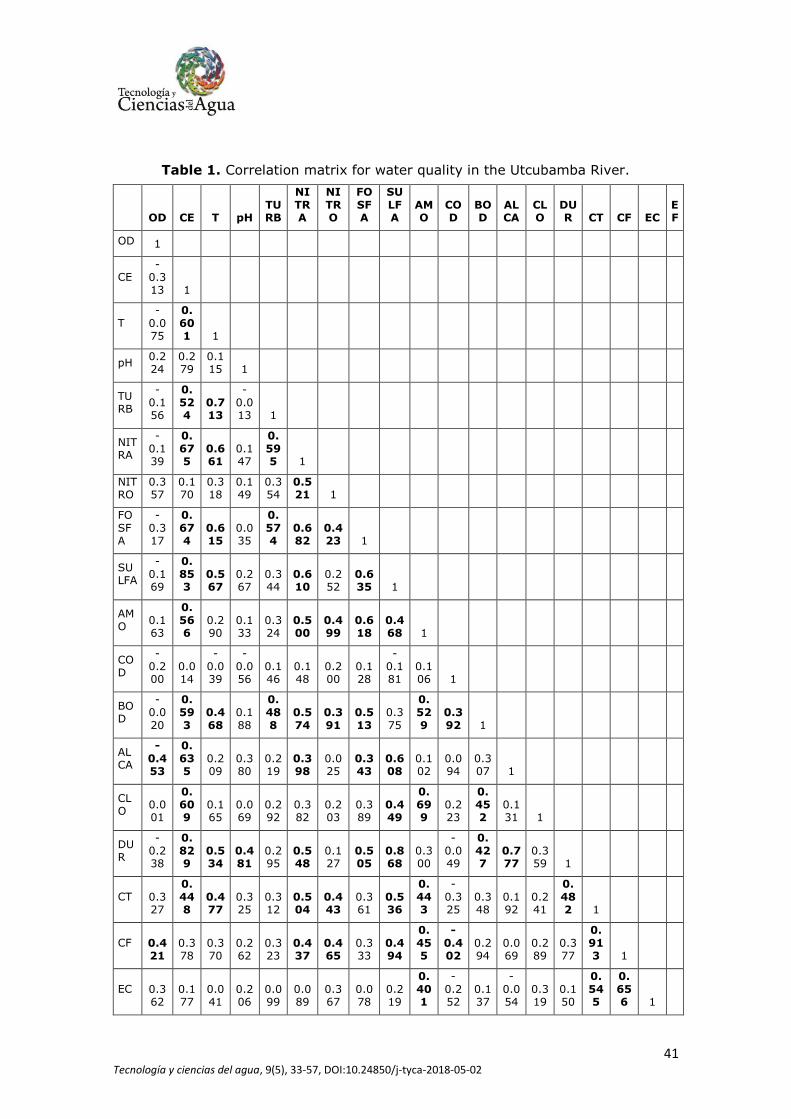
this study, a correlation matrix was generated (Table 1), in which the statistically significant correlation coefficients (with a significance level
of 0.01) are marked in bold. There were high correlations between all the microbiological variables (CT and CF, CT and EC, CT and EF, CF
and EC, CF and EF, and EC and EF). The Environmental Protection Agency recommends the use of Escherichia coli and members of the
genus Enterococcus as indicators of fecal contamination in surface waters (USEPA, 2000). The appearance of large concentrations of
Escherichia coli, which inhabits the intestines of homeothermic animals (Sunantha & Vasudevan, 2016), whose reproduction outside the
intestine of these animals is favored by the existence of adequate organic matter and pH conditions (Prescott, Harley, & Klein, 1996;
Arcos-Pulido, Ávila-de-Navia, Estupiñán-Torres, & Gómez-Prieto, 2005)
is found in much of the Utcubamba River basin.
41 Tecnología y ciencias del agua, 9(5), 33-57, DOI:10.24850/j-tyca-2018-05-02
Table 1. Correlation matrix for water quality in the Utcubamba River.
OD CE T pH TURB
NITRA
NITRO
FOSFA
SULFA
AMO
COD
BOD
ALCA
CLO
DUR CT CF EC
EF
OD 1
CE -
0.313 1
T -
0.075
0.601 1
pH
0.224
0.279
0.115 1
TURB
-0.156
0.524
0.713
-0.013 1
NITRA
-0.139
0.675
0.661
0.147
0.595 1
NITRO
0.357
0.170
0.318
0.149
0.354
0.521 1
FOSFA
-0.317
0.674
0.615
0.035
0.574
0.682
0.423 1
SULFA
-0.169
0.853
0.567
0.267
0.344
0.610
0.252
0.635 1
AMO
0.163
0.566
0.290
0.133
0.324
0.500
0.499
0.618
0.468 1
COD
-0.200
0.014
-0.039
-0.056
0.146
0.148
0.200
0.128
-0.181
0.106 1
BOD
-0.020
0.593
0.468
0.188
0.488
0.574
0.391
0.513
0.375
0.529
0.392 1
ALCA
-0.453
0.635
0.209
0.380
0.219
0.398
0.025
0.343
0.608
0.102
0.094
0.307 1
CLO
0.001
0.609
0.165
0.069
0.292
0.382
0.203
0.389
0.449
0.699
0.223
0.452
0.131 1
DUR
-0.238
0.829
0.534
0.481
0.295
0.548
0.127
0.505
0.868
0.300
-0.049
0.427
0.777
0.359 1
CT 0.327
0.448
0.477
0.325
0.312
0.504
0.443
0.361
0.536
0.443
-0.325
0.348
0.192
0.241
0.482 1
CF 0.421
0.378
0.370
0.262
0.323
0.437
0.465
0.333
0.494
0.455
-0.402
0.294
0.069
0.289
0.377
0.913 1
EC 0.362
0.177
0.041
0.206
0.099
0.089
0.367
0.078
0.219
0.401
-0.252
0.137
-0.054
0.319
0.150
0.545
0.656 1
42 Tecnología y ciencias del agua, 9(5), 33-57, DOI:10.24850/j-tyca-2018-05-02
EF 0.308
0.519
0.417
0.166
0.463
0.526
0.490
0.461
0.527
0.778
0.027
0.430
0.078
0.617
0.330
0.611
0.615
0.484 1
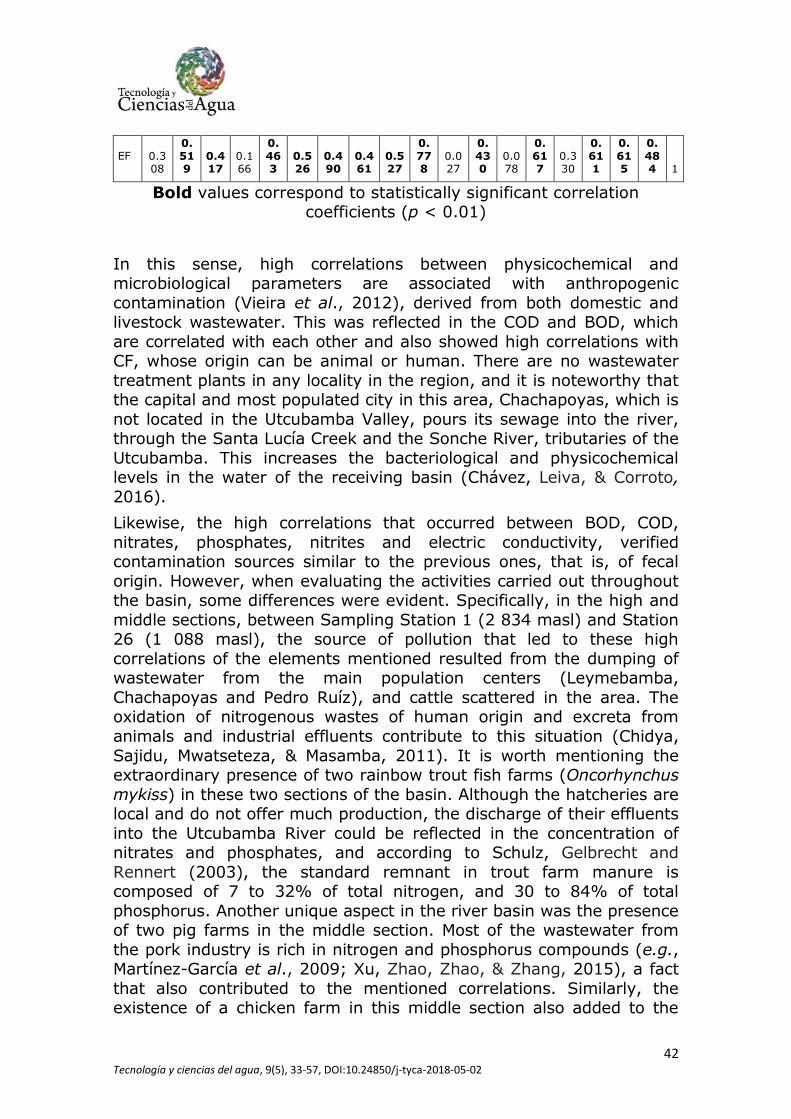
Bold values correspond to statistically significant correlation coefficients (p < 0.01)
In this sense, high correlations between physicochemical and microbiological parameters are associated with anthropogenic
contamination (Vieira et al., 2012), derived from both domestic and livestock wastewater. This was reflected in the COD and BOD, which
are correlated with each other and also showed high correlations with CF, whose origin can be animal or human. There are no wastewater
treatment plants in any locality in the region, and it is noteworthy that the capital and most populated city in this area, Chachapoyas, which is
not located in the Utcubamba Valley, pours its sewage into the river, through the Santa Lucía Creek and the Sonche River, tributaries of the
Utcubamba. This increases the bacteriological and physicochemical levels in the water of the receiving basin (Chávez, Leiva, & Corroto,
2016).
Likewise, the high correlations that occurred between BOD, COD,
nitrates, phosphates, nitrites and electric conductivity, verified contamination sources similar to the previous ones, that is, of fecal
origin. However, when evaluating the activities carried out throughout the basin, some differences were evident. Specifically, in the high and
middle sections, between Sampling Station 1 (2 834 masl) and Station 26 (1 088 masl), the source of pollution that led to these high
correlations of the elements mentioned resulted from the dumping of wastewater from the main population centers (Leymebamba,
Chachapoyas and Pedro Ruíz), and cattle scattered in the area. The oxidation of nitrogenous wastes of human origin and excreta from
animals and industrial effluents contribute to this situation (Chidya,
Sajidu, Mwatseteza, & Masamba, 2011). It is worth mentioning the extraordinary presence of two rainbow trout fish farms (Oncorhynchus
mykiss) in these two sections of the basin. Although the hatcheries are local and do not offer much production, the discharge of their effluents
into the Utcubamba River could be reflected in the concentration of nitrates and phosphates, and according to Schulz, Gelbrecht and
Rennert (2003), the standard remnant in trout farm manure is composed of 7 to 32% of total nitrogen, and 30 to 84% of total
phosphorus. Another unique aspect in the river basin was the presence of two pig farms in the middle section. Most of the wastewater from
the pork industry is rich in nitrogen and phosphorus compounds (e.g., Martínez-García et al., 2009; Xu, Zhao, Zhao, & Zhang, 2015), a fact
that also contributed to the mentioned correlations. Similarly, the existence of a chicken farm in this middle section also added to the

43 Tecnología y ciencias del agua, 9(5), 33-57, DOI:10.24850/j-tyca-2018-05-02
presence in the river of the compounds mentioned, especially AMO, which increases with the increase of stock in poultry farms (Rossignol,
Paerl, Fear, & Braddy, 2011).
In contrast, the correlations between the physicochemical variables mentioned in the lower section, between Sampling Station 27 (880
masl) and Station 43 (386 masl), corresponded to agricultural development. The dry valley of Bagua has had agricultural activity
over the last 25 years, mainly for the seeding of rice in pools, and consequently a great percentage of the valley has been deforested for
this purpose. In the provinces of Bagua and Utcubamba, this crop has
an annual production of around 250 000 metric tons, making it the most important agricultural crop in the region in terms of volume and
value of production (Peru-IIAP, 2008). The seasonal distribution of NITRA, FOSFA, CLO and AMO in the lower section of the Utcubamba
River is related to the application of chemical fertilizers in the agricultural areas of the drainage area, with diammonium phosphate
(DAP), urea, and ammonium chloride being the most used in the region. Since nitrates are not well retained by soils because they are
not used quickly by plants, they are lost through drainage (Martínez-García et al., 2009; Arias, Pérez, & Rueda, 2004). DAP, a source of
nitrogen (18%) and phosphate (20%) (Tanaka, Diagne, & Saito, 2015), is universally used in rice cultivation (Wopereis-Pura,
Watanabe, Moreira, & Wopereis, 2002; Solaraj, Dhanakumar, Murthy, & Mohanraj, 2010; Zhang, Gao, Fan, Lan, & Zhao, 2017) and is
considered the most widely used phosphate fertilizer (Azizullah, Nasir,
Richter, Lebert, & Häder, 2011). Urea contains 46% nitrogen (Zou, Lu, Li, & Li 2011) and is usually used in a complementary way with DAP.
Its drainage in soils and its direct drainage caused the high concentrations of these three chemical parameters in the water in
Utcubamba. In addition to the large bacterial load that reaches this section of the basin, there is also the discharge of untreated domestic
waters from the cities of Bagua Grande and Bagua, the most populated in the study section.
Finally, the high correlation found between DUR and ALCA was also
common in several studies (e.g., Segnini & Chacón, 2005; Chidya et
al., 2011) and is caused by the geology of the study area, which is composed mainly of calcites and dolomites, giving the pH of the soil a
basic character.
PCA of the variables studied

44 Tecnología y ciencias del agua, 9(5), 33-57, DOI:10.24850/j-tyca-2018-05-02
The selection of the number of principal components (PCs) and the
classification of the influence of the variables in each PC were based on the research line reported by Vieira et al. (2012) on the Lis River
(Portugal), which was adapted. Thus, regarding the selection of the number of PCs, the eigenvalues greater than 1 were chosen (Kaiser,
1958). The first five PCs were selected accordingly, which represented 80.50% with respect to the original variance. The values
corresponding to each of these five PCs were classified based on the influence of the variables in each one, resulting in values ≥ 0.3 being
those that contributed the most (Table 2). Thus, there were 13 variables that contributed the most, out of the initial 19. These data
are similar to those obtained by Singh, Malik, Mohan and Sinha (2004) in his study of the Gomti River using multivariate statistical
techniques, where as a result of the PCA their variables were reduced from 24 to 14, explaining 71% of the total variance of the data set.
Table 2. Obtained values and PCA values for water quality variables. Bold values correspond to the variables that contribute significantly in each PC.
PC 1 PC 2 PC 3 PC 4 PC 5
OD -0.003 0.488 0.026 0.051 0.264
CE 0.311 -0.202 -0.100 0.107 -0.159
T 0.250 -0.096 0.021 -0.457 0.086
pH 0.116 0.056 -0.326 0.310 0.525
TURB 0.226 -0.099 0.216 -0.372 0.032
NITRA 0.290 -0.103 0.108 -0.184 0.124
NITRO 0.191 0.211 0.252 -0.084 0.369
FOSFA 0.273 -0.160 0.149 -0.160 -0.119
SULFA 0.300 -0.114 -0.242 0.028 -0.164
AMO 0.260 0.132 0.242 0.257 -0.200
COD 0.007 -0.224 0.467 0.289 0.357
BOD 0.242 -0.086 0.238 0.113 0.249
ALCA 0.172 -0.328 -0.302 0.188 0.173
CLO 0.215 0.017 0.210 0.430 -0.349
DUR 0.269 -0.200 -0.331 0.123 0.075
CT 0.257 0.271 -0.201 -0.148 0.058
CF 0.241 0.346 -0.170 -0.138 -0.035

45 Tecnología y ciencias del agua, 9(5), 33-57, DOI:10.24850/j-tyca-2018-05-02
EC 0.142 0.377 -0.088 0.159 -0.131
EF 0.272 0.216 0.157 0.104 -0.142
Own
values 7.732 2.964 2.041 1.392 1.165
In PC 2, the variables with the most influence (CF, EC, and OD) were associated with fecal contamination that occurs throughout the basin.
The first two, CF and EC, were directly related to fecal waste, both human and animal (Gemmell & Schmidt, 2012), and the DO can be
linked to changing physicochemical conditions caused by suspended bacteria that are indicators of fecal contamination in water (Tshibanda
et al., 2014). Meanwhile, in PC 3, the presence of pH, DUR and ALCA, variables with the greatest contribution, was associated with the
chemical characteristics of the water, resulting from the chemical properties of the calcareous soil existing in the basin. PC 5 was
moderately influenced by pH, NITRO, COD and CLO. This group of associated variables was similar to that determined by Arpajón et al.
(2011), in their study conducted in the Almendrares River (Cuba), where the presence of large concentrations of nitrites in the water
reflected organic contamination of fecal origin from populated areas.
In PC 4, the contribution of the TURB had its origin in the seasonality
of the region, with the rainy season having a direct affect on this physical characteristic of water. In addition, variables such as pH and
CLO reappeared, which could be a result of fecal contamination, however their presence together with the TURB prevents finding a
common origin.
CA of the variables studied
The CA made it possible to create groups of variables according to their similarity (Figure 3). The groups formed (GF) were broadly the
following:
46 Tecnología y ciencias del agua, 9(5), 33-57, DOI:10.24850/j-tyca-2018-05-02
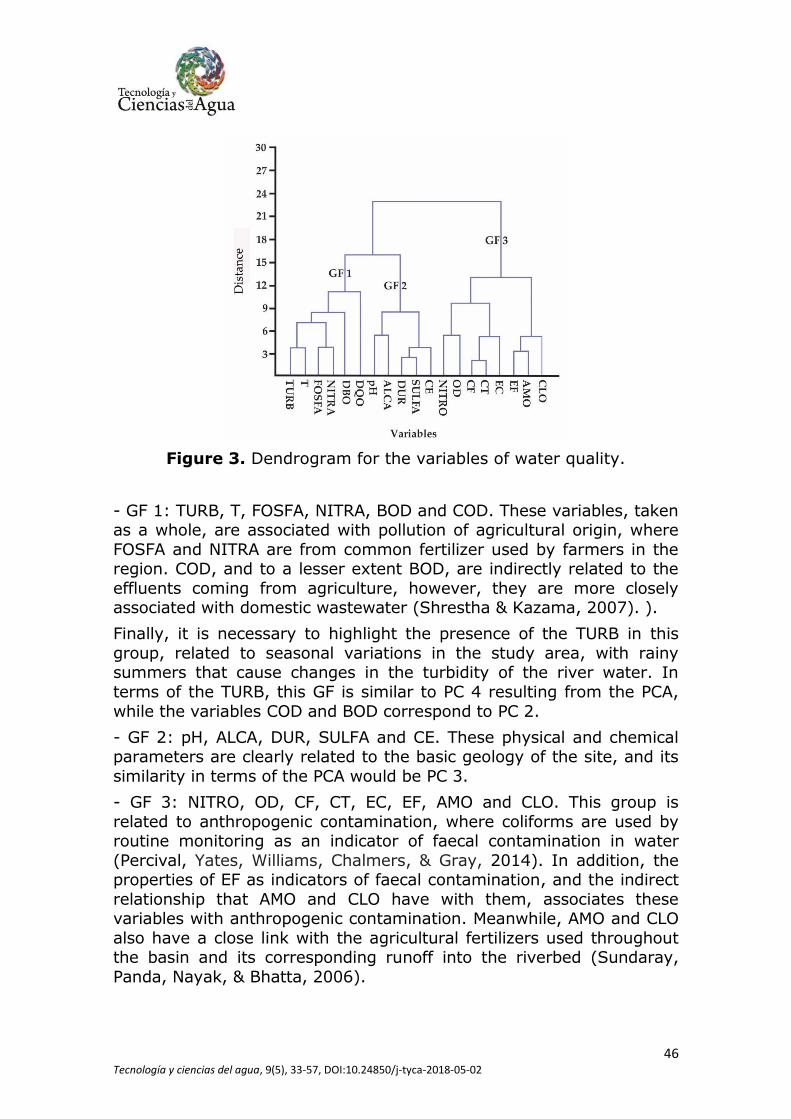
Figure 3. Dendrogram for the variables of water quality.
- GF 1: TURB, T, FOSFA, NITRA, BOD and COD. These variables, taken as a whole, are associated with pollution of agricultural origin, where
FOSFA and NITRA are from common fertilizer used by farmers in the region. COD, and to a lesser extent BOD, are indirectly related to the
effluents coming from agriculture, however, they are more closely associated with domestic wastewater (Shrestha & Kazama, 2007). ).
Finally, it is necessary to highlight the presence of the TURB in this
group, related to seasonal variations in the study area, with rainy summers that cause changes in the turbidity of the river water. In
terms of the TURB, this GF is similar to PC 4 resulting from the PCA,
while the variables COD and BOD correspond to PC 2.
- GF 2: pH, ALCA, DUR, SULFA and CE. These physical and chemical parameters are clearly related to the basic geology of the site, and its
similarity in terms of the PCA would be PC 3.
- GF 3: NITRO, OD, CF, CT, EC, EF, AMO and CLO. This group is
related to anthropogenic contamination, where coliforms are used by routine monitoring as an indicator of faecal contamination in water
(Percival, Yates, Williams, Chalmers, & Gray, 2014). In addition, the properties of EF as indicators of faecal contamination, and the indirect
relationship that AMO and CLO have with them, associates these variables with anthropogenic contamination. Meanwhile, AMO and CLO
also have a close link with the agricultural fertilizers used throughout the basin and its corresponding runoff into the riverbed (Sundaray,
Panda, Nayak, & Bhatta, 2006).
47 Tecnología y ciencias del agua, 9(5), 33-57, DOI:10.24850/j-tyca-2018-05-02
The GF 3 was found to be significantly associated with PC 2 in terms of the faecal origin of water contamination.
These groups are similar to those formed as a product of the cluster
analysis in the Cértima River basin (Portugal) (Figueiredo et al., 2012), which are primarily divided according to two groups: pollution derived
from agricultural effluents and contamination derived from animal and human effluents.
PCA of the Sampling Stations
The same methodology previously used for the analysis of the
variables was followed, but in this case the objective was to evaluate the spatial variation through the examination of the 43 sampling
stations. In this case, the number of PCs from the PCA (with
eigenvalues greater than 1) was eight, which accounted for 80.18% of the variance (Table 3). Thus, the number of sampling stations was
reduced from 43 to 10.
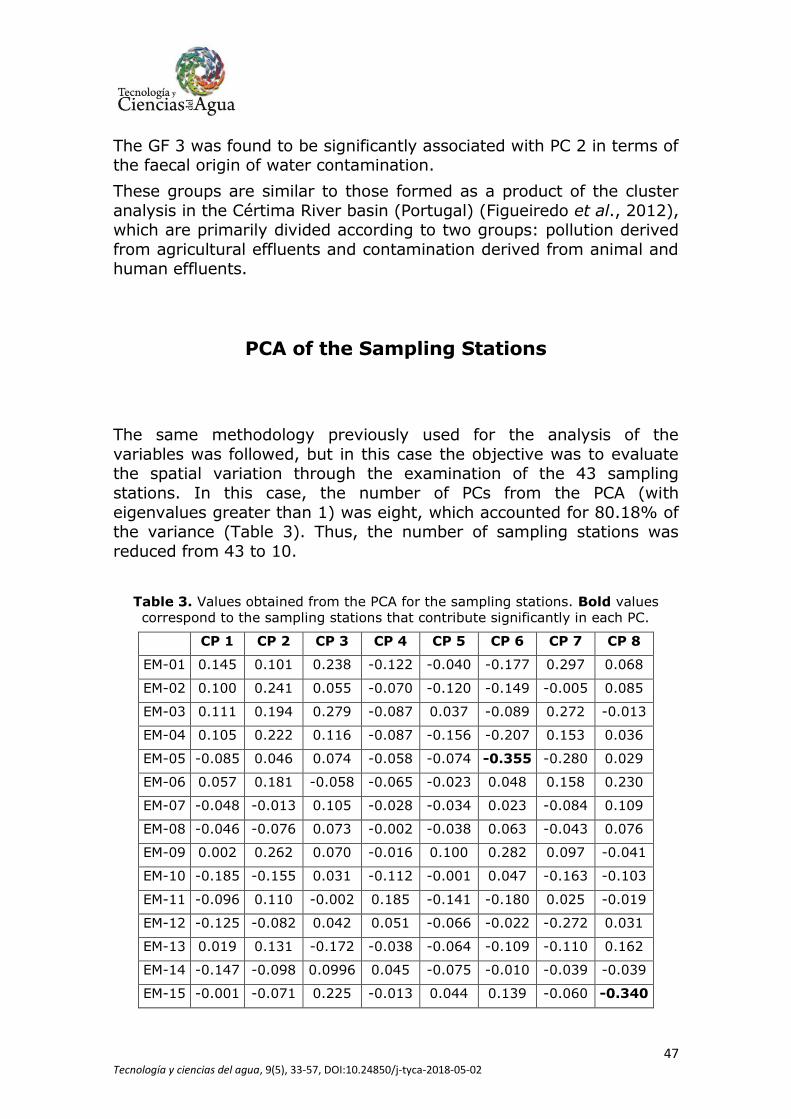
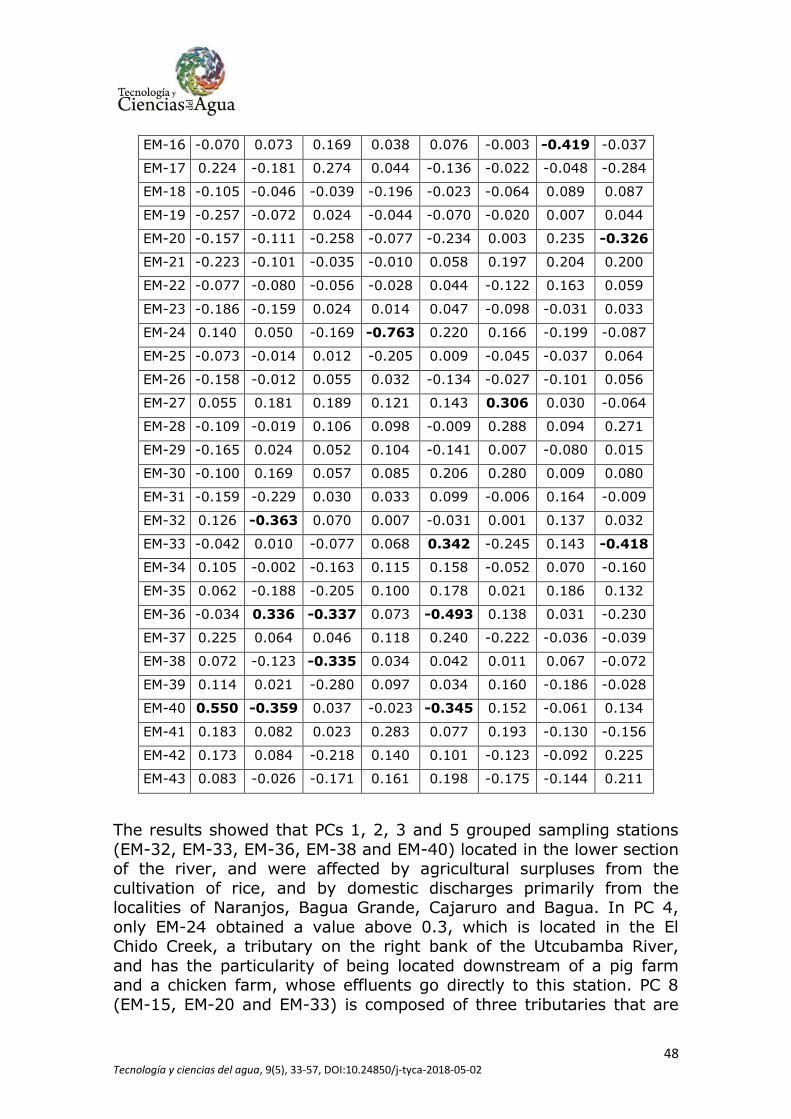
Table 3. Values obtained from the PCA for the sampling stations. Bold values correspond to the sampling stations that contribute significantly in each PC.
CP 1 CP 2 CP 3 CP 4 CP 5 CP 6 CP 7 CP 8
EM-01 0.145 0.101 0.238 -0.122 -0.040 -0.177 0.297 0.068
EM-02 0.100 0.241 0.055 -0.070 -0.120 -0.149 -0.005 0.085
EM-03 0.111 0.194 0.279 -0.087 0.037 -0.089 0.272 -0.013
EM-04 0.105 0.222 0.116 -0.087 -0.156 -0.207 0.153 0.036
EM-05 -0.085 0.046 0.074 -0.058 -0.074 -0.355 -0.280 0.029
EM-06 0.057 0.181 -0.058 -0.065 -0.023 0.048 0.158 0.230
EM-07 -0.048 -0.013 0.105 -0.028 -0.034 0.023 -0.084 0.109
EM-08 -0.046 -0.076 0.073 -0.002 -0.038 0.063 -0.043 0.076
EM-09 0.002 0.262 0.070 -0.016 0.100 0.282 0.097 -0.041
EM-10 -0.185 -0.155 0.031 -0.112 -0.001 0.047 -0.163 -0.103
EM-11 -0.096 0.110 -0.002 0.185 -0.141 -0.180 0.025 -0.019
EM-12 -0.125 -0.082 0.042 0.051 -0.066 -0.022 -0.272 0.031
EM-13 0.019 0.131 -0.172 -0.038 -0.064 -0.109 -0.110 0.162
EM-14 -0.147 -0.098 0.0996 0.045 -0.075 -0.010 -0.039 -0.039
EM-15 -0.001 -0.071 0.225 -0.013 0.044 0.139 -0.060 -0.340
48 Tecnología y ciencias del agua, 9(5), 33-57, DOI:10.24850/j-tyca-2018-05-02
EM-16 -0.070 0.073 0.169 0.038 0.076 -0.003 -0.419 -0.037
EM-17 0.224 -0.181 0.274 0.044 -0.136 -0.022 -0.048 -0.284
EM-18 -0.105 -0.046 -0.039 -0.196 -0.023 -0.064 0.089 0.087
EM-19 -0.257 -0.072 0.024 -0.044 -0.070 -0.020 0.007 0.044
EM-20 -0.157 -0.111 -0.258 -0.077 -0.234 0.003 0.235 -0.326
EM-21 -0.223 -0.101 -0.035 -0.010 0.058 0.197 0.204 0.200
EM-22 -0.077 -0.080 -0.056 -0.028 0.044 -0.122 0.163 0.059
EM-23 -0.186 -0.159 0.024 0.014 0.047 -0.098 -0.031 0.033
EM-24 0.140 0.050 -0.169 -0.763 0.220 0.166 -0.199 -0.087
EM-25 -0.073 -0.014 0.012 -0.205 0.009 -0.045 -0.037 0.064
EM-26 -0.158 -0.012 0.055 0.032 -0.134 -0.027 -0.101 0.056
EM-27 0.055 0.181 0.189 0.121 0.143 0.306 0.030 -0.064
EM-28 -0.109 -0.019 0.106 0.098 -0.009 0.288 0.094 0.271
EM-29 -0.165 0.024 0.052 0.104 -0.141 0.007 -0.080 0.015
EM-30 -0.100 0.169 0.057 0.085 0.206 0.280 0.009 0.080
EM-31 -0.159 -0.229 0.030 0.033 0.099 -0.006 0.164 -0.009
EM-32 0.126 -0.363 0.070 0.007 -0.031 0.001 0.137 0.032
EM-33 -0.042 0.010 -0.077 0.068 0.342 -0.245 0.143 -0.418
EM-34 0.105 -0.002 -0.163 0.115 0.158 -0.052 0.070 -0.160
EM-35 0.062 -0.188 -0.205 0.100 0.178 0.021 0.186 0.132
EM-36 -0.034 0.336 -0.337 0.073 -0.493 0.138 0.031 -0.230
EM-37 0.225 0.064 0.046 0.118 0.240 -0.222 -0.036 -0.039
EM-38 0.072 -0.123 -0.335 0.034 0.042 0.011 0.067 -0.072
EM-39 0.114 0.021 -0.280 0.097 0.034 0.160 -0.186 -0.028
EM-40 0.550 -0.359 0.037 -0.023 -0.345 0.152 -0.061 0.134
EM-41 0.183 0.082 0.023 0.283 0.077 0.193 -0.130 -0.156
EM-42 0.173 0.084 -0.218 0.140 0.101 -0.123 -0.092 0.225
EM-43 0.083 -0.026 -0.171 0.161 0.198 -0.175 -0.144 0.211
The results showed that PCs 1, 2, 3 and 5 grouped sampling stations
(EM-32, EM-33, EM-36, EM-38 and EM-40) located in the lower section of the river, and were affected by agricultural surpluses from the
cultivation of rice, and by domestic discharges primarily from the localities of Naranjos, Bagua Grande, Cajaruro and Bagua. In PC 4,
only EM-24 obtained a value above 0.3, which is located in the El Chido Creek, a tributary on the right bank of the Utcubamba River,
and has the particularity of being located downstream of a pig farm and a chicken farm, whose effluents go directly to this station. PC 8
(EM-15, EM-20 and EM-33) is composed of three tributaries that are

49 Tecnología y ciencias del agua, 9(5), 33-57, DOI:10.24850/j-tyca-2018-05-02
affected by pollution from the discharge of solid waste upstream of them. The Sonche River (EM-20) is the main receiver of these wastes,
which are generated in the city of Chachapoyas. Finally, PC 6 (EM-5 and EM-27) and PC 7 (EM-16) showed a relationship with the
hydrogeomorphological transformation that have occurred at their sampling stations from the establishment of quarries, which have a
negative impact, especially on the physical quality of the water. Despite this, these three stations were characterized by moderate
pollution.
CA of the Sampling Stations
The groups from the CA were somewhat different than those of the
PCA, resulting in three GFs in the cluster of sampling stations (Figure 4). The similarity with the PCA was mainly found in the lower section
of the river, where sampling stations EM-32, EM-17, EM-40, EM-39, EM-38, EM-35, EM-34, EM-43, EM-42, EM-41, EM-37, EM-33, EM-36
and EM-24 were grouped into GF 3 (PCs 1, 2, 3, 4 and 5 of the PCA). Although stations 17 and 24 did not belong to this section of the basin,
these presented common characteristics in terms of fecal contamination, either of human or animal origin. The dendrogram
extracted from the CA reflected two other GFs, which were categorized according to their level of contamination: medium or low. This last
division is the one reported by Singh, Malik and Sinha (2005), who divided the Gomti River basin (India) into three groups according to
the pollution they presented: high, moderate and medium. Thus, in the present study, GF 1 was mainly composed of tributaries with small
volumes and without large anthropogenic effects. The contamination
was accentuated in GF 2, consisting of sampling stations located in the main channel and in large tributaries. The stations located in the main
basin were downstream of the first locality in the study (Leymebamba), EM-5, which discharges its domestic waste into the
river. It is noteworthy that the EMs located in the middle section, such as 25, 26, 28, 29 and 31, which presumably should have a
contamination of fecal origin similar to those grouped in GF 3, appeared in GF 2. This can be explained by this section of the basin
having a greater slope than the others, with steep drop-offs, which Domenech, Ollero and Sánchez-Fabre (2008) describe as a "fluvial
course with a closed canon valley." The waterfalls in this section

50 Tecnología y ciencias del agua, 9(5), 33-57, DOI:10.24850/j-tyca-2018-05-02
oxygenate the water (Gonzalo & Camargo, 2013) and help to decompose the accumulated organic matter coming from the farms
and populations located upstream.
Figure 4. Dendrogram for the sampling stations.
Conclusions
The results obtained from the physicochemical and microbiological evaluation of water in the Utcubamba River basin show a deterioration
in its quality due to discharges of anthropogenic, agricultural and livestock wastewater, taking into account that there is no municipal
treatment infrastructure anywhere in the region. There is a huge pollution load from domestic fecal waste, mainly in the lower section of
the river, based on the high concentrations of indicator bacteria such as Escherichia coli and fecal Enterococci, in addition to compounds
such as nitrites, ammonium and phosphates obtained.
Multivariate statistical methods, such as the PCA, were used to divide
the basin into eight PCs with similar characteristics. A CA was used to divide the basin into three GFs, in such a way that each of them
indicated a different level of contamination.
In this way, the multivariate statistical techniques used served as an excellent exploratory tool in the analysis and interpretation of the
51 Tecnología y ciencias del agua, 9(5), 33-57, DOI:10.24850/j-tyca-2018-05-02
temporal and spatial variations present throughout the Utcubamba River basin, since it was possible to reduce both the number of
variables (from 19 to 13) and the number sampling stations (from 43 to 10). Since this is the only study that has been conducted in the
Utcubamba River basin, the situation could be reevaluated by further investigations in the near future.
Acknowledgements
To the Programa Nacional de Innovación para la Competitividad y
Productividad - FINCyT (Contrato N° 221-FINCyT-IA-2013) for the
support provided for conducting this research.