municipal and city level estimates - psa.gov.ph
TRANSCRIPT
2003 City and Municipal Level Poverty Estimates
Republika ng PilipinasPAMBANSANG LUPON SA UGNAYANG PANG-ESTADISTIKA(NATIONAL STATISTICAL COORDINATION BOARD)http://www.nscb.gov.ph
in cooperation with
The WORLD BANK
23 March 2009Makati City, Philippines
2003 City and MunicipaNSCB/WB Intercensal
For d
2003 City and Municipal Level Poverty Estimates is a publication prepared by the Poverty, Labor, Human Development, and Gender Statistics Division
of the NATIONAL STATISTICAL COORDINATION BOARD (NSCB). For technical inquiries, please contact us at: (632) 896-7981 or email us at [email protected].
TERMS OF USE OF NSCB PUBLICATIONS The NSCB reserves its exclusive right to reproduce all its publications in whatever form. • Any part of this publication should not be reproduced, recopied, lent or repackaged for other parties
for any commercial purposes without written permission from the NSCB. • Any part of this publication may only be reproduced for internal use of the recipient/customer company. •
Should any portion of the data in this publication be included in a report/article, the title of the publication and the NSCB as publisher should be cited as the source of the data. • Any
information derived from the processing of data contained in this publication will not be the responsibility of NSCB.
Published by the National Statistical Coordination Board
Midland Buendia Building 403 Sen. Gil Puyat Avenue
Makati City 1200 Philippines
with funding assistance from the
World Bank
23 March 2009
The 2003 City and Municipal Level Poverty Estimates is available in electronic formats (Excel/Word/PDF in CDRom).
etails, please contact us at (632) 890-8456 or at [email protected].
l Level Poverty Estimates Page ii Updating of Small Area Poverty Estimates
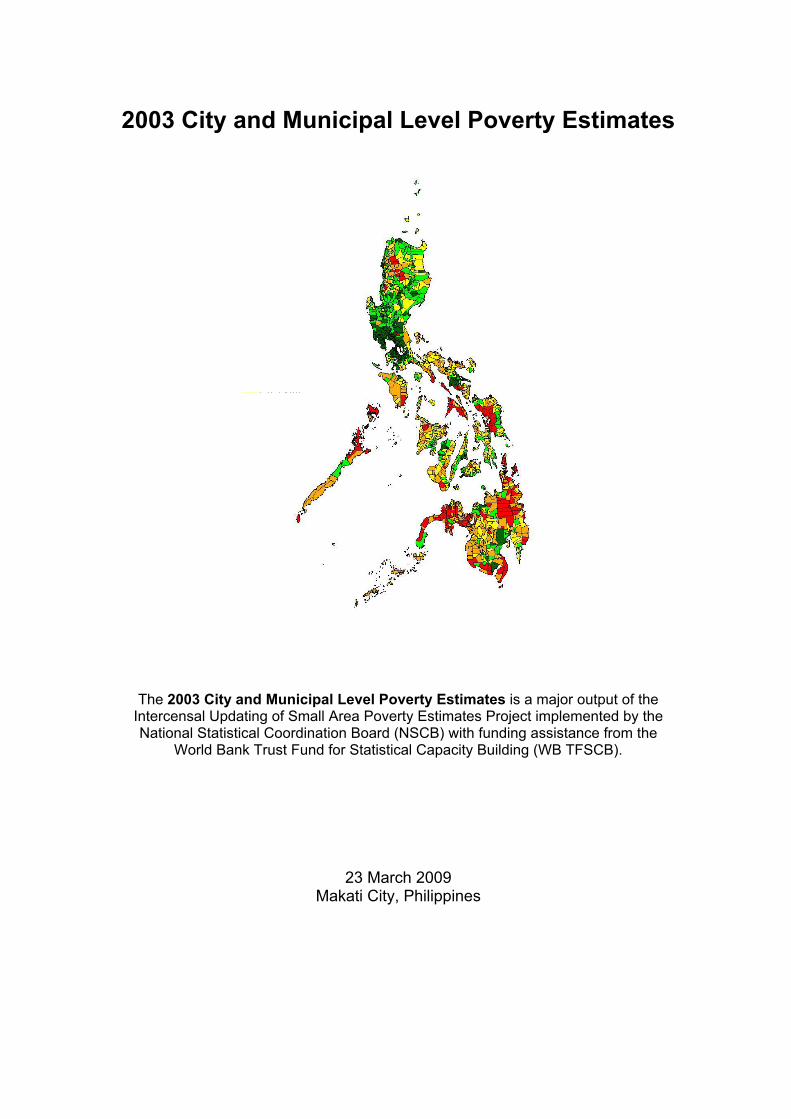
2003 City and Municipal Level Poverty Estimates
The 2003 City and Municipal Level Poverty Estimates is a major output of the Intercensal Updating of Small Area Poverty Estimates Project implemented by the National Statistical Coordination Board (NSCB) with funding assistance from the
World Bank Trust Fund for Statistical Capacity Building (WB TFSCB).
23 March 2009 Makati City, Philippines
2003 City and Municipal Level Poverty Estimates Page i NSCB/WB Intercensal Updating of Small Area Poverty Estimates
FOREWORD
This report features the 2003 small area poverty estimates (SAPE) for the 1,622 cities and municipalities in the country as part of the output of the Intercensal Updating of Small Area Poverty Estimates Project. The project was implemented by the National Statistical Coordination Board (NSCB) with funding assistance from the World Bank Trust Fund for Statistical Capacity Building (WB TFSCB). It is a follow-up study to the NSCB project on Poverty Mapping in the Philippines funded through the WB-Asia Europe Meeting Trust Fund, which generated provincial and municipal level poverty estimates for 2000 using small area estimation (SAE) techniques.
The SAE methodology employed in the project combined survey and census data to produce reliable poverty estimates at lower levels of geographic disaggregation. The SAE methodology was based on Elbers, Lanjouw and Lanjouw (ELL) methodology developed by the WB, which was modified to come up with estimates even during intercensal years. The methodology combined the data from the 2003 Family Income and Expenditure Survey (FIES), 2003 Labor Force Survey (LFS) and 2000 Census of Population and Housing (CPH) to estimate 2003 poverty incidence, poverty gap, and severity for all cities and municipalities in the country. We acknowledge the valuable assistance provided by the Project Technical Adviser, Dr. Peter Lanjouw of the WB, and the Project Consultants, Dr. Roy van der Weide also of the WB and Dr. Zita VJ. Albacea of the University of the Philippines Los Baños (UPLB). We also express our deepest appreciation to Mr. Karl Kendrick Chua, the Project Task Team Leader of the WB, for his encouraging support in this undertaking and for his untiring efforts to help us improve the Philippine Statistical System. This report also highlights actual policy uses in the Philippines as well as in other countries and the relevance of the project outputs to national policymaking. Thus, it is hoped that the results of this project will help local communities and policymakers in the formulation of appropriate programs and improvements in targeting schemes aimed at reducing poverty. ROMULO A. VIROLA Secretary General National Statistical Coordination Board
23 March 2009
Table of Contents Page I. Introduction 1
II. 2003 City and Municipal Level Poverty Estimates 3
A. 2003 Poorest Cities and Municipalities Across the Nation 3
1. Poorest 40 Municipalities in 2003 6
2. 40 Municipalities in 2003 with Highest Poverty Gap 8
3. 40 Municipalities in 2003 with Highest Severity of Poverty 10
4. Critical Municipalities in Terms of Three Poverty Measures 12
B. 2003 Poorest Cities and Municipalities: The Regional Situation 14
III. Actual Policy Uses 36
A. Philippines 36
B. Other Country Experiences 40
IV. Conclusions and Recommendations 42
V. Annex 43
A. Definition of Terms 44
B. Methodology 46
1. Overview 46
2. Data Sources 49
3. Implementation of the Methodology 50
a. Introduction/Background 50
b. Selection of Explanatory Variables 51
c. Statistical Modeling 56
d. Production and Selection of Regional Models 57
4. Limitations of the Study 63
C. Validation Workshops 66
1. Objectives 66
2. Mechanics 66
3. Workshop Design 67
4. Validation Forms 69
5. Matrix of Findings 74
D. Advocacy 76
E. Lessons Learned 80
F. 2003 Small Area Poverty Estimates 81
References
Project Staff
2003 City and Municipal Level Poverty Estimates Page ii NSCB/WB Intercensal Updating of Small Area Poverty Estimates
Introduction
The Millennium Development Goals (MDGs), which affirmed commitments of member
countries of the United Nations towards reducing the worst forms of human
deprivation, has as its primary goal halving poverty by 2015. Towards the achievement
of this goal, it is imperative that policy- and decision-makers have access to
subnational information on the poverty situation as program interventions are
implemented and done at the local level.
The National Statistical Coordination Board (NSCB), under Executive Order No. 352
issued in 1996, Designation of Statistical Activities that will Generate Critical Data for
Decision-making of the Government and the Private Sector, generates and release the
country’s official poverty statistics using the official poverty estimation methodology as
approved in NSCB Resolution No. 1 Series of 2003 Approving the Proposed
Methodology for the Computation of Provincial Poverty Statistics. Poverty incidence
and other measures of poverty are directly estimated using the Family Income and
Expenditure Survey (FIES) collected by the National Statistics Office (NSO) every
three years. Due to limited resources of the government and the Philippine Statistical
System (PSS), these are available only at the national, regional, and provincial levels.
With increasing clamor for lower disaggregation of poverty statistics, the NSCB
embarked on a Poverty Mapping Project with funding assistance from the World Bank
Asia Europe Meeting (ASEM) Trust Fund in 2004. This Project made possible the
release of 2000 poverty estimates for all the 1,623 municipalities in the country through
small area estimation in 2005. Small area estimation is a statistical methodology that
allows the estimation at lower levels of disaggregation by combining data from other
sources such as the census, in addition to information collected from a survey. A
variant of this methodology, called the Elbers, Lanjouw and Lanjouw (ELL) Method,
was applied in this Project using the 2000 Census of Population and Housing (CPH),
4th Round of the 2000 Labor Force Survey (LFS) and 2000 FIES.
Recognizing the need to update these 2000 city and municipal level poverty estimates,
the NSCB implemented the “Intercensal Updating of Small Area Poverty Estimates
Project” in 2006 through the World Bank Trust Fund for Statistical Capacity Building
(WB TFSCB). The study aims to explore the possibility of generating reliable 2003 city
2003 City and Municipal Level Poverty Estimates Page 1 NSCB/WB Intercensal Updating of Small Area Poverty Estimates
and municipal level poverty estimates using a slight modification of the ELL
Methodology used in the earlier Project, using 2000 census data.
It is hoped that the results of this Project like the earlier initiative, will be a useful guide
to local government units, policy makers and program implementers in
formulating/designing intervention programs aimed at reducing poverty.
2003 City and Municipal Level Poverty Estimates Page 2 NSCB/WB Intercensal Updating of Small Area Poverty Estimates
II. 2003 City and Municipal Level Poverty Estimates
A. 2003 Poorest Cities and Municipalities Across the Nation
A total of 1,622 municipal and city level poverty estimates were generated for the year
2003 using the small area estimation technique discussed in the Annex section.
Annex F gives the complete list of these estimates. Based on the results, the poorest
municipality is Siayan of Zamboanga del Norte with a poverty incidence of 97.5
percent and coefficient of variation (CV) equal to 1.4 percent. This municipality is
located seven hours away from the poblacion. The figure indicates that 97.5 percent
or almost all of the municipality residents are poor. Siayan is a third class municipality1
with a population of 34,588 in 2007 Census of Population (PopCen) and has fishing
and farming as its main source of livelihood.
On the other hand, the least poor residents are found in Binondo, where the biggest
Chinatown in the City of Manila is located, with poverty incidence placed at 1.1
percent. In this area with a population of 12,100 in 2007 PopCen, only one out of
every ten residents is considered in poverty. However, this estimate has a CV equal to
86 percent. It should be noted that it is generally believed that the reliability of an
estimate is within acceptable level, if its CV is low, which is at most 20 percent.
On the average, the municipality and city level poverty incidence estimates is
less than 50 percent, with a reported average value of 37.5 percent. Thus, on
the average, around four out of every ten residents of a municipality or city are
said to be poor. Table 1 shows the distribution of the poverty incidences at the
municipality and city level estimates. As shown in the table, almost half (48
percent) of the 1,622 municipalities and cities have estimates ranging from 25
percent to 50 percent. Only 2 percent of the municipalities (36 out of 1,622)
have higher than 75 percent poverty incidence.
1 Income classification is based on the Department of Finance’ Order No. 20-05, effective July 29, 2005.
2003 City and Municipal Level Poverty Estimates Page 3 NSCB/WB Intercensal Updating of Small Area Poverty Estimates
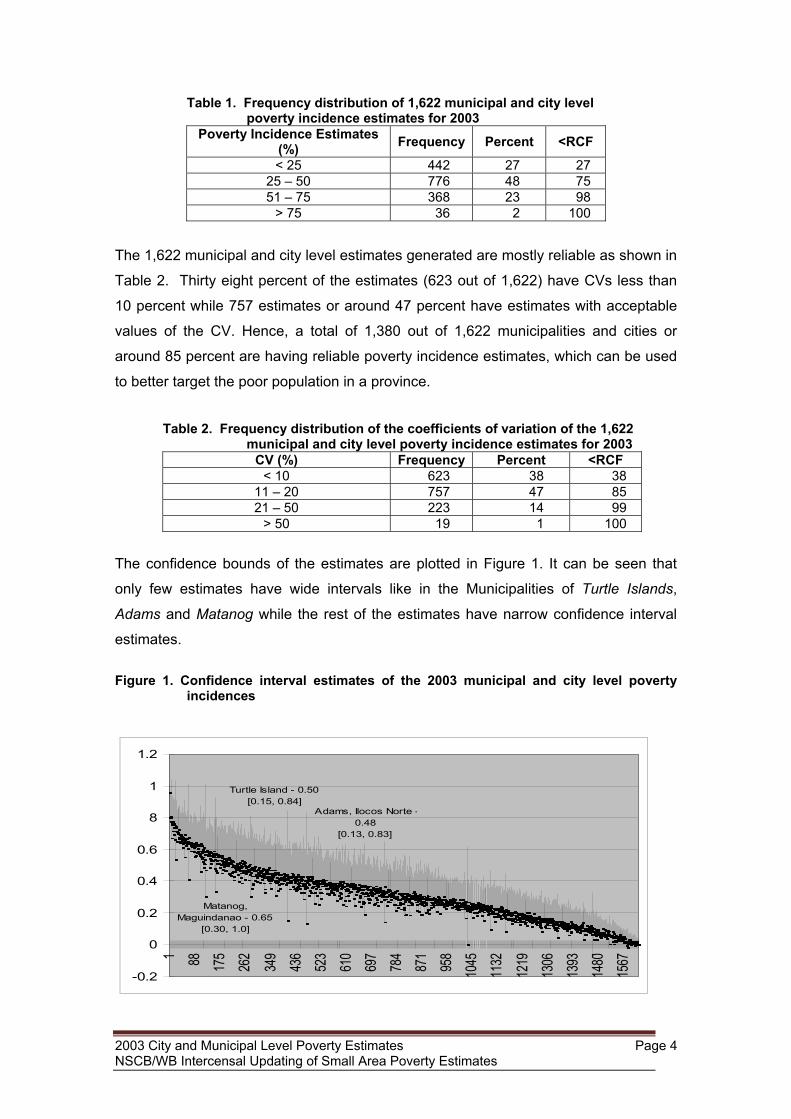
Table 1. Frequency distribution of 1,622 municipal and city level poverty incidence estimates for 2003
Poverty Incidence Estimates (%) Frequency Percent <RCF
< 25 442 27 27 25 – 50 776 48 75 51 – 75 368 23 98
> 75 36 2 100
The 1,622 municipal and city level estimates generated are mostly reliable as shown in
Table 2. Thirty eight percent of the estimates (623 out of 1,622) have CVs less than
10 percent while 757 estimates or around 47 percent have estimates with acceptable
values of the CV. Hence, a total of 1,380 out of 1,622 municipalities and cities or
around 85 percent are having reliable poverty incidence estimates, which can be used
to better target the poor population in a province.
Table 2. Frequency distribution of the coefficients of variation of the 1,622 municipal and city level poverty incidence estimates for 2003
CV (%) Frequency Percent <RCF < 10 623 38 38
11 – 20 757 47 85 21 – 50 223 14 99
> 50 19 1 100
The confidence bounds of the estimates are plotted in Figure 1. It can be seen that
only few estimates have wide intervals like in the Municipalities of Turtle Islands,
Adams and Matanog while the rest of the estimates have narrow confidence interval
estimates.
Figure 1. Confidence interval estimates of the 2003 municipal and city level poverty
incidences
0. Adams, Ilocos Norte -0.48
[0.13, 0.83]
Turtle Island - 0.50[0.15, 0.84]
Matanog, Maguindanao - 0.65
[0.30, 1.0]
-0.2
0
0.2
0.4
0.6
8
1
1.2
1 88 175
262
349
436
523
610
697
784
871
958
1045
1132
1219
1306
1393
1480
1567
2003 City and Municipal Level Poverty Estimates Page 4 NSCB/WB Intercensal Updating of Small Area Poverty Estimates
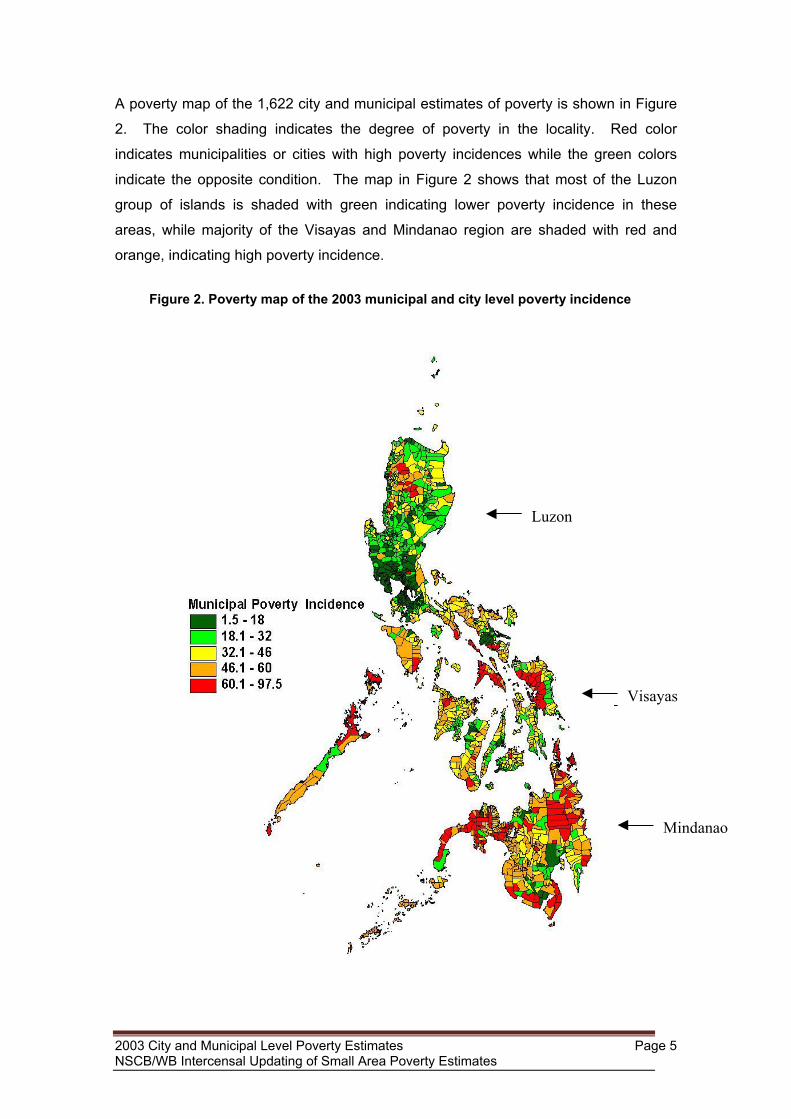
A poverty map of the 1,622 city and municipal estimates of poverty is shown in Figure
2. The color shading indicates the degree of poverty in the locality. Red color
indicates municipalities or cities with high poverty incidences while the green colors
indicate the opposite condition. The map in Figure 2 shows that most of the Luzon
group of islands is shaded with green indicating lower poverty incidence in these
areas, while majority of the Visayas and Mindanao region are shaded with red and
orange, indicating high poverty incidence.
2003NSC
Figure 2. Poverty map of the 2003 municipal and city level poverty incidence
Visayas
Luzon
Mindanao
Visayas
City and Municipal Level Poverty Estimates Page 5 B/WB Intercensal Updating of Small Area Poverty Estimates
1. The Poorest 40 Municipalities in 2003
As mentioned earlier, the Municipality of Siayan in the Province of Zamboanga del
Norte found in Region IX tops the list of the municipalities and cities based on the
estimated poverty incidence. The list is actually composed of municipalities with no
city included. The 2nd poorest municipality is Tanudan, a fourth class municipality and
a remote place in the Province of Kalinga. In this community, almost nine out of every
ten residents are in poverty. The lowest poverty incidence estimate among these 40
municipalities is 74.3 percent indicating that at least seven out of every ten residents
are poor.
Among the poorest 40 municipalities, only five are in Luzon. Specifically, two are in
the Province of Kalinga in Cordillera Autonomous Region (CAR), one in the Province
of La Union in Region I, and two from Region 4-B; one each in the Provinces of
Palawan and Oriental Mindoro. In the Visayas, the seven municipalities included in
the list all came from Region VIII, specifically in the province of Western Samar, which
is considered the poorest province in 2003 using the SAE. Mindanao has the rest of
the municipalities (28 out of 40) and mostly from Regions IX, X, XI and Caraga. These
municipalities in Mindanao are found in the provinces of Zamboanga del Norte (7),
Zamboanga del Sur (7), Davao del Norte (1), Davao del Sur (3), Agusan del Sur (4),
Surigao del Norte (2), and Lanao del Norte (4).
The provinces with municipalities belonging to the poorest 40 are the same provinces
identified in the 40 poorest provinces based on the SAE estimates for 2003. The list of
40 provinces includes the provinces mentioned above except for Davao del Norte and
Davao del Sur. Hence, it can be said that within a province that is not generally
considered poor, there are municipalities that are very poor and need more assistance
compared to other municipalities or cities in the same province.
All the 40 estimates are found to have CV of at most 16.4 percent. Only two estimates
have CVs greater than ten but less than 20 percent, hence these two estimates are
still with acceptable measures of reliability. The rest of the 40 estimates (38 out of 40)
are reliable with CVs less than 10 percent.
2003 City and Municipal Level Poverty Estimates Page 6 NSCB/WB Intercensal Updating of Small Area Poverty Estimates
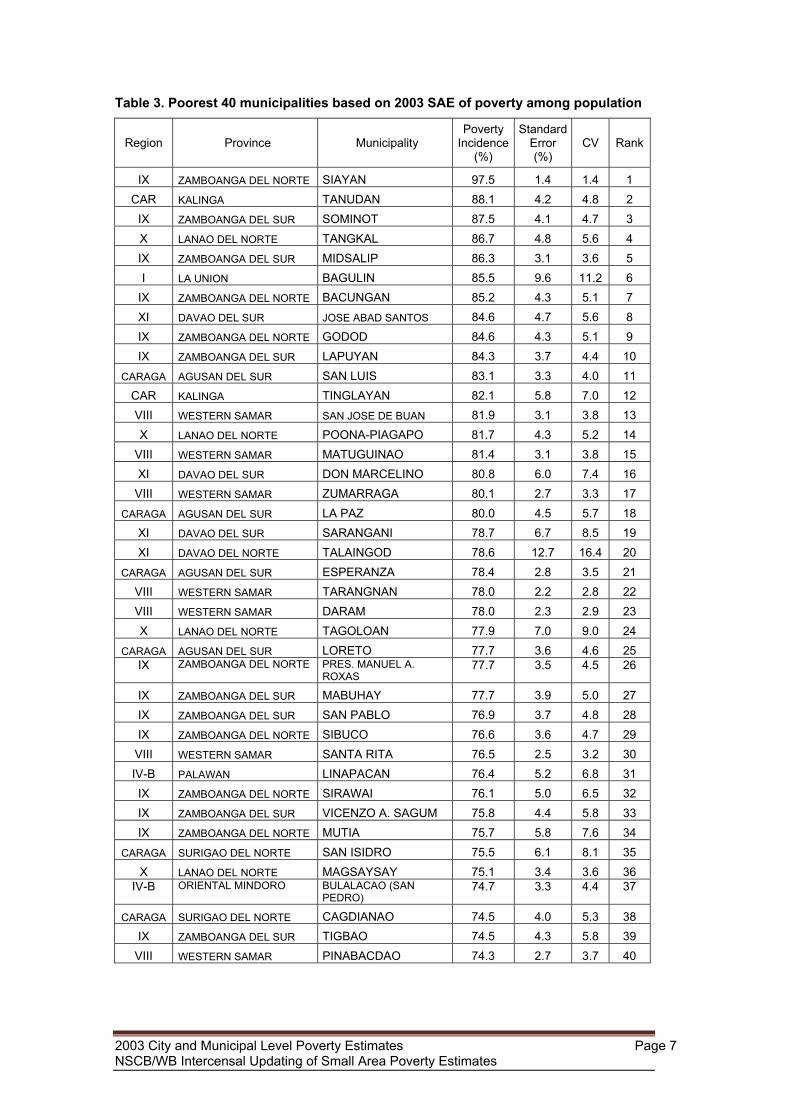
Table 3. Poorest 40 municipalities based on 2003 SAE of poverty among population
Region Province Municipality Poverty
Incidence (%)
Standard Error (%)
CV Rank
IX ZAMBOANGA DEL NORTE SIAYAN 97.5 1.4 1.4 1 CAR KALINGA TANUDAN 88.1 4.2 4.8 2
IX ZAMBOANGA DEL SUR SOMINOT 87.5 4.1 4.7 3 X LANAO DEL NORTE TANGKAL 86.7 4.8 5.6 4 IX ZAMBOANGA DEL SUR MIDSALIP 86.3 3.1 3.6 5 I LA UNION BAGULIN 85.5 9.6 11.2 6
IX ZAMBOANGA DEL NORTE BACUNGAN 85.2 4.3 5.1 7 XI DAVAO DEL SUR JOSE ABAD SANTOS 84.6 4.7 5.6 8 IX ZAMBOANGA DEL NORTE GODOD 84.6 4.3 5.1 9 IX ZAMBOANGA DEL SUR LAPUYAN 84.3 3.7 4.4 10
CARAGA AGUSAN DEL SUR SAN LUIS 83.1 3.3 4.0 11 CAR KALINGA TINGLAYAN 82.1 5.8 7.0 12 VIII WESTERN SAMAR SAN JOSE DE BUAN 81.9 3.1 3.8 13 X LANAO DEL NORTE POONA-PIAGAPO 81.7 4.3 5.2 14
VIII WESTERN SAMAR MATUGUINAO 81.4 3.1 3.8 15 XI DAVAO DEL SUR DON MARCELINO 80.8 6.0 7.4 16
VIII WESTERN SAMAR ZUMARRAGA 80.1 2.7 3.3 17
CARAGA AGUSAN DEL SUR LA PAZ 80.0 4.5 5.7 18 XI DAVAO DEL SUR SARANGANI 78.7 6.7 8.5 19 XI DAVAO DEL NORTE TALAINGOD 78.6 12.7 16.4 20
CARAGA AGUSAN DEL SUR ESPERANZA 78.4 2.8 3.5 21 VIII WESTERN SAMAR TARANGNAN 78.0 2.2 2.8 22 VIII WESTERN SAMAR DARAM 78.0 2.3 2.9 23 X LANAO DEL NORTE TAGOLOAN 77.9 7.0 9.0 24
CARAGA AGUSAN DEL SUR LORETO 77.7 3.6 4.6 25 IX ZAMBOANGA DEL NORTE PRES. MANUEL A.
ROXAS 77.7 3.5 4.5 26
IX ZAMBOANGA DEL SUR MABUHAY 77.7 3.9 5.0 27 IX ZAMBOANGA DEL SUR SAN PABLO 76.9 3.7 4.8 28 IX ZAMBOANGA DEL NORTE SIBUCO 76.6 3.6 4.7 29
VIII WESTERN SAMAR SANTA RITA 76.5 2.5 3.2 30 IV-B PALAWAN LINAPACAN 76.4 5.2 6.8 31 IX ZAMBOANGA DEL NORTE SIRAWAI 76.1 5.0 6.5 32 IX ZAMBOANGA DEL SUR VICENZO A. SAGUM 75.8 4.4 5.8 33 IX ZAMBOANGA DEL NORTE MUTIA 75.7 5.8 7.6 34
CARAGA SURIGAO DEL NORTE SAN ISIDRO 75.5 6.1 8.1 35 X LANAO DEL NORTE MAGSAYSAY 75.1 3.4 3.6 36
IV-B ORIENTAL MINDORO BULALACAO (SAN PEDRO)
74.7 3.3 4.4 37
CARAGA SURIGAO DEL NORTE CAGDIANAO 74.5 4.0 5.3 38 IX ZAMBOANGA DEL SUR TIGBAO 74.5 4.3 5.8 39
VIII WESTERN SAMAR PINABACDAO 74.3 2.7 3.7 40
2003 City and Municipal Level Poverty Estimates Page 7 NSCB/WB Intercensal Updating of Small Area Poverty Estimates
2. 40 Municipalities in 2003 with Highest Poverty Gap
Another poverty measure is poverty gap, which measures the total income shortfall
(expressed in proportion to the poverty line) of individuals with income below the
poverty line divided by the total number of individuals. This could actually provide
information as to how much, on the average, is needed by each individual for them to
become non-poor.
The 2003 municipal and city level poverty gap estimates were also generated using
the SAE technique described in the Annex. The Municipality of Siayan in the Province
of Zamboanga del Norte found in Region IX still tops the list of the municipalities and
cities based on the estimated poverty gap. Thus, the people of Siayan are not only
poor but their incomes are also the farthest from the threshold compared to other poor
municipalities since their municipality has the highest poverty gap estimated at 63.2
percent. This means that on the average, the per capita income of Filipino families
living in Siayan is 63.2 percent short of the poverty threshold. Again, no city was
included in the list (see Table 5).
The fifth class municipality of Tangkal in the Province of Lanao del Norte ranks 2nd
highest in terms of poverty gap. The Municipality of Tanudan in Kalinga, which ranks
2nd in terms of poverty incidence, is now 5th in the list. Hence, while Tanudan has high
proportion of poor, the income of its residents are closer to the poverty threshold,
compared to those residing in Tangkal, the smallest municipality in Lanao del Norte.
Six municipalities in the list of 40 poorest municipalities based on the poverty incidence
were not included in the list based on the poverty gap. These six municipalities were
replaced by municipalities coming from the province of Lanao del Norte in Region X.
The list of 40 municipalities with high poverty gap is composed of two municipalities
from the Province of Kalinga in Cordillera Autonomous Region (CAR); one in the
Province of La Union in Region I, six municipalities from the Province of Western
Samar, and the rest from the provinces in Mindanao. Only one of the 40 estimates in
Table 4 has CV greater than 20 percent, at 26 percent. The rest in the list has CVs
less than 20 percent, which indicates that the measures of reliability of the estimates
are still acceptable.
2003 City and Municipal Level Poverty Estimates Page 8 NSCB/WB Intercensal Updating of Small Area Poverty Estimates
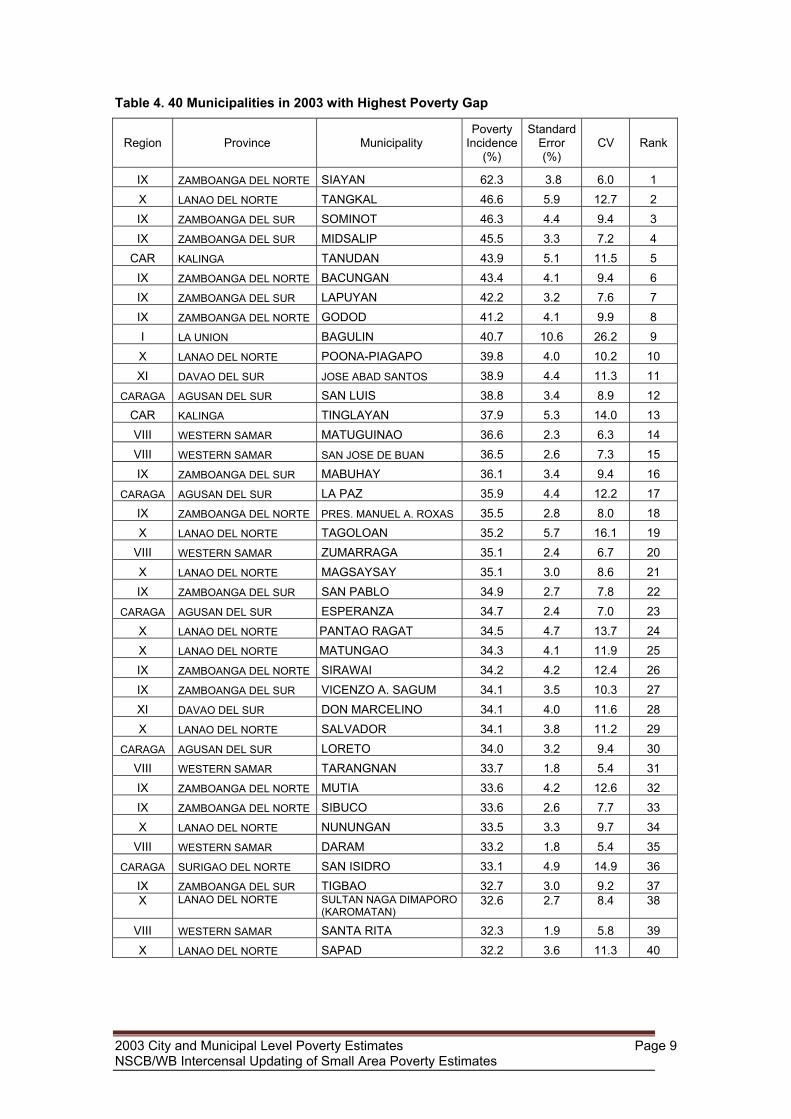
Table 4. 40 Municipalities in 2003 with Highest Poverty Gap
Region Province Municipality Poverty
Incidence (%)
Standard Error (%)
CV Rank
IX ZAMBOANGA DEL NORTE SIAYAN 62.3 3.8 6.0 1 X LANAO DEL NORTE TANGKAL 46.6 5.9 12.7 2 IX ZAMBOANGA DEL SUR SOMINOT 46.3 4.4 9.4 3 IX ZAMBOANGA DEL SUR MIDSALIP 45.5 3.3 7.2 4
CAR KALINGA TANUDAN 43.9 5.1 11.5 5 IX ZAMBOANGA DEL NORTE BACUNGAN 43.4 4.1 9.4 6 IX ZAMBOANGA DEL SUR LAPUYAN 42.2 3.2 7.6 7 IX ZAMBOANGA DEL NORTE GODOD 41.2 4.1 9.9 8 I LA UNION BAGULIN 40.7 10.6 26.2 9 X LANAO DEL NORTE POONA-PIAGAPO 39.8 4.0 10.2 10 XI DAVAO DEL SUR JOSE ABAD SANTOS 38.9 4.4 11.3 11
CARAGA AGUSAN DEL SUR SAN LUIS 38.8 3.4 8.9 12 CAR KALINGA TINGLAYAN 37.9 5.3 14.0 13 VIII WESTERN SAMAR MATUGUINAO 36.6 2.3 6.3 14 VIII WESTERN SAMAR SAN JOSE DE BUAN 36.5 2.6 7.3 15 IX ZAMBOANGA DEL SUR MABUHAY 36.1 3.4 9.4 16
CARAGA AGUSAN DEL SUR LA PAZ 35.9 4.4 12.2 17 IX ZAMBOANGA DEL NORTE PRES. MANUEL A. ROXAS 35.5 2.8 8.0 18 X LANAO DEL NORTE TAGOLOAN 35.2 5.7 16.1 19
VIII WESTERN SAMAR ZUMARRAGA 35.1 2.4 6.7 20 X LANAO DEL NORTE MAGSAYSAY 35.1 3.0 8.6 21 IX ZAMBOANGA DEL SUR SAN PABLO 34.9 2.7 7.8 22
CARAGA AGUSAN DEL SUR ESPERANZA 34.7 2.4 7.0 23 X LANAO DEL NORTE PANTAO RAGAT 34.5 4.7 13.7 24 X LANAO DEL NORTE MATUNGAO 34.3 4.1 11.9 25 IX ZAMBOANGA DEL NORTE SIRAWAI 34.2 4.2 12.4 26 IX ZAMBOANGA DEL SUR VICENZO A. SAGUM 34.1 3.5 10.3 27 XI DAVAO DEL SUR DON MARCELINO 34.1 4.0 11.6 28 X LANAO DEL NORTE SALVADOR 34.1 3.8 11.2 29
CARAGA AGUSAN DEL SUR LORETO 34.0 3.2 9.4 30 VIII WESTERN SAMAR TARANGNAN 33.7 1.8 5.4 31 IX ZAMBOANGA DEL NORTE MUTIA 33.6 4.2 12.6 32 IX ZAMBOANGA DEL NORTE SIBUCO 33.6 2.6 7.7 33 X LANAO DEL NORTE NUNUNGAN 33.5 3.3 9.7 34
VIII WESTERN SAMAR DARAM 33.2 1.8 5.4 35
CARAGA SURIGAO DEL NORTE SAN ISIDRO 33.1 4.9 14.9 36 IX ZAMBOANGA DEL SUR TIGBAO 32.7 3.0 9.2 37 X LANAO DEL NORTE SULTAN NAGA DIMAPORO
(KAROMATAN) 32.6 2.7 8.4 38
VIII WESTERN SAMAR SANTA RITA 32.3 1.9 5.8 39 X LANAO DEL NORTE SAPAD 32.2 3.6 11.3 40
2003 City and Municipal Level Poverty Estimates Page 9 NSCB/WB Intercensal Updating of Small Area Poverty Estimates
3. 40 Municipalities in 2003 with Highest Severity of Poverty
Severity of poverty is a poverty measure that estimates the inequality among poor.
This measure is sensitive to the distribution of living standards among the poor. A high
value indicates that the distribution is worse or that poverty is severe. The severity of
poverty index of the 1,622 municipalities and cities were generated using the SAE
technique. The Municipality of Siayan in the Province of Zamboanga del Norte found
in Region IX still ranked first in the list of municipalities with high estimated severity of
poverty. Thus, the most severe in poverty is being experienced by the people of
Siayan. The 40 municipalities that comprise the list is shown in Table 6.
On the average, the severity of poverty of the municipalities and cities in 2003 is 5.1
percent, which is higher than the country’s official measure in 2003. The highest index
was observed in Siayan, which is equal to 42.9 percent while the least severe is the
first class Municipality of Angono in the Province of Rizal with severity index equal to
0.1 percent. The municipalities comprising the list of 40 municipalities with the highest
index of severity is the same as those in the list of 40 municipalities with highest
poverty gap except for one municipality. The Municipality of Sta. Rita in the Province
of Western Samar of Region VIII now ranks 42nd based on severity of poverty while it
ranks 39th based on poverty gap. Hence, the residents of this municipality are said to
be poor with incomes that are far from the poverty line but their state of poverty is less
severe compared to those in the list.
As mentioned before, the composition of the list of 40 municipalities is almost the
same as that of the list based on poverty gap except for Sta. Rita in Western Samar.
Thus, the list is composed of two municipalities from the Province of Kalinga in
Cordillera Autonomous Region (CAR); one in the Province of La Union in Region I, five
municipalities from the Province of Western Samar, and the rest from the provinces in
Mindanao. In terms of reliability, the estimates for the municipalities of Baculin of Ilocos
Norte and Tagoloan of Lanao del Norte have high CVs, with values greater than 20
percent. Hence, these estimates must be used with caution.
2003 City and Municipal Level Poverty Estimates Page 10 NSCB/WB Intercensal Updating of Small Area Poverty Estimates
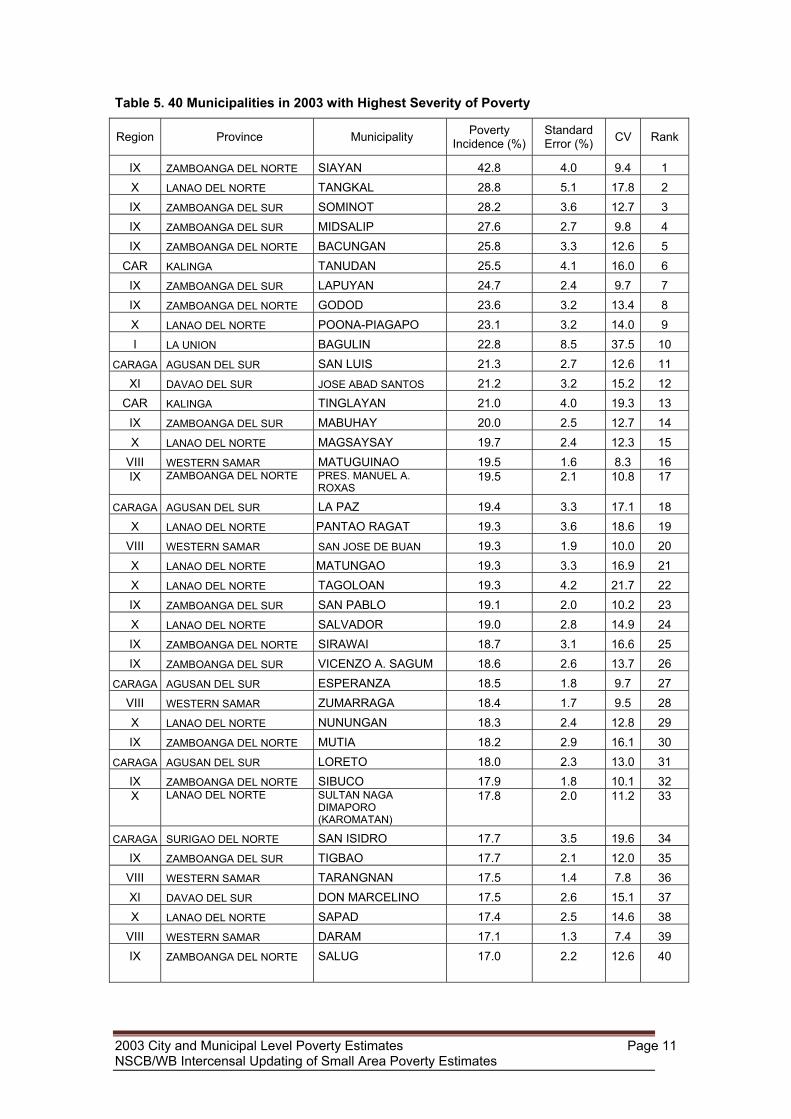
Table 5. 40 Municipalities in 2003 with Highest Severity of Poverty
Region Province Municipality Poverty Incidence (%)
Standard Error (%) CV Rank
IX ZAMBOANGA DEL NORTE SIAYAN 42.8 4.0 9.4 1 X LANAO DEL NORTE TANGKAL 28.8 5.1 17.8 2 IX ZAMBOANGA DEL SUR SOMINOT 28.2 3.6 12.7 3 IX ZAMBOANGA DEL SUR MIDSALIP 27.6 2.7 9.8 4 IX ZAMBOANGA DEL NORTE BACUNGAN 25.8 3.3 12.6 5
CAR KALINGA TANUDAN 25.5 4.1 16.0 6 IX ZAMBOANGA DEL SUR LAPUYAN 24.7 2.4 9.7 7 IX ZAMBOANGA DEL NORTE GODOD 23.6 3.2 13.4 8 X LANAO DEL NORTE POONA-PIAGAPO 23.1 3.2 14.0 9 I LA UNION BAGULIN 22.8 8.5 37.5 10
CARAGA AGUSAN DEL SUR SAN LUIS 21.3 2.7 12.6 11 XI DAVAO DEL SUR JOSE ABAD SANTOS 21.2 3.2 15.2 12
CAR KALINGA TINGLAYAN 21.0 4.0 19.3 13 IX ZAMBOANGA DEL SUR MABUHAY 20.0 2.5 12.7 14 X LANAO DEL NORTE MAGSAYSAY 19.7 2.4 12.3 15
VIII WESTERN SAMAR MATUGUINAO 19.5 1.6 8.3 16 IX ZAMBOANGA DEL NORTE PRES. MANUEL A.
ROXAS 19.5 2.1 10.8 17
CARAGA AGUSAN DEL SUR LA PAZ 19.4 3.3 17.1 18 X LANAO DEL NORTE PANTAO RAGAT 19.3 3.6 18.6 19
VIII WESTERN SAMAR SAN JOSE DE BUAN 19.3 1.9 10.0 20 X LANAO DEL NORTE MATUNGAO 19.3 3.3 16.9 21 X LANAO DEL NORTE TAGOLOAN 19.3 4.2 21.7 22 IX ZAMBOANGA DEL SUR SAN PABLO 19.1 2.0 10.2 23 X LANAO DEL NORTE SALVADOR 19.0 2.8 14.9 24 IX ZAMBOANGA DEL NORTE SIRAWAI 18.7 3.1 16.6 25 IX ZAMBOANGA DEL SUR VICENZO A. SAGUM 18.6 2.6 13.7 26
CARAGA AGUSAN DEL SUR ESPERANZA 18.5 1.8 9.7 27 VIII WESTERN SAMAR ZUMARRAGA 18.4 1.7 9.5 28 X LANAO DEL NORTE NUNUNGAN 18.3 2.4 12.8 29 IX ZAMBOANGA DEL NORTE MUTIA 18.2 2.9 16.1 30
CARAGA AGUSAN DEL SUR LORETO 18.0 2.3 13.0 31 IX ZAMBOANGA DEL NORTE SIBUCO 17.9 1.8 10.1 32 X LANAO DEL NORTE SULTAN NAGA
DIMAPORO (KAROMATAN)
17.8 2.0 11.2 33
CARAGA SURIGAO DEL NORTE SAN ISIDRO 17.7 3.5 19.6 34 IX ZAMBOANGA DEL SUR TIGBAO 17.7 2.1 12.0 35
VIII WESTERN SAMAR TARANGNAN 17.5 1.4 7.8 36 XI DAVAO DEL SUR DON MARCELINO 17.5 2.6 15.1 37 X LANAO DEL NORTE SAPAD 17.4 2.5 14.6 38
VIII WESTERN SAMAR DARAM 17.1 1.3 7.4 39 IX ZAMBOANGA DEL NORTE SALUG 17.0 2.2 12.6 40
2003 City and Municipal Level Poverty Estimates Page 11 NSCB/WB Intercensal Updating of Small Area Poverty Estimates
4. Municipalities in Terms of the Three Poverty Measures Using the three measures of poverty, namely; poverty incidence, poverty gap and
severity of poverty, municipalities that have high estimates in the three poverty
measures can be identified and targeted. These municipalities are those that are
consistently in the list of 40 municipalities when each of the poverty measures was
considered. This comprises a total of 31 municipalities as shown in Table 6.
The Municipality of Siayan of Zamboaga del Norte in Region IX tops this list. Many
residents of this municipality are poor with incomes that are far from the poverty line.
In addition, the poor residents of the municipality are in very severe poverty state.
Hence, being first in terms of the three poverty measures indicates that a considerable
amount of resources is needed to alleviate poverty in this area.
There are municipalities, which rank low in poverty incidences but rank high in poverty
gap and severity of poverty. For example, the Municipality of Mabuhay in the Province
of Zamboanga del Sur, has less percentage of poor residents but the condition of its
poor residents is more severe compared to other municipalities. The case of the
Municipality of Zumarraga of the Province of Western Samar of Region VIII, which was
visited by four typhoons in 2003, is the opposite. There is a high percentage of poor
residents in this municipality but the condition of the poor residents is less severe
compared to other municipalities.
The municipalities with high estimates on the three poverty measures are mostly from
Mindanao provinces. Only three municipalities are from Luzon while five are from the
Visayas. It is in Region IX where most of these municipalities can be found,
specifically in the provinces of Zamboanga del Norte and Zamboanga del Sur. Each of
these provinces has seven of its municipalities in the list. Other municipalities are from
Lanao del Norte of Region X, Davao del Sur of Region XI and Agusan del Sur of the
Caraga Region.
Among the 1,622 cities and municipalities, these municipalities identified in Table 6 are
said to have higher percentages of poor residents with incomes far from poverty line
making their conditions more severe compared to others.
2003 City and Municipal Level Poverty Estimates Page 12 NSCB/WB Intercensal Updating of Small Area Poverty Estimates
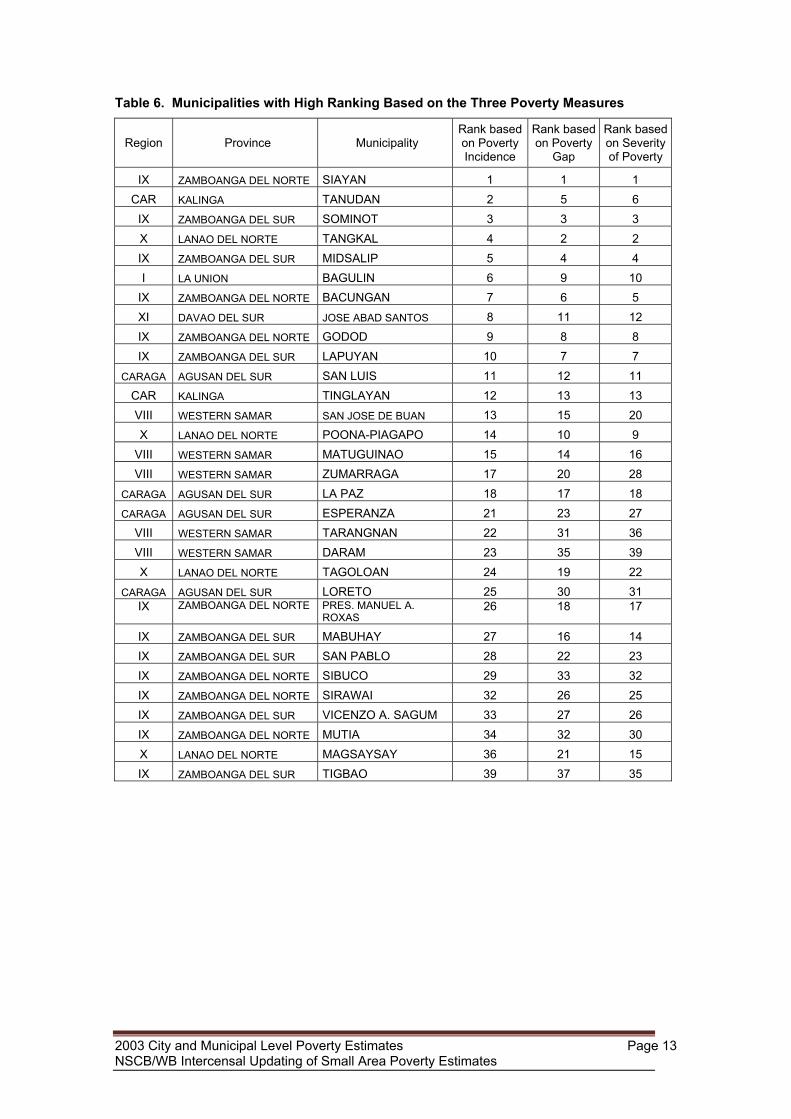
Table 6. Municipalities with High Ranking Based on the Three Poverty Measures
Region Province Municipality Rank based on Poverty Incidence
Rank based on Poverty
Gap
Rank based on Severity of Poverty
IX ZAMBOANGA DEL NORTE SIAYAN 1 1 1 CAR KALINGA TANUDAN 2 5 6
IX ZAMBOANGA DEL SUR SOMINOT 3 3 3 X LANAO DEL NORTE TANGKAL 4 2 2 IX ZAMBOANGA DEL SUR MIDSALIP 5 4 4 I LA UNION BAGULIN 6 9 10
IX ZAMBOANGA DEL NORTE BACUNGAN 7 6 5 XI DAVAO DEL SUR JOSE ABAD SANTOS 8 11 12 IX ZAMBOANGA DEL NORTE GODOD 9 8 8 IX ZAMBOANGA DEL SUR LAPUYAN 10 7 7
CARAGA AGUSAN DEL SUR SAN LUIS 11 12 11 CAR KALINGA TINGLAYAN 12 13 13 VIII WESTERN SAMAR SAN JOSE DE BUAN 13 15 20 X LANAO DEL NORTE POONA-PIAGAPO 14 10 9
VIII WESTERN SAMAR MATUGUINAO 15 14 16 VIII WESTERN SAMAR ZUMARRAGA 17 20 28
CARAGA AGUSAN DEL SUR LA PAZ 18 17 18
CARAGA AGUSAN DEL SUR ESPERANZA 21 23 27 VIII WESTERN SAMAR TARANGNAN 22 31 36 VIII WESTERN SAMAR DARAM 23 35 39 X LANAO DEL NORTE TAGOLOAN 24 19 22
CARAGA AGUSAN DEL SUR LORETO 25 30 31 IX ZAMBOANGA DEL NORTE PRES. MANUEL A.
ROXAS 26 18 17
IX ZAMBOANGA DEL SUR MABUHAY 27 16 14 IX ZAMBOANGA DEL SUR SAN PABLO 28 22 23 IX ZAMBOANGA DEL NORTE SIBUCO 29 33 32 IX ZAMBOANGA DEL NORTE SIRAWAI 32 26 25 IX ZAMBOANGA DEL SUR VICENZO A. SAGUM 33 27 26 IX ZAMBOANGA DEL NORTE MUTIA 34 32 30 X LANAO DEL NORTE MAGSAYSAY 36 21 15 IX ZAMBOANGA DEL SUR TIGBAO 39 37 35
2003 City and Municipal Level Poverty Estimates Page 13 NSCB/WB Intercensal Updating of Small Area Poverty Estimates
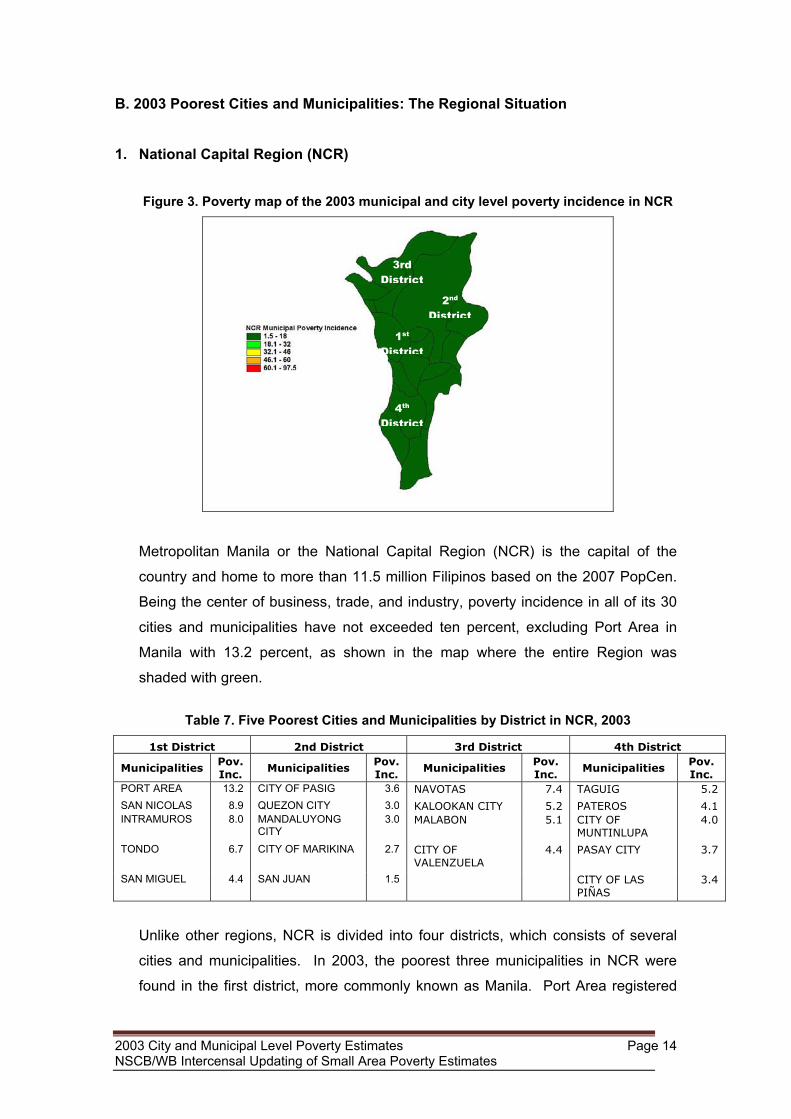
B. 2003 Poorest Cities and Municipalities: The Regional Situation 1. National Capital Region (NCR)
Figure 3. Poverty map of the 2003 municipal and city level poverty incidence in NCR
D
D
D
D
Metropolitan Manila or the National
country and home to more than 11.5
Being the center of business, trade, a
cities and municipalities have not exc
Manila with 13.2 percent, as shown
shaded with green.
Table 7. Five Poorest Cities and
1st District 2nd District
Municipalities Pov. Inc.
Municipalities PoIn
PORT AREA 13.2 CITY OF PASIG 3SAN NICOLAS 8.9 QUEZON CITY 3INTRAMUROS 8.0 MANDALUYONG
CITY 3
TONDO 6.7 CITY OF MARIKINA 2
SAN MIGUEL 4.4 SAN JUAN 1
Unlike other regions, NCR is divided
cities and municipalities. In 2003, th
found in the first district, more commo
2003 City and Municipal Level Poverty EstimatNSCB/WB Intercensal Updating of Small Area
1st istrict
Capital
million F
nd indu
eeded
in the
Municip
v. c.
Mu
.6 NAV
.0 KAL
.0 MAL
.7 CITYVAL
.5
into fou
e poore
nly kno
es Poverty
2nd istrict
4th istrict
3rd istrict
Region (NCR) is the capital of the
ilipinos based on the 2007 PopCen.
stry, poverty incidence in all of its 30
ten percent, excluding Port Area in
map where the entire Region was
alities by District in NCR, 2003
3rd District 4th District
nicipalities Pov. Inc.
Municipalities Pov. Inc.
OTAS 7.4 TAGUIG 5.2
OOKAN CITY 5.2 PATEROS 4.1 ABON 5.1 CITY OF
MUNTINLUPA 4.0
OF ENZUELA
4.4 PASAY CITY 3.7
CITY OF LAS PIÑAS
3.4
r districts, which consists of several
st three municipalities in NCR were
wn as Manila. Port Area registered
Page 14 Estimates
the highest poverty incidence with 13.2 percent, followed by San Nicolas and
Intramuros, with 8.9 percent and 8.0 percent, respectively.
In the second district, Pasig City had the highest poverty incidence estimated at
3.6 percent, followed by Quezon City (3.0 percent) and Mandaluyong City (3.0
percent).
Navotas, which is also known as the fishing capital in the region, topped the list of
the poorest municipalities in the third district with an estimated poverty incidence of
7.4 percent. This was followed by its nearby municipalities, Kalookan City and
Malabon.
The fourth district of NCR, consisting of five cities and two municipalities registered
Taguig as its poorest municipality in 2003 with 5.2 percent of its total population
classified as poor. Pateros, known for its balut-making industry, ranked 2nd poorest
in the municipality at 4.1 percent followed by the City of Muntinlupa at 4.0 percent.
Variables found to be significantly correlated with income in this region include
those related to education, family size, and floor area of the house.
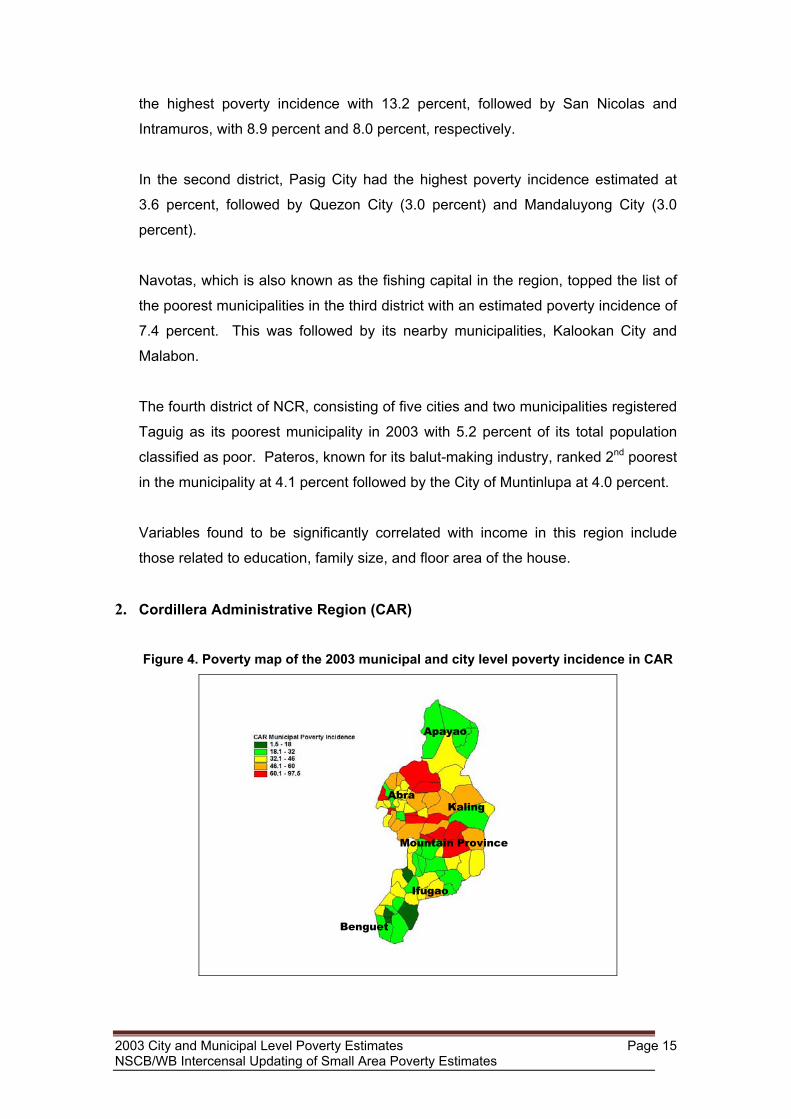
2. Cordillera Administrative Region (CAR) Figure 4. Poverty map of the 2003 municipal and city level poverty incidence in CAR
2003 City and Municipal Level PovertNSCB/WB Intercensal Updating of Sm
Benguet
y Estimatesall Area Po
Ifugao
Mountain Province
verty E
Kaling
Apayao
Abra
Page 15 stimates
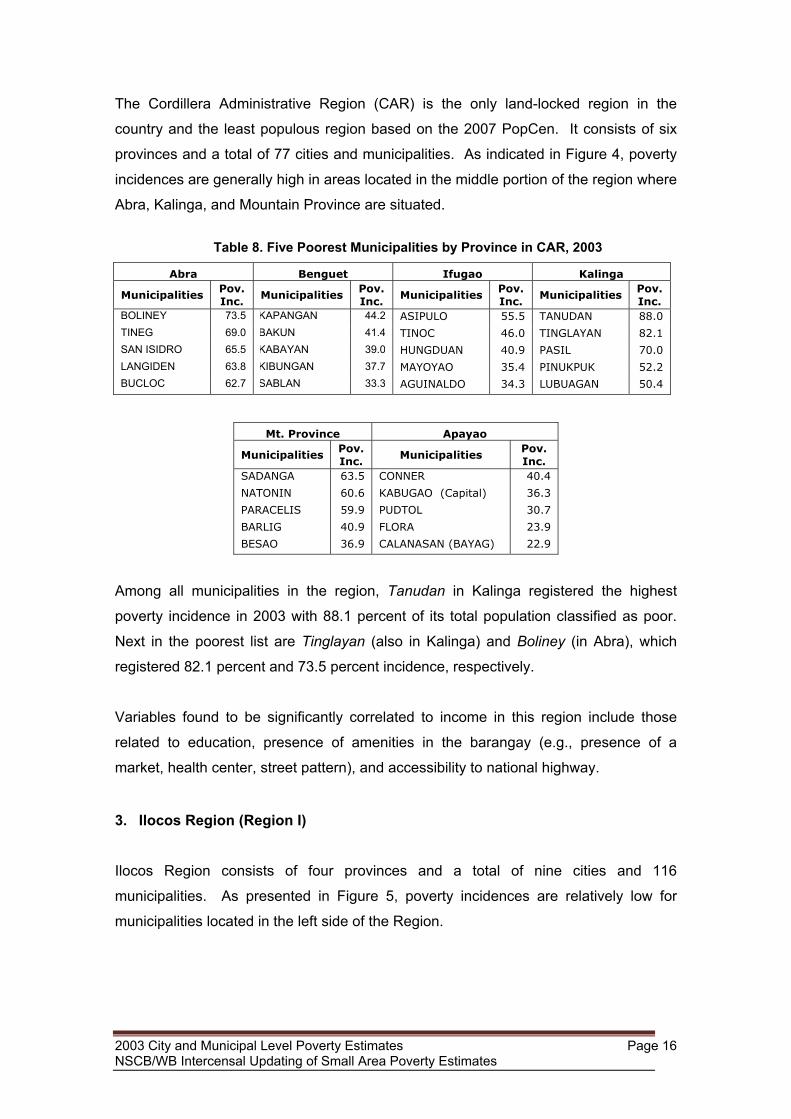
The Cordillera Administrative Region (CAR) is the only land-locked region in the
country and the least populous region based on the 2007 PopCen. It consists of six
provinces and a total of 77 cities and municipalities. As indicated in Figure 4, poverty
incidences are generally high in areas located in the middle portion of the region where
Abra, Kalinga, and Mountain Province are situated.
Table 8. Five Poorest Municipalities by Province in CAR, 2003
Abra Benguet Ifugao Kalinga
Municipalities Pov. Inc.
Municipalities Pov. Inc.
Municipalities Pov. Inc.
Municipalities Pov. Inc.
BOLINEY 73.5 KAPANGAN 44.2 ASIPULO 55.5 TANUDAN 88.0
TINEG 69.0 BAKUN 41.4 TINOC 46.0 TINGLAYAN 82.1
SAN ISIDRO 65.5 KABAYAN 39.0 HUNGDUAN 40.9 PASIL 70.0
LANGIDEN 63.8 KIBUNGAN 37.7 MAYOYAO 35.4 PINUKPUK 52.2
BUCLOC 62.7 SABLAN 33.3 AGUINALDO 34.3 LUBUAGAN 50.4
Mt. Province Apayao
Municipalities Pov. Inc.
Municipalities Pov. Inc.
SADANGA 63.5 CONNER 40.4
NATONIN 60.6 KABUGAO (Capital) 36.3
PARACELIS 59.9 PUDTOL 30.7
BARLIG 40.9 FLORA 23.9
BESAO 36.9 CALANASAN (BAYAG) 22.9
Among all municipalities in the region, Tanudan in Kalinga registered the highest
poverty incidence in 2003 with 88.1 percent of its total population classified as poor.
Next in the poorest list are Tinglayan (also in Kalinga) and Boliney (in Abra), which
registered 82.1 percent and 73.5 percent incidence, respectively.
Variables found to be significantly correlated to income in this region include those
related to education, presence of amenities in the barangay (e.g., presence of a
market, health center, street pattern), and accessibility to national highway.
3. Ilocos Region (Region I) Ilocos Region consists of four provinces and a total of nine cities and 116
municipalities. As presented in Figure 5, poverty incidences are relatively low for
municipalities located in the left side of the Region.
2003 City and Municipal Level Poverty Estimates Page 16 NSCB/WB Intercensal Updating of Small Area Poverty Estimates
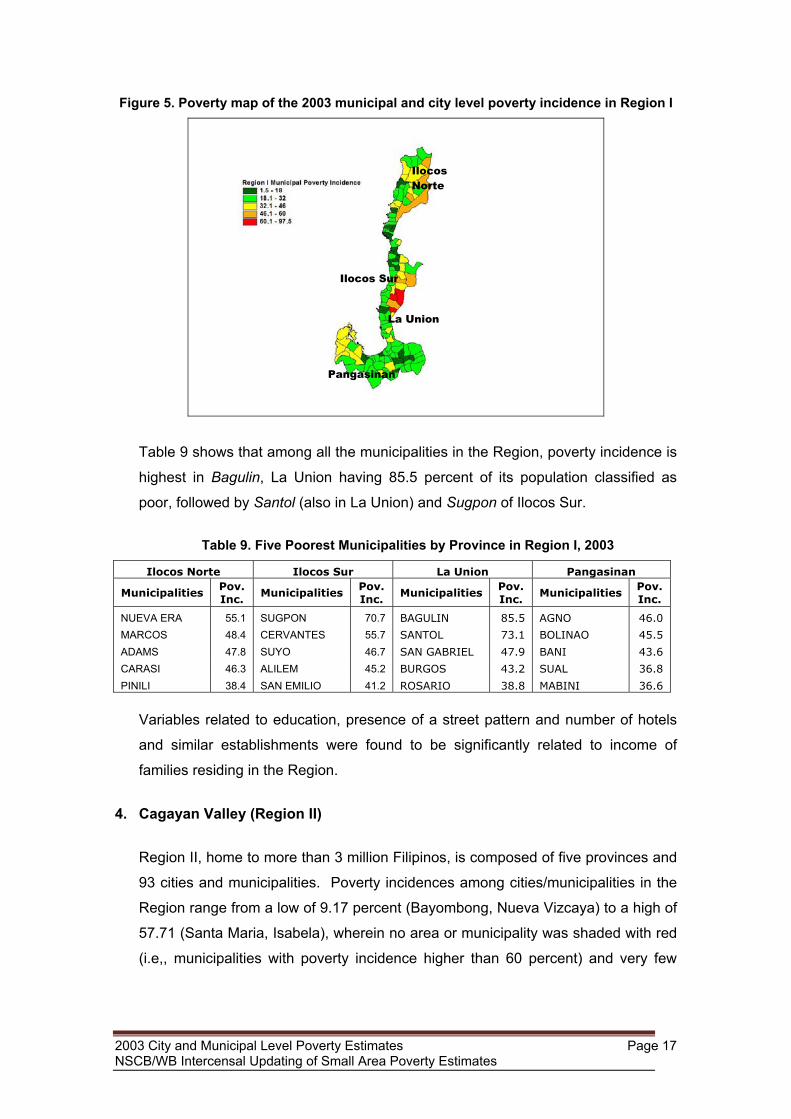
Figure 5. Poverty map of the 2003 municipal and city level poverty incidence in Region I
Ilocos Norte
Table 9 shows that among all
highest in Bagulin, La Union
poor, followed by Santol (also
Table 9. Five Poorest
Ilocos Norte Ilocos
Municipalities Pov. Inc.
Municipalitie
NUEVA ERA 55.1 SUGPON MARCOS 48.4 CERVANTES ADAMS 47.8 SUYO CARASI 46.3 ALILEM PINILI 38.4 SAN EMILIO
Variables related to education
and similar establishments w
families residing in the Region
4. Cagayan Valley (Region II)
Region II, home to more than
93 cities and municipalities. P
Region range from a low of 9.
57.71 (Santa Maria, Isabela),
(i.e,, municipalities with pove
2003 City and Municipal Level PovertNSCB/WB Intercensal Updating of Sm
Ilocos Sur
the mu
having
in La U
Munici
Sur
s PovInc
70.55.46.45.41.
, prese
ere fou
.
3 millio
overty
17 perc
wherein
rty incid
y Estimaall Area
La Union
Pangasinannicipalities in the Region, poverty incidence is
85.5 percent of its population classified as
nion) and Sugpon of Ilocos Sur.
palities by Province in Region I, 2003
La Union Pangasinan . .
Municipalities Pov. Inc.
Municipalities Pov. Inc.
7 BAGULIN 85.5 AGNO 46.0
7 SANTOL 73.1 BOLINAO 45.5
7 SAN GABRIEL 47.9 BANI 43.6
2 BURGOS 43.2 SUAL 36.8
2 ROSARIO 38.8 MABINI 36.6
nce of a street pattern and number of hotels
nd to be significantly related to income of
n Filipinos, is composed of five provinces and
incidences among cities/municipalities in the
ent (Bayombong, Nueva Vizcaya) to a high of
no area or municipality was shaded with red
ence higher than 60 percent) and very few
tes Page 17 Poverty Estimates
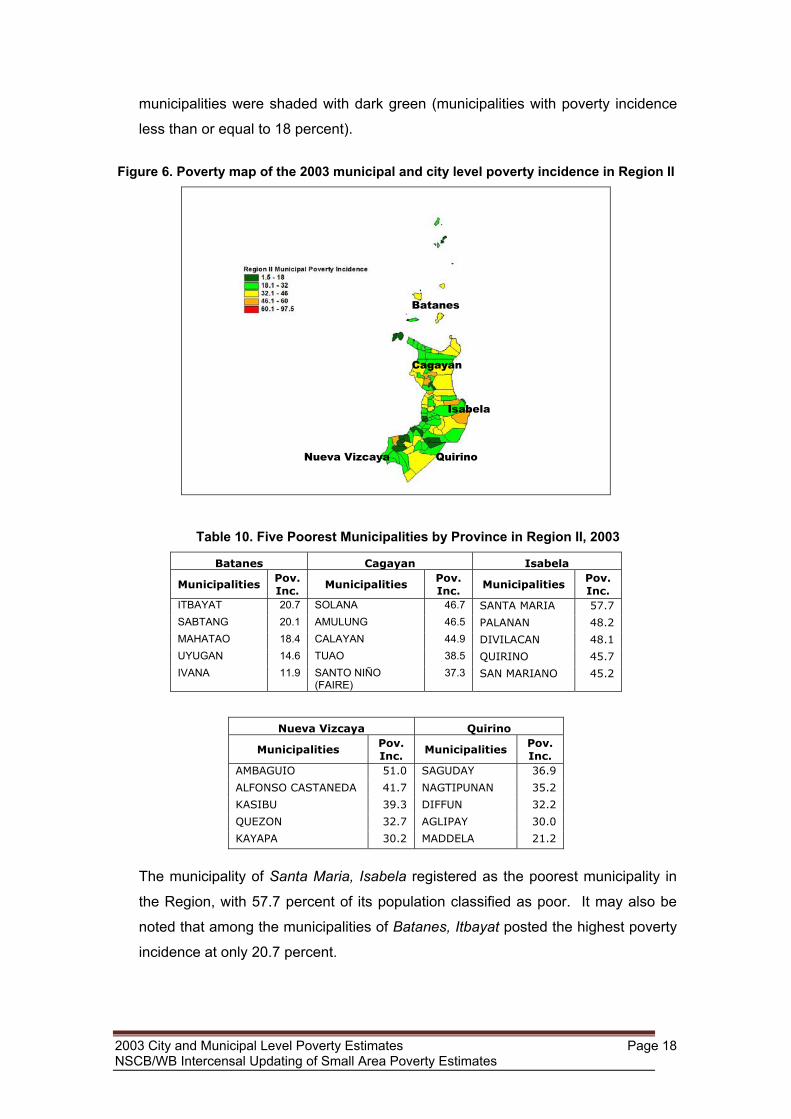
municipalities were shaded with dark green (municipalities with poverty incidence
less than or equal to 18 percent).
Figure 6. Poverty map of the 2003 municipal and city level poverty incidence in Region II
Table 10. Five Poorest Municipali
Batanes Cagaya
Municipalities Pov. Inc.
Municipalities
ITBAYAT 20.7 SOLANA SABTANG 20.1 AMULUNG MAHATAO 18.4 CALAYAN UYUGAN 14.6 TUAO IVANA 11.9 SANTO NIÑO
(FAIRE)
Nueva Vizcaya
Municipalities Pov.Inc.
AMBAGUIO 51.0
ALFONSO CASTANEDA 41.7
KASIBU 39.3
QUEZON 32.7
KAYAPA 30.2
The municipality of Santa Maria, Isabela
the Region, with 57.7 percent of its popu
noted that among the municipalities of Ba
incidence at only 20.7 percent.
2003 City and Municipal Level Poverty EstimatesNSCB/WB Intercensal Updating of Small Area Po
Batanes
n
Cagayaties b
n
PI
Mu
SAG
NAG
DIF
AGL
MAD
regis
lation
tane
verty E
Isabela
Quirino Nueva Vizcayay Province in Region II, 2003
Isabela ov. nc.
Municipalities Pov. Inc.
46.7 SANTA MARIA 57.7
46.5 PALANAN 48.2
44.9 DIVILACAN 48.1
38.5 QUIRINO 45.7
37.3 SAN MARIANO 45.2
Quirino
nicipalities Pov. Inc.
UDAY 36.9
TIPUNAN 35.2
FUN 32.2
IPAY 30.0
DELA 21.2
tered as the poorest municipality in
classified as poor. It may also be
s, Itbayat posted the highest poverty
Page 18 stimates
For Region II, variables related to housing materials, education, presence of a
postal system in the barangay, and proportion of houses with radio in the
municipality, were found to be significantly related to income of households
residing in this area.
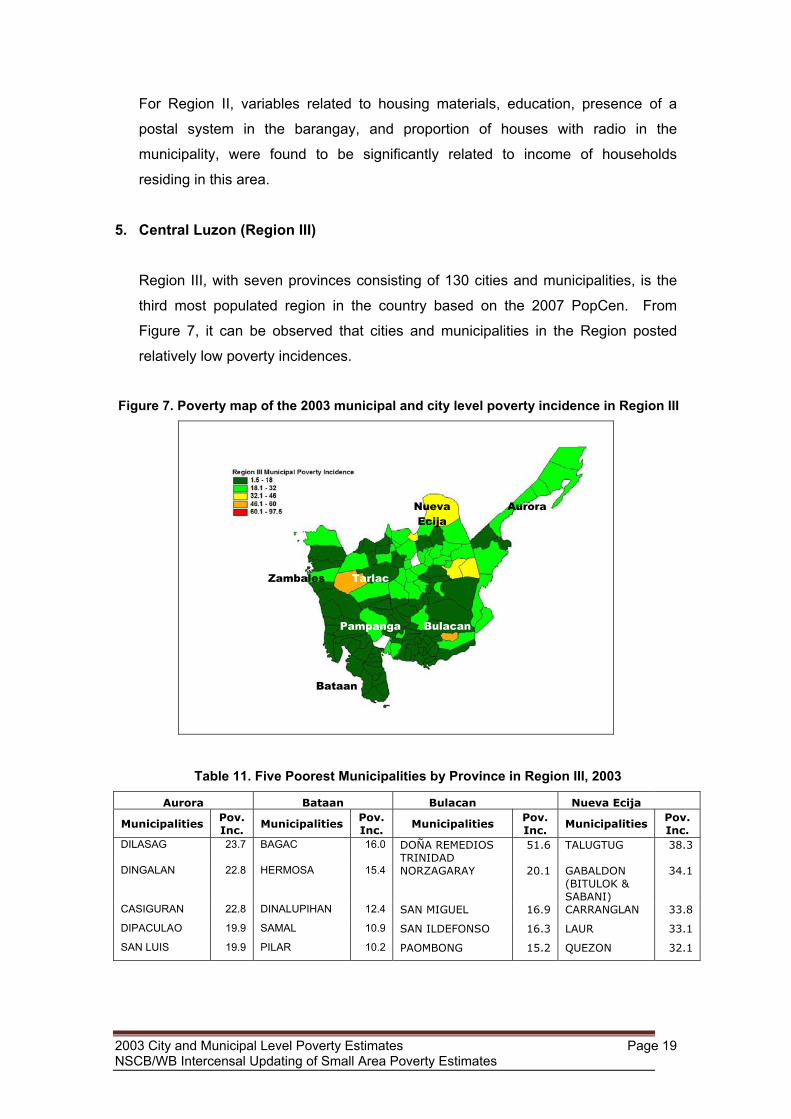
5. Central Luzon (Region III)
Region III, with seven provinces consisting of 130 cities and municipalities, is the
third most populated region in the country based on the 2007 PopCen. From
Figure 7, it can be observed that cities and municipalities in the Region posted
relatively low poverty incidences.
Figure 7. Poverty map of the 2003 municipal and city level poverty incidence in Region III
Nueva Ecija
Table 11. Five Poorest Municipalities by Province
Aurora Bataan Bulacan
Municipalities Pov. Inc.
Municipalities Pov. Inc.
Municipalities
DILASAG 23.7 BAGAC 16.0 DOÑA REMEDIOS TRINIDAD
DINGALAN 22.8 HERMOSA 15.4 NORZAGARAY
CASIGURAN 22.8 DINALUPIHAN 12.4 SAN MIGUEL
DIPACULAO 19.9 SAMAL 10.9 SAN ILDEFONSO
SAN LUIS 19.9 PILAR 10.2 PAOMBONG
2003 City and Municipal Level Poverty Estimates NSCB/WB Intercensal Updating of Small Area Poverty Estimates
Aurora
Bataan
Pampanga
Zambales
TarlacBulacan
in Region III, 2003
Nueva Ecija Pov. Inc.
Municipalities Pov. Inc.
51.6 TALUGTUG 38.3
20.1 GABALDON (BITULOK & SABANI)
34.1
16.9 CARRANGLAN 33.8
16.3 LAUR 33.1
15.2 QUEZON 32.1
Page 19
Pampanga Tarlac Zambales
Municipalities Pov. Inc.
Municipalities Pov. Inc.
Municipalities Pov. Inc.
CANDABA 21.8 SAN JOSE 47.9 PALAUIG 24.4
MASANTOL 20.2 LA PAZ 22.6 SANTA CRUZ 18.4
MINALIN 19.7 SAN MANUEL 21.8 CANDELARIA 17.4
PORAC 19.7 CAPAS 21.7 CABANGAN 16.7
SASMUAN (Sexmoan) 18.4 RAMOS 20.9 SUBIC 14.7
Doña Remedios Trinidad in Bulacan registered as the poorest municipality in the
Region at 51.6 percent, followed by San Jose, Tarlac at 47.9. It is worth noting
that other than these above-mentioned municipalities, no other city or municipality
in the Region had poverty incidence higher than 40 percent.
Variables found to be significantly related to income of households residing in the
Region were almost similar to the variables of NCR (e.g., education variables and
characteristics of the house).
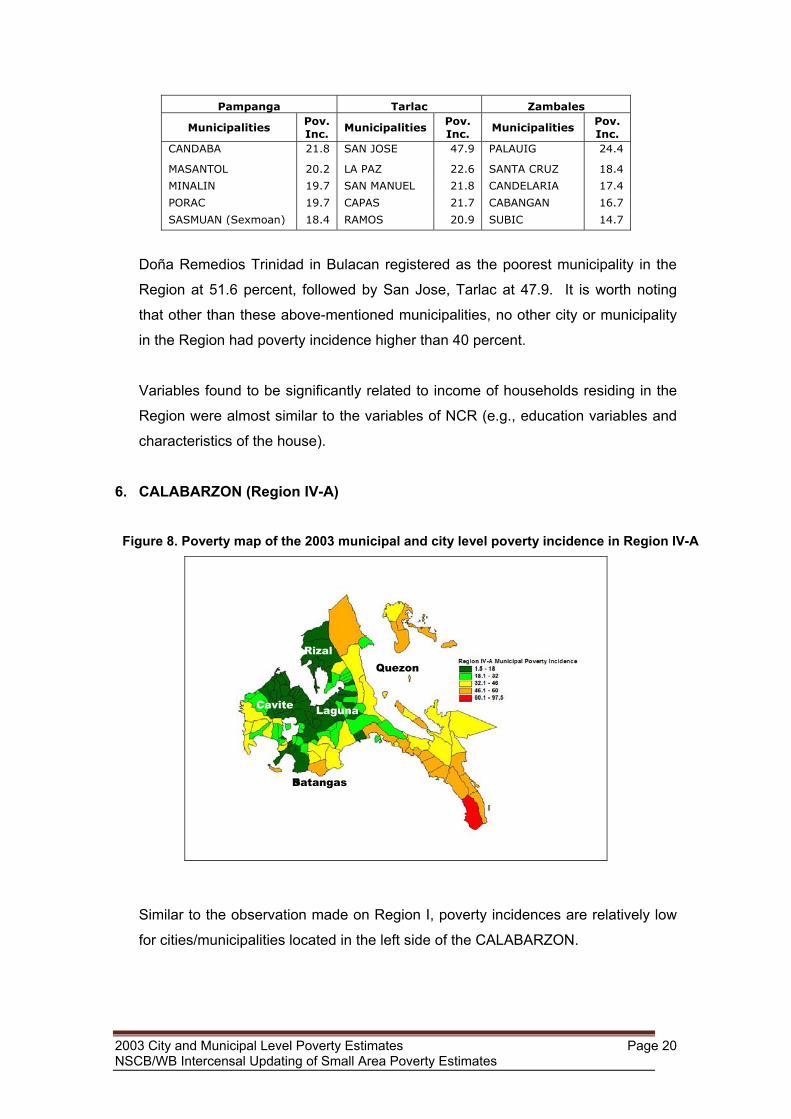
6. CALABARZON (Region IV-A)
Figure 8. Poverty map of the 2003 municipal and city level poverty incidence in Region IV-A
Quezon Rizal
Cavite
Batangas
Laguna
Similar to the observation made on Region I, poverty incidences are relatively low
for cities/municipalities located in the left side of the CALABARZON.
2003 City and Municipal Level Poverty Estimates Page 20 NSCB/WB Intercensal Updating of Small Area Poverty Estimates
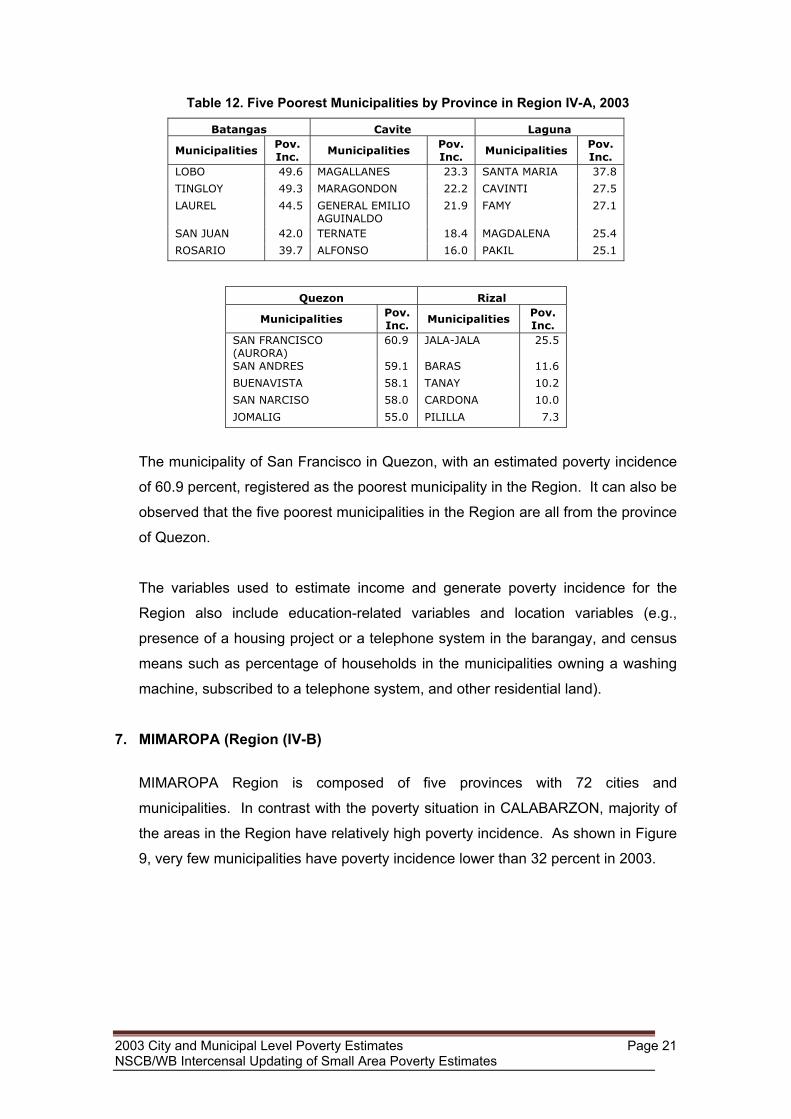
Table 12. Five Poorest Municipalities by Province in Region IV-A, 2003
Batangas Cavite Laguna
Municipalities Pov. Inc.
Municipalities Pov. Inc.
Municipalities Pov. Inc.
LOBO 49.6 MAGALLANES 23.3 SANTA MARIA 37.8
TINGLOY 49.3 MARAGONDON 22.2 CAVINTI 27.5
LAUREL 44.5 GENERAL EMILIO AGUINALDO
21.9 FAMY 27.1
SAN JUAN 42.0 TERNATE 18.4 MAGDALENA 25.4
ROSARIO 39.7 ALFONSO 16.0 PAKIL 25.1
Quezon Rizal
Municipalities Pov. Inc.
Municipalities Pov. Inc.
SAN FRANCISCO (AURORA)
60.9 JALA-JALA 25.5
SAN ANDRES 59.1 BARAS 11.6
BUENAVISTA 58.1 TANAY 10.2
SAN NARCISO 58.0 CARDONA 10.0
JOMALIG 55.0 PILILLA 7.3
The municipality of San Francisco in Quezon, with an estimated poverty incidence
of 60.9 percent, registered as the poorest municipality in the Region. It can also be
observed that the five poorest municipalities in the Region are all from the province
of Quezon.
The variables used to estimate income and generate poverty incidence for the
Region also include education-related variables and location variables (e.g.,
presence of a housing project or a telephone system in the barangay, and census
means such as percentage of households in the municipalities owning a washing
machine, subscribed to a telephone system, and other residential land).
7. MIMAROPA (Region (IV-B)
MIMAROPA Region is composed of five provinces with 72 cities and
municipalities. In contrast with the poverty situation in CALABARZON, majority of
the areas in the Region have relatively high poverty incidence. As shown in Figure
9, very few municipalities have poverty incidence lower than 32 percent in 2003.
2003 City and Municipal Level Poverty Estimates Page 21 NSCB/WB Intercensal Updating of Small Area Poverty Estimates
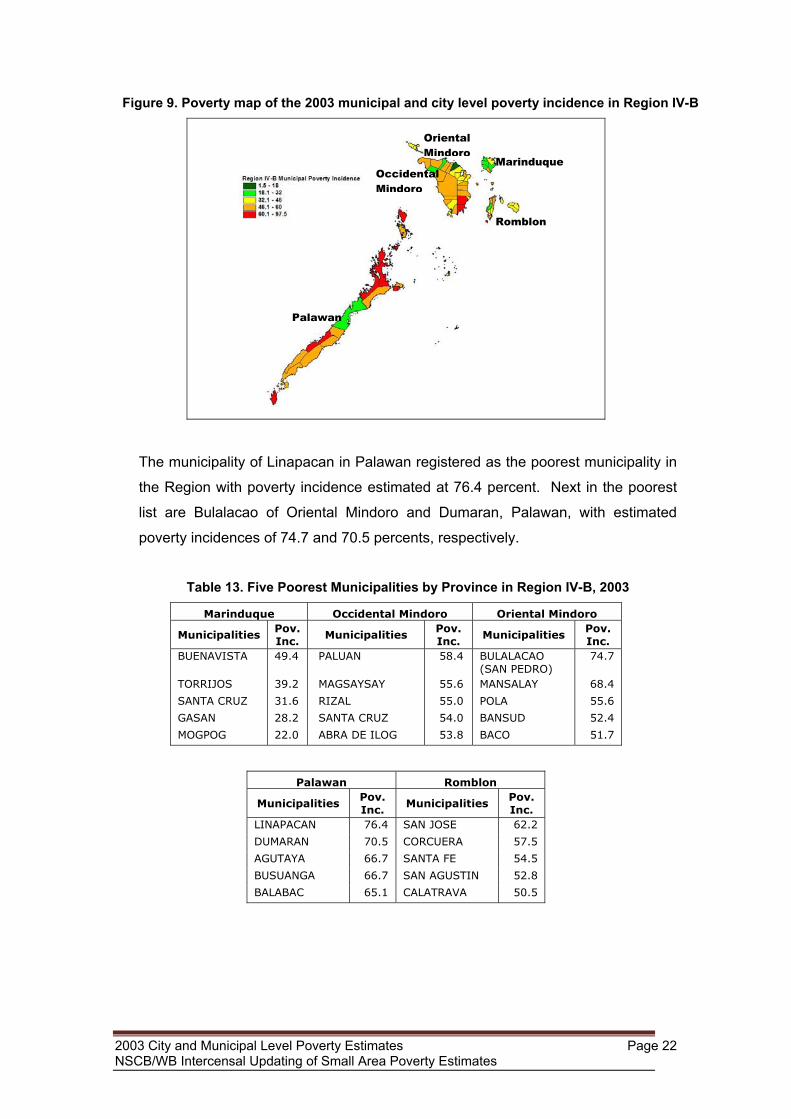
Figure 9. Poverty map of the 2003 municipal and city level poverty incidence in Region IV-B
The municipality of Lin
the Region with pover
list are Bulalacao of
poverty incidences of 7
Table 13. Five P
Marinduque
Municipalities PoIn
BUENAVISTA 49
TORRIJOS 39
SANTA CRUZ 31
GASAN 28
MOGPOG 22
Muni
LINAP
DUMA
AGUT
BUSU
BALAB
2003 City and Municipal LeveNSCB/WB Intercensal Updat
Palawan
apacan in Pa
ty incidence
Oriental Min
4.7 and 70.5
oorest Munic
Occidev. c.
Municip
.4 PALUAN
.2 MAGSAYS
.6 RIZAL
.2 SANTA CR
.0 ABRA DE
Palawan
cipalities PIn
ACAN 7
RAN 7
AYA 6
ANGA 6
AC 6
l Poverty Estiming of Small Ar
Occidental Mindoro
lawan
estimate
doro an
percen
ipalities
ntal Min
alities
AY
UZ
ILOG
ov. c.
M
6.4 SA
0.5 CO
6.7 SA
6.7 SA
5.1 CA
ates ea Pove
Oriental Mindoro
registered a
d at 76.4
d Dumara
ts, respecti
by Provinc
doro Pov. Inc.
M
58.4 B(S
55.6 M
55.0 PO
54.0 B
53.8 B
Romblo
unicipalities
N JOSE
RCUERA
NTA FE
N AGUSTIN
LATRAVA
rty Estimate
Romblon
Marinduque
s the poorest municipality in
percent. Next in the poorest
n, Palawan, with estimated
vely.
e in Region IV-B, 2003
Oriental Mindoro
unicipalities Pov. Inc.
ULALACAO AN PEDRO)
74.7
ANSALAY 68.4
LA 55.6
ANSUD 52.4
ACO 51.7
n
Pov. Inc. 62.2
57.5
54.5
52.8
50.5
Page 22 s
8. Bicol Region (Region V) Figure 10. Poverty map of the 2003 municipal and city level poverty incidence in Region V
Camarines Norte Camarines
Sur
Albay
Poverty incidences of municipalities in the six provi
relatively high, ranging from 22.8 percent to 72.5 perce
in the province of Albay2. As illustrated in the map
relatively high poverty incidence is concentrated in the
while municipalities with low poverty incidences are conc
Table 14. Five Poorest Municipalities by Provinc
Albay Camarines Norte
Municipalities Pov. Inc.
Municipalities Pov. Inc.
Mu
LEGAZPI CITY (Capital)
36.5 CAPALONGA 54.0
BAL
CITY OF TABACO 21.7 PARACALE 50.2 GARSANTO DOMINGO (LIBOG)
20.1 SANTA ELENA 49.4 CAB
MALILIPOT 14.9 SAN LORENZO RUIZ (IMELDA)
48.7 PAS
PIO DURAN 14.9 MERCEDES 47.6 SIR
2 It was observed that poverty incidence generated for Albay usingdeveloped in SAE was estimated as 15.1 percent with a CV of 3.7considered relatively low compared to the 2003 official poverty esCV of 7.3. While the Project Team recognizes that there may be ocorrelated with income (particularly for households of Albay), thesin the model developed for the region due to some constraints (e.gmanpower and financial resources). Thus, users are adviced to taabove-mentioned concern in the analysis of the estimates for Albamunicipalities.
2003 City and Municipal Level Poverty Estimates NSCB/WB Intercensal Updating of Small Area Poverty Estimates
Catanduanes
Masbate
Sorsogon
nces of the Region were
nt, except for those located
, it can be observed that
municipalities of Masbate,
entrated in Albay.
e in Region V, 2003
Camarines Sur
nicipalities Pov. Inc.
ATAN 61.0
CHITORENA 59.3 USAO 57.9
ACAO 57.0
UMA 56.0
the regional model . The computed incidence is timates of 42.7 percent with a ther variables that are
e, however, were not included ., limited time, data, ke into consideration the y, including all its cities and
Page 23
Catanduanes Masbate Sorsogon
Municipalities Pov. Inc.
Municipalities Pov. Inc.
Municipalities Pov. Inc.
PANDAN 44.8 CAWAYAN 72.5 DONSOL 68.7
BAGAMANOC 42.7 SAN PASCUAL 72.0 PILAR 61.3
CARAMORAN 42.7 CLAVERIA 69.6 CASTILLA 61.2
VIGA 41.8 PLACER 68.7 MATNOG 57.6
BARAS 37.0 MONREAL 66.7 MAGALLANES 56.1
Highest poverty incidence in the Region was observed in Cawayan, Masbate at
72.5 percent, followed by San Pascual (72.0 percent) and Claveria (69.6 percent),
which are also located in Masbate.
These estimates were generated through the significant relation of income with
variables like education-related variables, average family size, and housing
materials.
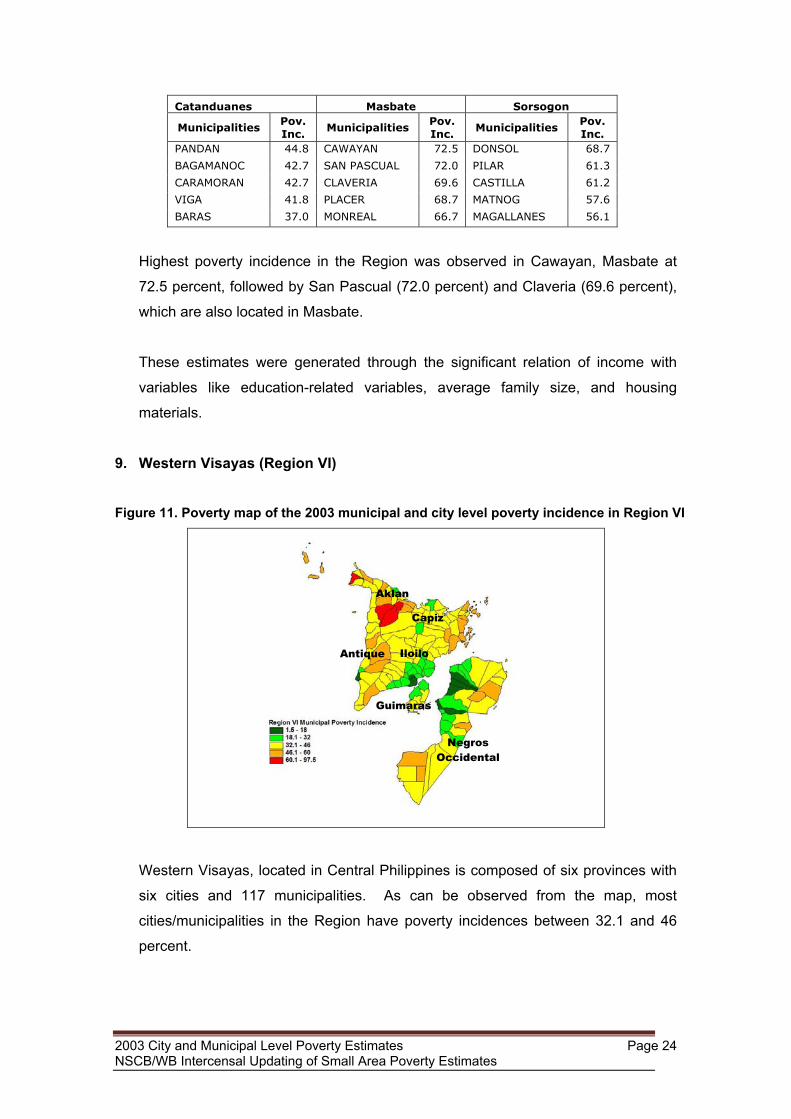
9. Western Visayas (Region VI) Figure 11. Poverty map of the 2003 municipal and city level poverty incidence in Region VI
Aklan
Antique Iloilo
Capiz
Negros Occidental
Guimaras
Western Visayas, located in Central Philippines is composed of six provinces with
six cities and 117 municipalities. As can be observed from the map, most
cities/municipalities in the Region have poverty incidences between 32.1 and 46
percent.
2003 City and Municipal Level Poverty Estimates Page 24 NSCB/WB Intercensal Updating of Small Area Poverty Estimates
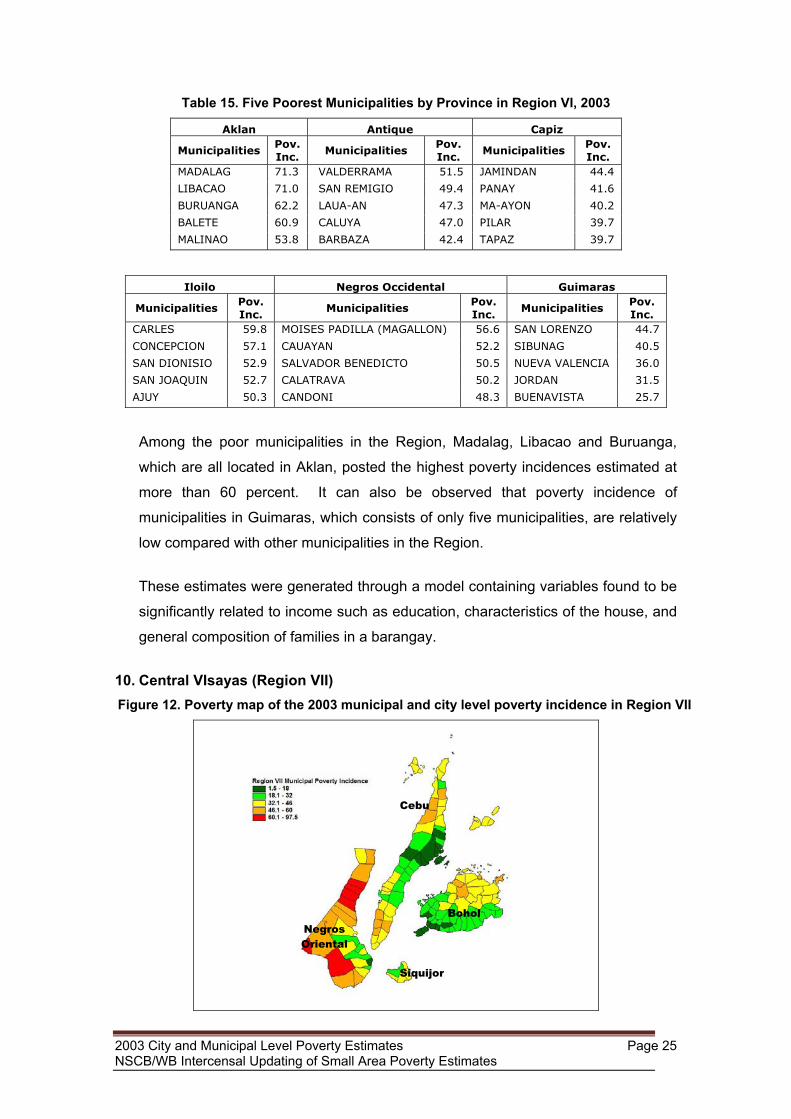
Table 15. Five Poorest Municipalities by Province in Region VI, 2003
Aklan Antique Capiz
Municipalities Pov. Inc.
Municipalities Pov. Inc.
Municipalities Pov. Inc.
MADALAG 71.3 VALDERRAMA 51.5 JAMINDAN 44.4
LIBACAO 71.0 SAN REMIGIO 49.4 PANAY 41.6
BURUANGA 62.2 LAUA-AN 47.3 MA-AYON 40.2
BALETE 60.9 CALUYA 47.0 PILAR 39.7
MALINAO 53.8 BARBAZA 42.4 TAPAZ 39.7
Iloilo Negros Occidental Guimaras
Municipalities Pov. Inc.
Municipalities Pov. Inc.
Municipalities Pov. Inc.
CARLES 59.8 MOISES PADILLA (MAGALLON) 56.6 SAN LORENZO 44.7
CONCEPCION 57.1 CAUAYAN 52.2 SIBUNAG 40.5
SAN DIONISIO 52.9 SALVADOR BENEDICTO 50.5 NUEVA VALENCIA 36.0
SAN JOAQUIN 52.7 CALATRAVA 50.2 JORDAN 31.5
AJUY 50.3 CANDONI 48.3 BUENAVISTA 25.7
Among the poor municipalities in the Region, Madalag, Libacao and Buruanga,
which are all located in Aklan, posted the highest poverty incidences estimated at
more than 60 percent. It can also be observed that poverty incidence of
municipalities in Guimaras, which consists of only five municipalities, are relatively
low compared with other municipalities in the Region.
These estimates were generated through a model containing variables found to be
significantly related to income such as education, characteristics of the house, and
general composition of families in a barangay.
10. Central VIsayas (Region VII) Figure 12. Poverty map of the 2003 municipal and city level poverty incidence in Region VII
Negros Oriental
2003 City and Municipal Level Poverty EstimateNSCB/WB Intercensal Updating of Small Area P
Cebu
s overty E
Bohol
SiquijorPage 25 stimates
Central Visayas consists of four provinces, with 16 cities and 116 municipalities. It
can be observed from the map that municipalities with low poverty incidence are
generally concentrated in specific areas of the province, such as Cebu City of
Cebu, Dumaguete City of Negros Oriental and Tagbilaran City of Bohol.
Table 16. Five Poorest Municipalities by Province in Region VII, 2003
Bohol Cebu Negros Oriental Siquijor
Municipalities Pov. Inc.
Municipalities Pov. Inc.
Municipalities Pov. Inc.
Municipalities Pov. Inc.
DANAO 57.2 MALABUYOC 54.9 JIMALALUD 65.7 ENRIQUE VILLANUEVA
43.2
BUENAVISTA 51.7 ALEGRIA 53.1 LA LIBERTAD 64.8 LAZI 42.0 PRES. CARLOS P. GARCIA (PITOGO)
50.2 TUBURAN 51.2 TAYASAN 63.9 MARIA 41.0
BIEN UNIDO 46.4 GINATILAN 49.5 BASAY 63.5 SAN JUAN 32.1
UBAY 45.9 TABOGON 47.9 SANTA CATALINA
61.4 SIQUIJOR (Capital) 24.3
Across all cities and municipalities in the Region, Jimalalud in Negros Oriental
posted the highest poverty incidence estimated at 65.7 percent. It can be
observed that the five poorest municipalities in Central Visayas are all located in
Negros Oriental.
Variables found to be significantly related to the income of households in the
Region include presence of accommodation establishments (e.g., hotels and
dormitories), highest educational attainment of the household head, housing
materials, and percentage of households in the municipality that own a television.
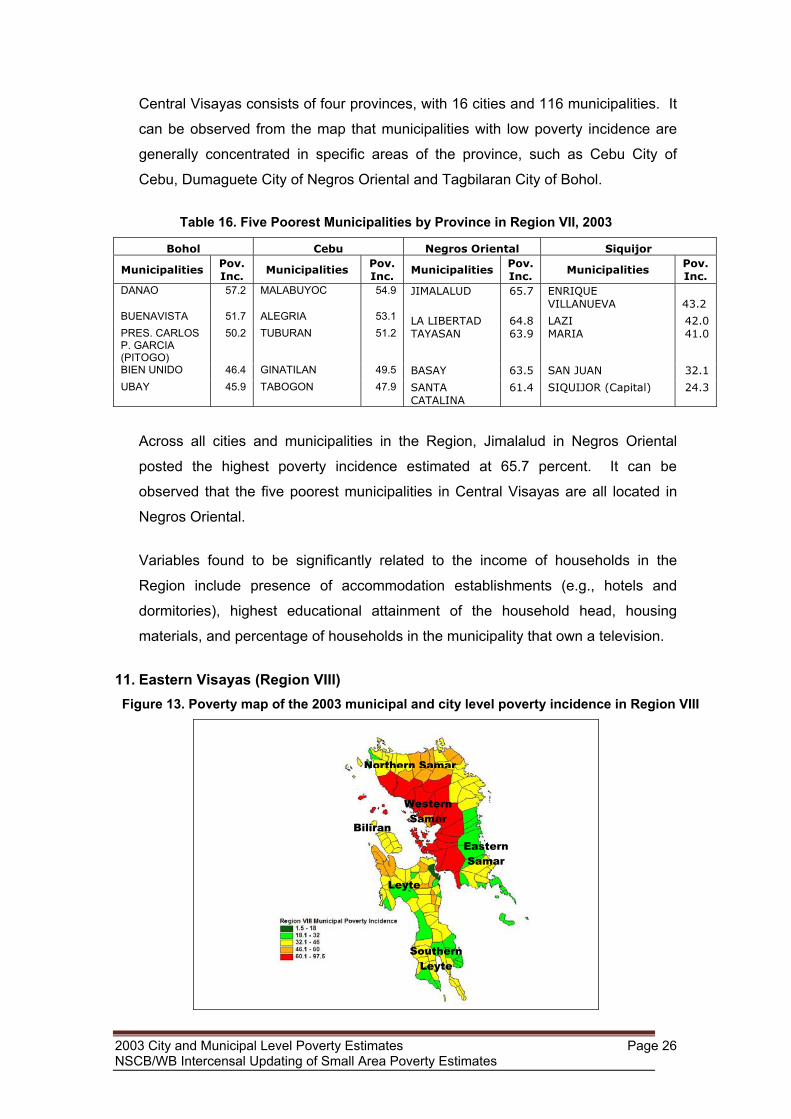
11. Eastern Visayas (Region VIII) Figure 13. Poverty map of the 2003 municipal and city level poverty incidence in Region VIII
2003 City and Municipal Level Poverty EsNSCB/WB Intercensal Updating of Small
Northern Samar
BiliranEastern Samar
timaArea
Leyte
tes Po
Southern Leyte
WesternSamar
Page 26 verty Estimates

Eastern Visayas consists of six provinces, with seven cities and 136 municipalities.
It can be observed in the poverty map presented in Figure 13 that poverty in the
Region is highly concentrated in Western Samar.
Table 17. Five Poorest Municipalities by Province in Region VIII, 2003
Eastern Samar Leyte Northern Samar
Municipalities Pov. Inc.
Municipalities Pov. Inc.
Municipalities Pov. Inc.
JIPAPAD 45.8 LEYTE 55.1 LAS NAVAS 53.3
ARTECHE 45.7 SAN ISIDRO 54.3 SILVINO LOBOS 52.1
MASLOG 44.7 CALUBIAN 52.0 PAMBUJAN 50.0
HERNANI 42.4 MAYORGA 49.4 MAPANAS 49.2
SAN POLICARPO
39.3 TABANGO 49.3 SAN ROQUE 48.5
Western Samar Southern Leyte Biliran
Municipalities Pov. Inc.
Municipalities Pov. Inc.
Municipalities Pov. Inc.
SAN JOSE DE BUAN 81.9 PINTUYAN 36.6 CULABA 41.9
MATUGUINAO 81.4 SAINT BERNARD
36.3 CABUCGAYAN 41.4
ZUMARRAGA 80.1 BONTOC 35.8 CAIBIRAN 40.2
TARANGNAN 78.0 TOMAS OPPUS 35.2 KAWAYAN 39.4
DARAM 78.0 SAN RICARDO 34.9 MARIPIPI 36.7
Consequently, municipalities from Western Samar were identified as the poorest
municipalities in the Region with poverty incidence registering as high as 80
percent. It should be noted that variables on education, housing materials, and
presence of community work in the barangay were found to be significantly related
to income of families residing in the Region. 12. Zamboanga Peninsula (Region IX)
The Zamboanga Peninsula is a region bounded by three bodies of water, namely
Moro Gulf, Celebes Sea, and Sulu Sea. The Region consisting of three provinces,
five cities and 67 municipalities is home to more than 3.2 million Filipinos based on
the 2007 PopCen. As presented in Figure 14, poverty is heavily concentrated in
Zamboanga del Norte. Ironically, the least poor municipality in the region, which
was identified as Dipolog City with poverty incidence of 16.2 percent, is also
located in this province.
2003 City and Municipal Level Poverty Estimates Page 27 NSCB/WB Intercensal Updating of Small Area Poverty Estimates
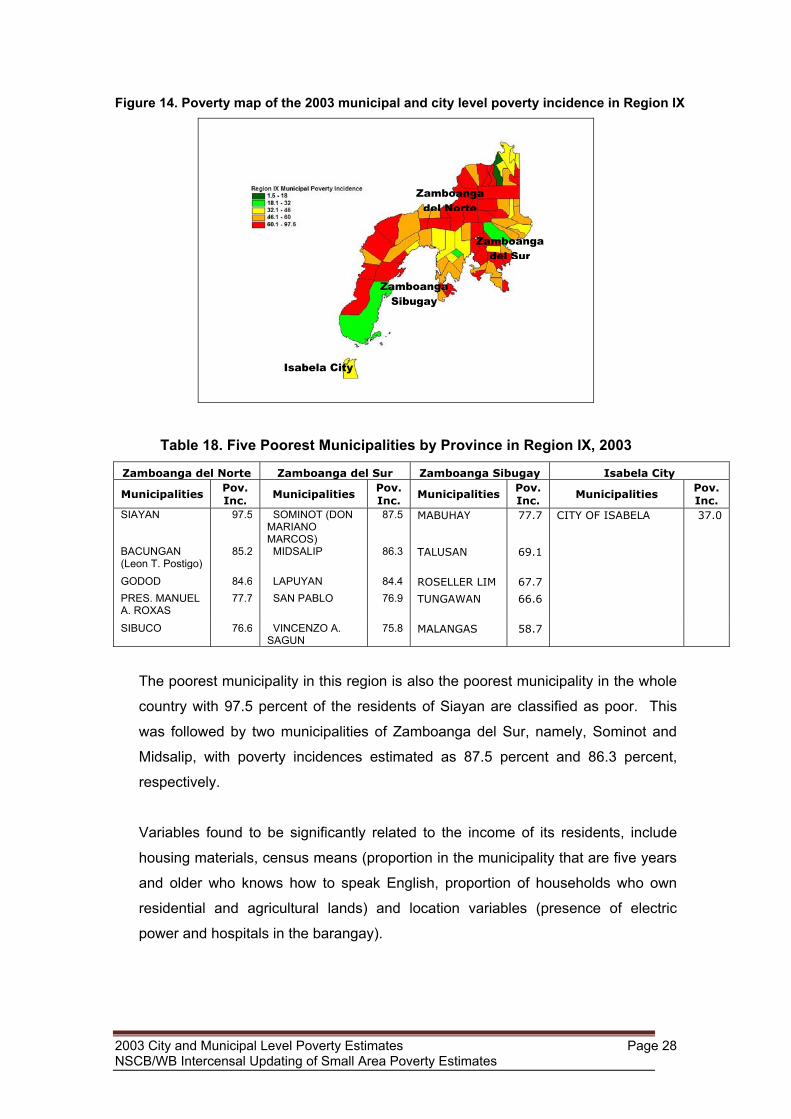
Figure 14. Poverty map of the 2003 municipal and city level poverty incidence in Region IX
ZambSib
Table 18. Five Poorest Municipalitie
Zamboanga del Norte Zamboanga del Sur
Municipalities Pov. Inc.
Municipalities Pov. Inc.
SIAYAN 97.5 SOMINOT (DON MARIANO MARCOS)
87.5
BACUNGAN (Leon T. Postigo)
85.2 MIDSALIP 86.3
GODOD 84.6 LAPUYAN 84.4 PRES. MANUEL A. ROXAS
77.7 SAN PABLO 76.9
SIBUCO 76.6 VINCENZO A. SAGUN
75.8
The poorest municipality in this region is
country with 97.5 percent of the resident
was followed by two municipalities of Za
Midsalip, with poverty incidences estima
respectively.
Variables found to be significantly relate
housing materials, census means (propor
and older who knows how to speak Eng
residential and agricultural lands) and
power and hospitals in the barangay).
2003 City and Municipal Level Poverty Estimates NSCB/WB Intercensal Updating of Small Area Po
Zamboanga del Norte
oanga ugay
s by Prov
Zamboa
Municipa
MABUHAY
TALUSAN
ROSELLER
TUNGAWA
MALANGA
also the p
s of Siay
mboanga
ted as 8
d to the
tion in the
lish, prop
location
verty Estim
Zamboanga del Sur
Isabela City
ince in Region IX, 2003
nga Sibugay Isabela City
lities Pov. Inc.
Municipalities Pov. Inc.
77.7 CITY OF ISABELA 37.0
69.1
LIM 67.7 N 66.6
S 58.7
oorest municipality in the whole
an are classified as poor. This
del Sur, namely, Sominot and
7.5 percent and 86.3 percent,
income of its residents, include
municipality that are five years
ortion of households who own
variables (presence of electric
Page 28 ates

13. Northern Mindanao (Region X) Figure 15. Poverty map of the 2003 municipal and city level poverty incidence in Region X
Misamis Occidental
Lanao del Norte
The Northern Mindanao consists o
municipalities. As illustrated in Figur
Region, specifically in the provinc
municipalities have poverty incidenc
region, only Cagayan de Oro City wa
incidence lower than 18 percent.
The five poorest municipalities in the
The municipality of Tangkal registere
incidence of 86.7 percent. Comparin
municipalities in each of the province
incidences of the municipalities in Cam
Table 19. Five Poorest Municipa
Bukidnon Cam
Municipalities Pov. Inc.
Municipa
TALAKAG 62.9 SAGAY
MALITBOG 60.9 MAHINOG
DAMULOG 60.3 GUINSILIBAN
KITAOTAO 59.5 CATARMAN
SAN FERNANDO 58.7 MAMBAJAO (
2003 City and Municipal Level Poverty EstimaNSCB/WB Intercensal Updating of Small Area
MisamisOriental
e
s
s
l
C
Camiguin
f fi
15
e o
e g
sh
Re
d a
g th
in
igu
litie
igu
ities
api
tes Po
Bukidnon
ve provinces, with nine cities and 84
, pockets of poverty can be found in the
f Lanao del Norte where all of its
reater than 46 percent. For the entire
aded with dark green indicating a poverty
gion were all located in Lanao del Norte.
s the poorest municipality with a poverty
e poverty incidences of the five poorest
the Region, it is worth noting that poverty
in were relatively low as compared to
s by Province in Region X, 2003
in Lanao del Norte
Pov. Inc.
Municipalities Pov. Inc.
38.0 TANGCAL 86.7
37.8 POONA PIAGAPO
81.7
35.0 TAGOLOAN 77.9
32.2 MAGSAYSAY 75.1
tal) 23.6 NUNUNGAN 74.3
Page 29 verty Estimates
Misamis Occidental Misamis Oriental
Municipalities Pov. Inc.
Municipalities Pov. Inc.
CONCEPCION 72.4 MAGSAYSAY (LINUGOS)
63.4
DON VICTORIANO CHIONGBIAN
72.0 LAGONGLONG 53.1
BONIFACIO 64.1 ALUBIJID 50.7 BALIANGAO 60.5 CLAVERIA 50.4 LOPEZ JAENA 59.0 BALINGASAG 49.2
municipalities in other provinces, with Sagay – its poorest municipality, posting 38
percent in poverty incidence. Education of the household head, housing materials,
presence of a street pattern in the barangay, proportion of households in the
municipality with washing machine, and average proportion of household members
who are children of the household head in the barangay were variables found to be
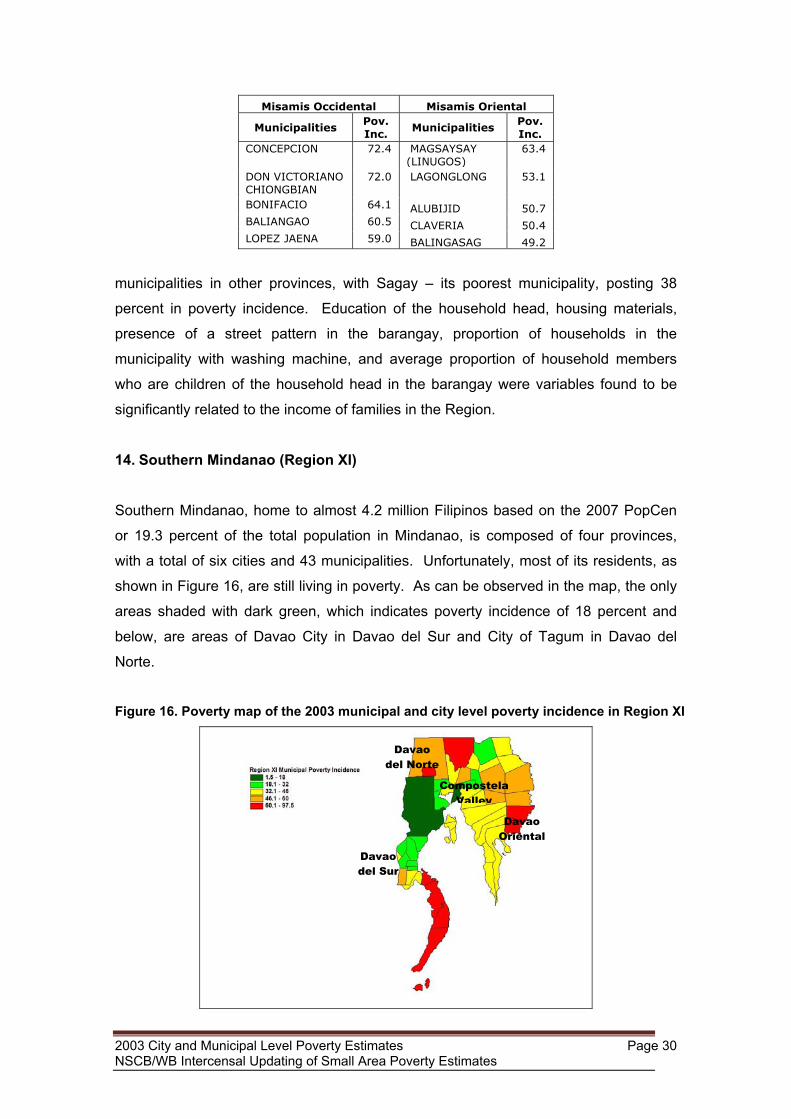
significantly related to the income of families in the Region. 14. Southern Mindanao (Region XI) Southern Mindanao, home to almost 4.2 million Filipinos based on the 2007 PopCen
or 19.3 percent of the total population in Mindanao, is composed of four provinces,
with a total of six cities and 43 municipalities. Unfortunately, most of its residents, as
shown in Figure 16, are still living in poverty. As can be observed in the map, the only
areas shaded with dark green, which indicates poverty incidence of 18 percent and
below, are areas of Davao City in Davao del Sur and City of Tagum in Davao del
Norte.
Figure 16. Poverty map of the 2003 municipal and city level poverty incidence in Region XI
Davao del Sur
Davao del Norte
2003 City and Municipal Level Poverty Estimates NSCB/WB Intercensal Updating of Small Area Poverty
Compostela Valley
Davao Oriental
Page 30 Estimates
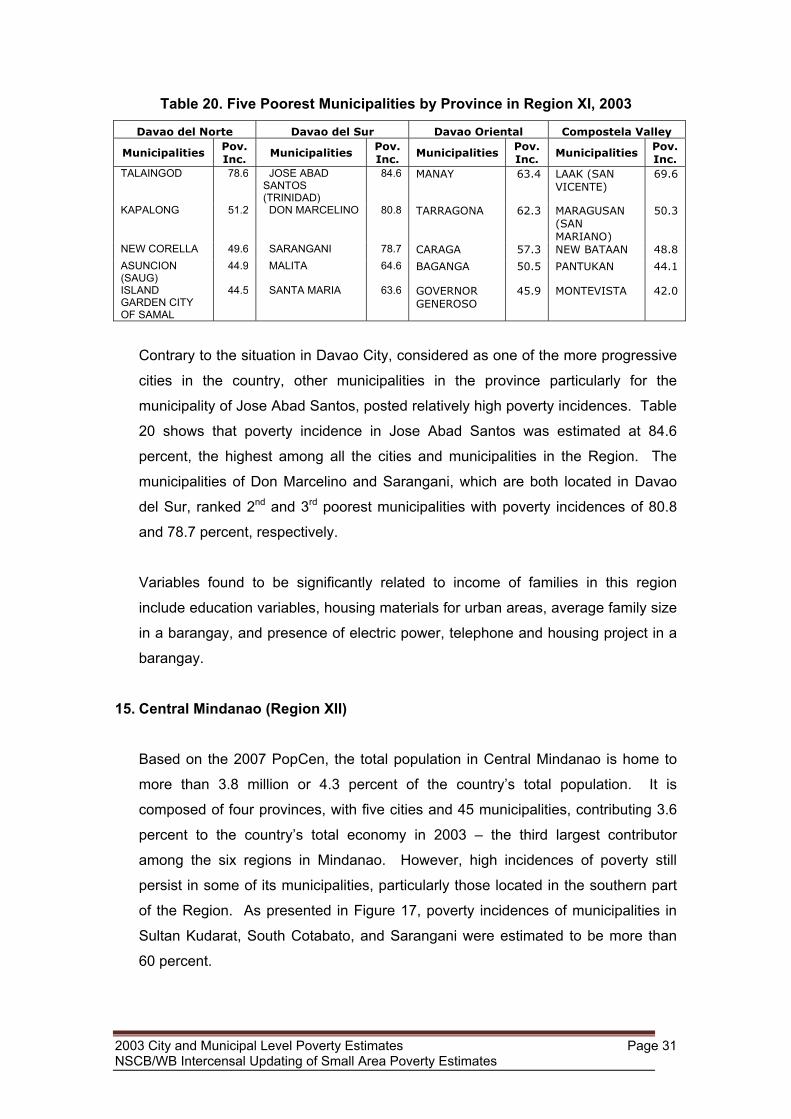
Table 20. Five Poorest Municipalities by Province in Region XI, 2003
Davao del Norte Davao del Sur Davao Oriental Compostela Valley
Municipalities Pov. Inc.
Municipalities Pov. Inc.
Municipalities Pov. Inc.
Municipalities Pov. Inc.
TALAINGOD 78.6 JOSE ABAD SANTOS (TRINIDAD)
84.6 MANAY 63.4 LAAK (SAN VICENTE)
69.6
KAPALONG 51.2 DON MARCELINO 80.8 TARRAGONA 62.3 MARAGUSAN (SAN MARIANO)
50.3
NEW CORELLA 49.6 SARANGANI 78.7 CARAGA 57.3 NEW BATAAN 48.8
ASUNCION (SAUG)
44.9 MALITA 64.6 BAGANGA 50.5 PANTUKAN 44.1
ISLAND GARDEN CITY OF SAMAL
44.5 SANTA MARIA 63.6 GOVERNOR GENEROSO
45.9 MONTEVISTA 42.0
Contrary to the situation in Davao City, considered as one of the more progressive
cities in the country, other municipalities in the province particularly for the
municipality of Jose Abad Santos, posted relatively high poverty incidences. Table
20 shows that poverty incidence in Jose Abad Santos was estimated at 84.6
percent, the highest among all the cities and municipalities in the Region. The
municipalities of Don Marcelino and Sarangani, which are both located in Davao
del Sur, ranked 2nd and 3rd poorest municipalities with poverty incidences of 80.8
and 78.7 percent, respectively.
Variables found to be significantly related to income of families in this region
include education variables, housing materials for urban areas, average family size
in a barangay, and presence of electric power, telephone and housing project in a
barangay.
15. Central Mindanao (Region XII)
Based on the 2007 PopCen, the total population in Central Mindanao is home to
more than 3.8 million or 4.3 percent of the country’s total population. It is
composed of four provinces, with five cities and 45 municipalities, contributing 3.6
percent to the country’s total economy in 2003 – the third largest contributor
among the six regions in Mindanao. However, high incidences of poverty still
persist in some of its municipalities, particularly those located in the southern part
of the Region. As presented in Figure 17, poverty incidences of municipalities in
Sultan Kudarat, South Cotabato, and Sarangani were estimated to be more than
60 percent.
2003 City and Municipal Level Poverty Estimates Page 31 NSCB/WB Intercensal Updating of Small Area Poverty Estimates
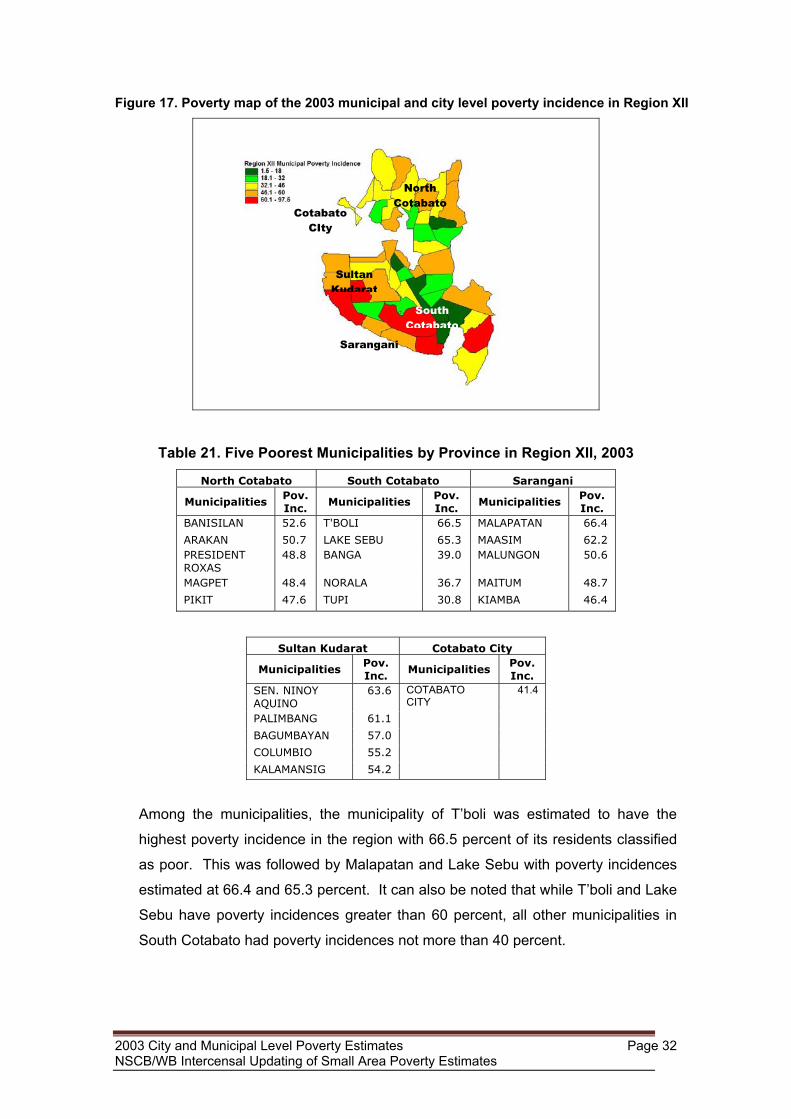
Figure 17. Poverty map of the 2003 municipal and city level poverty incidence in Region XII
North Cotabato
Sultan Kudarat
Sarangani
South Cotabato
Cotabato CIty
Table 21. Five Poorest Municipalities by Province in Region XII, 2003
North Cotabato South Cotabato Sarangani
Municipalities Pov. Inc.
Municipalities Pov. Inc.
Municipalities Pov. Inc.
BANISILAN 52.6 T'BOLI 66.5 MALAPATAN 66.4
ARAKAN 50.7 LAKE SEBU 65.3 MAASIM 62.2 PRESIDENT ROXAS
48.8 BANGA 39.0 MALUNGON 50.6
MAGPET 48.4 NORALA 36.7 MAITUM 48.7
PIKIT 47.6 TUPI 30.8 KIAMBA 46.4
Sultan Kudarat Cotabato City
Municipalities Pov. Inc.
Municipalities Pov. Inc.
SEN. NINOY AQUINO
63.6 COTABATO CITY
41.4
PALIMBANG 61.1
BAGUMBAYAN 57.0 COLUMBIO 55.2 KALAMANSIG 54.2
Among the municipalities, the municipality of T’boli was estimated to have the
highest poverty incidence in the region with 66.5 percent of its residents classified
as poor. This was followed by Malapatan and Lake Sebu with poverty incidences
estimated at 66.4 and 65.3 percent. It can also be noted that while T’boli and Lake
Sebu have poverty incidences greater than 60 percent, all other municipalities in
South Cotabato had poverty incidences not more than 40 percent.
2003 City and Municipal Level Poverty Estimates Page 32 NSCB/WB Intercensal Updating of Small Area Poverty Estimates
Variables found to be significantly related to the income of household are:
education, proportion of persons in the municipality involved in agriculture, and
presence of the following in the barangay: community work, hospitals, housing
project, hotels and similar accommodation establishments.
16. Caraga Region
The Caraga Administrative Region boasts of Butuan, the site of some of the oldest
archeological discoveries in the country and Siargao Island, the surfing capital of
the Philippines. The Region is composed of four provinces, with six cities and 67
municipalities and home to 2.3 million Filipinos based on the 2007 PopCen. As
illustrated in Figure18, most of its residents were classified as poor in 2003, with
most areas shaded red. In fact, only two areas were estimated to have poverty
incidences lower than 32 percent, namely Butuan City and Nasipit, both of Agusan
del Norte.
Figure 18. Poverty map of the 2003 municipal and city level poverty incidence in Caraga
Surigao del Norte
Agusan delNorte
Agusan del Sur
Surigao del Sur
Table 22. Five Poorest Municipalities by Province in Caraga, 2003
Agusan del Norte Agusan del Sur Surigao del Norte Surigao del Sur
Municipalities Pov. Inc.
Municipalities Pov. Inc.
Municipalities Pov. Inc.
Municipalities Pov. Inc.
LAS NIEVES 65.9 SAN LUIS 83.1 SAN ISIDRO 75.5 LINGIG 70.5 JABONGA 63.2 LA PAZ 79.7 CAGDIANAO 74.5 SAN MIGUEL 69.7 TUBAY 60.6 ESPERANZA 78.4 PILAR 72.6 LANUZA 63.5 SANTIAGO 59.1 LORETO 77.7 GIGAQUIT 70.2 HINATUAN 63.3 REMEDIOS T. ROMUALDEZ
53.2 VERUELA 70.6 LIBJO (ALBOR) 69.8 TAGBINA 59.8
2003 City and Municipal Level Poverty Estimates Page 33 NSCB/WB Intercensal Updating of Small Area Poverty Estimates
Among the municipalities in the Region, San Luis in Agusan del Sur was estimated
to have the highest poverty incidence with 83.1 percent of its population or eight
out of ten individuals considered to be poor in 2003. The 2nd and 3rd poorest
municipalities in the region were also part of Agusan del Sur, namely, La Paz and
Esperanza with poverty incidences of 79.7 percent and 78.4 percent, respectively.
Variables that were significantly related to income of the families in this region
were education, housing materials, presence of a market in a barangay, and
proportion of individuals in the municipality five years and older who can speak
Filipino.
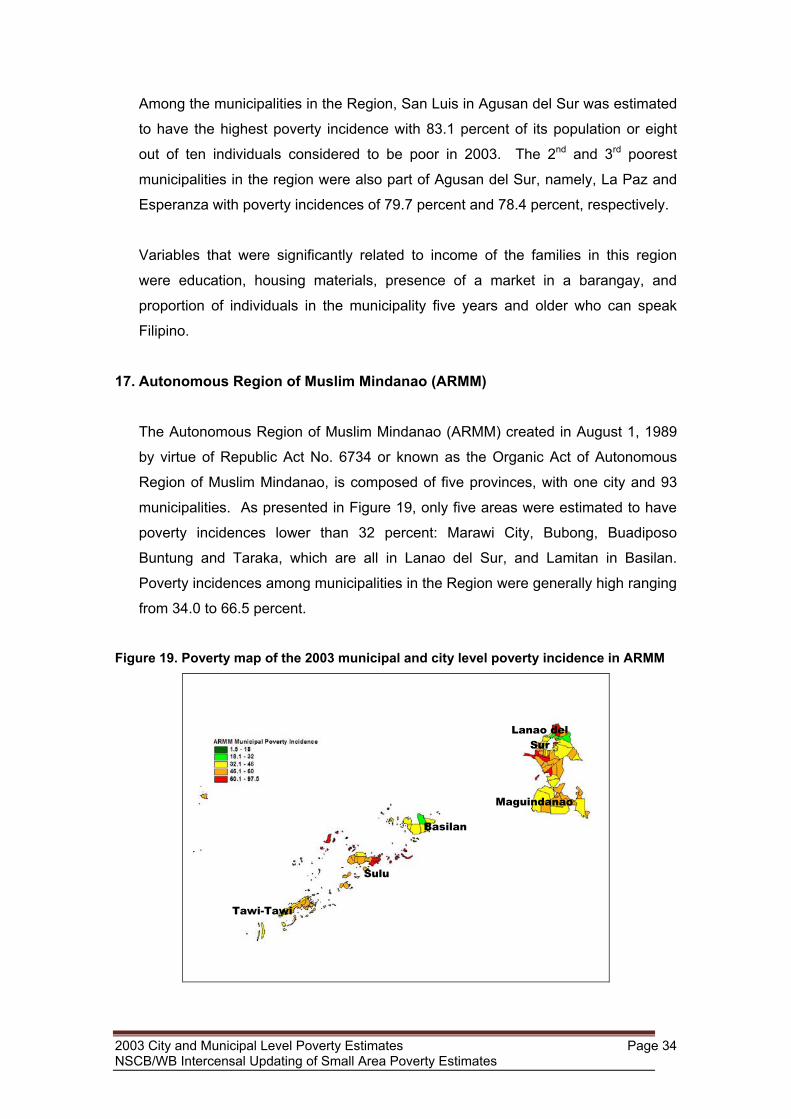
17. Autonomous Region of Muslim Mindanao (ARMM)
The Autonomous Region of Muslim Mindanao (ARMM) created in August 1, 1989
by virtue of Republic Act No. 6734 or known as the Organic Act of Autonomous
Region of Muslim Mindanao, is composed of five provinces, with one city and 93
municipalities. As presented in Figure 19, only five areas were estimated to have
poverty incidences lower than 32 percent: Marawi City, Bubong, Buadiposo
Buntung and Taraka, which are all in Lanao del Sur, and Lamitan in Basilan.
Poverty incidences among municipalities in the Region were generally high ranging
from 34.0 to 66.5 percent.
Figure 19. Poverty map of the 2003 municipal and city level poverty incidence in ARMM
Tawi-Tawi
Sulu
Basilan
Lanao del Sur
Maguindanao
2003 City and Municipal Level Poverty Estimates Page 34 NSCB/WB Intercensal Updating of Small Area Poverty Estimates
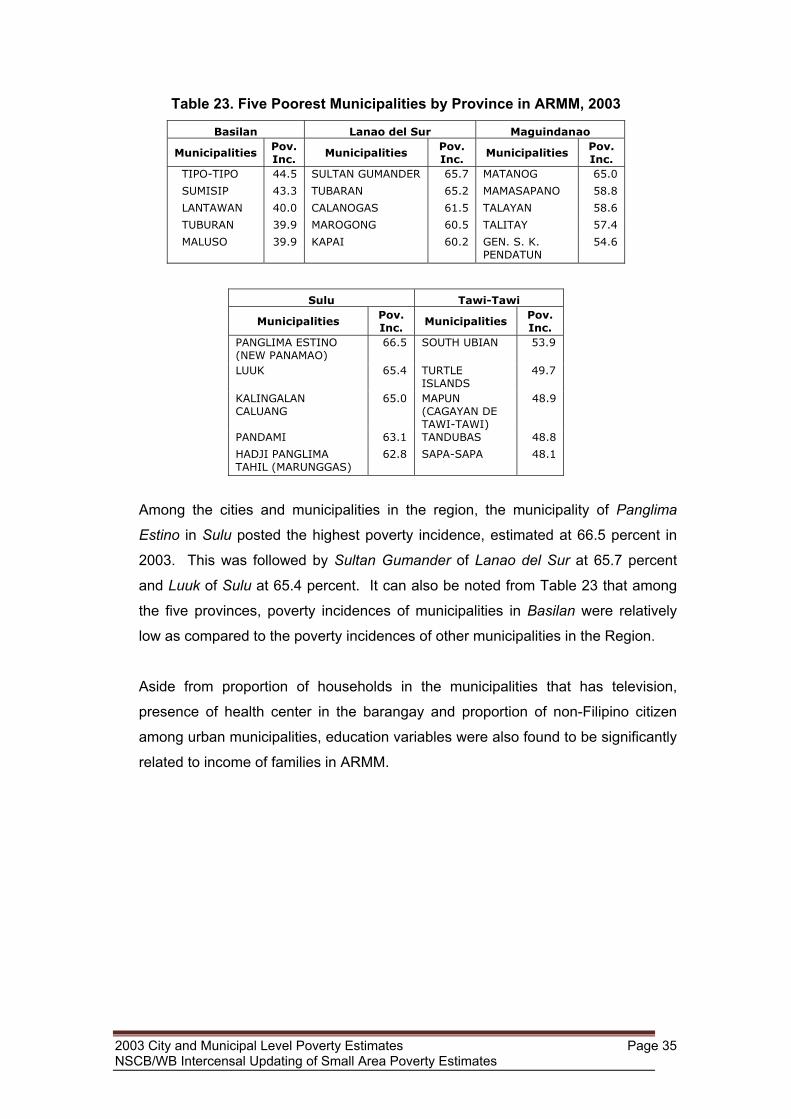
Table 23. Five Poorest Municipalities by Province in ARMM, 2003
Basilan Lanao del Sur Maguindanao
Municipalities Pov. Inc.
Municipalities Pov. Inc.
Municipalities Pov. Inc.
TIPO-TIPO 44.5 SULTAN GUMANDER 65.7 MATANOG 65.0
SUMISIP 43.3 TUBARAN 65.2 MAMASAPANO 58.8
LANTAWAN 40.0 CALANOGAS 61.5 TALAYAN 58.6
TUBURAN 39.9 MAROGONG 60.5 TALITAY 57.4
MALUSO 39.9 KAPAI 60.2 GEN. S. K. PENDATUN
54.6
Sulu Tawi-Tawi
Municipalities Pov. Inc.
Municipalities Pov. Inc.
PANGLIMA ESTINO (NEW PANAMAO)
66.5 SOUTH UBIAN 53.9
LUUK 65.4 TURTLE ISLANDS
49.7
KALINGALAN CALUANG
65.0 MAPUN (CAGAYAN DE TAWI-TAWI)
48.9
PANDAMI 63.1 TANDUBAS 48.8
HADJI PANGLIMA TAHIL (MARUNGGAS)
62.8 SAPA-SAPA 48.1
Among the cities and municipalities in the region, the municipality of Panglima
Estino in Sulu posted the highest poverty incidence, estimated at 66.5 percent in
2003. This was followed by Sultan Gumander of Lanao del Sur at 65.7 percent
and Luuk of Sulu at 65.4 percent. It can also be noted from Table 23 that among
the five provinces, poverty incidences of municipalities in Basilan were relatively
low as compared to the poverty incidences of other municipalities in the Region.
Aside from proportion of households in the municipalities that has television,
presence of health center in the barangay and proportion of non-Filipino citizen
among urban municipalities, education variables were also found to be significantly
related to income of families in ARMM.
2003 City and Municipal Level Poverty Estimates Page 35 NSCB/WB Intercensal Updating of Small Area Poverty Estimates
III. Actual Policy Uses
Behind all these efforts by the NSCB to generate small area estimates of poverty,
there is a need for statistical capacity building among the producers, users and the
providers of statistics. As the NSCB responds to the need to produce more
relevant statistics, there is a strong need for the data users to demonstrate better
use of statistics to improve the relevance of the NSCB and the PSS.
A. Philippines
It is worth noting that the results of the earlier poverty mapping project undertaken
by the NSCB played a significant role, especially in policy formulation and
targeting. Following is a list of actual policy uses of the 2000 small area estimates
of poverty released in 2005, which can also serve as a reference for other policy-
and decision-makers:
1. Targeting Beneficiaries of Programs/Projects
1.1 The Department of Social Welfare and Development (DSWD) used the
small area estimates of poverty in their Pantawid Pamilyang Pilipino Program to identify the poorest municipalities from the 20 poorest
provinces. Data will be collected from residents of these municipalities to
determine beneficiaries of their poverty reduction programs.
1.2 The National Nutrition Council (NNC) and DSWD used the small area
estimates of poverty in December 2007 to identify priority households for
the Pamaskong Handog of GMA.
1.3 The Department of Agriculture (DA) used the 2000 small area estimates of
poverty as one criterion in the identification of target sites of the Cordillera
Highland Agricultural Resources Management Project (CHARMP II).
1.4 The Regional Development Council of Region I (RDC I) used the 2000
small area estimates of poverty in the identification of common priority
areas for poverty-related programs in the region.
2003 City and Municipal Level Poverty Estimates Page 36 NSCB/WB Intercensal Updating of Small Area Poverty Estimates
1.5 The Regional KALAHI Convergence Group (RKCG) used the estimates to
serve as one of the bases in identifying its convergence municipalities
throughout the region (e.g., MIMAROPA, Region VI).
1.6 The NSCB RD VI provided a list of the five poorest municipalities for each
of the six provinces of the region to the Office of the Presidential Adviser for
Regional Development (OPARD). The list will be used in identifying target
municipalities for the livelihood projects of the Department of Labor and
Employment (DOLE). These projects include the Integrated Services for
Livelihood Advancement of Fisherfolks (ISLA) and Tulong
Panghanapbuhay sa Ating Disadvantaged Workers (TUPAD).
1.7 The Philippine Health Insurance Corporation used the results as inputs to
determine target enrolment for its health insurance sponsored programs in
2007 (e.g.,Regions VIII and XII).
1.8 The small area poverty estimates were used by the Local Government
Units (LGUs) in Antique, DSWD, Department of Education (DepEd) and
National Food Authority (NFA) in the estimation of the volume of rice
needed for the “Food for Children” Program in the province.
1.9 The MPAI-World Vision used the poverty mapping results to determine
priority municipalities in Leyte in May 2007 for: (i) sponsorship program for
schooling of indigent children; and (ii) for micro-enterprise development
(MED) projects.
1.10 The DSWD used the municipal poverty incidences in identifying priority
municipalities for Kapit-Bisig Laban sa Kahirapan Comprehensive and
Integrated Delivery of Social Services (KALAHI-CIDSS) (e.g., Samar).
1.11 The LGUs in Zamboanga del Norte and Zamboanga Sibugay used the SAE
of poverty extensively for the allocation of funds to and implementation of
projects in priority/depressed areas.
2003 City and Municipal Level Poverty Estimates Page 37 NSCB/WB Intercensal Updating of Small Area Poverty Estimates
2. Policy Formulation and Planning
2.1 The SAE of poverty were used as reference by the Millennium
Development Goals – International Conference on Population and
Development (MDG-ICPD) Localization Task Force in Region VI in its
orientation to various Provincial Poverty Reduction Action Teams
(PPRATs), in the design and implementation of their local poverty action
plan.
2.2 The estimates were used by the KALAHI CIDDSS Project Management
Team in Region VIII (RPMT) for project planning.
2.3 The NEDA XII used the estimates as inputs for their study on the socio
economic reconstruction and development of conflict-affected areas in
Mindanao and in the revision of their Medium Term Regional Development
Plan (MTRDP).
2.4 The Runggiyan Social Development Foundation used the estimates in the
preparation of a proposal on the Infrastructure for Rural Productivity
Enhancement Sector Project of Barugo, Leyte.
2.5 The Compostela Valley Provincial Government used the results in the
revision of their Provincial Development and Physical Framework Plan and
in the preparation of their Provincial Plan for Children.
3. Poverty Monitoring
3.1 Various local government units (LGUs) of Regions I, IV, and VIII used the
estimates in monitoring the attainment of the MDGs at the local level as
basis in setting the MDG targets (Goal 1) as well as in the preparation of
their MDG action plans in 2006.
3.2 The LGUs in CALABARZON used the small area poverty estimates, along
with the official poverty statistics, in the preparation of their 2007 State of
the Children Report.
2003 City and Municipal Level Poverty Estimates Page 38 NSCB/WB Intercensal Updating of Small Area Poverty Estimates
3.3 The NEDA Regional Development Council (NEDA RDC) used the
estimates in the assessment of interventions being provided to the poorest
municipalities in Eastern Visayas and for future targeting purposes of the
different local government agencies.
3.4 The NNC Region VIII used the estimates in assessing the nutritional
situation of municipalities in the region in October 2007.
3.5 The Asia Pacific and Policy Center (APPC)/Human Development Network
(HDN) used the estimates as inputs in the preparation of the La Union
Provincial Development Report.
3.6 The estimates were used by the LGUs in La Union in the development of
their Provincial MDG database
Further, it is worth-noting that the relevance of the 2003 intercensal small area
estimates of poverty was already demonstrated by various government agencies,
within seven months3 from its release in September 2008. Below is a list of the
actual policy uses of the 2003 estimates:
1. The 2003 intercensal small area estimates of poverty was used by the
DSWD as basis for prioritizing target households for the National
Household Targeting System for Poverty Reduction (NHTSPR) as well as
in their conditional cash transfer (CCT) program presently being
implemented.
2. The DOLE, Department of Health (DOH), and the Professional Regulation
Commission, Board of Nursing (PRC-BON) used the 2003 SAE of poverty
as inputs in the design and implementation of their collaborative
training/deployment Project on Nurses Assigned in Rural Service (NARS).
The Project aims to mobilize unemployed registered nurses to the 1,000
poorest municipalities in the country to improve the delivery of health care
services.
3 As of March 2009.
2003 City and Municipal Level Poverty Estimates Page 39 NSCB/WB Intercensal Updating of Small Area Poverty Estimates
B. International community
Small area estimation methodology has been used not only in the Philippines but
in numerous countries around the world. The following are just some of the
experiences in the different countries around the world as presented by Dr. Roy
van der Weide during the National Dissemination Forum last 4 September 2008:
1. Indonesia
1.1 “In 2005, the government of Indonesia decided to cut fuel subsidies. The
resulting increase in fuel prices would particularly affect the poor, and the
government planned to cushion this negative shock by providing
unconditional cash transfers to the poor. The Ministry of Finance used the
poverty maps to estimate the budget for the cash transfers” (Ahmad and
Goh, 2007).
2. Cambodia
2.1 The Ministry of Agriculture, Forestry and Fisheries has “used the poverty
map as a guide in selecting target areas for agro-ecosystems analysis” –
and “to target the poorest communes for agricultural productivity
improvement and crop diversification” (Fujii, 2007).
3. China
3.1 Food-and-cash for work programs make “use of the surplus labor resources
in poor areas to build infrastructure such as roads, water management
structures and drinking water treatment facilities. The program aims at
providing poor farmers with job opportunities and sources of income”
(Ahmand and Goh, 2007).
4. Morocco
4.1 “The impact of the poverty maps on Moroccan social policy has been
strong and direct”. They were released in June 2004, which was followed
by a World Bank analysis of poverty and targeting at the local level, and in
2003 City and Municipal Level Poverty Estimates Page 40 NSCB/WB Intercensal Updating of Small Area Poverty Estimates
“May 2005, King Mohammed VI launched the National Initiative for Human
Development”. One Billion USD would be allocated, half of which would be
invested in the poorest 360 rural communes and poorest 250 urban
neighborhoods (Litvack, 2007).
4.2 Poverty maps played a role in promoting local governance. The maps
provided citizens and local officials with relative poverty rankings of the
areas in which they live. “This empowered them to question the
government allocations to their communes and hold government officials
accountable for any lack of equitable treatment in the geographical
distribution of government programs” (Litvack, 2007).
5. Bulgaria
5.1 “Immediately after the 2005 maps had been completed, the Ministry of
Labour and Social Policy (MLSP) organized consultations with the mayors
and other representatives of the 13 poorest municipalities”, which resulted
in “the development of an ad hoc Program for Poverty Reduction … It
identified priority areas for intervention and the allocation of resources,
including the generation of employment, especially among the long-term
unemployed and disadvantaged groups in the labor market” (Gotcheva,
2007).
5.2 Contributed in reducing poverty in the disadvantaged municipalities by
creating alternative income sources such as agro-industries, bio-fuels, rural
tourism, local crafts, wood working, carpentry …” (Gotcheva, 2007).
2003 City and Municipal Level Poverty Estimates Page 41 NSCB/WB Intercensal Updating of Small Area Poverty Estimates
IV. Conclusions and Recommendations
1. Using the modified ELL methodology, 1,380 out of 1,622 (85%) city and
municipal level estimates for 2003 have Cvs not greater than 20 percent.
2. For further improvement of the estimates, inclusion of other indicators in the
conduct of survey (i.e., FIES) or census (i.e., CPH) may be considered,
such as migration and tourism indicators. Inclusion of these variables in
the development of the regional models will likely improve poverty
estimates that will be generated.
3. In the intercensal updating of small area poverty estimates, variables to be
used in the model-building process need not be restricted to only those that
are considered to be time-invariant. Possibility of using regression
model(s) to come up with intercensal estimates of independent variables,
which may possibly be significantly correlated with income but may vary
over time.
4. Cognizant of the importance of this information for targeting and
policymaking, the NSCB would like to update these estimates to further
guide the national and local governments in targeting priority areas in the
implementation of poverty reduction programs of the government.
However, as this is beyond the regular work of the NSCB and in light of its
limited manpower and financial resources, the Government should realize
that statistics play a critical role for coming up with informed decisions,
better design of programs; hence, should invest more on statistics.
5. Behind all these efforts by the NSCB to generate small area estimates of
poverty, there is a need for statistical capacity building among the
producers, users and the providers of statistics. As the NSCB responds to
the need to produce more relevant statistics, data users should
demonstrate better use of statistics in policy-making and program
implementation.
2003 City and Municipal Level Poverty Estimates Page 42 NSCB/WB Intercensal Updating of Small Area Poverty Estimates
ANNEX
2003 City and Municipal Level Poverty Estimates Page 43 NSCB/WB Intercensal Updating of Small Area Poverty Estimates
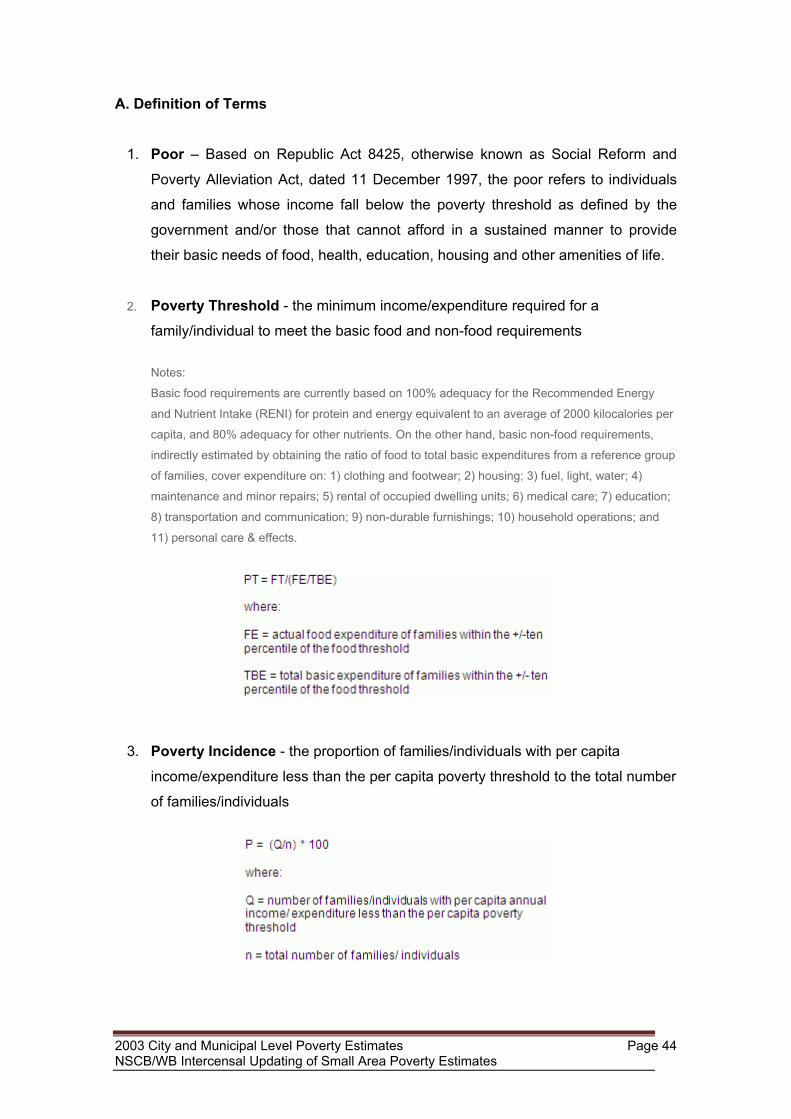
A. Definition of Terms
1. Poor – Based on Republic Act 8425, otherwise known as Social Reform and
Poverty Alleviation Act, dated 11 December 1997, the poor refers to individuals
and families whose income fall below the poverty threshold as defined by the
government and/or those that cannot afford in a sustained manner to provide
their basic needs of food, health, education, housing and other amenities of life.
2. Poverty Threshold - the minimum income/expenditure required for a
family/individual to meet the basic food and non-food requirements
Notes:
Basic food requirements are currently based on 100% adequacy for the Recommended Energy
and Nutrient Intake (RENI) for protein and energy equivalent to an average of 2000 kilocalories per
capita, and 80% adequacy for other nutrients. On the other hand, basic non-food requirements,
indirectly estimated by obtaining the ratio of food to total basic expenditures from a reference group
of families, cover expenditure on: 1) clothing and footwear; 2) housing; 3) fuel, light, water; 4)
maintenance and minor repairs; 5) rental of occupied dwelling units; 6) medical care; 7) education;
8) transportation and communication; 9) non-durable furnishings; 10) household operations; and
11) personal care & effects.
3. Poverty Incidence - the proportion of families/individuals with per capita
income/expenditure less than the per capita poverty threshold to the total number
of families/individuals
2003 City and Municipal Level Poverty Estimates Page 44 NSCB/WB Intercensal Updating of Small Area Poverty Estimates
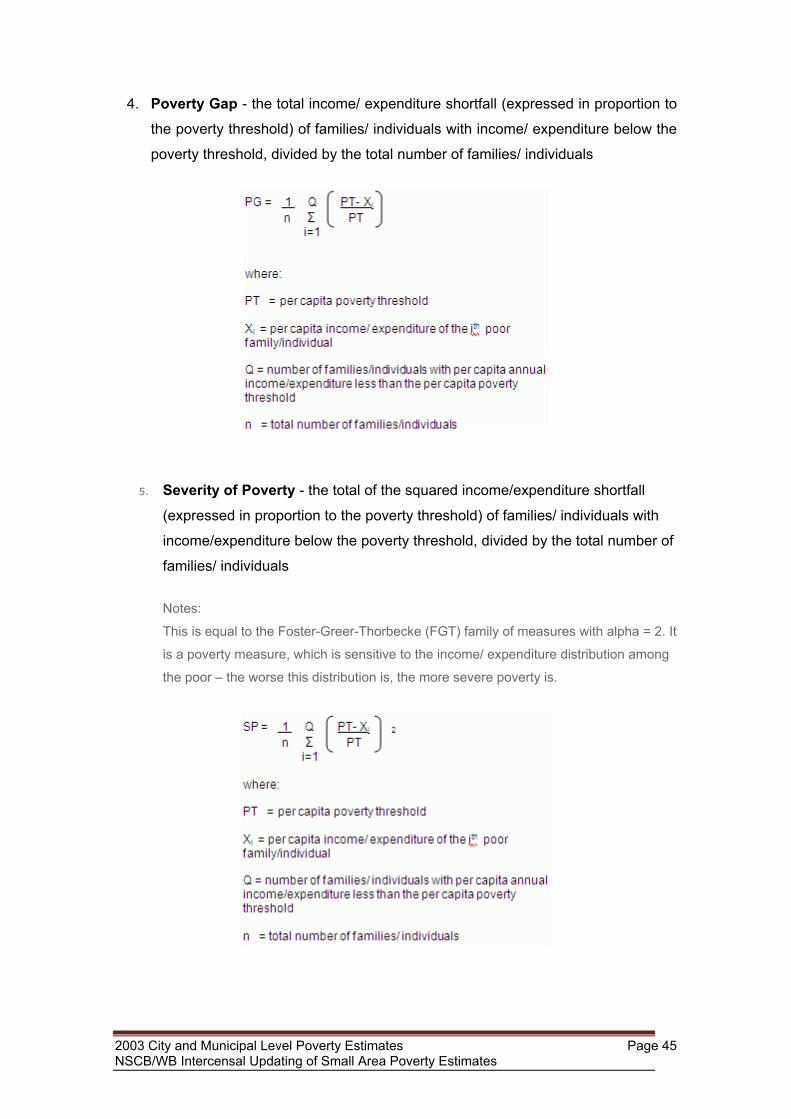
4. Poverty Gap - the total income/ expenditure shortfall (expressed in proportion to
the poverty threshold) of families/ individuals with income/ expenditure below the
poverty threshold, divided by the total number of families/ individuals
5. Severity of Poverty - the total of the squared income/expenditure shortfall
(expressed in proportion to the poverty threshold) of families/ individuals with
income/expenditure below the poverty threshold, divided by the total number of
families/ individuals
Notes:
This is equal to the Foster-Greer-Thorbecke (FGT) family of measures with alpha = 2. It
is a poverty measure, which is sensitive to the income/ expenditure distribution among
the poor – the worse this distribution is, the more severe poverty is.
2003 City and Municipal Level Poverty Estimates Page 45 NSCB/WB Intercensal Updating of Small Area Poverty Estimates
B. Methodology 1. Overview
In this study, the main consideration is to identify local areas that need to be
prioritized in poverty alleviation programs. These areas, which have uncontained
pockets of poverty, are often sought through the use of nationwide survey data that
provide information on poverty indicators. These surveys usually have a great deal
of information, such as income and expenditure, but have limited sample size that
can only provide reliable estimates at larger geographic disaggregation such as
regions, but not at smaller geographic level such as provinces or municipalities or
cities. The census, on the other hand, has complete coverage and therefore can
produce reliable estimates at smaller geographic levels. However, the census
usually has limited information and does not contain data on income and
expenditure, which are the variables usually needed as inputs in poverty
estimation.
A solution to this problem is the use of small area estimation (SAE) technique.
There are numerous techniques that can be used to generate statistics at the local
area. One of these techniques is the methodology developed by the World Bank,
which is commonly referred to as the Elbers, Lanjouw and Lanjouw (ELL)
methodology. Such methodology requires the use of census and survey data sets
conducted on the same year. In the Philippines, this situation occurred in the year
2000. Consequently, a Poverty Mapping Project implemented by the NSCB with
funding assistance from the World Bank used the ELL method to generate the
municipal and city level poverty statistics for 2000. As mentioned in the previous
section, the project made use of the FIES, LFS and CPH data sets that were all
gathered in the same year, 2000, as required in the methodology. More so, the
methodology in the project made use of a single regression model4 for the whole
country to predict the family income per capita in logarithmic form.
The situation, however, is different in 2003. While there are no census data set for
the year to speak of there is a nationwide survey, which is the usual source of
poverty statistics, in 2003. Thus, in updating the small area poverty estimates from
4 Regression is a statistical tool used to predict one variable using other variables/information. For example, one can predict a salesperson’s total yearly sales using information on age, education and years of experience of the salesperson.
2003 City and Municipal Level Poverty Estimates Page 46 NSCB/WB Intercensal Updating of Small Area Poverty Estimates
the census year 2000 to the intercensal year 2003, a slightly different approach
was used.
The information from the 2003 FIES, 2003 LFS and 2000 CPH were combined to
estimate poverty incidence, poverty gap, and poverty severity for the provincial and
municipal levels. Statistical regression is used to predict per capita family income,
expressed in natural logarithmic form Y, using explanatory variables, which are
denoted as X.
Similarly with 2000 poverty mapping project, X can be classified into two types: the
survey-obtainable variables, at the household or individual level (e.g., educational
attainment of household head); and the census-derivable location variables, which
correspond to barangay or municipal means (e.g. average family size in the
barangay). It is important that the X’s used in modeling should be comparable
both in the survey and the census. In general, comparability means that X has the
same definition in both survey and census.
However, the 2000 poverty mapping project, comparability assessment was more
straightforward because the data sets used (i.e., FIES, LFS and CPH) have the
same reference period: the year 2000. Selection of survey-obtainable variables
was done by examining the survey and census questionnaires to identify which
questions elicit equivalent information. In several cases, equivalence were
achieved by collapsing some categories of answers. When common variables had
been identified, the appropriate summary statistics were compared for the survey
and the census data.
It is ideal that the summary statistics for the census data be within the confidence
interval for the survey. Comparability assessment is not required for the case of
location-effect variables because these are essentially sourced from the census,
which were only merged with the survey; and as long as the geographic
configurations between survey and census are the same.
Assessing comparability in the case of updating small area poverty statistics
requires more attention. It should be noted that the survey data were taken in 2003
while census data were obtained in 2000, while the goal is to come up with 2003
poverty statistics at the small area level. Hence, there is a time component that
should be taken into consideration. Using the same methodology as in the 2000
poverty mapping project will result to ambiguity since such procedure captures
2003 City and Municipal Level Poverty Estimates Page 47 NSCB/WB Intercensal Updating of Small Area Poverty Estimates
relationship between Y and X, through regression modeling using 2003 survey
information but fitting the model using 2000 census data, which is of a different
reference period.
To address the issue, the survey-obtainable variables were carefully evaluated.
First, the survey and census questionnaires were examined carefully not only to
identify which questions refer to equivalent information but also those, which are
time-invariant. Time invariance implies that the characteristic is not likely to change
from time to time, or at least in three years in this case. This can be done by
purposely collapsing some categories of answers to pre-defined categories. For
example, a binary variable head_athsgrad1 can be created, with value 1 if the
head of the household is at least high school graduate and 0 otherwise. If the head
of the household is at least high school graduate in 2000, he/she is still at least
high school graduate in 2003. When there are sufficient number of time-invariant
variables that have been created, appropriate summary statistics are compared for
the survey and census data. A variable will be included in the list of possible X’s if
the summary statistics for the census data is within the confidence interval of the
survey data. Likewise, location-effect variables represented by the census are also
considered.
After identifying possible X’s, several regression models were developed to
estimate the natural logarithmic form of per capita income Y. A reasonable model
is then chosen which satisfies the following practical criteria (in addition to the
usual regression diagnostics):
• The relationship of the variables, whether positive or negative, on Y is generally
consistent with earlier researches on poverty (e.g. education should have a
positive effect on income).
• The models should be robust, which means that small changes to the model do
not greatly affect the significance or signs of the variables.
• Estimated regional poverty incidence does not largely differ from the official
regional poverty estimates.
Selected regional models were then used to generate 2003 per capita income for
all households in the CPH and these were compared to the poverty lines to
estimate the different poverty measures, poverty incidence, poverty gap and
severity of poverty at the provincial, city and municipal levels.
2003 City and Municipal Level Poverty Estimates Page 48 NSCB/WB Intercensal Updating of Small Area Poverty Estimates
2. Data Sources
A. 2003 Official Poverty Statistics
The NSCB generates official poverty statistics based on the NSCB Resolution No.
1 Series of 2003, Approving the Proposed Methodology for the Computation of
Provincial Poverty Statistics. Official Poverty Statistics include food threshold,
poverty threshold, subsistence incidence, poverty incidence, magnitude of poor,
income gap, poverty gap and severity of poverty. The 2003 official provincial
poverty thresholds, with urban and rural disaggregation, were applied in the
estimation of the 2003 small area poverty estimates in this Project.
B. This study also made used of the following datasets from the National
Statistics Office (NSO):
• 2003 Family Income and Expenditure Survey (FIES) The FIES is a nationwide survey conducted every three years where information
on household income and expenditure, as well as, some socio-demographic
characteristics of the household head are collected. It is the main source of data in
the estimation of official poverty statistics in the country. The 2003 FIES is a
regular module of the Integrated Survey of Household (ISH), which contains
42,094 sample households, distributed across the 17 regions of the country.
• January 2004 Round of the Labor Force Survey (LFS) The LFS is another regular module of the ISH conducted every quarter of the year.
It collects data on the demographic and socio-economic characteristics of
population 15 years old and over. Sample households of the second and fourth
quarter round of the LFS coincide with the sample households of the FIES. Thus,
these two data sets were combined to form a richer data set.
• 2000 Census of Population and Housing (CPH) The CPH is a complete enumeration of the population in the country conducted at
least every ten years. It is a vital source of information on the composition of the
population and characteristics of their housing units. It covers all areas under the
jurisdiction of the Philippines as defined by the 1987 Constitution.
2003 City and Municipal Level Poverty Estimates Page 49 NSCB/WB Intercensal Updating of Small Area Poverty Estimates
3. Implementation of the Methodology5
This section presents a general perspective on small area estimation following the
ELL method implemented in the Philippines for the intercensal year 2003. As the
methodology used in this updating is similar to the previous poverty mapping
project up to a certain extent, some parts of this section are lifted directly from the
previous Estimation of Local Poverty in the Philippines report.
a. Introduction/Background
In introducing the concept of small area estimation, we consider the thrust of the
national government of alleviating the poverty status of the country. To maximize
the effect of any poverty alleviation program, there are a number of factors that
have to be carefully taken into account before implementation. One of the most
common considerations is the proper identification of priority areas. Answers to
questions such as which areas need most help and assistance from the
government are often sought from national surveys that provide information on
poverty indicators. Needless to say, users want surveys to have as much coverage
as that of a census. However, this is not usually feasible because survey coverage
is directly proportional to the amount of administrative and financial resources
required to carry out the survey. Thus, surveys being incomplete enumeration of all
populations units, have limitations and sampling errors. Due to the sampling
design, surveys may not be representative at the province and district level, such
that estimates may tend to be biased. In this context, survey domains provide
information on the level of disaggregation of direct estimates that can be derived
from a survey which are theoretically reliable. For example, the domain of the 2003
FIES conducted by NSO corresponds to the geographic region. Therefore, it is not
surprising to get relatively high standard errors for some poverty estimates at the
provincial level. This could imply that the sample is not representative at that level,
and so, the estimates may tend to be biased. Further, analogous estimates at the
municipal level is expected to be less reliable should these be generated directly
from the survey. In this example, the sets of geographic provinces and
municipalities are referred to as statistical small areas. Hence, small area
estimation is a collection of statistical techniques designed to provide reliable
5 Most of the procedures discussed in this section were implemented using PovMap version 2.06. PovMap is a software package that computes poverty and inequality indicators at a spatially disaggregated level.
2003 City and Municipal Level Poverty Estimates Page 50 NSCB/WB Intercensal Updating of Small Area Poverty Estimates

estimates beyond the survey domain. There are a number of small area
techniques and among them is the ELL method used to generate the municipal
poverty statistics for the census year 2000.
In updating the small area poverty estimates from the 2000 census year to the
intercensal year 2003, a similar approach was used. The information from the 2003
FIES, 2003 Labor Force Survey (LFS), and 2000 Census of Population and
Housing (CPH) were combined to estimate poverty incidence, poverty gap, and
poverty severity at the provincial and municipal levels. Statistical regression was
used to predict per capita family income, expressed in natural logarithmic form6, Y,
using explanatory variables, which we denote as X.
b. Selection of Explanatory Variables
Similar to the earlier poverty mapping project, X can be classified into two types:
the survey-obtainable variables, at the household or individual level (e.g.,
educational attainment of household head, etc.); and the census-derivable location
variables, which correspond to barangay or municipal means (e.g., existence of a
market in the barangay). It is important that X used in modeling should be (a)
available both in the survey and census; (b) comparable and/or consistent with
both the survey and census (i.e., X follows the same definition in both survey and
census) and (c) have survey and census statistics (mean value) that match.
It may be noted that the overall objective is to compute city and municipal level
poverty statistics, with reliable and/or acceptable levels of precision. This can be
done by modeling income using X and fitting the resulting model using its census
counterpart. Once this has been done, there will be predicted (per capita) income
for all family units in the population. Effectively, strength is borrowed from the
census which has a larger coverage than the survey. Note that such procedure
requires that the variables constituting X should also be available from the census.
In addition to availability, comparability is also an essential component in order to
make the substitution of X with its census counterpart to compute predicted (per
capita) family income become valid. 6 Using natural logarithmic form of income is a usual approach in a number of econometric models. This is done because log of income has symmetric distribution (while income has a highly skewed distribution). The error term in the model, which denotes the unexplained part of the dependent variable, is also assumed symmetric. Such that a model specification where the dependent variable and the error term have a similar distribution will be preferred to a model where they have very different distributions. For a more thorough discussion of this approach, the readers are referred to statistical regression theory texts.
2003 City and Municipal Level Poverty Estimates Page 51 NSCB/WB Intercensal Updating of Small Area Poverty Estimates

In the earlier poverty mapping project, comparability assessment is more
straightforward as the data sets used (i.e., FIES, LFS and CPH) have the same
reference period (i.e., 2000). Selection of survey-obtainable explanatory data can
be done by examining the survey and census questionnaires to identify which
questions elicit equivalent information. In several cases, equivalence may be
achieved by collapsing some categories of answers. When common variables
have been identified, the appropriate summary statistics are compared for the
survey and the census data. For variables to be considered as consistent,
summary statistics for the census data should be within the confidence interval for
the survey. Comparability assessment is not required for the case of location-effect
variables as these are sourced from the census, which were merged with the
survey; and as long as the geographic configurations between survey and census
are the same.
Assessing comparability in the case of updating small area poverty statistics
requires more attention. Note that survey data is for 2003 while census data is for
2000, and our goal is to come up with 2003 poverty statistics at the small area
level. Hence, the time component has to be taken into consideration, otherwise
ambiguity may arise when the relationship between Y and X is captured through
regression modeling using 2003 survey information but fitting the model using
2000 census data. To address the issue, survey-obtainable variables were
carefully screened by examining the survey and census questionnaires not only to
identify which questions elicit equivalent information but also those, which are time-
invariant. Time invariance, as used in this Project, means that the characteristic is
not likely to change from time to time (i.e., stable over time). For some of the
variables, this can be done by purposely collapsing some categories of answers to
pre-defined categories. For example, a binary variable hea_noed can be created,
with value 1 if the head of the household did not have any formal education, 0
otherwise. If the head of the household has no formal education in 2003, he / she
also has no formal education in 2000. When as many as possible of these “at
least” type of variables have been created, appropriate summary statistics are
compared for the survey and census data. A variable will be included in the list of
explanatory variables X if the summary statistics for the census data is within the
confidence interval of the survey data. Likewise, we also include in the list of
explanatory variables X, location-effect variables represented by the census
means.
2003 City and Municipal Level Poverty Estimates Page 52 NSCB/WB Intercensal Updating of Small Area Poverty Estimates
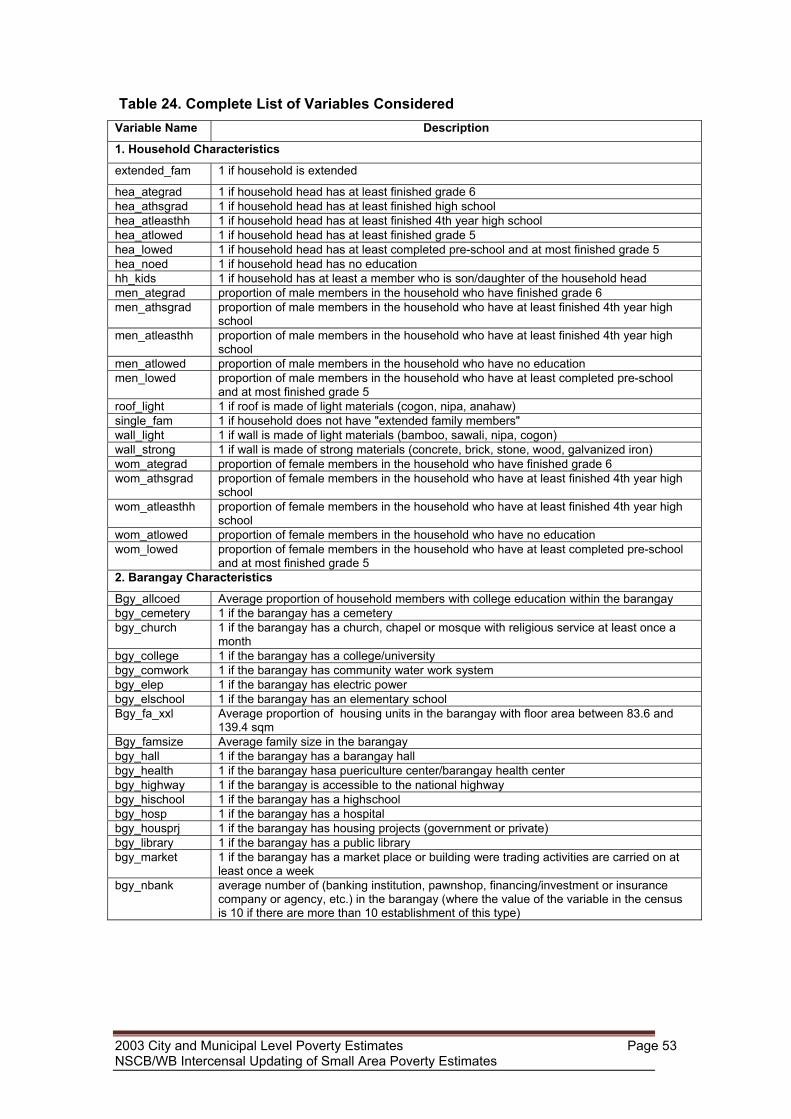
Table 24. Complete List of Variables Considered Variable Name Description
1. Household Characteristics
extended_fam 1 if household is extended
hea_ategrad 1 if household head has at least finished grade 6 hea_athsgrad 1 if household head has at least finished high school hea_atleasthh 1 if household head has at least finished 4th year high school hea_atlowed 1 if household head has at least finished grade 5 hea_lowed 1 if household head has at least completed pre-school and at most finished grade 5 hea_noed 1 if household head has no education hh_kids 1 if household has at least a member who is son/daughter of the household head men_ategrad proportion of male members in the household who have finished grade 6 men_athsgrad proportion of male members in the household who have at least finished 4th year high
school men_atleasthh proportion of male members in the household who have at least finished 4th year high
school men_atlowed proportion of male members in the household who have no education men_lowed proportion of male members in the household who have at least completed pre-school
and at most finished grade 5 roof_light 1 if roof is made of light materials (cogon, nipa, anahaw) single_fam 1 if household does not have "extended family members" wall_light 1 if wall is made of light materials (bamboo, sawali, nipa, cogon) wall_strong 1 if wall is made of strong materials (concrete, brick, stone, wood, galvanized iron) wom_ategrad proportion of female members in the household who have finished grade 6 wom_athsgrad proportion of female members in the household who have at least finished 4th year high
school wom_atleasthh proportion of female members in the household who have at least finished 4th year high
school wom_atlowed proportion of female members in the household who have no education wom_lowed proportion of female members in the household who have at least completed pre-school
and at most finished grade 5 2. Barangay Characteristics
Bgy_allcoed Average proportion of household members with college education within the barangay bgy_cemetery 1 if the barangay has a cemetery bgy_church 1 if the barangay has a church, chapel or mosque with religious service at least once a
month bgy_college 1 if the barangay has a college/university bgy_comwork 1 if the barangay has community water work system bgy_elep 1 if the barangay has electric power bgy_elschool 1 if the barangay has an elementary school Bgy_fa_xxl Average proportion of housing units in the barangay with floor area between 83.6 and
139.4 sqm Bgy_famsize Average family size in the barangay bgy_hall 1 if the barangay has a barangay hall bgy_health 1 if the barangay hasa puericulture center/barangay health center bgy_highway 1 if the barangay is accessible to the national highway bgy_hischool 1 if the barangay has a highschool bgy_hosp 1 if the barangay has a hospital bgy_housprj 1 if the barangay has housing projects (government or private) bgy_library 1 if the barangay has a public library bgy_market 1 if the barangay has a market place or building were trading activities are carried on at
least once a week bgy_nbank average number of (banking institution, pawnshop, financing/investment or insurance
company or agency, etc.) in the barangay (where the value of the variable in the census is 10 if there are more than 10 establishment of this type)
2003 City and Municipal Level Poverty Estimates Page 53 NSCB/WB Intercensal Updating of Small Area Poverty Estimates

Table 24. (continued) Variable Name Description
2. Barangay Characteristics
bgy_ncafe average number of (restaurants, cafeteria, or refreshment parlor excluding temporary restaurants, cafeteria, or refreshment parlor; beauty parlor; barber shop; industry shop; funeral parlor; and other personal services establishments) in the barangay (where the value of the variable in the census is 10 if there are more than 10 establishment of this type)
bgy_news 1 if the barangay has a newspaper circulation
bgy_nfactory
average number of (manufacturing establishments like rice or corn mill, tailor or dress shop or shoe factory, furniture factory, blacksmith shop) in the barangay (where the value of the variable in the census is 10 if there are more than 10 establishment of this type)
bgy_nhotel
average number of (hotel dormitory, and other lodging places) in the barangay (where the value of the variable in the census is 10 if there are more than 10 establishment of this type)
bgy_nplay
average number of (recreational establishments like theater or movie house, night club, cabaret, bar, beer garden, billiard hall, bowling alley, pool room, etc.) in the barangay (where the value of the variable in the census is 10 if there are more than 10 establishment of this type)
bgy_nrepair
average number of (auto repair shop, vulcanizing shop and other repair shops) in the barangay (where the value of the variable in the census is 10 if there are more than 10 establishment of this type)
bgy_nstore
average number of (wholesale store, department store, bazaar, hardware store, drugstore, sari-sari store and other store with current merchandise worth P600 or more; gasoine station) in the barangay (where the value of the variable in the census is 10 if there are more than 10 establishment of this type)
bgy_park 1 if the barangay has a public plaza or park for recreation Bgy_per61up Average Proportion of household members who are 61 and above
Bgy_perkids Average proportion of household members who are children of household head in the barangay
bgy_post 1 if the barangay has postal service bgy_provcap 1 if the barangay has a town/city hall or provincial capitol
bgy_streets 1 if the barangay has a street pattern, i.e. networks of streets of at least three (3) streets or roads
bgy_teleg 1 if the barangay has telegraph bgy_telep 1 if the barangay has telephone
bgy_towncity 1 if barangay is a part of the town/city proper or former poblacion of the municipality, or poblacion/city district
hea_rel_mus proportion of household heads in the barangay whose religion is Islam hea_rel_oth proportion of household heads in the barangay whose religion is not Islam but is not
unknown head_abroad proportion of household heads in the barangay who lived in a foreign country, five years
ago head_nohere proportion of household heads in the barangay who did not live in the same
city/municipality five years ago hou_9600 proportion of houses/building in the barangay which were constructed in 1996 or later hou_nrprtd proportion of houses in the barangay whose state of repair was not reported hou_reno proportion of houses in the barangay that require/ are under renovation hou_repair proportion of houses in the barangay that need major repair hou_unfconst proportion of houses in the barangay which can be considered as unfinished construction per_disa proportion of household members in the barangay who have disability per_indig proportion of household members in the barangay who are considered indigenous people
2003 City and Municipal Level Poverty Estimates Page 54 NSCB/WB Intercensal Updating of Small Area Poverty Estimates
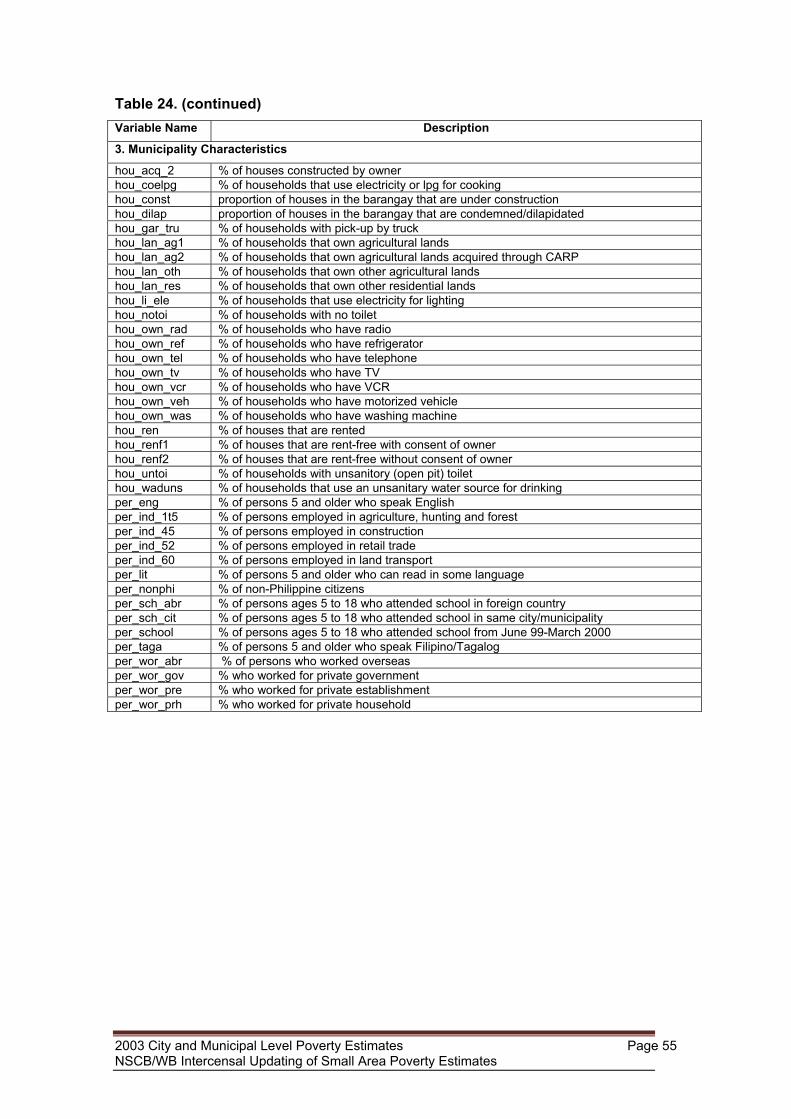
Table 24. (continued) Variable Name Description
3. Municipality Characteristics
hou_acq_2 % of houses constructed by owner hou_coelpg % of households that use electricity or lpg for cooking hou_const proportion of houses in the barangay that are under construction hou_dilap proportion of houses in the barangay that are condemned/dilapidated hou_gar_tru % of households with pick-up by truck hou_lan_ag1 % of households that own agricultural lands hou_lan_ag2 % of households that own agricultural lands acquired through CARP hou_lan_oth % of households that own other agricultural lands hou_lan_res % of households that own other residential lands hou_li_ele % of households that use electricity for lighting hou_notoi % of households with no toilet hou_own_rad % of households who have radio hou_own_ref % of households who have refrigerator hou_own_tel % of households who have telephone hou_own_tv % of households who have TV hou_own_vcr % of households who have VCR hou_own_veh % of households who have motorized vehicle hou_own_was % of households who have washing machine hou_ren % of houses that are rented hou_renf1 % of houses that are rent-free with consent of owner hou_renf2 % of houses that are rent-free without consent of owner hou_untoi % of households with unsanitory (open pit) toilet hou_waduns % of households that use an unsanitary water source for drinking per_eng % of persons 5 and older who speak English per_ind_1t5 % of persons employed in agriculture, hunting and forest per_ind_45 % of persons employed in construction per_ind_52 % of persons employed in retail trade per_ind_60 % of persons employed in land transport per_lit % of persons 5 and older who can read in some language per_nonphi % of non-Philippine citizens per_sch_abr % of persons ages 5 to 18 who attended school in foreign country per_sch_cit % of persons ages 5 to 18 who attended school in same city/municipality per_school % of persons ages 5 to 18 who attended school from June 99-March 2000 per_taga % of persons 5 and older who speak Filipino/Tagalog per_wor_abr % of persons who worked overseas per_wor_gov % who worked for private government per_wor_pre % who worked for private establishment per_wor_prh % who worked for private household
2003 City and Municipal Level Poverty Estimates Page 55 NSCB/WB Intercensal Updating of Small Area Poverty Estimates
c. Statistical Modeling
This section provides a brief discussion of the regression modeling for per capita
income (Note: Please refer to the Estimation of Local Poverty in the Philippines
released in 2005 for a discussion of more advanced statistical concepts such as
multicollinearity, heteroscedasticity modeling, and bootstrapping.).
Since there is limited number of time invariant variables at the household level, the
explanatory variables X is dominated more by the location-effect variables. Recall that
the dependent variable Y is expressed at the household level. To capture a significant
amount of variability of Y, it is operationally useful to construct more time-invariant
variables. This was done by computing two-way interactions among variables in X.
Interactions of explanatory variables with urbanity were also computed. These
approaches created more household-level auxiliary data.
Separate models were fitted for each geographic region. The objective is to tailor the
model to account for the differences of geographic regions in the country, such as
spatial peculiarities. The set of geographic barangays comprise the clusters. Per
geographic region, computing through PovMap begins in the estimation of the income
function,
ln Yij = E[ln Yij | Xij] + uij (1)
where Yij is the per capita income of jth household in ith cluster, X is the explanatory
variable and u is the error component. This error component uij can be attributed into
two components: variability among the clusters and variability among households.
Thus, we can represent uij as,
uij = hi + eij (2)
where hi is the cluster component and eij is the household component. For each
region, a number of candidate models were estimated. As mentioned earlier,
estimation of these models was implemented using PovMap.
2003 City and Municipal Level Poverty Estimates Page 56 NSCB/WB Intercensal Updating of Small Area Poverty Estimates
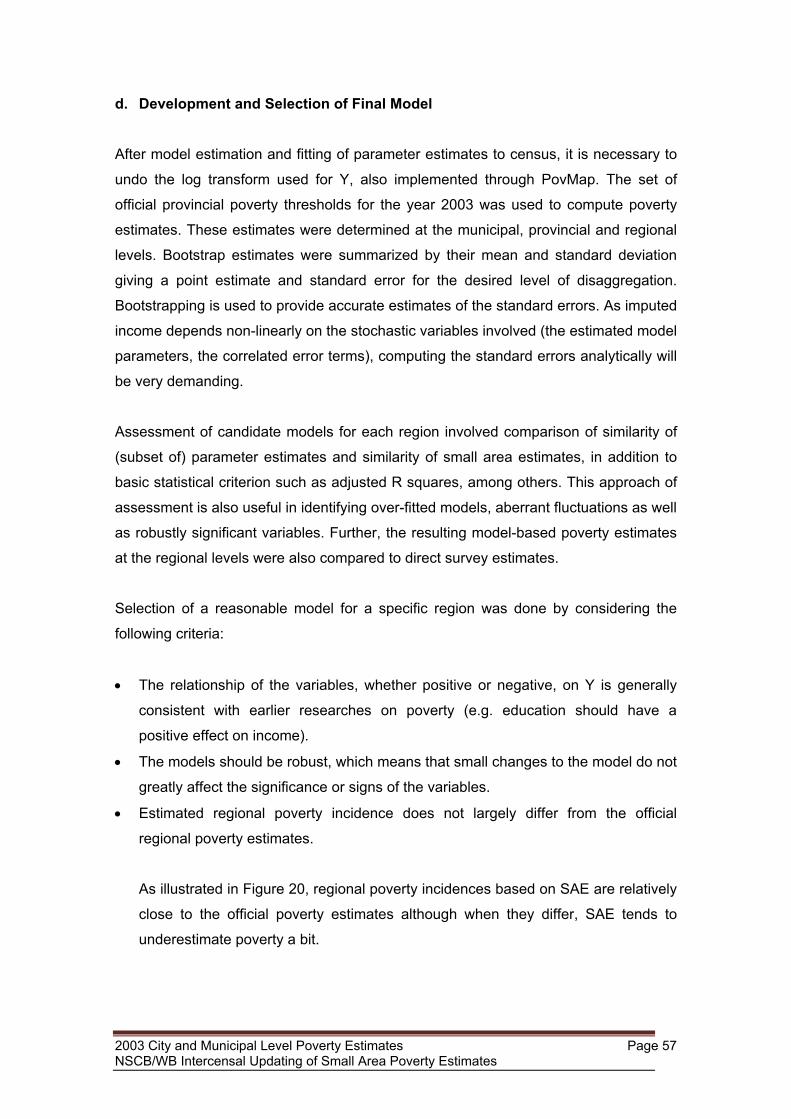
d. Development and Selection of Final Model After model estimation and fitting of parameter estimates to census, it is necessary to
undo the log transform used for Y, also implemented through PovMap. The set of
official provincial poverty thresholds for the year 2003 was used to compute poverty
estimates. These estimates were determined at the municipal, provincial and regional
levels. Bootstrap estimates were summarized by their mean and standard deviation
giving a point estimate and standard error for the desired level of disaggregation.
Bootstrapping is used to provide accurate estimates of the standard errors. As imputed
income depends non-linearly on the stochastic variables involved (the estimated model
parameters, the correlated error terms), computing the standard errors analytically will
be very demanding.
Assessment of candidate models for each region involved comparison of similarity of
(subset of) parameter estimates and similarity of small area estimates, in addition to
basic statistical criterion such as adjusted R squares, among others. This approach of
assessment is also useful in identifying over-fitted models, aberrant fluctuations as well
as robustly significant variables. Further, the resulting model-based poverty estimates
at the regional levels were also compared to direct survey estimates.
Selection of a reasonable model for a specific region was done by considering the
following criteria:
• The relationship of the variables, whether positive or negative, on Y is generally
consistent with earlier researches on poverty (e.g. education should have a
positive effect on income).
• The models should be robust, which means that small changes to the model do not
greatly affect the significance or signs of the variables.
• Estimated regional poverty incidence does not largely differ from the official
regional poverty estimates.
As illustrated in Figure 20, regional poverty incidences based on SAE are relatively
close to the official poverty estimates although when they differ, SAE tends to
underestimate poverty a bit.
2003 City and Municipal Level Poverty Estimates Page 57 NSCB/WB Intercensal Updating of Small Area Poverty Estimates
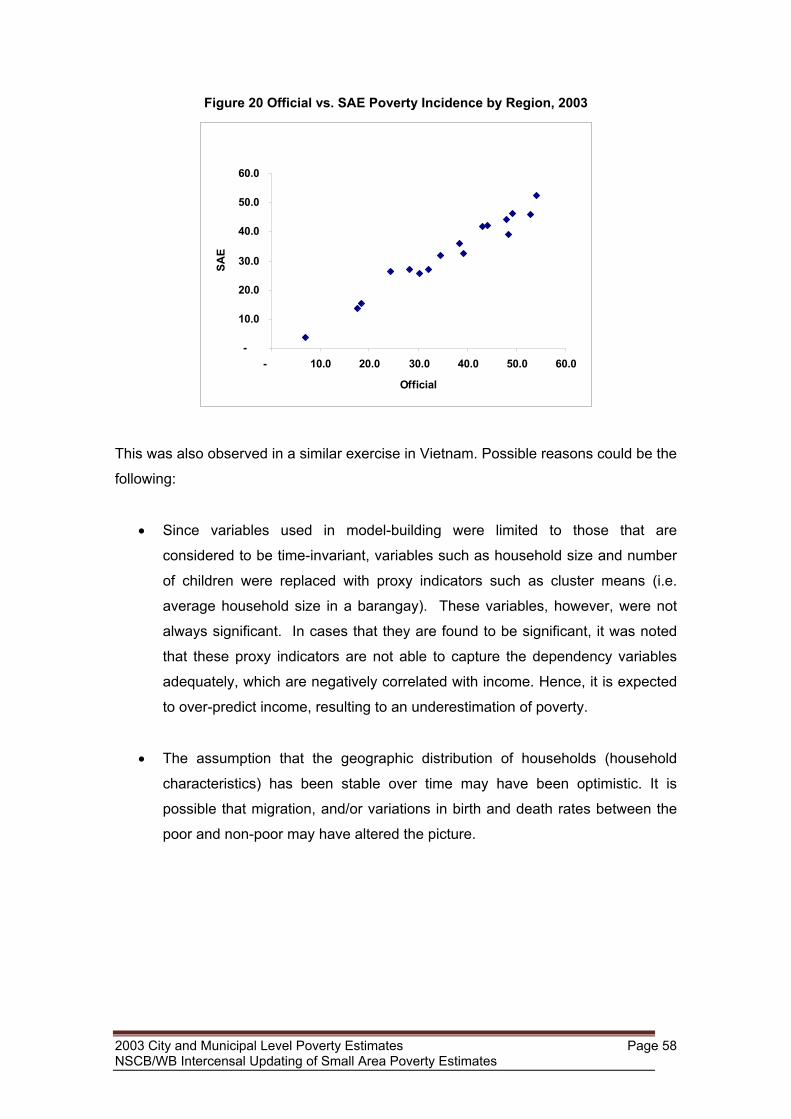
Figure 20 Official vs. SAE Poverty Incidence by Region, 2003
-
10.0
20.0
30.0
40.0
50.0
60.0
- 10.0 20.0 30.0 40.0 50.0 60.0
Official
SAE
This was also observed in a similar exercise in Vietnam. Possible reasons could be the
following:
• Since variables used in model-building were limited to those that are
considered to be time-invariant, variables such as household size and number
of children were replaced with proxy indicators such as cluster means (i.e.
average household size in a barangay). These variables, however, were not
always significant. In cases that they are found to be significant, it was noted
that these proxy indicators are not able to capture the dependency variables
adequately, which are negatively correlated with income. Hence, it is expected
to over-predict income, resulting to an underestimation of poverty.
• The assumption that the geographic distribution of households (household
characteristics) has been stable over time may have been optimistic. It is
possible that migration, and/or variations in birth and death rates between the
poor and non-poor may have altered the picture.
2003 City and Municipal Level Poverty Estimates Page 58 NSCB/WB Intercensal Updating of Small Area Poverty Estimates
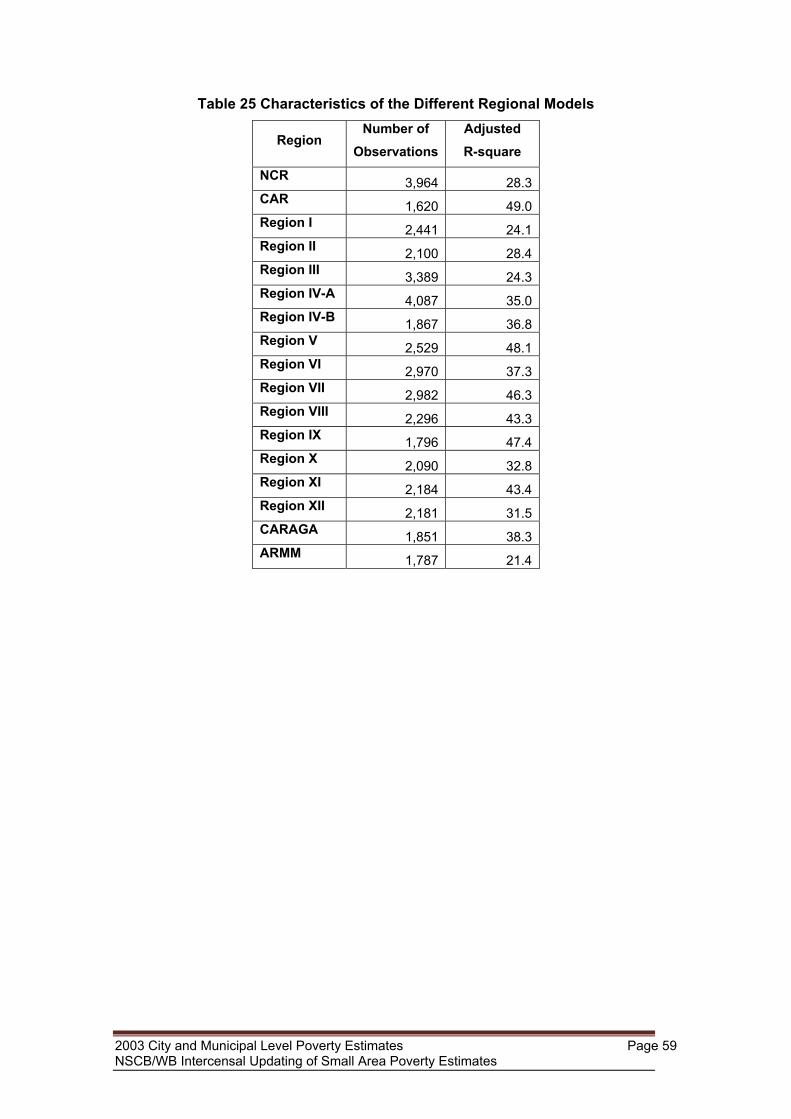
Table 25 Characteristics of the Different Regional Models
Region Number of
ObservationsAdjusted R-square
NCR 3,964 28.3CAR 1,620 49.0Region I 2,441 24.1Region II 2,100 28.4Region III 3,389 24.3Region IV-A 4,087 35.0Region IV-B 1,867 36.8Region V 2,529 48.1Region VI 2,970 37.3Region VII 2,982 46.3Region VIII 2,296 43.3Region IX 1,796 47.4Region X 2,090 32.8Region XI 2,184 43.4Region XII 2,181 31.5CARAGA 1,851 38.3ARMM 1,787 21.4
2003 City and Municipal Level Poverty Estimates Page 59 NSCB/WB Intercensal Updating of Small Area Poverty Estimates
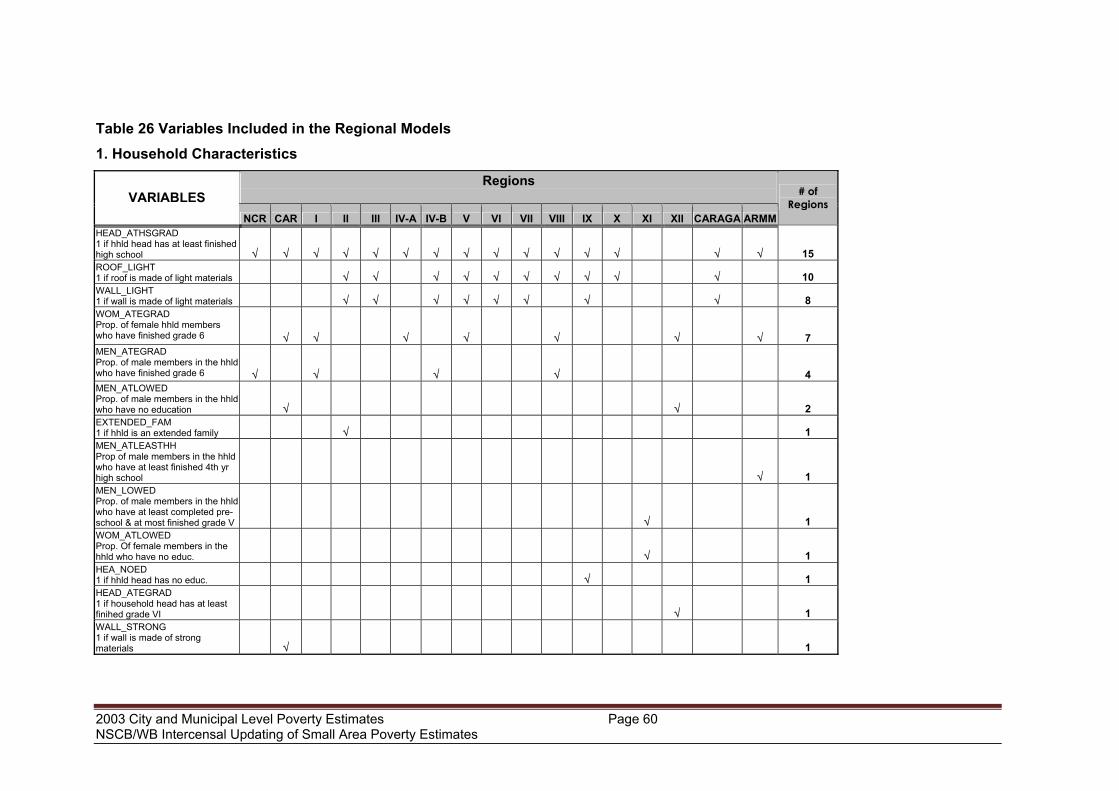
Table 26 Variables Included in the Regional Models 1. Household Characteristics
Regions VARIABLES NCR CAR I II III IV-A IV-B V VI VII VIII IX X XI XII CARAGA ARMM
# of Regions
HEAD_ATHSGRAD 1 if hhld head has at least finished high school √ √ √ √ √ √ √ √ √ √ √ √ √ √ √ 15 ROOF_LIGHT 1 if roof is made of light materials √ √ √ √ √ √ √ √ √ √ 10 WALL_LIGHT 1 if wall is made of light materials √ √ √ √ √ √ √ √ 8 WOM_ATEGRAD Prop. of female hhld members who have finished grade 6 √ √ √ √ √ √ √ 7 MEN_ATEGRAD Prop. of male members in the hhld who have finished grade 6 √ √ √ √ 4 MEN_ATLOWED Prop. of male members in the hhld who have no education √ √ 2 EXTENDED_FAM 1 if hhld is an extended family √ 1 MEN_ATLEASTHH Prop of male members in the hhld who have at least finished 4th yr high school √ 1 MEN_LOWED Prop. of male members in the hhld who have at least completed pre-school & at most finished grade V √ 1 WOM_ATLOWED Prop. Of female members in the hhld who have no educ. √ 1 HEA_NOED 1 if hhld head has no educ. √ 1 HEAD_ATEGRAD 1 if household head has at least finihed grade VI √ 1 WALL_STRONG 1 if wall is made of strong materials √ 1
2003 City and Municipal Level Poverty Estimates Page 60 NSCB/WB Intercensal Updating of Small Area Poverty Estimates
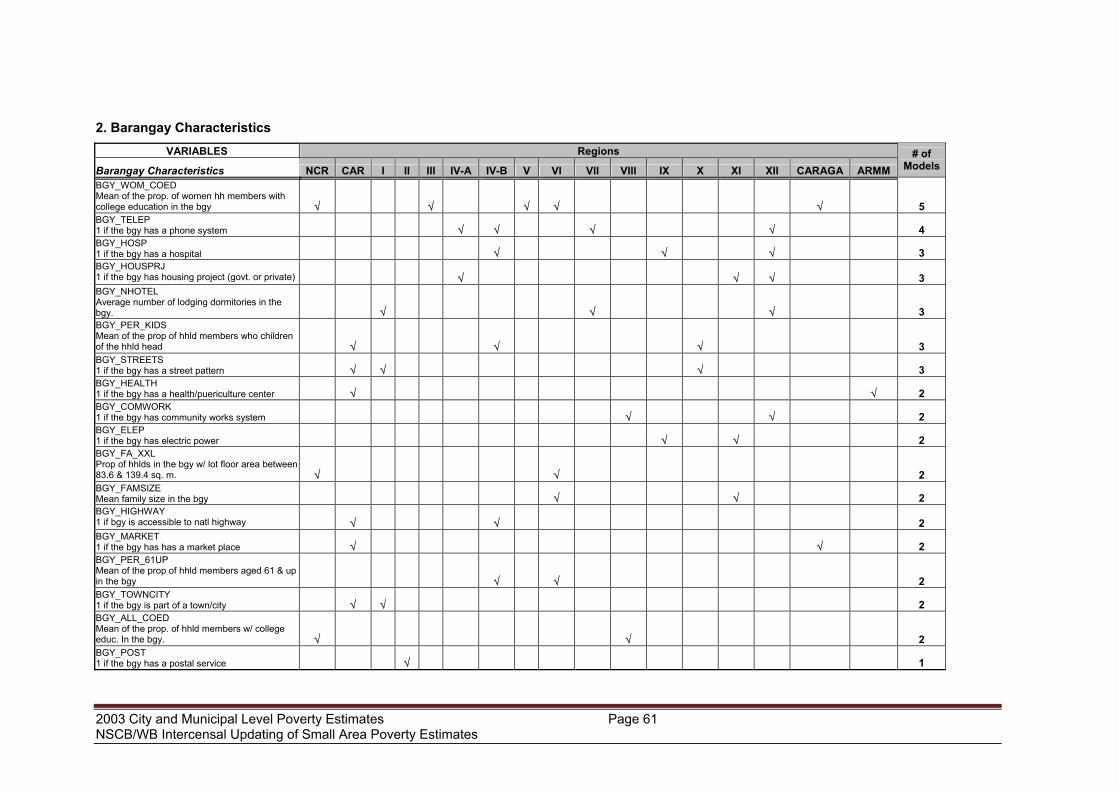
2. Barangay Characteristics VARIABLES Regions
Barangay Characteristics NCR CAR I II III IV-A IV-B V VI VII VIII IX X XI XII CARAGA ARMM # of
Models
BGY_WOM_COED Mean of the prop. of women hh members with college education in the bgy √ √ √ √ √ 5 BGY_TELEP 1 if the bgy has a phone system √ √ √ √ 4 BGY_HOSP 1 if the bgy has a hospital √ √ √ 3 BGY_HOUSPRJ 1 if the bgy has housing project (govt. or private) √ √ √ 3 BGY_NHOTEL Average number of lodging dormitories in the bgy. √ √ √ 3 BGY_PER_KIDS Mean of the prop of hhld members who children of the hhld head √ √ √ 3 BGY_STREETS 1 if the bgy has a street pattern √ √ √ 3 BGY_HEALTH 1 if the bgy has a health/puericulture center √ √ 2 BGY_COMWORK 1 if the bgy has community works system √ √ 2 BGY_ELEP 1 if the bgy has electric power √ √ 2 BGY_FA_XXL Prop of hhlds in the bgy w/ lot floor area between 83.6 & 139.4 sq. m. √ √ 2 BGY_FAMSIZE Mean family size in the bgy √ √ 2 BGY_HIGHWAY 1 if bgy is accessible to natl highway √ √ 2 BGY_MARKET 1 if the bgy has has a market place √ √ 2 BGY_PER_61UP Mean of the prop of hhld members aged 61 & up in the bgy √ √ 2 BGY_TOWNCITY 1 if the bgy is part of a town/city √ √ 2 BGY_ALL_COED Mean of the prop. of hhld members w/ college educ. In the bgy. √ √ 2 BGY_POST 1 if the bgy has a postal service √ 1
2003 City and Municipal Level Poverty Estimates Page 61 NSCB/WB Intercensal Updating of Small Area Poverty Estimates
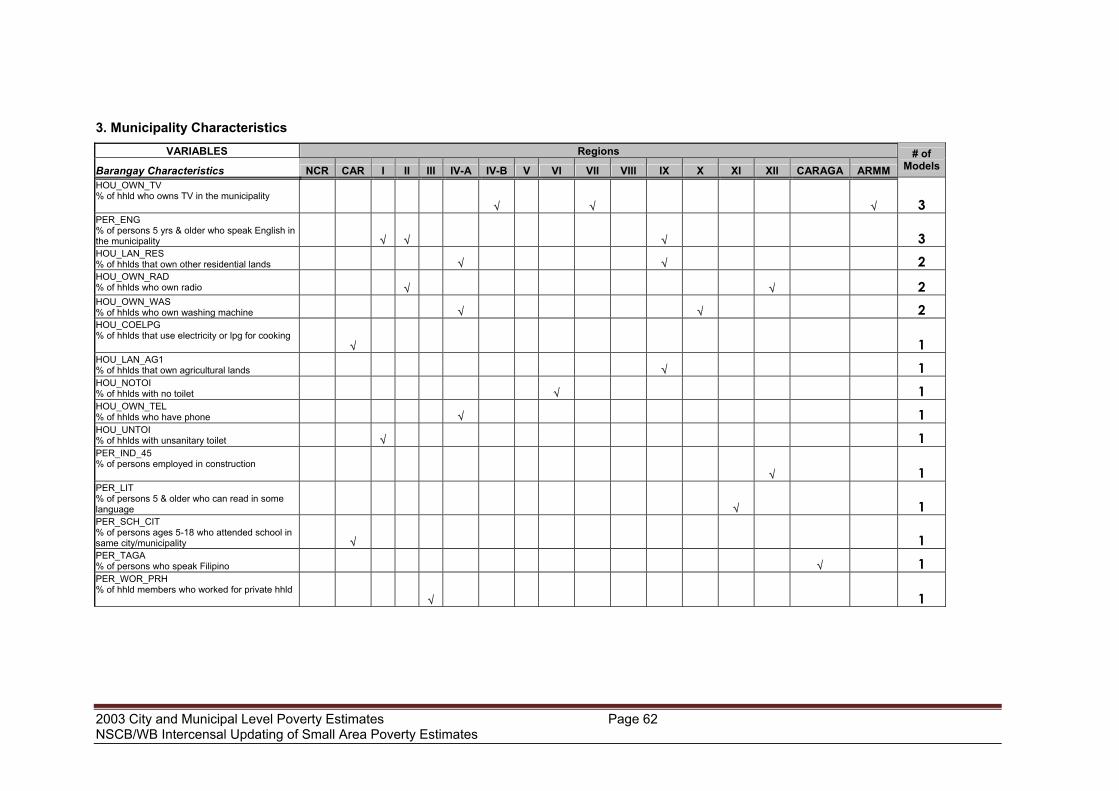
3. Municipality Characteristics VARIABLES Regions
Barangay Characteristics NCR CAR I II III IV-A IV-B V VI VII VIII IX X XI XII CARAGA ARMM # of
Models
HOU_OWN_TV % of hhld who owns TV in the municipality √ √ √ 3 PER_ENG % of persons 5 yrs & older who speak English in the municipality √ √ √ 3 HOU_LAN_RES % of hhlds that own other residential lands √ √ 2 HOU_OWN_RAD % of hhlds who own radio √ √ 2 HOU_OWN_WAS % of hhlds who own washing machine √ √ 2 HOU_COELPG % of hhlds that use electricity or lpg for cooking √ 1 HOU_LAN_AG1 % of hhlds that own agricultural lands √ 1 HOU_NOTOI % of hhlds with no toilet √ 1 HOU_OWN_TEL % of hhlds who have phone √ 1 HOU_UNTOI % of hhlds with unsanitary toilet √ 1 PER_IND_45 % of persons employed in construction √ 1 PER_LIT % of persons 5 & older who can read in some language √ 1 PER_SCH_CIT % of persons ages 5-18 who attended school in same city/municipality √ 1 PER_TAGA % of persons who speak Filipino √ 1 PER_WOR_PRH % of hhld members who worked for private hhld √ 1
2003 City and Municipal Level Poverty Estimates Page 62 NSCB/WB Intercensal Updating of Small Area Poverty Estimates
4.Limitations of the Study
a. Data In the absence of a census, as well as panel data in 2003, in which case, survey
household income from 2003 can be linked to X variables in 2000, only time-
invariant variables7 or location effect variables/census means were used in the
development of the regression models to predict income of households in 2003.
As a result, variables such as household size and number of children were
replaced with proxy indicators such as cluster means (i.e., average household
size in a barangay). These variables, however, were not always significant. In
cases that they are found to be significant, it was noted that these proxy indicators
are not able to capture the dependency variables adequately, which are
negatively correlated with income. Hence, it is expected to over-predict income,
resulting to an underestimation of poverty.
b. Estimation of Magnitude of Poor Population in 2003
To be able to come up with the magnitude of poor population in 2003, poverty
incidence in each municipality was multiplied with the estimated total population in
each municipality. With estimated total population by municipality computed using
the following data:
• 2000-based population projection for 2003 (provincial level)
• 2000-based population projection for 2007 (provincial level)
• Actual Population for 2007 (provincial and municipal level)
The difference between the 2007 projections and actual population at the
provincial level were computed and used to adjust the 2000-based population
projection for 2003. Further, the distribution of the 2007 actual population among
the municipalities was also used to estimate the municipal level population
projection for 2003.
7 Time-invariant variables are variables considered to be “stable” over time.
2003 City and Municipal Level Poverty Estimates Page 63 NSCB/WB Intercensal Updating of Small Area Poverty Estimates
c. Regional model may not necessarily capture the unique characteristics
of provinces/municipalities
As models specified are at the regional level, characteristics of the
municipalities atypical of the province/region may not be fully captured by the
model.
1. Siayan, Zamboanga del Norte
This municipality is characterized8 as follows:
• Ranked as the poorest municipality in 2003
• Has farming and fishing is known to be the common source of income
• Located very far from the poblacion (i.e., approx. 7 hrs. away) with
roads that are described to be “rugged and rough”.
• Yet it was found that GIS-based maps of poverty related indicators
done by NSCB Regional Division IX (NSCB RD IX) presented good
status of the municipality, except for malnutrition.
• It was also noted that an “e-center” of the National Computer Center
(NCC) has been established in this municipality.
2. Albay
• It was observed that poverty incidence generated for Albay using the
regional model developed in SAE was estimated as 15.1 percent with a
CV of 3.7. The computed incidence is considered relatively low
compared to the 2003 official poverty estimates of 42.7 percent with a
CV of 7.3. While the Project Team recognizes that there may be other
variables that are correlated with income (particularly for households of
Albay), these, however, were not included in the model developed for
the region due to some constraints (e.g., limited time, data, manpower
and financial resources).
8 Per consultation with NSCB Regional Division IX.
2003 City and Municipal Level Poverty Estimates Page 64 NSCB/WB Intercensal Updating of Small Area Poverty Estimates

d. Non-inclusion of variables on migration and tourism
Although it has been recognized that migration and tourism might be significant
variables that could have been considered in the model building, these were not
included in the model due to limited time and data available. (Note: Tourism was
somehow incorporated in the model building through the census variable “number
of hotel or accommodation establishments in the barangay”). Nevertheless, with
the availability of data on these areas of concern, the NSCB plans to consider
these in the future endeavors on SAE.
e. Comparison of the 2000 and 2003 SAE It is recognized that trend analysis, specifically for poverty measurement, is
important. However, in consideration of the differences in model building, such
as:
• National model for 2000 SAE and regional models for 2003 SAE
• 2003 models were only developed using time invariant variables, location-
effect/census means
Thus, it might not be appropriate to do a trend analysis from 2000 SAE to 2003
SAE.
2003 City and Municipal Level Poverty Estimates Page 65 NSCB/WB Intercensal Updating of Small Area Poverty Estimates
C. Validation Workshops 1. Objectives
Similar to the earlier poverty mapping project, which the NSCB conducted in
2004-2005, a series of provincial validation exercises were conducted in order to
assess the acceptability and consistency of the estimates generated. These
exercises were done to assess how well the estimates relate to the assessment of
local government units, the academe, and non-government organizations in the
province. Specifically, these activities aim to:
• Solicit the participants’ expert opinion and intimate knowledge of the poverty
situation in their province;
• Present the initial results of the Intercensal Project;
• Serve as a forum for the exchange of ideas and discussion of the provincial
and municipal level poverty estimates produced through the project and to
evaluate how well they relate to the assessment of the local participants;
• Serve as an advocacy for poverty mapping at the local level; and
• Convince the local government units (LGUs) to invest on and appreciate
statistics.
2. Mechanics
Invited workshop participants were composed of:
Group 1: Provincial key informants with detailed knowledge of all the
municipalities in the province, e.g., provincial planning and development
coordinator.
Group 2: Municipal key informants, e.g., representatives from the municipal
planning and development offices.
• The participants were asked to accomplish the validation form, which included
the indicators significant in the small area modeling procedure, other
correlates of poverty, and the Millennium Development Goal (MDG) indicators.
• The following indicators were included in the validation form:
- Level of educational attainment
- Age dependency ratio
2003 City and Municipal Level Poverty Estimates Page 66 NSCB/WB Intercensal Updating of Small Area Poverty Estimates
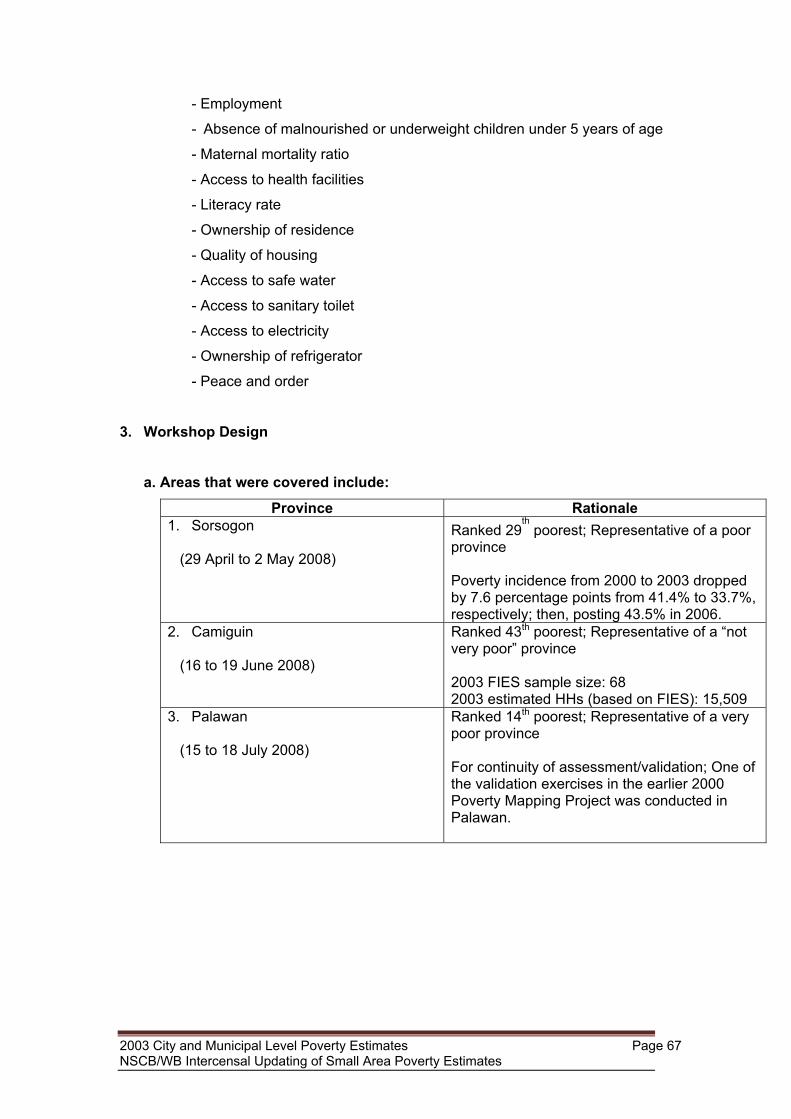
- Employment
- Absence of malnourished or underweight children under 5 years of age
- Maternal mortality ratio
- Access to health facilities
- Literacy rate
- Ownership of residence
- Quality of housing
- Access to safe water
- Access to sanitary toilet
- Access to electricity
- Ownership of refrigerator
- Peace and order
3. Workshop Design
a. Areas that were covered include:
Province Rationale 1. Sorsogon (29 April to 2 May 2008)
Ranked 29th poorest; Representative of a poor
province Poverty incidence from 2000 to 2003 dropped by 7.6 percentage points from 41.4% to 33.7%, respectively; then, posting 43.5% in 2006.
2. Camiguin (16 to 19 June 2008)
Ranked 43th poorest; Representative of a “not very poor” province 2003 FIES sample size: 68 2003 estimated HHs (based on FIES): 15,509
3. Palawan (15 to 18 July 2008)
Ranked 14th poorest; Representative of a very poor province For continuity of assessment/validation; One of the validation exercises in the earlier 2000 Poverty Mapping Project was conducted in Palawan.
2003 City and Municipal Level Poverty Estimates Page 67 NSCB/WB Intercensal Updating of Small Area Poverty Estimates

b. Workshop Participants
Participants Sorsogon Camiguin Palawan Local Government Units
24 24 24
Academe 0 0 4 Non-Government Organizations
1 0 3
Other Participants/ guests
0 Vice-Governor of the Province of
Camiguin
0
TOTAL 25 25 31 No. of municipalities 16 5 23 (excluding
Kalayaan)
c. Field Validation In addition to the validation workshops conducted, ocular assessments were
also done in some of the municipalities/barangays of the three provinces.
Members of the Team were asked to accomplish an Ocular Assessment Form
(See Annex C) containing the different variables found to be significant in the
regional model. These were done for the Team to gain better insights on the
province, as well as validate whether the variables are truly reflective of the
actual poverty situation in the municipalities.
Through these ocular assessments, some of the SAE results were verified
such as Donsol being a poor municipality (perceived by some of the workshop
participants as relatively non-poor municipality because of its popularity as a
tourist destination) with most houses still made of light materials including
those along the highway. These also gave the members of the Team the
chance to actually talk to people residing in the visited municipalities and
understand better their way of life.
2003 City and Municipal Level Poverty Estimates Page 68 NSCB/WB Intercensal Updating of Small Area Poverty Estimates
4. VALIDATION FORMS
2003 City and Municipal Level Poverty Estimates Page 69 NSCB/WB Intercensal Updating of Small Area Poverty Estimates
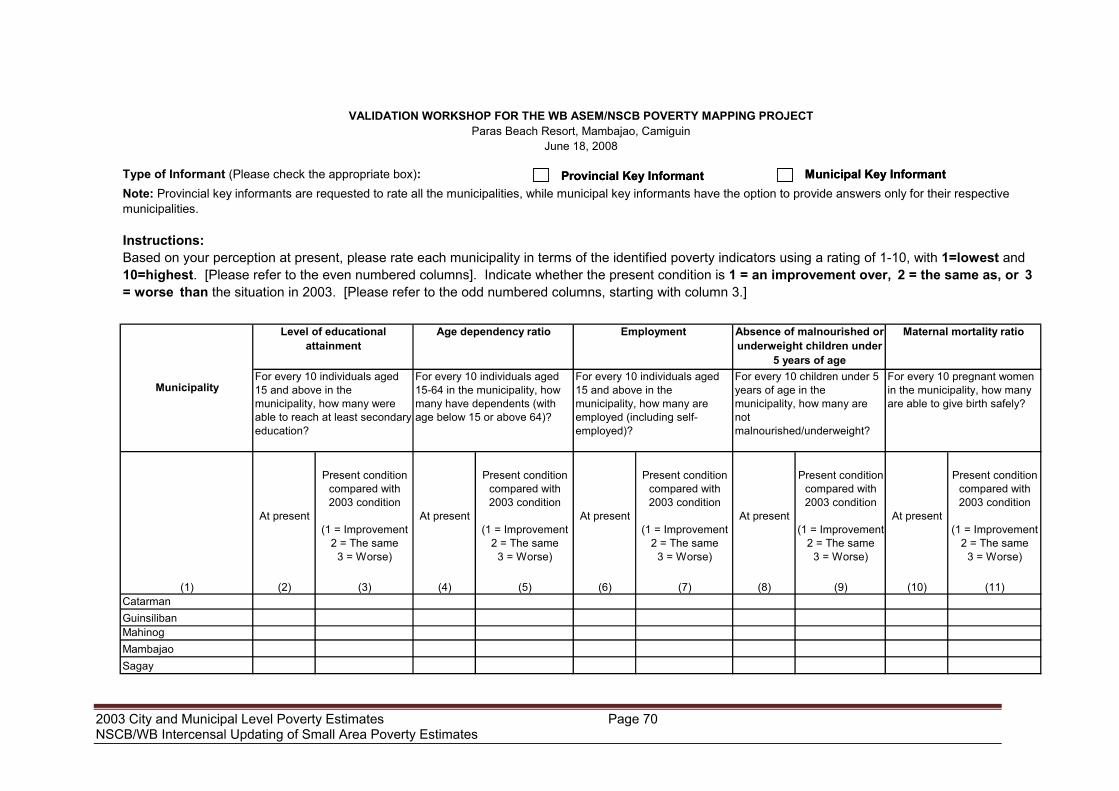
Type of Informant (Please check the appropriate box):
At present
Present condition compared with 2003 condition
(1 = Improvement2 = The same
3 = Worse)
At present
Present condition compared with 2003 condition
(1 = Improvement2 = The same
3 = Worse)
At present
Present condition compared with 2003 condition
(1 = Improvement2 = The same
3 = Worse)
At present
Present condition compared with 2003 condition
(1 = Improvement2 = The same
3 = Worse)
At present
Present condition compared with 2003 condition
(1 = Improvement2 = The same
3 = Worse)
(1) (2) (3) (4) (5) (6) (7) (8) (9) (10) (11)CatarmanGuinsilibanMahinogMambajaoSagay
Note: Provincial key informants are requested to rate all the municipalities, while municipal key informants have the option to provide answers only for their respective municipalities.
EmploymentAge dependency ratio
For every 10 individuals aged15-64 in the municipality, how many have dependents (with age below 15 or above 64)?
Level of educational attainment
Instructions: Based on your perception at present, please rate each municipality in terms of the identified poverty indicators using a rating of 1-10, with 1=lowest and 10=highest. [Please refer to the even numbered columns]. Indicate whether the present condition is 1 = an improvement over, 2 = the same as, or 3 = worse than the situation in 2003. [Please refer to the odd numbered columns, starting with column 3.]
For every 10 individuals aged 15 and above in the municipality, how many are employed (including self-employed)?
Absence of malnourished or underweight children under
5 years of ageFor every 10 children under 5 years of age in the municipality, how many are not malnourished/underweight?
Maternal mortality ratio
For every 10 pregnant women in the municipality, how many are able to give birth safely?
VALIDATION WORKSHOP FOR THE WB ASEM/NSCB POVERTY MAPPING PROJECTParas Beach Resort, Mambajao, Camiguin
June 18, 2008
MunicipalityFor every 10 individuals aged 15 and above in the municipality, how many were able to reach at least secondary education?
Provincial Key Informant Municipal Key InformantProvincial Key Informant Municipal Key Informant
2003 City and Municipal Level Poverty Estimates Page 70 NSCB/WB Intercensal Updating of Small Area Poverty Estimates
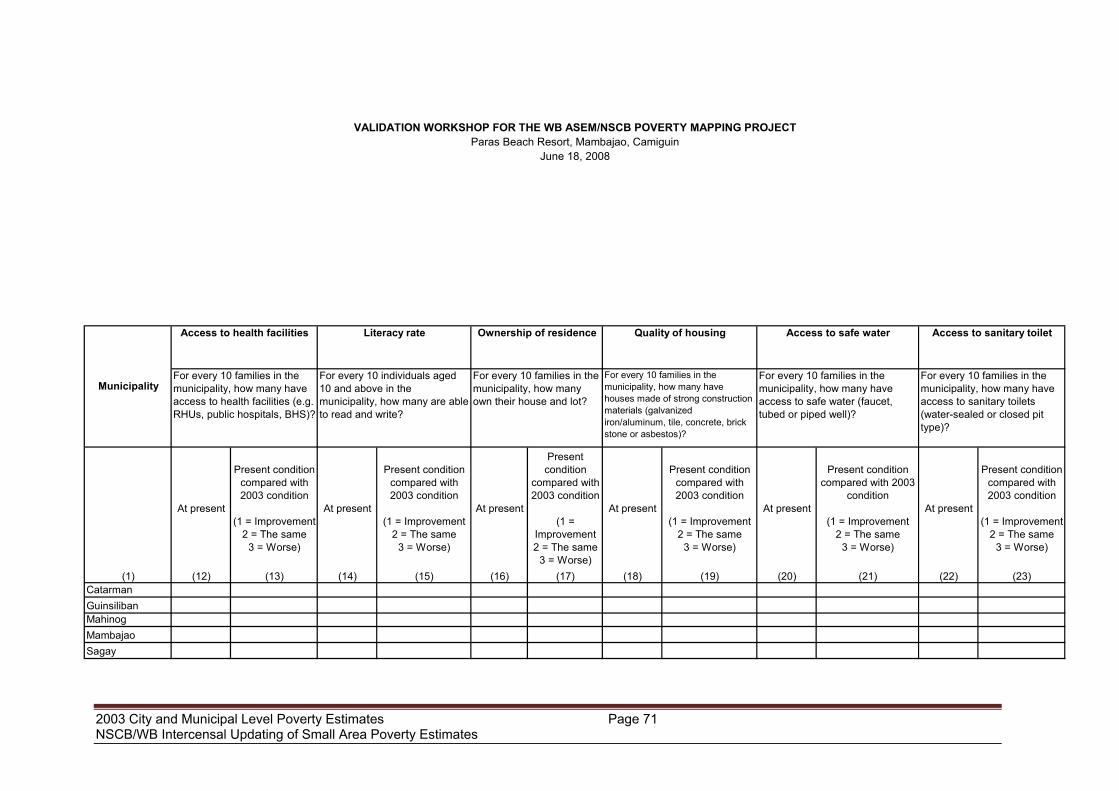
At present
Present condition compared with 2003 condition
(1 = Improvement2 = The same
3 = Worse)
At present
Present condition compared with 2003 condition
(1 = Improvement2 = The same
3 = Worse)
At present
Present condition
compared with 2003 condition
(1 = Improvement2 = The same
3 = Worse)
At present
Present condition compared with 2003 condition
(1 = Improvement2 = The same
3 = Worse)
At present
Present condition compared with 2003
condition
(1 = Improvement2 = The same
3 = Worse)
At present
Present condition compared with 2003 condition
(1 = Improvement2 = The same
3 = Worse)
(1) (12) (13) (14) (15) (16) (17) (18) (19) (20) (21) (22) (23)CatarmanGuinsilibanMahinogMambajaoSagay
Municipality
VALIDATION WORKSHOP FOR THE WB ASEM/NSCB POVERTY MAPPING PROJECTParas Beach Resort, Mambajao, Camiguin
June 18, 2008
For every 10 families in the municipality, how many have access to health facilities (e.g. RHUs, public hospitals, BHS)?
Ownership of residence
For every 10 families in the municipality, how many own their house and lot?
Literacy rate
For every 10 individuals aged 10 and above in the municipality, how many are able to read and write?
For every 10 families in the municipality, how many have access to safe water (faucet, tubed or piped well)?
Access to sanitary toilet
For every 10 families in the municipality, how many have access to sanitary toilets (water-sealed or closed pit type)?
Quality of housing
For every 10 families in the municipality, how many have houses made of strong construction materials (galvanized iron/aluminum, tile, concrete, brick stone or asbestos)?
Access to safe waterAccess to health facilities
2003 City and Municipal Level Poverty Estimates Page 71 NSCB/WB Intercensal Updating of Small Area Poverty Estimates
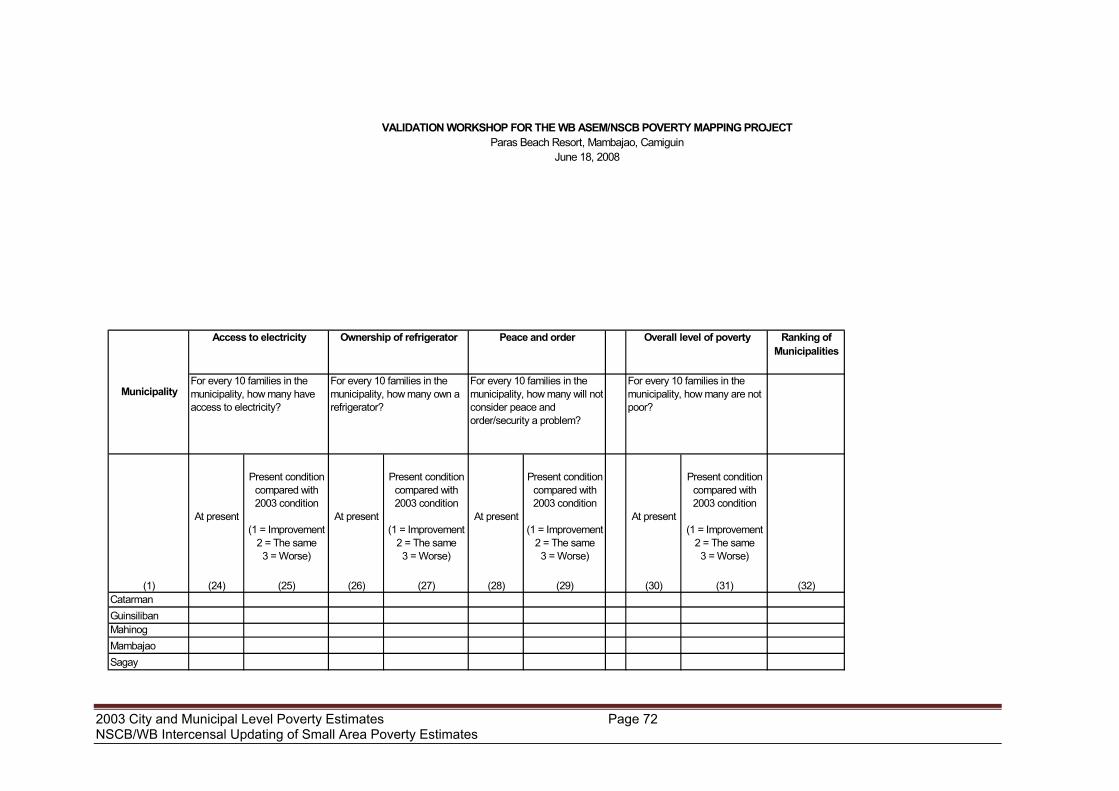
Ranking of Municipalities
At present
Present condition compared with 2003 condition
(1 = Improvement2 = The same3 = Worse)
At present
Present condition compared with 2003 condition
(1 = Improvement2 = The same3 = Worse)
At present
Present condition compared with 2003 condition
(1 = Improvement2 = The same3 = Worse)
At present
Present condition compared with 2003 condition
(1 = Improvement2 = The same3 = Worse)
(1) (24) (25) (26) (27) (28) (29) (30) (31) (32)CatarmanGuinsilibanMahinogMambajaoSagay
Municipality
VALIDATION WORKSHOP FOR THE WB ASEM/NSCB POVERTY MAPPING PROJECTParas Beach Resort, Mambajao, Camiguin
June 18, 2008
Access to electricity
For every 10 families in the municipality, how many have access to electricity?
Overall level of poverty
For every 10 families in the municipality, how many are not poor?
Ownership of refrigerator
For every 10 families in the municipality, how many own a refrigerator?
Peace and order
For every 10 families in the municipality, how many will not consider peace and order/security a problem?
2003 City and Municipal Level Poverty Estimates Page 72 NSCB/WB Intercensal Updating of Small Area Poverty Estimates
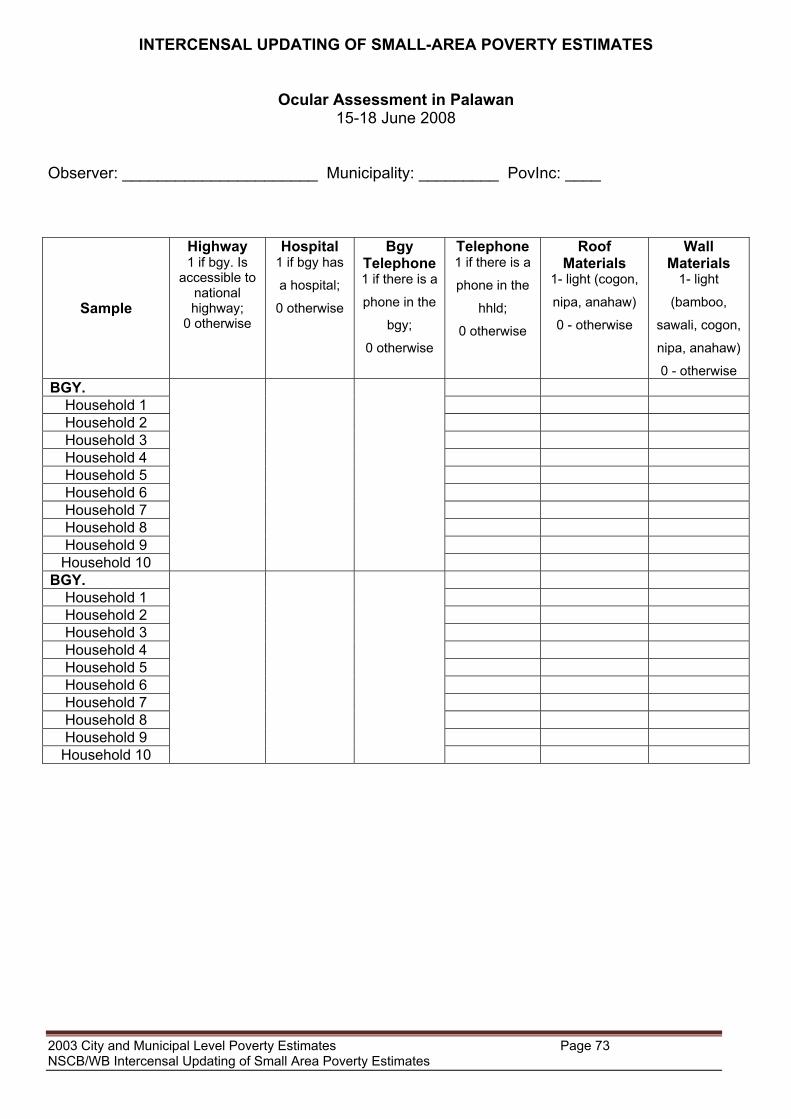
INTERCENSAL UPDATING OF SMALL-AREA POVERTY ESTIMATES
Ocular Assessment in Palawan 15-18 June 2008
Observer: ______________________ Municipality: _________ PovInc: ____
Sample
Highway 1 if bgy. Is
accessible to national highway;
0 otherwise
Hospital 1 if bgy has
a hospital;
0 otherwise
Bgy Telephone 1 if there is a
phone in the
bgy;
0 otherwise
Telephone 1 if there is a
phone in the
hhld;
0 otherwise
Roof Materials
1- light (cogon,
nipa, anahaw)
0 - otherwise
Wall Materials
1- light
(bamboo,
sawali, cogon,
nipa, anahaw)
0 - otherwise BGY.
Household 1 Household 2 Household 3 Household 4 Household 5 Household 6 Household 7 Household 8 Household 9
Household 10
BGY.
Household 1 Household 2 Household 3 Household 4 Household 5 Household 6 Household 7 Household 8 Household 9
Household 10
2003 City and Municipal Level Poverty Estimates Page 73 NSCB/WB Intercensal Updating of Small Area Poverty Estimates

5. Matrix of Findings
In the validation workshops conducted in the three provinces, some of the general
insights and findings of the Team were as follows:
• As the design of the validation form is expected to exhibit memory bias, it is
not surprising that participants encountered some difficulties in recalling the
situation five years ago.
• The results generated from the SAE methodology did not produce a unique
ranking of the municipalities. While the poverty incidences were unique, due to
sampling errors, it was not possible to establish definitive rankings of
municipalities.
• SAE rankings were generally consistent with the participants’ assessment,
except for some municipalities.
The following were specific observations in each of the provinces:
Province Aspect Reactions/Remarks
1. Sorsogon The model does not include tourism-specific variables as significant predictors of income.
Methodology and
regional model
Presence of financial institutions was included as one of the variables in the initial regional model of Bicol. However, per the citizens’ perception, this is not a strong indicator of the economic situation for all municipalities.
Validation results Donsol ranked poorest in SAE but 10th poorest (among 16) based on participant’s assessment.
A participant from an NGO noted that in their recently conducted poverty mapping activity in Sorsogon, Donsol also ranked as poorest, consistent with SAE.
Participants also noted that their assessments are mostly based on their perception as a number of them have yet to personally see/visit Donsol.
2003 City and Municipal Level Poverty Estimates Page 74 NSCB/WB Intercensal Updating of Small Area Poverty Estimates
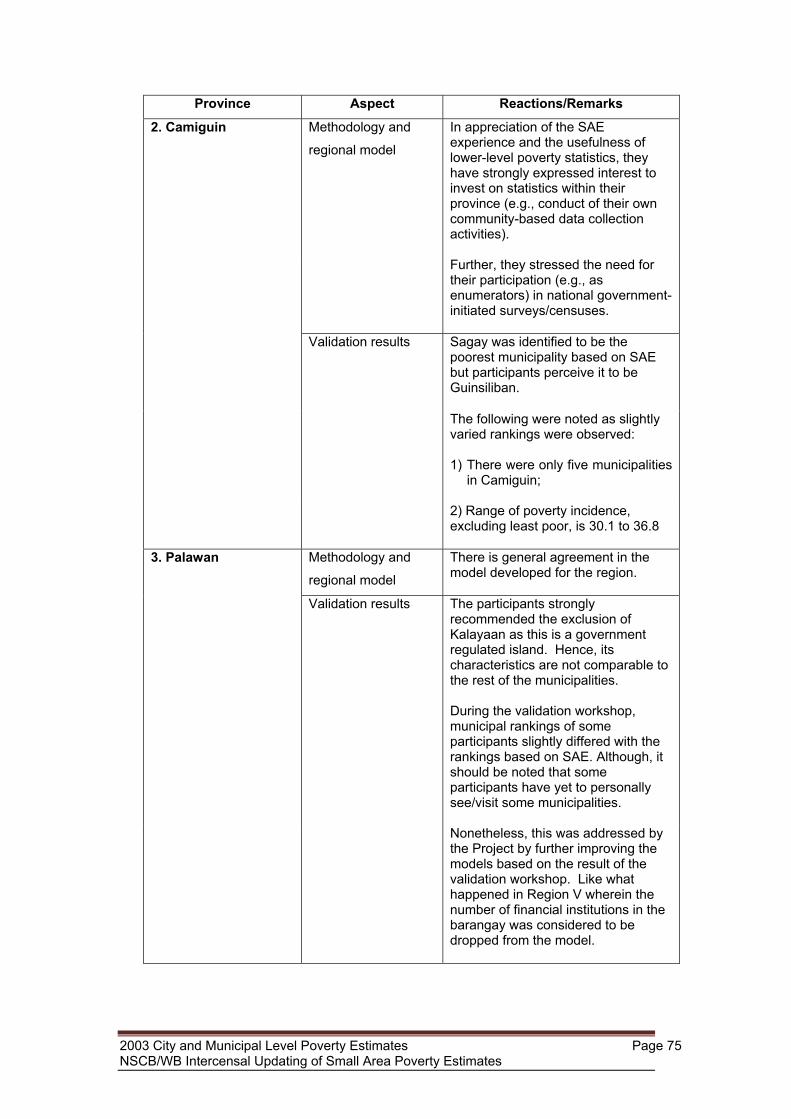
Province Aspect Reactions/Remarks
2. Camiguin Methodology and
regional model
In appreciation of the SAE experience and the usefulness of lower-level poverty statistics, they have strongly expressed interest to invest on statistics within their province (e.g., conduct of their own community-based data collection activities).
Further, they stressed the need for their participation (e.g., as enumerators) in national government-initiated surveys/censuses.
Sagay was identified to be the poorest municipality based on SAE but participants perceive it to be Guinsiliban.
Validation results
The following were noted as slightly varied rankings were observed:
1) There were only five municipalities in Camiguin;
2) Range of poverty incidence,
excluding least poor, is 30.1 to 36.8
3. Palawan Methodology and
regional model
There is general agreement in the model developed for the region.
Validation results The participants strongly recommended the exclusion of Kalayaan as this is a government regulated island. Hence, its characteristics are not comparable to the rest of the municipalities.
During the validation workshop, municipal rankings of some participants slightly differed with the rankings based on SAE. Although, it should be noted that some participants have yet to personally see/visit some municipalities.
Nonetheless, this was addressed by the Project by further improving the models based on the result of the validation workshop. Like what happened in Region V wherein the number of financial institutions in the barangay was considered to be dropped from the model.
2003 City and Municipal Level Poverty Estimates Page 75 NSCB/WB Intercensal Updating of Small Area Poverty Estimates
D. Advocacy 1. National Dissemination Forum
A National Dissemination Forum was held on 4 September 2008 at the Crowne
Plaza Hotel to:
a. Present the project results, providing details on the methodology and variables
used;
b. Serve as a venue for the exchange of ideas and discussion of the estimates
produced through the project;
c. Develop awareness among national government agencies, the academe, non-
government organizations, local government units and other institutions/
organizations on the importance of the small area estimation methodology and
the results generated.
Some of the important points raised during the forum include:
• Suggestion to include the magnitude of poor families in the poverty estimates
to reflect the density of poverty across the country. An attempt to generate
estimates of the magnitude of poor population has been done during the
presentation of the SAE to the Congress, however, it should be noted that it
entailed a number of assumptions since 2003 actual population is not
available. Provided in Annex E is the table with magnitude of poor population.
• Possibility of generating poverty estimates at the barangay level. While it is
possible to generate poverty estimates at the barangay level, the estimates
might not even be useful or acceptable to data users due to expected large
errors of the estimates.
• Difference of the 2003 small area poverty estimates with the 2003 official
poverty estimates and how to relate them. Which provincial ranking should be
used? Although it has been presented during the forum that the 2003
provincial poverty estimates based on SAE have lower coefficients of variation
as compared to the official poverty estimates, the SAE methodology adopted
in the Philippines is still undergoing further review/refinements/ improvements.
Thus, ranking of poverty estimates should still be based on the 2003 official
poverty estimates.
• Need for better data dissemination schemes for better appreciation at the local
level. As NSCB recognized the need to communicate the results of the
Project to policy makers and local government units, presentations have been
2003 City and Municipal Level Poverty Estimates Page 76 NSCB/WB Intercensal Updating of Small Area Poverty Estimates
done with various data users of poverty. In addition, this final report has also
been prepared such that it will be more user-friendly, easy to understand and
not very technical.
• Timeliness of release of poverty data. At present, the generation of SAE is not
yet included in the regular work of NSCB since this exercise will entail
additional resources and manpower. However, its implementation is part of
the future plans of NSCB.
• Possibility of partnership between the Philippine Statistical System (PSS) and
the local government units (LGUs), specifically, in maximizing the use of
Community Based Monitoring System (CBMS) database. This issue was
raised by the City Planning and Development Coordinator (CPDC) of Pasay
City as one of the discussant during the forum. The NSCB, in response, has
already communicated with the Office of the Mayor the willingness of NSCB to
provide technical assistance in the analysis of CBMS data.
• Use of the SAE in monitoring poverty over time. It is recognized that
monitoring of poverty over time is important, specifically, if we want to
determine whether gains in poverty reduction programs have been significant.
However, with a slight variation of the methodology used in the earlier project,
(used of only time-invariant variables in the model and developing regional
models in the 2003 SAE, as compared to the national model used in the
earlier project) it might not be appropriate to do a trend analysis between the
2000 and 2003 SAE.
• Explore other SAE methods, such as the Bayes’ Hierarchical Model. This may
be considered in the future studies of NSCB on SAE.
• Effectiveness of the SAE method in estimating poverty, specifically when
dealing with non-censal year, considering the fact that one is only limited into
using time-invariant variables. In this Project, regional models using only time-
invariant variables were able to produce poverty estimates with acceptable
level of error for most of the provinces and even for majority of the cities and
municipalities.
• Variables such as housing materials, which were considered to be time-
invariant, can actually be affected by typhoon and other external factors.
While this may be correct, average values were used in the computation of
estimates thereby negating the contribution of extreme values.
2003 City and Municipal Level Poverty Estimates Page 77 NSCB/WB Intercensal Updating of Small Area Poverty Estimates

• As this is a regression modeling study, there is a need to also present the
diagnostic checks done to assess the effectiveness/robustness of the models
developed. In the dissemination fora, the results of the diagnostic tests were
not fully discussed because of time limitation but in this report, indicators used
to assess the appropriateness of the models are provided.
• Use of consumption/expenditure instead of income as welfare measure. There
is indeed a debate on the use of consumption/expenditure instead of income
in welfare measure. However, since the official methodology of poverty
measures in the Philippines makes use of income, the study considered the
same as the welfare measure.
• Given the assumption of area homogeneity with the use of regional models,
questions on how cultural diversity and conflict areas, specifically in Mindanao,
were taken into consideration in the models developed. The cultural diversity
within a region was not accounted for in the model building process since
there is no measure of such characteristic in the data sets used in the study.
• Need to make available subsistence incidence, which are useful to
government agencies like the DSWD who are targeting those who are food
poor. This may actually be done but will entail some time. Also, DSWD has
already started using the ranking of provinces and municipalities based on
poverty incidence among families.
• Need to check the consistency of the model and estimates across the years,
2000, 2003 and 2006. It might not be appropriate to do a comparative analysis
of the 2000 and 2003 SAE because of its differences in the model building: a)
national model for 2000 and regional model for 2003 and b) 2003 model were
developed using only time-invariant variables.
• It might be useful to compare the result of the CBMS data with the SAE.
Although comparison of the result of the CBMS and SAE is feasible, it must be
noted that the methodologies used in these two studies as well as the data
sets are different. Hence, the comparison is baseless.
• The sustainability of this activity, specifically, on whether there will already be
a regular generation of SAE through the help of World Bank. It is recognized
that World Bank can only support this activity to a certain extent and thus, the
NSCB, and also with the help of World Bank, started to explore other
possibilities like seeking the help of Congress to fund this activity and make it
part of the regular work of NSCB.
2003 City and Municipal Level Poverty Estimates Page 78 NSCB/WB Intercensal Updating of Small Area Poverty Estimates
2. Various presentations to various agencies/organizations Various presentations on the SAE were also made to the following to disseminate
the results and methodology, generate comments and gather support, specifically
from policymakers, to be able to have the necessary resources to sustain the
generation of small area poverty estimates:
• House of Representatives through the Congressional Planning and Budget
Department (CPBD)
• NSCB Executive Board
• Provincial Social Welfare and Development in Rizal
• Inter-agency Committee of the Department of Labor and Employment
• National Economic Development Authority - Region IV-A
• UP Junior Executive Society
• UNSD / UNESCAP Workshop on MDG Monitoring
2003 City and Municipal Level Poverty Estimates Page 79 NSCB/WB Intercensal Updating of Small Area Poverty Estimates
E. Lessons Learned
1. In producing SAE on poverty, variables to be used in the model-building
process need not be restricted to only those that are time-invariant. Possible
regressors that are perceived to be significantly correlated with income, but
may vary over time, may be estimated through regression modeling.
2. Use of latest/up-to-date version of the PovMap software is expected to greatly
improve the model building process.
3. In designing and conducting validation/dissemination workshops, the following
should have been considered by the Team to ensure outputs presented are
fully optimized:
• Inclusion of an activity wherein participants will be requested to identify
actual programs in their locality where the small area poverty estimates
presented to them can possibly be used.
• Identification of more targeted participants by selecting agencies/
organization which are possible users of the estimates.
2003 City and Municipal Level Poverty Estimates Page 80 NSCB/WB Intercensal Updating of Small Area Poverty Estimates

Annex F 2003 City and Municipal Level Poverty
Estimates
2003 City and Municipal Level Poverty Estimates Page 81 NSCB/WB Intercensal Updating of Small Area Poverty Estimates
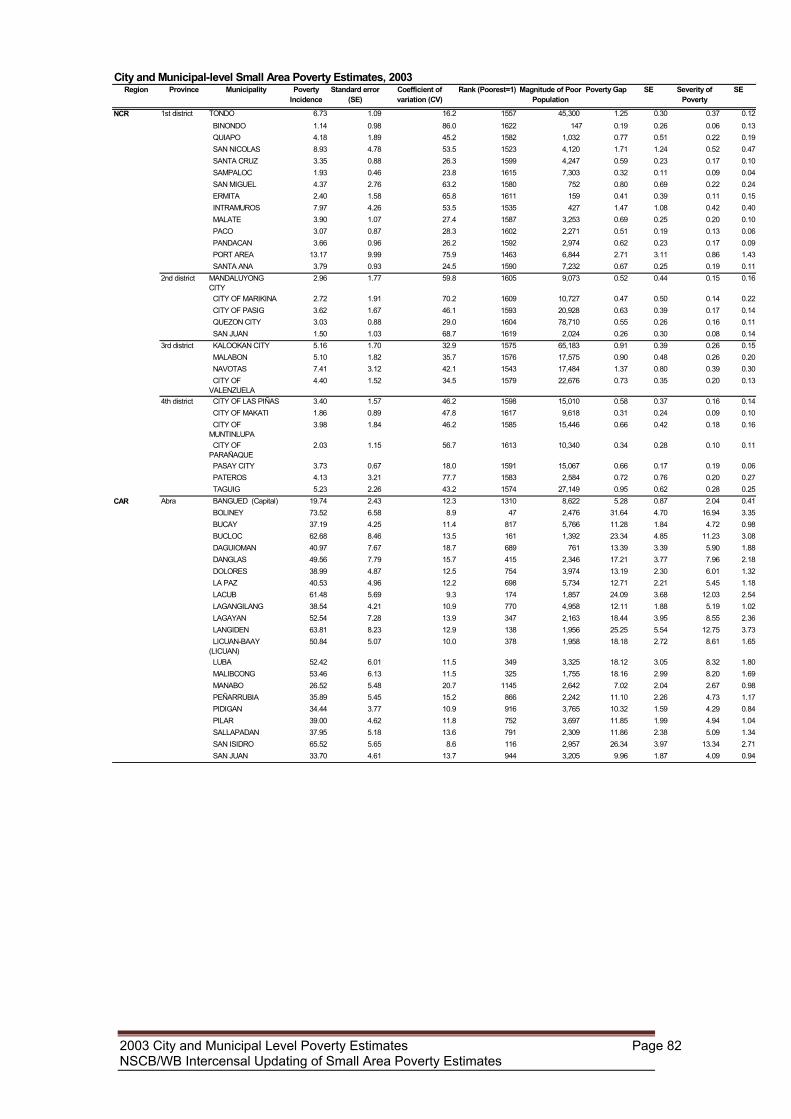
City and Municipal-level Small Area Poverty Estimates, 2003Region Province Municipality Poverty
IncidenceStandard error
(SE)Coefficient of variation (CV)
Rank (Poorest=1) Magnitude of Poor Population
Poverty Gap SE Severity of Poverty
SE
NCR 1st district TONDO 6.73 1.09 16.2 1557 45,300 1.25 0.30 0.37 0.12 BINONDO 1.14 0.98 86.0 1622 147 0.19 0.26 0.06 0.13 QUIAPO 4.18 1.89 45.2 1582 1,032 0.77 0.51 0.22 0.19 SAN NICOLAS 8.93 4.78 53.5 1523 4,120 1.71 1.24 0.52 0.47 SANTA CRUZ 3.35 0.88 26.3 1599 4,247 0.59 0.23 0.17 0.10 SAMPALOC 1.93 0.46 23.8 1615 7,303 0.32 0.11 0.09 0.04 SAN MIGUEL 4.37 2.76 63.2 1580 752 0.80 0.69 0.22 0.24 ERMITA 2.40 1.58 65.8 1611 159 0.41 0.39 0.11 0.15 INTRAMUROS 7.97 4.26 53.5 1535 427 1.47 1.08 0.42 0.40 MALATE 3.90 1.07 27.4 1587 3,253 0.69 0.25 0.20 0.10 PACO 3.07 0.87 28.3 1602 2,271 0.51 0.19 0.13 0.06 PANDACAN 3.66 0.96 26.2 1592 2,974 0.62 0.23 0.17 0.09 PORT AREA 13.17 9.99 75.9 1463 6,844 2.71 3.11 0.86 1.43 SANTA ANA 3.79 0.93 24.5 1590 7,232 0.67 0.25 0.19 0.11
2nd district MANDALUYONG CITY
2.96 1.77 59.8 1605 9,073 0.52 0.44 0.15 0.16
CITY OF MARIKINA 2.72 1.91 70.2 1609 10,727 0.47 0.50 0.14 0.22 CITY OF PASIG 3.62 1.67 46.1 1593 20,928 0.63 0.39 0.17 0.14 QUEZON CITY 3.03 0.88 29.0 1604 78,710 0.55 0.26 0.16 0.11 SAN JUAN 1.50 1.03 68.7 1619 2,024 0.26 0.30 0.08 0.14
3rd district KALOOKAN CITY 5.16 1.70 32.9 1575 65,183 0.91 0.39 0.26 0.15 MALABON 5.10 1.82 35.7 1576 17,575 0.90 0.48 0.26 0.20 NAVOTAS 7.41 3.12 42.1 1543 17,484 1.37 0.80 0.39 0.30 CITY OF VALENZUELA
4.40 1.52 34.5 1579 22,676 0.73 0.35 0.20 0.13
4th district CITY OF LAS PIÑAS 3.40 1.57 46.2 1598 15,010 0.58 0.37 0.16 0.14 CITY OF MAKATI 1.86 0.89 47.8 1617 9,618 0.31 0.24 0.09 0.10 CITY OF MUNTINLUPA
3.98 1.84 46.2 1585 15,446 0.66 0.42 0.18 0.16
CITY OF PARAÑAQUE
2.03 1.15 56.7 1613 10,340 0.34 0.28 0.10 0.11
PASAY CITY 3.73 0.67 18.0 1591 15,067 0.66 0.17 0.19 0.06 PATEROS 4.13 3.21 77.7 1583 2,584 0.72 0.76 0.20 0.27 TAGUIG 5.23 2.26 43.2 1574 27,149 0.95 0.62 0.28 0.25
CAR Abra BANGUED (Capital) 19.74 2.43 12.3 1310 8,622 5.28 0.87 2.04 0.41 BOLINEY 73.52 6.58 8.9 47 2,476 31.64 4.70 16.94 3.35 BUCAY 37.19 4.25 11.4 817 5,766 11.28 1.84 4.72 0.98 BUCLOC 62.68 8.46 13.5 161 1,392 23.34 4.85 11.23 3.08 DAGUIOMAN 40.97 7.67 18.7 689 761 13.39 3.39 5.90 1.88 DANGLAS 49.56 7.79 15.7 415 2,346 17.21 3.77 7.96 2.18 DOLORES 38.99 4.87 12.5 754 3,974 13.19 2.30 6.01 1.32 LA PAZ 40.53 4.96 12.2 698 5,734 12.71 2.21 5.45 1.18 LACUB 61.48 5.69 9.3 174 1,857 24.09 3.68 12.03 2.54 LAGANGILANG 38.54 4.21 10.9 770 4,958 12.11 1.88 5.19 1.02 LAGAYAN 52.54 7.28 13.9 347 2,163 18.44 3.95 8.55 2.36 LANGIDEN 63.81 8.23 12.9 138 1,956 25.25 5.54 12.75 3.73 LICUAN-BAAY (LICUAN)
50.84 5.07 10.0 378 1,958 18.18 2.72 8.61 1.65
LUBA 52.42 6.01 11.5 349 3,325 18.12 3.05 8.32 1.80 MALIBCONG 53.46 6.13 11.5 325 1,755 18.16 2.99 8.20 1.69 MANABO 26.52 5.48 20.7 1145 2,642 7.02 2.04 2.67 0.98 PEÑARRUBIA 35.89 5.45 15.2 866 2,242 11.10 2.26 4.73 1.17 PIDIGAN 34.44 3.77 10.9 916 3,765 10.32 1.59 4.29 0.84 PILAR 39.00 4.62 11.8 752 3,697 11.85 1.99 4.94 1.04 SALLAPADAN 37.95 5.18 13.6 791 2,309 11.86 2.38 5.09 1.34 SAN ISIDRO 65.52 5.65 8.6 116 2,957 26.34 3.97 13.34 2.71 SAN JUAN 33.70 4.61 13.7 944 3,205 9.96 1.87 4.09 0.94
2003 City and Municipal Level Poverty Estimates Page 82 NSCB/WB Intercensal Updating of Small Area Poverty Estimates
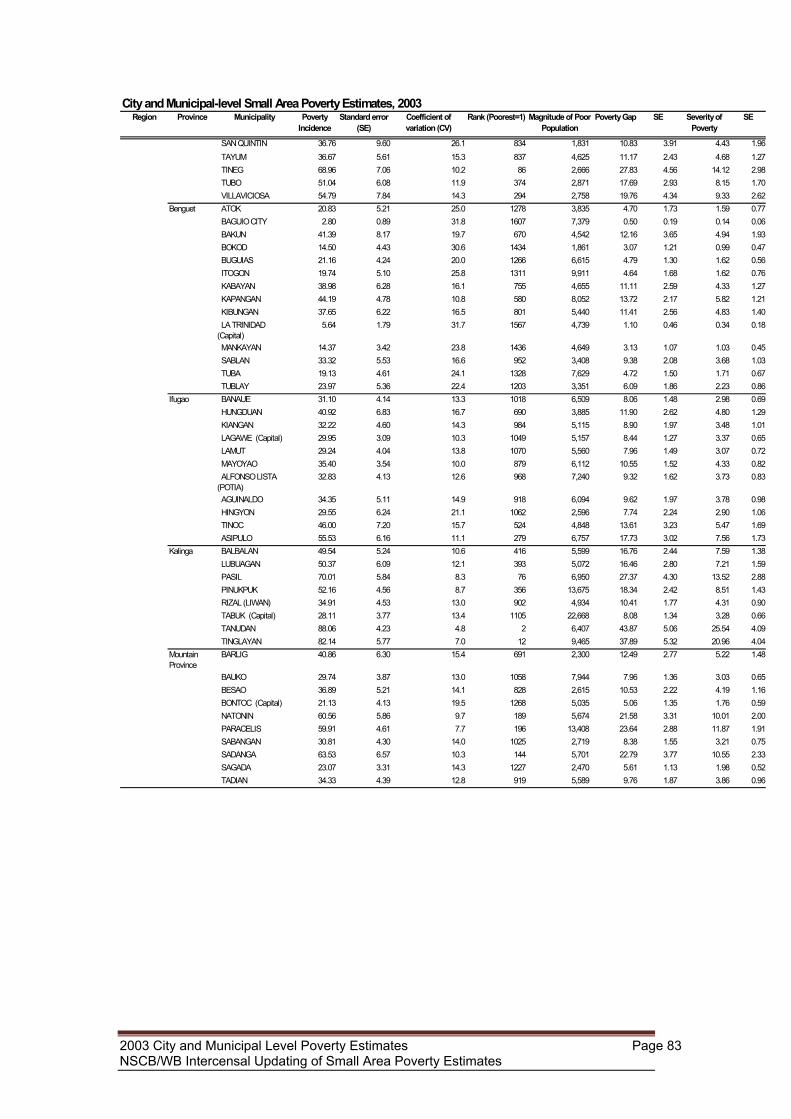
City and Municipal-level Small Area Poverty Estimates, 2003Region Province Municipality Poverty
IncidenceStandard error
(SE)Coefficient of variation (CV)
Rank (Poorest=1) Magnitude of Poor Population
Poverty Gap SE Severity of Poverty
SE
SAN QUINTIN 36.76 9.60 26.1 834 1,831 10.83 3.91 4.43 1.96 TAYUM 36.67 5.61 15.3 837 4,625 11.17 2.43 4.68 1.27 TINEG 68.96 7.06 10.2 86 2,666 27.83 4.56 14.12 2.98 TUBO 51.04 6.08 11.9 374 2,871 17.69 2.93 8.15 1.70 VILLAVICIOSA 54.79 7.84 14.3 294 2,758 19.76 4.34 9.33 2.62
Benguet ATOK 20.83 5.21 25.0 1278 3,835 4.70 1.73 1.59 0.77 BAGUIO CITY 2.80 0.89 31.8 1607 7,379 0.50 0.19 0.14 0.06 BAKUN 41.39 8.17 19.7 670 4,542 12.16 3.65 4.94 1.93 BOKOD 14.50 4.43 30.6 1434 1,861 3.07 1.21 0.99 0.47 BUGUIAS 21.16 4.24 20.0 1266 6,615 4.79 1.30 1.62 0.56 ITOGON 19.74 5.10 25.8 1311 9,911 4.64 1.68 1.62 0.76 KABAYAN 38.98 6.28 16.1 755 4,655 11.11 2.59 4.33 1.27 KAPANGAN 44.19 4.78 10.8 580 8,052 13.72 2.17 5.82 1.21 KIBUNGAN 37.65 6.22 16.5 801 5,440 11.41 2.56 4.83 1.40 LA TRINIDAD (Capital)
5.64 1.79 31.7 1567 4,739 1.10 0.46 0.34 0.18
MANKAYAN 14.37 3.42 23.8 1436 4,649 3.13 1.07 1.03 0.45 SABLAN 33.32 5.53 16.6 952 3,408 9.38 2.08 3.68 1.03 TUBA 19.13 4.61 24.1 1328 7,629 4.72 1.50 1.71 0.67 TUBLAY 23.97 5.36 22.4 1203 3,351 6.09 1.86 2.23 0.86
Ifugao BANAUE 31.10 4.14 13.3 1018 6,509 8.06 1.48 2.98 0.69 HUNGDUAN 40.92 6.83 16.7 690 3,885 11.90 2.62 4.80 1.29 KIANGAN 32.22 4.60 14.3 984 5,115 8.90 1.97 3.48 1.01 LAGAWE (Capital) 29.95 3.09 10.3 1049 5,157 8.44 1.27 3.37 0.65 LAMUT 29.24 4.04 13.8 1070 5,560 7.96 1.49 3.07 0.72 MAYOYAO 35.40 3.54 10.0 879 6,112 10.55 1.52 4.33 0.82 ALFONSO LISTA (POTIA)
32.83 4.13 12.6 968 7,240 9.32 1.62 3.73 0.83
AGUINALDO 34.35 5.11 14.9 918 6,094 9.62 1.97 3.78 0.98 HINGYON 29.55 6.24 21.1 1062 2,596 7.74 2.24 2.90 1.06 TINOC 46.00 7.20 15.7 524 4,848 13.61 3.23 5.47 1.69 ASIPULO 55.53 6.16 11.1 279 6,757 17.73 3.02 7.56 1.73
Kalinga BALBALAN 49.54 5.24 10.6 416 5,599 16.76 2.44 7.59 1.38 LUBUAGAN 50.37 6.09 12.1 393 5,072 16.46 2.80 7.21 1.59 PASIL 70.01 5.84 8.3 76 6,950 27.37 4.30 13.52 2.88 PINUKPUK 52.16 4.56 8.7 356 13,675 18.34 2.42 8.51 1.43 RIZAL (LIWAN) 34.91 4.53 13.0 902 4,934 10.41 1.77 4.31 0.90 TABUK (Capital) 28.11 3.77 13.4 1105 22,668 8.08 1.34 3.28 0.66 TANUDAN 88.06 4.23 4.8 2 6,407 43.87 5.06 25.54 4.09 TINGLAYAN 82.14 5.77 7.0 12 9,465 37.89 5.32 20.96 4.04
Mountain Province
BARLIG 40.86 6.30 15.4 691 2,300 12.49 2.77 5.22 1.48
BAUKO 29.74 3.87 13.0 1058 7,944 7.96 1.36 3.03 0.65 BESAO 36.89 5.21 14.1 828 2,615 10.53 2.22 4.19 1.16 BONTOC (Capital) 21.13 4.13 19.5 1268 5,035 5.06 1.35 1.76 0.59 NATONIN 60.56 5.86 9.7 189 5,674 21.58 3.31 10.01 2.00 PARACELIS 59.91 4.61 7.7 196 13,408 23.64 2.88 11.87 1.91 SABANGAN 30.81 4.30 14.0 1025 2,719 8.38 1.55 3.21 0.75 SADANGA 63.53 6.57 10.3 144 5,701 22.79 3.77 10.55 2.33 SAGADA 23.07 3.31 14.3 1227 2,470 5.61 1.13 1.98 0.52 TADIAN 34.33 4.39 12.8 919 5,589 9.76 1.87 3.86 0.96
2003 City and Municipal Level Poverty Estimates Page 83 NSCB/WB Intercensal Updating of Small Area Poverty Estimates
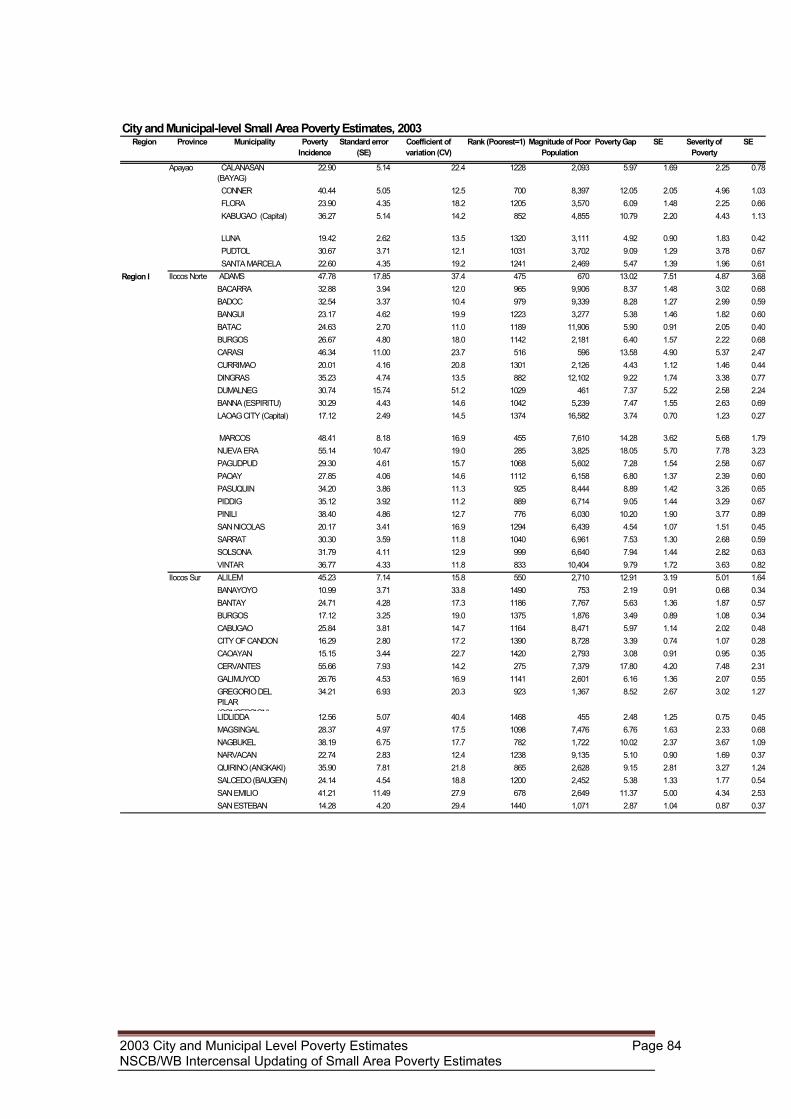
City and Municipal-level Small Area Poverty Estimates, 2003Region Province Municipality Poverty
IncidenceStandard error
(SE)Coefficient of variation (CV)
Rank (Poorest=1) Magnitude of Poor Population
Poverty Gap SE Severity of Poverty
SE
Apayao CALANASAN (BAYAG)
22.90 5.14 22.4 1228 2,093 5.97 1.69 2.25 0.78
CONNER 40.44 5.05 12.5 700 8,397 12.05 2.05 4.96 1.03 FLORA 23.90 4.35 18.2 1205 3,570 6.09 1.48 2.25 0.66 KABUGAO (Capital) 36.27 5.14 14.2 852 4,855 10.79 2.20 4.43 1.13
LUNA 19.42 2.62 13.5 1320 3,111 4.92 0.90 1.83 0.42 PUDTOL 30.67 3.71 12.1 1031 3,702 9.09 1.29 3.78 0.67 SANTA MARCELA 22.60 4.35 19.2 1241 2,469 5.47 1.39 1.96 0.61
Region I Ilocos Norte ADAMS 47.78 17.85 37.4 475 670 13.02 7.51 4.87 3.68BACARRA 32.88 3.94 12.0 965 9,906 8.37 1.48 3.02 0.68BADOC 32.54 3.37 10.4 979 9,339 8.28 1.27 2.99 0.59BANGUI 23.17 4.62 19.9 1223 3,277 5.38 1.46 1.82 0.60BATAC 24.63 2.70 11.0 1189 11,906 5.90 0.91 2.05 0.40BURGOS 26.67 4.80 18.0 1142 2,181 6.40 1.57 2.22 0.68CARASI 46.34 11.00 23.7 516 596 13.58 4.90 5.37 2.47CURRIMAO 20.01 4.16 20.8 1301 2,126 4.43 1.12 1.46 0.44DINGRAS 35.23 4.74 13.5 882 12,102 9.22 1.74 3.38 0.77DUMALNEG 30.74 15.74 51.2 1029 461 7.37 5.22 2.58 2.24BANNA (ESPIRITU) 30.29 4.43 14.6 1042 5,239 7.47 1.55 2.63 0.69LAOAG CITY (Capital) 17.12 2.49 14.5 1374 16,582 3.74 0.70 1.23 0.27
MARCOS 48.41 8.18 16.9 455 7,610 14.28 3.62 5.68 1.79NUEVA ERA 55.14 10.47 19.0 285 3,825 18.05 5.70 7.78 3.23PAGUDPUD 29.30 4.61 15.7 1068 5,602 7.28 1.54 2.58 0.67PAOAY 27.85 4.06 14.6 1112 6,158 6.80 1.37 2.39 0.60PASUQUIN 34.20 3.86 11.3 925 8,444 8.89 1.42 3.26 0.65PIDDIG 35.12 3.92 11.2 889 6,714 9.05 1.44 3.29 0.67PINILI 38.40 4.86 12.7 776 6,030 10.20 1.90 3.77 0.89SAN NICOLAS 20.17 3.41 16.9 1294 6,439 4.54 1.07 1.51 0.45SARRAT 30.30 3.59 11.8 1040 6,961 7.53 1.30 2.68 0.59SOLSONA 31.79 4.11 12.9 999 6,640 7.94 1.44 2.82 0.63VINTAR 36.77 4.33 11.8 833 10,404 9.79 1.72 3.63 0.82
Ilocos Sur ALILEM 45.23 7.14 15.8 550 2,710 12.91 3.19 5.01 1.64BANAYOYO 10.99 3.71 33.8 1490 753 2.19 0.91 0.68 0.34BANTAY 24.71 4.28 17.3 1186 7,767 5.63 1.36 1.87 0.57BURGOS 17.12 3.25 19.0 1375 1,876 3.49 0.89 1.08 0.34CABUGAO 25.84 3.81 14.7 1164 8,471 5.97 1.14 2.02 0.48CITY OF CANDON 16.29 2.80 17.2 1390 8,728 3.39 0.74 1.07 0.28CAOAYAN 15.15 3.44 22.7 1420 2,793 3.08 0.91 0.95 0.35CERVANTES 55.66 7.93 14.2 275 7,379 17.80 4.20 7.48 2.31GALIMUYOD 26.76 4.53 16.9 1141 2,601 6.16 1.36 2.07 0.55GREGORIO DEL PILAR (CONCEPCION)
34.21 6.93 20.3 923 1,367 8.52 2.67 3.02 1.27
LIDLIDDA 12.56 5.07 40.4 1468 455 2.48 1.25 0.75 0.45MAGSINGAL 28.37 4.97 17.5 1098 7,476 6.76 1.63 2.33 0.68NAGBUKEL 38.19 6.75 17.7 782 1,722 10.02 2.37 3.67 1.09NARVACAN 22.74 2.83 12.4 1238 9,135 5.10 0.90 1.69 0.37QUIRINO (ANGKAKI) 35.90 7.81 21.8 865 2,628 9.15 2.81 3.27 1.24SALCEDO (BAUGEN) 24.14 4.54 18.8 1200 2,452 5.38 1.33 1.77 0.54SAN EMILIO 41.21 11.49 27.9 678 2,649 11.37 5.00 4.34 2.53SAN ESTEBAN 14.28 4.20 29.4 1440 1,071 2.87 1.04 0.87 0.37
2003 City and Municipal Level Poverty Estimates Page 84 NSCB/WB Intercensal Updating of Small Area Poverty Estimates

City and Municipal-level Small Area Poverty Estimates, 2003Region Province Municipality Poverty
IncidenceStandard error
(SE)Coefficient of variation (CV)
Rank (Poorest=1) Magnitude of Poor Population
Poverty Gap SE Severity of Poverty
SE
SAN ILDEFONSO 17.13 3.97 23.2 1373 1,054 3.62 1.09 1.14 0.42SAN JUAN (LAPOG) 30.63 4.12 13.5 1032 6,997 7.43 1.39 2.59 0.60SAN VICENTE 23.63 5.16 21.8 1214 2,748 5.32 1.78 1.76 0.78SANTA 14.68 3.44 23.4 1429 2,023 2.93 0.86 0.89 0.31SANTA CATALINA 18.53 5.00 27.0 1336 2,404 3.90 1.40 1.22 0.53SANTA CRUZ 20.35 2.50 12.3 1292 6,995 4.43 0.77 1.43 0.33SANTA LUCIA 19.79 3.25 16.4 1307 4,605 4.30 0.98 1.39 0.39SANTA MARIA 11.64 2.67 22.9 1481 3,152 2.35 0.68 0.73 0.25SANTIAGO 20.01 3.86 19.3 1302 3,201 4.30 1.08 1.38 0.42SANTO DOMINGO 17.77 3.13 17.6 1359 4,338 3.70 0.82 1.17 0.31SIGAY 37.23 9.92 26.6 813 851 9.38 3.66 3.28 1.68SINAIT 17.05 2.88 16.9 1376 4,094 3.56 0.81 1.12 0.32SUGPON 70.71 15.40 21.8 67 2,554 27.41 10.51 13.28 6.76 SUYO 46.68 10.87 23.3 504 4,779 13.75 4.99 5.49 2.52TAGUDIN 25.36 3.62 14.3 1172 8,534 5.86 1.14 1.97 0.46CITY OF VIGAN (Capital)
13.60 2.39 17.6 1451 6,207 2.78 0.63 0.87 0.24
La Union AGOO 25.85 2.69 10.4 1162 14,047 6.07 0.86 2.08 0.36ARINGAY 30.48 5.20 17.1 1037 12,404 7.54 1.77 2.66 0.75BACNOTAN 20.54 2.97 14.5 1287 7,548 4.49 0.84 1.46 0.33BAGULIN 85.50 9.61 11.2 6 9,755 40.65 10.64 22.75 8.52BALAOAN 25.07 3.32 13.2 1180 8,831 5.74 0.99 1.93 0.40BANGAR 31.13 3.73 12.0 1017 9,875 7.69 1.33 2.71 0.58BAUANG 19.67 2.73 13.9 1316 12,890 4.38 0.82 1.44 0.34BURGOS 43.17 9.90 22.9 610 3,274 12.25 4.12 4.75 1.99CABA 26.19 4.01 15.3 1152 5,183 6.17 1.36 2.12 0.59LUNA 29.91 3.72 12.4 1053 10,212 7.30 1.27 2.56 0.55NAGUILIAN 26.17 3.58 13.7 1154 11,060 6.14 1.19 2.09 0.52 PUGO 27.19 5.22 19.2 1130 4,546 6.42 1.72 2.20 0.75ROSARIO 38.79 4.47 11.5 762 17,862 10.27 1.76 3.79 0.82CITY OF SAN FERNANDO (Capital)
14.47 2.75 19.0 1435 15,413 3.06 0.74 0.97 0.29
SAN GABRIEL 47.93 6.56 13.7 469 7,158 14.23 2.94 5.69 1.49SAN JUAN 19.80 3.02 15.3 1306 6,093 4.36 0.87 1.43 0.35SANTO TOMAS 20.49 3.46 16.9 1288 6,531 4.54 0.97 1.50 0.39SANTOL 73.13 9.52 13.0 51 8,110 28.63 6.99 13.90 4.59SUDIPEN 35.18 5.31 15.1 886 5,315 8.95 1.90 3.22 0.84TUBAO 37.22 5.47 14.7 815 9,262 9.78 2.06 3.59 0.96
Pangasinan AGNO 45.96 7.21 15.7 526 11,283 13.54 3.20 5.40 1.61AGUILAR 31.64 5.34 16.9 1000 10,809 7.90 1.92 2.82 0.86CITY OF ALAMINOS 20.76 3.17 15.3 1281 15,430 4.71 0.97 1.58 0.41ALCALA 15.28 3.35 21.9 1416 5,637 3.25 0.89 1.04 0.34ANDA 34.71 4.91 14.1 910 11,055 9.17 1.90 3.40 0.89ASINGAN 17.23 3.39 19.7 1371 8,877 3.65 0.88 1.17 0.33BALUNGAO 19.26 3.41 17.7 1325 4,686 4.23 0.98 1.39 0.40BANI 43.56 9.57 22.0 601 19,081 12.56 4.20 4.97 2.11BASISTA 25.90 5.23 20.2 1160 6,767 6.10 1.77 2.09 0.76BAUTISTA 20.82 4.32 20.7 1279 5,454 4.63 1.26 1.53 0.50BAYAMBANG 29.53 2.42 8.2 1064 28,731 7.17 0.86 2.51 0.38BINALONAN 16.75 3.05 18.2 1383 8,373 3.63 0.85 1.18 0.33BINMALEY 21.28 3.01 14.1 1263 15,368 4.81 0.94 1.61 0.39BOLINAO 45.53 7.20 15.8 543 29,563 13.58 3.17 5.47 1.61BUGALLON 27.57 4.44 16.1 1119 16,219 6.51 1.52 2.22 0.65
2003 City and Municipal Level Poverty Estimates Page 85 NSCB/WB Intercensal Updating of Small Area Poverty Estimates
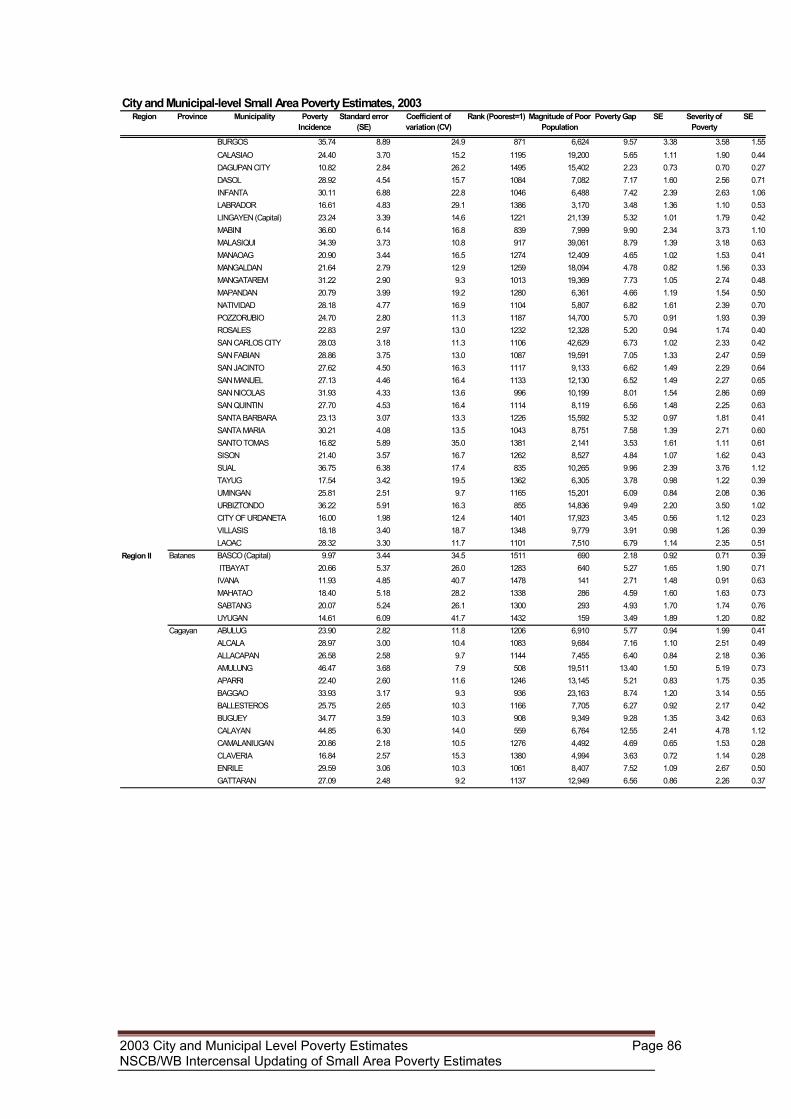
City and Municipal-level Small Area Poverty Estimates, 2003Region Province Municipality Poverty
IncidenceStandard error
(SE)Coefficient of variation (CV)
Rank (Poorest=1) Magnitude of Poor Population
Poverty Gap SE Severity of Poverty
SE
BURGOS 35.74 8.89 24.9 871 6,624 9.57 3.38 3.58 1.55CALASIAO 24.40 3.70 15.2 1195 19,200 5.65 1.11 1.90 0.44DAGUPAN CITY 10.82 2.84 26.2 1495 15,402 2.23 0.73 0.70 0.27DASOL 28.92 4.54 15.7 1084 7,082 7.17 1.60 2.56 0.71INFANTA 30.11 6.88 22.8 1046 6,488 7.42 2.39 2.63 1.06LABRADOR 16.61 4.83 29.1 1386 3,170 3.48 1.36 1.10 0.53LINGAYEN (Capital) 23.24 3.39 14.6 1221 21,139 5.32 1.01 1.79 0.42MABINI 36.60 6.14 16.8 839 7,999 9.90 2.34 3.73 1.10MALASIQUI 34.39 3.73 10.8 917 39,061 8.79 1.39 3.18 0.63MANAOAG 20.90 3.44 16.5 1274 12,409 4.65 1.02 1.53 0.41MANGALDAN 21.64 2.79 12.9 1259 18,094 4.78 0.82 1.56 0.33MANGATAREM 31.22 2.90 9.3 1013 19,369 7.73 1.05 2.74 0.48MAPANDAN 20.79 3.99 19.2 1280 6,361 4.66 1.19 1.54 0.50NATIVIDAD 28.18 4.77 16.9 1104 5,807 6.82 1.61 2.39 0.70POZZORUBIO 24.70 2.80 11.3 1187 14,700 5.70 0.91 1.93 0.39ROSALES 22.83 2.97 13.0 1232 12,328 5.20 0.94 1.74 0.40SAN CARLOS CITY 28.03 3.18 11.3 1106 42,629 6.73 1.02 2.33 0.42SAN FABIAN 28.86 3.75 13.0 1087 19,591 7.05 1.33 2.47 0.59SAN JACINTO 27.62 4.50 16.3 1117 9,133 6.62 1.49 2.29 0.64SAN MANUEL 27.13 4.46 16.4 1133 12,130 6.52 1.49 2.27 0.65SAN NICOLAS 31.93 4.33 13.6 996 10,199 8.01 1.54 2.86 0.69SAN QUINTIN 27.70 4.53 16.4 1114 8,119 6.56 1.48 2.25 0.63SANTA BARBARA 23.13 3.07 13.3 1226 15,592 5.32 0.97 1.81 0.41SANTA MARIA 30.21 4.08 13.5 1043 8,751 7.58 1.39 2.71 0.60SANTO TOMAS 16.82 5.89 35.0 1381 2,141 3.53 1.61 1.11 0.61SISON 21.40 3.57 16.7 1262 8,527 4.84 1.07 1.62 0.43SUAL 36.75 6.38 17.4 835 10,265 9.96 2.39 3.76 1.12TAYUG 17.54 3.42 19.5 1362 6,305 3.78 0.98 1.22 0.39UMINGAN 25.81 2.51 9.7 1165 15,201 6.09 0.84 2.08 0.36URBIZTONDO 36.22 5.91 16.3 855 14,836 9.49 2.20 3.50 1.02CITY OF URDANETA 16.00 1.98 12.4 1401 17,923 3.45 0.56 1.12 0.23VILLASIS 18.18 3.40 18.7 1348 9,779 3.91 0.98 1.26 0.39LAOAC 28.32 3.30 11.7 1101 7,510 6.79 1.14 2.35 0.51
Region II Batanes BASCO (Capital) 9.97 3.44 34.5 1511 690 2.18 0.92 0.71 0.39 ITBAYAT 20.66 5.37 26.0 1283 640 5.27 1.65 1.90 0.71IVANA 11.93 4.85 40.7 1478 141 2.71 1.48 0.91 0.63MAHATAO 18.40 5.18 28.2 1338 286 4.59 1.60 1.63 0.73SABTANG 20.07 5.24 26.1 1300 293 4.93 1.70 1.74 0.76UYUGAN 14.61 6.09 41.7 1432 159 3.49 1.89 1.20 0.82
Cagayan ABULUG 23.90 2.82 11.8 1206 6,910 5.77 0.94 1.99 0.41ALCALA 28.97 3.00 10.4 1083 9,684 7.16 1.10 2.51 0.49ALLACAPAN 26.58 2.58 9.7 1144 7,455 6.40 0.84 2.18 0.36AMULUNG 46.47 3.68 7.9 508 19,511 13.40 1.50 5.19 0.73APARRI 22.40 2.60 11.6 1246 13,145 5.21 0.83 1.75 0.35BAGGAO 33.93 3.17 9.3 936 23,163 8.74 1.20 3.14 0.55BALLESTEROS 25.75 2.65 10.3 1166 7,705 6.27 0.92 2.17 0.42BUGUEY 34.77 3.59 10.3 908 9,349 9.28 1.35 3.42 0.63CALAYAN 44.85 6.30 14.0 559 6,764 12.55 2.41 4.78 1.12CAMALANIUGAN 20.86 2.18 10.5 1276 4,492 4.69 0.65 1.53 0.28CLAVERIA 16.84 2.57 15.3 1380 4,994 3.63 0.72 1.14 0.28ENRILE 29.59 3.06 10.3 1061 8,407 7.52 1.09 2.67 0.50GATTARAN 27.09 2.48 9.2 1137 12,949 6.56 0.86 2.26 0.37
2003 City and Municipal Level Poverty Estimates Page 86 NSCB/WB Intercensal Updating of Small Area Poverty Estimates
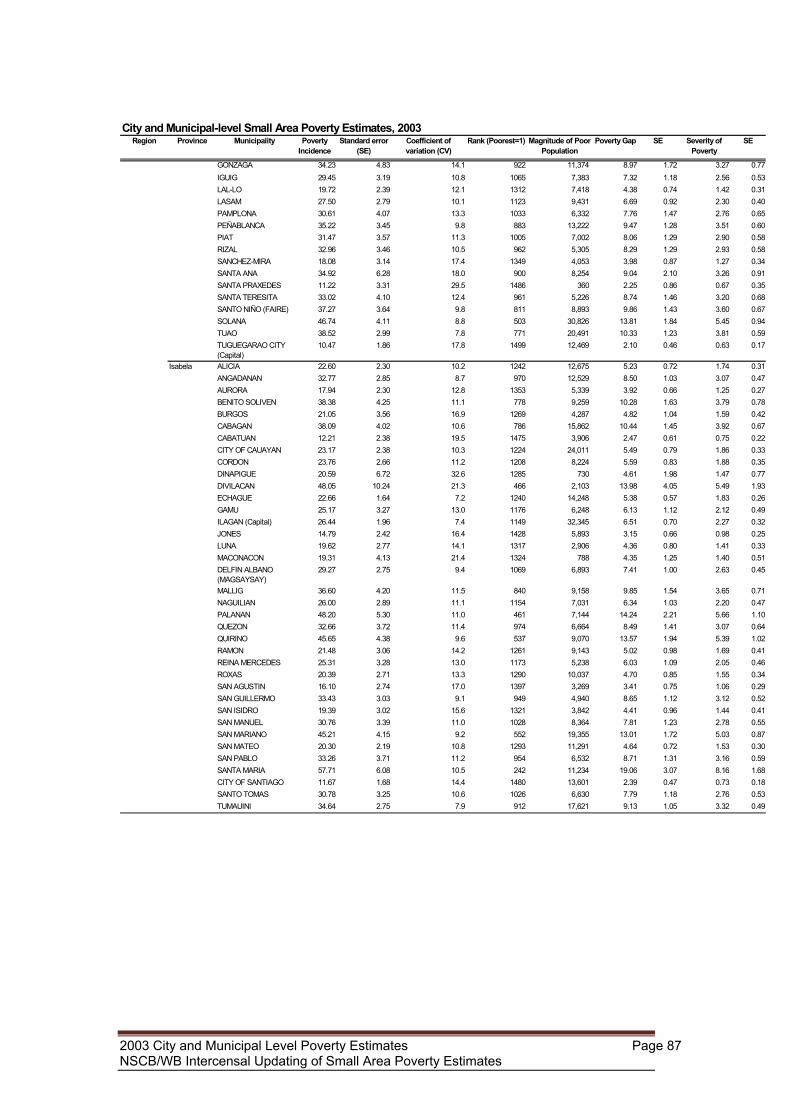
City and Municipal-level Small Area Poverty Estimates, 2003Region Province Municipality Poverty
IncidenceStandard error
(SE)Coefficient of variation (CV)
Rank (Poorest=1) Magnitude of Poor Population
Poverty Gap SE Severity of Poverty
SE
GONZAGA 34.23 4.83 14.1 922 11,374 8.97 1.72 3.27 0.77IGUIG 29.45 3.19 10.8 1065 7,383 7.32 1.18 2.56 0.53LAL-LO 19.72 2.39 12.1 1312 7,418 4.38 0.74 1.42 0.31LASAM 27.50 2.79 10.1 1123 9,431 6.69 0.92 2.30 0.40PAMPLONA 30.61 4.07 13.3 1033 6,332 7.76 1.47 2.76 0.65PEÑABLANCA 35.22 3.45 9.8 883 13,222 9.47 1.28 3.51 0.60PIAT 31.47 3.57 11.3 1005 7,002 8.06 1.29 2.90 0.58RIZAL 32.96 3.46 10.5 962 5,305 8.29 1.29 2.93 0.58SANCHEZ-MIRA 18.08 3.14 17.4 1349 4,053 3.98 0.87 1.27 0.34SANTA ANA 34.92 6.28 18.0 900 8,254 9.04 2.10 3.26 0.91SANTA PRAXEDES 11.22 3.31 29.5 1486 360 2.25 0.86 0.67 0.35SANTA TERESITA 33.02 4.10 12.4 961 5,226 8.74 1.46 3.20 0.68SANTO NIÑO (FAIRE) 37.27 3.64 9.8 811 8,893 9.86 1.43 3.60 0.67SOLANA 46.74 4.11 8.8 503 30,826 13.81 1.84 5.45 0.94TUAO 38.52 2.99 7.8 771 20,491 10.33 1.23 3.81 0.59TUGUEGARAO CITY (Capital)
10.47 1.86 17.8 1499 12,469 2.10 0.46 0.63 0.17
Isabela ALICIA 22.60 2.30 10.2 1242 12,675 5.23 0.72 1.74 0.31ANGADANAN 32.77 2.85 8.7 970 12,529 8.50 1.03 3.07 0.47AURORA 17.94 2.30 12.8 1353 5,339 3.92 0.66 1.25 0.27BENITO SOLIVEN 38.38 4.25 11.1 778 9,259 10.28 1.63 3.79 0.78BURGOS 21.05 3.56 16.9 1269 4,287 4.82 1.04 1.59 0.42CABAGAN 38.09 4.02 10.6 786 15,862 10.44 1.45 3.92 0.67CABATUAN 12.21 2.38 19.5 1475 3,906 2.47 0.61 0.75 0.22CITY OF CAUAYAN 23.17 2.38 10.3 1224 24,011 5.49 0.79 1.86 0.33CORDON 23.76 2.66 11.2 1208 8,224 5.59 0.83 1.88 0.35DINAPIGUE 20.59 6.72 32.6 1285 730 4.61 1.98 1.47 0.77DIVILACAN 48.05 10.24 21.3 466 2,103 13.98 4.05 5.49 1.93ECHAGUE 22.66 1.64 7.2 1240 14,248 5.38 0.57 1.83 0.26GAMU 25.17 3.27 13.0 1176 6,248 6.13 1.12 2.12 0.49ILAGAN (Capital) 26.44 1.96 7.4 1149 32,345 6.51 0.70 2.27 0.32JONES 14.79 2.42 16.4 1428 5,893 3.15 0.66 0.98 0.25LUNA 19.62 2.77 14.1 1317 2,906 4.36 0.80 1.41 0.33MACONACON 19.31 4.13 21.4 1324 788 4.35 1.25 1.40 0.51DELFIN ALBANO (MAGSAYSAY)
29.27 2.75 9.4 1069 6,893 7.41 1.00 2.63 0.45
MALLIG 36.60 4.20 11.5 840 9,158 9.85 1.54 3.65 0.71NAGUILIAN 26.00 2.89 11.1 1154 7,031 6.34 1.03 2.20 0.47PALANAN 48.20 5.30 11.0 461 7,144 14.24 2.21 5.66 1.10QUEZON 32.66 3.72 11.4 974 6,664 8.49 1.41 3.07 0.64QUIRINO 45.65 4.38 9.6 537 9,070 13.57 1.94 5.39 1.02RAMON 21.48 3.06 14.2 1261 9,143 5.02 0.98 1.69 0.41REINA MERCEDES 25.31 3.28 13.0 1173 5,238 6.03 1.09 2.05 0.46ROXAS 20.39 2.71 13.3 1290 10,037 4.70 0.85 1.55 0.34SAN AGUSTIN 16.10 2.74 17.0 1397 3,269 3.41 0.75 1.06 0.29SAN GUILLERMO 33.43 3.03 9.1 949 4,940 8.65 1.12 3.12 0.52SAN ISIDRO 19.39 3.02 15.6 1321 3,842 4.41 0.96 1.44 0.41SAN MANUEL 30.76 3.39 11.0 1028 8,364 7.81 1.23 2.78 0.55SAN MARIANO 45.21 4.15 9.2 552 19,355 13.01 1.72 5.03 0.87SAN MATEO 20.30 2.19 10.8 1293 11,291 4.64 0.72 1.53 0.30SAN PABLO 33.26 3.71 11.2 954 6,532 8.71 1.31 3.16 0.59SANTA MARIA 57.71 6.08 10.5 242 11,234 19.06 3.07 8.16 1.68CITY OF SANTIAGO 11.67 1.68 14.4 1480 13,601 2.39 0.47 0.73 0.18SANTO TOMAS 30.78 3.25 10.6 1026 6,630 7.79 1.18 2.76 0.53TUMAUINI 34.64 2.75 7.9 912 17,621 9.13 1.05 3.32 0.49
2003 City and Municipal Level Poverty Estimates Page 87 NSCB/WB Intercensal Updating of Small Area Poverty Estimates
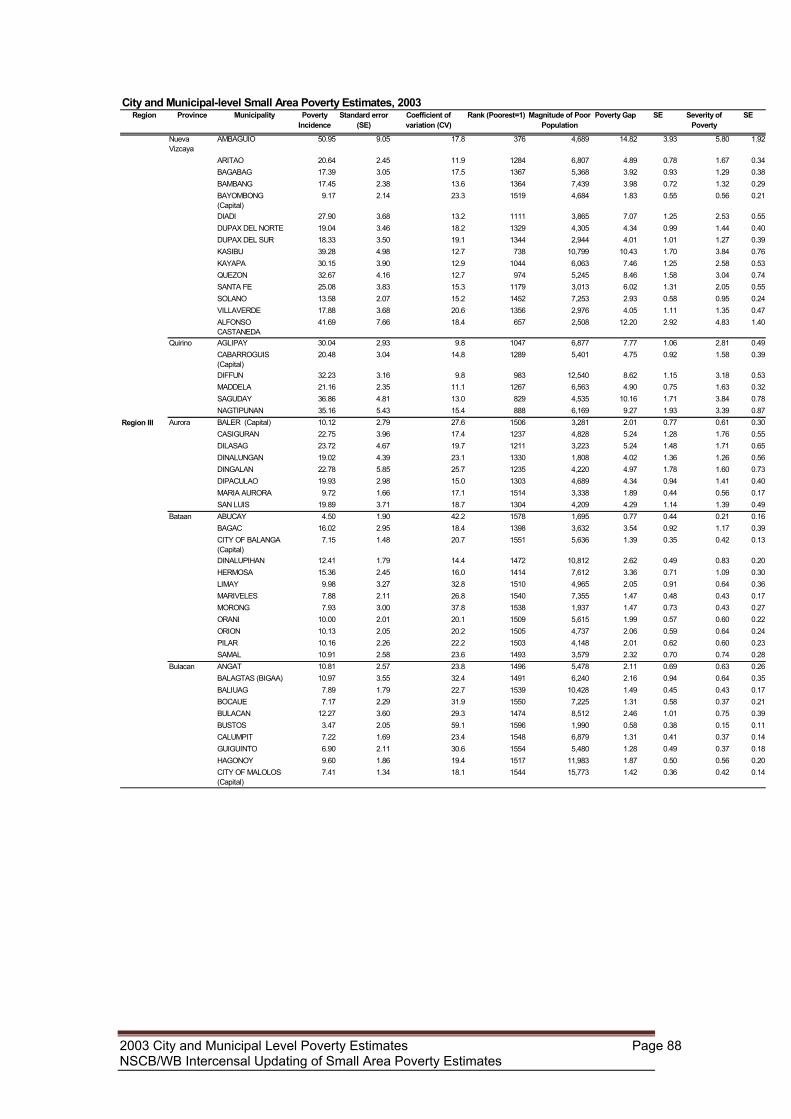
City and Municipal-level Small Area Poverty Estimates, 2003Region Province Municipality Poverty
IncidenceStandard error
(SE)Coefficient of variation (CV)
Rank (Poorest=1) Magnitude of Poor Population
Poverty Gap SE Severity of Poverty
SE
Nueva Vizcaya
AMBAGUIO 50.95 9.05 17.8 376 4,689 14.82 3.93 5.80 1.92
ARITAO 20.64 2.45 11.9 1284 6,807 4.89 0.78 1.67 0.34BAGABAG 17.39 3.05 17.5 1367 5,368 3.92 0.93 1.29 0.38BAMBANG 17.45 2.38 13.6 1364 7,439 3.98 0.72 1.32 0.29BAYOMBONG (Capital)
9.17 2.14 23.3 1519 4,684 1.83 0.55 0.56 0.21
DIADI 27.90 3.68 13.2 1111 3,865 7.07 1.25 2.53 0.55DUPAX DEL NORTE 19.04 3.46 18.2 1329 4,305 4.34 0.99 1.44 0.40DUPAX DEL SUR 18.33 3.50 19.1 1344 2,944 4.01 1.01 1.27 0.39KASIBU 39.28 4.98 12.7 738 10,799 10.43 1.70 3.84 0.76KAYAPA 30.15 3.90 12.9 1044 6,063 7.46 1.25 2.58 0.53QUEZON 32.67 4.16 12.7 974 5,245 8.46 1.58 3.04 0.74SANTA FE 25.08 3.83 15.3 1179 3,013 6.02 1.31 2.05 0.55SOLANO 13.58 2.07 15.2 1452 7,253 2.93 0.58 0.95 0.24VILLAVERDE 17.88 3.68 20.6 1356 2,976 4.05 1.11 1.35 0.47ALFONSO CASTANEDA
41.69 7.66 18.4 657 2,508 12.20 2.92 4.83 1.40
Quirino AGLIPAY 30.04 2.93 9.8 1047 6,877 7.77 1.06 2.81 0.49CABARROGUIS (Capital)
20.48 3.04 14.8 1289 5,401 4.75 0.92 1.58 0.39
DIFFUN 32.23 3.16 9.8 983 12,540 8.62 1.15 3.18 0.53MADDELA 21.16 2.35 11.1 1267 6,563 4.90 0.75 1.63 0.32SAGUDAY 36.86 4.81 13.0 829 4,535 10.16 1.71 3.84 0.78NAGTIPUNAN 35.16 5.43 15.4 888 6,169 9.27 1.93 3.39 0.87
Region III Aurora BALER (Capital) 10.12 2.79 27.6 1506 3,281 2.01 0.77 0.61 0.30CASIGURAN 22.75 3.96 17.4 1237 4,828 5.24 1.28 1.76 0.55DILASAG 23.72 4.67 19.7 1211 3,223 5.24 1.48 1.71 0.65DINALUNGAN 19.02 4.39 23.1 1330 1,808 4.02 1.36 1.26 0.56DINGALAN 22.78 5.85 25.7 1235 4,220 4.97 1.78 1.60 0.73DIPACULAO 19.93 2.98 15.0 1303 4,689 4.34 0.94 1.41 0.40MARIA AURORA 9.72 1.66 17.1 1514 3,338 1.89 0.44 0.56 0.17SAN LUIS 19.89 3.71 18.7 1304 4,209 4.29 1.14 1.39 0.49
Bataan ABUCAY 4.50 1.90 42.2 1578 1,695 0.77 0.44 0.21 0.16BAGAC 16.02 2.95 18.4 1398 3,632 3.54 0.92 1.17 0.39CITY OF BALANGA (Capital)
7.15 1.48 20.7 1551 5,636 1.39 0.35 0.42 0.13
DINALUPIHAN 12.41 1.79 14.4 1472 10,812 2.62 0.49 0.83 0.20HERMOSA 15.36 2.45 16.0 1414 7,612 3.36 0.71 1.09 0.30LIMAY 9.98 3.27 32.8 1510 4,965 2.05 0.91 0.64 0.36MARIVELES 7.88 2.11 26.8 1540 7,355 1.47 0.48 0.43 0.17MORONG 7.93 3.00 37.8 1538 1,937 1.47 0.73 0.43 0.27ORANI 10.00 2.01 20.1 1509 5,615 1.99 0.57 0.60 0.22ORION 10.13 2.05 20.2 1505 4,737 2.06 0.59 0.64 0.24PILAR 10.16 2.26 22.2 1503 4,148 2.01 0.62 0.60 0.23SAMAL 10.91 2.58 23.6 1493 3,579 2.32 0.70 0.74 0.28
Bulacan ANGAT 10.81 2.57 23.8 1496 5,478 2.11 0.69 0.63 0.26BALAGTAS (BIGAA) 10.97 3.55 32.4 1491 6,240 2.16 0.94 0.64 0.35BALIUAG 7.89 1.79 22.7 1539 10,428 1.49 0.45 0.43 0.17BOCAUE 7.17 2.29 31.9 1550 7,225 1.31 0.58 0.37 0.21BULACAN 12.27 3.60 29.3 1474 8,512 2.46 1.01 0.75 0.39BUSTOS 3.47 2.05 59.1 1596 1,990 0.58 0.38 0.15 0.11CALUMPIT 7.22 1.69 23.4 1548 6,879 1.31 0.41 0.37 0.14GUIGUINTO 6.90 2.11 30.6 1554 5,480 1.28 0.49 0.37 0.18HAGONOY 9.60 1.86 19.4 1517 11,983 1.87 0.50 0.56 0.20CITY OF MALOLOS (Capital)
7.41 1.34 18.1 1544 15,773 1.42 0.36 0.42 0.14
2003 City and Municipal Level Poverty Estimates Page 88 NSCB/WB Intercensal Updating of Small Area Poverty Estimates
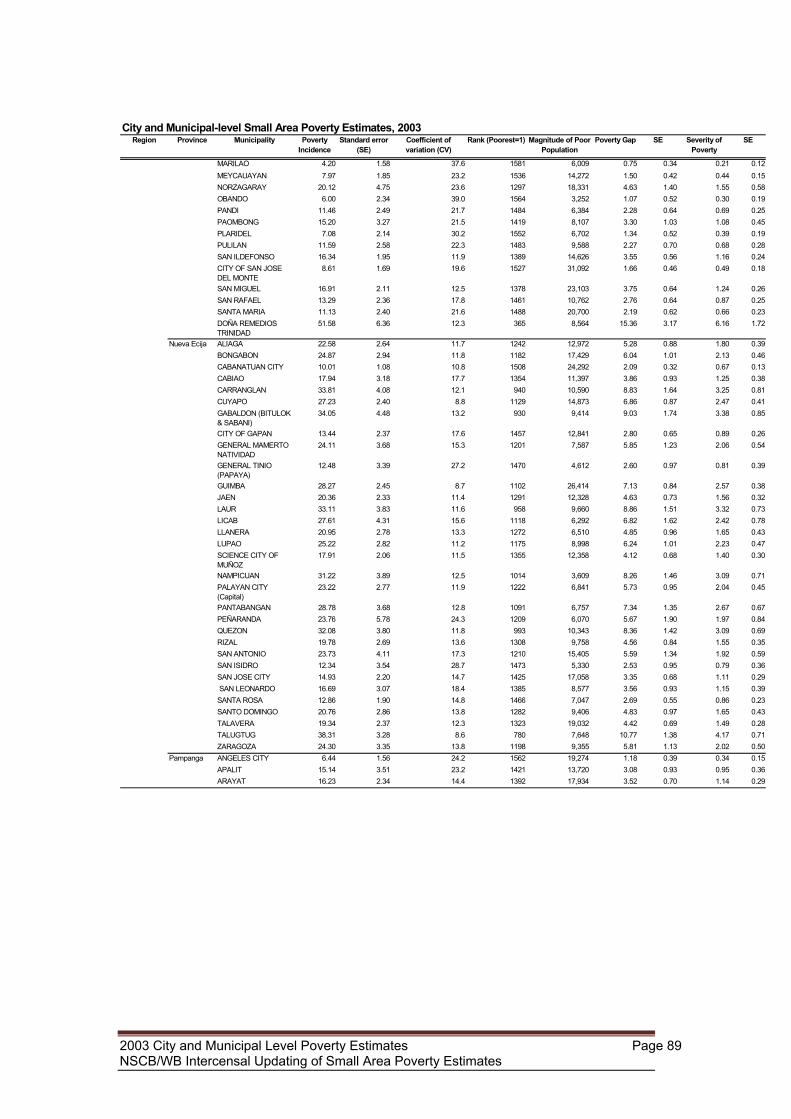
City and Municipal-level Small Area Poverty Estimates, 2003Region Province Municipality Poverty
IncidenceStandard error
(SE)Coefficient of variation (CV)
Rank (Poorest=1) Magnitude of Poor Population
Poverty Gap SE Severity of Poverty
SE
MARILAO 4.20 1.58 37.6 1581 6,009 0.75 0.34 0.21 0.12MEYCAUAYAN 7.97 1.85 23.2 1536 14,272 1.50 0.42 0.44 0.15NORZAGARAY 20.12 4.75 23.6 1297 18,331 4.63 1.40 1.55 0.58OBANDO 6.00 2.34 39.0 1564 3,252 1.07 0.52 0.30 0.19PANDI 11.46 2.49 21.7 1484 6,384 2.28 0.64 0.69 0.25PAOMBONG 15.20 3.27 21.5 1419 8,107 3.30 1.03 1.08 0.45PLARIDEL 7.08 2.14 30.2 1552 6,702 1.34 0.52 0.39 0.19PULILAN 11.59 2.58 22.3 1483 9,588 2.27 0.70 0.68 0.28SAN ILDEFONSO 16.34 1.95 11.9 1389 14,626 3.55 0.56 1.16 0.24CITY OF SAN JOSE DEL MONTE
8.61 1.69 19.6 1527 31,092 1.66 0.46 0.49 0.18
SAN MIGUEL 16.91 2.11 12.5 1378 23,103 3.75 0.64 1.24 0.26SAN RAFAEL 13.29 2.36 17.8 1461 10,762 2.76 0.64 0.87 0.25SANTA MARIA 11.13 2.40 21.6 1488 20,700 2.19 0.62 0.66 0.23DOÑA REMEDIOS TRINIDAD
51.58 6.36 12.3 365 8,564 15.36 3.17 6.16 1.72
Nueva Ecija ALIAGA 22.58 2.64 11.7 1242 12,972 5.28 0.88 1.80 0.39BONGABON 24.87 2.94 11.8 1182 17,429 6.04 1.01 2.13 0.46CABANATUAN CITY 10.01 1.08 10.8 1508 24,292 2.09 0.32 0.67 0.13CABIAO 17.94 3.18 17.7 1354 11,397 3.86 0.93 1.25 0.38CARRANGLAN 33.81 4.08 12.1 940 10,590 8.83 1.64 3.25 0.81CUYAPO 27.23 2.40 8.8 1129 14,873 6.86 0.87 2.47 0.41GABALDON (BITULOK & SABANI)
34.05 4.48 13.2 930 9,414 9.03 1.74 3.38 0.85
CITY OF GAPAN 13.44 2.37 17.6 1457 12,841 2.80 0.65 0.89 0.26GENERAL MAMERTO NATIVIDAD
24.11 3.68 15.3 1201 7,587 5.85 1.23 2.06 0.54
GENERAL TINIO (PAPAYA)
12.48 3.39 27.2 1470 4,612 2.60 0.97 0.81 0.39
GUIMBA 28.27 2.45 8.7 1102 26,414 7.13 0.84 2.57 0.38JAEN 20.36 2.33 11.4 1291 12,328 4.63 0.73 1.56 0.32LAUR 33.11 3.83 11.6 958 9,660 8.86 1.51 3.32 0.73LICAB 27.61 4.31 15.6 1118 6,292 6.82 1.62 2.42 0.78LLANERA 20.95 2.78 13.3 1272 6,510 4.85 0.96 1.65 0.43LUPAO 25.22 2.82 11.2 1175 8,998 6.24 1.01 2.23 0.47SCIENCE CITY OF MUÑOZ
17.91 2.06 11.5 1355 12,358 4.12 0.68 1.40 0.30
NAMPICUAN 31.22 3.89 12.5 1014 3,609 8.26 1.46 3.09 0.71PALAYAN CITY (Capital)
23.22 2.77 11.9 1222 6,841 5.73 0.95 2.04 0.45
PANTABANGAN 28.78 3.68 12.8 1091 6,757 7.34 1.35 2.67 0.67PEÑARANDA 23.76 5.78 24.3 1209 6,070 5.67 1.90 1.97 0.84QUEZON 32.08 3.80 11.8 993 10,343 8.36 1.42 3.09 0.69RIZAL 19.78 2.69 13.6 1308 9,758 4.56 0.84 1.55 0.35SAN ANTONIO 23.73 4.11 17.3 1210 15,405 5.59 1.34 1.92 0.59SAN ISIDRO 12.34 3.54 28.7 1473 5,330 2.53 0.95 0.79 0.36SAN JOSE CITY 14.93 2.20 14.7 1425 17,058 3.35 0.68 1.11 0.29 SAN LEONARDO 16.69 3.07 18.4 1385 8,577 3.56 0.93 1.15 0.39SANTA ROSA 12.86 1.90 14.8 1466 7,047 2.69 0.55 0.86 0.23SANTO DOMINGO 20.76 2.86 13.8 1282 9,406 4.83 0.97 1.65 0.43TALAVERA 19.34 2.37 12.3 1323 19,032 4.42 0.69 1.49 0.28TALUGTUG 38.31 3.28 8.6 780 7,648 10.77 1.38 4.17 0.71ZARAGOZA 24.30 3.35 13.8 1198 9,355 5.81 1.13 2.02 0.50
Pampanga ANGELES CITY 6.44 1.56 24.2 1562 19,274 1.18 0.39 0.34 0.15APALIT 15.14 3.51 23.2 1421 13,720 3.08 0.93 0.95 0.36ARAYAT 16.23 2.34 14.4 1392 17,934 3.52 0.70 1.14 0.29
2003 City and Municipal Level Poverty Estimates Page 89 NSCB/WB Intercensal Updating of Small Area Poverty Estimates
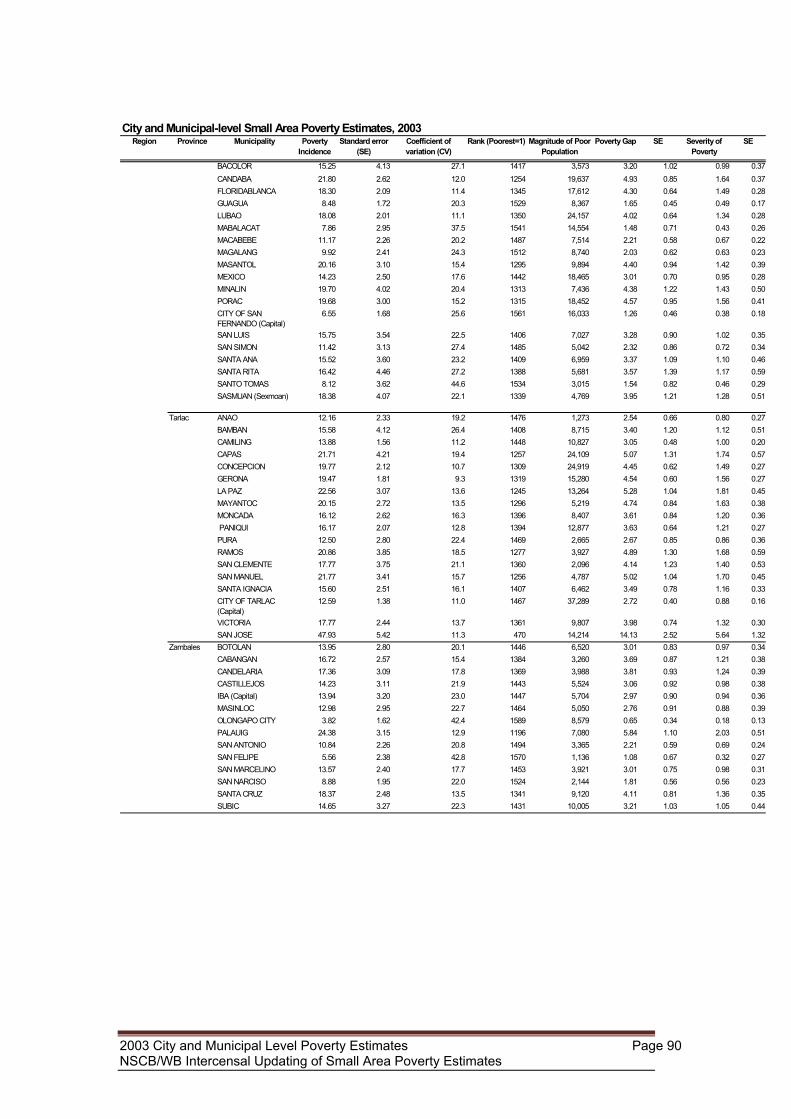
City and Municipal-level Small Area Poverty Estimates, 2003Region Province Municipality Poverty
IncidenceStandard error
(SE)Coefficient of variation (CV)
Rank (Poorest=1) Magnitude of Poor Population
Poverty Gap SE Severity of Poverty
SE
BACOLOR 15.25 4.13 27.1 1417 3,573 3.20 1.02 0.99 0.37CANDABA 21.80 2.62 12.0 1254 19,637 4.93 0.85 1.64 0.37FLORIDABLANCA 18.30 2.09 11.4 1345 17,612 4.30 0.64 1.49 0.28GUAGUA 8.48 1.72 20.3 1529 8,367 1.65 0.45 0.49 0.17LUBAO 18.08 2.01 11.1 1350 24,157 4.02 0.64 1.34 0.28MABALACAT 7.86 2.95 37.5 1541 14,554 1.48 0.71 0.43 0.26MACABEBE 11.17 2.26 20.2 1487 7,514 2.21 0.58 0.67 0.22MAGALANG 9.92 2.41 24.3 1512 8,740 2.03 0.62 0.63 0.23MASANTOL 20.16 3.10 15.4 1295 9,894 4.40 0.94 1.42 0.39MEXICO 14.23 2.50 17.6 1442 18,465 3.01 0.70 0.95 0.28MINALIN 19.70 4.02 20.4 1313 7,436 4.38 1.22 1.43 0.50PORAC 19.68 3.00 15.2 1315 18,452 4.57 0.95 1.56 0.41CITY OF SAN FERNANDO (Capital)
6.55 1.68 25.6 1561 16,033 1.26 0.46 0.38 0.18
SAN LUIS 15.75 3.54 22.5 1406 7,027 3.28 0.90 1.02 0.35SAN SIMON 11.42 3.13 27.4 1485 5,042 2.32 0.86 0.72 0.34SANTA ANA 15.52 3.60 23.2 1409 6,959 3.37 1.09 1.10 0.46SANTA RITA 16.42 4.46 27.2 1388 5,681 3.57 1.39 1.17 0.59SANTO TOMAS 8.12 3.62 44.6 1534 3,015 1.54 0.82 0.46 0.29SASMUAN (Sexmoan) 18.38 4.07 22.1 1339 4,769 3.95 1.21 1.28 0.51
Tarlac ANAO 12.16 2.33 19.2 1476 1,273 2.54 0.66 0.80 0.27BAMBAN 15.58 4.12 26.4 1408 8,715 3.40 1.20 1.12 0.51CAMILING 13.88 1.56 11.2 1448 10,827 3.05 0.48 1.00 0.20CAPAS 21.71 4.21 19.4 1257 24,109 5.07 1.31 1.74 0.57CONCEPCION 19.77 2.12 10.7 1309 24,919 4.45 0.62 1.49 0.27GERONA 19.47 1.81 9.3 1319 15,280 4.54 0.60 1.56 0.27LA PAZ 22.56 3.07 13.6 1245 13,264 5.28 1.04 1.81 0.45MAYANTOC 20.15 2.72 13.5 1296 5,219 4.74 0.84 1.63 0.38MONCADA 16.12 2.62 16.3 1396 8,407 3.61 0.84 1.20 0.36 PANIQUI 16.17 2.07 12.8 1394 12,877 3.63 0.64 1.21 0.27PURA 12.50 2.80 22.4 1469 2,665 2.67 0.85 0.86 0.36RAMOS 20.86 3.85 18.5 1277 3,927 4.89 1.30 1.68 0.59SAN CLEMENTE 17.77 3.75 21.1 1360 2,096 4.14 1.23 1.40 0.53SAN MANUEL 21.77 3.41 15.7 1256 4,787 5.02 1.04 1.70 0.45SANTA IGNACIA 15.60 2.51 16.1 1407 6,462 3.49 0.78 1.16 0.33CITY OF TARLAC (Capital)
12.59 1.38 11.0 1467 37,289 2.72 0.40 0.88 0.16
VICTORIA 17.77 2.44 13.7 1361 9,807 3.98 0.74 1.32 0.30SAN JOSE 47.93 5.42 11.3 470 14,214 14.13 2.52 5.64 1.32
Zambales BOTOLAN 13.95 2.80 20.1 1446 6,520 3.01 0.83 0.97 0.34CABANGAN 16.72 2.57 15.4 1384 3,260 3.69 0.87 1.21 0.38CANDELARIA 17.36 3.09 17.8 1369 3,988 3.81 0.93 1.24 0.39CASTILLEJOS 14.23 3.11 21.9 1443 5,524 3.06 0.92 0.98 0.38IBA (Capital) 13.94 3.20 23.0 1447 5,704 2.97 0.90 0.94 0.36MASINLOC 12.98 2.95 22.7 1464 5,050 2.76 0.91 0.88 0.39OLONGAPO CITY 3.82 1.62 42.4 1589 8,579 0.65 0.34 0.18 0.13PALAUIG 24.38 3.15 12.9 1196 7,080 5.84 1.10 2.03 0.51SAN ANTONIO 10.84 2.26 20.8 1494 3,365 2.21 0.59 0.69 0.24SAN FELIPE 5.56 2.38 42.8 1570 1,136 1.08 0.67 0.32 0.27SAN MARCELINO 13.57 2.40 17.7 1453 3,921 3.01 0.75 0.98 0.31SAN NARCISO 8.88 1.95 22.0 1524 2,144 1.81 0.56 0.56 0.23SANTA CRUZ 18.37 2.48 13.5 1341 9,120 4.11 0.81 1.36 0.35SUBIC 14.65 3.27 22.3 1431 10,005 3.21 1.03 1.05 0.44
2003 City and Municipal Level Poverty Estimates Page 90 NSCB/WB Intercensal Updating of Small Area Poverty Estimates
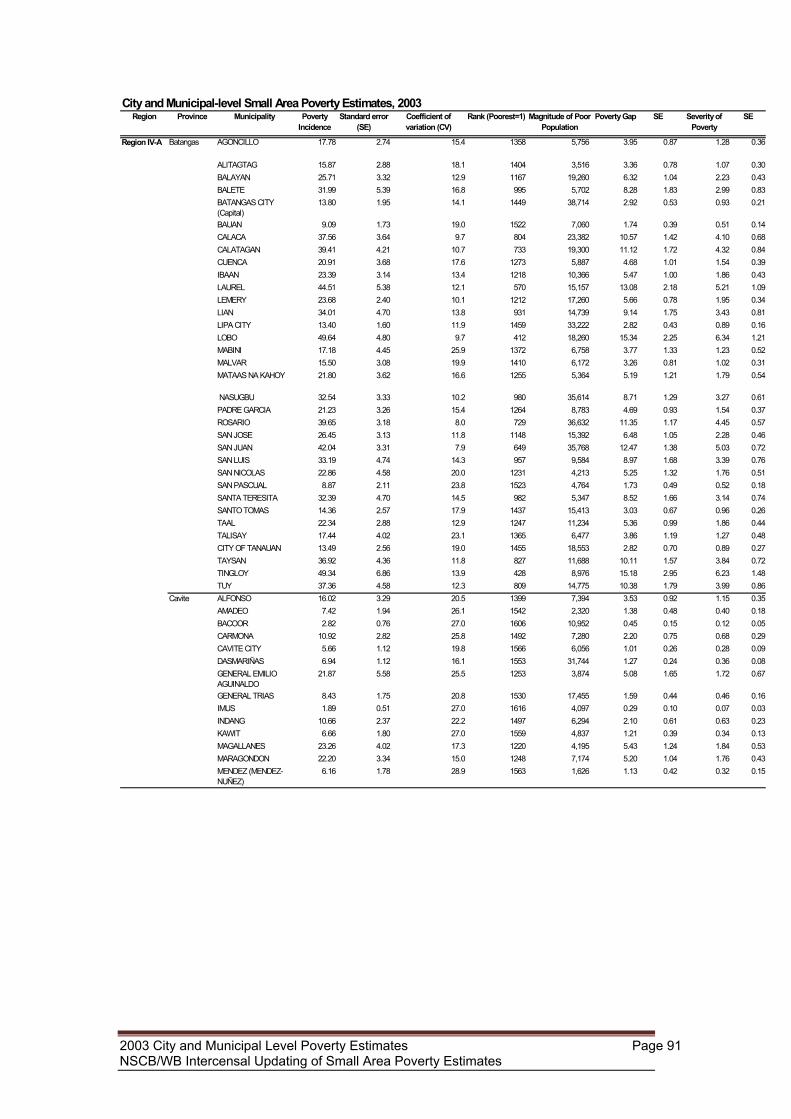
City and Municipal-level Small Area Poverty Estimates, 2003Region Province Municipality Poverty
IncidenceStandard error
(SE)Coefficient of variation (CV)
Rank (Poorest=1) Magnitude of Poor Population
Poverty Gap SE Severity of Poverty
SE
Region IV-A Batangas AGONCILLO 17.78 2.74 15.4 1358 5,756 3.95 0.87 1.28 0.36
ALITAGTAG 15.87 2.88 18.1 1404 3,516 3.36 0.78 1.07 0.30BALAYAN 25.71 3.32 12.9 1167 19,260 6.32 1.04 2.23 0.43BALETE 31.99 5.39 16.8 995 5,702 8.28 1.83 2.99 0.83BATANGAS CITY (Capital)
13.80 1.95 14.1 1449 38,714 2.92 0.53 0.93 0.21
BAUAN 9.09 1.73 19.0 1522 7,060 1.74 0.39 0.51 0.14CALACA 37.56 3.64 9.7 804 23,382 10.57 1.42 4.10 0.68CALATAGAN 39.41 4.21 10.7 733 19,300 11.12 1.72 4.32 0.84CUENCA 20.91 3.68 17.6 1273 5,887 4.68 1.01 1.54 0.39IBAAN 23.39 3.14 13.4 1218 10,366 5.47 1.00 1.86 0.43LAUREL 44.51 5.38 12.1 570 15,157 13.08 2.18 5.21 1.09LEMERY 23.68 2.40 10.1 1212 17,260 5.66 0.78 1.95 0.34LIAN 34.01 4.70 13.8 931 14,739 9.14 1.75 3.43 0.81LIPA CITY 13.40 1.60 11.9 1459 33,222 2.82 0.43 0.89 0.16LOBO 49.64 4.80 9.7 412 18,260 15.34 2.25 6.34 1.21MABINI 17.18 4.45 25.9 1372 6,758 3.77 1.33 1.23 0.52MALVAR 15.50 3.08 19.9 1410 6,172 3.26 0.81 1.02 0.31MATAAS NA KAHOY 21.80 3.62 16.6 1255 5,364 5.19 1.21 1.79 0.54
NASUGBU 32.54 3.33 10.2 980 35,614 8.71 1.29 3.27 0.61PADRE GARCIA 21.23 3.26 15.4 1264 8,783 4.69 0.93 1.54 0.37ROSARIO 39.65 3.18 8.0 729 36,632 11.35 1.17 4.45 0.57SAN JOSE 26.45 3.13 11.8 1148 15,392 6.48 1.05 2.28 0.46SAN JUAN 42.04 3.31 7.9 649 35,768 12.47 1.38 5.03 0.72SAN LUIS 33.19 4.74 14.3 957 9,584 8.97 1.68 3.39 0.76SAN NICOLAS 22.86 4.58 20.0 1231 4,213 5.25 1.32 1.76 0.51SAN PASCUAL 8.87 2.11 23.8 1523 4,764 1.73 0.49 0.52 0.18SANTA TERESITA 32.39 4.70 14.5 982 5,347 8.52 1.66 3.14 0.74SANTO TOMAS 14.36 2.57 17.9 1437 15,413 3.03 0.67 0.96 0.26TAAL 22.34 2.88 12.9 1247 11,234 5.36 0.99 1.86 0.44TALISAY 17.44 4.02 23.1 1365 6,477 3.86 1.19 1.27 0.48CITY OF TANAUAN 13.49 2.56 19.0 1455 18,553 2.82 0.70 0.89 0.27TAYSAN 36.92 4.36 11.8 827 11,688 10.11 1.57 3.84 0.72TINGLOY 49.34 6.86 13.9 428 8,976 15.18 2.95 6.23 1.48TUY 37.36 4.58 12.3 809 14,775 10.38 1.79 3.99 0.86
Cavite ALFONSO 16.02 3.29 20.5 1399 7,394 3.53 0.92 1.15 0.35AMADEO 7.42 1.94 26.1 1542 2,320 1.38 0.48 0.40 0.18BACOOR 2.82 0.76 27.0 1606 10,952 0.45 0.15 0.12 0.05CARMONA 10.92 2.82 25.8 1492 7,280 2.20 0.75 0.68 0.29CAVITE CITY 5.66 1.12 19.8 1566 6,056 1.01 0.26 0.28 0.09DASMARIÑAS 6.94 1.12 16.1 1553 31,744 1.27 0.24 0.36 0.08GENERAL EMILIO AGUINALDO
21.87 5.58 25.5 1253 3,874 5.08 1.65 1.72 0.67
GENERAL TRIAS 8.43 1.75 20.8 1530 17,455 1.59 0.44 0.46 0.16IMUS 1.89 0.51 27.0 1616 4,097 0.29 0.10 0.07 0.03INDANG 10.66 2.37 22.2 1497 6,294 2.10 0.61 0.63 0.23KAWIT 6.66 1.80 27.0 1559 4,837 1.21 0.39 0.34 0.13MAGALLANES 23.26 4.02 17.3 1220 4,195 5.43 1.24 1.84 0.53MARAGONDON 22.20 3.34 15.0 1248 7,174 5.20 1.04 1.76 0.43MENDEZ (MENDEZ-NUÑEZ)
6.16 1.78 28.9 1563 1,626 1.13 0.42 0.32 0.15
2003 City and Municipal Level Poverty Estimates Page 91 NSCB/WB Intercensal Updating of Small Area Poverty Estimates
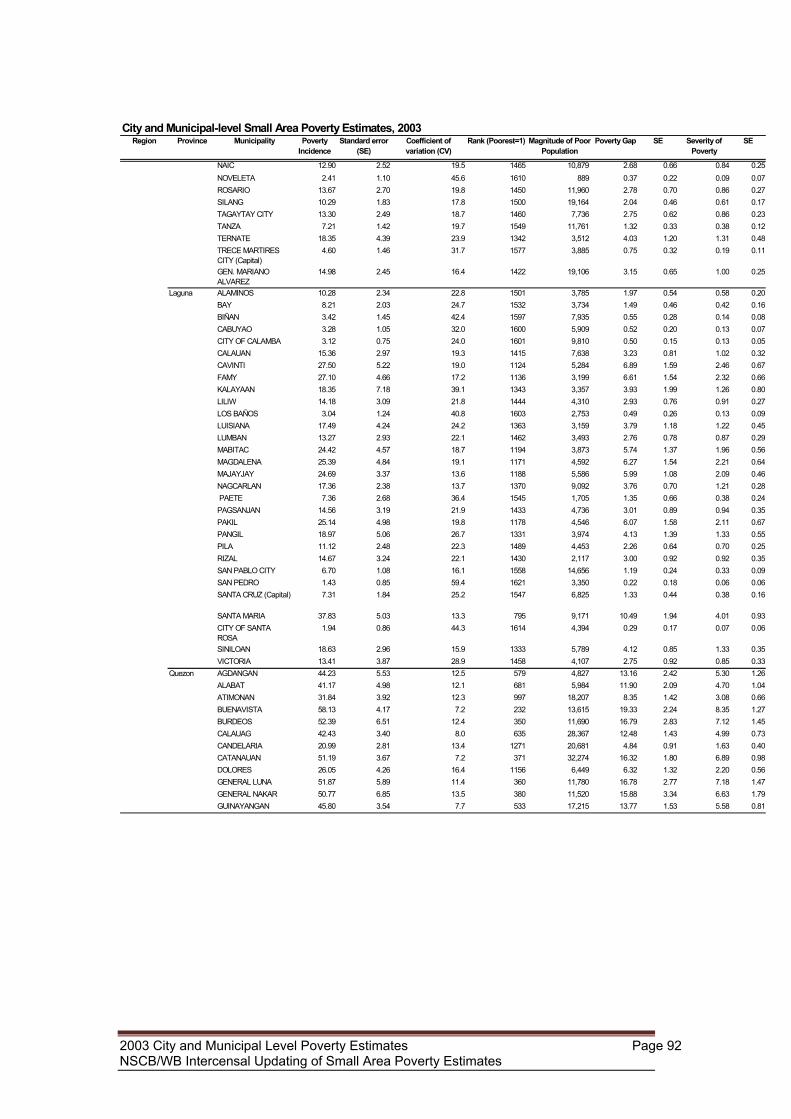
City and Municipal-level Small Area Poverty Estimates, 2003Region Province Municipality Poverty
IncidenceStandard error
(SE)Coefficient of variation (CV)
Rank (Poorest=1) Magnitude of Poor Population
Poverty Gap SE Severity of Poverty
SE
NAIC 12.90 2.52 19.5 1465 10,879 2.68 0.66 0.84 0.25NOVELETA 2.41 1.10 45.6 1610 889 0.37 0.22 0.09 0.07ROSARIO 13.67 2.70 19.8 1450 11,960 2.78 0.70 0.86 0.27SILANG 10.29 1.83 17.8 1500 19,164 2.04 0.46 0.61 0.17TAGAYTAY CITY 13.30 2.49 18.7 1460 7,736 2.75 0.62 0.86 0.23TANZA 7.21 1.42 19.7 1549 11,761 1.32 0.33 0.38 0.12TERNATE 18.35 4.39 23.9 1342 3,512 4.03 1.20 1.31 0.48TRECE MARTIRES CITY (Capital)
4.60 1.46 31.7 1577 3,885 0.75 0.32 0.19 0.11
GEN. MARIANO ALVAREZ
14.98 2.45 16.4 1422 19,106 3.15 0.65 1.00 0.25
Laguna ALAMINOS 10.28 2.34 22.8 1501 3,785 1.97 0.54 0.58 0.20BAY 8.21 2.03 24.7 1532 3,734 1.49 0.46 0.42 0.16BIÑAN 3.42 1.45 42.4 1597 7,935 0.55 0.28 0.14 0.08CABUYAO 3.28 1.05 32.0 1600 5,909 0.52 0.20 0.13 0.07CITY OF CALAMBA 3.12 0.75 24.0 1601 9,810 0.50 0.15 0.13 0.05CALAUAN 15.36 2.97 19.3 1415 7,638 3.23 0.81 1.02 0.32CAVINTI 27.50 5.22 19.0 1124 5,284 6.89 1.59 2.46 0.67FAMY 27.10 4.66 17.2 1136 3,199 6.61 1.54 2.32 0.66KALAYAAN 18.35 7.18 39.1 1343 3,357 3.93 1.99 1.26 0.80LILIW 14.18 3.09 21.8 1444 4,310 2.93 0.76 0.91 0.27LOS BAÑOS 3.04 1.24 40.8 1603 2,753 0.49 0.26 0.13 0.09LUISIANA 17.49 4.24 24.2 1363 3,159 3.79 1.18 1.22 0.45LUMBAN 13.27 2.93 22.1 1462 3,493 2.76 0.78 0.87 0.29MABITAC 24.42 4.57 18.7 1194 3,873 5.74 1.37 1.96 0.56MAGDALENA 25.39 4.84 19.1 1171 4,592 6.27 1.54 2.21 0.64MAJAYJAY 24.69 3.37 13.6 1188 5,586 5.99 1.08 2.09 0.46NAGCARLAN 17.36 2.38 13.7 1370 9,092 3.76 0.70 1.21 0.28 PAETE 7.36 2.68 36.4 1545 1,705 1.35 0.66 0.38 0.24PAGSANJAN 14.56 3.19 21.9 1433 4,736 3.01 0.89 0.94 0.35PAKIL 25.14 4.98 19.8 1178 4,546 6.07 1.58 2.11 0.67PANGIL 18.97 5.06 26.7 1331 3,974 4.13 1.39 1.33 0.55PILA 11.12 2.48 22.3 1489 4,453 2.26 0.64 0.70 0.25RIZAL 14.67 3.24 22.1 1430 2,117 3.00 0.92 0.92 0.35SAN PABLO CITY 6.70 1.08 16.1 1558 14,656 1.19 0.24 0.33 0.09SAN PEDRO 1.43 0.85 59.4 1621 3,350 0.22 0.18 0.06 0.06SANTA CRUZ (Capital) 7.31 1.84 25.2 1547 6,825 1.33 0.44 0.38 0.16
SANTA MARIA 37.83 5.03 13.3 795 9,171 10.49 1.94 4.01 0.93CITY OF SANTA ROSA
1.94 0.86 44.3 1614 4,394 0.29 0.17 0.07 0.06
SINILOAN 18.63 2.96 15.9 1333 5,789 4.12 0.85 1.33 0.35VICTORIA 13.41 3.87 28.9 1458 4,107 2.75 0.92 0.85 0.33
Quezon AGDANGAN 44.23 5.53 12.5 579 4,827 13.16 2.42 5.30 1.26ALABAT 41.17 4.98 12.1 681 5,984 11.90 2.09 4.70 1.04ATIMONAN 31.84 3.92 12.3 997 18,207 8.35 1.42 3.08 0.66BUENAVISTA 58.13 4.17 7.2 232 13,615 19.33 2.24 8.35 1.27BURDEOS 52.39 6.51 12.4 350 11,690 16.79 2.83 7.12 1.45CALAUAG 42.43 3.40 8.0 635 28,367 12.48 1.43 4.99 0.73CANDELARIA 20.99 2.81 13.4 1271 20,681 4.84 0.91 1.63 0.40CATANAUAN 51.19 3.67 7.2 371 32,274 16.32 1.80 6.89 0.98DOLORES 26.05 4.26 16.4 1156 6,449 6.32 1.32 2.20 0.56GENERAL LUNA 51.87 5.89 11.4 360 11,780 16.78 2.77 7.18 1.47GENERAL NAKAR 50.77 6.85 13.5 380 11,520 15.88 3.34 6.63 1.79GUINAYANGAN 45.80 3.54 7.7 533 17,215 13.77 1.53 5.58 0.81
2003 City and Municipal Level Poverty Estimates Page 92 NSCB/WB Intercensal Updating of Small Area Poverty Estimates
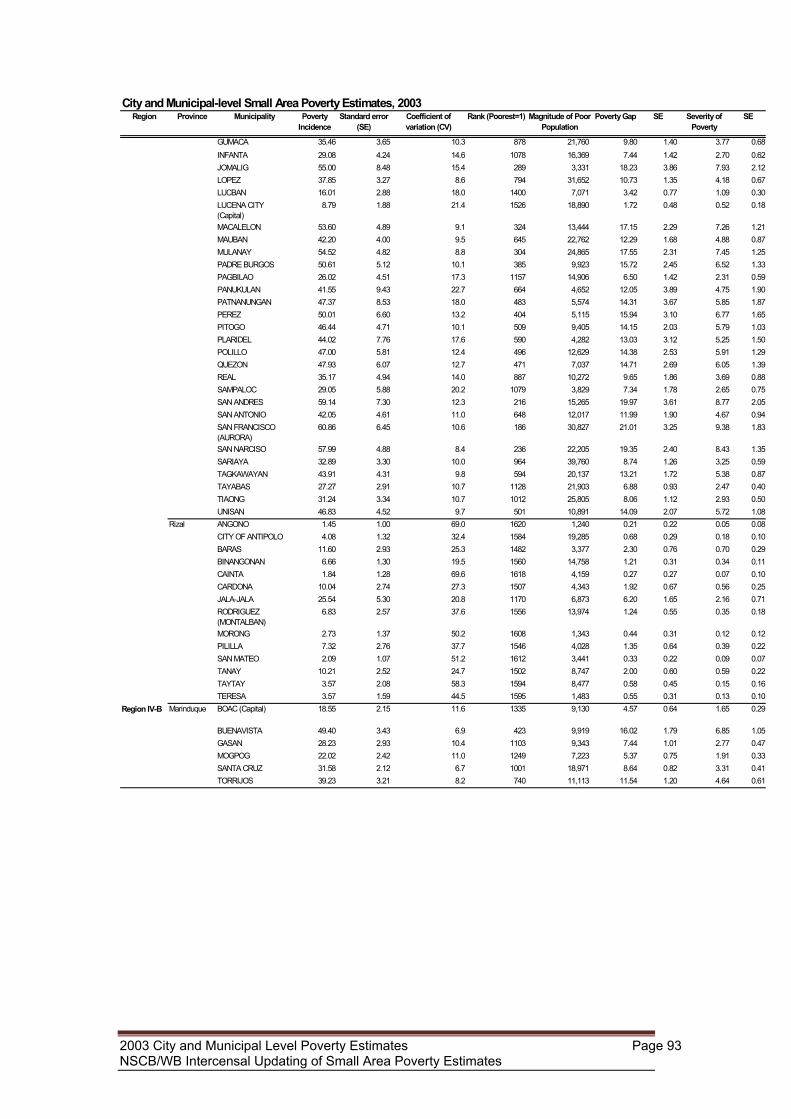
City and Municipal-level Small Area Poverty Estimates, 2003Region Province Municipality Poverty
IncidenceStandard error
(SE)Coefficient of variation (CV)
Rank (Poorest=1) Magnitude of Poor Population
Poverty Gap SE Severity of Poverty
SE
GUMACA 35.46 3.65 10.3 878 21,760 9.80 1.40 3.77 0.68INFANTA 29.08 4.24 14.6 1078 16,369 7.44 1.42 2.70 0.62JOMALIG 55.00 8.48 15.4 289 3,331 18.23 3.86 7.93 2.12LOPEZ 37.85 3.27 8.6 794 31,652 10.73 1.35 4.18 0.67LUCBAN 16.01 2.88 18.0 1400 7,071 3.42 0.77 1.09 0.30LUCENA CITY (Capital)
8.79 1.88 21.4 1526 18,890 1.72 0.48 0.52 0.18
MACALELON 53.60 4.89 9.1 324 13,444 17.15 2.29 7.26 1.21MAUBAN 42.20 4.00 9.5 645 22,762 12.29 1.68 4.88 0.87MULANAY 54.52 4.82 8.8 304 24,865 17.55 2.31 7.45 1.25PADRE BURGOS 50.61 5.12 10.1 385 9,923 15.72 2.45 6.52 1.33PAGBILAO 26.02 4.51 17.3 1157 14,906 6.50 1.42 2.31 0.59PANUKULAN 41.55 9.43 22.7 664 4,652 12.05 3.89 4.75 1.90PATNANUNGAN 47.37 8.53 18.0 483 5,574 14.31 3.67 5.85 1.87PEREZ 50.01 6.60 13.2 404 5,115 15.94 3.10 6.77 1.65PITOGO 46.44 4.71 10.1 509 9,405 14.15 2.03 5.79 1.03PLARIDEL 44.02 7.76 17.6 590 4,282 13.03 3.12 5.25 1.50POLILLO 47.00 5.81 12.4 496 12,629 14.38 2.53 5.91 1.29QUEZON 47.93 6.07 12.7 471 7,037 14.71 2.69 6.05 1.39REAL 35.17 4.94 14.0 887 10,272 9.65 1.86 3.69 0.88SAMPALOC 29.05 5.88 20.2 1079 3,829 7.34 1.78 2.65 0.75SAN ANDRES 59.14 7.30 12.3 216 15,265 19.97 3.61 8.77 2.05SAN ANTONIO 42.05 4.61 11.0 648 12,017 11.99 1.90 4.67 0.94SAN FRANCISCO (AURORA)
60.86 6.45 10.6 186 30,827 21.01 3.25 9.38 1.83
SAN NARCISO 57.99 4.88 8.4 236 22,205 19.35 2.40 8.43 1.35SARIAYA 32.89 3.30 10.0 964 39,760 8.74 1.26 3.25 0.59TAGKAWAYAN 43.91 4.31 9.8 594 20,137 13.21 1.72 5.38 0.87TAYABAS 27.27 2.91 10.7 1128 21,903 6.88 0.93 2.47 0.40TIAONG 31.24 3.34 10.7 1012 25,805 8.06 1.12 2.93 0.50UNISAN 46.83 4.52 9.7 501 10,891 14.09 2.07 5.72 1.08
Rizal ANGONO 1.45 1.00 69.0 1620 1,240 0.21 0.22 0.05 0.08CITY OF ANTIPOLO 4.08 1.32 32.4 1584 19,285 0.68 0.29 0.18 0.10BARAS 11.60 2.93 25.3 1482 3,377 2.30 0.76 0.70 0.29BINANGONAN 6.66 1.30 19.5 1560 14,758 1.21 0.31 0.34 0.11CAINTA 1.84 1.28 69.6 1618 4,159 0.27 0.27 0.07 0.10CARDONA 10.04 2.74 27.3 1507 4,343 1.92 0.67 0.56 0.25JALA-JALA 25.54 5.30 20.8 1170 6,873 6.20 1.65 2.16 0.71RODRIGUEZ (MONTALBAN)
6.83 2.57 37.6 1556 13,974 1.24 0.55 0.35 0.18
MORONG 2.73 1.37 50.2 1608 1,343 0.44 0.31 0.12 0.12PILILLA 7.32 2.76 37.7 1546 4,028 1.35 0.64 0.39 0.22SAN MATEO 2.09 1.07 51.2 1612 3,441 0.33 0.22 0.09 0.07TANAY 10.21 2.52 24.7 1502 8,747 2.00 0.60 0.59 0.22TAYTAY 3.57 2.08 58.3 1594 8,477 0.58 0.45 0.15 0.16TERESA 3.57 1.59 44.5 1595 1,483 0.55 0.31 0.13 0.10
Region IV-B Marinduque BOAC (Capital) 18.55 2.15 11.6 1335 9,130 4.57 0.64 1.65 0.29
BUENAVISTA 49.40 3.43 6.9 423 9,919 16.02 1.79 6.85 1.05GASAN 28.23 2.93 10.4 1103 9,343 7.44 1.01 2.77 0.47MOGPOG 22.02 2.42 11.0 1249 7,223 5.37 0.75 1.91 0.33SANTA CRUZ 31.58 2.12 6.7 1001 18,971 8.64 0.82 3.31 0.41TORRIJOS 39.23 3.21 8.2 740 11,113 11.54 1.20 4.64 0.61
2003 City and Municipal Level Poverty Estimates Page 93 NSCB/WB Intercensal Updating of Small Area Poverty Estimates

City and Municipal-level Small Area Poverty Estimates, 2003Region Province Municipality Poverty
IncidenceStandard error
(SE)Coefficient of variation (CV)
Rank (Poorest=1) Magnitude of Poor Population
Poverty Gap SE Severity of Poverty
SE
Occidental Mindoro
ABRA DE ILOG 53.78 4.78 8.9 319 13,316 18.07 2.78 7.88 1.70
CALINTAAN 52.53 4.20 8.0 348 13,144 17.17 2.00 7.32 1.13LOOC 44.94 4.88 10.9 556 4,912 14.01 2.29 5.84 1.23LUBANG 34.21 3.90 11.4 924 9,364 9.73 1.49 3.85 0.77MAGSAYSAY 55.59 4.51 8.1 278 15,869 19.72 2.22 9.00 1.27MAMBURAO (Capital) 27.50 3.13 11.4 1125 8,896 7.51 1.23 2.87 0.64
PALUAN 58.40 5.53 9.5 230 7,891 19.90 2.99 8.77 1.74RIZAL 54.97 3.56 6.5 290 16,507 18.70 1.88 8.27 1.09SABLAYAN 49.93 3.39 6.8 406 32,844 16.53 1.74 7.14 0.99SAN JOSE 33.67 2.14 6.4 943 37,712 10.28 0.90 4.28 0.52SANTA CRUZ 53.99 4.22 7.8 314 14,481 17.95 2.21 7.78 1.28
Oriental Mindoro
BACO 51.72 2.61 5.0 362 16,593 17.39 1.35 7.70 0.78
BANSUD 52.35 3.08 5.9 351 17,803 17.86 1.54 7.94 0.94BONGABONG 49.36 2.57 5.2 424 28,543 16.35 1.33 7.09 0.78BULALACAO (SAN PEDRO)
74.70 3.30 4.4 37 20,729 31.23 2.61 15.75 1.87
CITY OF CALAPAN (Capital)
17.84 2.74 15.4 1357 19,278 4.45 0.83 1.63 0.35
GLORIA 47.18 2.51 5.3 490 18,227 15.09 1.19 6.43 0.66MANSALAY 68.38 3.31 4.8 94 28,632 26.64 2.15 12.85 1.43NAUJAN 39.09 1.70 4.3 746 33,606 11.68 0.78 4.76 0.42PINAMALAYAN 36.53 2.39 6.5 843 26,228 10.85 0.91 4.42 0.46POLA 55.63 2.80 5.0 277 17,334 19.42 1.52 8.81 0.92PUERTO GALERA 25.64 3.75 14.6 1169 6,493 7.01 1.34 2.72 0.66ROXAS 40.35 2.62 6.5 703 18,068 12.69 1.06 5.34 0.56SAN TEODORO 49.31 4.41 8.9 430 7,029 15.66 2.04 6.60 1.14SOCORRO 41.75 2.41 5.8 656 14,680 12.83 1.02 5.34 0.56VICTORIA 32.20 2.34 7.3 985 13,269 9.17 0.91 3.63 0.47
Palawan ABORLAN 53.77 3.18 5.9 321 13,807 17.80 1.56 7.64 0.90AGUTAYA 66.68 5.61 8.4 103 6,487 24.80 3.77 11.57 2.38ARACELI 59.50 4.69 7.9 207 7,117 21.00 2.25 9.44 1.30BALABAC 65.08 6.07 9.3 123 18,161 22.95 3.11 10.28 1.77BATARAZA 53.17 3.95 7.4 334 24,575 17.00 1.89 7.10 1.02BROOKE'S POINT 51.84 3.65 7.0 361 29,595 16.73 1.84 7.04 1.04BUSUANGA 66.67 4.32 6.5 104 11,288 23.84 2.55 10.75 1.55CAGAYANCILLO 53.46 4.87 9.1 326 3,368 17.45 2.32 7.45 1.28CORON 60.08 3.92 6.5 194 23,150 21.50 2.03 9.77 1.22CUYO 45.74 3.13 6.8 534 9,088 14.63 1.44 6.21 0.81DUMARAN 70.50 3.52 5.0 70 11,752 26.42 2.20 12.30 1.42EL NIDO (BACUIT) 62.19 3.36 5.4 169 16,808 22.12 2.06 9.98 1.30LINAPACAN 76.37 5.23 6.8 31 8,317 30.22 3.70 14.57 2.42MAGSAYSAY 53.97 4.54 8.4 315 6,092 18.38 2.39 8.19 1.46 NARRA 48.46 3.15 6.5 451 27,856 15.47 1.53 6.51 0.89PUERTO PRINCESA CITY (Capital)
23.51 2.49 10.6 1216 43,681 6.10 0.91 2.26 0.43
QUEZON 61.23 3.75 6.1 180 30,602 21.38 1.94 9.48 1.19ROXAS 59.64 2.90 4.9 204 27,540 20.44 1.51 9.03 0.90SAN VICENTE 64.18 4.34 6.8 134 13,655 23.12 2.67 10.53 1.65TAYTAY 64.93 3.57 5.5 126 35,276 23.67 1.97 10.88 1.20CULION 55.68 5.14 9.2 274 8,654 20.17 2.60 9.30 1.56RIZAL (MARCOS) 59.86 5.30 8.9 197 18,758 19.44 2.82 8.17 1.62SOFRONIO ESPAÑOLA
57.74 5.20 9.0 240 14,978 18.67 2.63 7.85 1.50
Romblon ALCANTARA 40.24 4.20 10.4 704 5,976 12.03 1.76 4.87 0.89BANTON 46.59 5.33 11.4 506 3,312 14.39 2.35 5.95 1.21CAJIDIOCAN 38.42 3.58 9.3 775 7,871 11.07 1.59 4.35 0.81CALATRAVA 50.45 4.43 8.8 389 4,662 16.49 2.41 7.09 1.44CONCEPCION 49.26 5.35 10.9 432 2,012 15.71 2.38 6.62 1.25CORCUERA 57.54 4.86 8.4 245 6,180 19.32 2.36 8.35 1.28LOOC 38.70 3.71 9.6 765 7,680 11.38 1.54 4.54 0.79MAGDIWANG 44.15 4.05 9.2 584 5,421 13.40 1.67 5.47 0.91
2003 City and Municipal Level Poverty Estimates Page 94 NSCB/WB Intercensal Updating of Small Area Poverty Estimates
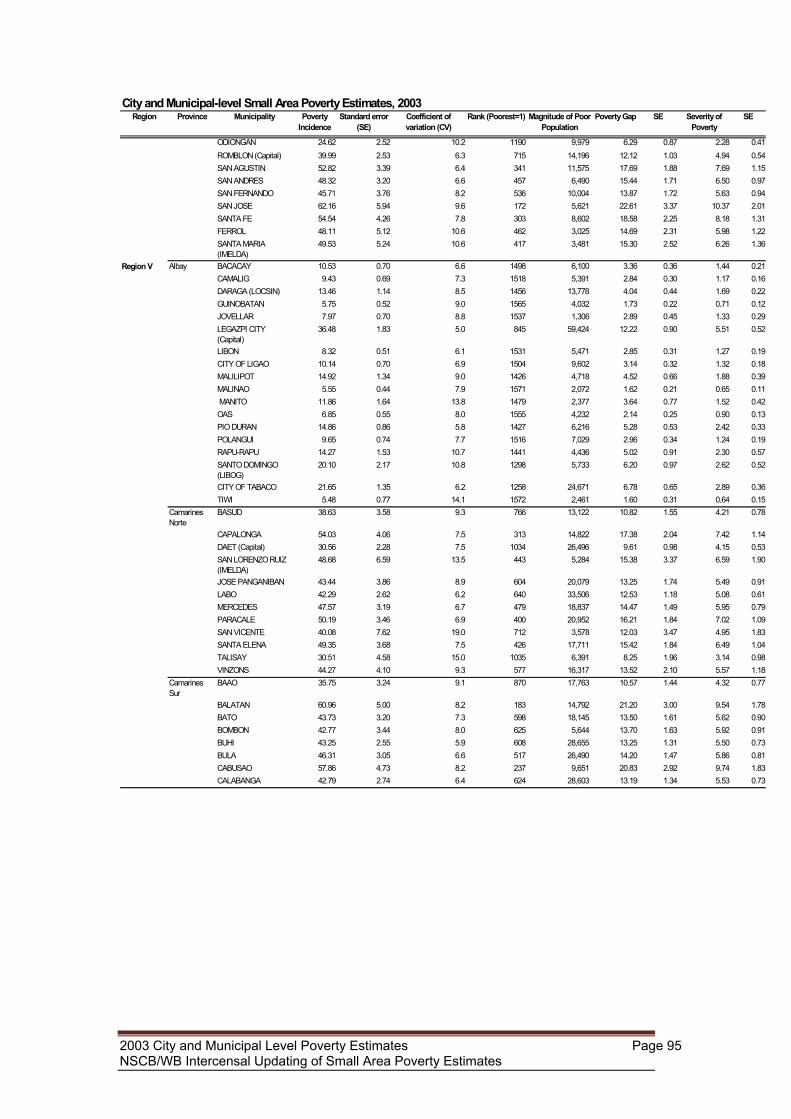
City and Municipal-level Small Area Poverty Estimates, 2003Region Province Municipality Poverty
IncidenceStandard error
(SE)Coefficient of variation (CV)
Rank (Poorest=1) Magnitude of Poor Population
Poverty Gap SE Severity of Poverty
SE
ODIONGAN 24.62 2.52 10.2 1190 9,979 6.29 0.87 2.28 0.41ROMBLON (Capital) 39.99 2.53 6.3 715 14,196 12.12 1.03 4.94 0.54SAN AGUSTIN 52.82 3.39 6.4 341 11,575 17.69 1.88 7.69 1.15SAN ANDRES 48.32 3.20 6.6 457 6,490 15.44 1.71 6.50 0.97SAN FERNANDO 45.71 3.76 8.2 536 10,004 13.87 1.72 5.63 0.94SAN JOSE 62.16 5.94 9.6 172 5,621 22.61 3.37 10.37 2.01SANTA FE 54.54 4.26 7.8 303 8,602 18.58 2.25 8.18 1.31FERROL 48.11 5.12 10.6 462 3,025 14.69 2.31 5.98 1.22SANTA MARIA (IMELDA)
49.53 5.24 10.6 417 3,481 15.30 2.52 6.26 1.36
Region V Albay BACACAY 10.53 0.70 6.6 1498 6,100 3.36 0.36 1.44 0.21CAMALIG 9.43 0.69 7.3 1518 5,391 2.84 0.30 1.17 0.16DARAGA (LOCSIN) 13.46 1.14 8.5 1456 13,778 4.04 0.44 1.69 0.22GUINOBATAN 5.75 0.52 9.0 1565 4,032 1.73 0.22 0.71 0.12JOVELLAR 7.97 0.70 8.8 1537 1,306 2.89 0.45 1.33 0.29LEGAZPI CITY (Capital)
36.48 1.83 5.0 845 59,424 12.22 0.90 5.51 0.52
LIBON 8.32 0.51 6.1 1531 5,471 2.85 0.31 1.27 0.19CITY OF LIGAO 10.14 0.70 6.9 1504 9,602 3.14 0.32 1.32 0.18MALILIPOT 14.92 1.34 9.0 1426 4,718 4.52 0.66 1.88 0.39MALINAO 5.55 0.44 7.9 1571 2,072 1.62 0.21 0.65 0.11 MANITO 11.86 1.64 13.8 1479 2,377 3.64 0.77 1.52 0.42OAS 6.85 0.55 8.0 1555 4,232 2.14 0.25 0.90 0.13PIO DURAN 14.86 0.86 5.8 1427 6,216 5.28 0.53 2.42 0.33POLANGUI 9.65 0.74 7.7 1516 7,029 2.96 0.34 1.24 0.19RAPU-RAPU 14.27 1.53 10.7 1441 4,436 5.02 0.91 2.30 0.57SANTO DOMINGO (LIBOG)
20.10 2.17 10.8 1298 5,733 6.20 0.97 2.62 0.52
CITY OF TABACO 21.65 1.35 6.2 1258 24,671 6.78 0.65 2.89 0.36TIWI 5.48 0.77 14.1 1572 2,461 1.60 0.31 0.64 0.15
Camarines Norte
BASUD 38.63 3.58 9.3 766 13,122 10.82 1.55 4.21 0.78
CAPALONGA 54.03 4.06 7.5 313 14,822 17.38 2.04 7.42 1.14DAET (Capital) 30.56 2.28 7.5 1034 26,496 9.61 0.98 4.15 0.53SAN LORENZO RUIZ (IMELDA)
48.68 6.59 13.5 443 5,284 15.38 3.37 6.59 1.90
JOSE PANGANIBAN 43.44 3.86 8.9 604 20,079 13.25 1.74 5.49 0.91LABO 42.29 2.62 6.2 640 33,506 12.53 1.18 5.08 0.61MERCEDES 47.57 3.19 6.7 479 18,837 14.47 1.49 5.95 0.79PARACALE 50.19 3.46 6.9 400 20,952 16.21 1.84 7.02 1.09SAN VICENTE 40.08 7.62 19.0 712 3,578 12.03 3.47 4.95 1.83SANTA ELENA 49.35 3.68 7.5 426 17,711 15.42 1.84 6.49 1.04TALISAY 30.51 4.58 15.0 1035 6,391 8.25 1.96 3.14 0.98VINZONS 44.27 4.10 9.3 577 16,317 13.52 2.10 5.57 1.18
Camarines Sur
BAAO 35.75 3.24 9.1 870 17,763 10.57 1.44 4.32 0.77
BALATAN 60.96 5.00 8.2 183 14,792 21.20 3.00 9.54 1.78BATO 43.73 3.20 7.3 598 18,145 13.50 1.61 5.62 0.90BOMBON 42.77 3.44 8.0 625 5,644 13.70 1.63 5.92 0.91BUHI 43.25 2.55 5.9 608 28,655 13.25 1.31 5.50 0.73BULA 46.31 3.05 6.6 517 26,490 14.20 1.47 5.86 0.81CABUSAO 57.86 4.73 8.2 237 9,651 20.83 2.92 9.74 1.83CALABANGA 42.79 2.74 6.4 624 28,603 13.19 1.34 5.53 0.73
2003 City and Municipal Level Poverty Estimates Page 95 NSCB/WB Intercensal Updating of Small Area Poverty Estimates
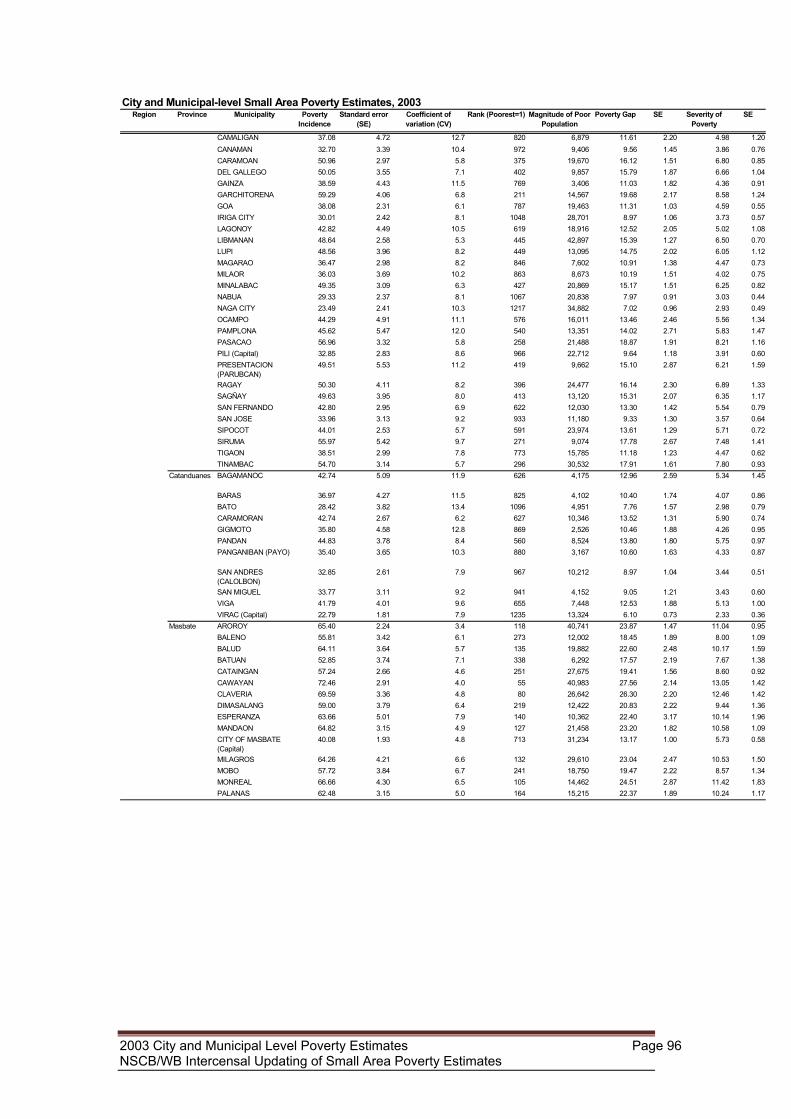
City and Municipal-level Small Area Poverty Estimates, 2003Region Province Municipality Poverty
IncidenceStandard error
(SE)Coefficient of variation (CV)
Rank (Poorest=1) Magnitude of Poor Population
Poverty Gap SE Severity of Poverty
SE
CAMALIGAN 37.08 4.72 12.7 820 6,879 11.61 2.20 4.98 1.20CANAMAN 32.70 3.39 10.4 972 9,406 9.56 1.45 3.86 0.76CARAMOAN 50.96 2.97 5.8 375 19,670 16.12 1.51 6.80 0.85DEL GALLEGO 50.05 3.55 7.1 402 9,857 15.79 1.87 6.66 1.04GAINZA 38.59 4.43 11.5 769 3,406 11.03 1.82 4.36 0.91GARCHITORENA 59.29 4.06 6.8 211 14,567 19.68 2.17 8.58 1.24GOA 38.08 2.31 6.1 787 19,463 11.31 1.03 4.59 0.55IRIGA CITY 30.01 2.42 8.1 1048 28,701 8.97 1.06 3.73 0.57LAGONOY 42.82 4.49 10.5 619 18,916 12.52 2.05 5.02 1.08LIBMANAN 48.64 2.58 5.3 445 42,897 15.39 1.27 6.50 0.70LUPI 48.56 3.96 8.2 449 13,095 14.75 2.02 6.05 1.12MAGARAO 36.47 2.98 8.2 846 7,602 10.91 1.38 4.47 0.73MILAOR 36.03 3.69 10.2 863 8,673 10.19 1.51 4.02 0.75MINALABAC 49.35 3.09 6.3 427 20,869 15.17 1.51 6.25 0.82NABUA 29.33 2.37 8.1 1067 20,838 7.97 0.91 3.03 0.44NAGA CITY 23.49 2.41 10.3 1217 34,882 7.02 0.96 2.93 0.49OCAMPO 44.29 4.91 11.1 576 16,011 13.46 2.46 5.56 1.34PAMPLONA 45.62 5.47 12.0 540 13,351 14.02 2.71 5.83 1.47PASACAO 56.96 3.32 5.8 258 21,488 18.87 1.91 8.21 1.16PILI (Capital) 32.85 2.83 8.6 966 22,712 9.64 1.18 3.91 0.60PRESENTACION (PARUBCAN)
49.51 5.53 11.2 419 9,662 15.10 2.87 6.21 1.59
RAGAY 50.30 4.11 8.2 396 24,477 16.14 2.30 6.89 1.33SAGÑAY 49.63 3.95 8.0 413 13,120 15.31 2.07 6.35 1.17SAN FERNANDO 42.80 2.95 6.9 622 12,030 13.30 1.42 5.54 0.79SAN JOSE 33.96 3.13 9.2 933 11,180 9.33 1.30 3.57 0.64SIPOCOT 44.01 2.53 5.7 591 23,974 13.61 1.29 5.71 0.72SIRUMA 55.97 5.42 9.7 271 9,074 17.78 2.67 7.48 1.41TIGAON 38.51 2.99 7.8 773 15,785 11.18 1.23 4.47 0.62TINAMBAC 54.70 3.14 5.7 296 30,532 17.91 1.61 7.80 0.93
Catanduanes BAGAMANOC 42.74 5.09 11.9 626 4,175 12.96 2.59 5.34 1.45
BARAS 36.97 4.27 11.5 825 4,102 10.40 1.74 4.07 0.86BATO 28.42 3.82 13.4 1096 4,951 7.76 1.57 2.98 0.79CARAMORAN 42.74 2.67 6.2 627 10,346 13.52 1.31 5.90 0.74GIGMOTO 35.80 4.58 12.8 869 2,526 10.46 1.88 4.26 0.95PANDAN 44.83 3.78 8.4 560 8,524 13.80 1.80 5.75 0.97PANGANIBAN (PAYO) 35.40 3.65 10.3 880 3,167 10.60 1.63 4.33 0.87
SAN ANDRES (CALOLBON)
32.85 2.61 7.9 967 10,212 8.97 1.04 3.44 0.51
SAN MIGUEL 33.77 3.11 9.2 941 4,152 9.05 1.21 3.43 0.60VIGA 41.79 4.01 9.6 655 7,448 12.53 1.88 5.13 1.00VIRAC (Capital) 22.79 1.81 7.9 1235 13,324 6.10 0.73 2.33 0.36
Masbate AROROY 65.40 2.24 3.4 118 40,741 23.87 1.47 11.04 0.95BALENO 55.81 3.42 6.1 273 12,002 18.45 1.89 8.00 1.09BALUD 64.11 3.64 5.7 135 19,882 22.60 2.48 10.17 1.59BATUAN 52.85 3.74 7.1 338 6,292 17.57 2.19 7.67 1.38CATAINGAN 57.24 2.66 4.6 251 27,675 19.41 1.56 8.60 0.92CAWAYAN 72.46 2.91 4.0 55 40,983 27.56 2.14 13.05 1.42CLAVERIA 69.59 3.36 4.8 80 26,642 26.30 2.20 12.46 1.42DIMASALANG 59.00 3.79 6.4 219 12,422 20.83 2.22 9.44 1.36ESPERANZA 63.66 5.01 7.9 140 10,362 22.40 3.17 10.14 1.96MANDAON 64.82 3.15 4.9 127 21,458 23.20 1.82 10.58 1.09CITY OF MASBATE (Capital)
40.08 1.93 4.8 713 31,234 13.17 1.00 5.73 0.58
MILAGROS 64.26 4.21 6.6 132 29,610 23.04 2.47 10.53 1.50MOBO 57.72 3.84 6.7 241 18,750 19.47 2.22 8.57 1.34MONREAL 66.66 4.30 6.5 105 14,462 24.51 2.87 11.42 1.83PALANAS 62.48 3.15 5.0 164 15,215 22.37 1.89 10.24 1.17
2003 City and Municipal Level Poverty Estimates Page 96 NSCB/WB Intercensal Updating of Small Area Poverty Estimates
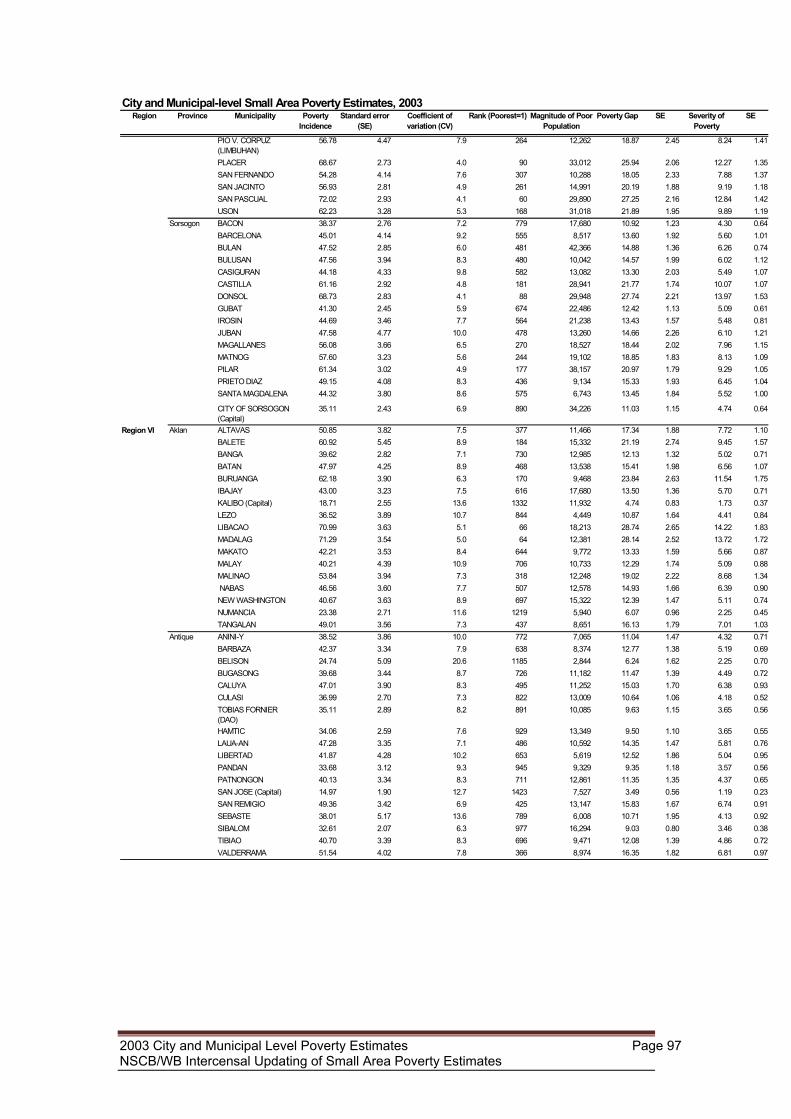
City and Municipal-level Small Area Poverty Estimates, 2003Region Province Municipality Poverty
IncidenceStandard error
(SE)Coefficient of variation (CV)
Rank (Poorest=1) Magnitude of Poor Population
Poverty Gap SE Severity of Poverty
SE
PIO V. CORPUZ (LIMBUHAN)
56.78 4.47 7.9 264 12,262 18.87 2.45 8.24 1.41
PLACER 68.67 2.73 4.0 90 33,012 25.94 2.06 12.27 1.35SAN FERNANDO 54.28 4.14 7.6 307 10,288 18.05 2.33 7.88 1.37SAN JACINTO 56.93 2.81 4.9 261 14,991 20.19 1.88 9.19 1.18SAN PASCUAL 72.02 2.93 4.1 60 29,890 27.25 2.16 12.84 1.42USON 62.23 3.28 5.3 168 31,018 21.89 1.95 9.89 1.19
Sorsogon BACON 38.37 2.76 7.2 779 17,680 10.92 1.23 4.30 0.64BARCELONA 45.01 4.14 9.2 555 8,517 13.60 1.92 5.60 1.01BULAN 47.52 2.85 6.0 481 42,366 14.88 1.36 6.26 0.74BULUSAN 47.56 3.94 8.3 480 10,042 14.57 1.99 6.02 1.12CASIGURAN 44.18 4.33 9.8 582 13,082 13.30 2.03 5.49 1.07CASTILLA 61.16 2.92 4.8 181 28,941 21.77 1.74 10.07 1.07DONSOL 68.73 2.83 4.1 88 29,948 27.74 2.21 13.97 1.53GUBAT 41.30 2.45 5.9 674 22,486 12.42 1.13 5.09 0.61IROSIN 44.69 3.46 7.7 564 21,238 13.43 1.57 5.48 0.81JUBAN 47.58 4.77 10.0 478 13,260 14.66 2.26 6.10 1.21MAGALLANES 56.08 3.66 6.5 270 18,527 18.44 2.02 7.96 1.15MATNOG 57.60 3.23 5.6 244 19,102 18.85 1.83 8.13 1.09PILAR 61.34 3.02 4.9 177 38,157 20.97 1.79 9.29 1.05PRIETO DIAZ 49.15 4.08 8.3 436 9,134 15.33 1.93 6.45 1.04SANTA MAGDALENA 44.32 3.80 8.6 575 6,743 13.45 1.84 5.52 1.00
CITY OF SORSOGON (Capital)
35.11 2.43 6.9 890 34,226 11.03 1.15 4.74 0.64
Region VI Aklan ALTAVAS 50.85 3.82 7.5 377 11,466 17.34 1.88 7.72 1.10BALETE 60.92 5.45 8.9 184 15,332 21.19 2.74 9.45 1.57BANGA 39.62 2.82 7.1 730 12,985 12.13 1.32 5.02 0.71BATAN 47.97 4.25 8.9 468 13,538 15.41 1.98 6.56 1.07BURUANGA 62.18 3.90 6.3 170 9,468 23.84 2.63 11.54 1.75IBAJAY 43.00 3.23 7.5 616 17,680 13.50 1.36 5.70 0.71KALIBO (Capital) 18.71 2.55 13.6 1332 11,932 4.74 0.83 1.73 0.37LEZO 36.52 3.89 10.7 844 4,449 10.87 1.64 4.41 0.84LIBACAO 70.99 3.63 5.1 66 18,213 28.74 2.65 14.22 1.83MADALAG 71.29 3.54 5.0 64 12,381 28.14 2.52 13.72 1.72MAKATO 42.21 3.53 8.4 644 9,772 13.33 1.59 5.66 0.87MALAY 40.21 4.39 10.9 706 10,733 12.29 1.74 5.09 0.88MALINAO 53.84 3.94 7.3 318 12,248 19.02 2.22 8.68 1.34 NABAS 46.56 3.60 7.7 507 12,578 14.93 1.66 6.39 0.90NEW WASHINGTON 40.67 3.63 8.9 697 15,322 12.39 1.47 5.11 0.74NUMANCIA 23.38 2.71 11.6 1219 5,940 6.07 0.96 2.25 0.45TANGALAN 49.01 3.56 7.3 437 8,651 16.13 1.79 7.01 1.03
Antique ANINI-Y 38.52 3.86 10.0 772 7,065 11.04 1.47 4.32 0.71BARBAZA 42.37 3.34 7.9 638 8,374 12.77 1.38 5.19 0.69BELISON 24.74 5.09 20.6 1185 2,844 6.24 1.62 2.25 0.70BUGASONG 39.68 3.44 8.7 726 11,182 11.47 1.39 4.49 0.72CALUYA 47.01 3.90 8.3 495 11,252 15.03 1.70 6.38 0.93CULASI 36.99 2.70 7.3 822 13,009 10.64 1.06 4.18 0.52TOBIAS FORNIER (DAO)
35.11 2.89 8.2 891 10,085 9.63 1.15 3.65 0.56
HAMTIC 34.06 2.59 7.6 929 13,349 9.50 1.10 3.65 0.55LAUA-AN 47.28 3.35 7.1 486 10,592 14.35 1.47 5.81 0.76LIBERTAD 41.87 4.28 10.2 653 5,619 12.52 1.86 5.04 0.95PANDAN 33.68 3.12 9.3 945 9,329 9.35 1.18 3.57 0.56PATNONGON 40.13 3.34 8.3 711 12,861 11.35 1.35 4.37 0.65SAN JOSE (Capital) 14.97 1.90 12.7 1423 7,527 3.49 0.56 1.19 0.23SAN REMIGIO 49.36 3.42 6.9 425 13,147 15.83 1.67 6.74 0.91SEBASTE 38.01 5.17 13.6 789 6,008 10.71 1.95 4.13 0.92SIBALOM 32.61 2.07 6.3 977 16,294 9.03 0.80 3.46 0.38TIBIAO 40.70 3.39 8.3 696 9,471 12.08 1.39 4.86 0.72VALDERRAMA 51.54 4.02 7.8 366 8,974 16.35 1.82 6.81 0.97
2003 City and Municipal Level Poverty Estimates Page 97 NSCB/WB Intercensal Updating of Small Area Poverty Estimates
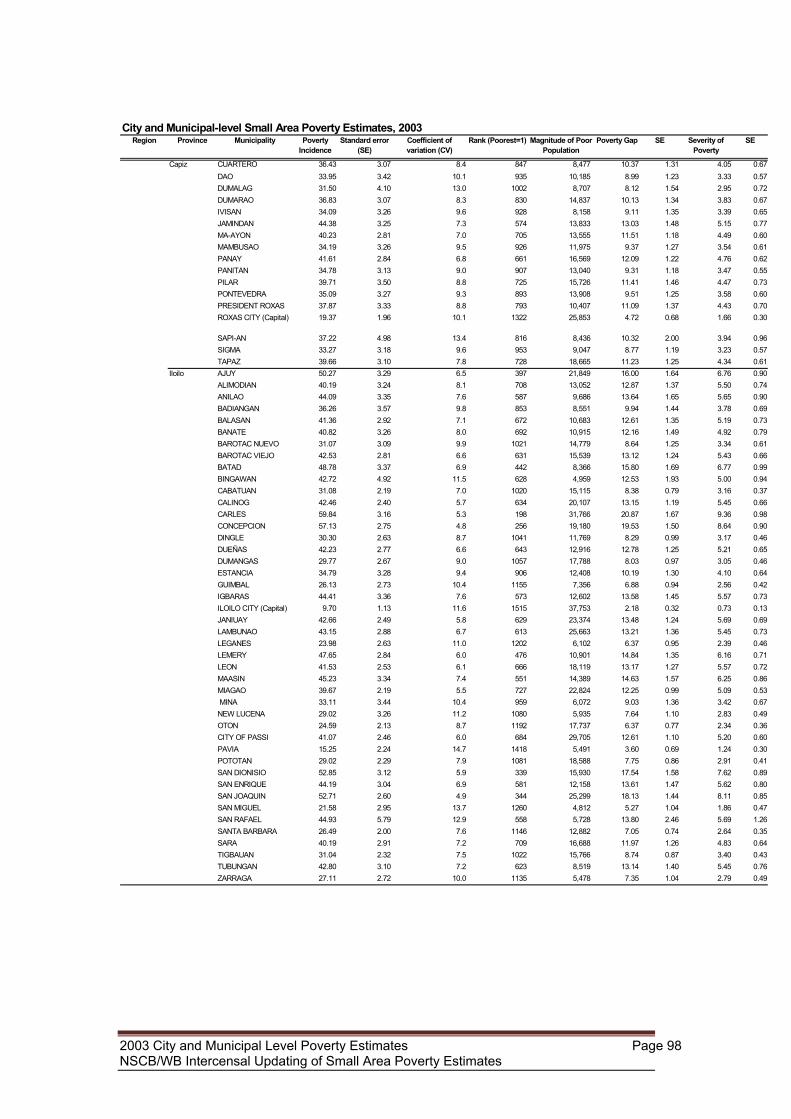
City and Municipal-level Small Area Poverty Estimates, 2003Region Province Municipality Poverty
IncidenceStandard error
(SE)Coefficient of variation (CV)
Rank (Poorest=1) Magnitude of Poor Population
Poverty Gap SE Severity of Poverty
SE
Capiz CUARTERO 36.43 3.07 8.4 847 8,477 10.37 1.31 4.05 0.67DAO 33.95 3.42 10.1 935 10,185 8.99 1.23 3.33 0.57DUMALAG 31.50 4.10 13.0 1002 8,707 8.12 1.54 2.95 0.72DUMARAO 36.83 3.07 8.3 830 14,837 10.13 1.34 3.83 0.67IVISAN 34.09 3.26 9.6 928 8,158 9.11 1.35 3.39 0.65JAMINDAN 44.38 3.25 7.3 574 13,833 13.03 1.48 5.15 0.77MA-AYON 40.23 2.81 7.0 705 13,555 11.51 1.18 4.49 0.60MAMBUSAO 34.19 3.26 9.5 926 11,975 9.37 1.27 3.54 0.61PANAY 41.61 2.84 6.8 661 16,569 12.09 1.22 4.76 0.62PANITAN 34.78 3.13 9.0 907 13,040 9.31 1.18 3.47 0.55PILAR 39.71 3.50 8.8 725 15,726 11.41 1.46 4.47 0.73PONTEVEDRA 35.09 3.27 9.3 893 13,908 9.51 1.25 3.58 0.60PRESIDENT ROXAS 37.87 3.33 8.8 793 10,407 11.09 1.37 4.43 0.70ROXAS CITY (Capital) 19.37 1.96 10.1 1322 25,853 4.72 0.68 1.66 0.30
SAPI-AN 37.22 4.98 13.4 816 8,436 10.32 2.00 3.94 0.96SIGMA 33.27 3.18 9.6 953 9,047 8.77 1.19 3.23 0.57TAPAZ 39.66 3.10 7.8 728 18,665 11.23 1.25 4.34 0.61
Iloilo AJUY 50.27 3.29 6.5 397 21,849 16.00 1.64 6.76 0.90ALIMODIAN 40.19 3.24 8.1 708 13,052 12.87 1.37 5.50 0.74ANILAO 44.09 3.35 7.6 587 9,686 13.64 1.65 5.65 0.90BADIANGAN 36.26 3.57 9.8 853 8,551 9.94 1.44 3.78 0.69BALASAN 41.36 2.92 7.1 672 10,683 12.61 1.35 5.19 0.73BANATE 40.82 3.26 8.0 692 10,915 12.16 1.49 4.92 0.79BAROTAC NUEVO 31.07 3.09 9.9 1021 14,779 8.64 1.25 3.34 0.61BAROTAC VIEJO 42.53 2.81 6.6 631 15,539 13.12 1.24 5.43 0.66BATAD 48.78 3.37 6.9 442 8,366 15.80 1.69 6.77 0.99BINGAWAN 42.72 4.92 11.5 628 4,959 12.53 1.93 5.00 0.94CABATUAN 31.08 2.19 7.0 1020 15,115 8.38 0.79 3.16 0.37CALINOG 42.46 2.40 5.7 634 20,107 13.15 1.19 5.45 0.66CARLES 59.84 3.16 5.3 198 31,766 20.87 1.67 9.36 0.98CONCEPCION 57.13 2.75 4.8 256 19,180 19.53 1.50 8.64 0.90DINGLE 30.30 2.63 8.7 1041 11,769 8.29 0.99 3.17 0.46DUEÑAS 42.23 2.77 6.6 643 12,916 12.78 1.25 5.21 0.65DUMANGAS 29.77 2.67 9.0 1057 17,788 8.03 0.97 3.05 0.46ESTANCIA 34.79 3.28 9.4 906 12,408 10.19 1.30 4.10 0.64GUIMBAL 26.13 2.73 10.4 1155 7,356 6.88 0.94 2.56 0.42IGBARAS 44.41 3.36 7.6 573 12,602 13.58 1.45 5.57 0.73ILOILO CITY (Capital) 9.70 1.13 11.6 1515 37,753 2.18 0.32 0.73 0.13JANIUAY 42.66 2.49 5.8 629 23,374 13.48 1.24 5.69 0.69LAMBUNAO 43.15 2.88 6.7 613 25,663 13.21 1.36 5.45 0.73LEGANES 23.98 2.63 11.0 1202 6,102 6.37 0.95 2.39 0.46LEMERY 47.65 2.84 6.0 476 10,901 14.84 1.35 6.16 0.71LEON 41.53 2.53 6.1 666 18,119 13.17 1.27 5.57 0.72MAASIN 45.23 3.34 7.4 551 14,389 14.63 1.57 6.25 0.86MIAGAO 39.67 2.19 5.5 727 22,824 12.25 0.99 5.09 0.53 MINA 33.11 3.44 10.4 959 6,072 9.03 1.36 3.42 0.67NEW LUCENA 29.02 3.26 11.2 1080 5,935 7.64 1.10 2.83 0.49OTON 24.59 2.13 8.7 1192 17,737 6.37 0.77 2.34 0.36CITY OF PASSI 41.07 2.46 6.0 684 29,705 12.61 1.10 5.20 0.60PAVIA 15.25 2.24 14.7 1418 5,491 3.60 0.69 1.24 0.30POTOTAN 29.02 2.29 7.9 1081 18,588 7.75 0.86 2.91 0.41SAN DIONISIO 52.85 3.12 5.9 339 15,930 17.54 1.58 7.62 0.89SAN ENRIQUE 44.19 3.04 6.9 581 12,158 13.61 1.47 5.62 0.80SAN JOAQUIN 52.71 2.60 4.9 344 25,299 18.13 1.44 8.11 0.85SAN MIGUEL 21.58 2.95 13.7 1260 4,812 5.27 1.04 1.86 0.47SAN RAFAEL 44.93 5.79 12.9 558 5,728 13.80 2.46 5.69 1.26SANTA BARBARA 26.49 2.00 7.6 1146 12,882 7.05 0.74 2.64 0.35SARA 40.19 2.91 7.2 709 16,688 11.97 1.26 4.83 0.64TIGBAUAN 31.04 2.32 7.5 1022 15,766 8.74 0.87 3.40 0.43TUBUNGAN 42.80 3.10 7.2 623 8,519 13.14 1.40 5.45 0.76ZARRAGA 27.11 2.72 10.0 1135 5,478 7.35 1.04 2.79 0.49
2003 City and Municipal Level Poverty Estimates Page 98 NSCB/WB Intercensal Updating of Small Area Poverty Estimates
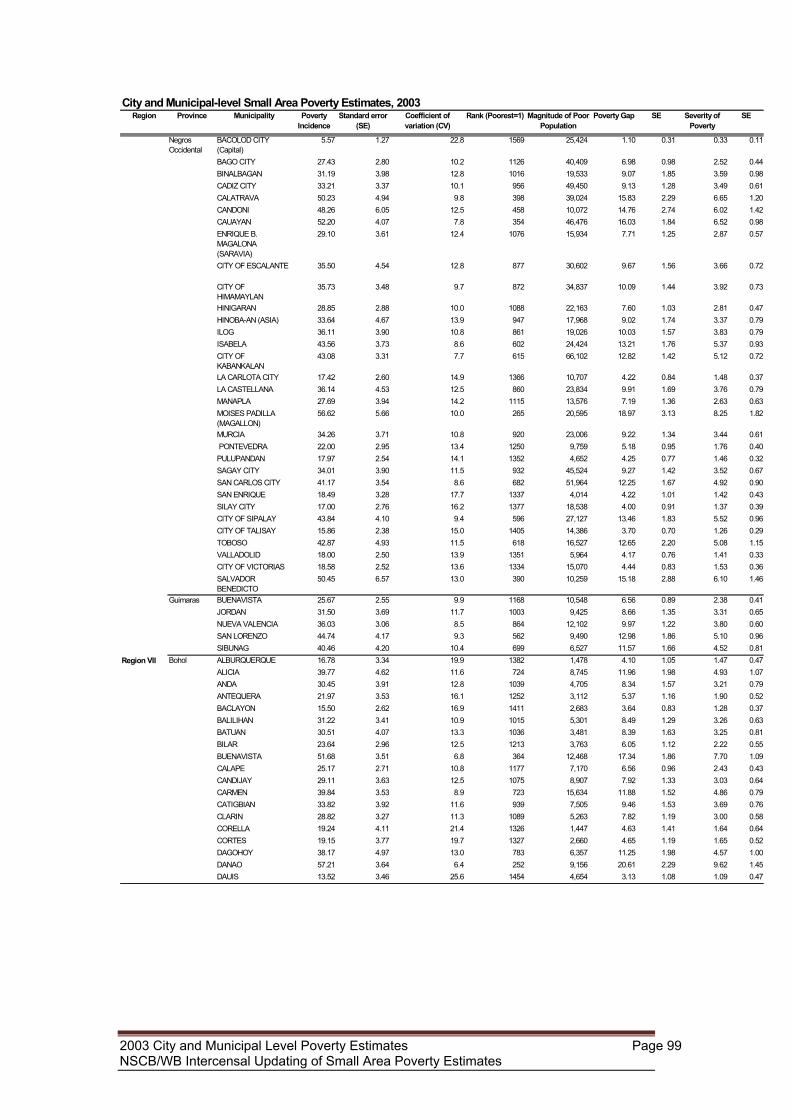
City and Municipal-level Small Area Poverty Estimates, 2003Region Province Municipality Poverty
IncidenceStandard error
(SE)Coefficient of variation (CV)
Rank (Poorest=1) Magnitude of Poor Population
Poverty Gap SE Severity of Poverty
SE
Negros Occidental
BACOLOD CITY (Capital)
5.57 1.27 22.8 1569 25,424 1.10 0.31 0.33 0.11
BAGO CITY 27.43 2.80 10.2 1126 40,409 6.98 0.98 2.52 0.44BINALBAGAN 31.19 3.98 12.8 1016 19,533 9.07 1.85 3.59 0.98CADIZ CITY 33.21 3.37 10.1 956 49,450 9.13 1.28 3.49 0.61CALATRAVA 50.23 4.94 9.8 398 39,024 15.83 2.29 6.65 1.20CANDONI 48.26 6.05 12.5 458 10,072 14.76 2.74 6.02 1.42CAUAYAN 52.20 4.07 7.8 354 46,476 16.03 1.84 6.52 0.98ENRIQUE B. MAGALONA (SARAVIA)
29.10 3.61 12.4 1076 15,934 7.71 1.25 2.87 0.57
CITY OF ESCALANTE 35.50 4.54 12.8 877 30,602 9.67 1.56 3.66 0.72
CITY OF HIMAMAYLAN
35.73 3.48 9.7 872 34,837 10.09 1.44 3.92 0.73
HINIGARAN 28.85 2.88 10.0 1088 22,163 7.60 1.03 2.81 0.47HINOBA-AN (ASIA) 33.64 4.67 13.9 947 17,968 9.02 1.74 3.37 0.79ILOG 36.11 3.90 10.8 861 19,026 10.03 1.57 3.83 0.79ISABELA 43.56 3.73 8.6 602 24,424 13.21 1.76 5.37 0.93CITY OF KABANKALAN
43.08 3.31 7.7 615 66,102 12.82 1.42 5.12 0.72
LA CARLOTA CITY 17.42 2.60 14.9 1366 10,707 4.22 0.84 1.48 0.37LA CASTELLANA 36.14 4.53 12.5 860 23,834 9.91 1.69 3.76 0.79MANAPLA 27.69 3.94 14.2 1115 13,576 7.19 1.36 2.63 0.63MOISES PADILLA (MAGALLON)
56.62 5.66 10.0 265 20,595 18.97 3.13 8.25 1.82
MURCIA 34.26 3.71 10.8 920 23,006 9.22 1.34 3.44 0.61 PONTEVEDRA 22.00 2.95 13.4 1250 9,759 5.18 0.95 1.76 0.40PULUPANDAN 17.97 2.54 14.1 1352 4,652 4.25 0.77 1.46 0.32SAGAY CITY 34.01 3.90 11.5 932 45,524 9.27 1.42 3.52 0.67SAN CARLOS CITY 41.17 3.54 8.6 682 51,964 12.25 1.67 4.92 0.90SAN ENRIQUE 18.49 3.28 17.7 1337 4,014 4.22 1.01 1.42 0.43SILAY CITY 17.00 2.76 16.2 1377 18,538 4.00 0.91 1.37 0.39CITY OF SIPALAY 43.84 4.10 9.4 596 27,127 13.46 1.83 5.52 0.96CITY OF TALISAY 15.86 2.38 15.0 1405 14,386 3.70 0.70 1.26 0.29TOBOSO 42.87 4.93 11.5 618 16,527 12.65 2.20 5.08 1.15VALLADOLID 18.00 2.50 13.9 1351 5,964 4.17 0.76 1.41 0.33CITY OF VICTORIAS 18.58 2.52 13.6 1334 15,070 4.44 0.83 1.53 0.36SALVADOR BENEDICTO
50.45 6.57 13.0 390 10,259 15.18 2.88 6.10 1.46
Guimaras BUENAVISTA 25.67 2.55 9.9 1168 10,548 6.56 0.89 2.38 0.41JORDAN 31.50 3.69 11.7 1003 9,425 8.66 1.35 3.31 0.65NUEVA VALENCIA 36.03 3.06 8.5 864 12,102 9.97 1.22 3.80 0.60SAN LORENZO 44.74 4.17 9.3 562 9,490 12.98 1.86 5.10 0.96SIBUNAG 40.46 4.20 10.4 699 6,527 11.57 1.66 4.52 0.81
Region VII Bohol ALBURQUERQUE 16.78 3.34 19.9 1382 1,478 4.10 1.05 1.47 0.47ALICIA 39.77 4.62 11.6 724 8,745 11.96 1.98 4.93 1.07ANDA 30.45 3.91 12.8 1039 4,705 8.34 1.57 3.21 0.79ANTEQUERA 21.97 3.53 16.1 1252 3,112 5.37 1.16 1.90 0.52BACLAYON 15.50 2.62 16.9 1411 2,683 3.64 0.83 1.28 0.37BALILIHAN 31.22 3.41 10.9 1015 5,301 8.49 1.29 3.26 0.63BATUAN 30.51 4.07 13.3 1036 3,481 8.39 1.63 3.25 0.81BILAR 23.64 2.96 12.5 1213 3,763 6.05 1.12 2.22 0.55BUENAVISTA 51.68 3.51 6.8 364 12,468 17.34 1.86 7.70 1.09CALAPE 25.17 2.71 10.8 1177 7,170 6.56 0.96 2.43 0.43CANDIJAY 29.11 3.63 12.5 1075 8,907 7.92 1.33 3.03 0.64CARMEN 39.84 3.53 8.9 723 15,634 11.88 1.52 4.86 0.79CATIGBIAN 33.82 3.92 11.6 939 7,505 9.46 1.53 3.69 0.76CLARIN 28.82 3.27 11.3 1089 5,263 7.82 1.19 3.00 0.58CORELLA 19.24 4.11 21.4 1326 1,447 4.63 1.41 1.64 0.64CORTES 19.15 3.77 19.7 1327 2,660 4.65 1.19 1.65 0.52DAGOHOY 38.17 4.97 13.0 783 6,357 11.25 1.98 4.57 1.00DANAO 57.21 3.64 6.4 252 9,156 20.61 2.29 9.62 1.45DAUIS 13.52 3.46 25.6 1454 4,654 3.13 1.08 1.09 0.47
2003 City and Municipal Level Poverty Estimates Page 99 NSCB/WB Intercensal Updating of Small Area Poverty Estimates
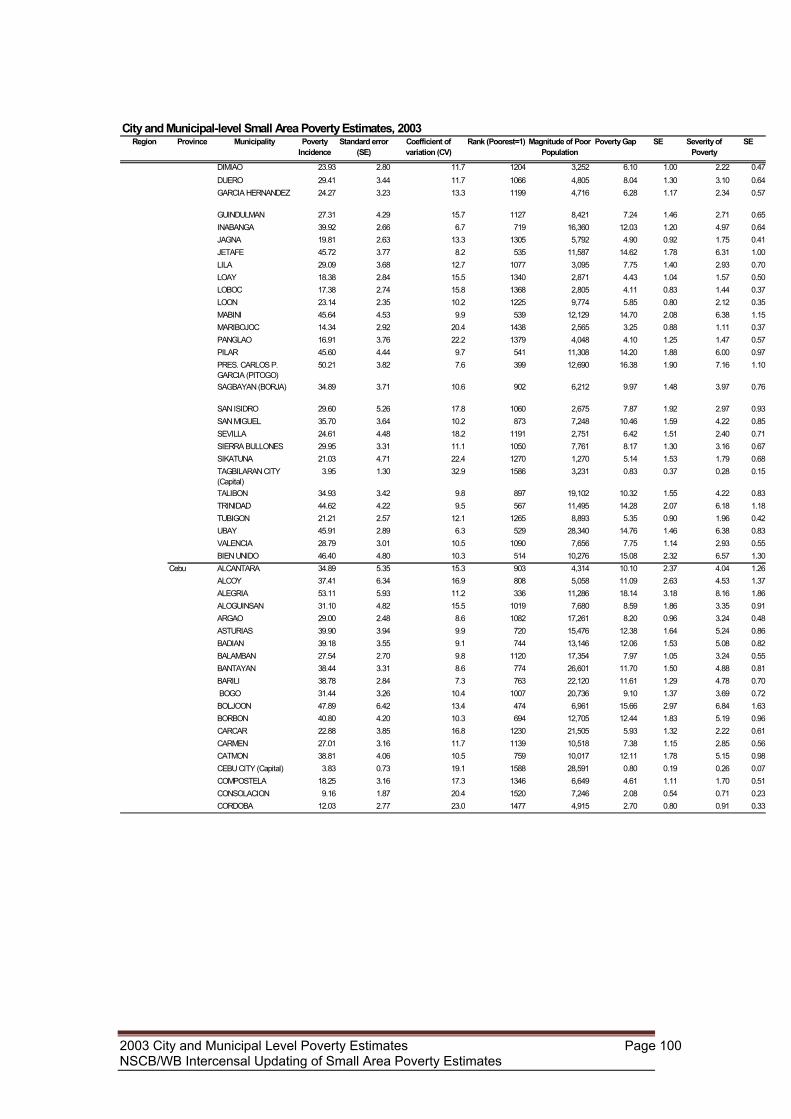
City and Municipal-level Small Area Poverty Estimates, 2003Region Province Municipality Poverty
IncidenceStandard error
(SE)Coefficient of variation (CV)
Rank (Poorest=1) Magnitude of Poor Population
Poverty Gap SE Severity of Poverty
SE
DIMIAO 23.93 2.80 11.7 1204 3,252 6.10 1.00 2.22 0.47DUERO 29.41 3.44 11.7 1066 4,805 8.04 1.30 3.10 0.64GARCIA HERNANDEZ 24.27 3.23 13.3 1199 4,716 6.28 1.17 2.34 0.57
GUINDULMAN 27.31 4.29 15.7 1127 8,421 7.24 1.46 2.71 0.65INABANGA 39.92 2.66 6.7 719 16,360 12.03 1.20 4.97 0.64JAGNA 19.81 2.63 13.3 1305 5,792 4.90 0.92 1.75 0.41JETAFE 45.72 3.77 8.2 535 11,587 14.62 1.78 6.31 1.00LILA 29.09 3.68 12.7 1077 3,095 7.75 1.40 2.93 0.70LOAY 18.38 2.84 15.5 1340 2,871 4.43 1.04 1.57 0.50LOBOC 17.38 2.74 15.8 1368 2,805 4.11 0.83 1.44 0.37LOON 23.14 2.35 10.2 1225 9,774 5.85 0.80 2.12 0.35MABINI 45.64 4.53 9.9 539 12,129 14.70 2.08 6.38 1.15MARIBOJOC 14.34 2.92 20.4 1438 2,565 3.25 0.88 1.11 0.37PANGLAO 16.91 3.76 22.2 1379 4,048 4.10 1.25 1.47 0.57PILAR 45.60 4.44 9.7 541 11,308 14.20 1.88 6.00 0.97PRES. CARLOS P. GARCIA (PITOGO)
50.21 3.82 7.6 399 12,690 16.38 1.90 7.16 1.10
SAGBAYAN (BORJA) 34.89 3.71 10.6 902 6,212 9.97 1.48 3.97 0.76
SAN ISIDRO 29.60 5.26 17.8 1060 2,675 7.87 1.92 2.97 0.93SAN MIGUEL 35.70 3.64 10.2 873 7,248 10.46 1.59 4.22 0.85SEVILLA 24.61 4.48 18.2 1191 2,751 6.42 1.51 2.40 0.71SIERRA BULLONES 29.95 3.31 11.1 1050 7,761 8.17 1.30 3.16 0.67SIKATUNA 21.03 4.71 22.4 1270 1,270 5.14 1.53 1.79 0.68TAGBILARAN CITY (Capital)
3.95 1.30 32.9 1586 3,231 0.83 0.37 0.28 0.15
TALIBON 34.93 3.42 9.8 897 19,102 10.32 1.55 4.22 0.83TRINIDAD 44.62 4.22 9.5 567 11,495 14.28 2.07 6.18 1.18TUBIGON 21.21 2.57 12.1 1265 8,893 5.35 0.90 1.96 0.42UBAY 45.91 2.89 6.3 529 28,340 14.76 1.46 6.38 0.83VALENCIA 28.79 3.01 10.5 1090 7,656 7.75 1.14 2.93 0.55BIEN UNIDO 46.40 4.80 10.3 514 10,276 15.08 2.32 6.57 1.30
Cebu ALCANTARA 34.89 5.35 15.3 903 4,314 10.10 2.37 4.04 1.26ALCOY 37.41 6.34 16.9 808 5,058 11.09 2.63 4.53 1.37ALEGRIA 53.11 5.93 11.2 336 11,286 18.14 3.18 8.16 1.86ALOGUINSAN 31.10 4.82 15.5 1019 7,680 8.59 1.86 3.35 0.91ARGAO 29.00 2.48 8.6 1082 17,261 8.20 0.96 3.24 0.48ASTURIAS 39.90 3.94 9.9 720 15,476 12.38 1.64 5.24 0.86BADIAN 39.18 3.55 9.1 744 13,146 12.06 1.53 5.08 0.82BALAMBAN 27.54 2.70 9.8 1120 17,354 7.97 1.05 3.24 0.55BANTAYAN 38.44 3.31 8.6 774 26,601 11.70 1.50 4.88 0.81BARILI 38.78 2.84 7.3 763 22,120 11.61 1.29 4.78 0.70 BOGO 31.44 3.26 10.4 1007 20,736 9.10 1.37 3.69 0.72BOLJOON 47.89 6.42 13.4 474 6,961 15.66 2.97 6.84 1.63BORBON 40.80 4.20 10.3 694 12,705 12.44 1.83 5.19 0.96CARCAR 22.88 3.85 16.8 1230 21,505 5.93 1.32 2.22 0.61CARMEN 27.01 3.16 11.7 1139 10,518 7.38 1.15 2.85 0.56CATMON 38.81 4.06 10.5 759 10,017 12.11 1.78 5.15 0.98CEBU CITY (Capital) 3.83 0.73 19.1 1588 28,591 0.80 0.19 0.26 0.07COMPOSTELA 18.25 3.16 17.3 1346 6,649 4.61 1.11 1.70 0.51CONSOLACION 9.16 1.87 20.4 1520 7,246 2.08 0.54 0.71 0.23CORDOBA 12.03 2.77 23.0 1477 4,915 2.70 0.80 0.91 0.33
2003 City and Municipal Level Poverty Estimates Page 100 NSCB/WB Intercensal Updating of Small Area Poverty Estimates
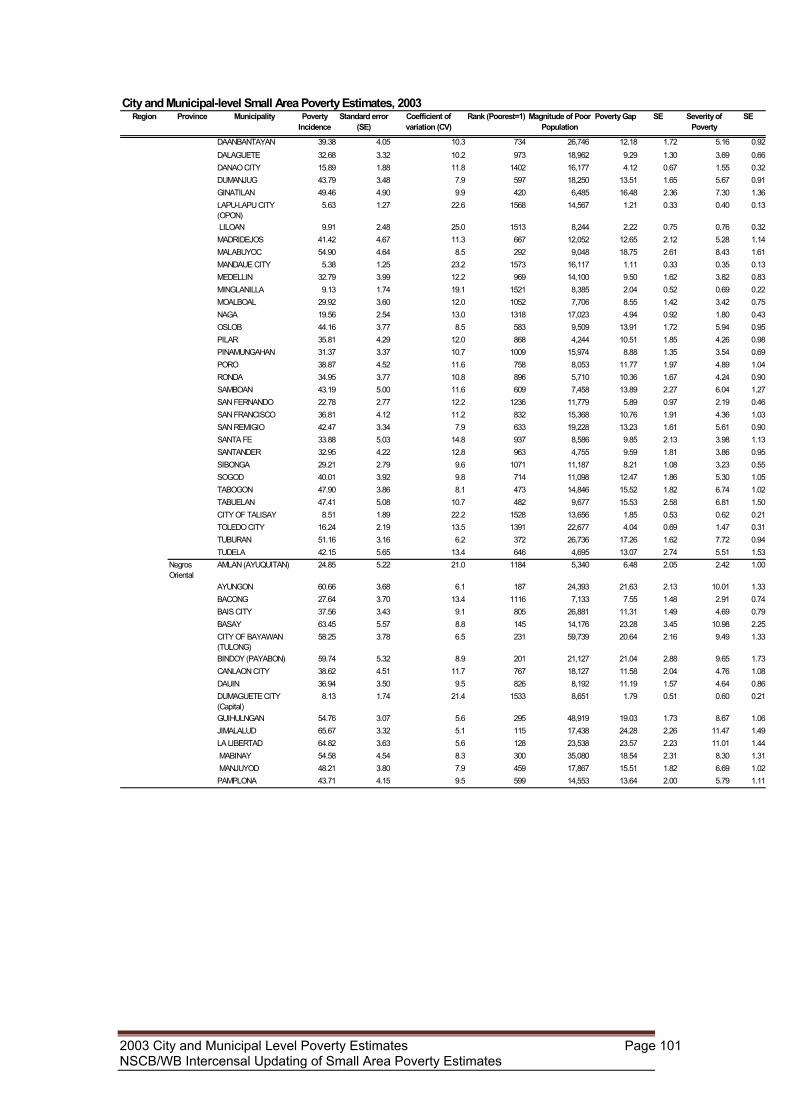
City and Municipal-level Small Area Poverty Estimates, 2003Region Province Municipality Poverty
IncidenceStandard error
(SE)Coefficient of variation (CV)
Rank (Poorest=1) Magnitude of Poor Population
Poverty Gap SE Severity of Poverty
SE
DAANBANTAYAN 39.38 4.05 10.3 734 26,746 12.18 1.72 5.16 0.92DALAGUETE 32.68 3.32 10.2 973 18,962 9.29 1.30 3.69 0.66DANAO CITY 15.89 1.88 11.8 1402 16,177 4.12 0.67 1.55 0.32DUMANJUG 43.79 3.48 7.9 597 18,250 13.51 1.65 5.67 0.91GINATILAN 49.46 4.90 9.9 420 6,485 16.48 2.36 7.30 1.36LAPU-LAPU CITY (OPON)
5.63 1.27 22.6 1568 14,567 1.21 0.33 0.40 0.13
LILOAN 9.91 2.48 25.0 1513 8,244 2.22 0.75 0.76 0.32MADRIDEJOS 41.42 4.67 11.3 667 12,052 12.65 2.12 5.28 1.14MALABUYOC 54.90 4.64 8.5 292 9,048 18.75 2.61 8.43 1.61MANDAUE CITY 5.38 1.25 23.2 1573 16,117 1.11 0.33 0.35 0.13MEDELLIN 32.79 3.99 12.2 969 14,100 9.50 1.62 3.82 0.83MINGLANILLA 9.13 1.74 19.1 1521 8,385 2.04 0.52 0.69 0.22MOALBOAL 29.92 3.60 12.0 1052 7,706 8.55 1.42 3.42 0.75NAGA 19.56 2.54 13.0 1318 17,023 4.94 0.92 1.80 0.43OSLOB 44.16 3.77 8.5 583 9,509 13.91 1.72 5.94 0.95PILAR 35.81 4.29 12.0 868 4,244 10.51 1.85 4.26 0.98PINAMUNGAHAN 31.37 3.37 10.7 1009 15,974 8.88 1.35 3.54 0.69PORO 38.87 4.52 11.6 758 8,053 11.77 1.97 4.89 1.04RONDA 34.95 3.77 10.8 896 5,710 10.36 1.67 4.24 0.90SAMBOAN 43.19 5.00 11.6 609 7,458 13.89 2.27 6.04 1.27SAN FERNANDO 22.78 2.77 12.2 1236 11,779 5.89 0.97 2.19 0.46SAN FRANCISCO 36.81 4.12 11.2 832 15,368 10.76 1.91 4.36 1.03SAN REMIGIO 42.47 3.34 7.9 633 19,228 13.23 1.61 5.61 0.90SANTA FE 33.88 5.03 14.8 937 8,586 9.85 2.13 3.98 1.13SANTANDER 32.95 4.22 12.8 963 4,755 9.59 1.81 3.86 0.95SIBONGA 29.21 2.79 9.6 1071 11,187 8.21 1.08 3.23 0.55SOGOD 40.01 3.92 9.8 714 11,098 12.47 1.86 5.30 1.05TABOGON 47.90 3.86 8.1 473 14,846 15.52 1.82 6.74 1.02TABUELAN 47.41 5.08 10.7 482 9,677 15.53 2.58 6.81 1.50CITY OF TALISAY 8.51 1.89 22.2 1528 13,656 1.85 0.53 0.62 0.21TOLEDO CITY 16.24 2.19 13.5 1391 22,677 4.04 0.69 1.47 0.31TUBURAN 51.16 3.16 6.2 372 26,736 17.26 1.62 7.72 0.94TUDELA 42.15 5.65 13.4 646 4,695 13.07 2.74 5.51 1.53
Negros Oriental
AMLAN (AYUQUITAN) 24.85 5.22 21.0 1184 5,340 6.48 2.05 2.42 1.00
AYUNGON 60.66 3.68 6.1 187 24,393 21.63 2.13 10.01 1.33BACONG 27.64 3.70 13.4 1116 7,133 7.55 1.48 2.91 0.74BAIS CITY 37.56 3.43 9.1 805 26,881 11.31 1.49 4.69 0.79BASAY 63.45 5.57 8.8 145 14,176 23.28 3.45 10.98 2.25CITY OF BAYAWAN (TULONG)
58.25 3.78 6.5 231 59,739 20.64 2.16 9.49 1.33
BINDOY (PAYABON) 59.74 5.32 8.9 201 21,127 21.04 2.88 9.65 1.73CANLAON CITY 38.62 4.51 11.7 767 18,127 11.58 2.04 4.76 1.08DAUIN 36.94 3.50 9.5 826 8,192 11.19 1.57 4.64 0.86DUMAGUETE CITY (Capital)
8.13 1.74 21.4 1533 8,651 1.79 0.51 0.60 0.21
GUIHULNGAN 54.76 3.07 5.6 295 48,919 19.03 1.73 8.67 1.06JIMALALUD 65.67 3.32 5.1 115 17,438 24.28 2.26 11.47 1.49LA LIBERTAD 64.82 3.63 5.6 128 23,538 23.57 2.23 11.01 1.44 MABINAY 54.58 4.54 8.3 300 35,080 18.54 2.31 8.30 1.31 MANJUYOD 48.21 3.80 7.9 459 17,867 15.51 1.82 6.69 1.02PAMPLONA 43.71 4.15 9.5 599 14,553 13.64 2.00 5.79 1.11
2003 City and Municipal Level Poverty Estimates Page 101 NSCB/WB Intercensal Updating of Small Area Poverty Estimates
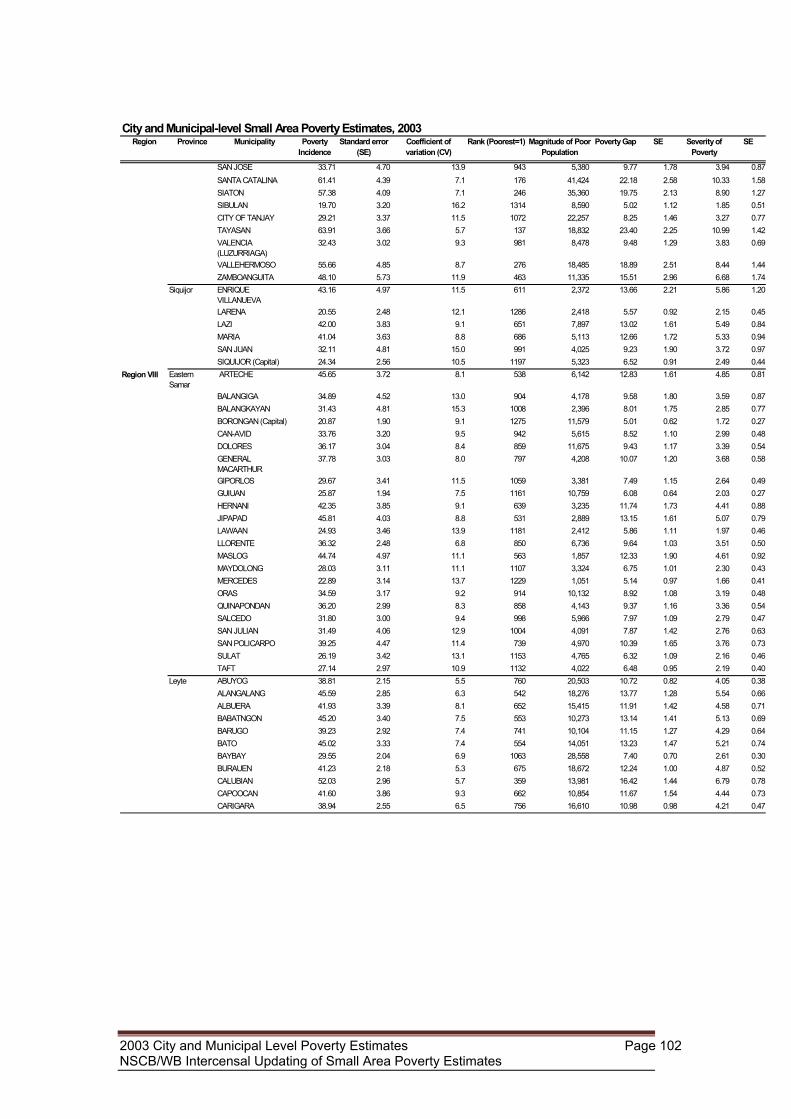
City and Municipal-level Small Area Poverty Estimates, 2003Region Province Municipality Poverty
IncidenceStandard error
(SE)Coefficient of variation (CV)
Rank (Poorest=1) Magnitude of Poor Population
Poverty Gap SE Severity of Poverty
SE
SAN JOSE 33.71 4.70 13.9 943 5,380 9.77 1.78 3.94 0.87SANTA CATALINA 61.41 4.39 7.1 176 41,424 22.18 2.58 10.33 1.58SIATON 57.38 4.09 7.1 246 35,360 19.75 2.13 8.90 1.27SIBULAN 19.70 3.20 16.2 1314 8,590 5.02 1.12 1.85 0.51CITY OF TANJAY 29.21 3.37 11.5 1072 22,257 8.25 1.46 3.27 0.77TAYASAN 63.91 3.66 5.7 137 18,832 23.40 2.25 10.99 1.42VALENCIA (LUZURRIAGA)
32.43 3.02 9.3 981 8,478 9.48 1.29 3.83 0.69
VALLEHERMOSO 55.66 4.85 8.7 276 18,485 18.89 2.51 8.44 1.44ZAMBOANGUITA 48.10 5.73 11.9 463 11,335 15.51 2.96 6.68 1.74
Siquijor ENRIQUE VILLANUEVA
43.16 4.97 11.5 611 2,372 13.66 2.21 5.86 1.20
LARENA 20.55 2.48 12.1 1286 2,418 5.57 0.92 2.15 0.45LAZI 42.00 3.83 9.1 651 7,897 13.02 1.61 5.49 0.84MARIA 41.04 3.63 8.8 686 5,113 12.66 1.72 5.33 0.94SAN JUAN 32.11 4.81 15.0 991 4,025 9.23 1.90 3.72 0.97SIQUIJOR (Capital) 24.34 2.56 10.5 1197 5,323 6.52 0.91 2.49 0.44
Region VIII Eastern Samar
ARTECHE 45.65 3.72 8.1 538 6,142 12.83 1.61 4.85 0.81
BALANGIGA 34.89 4.52 13.0 904 4,178 9.58 1.80 3.59 0.87BALANGKAYAN 31.43 4.81 15.3 1008 2,396 8.01 1.75 2.85 0.77BORONGAN (Capital) 20.87 1.90 9.1 1275 11,579 5.01 0.62 1.72 0.27CAN-AVID 33.76 3.20 9.5 942 5,615 8.52 1.10 2.99 0.48DOLORES 36.17 3.04 8.4 859 11,675 9.43 1.17 3.39 0.54GENERAL MACARTHUR
37.78 3.03 8.0 797 4,208 10.07 1.20 3.68 0.58
GIPORLOS 29.67 3.41 11.5 1059 3,381 7.49 1.15 2.64 0.49GUIUAN 25.87 1.94 7.5 1161 10,759 6.08 0.64 2.03 0.27HERNANI 42.35 3.85 9.1 639 3,235 11.74 1.73 4.41 0.88JIPAPAD 45.81 4.03 8.8 531 2,889 13.15 1.61 5.07 0.79LAWAAN 24.93 3.46 13.9 1181 2,412 5.86 1.11 1.97 0.46LLORENTE 36.32 2.48 6.8 850 6,736 9.64 1.03 3.51 0.50MASLOG 44.74 4.97 11.1 563 1,857 12.33 1.90 4.61 0.92MAYDOLONG 28.03 3.11 11.1 1107 3,324 6.75 1.01 2.30 0.43MERCEDES 22.89 3.14 13.7 1229 1,051 5.14 0.97 1.66 0.41ORAS 34.59 3.17 9.2 914 10,132 8.92 1.08 3.19 0.48QUINAPONDAN 36.20 2.99 8.3 858 4,143 9.37 1.16 3.36 0.54SALCEDO 31.80 3.00 9.4 998 5,966 7.97 1.09 2.79 0.47SAN JULIAN 31.49 4.06 12.9 1004 4,091 7.87 1.42 2.76 0.63SAN POLICARPO 39.25 4.47 11.4 739 4,970 10.39 1.65 3.76 0.73SULAT 26.19 3.42 13.1 1153 4,765 6.32 1.09 2.16 0.46TAFT 27.14 2.97 10.9 1132 4,022 6.48 0.95 2.19 0.40
Leyte ABUYOG 38.81 2.15 5.5 760 20,503 10.72 0.82 4.05 0.38ALANGALANG 45.59 2.85 6.3 542 18,276 13.77 1.28 5.54 0.66ALBUERA 41.93 3.39 8.1 652 15,415 11.91 1.42 4.58 0.71BABATNGON 45.20 3.40 7.5 553 10,273 13.14 1.41 5.13 0.69BARUGO 39.23 2.92 7.4 741 10,104 11.15 1.27 4.29 0.64BATO 45.02 3.33 7.4 554 14,051 13.23 1.47 5.21 0.74BAYBAY 29.55 2.04 6.9 1063 28,558 7.40 0.70 2.61 0.30BURAUEN 41.23 2.18 5.3 675 18,672 12.24 1.00 4.87 0.52CALUBIAN 52.03 2.96 5.7 359 13,981 16.42 1.44 6.79 0.78CAPOOCAN 41.60 3.86 9.3 662 10,854 11.67 1.54 4.44 0.73CARIGARA 38.94 2.55 6.5 756 16,610 10.98 0.98 4.21 0.47
2003 City and Municipal Level Poverty Estimates Page 102 NSCB/WB Intercensal Updating of Small Area Poverty Estimates
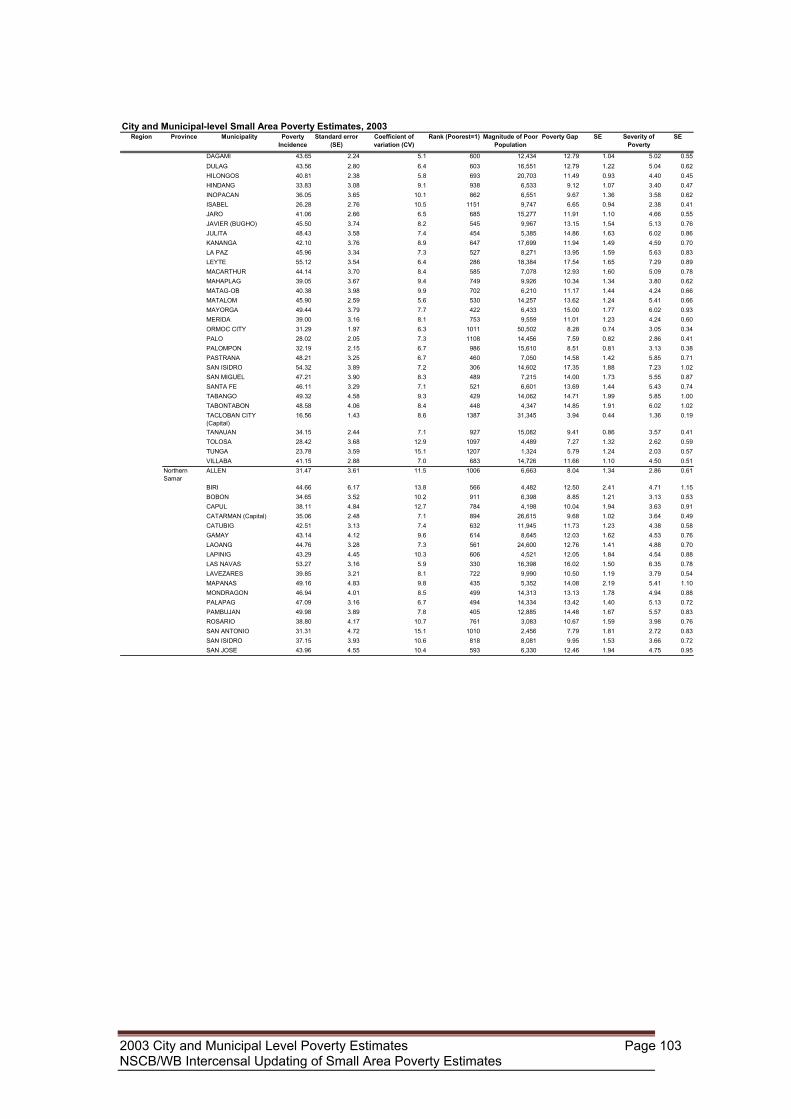
City and Municipal-level Small Area Poverty Estimates, 2003Region Province Municipality Poverty
IncidenceStandard error
(SE)Coefficient of variation (CV)
Rank (Poorest=1) Magnitude of Poor Population
Poverty Gap SE Severity of Poverty
SE
DAGAMI 43.65 2.24 5.1 600 12,434 12.79 1.04 5.02 0.55DULAG 43.56 2.80 6.4 603 16,551 12.79 1.22 5.04 0.62HILONGOS 40.81 2.38 5.8 693 20,703 11.49 0.93 4.40 0.45HINDANG 33.83 3.08 9.1 938 6,533 9.12 1.07 3.40 0.47INOPACAN 36.05 3.65 10.1 862 6,551 9.67 1.36 3.58 0.62ISABEL 26.28 2.76 10.5 1151 9,747 6.65 0.94 2.38 0.41JARO 41.06 2.66 6.5 685 15,277 11.91 1.10 4.66 0.55JAVIER (BUGHO) 45.50 3.74 8.2 545 9,967 13.15 1.54 5.13 0.76JULITA 48.43 3.58 7.4 454 5,385 14.86 1.63 6.02 0.86KANANGA 42.10 3.76 8.9 647 17,699 11.94 1.49 4.59 0.70LA PAZ 45.96 3.34 7.3 527 8,271 13.95 1.59 5.63 0.83LEYTE 55.12 3.54 6.4 286 18,384 17.54 1.65 7.29 0.89MACARTHUR 44.14 3.70 8.4 585 7,078 12.93 1.60 5.09 0.78MAHAPLAG 39.05 3.67 9.4 749 9,926 10.34 1.34 3.80 0.62MATAG-OB 40.38 3.98 9.9 702 6,210 11.17 1.44 4.24 0.66MATALOM 45.90 2.59 5.6 530 14,257 13.62 1.24 5.41 0.66MAYORGA 49.44 3.79 7.7 422 6,433 15.00 1.77 6.02 0.93MERIDA 39.00 3.16 8.1 753 9,559 11.01 1.23 4.24 0.60ORMOC CITY 31.29 1.97 6.3 1011 50,502 8.28 0.74 3.05 0.34PALO 28.02 2.05 7.3 1108 14,456 7.59 0.82 2.86 0.41PALOMPON 32.19 2.15 6.7 986 15,610 8.51 0.81 3.13 0.38PASTRANA 48.21 3.25 6.7 460 7,050 14.58 1.42 5.85 0.71SAN ISIDRO 54.32 3.89 7.2 306 14,602 17.35 1.88 7.23 1.02SAN MIGUEL 47.21 3.90 8.3 489 7,215 14.00 1.73 5.55 0.87SANTA FE 46.11 3.29 7.1 521 6,601 13.69 1.44 5.43 0.74TABANGO 49.32 4.58 9.3 429 14,062 14.71 1.99 5.85 1.00TABONTABON 48.58 4.06 8.4 448 4,347 14.85 1.91 6.02 1.02TACLOBAN CITY (Capital)
16.56 1.43 8.6 1387 31,345 3.94 0.44 1.36 0.19
TANAUAN 34.15 2.44 7.1 927 15,082 9.41 0.86 3.57 0.41TOLOSA 28.42 3.68 12.9 1097 4,489 7.27 1.32 2.62 0.59TUNGA 23.78 3.59 15.1 1207 1,324 5.79 1.24 2.03 0.57VILLABA 41.15 2.88 7.0 683 14,726 11.66 1.10 4.50 0.51
Northern Samar
ALLEN 31.47 3.61 11.5 1006 6,663 8.04 1.34 2.86 0.61
BIRI 44.66 6.17 13.8 566 4,482 12.50 2.41 4.71 1.15BOBON 34.65 3.52 10.2 911 6,398 8.85 1.21 3.13 0.53CAPUL 38.11 4.84 12.7 784 4,198 10.04 1.94 3.63 0.91CATARMAN (Capital) 35.06 2.48 7.1 894 26,615 9.68 1.02 3.64 0.49CATUBIG 42.51 3.13 7.4 632 11,945 11.73 1.23 4.38 0.58GAMAY 43.14 4.12 9.6 614 8,645 12.03 1.62 4.53 0.76LAOANG 44.76 3.28 7.3 561 24,600 12.76 1.41 4.88 0.70LAPINIG 43.29 4.45 10.3 606 4,521 12.05 1.84 4.54 0.88LAS NAVAS 53.27 3.16 5.9 330 16,398 16.02 1.50 6.35 0.78LAVEZARES 39.85 3.21 8.1 722 9,990 10.50 1.19 3.79 0.54MAPANAS 49.16 4.83 9.8 435 5,352 14.08 2.19 5.41 1.10MONDRAGON 46.94 4.01 8.5 499 14,313 13.13 1.78 4.94 0.88PALAPAG 47.09 3.16 6.7 494 14,334 13.42 1.40 5.13 0.72PAMBUJAN 49.98 3.89 7.8 405 12,885 14.48 1.67 5.57 0.83ROSARIO 38.80 4.17 10.7 761 3,083 10.67 1.59 3.98 0.76SAN ANTONIO 31.31 4.72 15.1 1010 2,456 7.79 1.81 2.72 0.83SAN ISIDRO 37.15 3.93 10.6 818 8,081 9.95 1.53 3.66 0.72SAN JOSE 43.96 4.55 10.4 593 6,330 12.46 1.94 4.75 0.95
2003 City and Municipal Level Poverty Estimates Page 103 NSCB/WB Intercensal Updating of Small Area Poverty Estimates
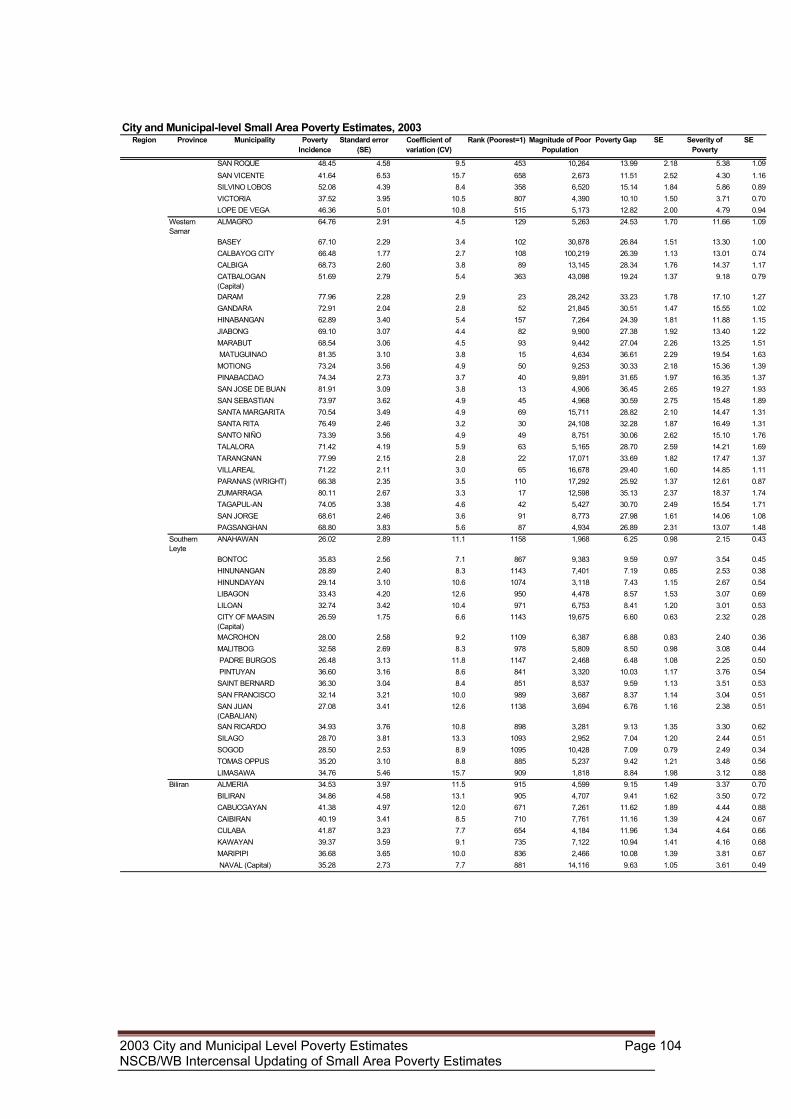
City and Municipal-level Small Area Poverty Estimates, 2003Region Province Municipality Poverty
IncidenceStandard error
(SE)Coefficient of variation (CV)
Rank (Poorest=1) Magnitude of Poor Population
Poverty Gap SE Severity of Poverty
SE
SAN ROQUE 48.45 4.58 9.5 453 10,264 13.99 2.18 5.38 1.09SAN VICENTE 41.64 6.53 15.7 658 2,673 11.51 2.52 4.30 1.16SILVINO LOBOS 52.08 4.39 8.4 358 6,520 15.14 1.84 5.86 0.89VICTORIA 37.52 3.95 10.5 807 4,390 10.10 1.50 3.71 0.70LOPE DE VEGA 46.36 5.01 10.8 515 5,173 12.82 2.00 4.79 0.94
Western Samar
ALMAGRO 64.76 2.91 4.5 129 5,263 24.53 1.70 11.66 1.09
BASEY 67.10 2.29 3.4 102 30,878 26.84 1.51 13.30 1.00CALBAYOG CITY 66.48 1.77 2.7 108 100,219 26.39 1.13 13.01 0.74CALBIGA 68.73 2.60 3.8 89 13,145 28.34 1.76 14.37 1.17CATBALOGAN (Capital)
51.69 2.79 5.4 363 43,098 19.24 1.37 9.18 0.79
DARAM 77.96 2.28 2.9 23 28,242 33.23 1.78 17.10 1.27GANDARA 72.91 2.04 2.8 52 21,845 30.51 1.47 15.55 1.02HINABANGAN 62.89 3.40 5.4 157 7,264 24.39 1.81 11.88 1.15JIABONG 69.10 3.07 4.4 82 9,900 27.38 1.92 13.40 1.22MARABUT 68.54 3.06 4.5 93 9,442 27.04 2.26 13.25 1.51 MATUGUINAO 81.35 3.10 3.8 15 4,634 36.61 2.29 19.54 1.63MOTIONG 73.24 3.56 4.9 50 9,253 30.33 2.18 15.36 1.39PINABACDAO 74.34 2.73 3.7 40 9,891 31.65 1.97 16.35 1.37SAN JOSE DE BUAN 81.91 3.09 3.8 13 4,906 36.45 2.65 19.27 1.93SAN SEBASTIAN 73.97 3.62 4.9 45 4,968 30.59 2.75 15.48 1.89SANTA MARGARITA 70.54 3.49 4.9 69 15,711 28.82 2.10 14.47 1.31SANTA RITA 76.49 2.46 3.2 30 24,108 32.28 1.87 16.49 1.31SANTO NIÑO 73.39 3.56 4.9 49 8,751 30.06 2.62 15.10 1.76TALALORA 71.42 4.19 5.9 63 5,165 28.70 2.59 14.21 1.69TARANGNAN 77.99 2.15 2.8 22 17,071 33.69 1.82 17.47 1.37VILLAREAL 71.22 2.11 3.0 65 16,678 29.40 1.60 14.85 1.11PARANAS (WRIGHT) 66.38 2.35 3.5 110 17,292 25.92 1.37 12.61 0.87ZUMARRAGA 80.11 2.67 3.3 17 12,598 35.13 2.37 18.37 1.74TAGAPUL-AN 74.05 3.38 4.6 42 5,427 30.70 2.49 15.54 1.71SAN JORGE 68.61 2.46 3.6 91 8,773 27.98 1.61 14.06 1.08PAGSANGHAN 68.80 3.83 5.6 87 4,934 26.89 2.31 13.07 1.48
Southern Leyte
ANAHAWAN 26.02 2.89 11.1 1158 1,968 6.25 0.98 2.15 0.43
BONTOC 35.83 2.56 7.1 867 9,383 9.59 0.97 3.54 0.45HINUNANGAN 28.89 2.40 8.3 1143 7,401 7.19 0.85 2.53 0.38HINUNDAYAN 29.14 3.10 10.6 1074 3,118 7.43 1.15 2.67 0.54LIBAGON 33.43 4.20 12.6 950 4,478 8.57 1.53 3.07 0.69LILOAN 32.74 3.42 10.4 971 6,753 8.41 1.20 3.01 0.53CITY OF MAASIN (Capital)
26.59 1.75 6.6 1143 19,675 6.60 0.63 2.32 0.28
MACROHON 28.00 2.58 9.2 1109 6,387 6.88 0.83 2.40 0.36MALITBOG 32.58 2.69 8.3 978 5,809 8.50 0.98 3.08 0.44 PADRE BURGOS 26.48 3.13 11.8 1147 2,468 6.48 1.08 2.25 0.50 PINTUYAN 36.60 3.16 8.6 841 3,320 10.03 1.17 3.76 0.54SAINT BERNARD 36.30 3.04 8.4 851 8,537 9.59 1.13 3.51 0.53SAN FRANCISCO 32.14 3.21 10.0 989 3,687 8.37 1.14 3.04 0.51SAN JUAN (CABALIAN)
27.08 3.41 12.6 1138 3,694 6.76 1.16 2.38 0.51
SAN RICARDO 34.93 3.76 10.8 898 3,281 9.13 1.35 3.30 0.62SILAGO 28.70 3.81 13.3 1093 2,952 7.04 1.20 2.44 0.51SOGOD 28.50 2.53 8.9 1095 10,428 7.09 0.79 2.49 0.34TOMAS OPPUS 35.20 3.10 8.8 885 5,237 9.42 1.21 3.48 0.56LIMASAWA 34.76 5.46 15.7 909 1,818 8.84 1.98 3.12 0.88
Biliran ALMERIA 34.53 3.97 11.5 915 4,599 9.15 1.49 3.37 0.70BILIRAN 34.86 4.58 13.1 905 4,707 9.41 1.62 3.50 0.72CABUCGAYAN 41.38 4.97 12.0 671 7,261 11.62 1.89 4.44 0.88CAIBIRAN 40.19 3.41 8.5 710 7,761 11.16 1.39 4.24 0.67CULABA 41.87 3.23 7.7 654 4,184 11.96 1.34 4.64 0.66KAWAYAN 39.37 3.59 9.1 735 7,122 10.94 1.41 4.16 0.68MARIPIPI 36.68 3.65 10.0 836 2,466 10.08 1.39 3.81 0.67 NAVAL (Capital) 35.28 2.73 7.7 881 14,116 9.63 1.05 3.61 0.49
2003 City and Municipal Level Poverty Estimates Page 104 NSCB/WB Intercensal Updating of Small Area Poverty Estimates
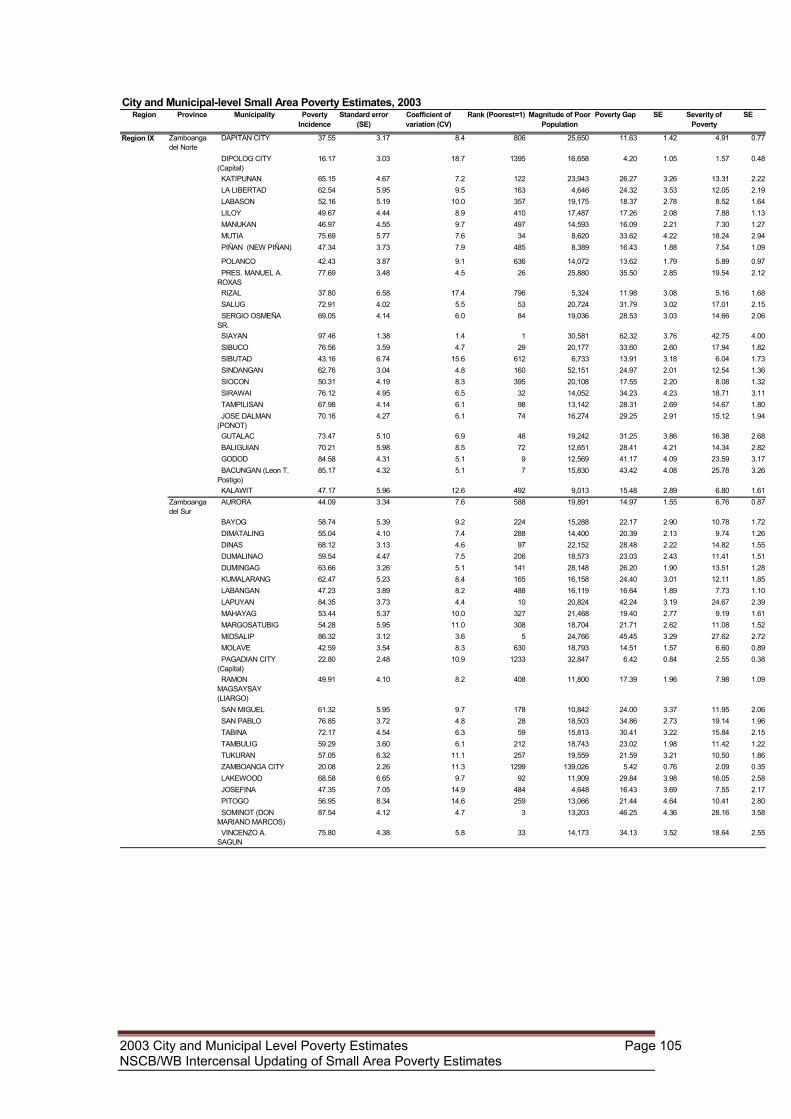
City and Municipal-level Small Area Poverty Estimates, 2003Region Province Municipality Poverty
IncidenceStandard error
(SE)Coefficient of variation (CV)
Rank (Poorest=1) Magnitude of Poor Population
Poverty Gap SE Severity of Poverty
SE
Region IX Zamboanga del Norte
DAPITAN CITY 37.55 3.17 8.4 806 25,650 11.63 1.42 4.91 0.77
DIPOLOG CITY (Capital)
16.17 3.03 18.7 1395 16,658 4.20 1.05 1.57 0.48
KATIPUNAN 65.15 4.67 7.2 122 23,943 26.27 3.26 13.31 2.22 LA LIBERTAD 62.54 5.95 9.5 163 4,646 24.32 3.53 12.05 2.19 LABASON 52.16 5.19 10.0 357 19,175 18.37 2.78 8.52 1.64 LILOY 49.67 4.44 8.9 410 17,487 17.26 2.08 7.88 1.13 MANUKAN 46.97 4.55 9.7 497 14,593 16.09 2.21 7.30 1.27 MUTIA 75.69 5.77 7.6 34 8,620 33.62 4.22 18.24 2.94 PIÑAN (NEW PIÑAN) 47.34 3.73 7.9 485 8,389 16.43 1.88 7.54 1.09
POLANCO 42.43 3.87 9.1 636 14,072 13.62 1.79 5.89 0.97 PRES. MANUEL A. ROXAS
77.69 3.48 4.5 26 25,880 35.50 2.85 19.54 2.12
RIZAL 37.80 6.58 17.4 796 5,324 11.98 3.08 5.16 1.68 SALUG 72.91 4.02 5.5 53 20,724 31.79 3.02 17.01 2.15 SERGIO OSMEÑA SR.
69.05 4.14 6.0 84 19,036 28.53 3.03 14.66 2.06
SIAYAN 97.46 1.38 1.4 1 30,581 62.32 3.76 42.75 4.00 SIBUCO 76.56 3.59 4.7 29 20,177 33.60 2.60 17.94 1.82 SIBUTAD 43.16 6.74 15.6 612 6,733 13.91 3.18 6.04 1.73 SINDANGAN 62.76 3.04 4.8 160 52,151 24.97 2.01 12.54 1.36 SIOCON 50.31 4.19 8.3 395 20,108 17.55 2.20 8.08 1.32 SIRAWAI 76.12 4.95 6.5 32 14,052 34.23 4.23 18.71 3.11 TAMPILISAN 67.98 4.14 6.1 98 13,142 28.31 2.69 14.67 1.80 JOSE DALMAN (PONOT)
70.16 4.27 6.1 74 16,274 29.25 2.91 15.12 1.94
GUTALAC 73.47 5.10 6.9 48 19,242 31.25 3.86 16.38 2.68 BALIGUIAN 70.21 5.98 8.5 72 12,651 28.41 4.21 14.34 2.82 GODOD 84.58 4.31 5.1 9 12,569 41.17 4.09 23.59 3.17 BACUNGAN (Leon T. Postigo)
85.17 4.32 5.1 7 15,830 43.42 4.08 25.78 3.26
KALAWIT 47.17 5.96 12.6 492 9,013 15.48 2.89 6.80 1.61Zamboanga del Sur
AURORA 44.09 3.34 7.6 588 19,891 14.97 1.55 6.76 0.87
BAYOG 58.74 5.39 9.2 224 15,288 22.17 2.90 10.78 1.72 DIMATALING 55.04 4.10 7.4 288 14,400 20.39 2.13 9.74 1.26 DINAS 68.12 3.13 4.6 97 22,152 28.48 2.22 14.82 1.55 DUMALINAO 59.54 4.47 7.5 206 18,573 23.03 2.43 11.41 1.51 DUMINGAG 63.66 3.26 5.1 141 28,148 26.20 1.90 13.51 1.28 KUMALARANG 62.47 5.23 8.4 165 16,158 24.40 3.01 12.11 1.85 LABANGAN 47.23 3.89 8.2 488 16,119 16.64 1.89 7.73 1.10 LAPUYAN 84.35 3.73 4.4 10 20,824 42.24 3.19 24.67 2.39 MAHAYAG 53.44 5.37 10.0 327 21,468 19.40 2.77 9.19 1.61 MARGOSATUBIG 54.28 5.95 11.0 308 18,704 21.71 2.62 11.08 1.52 MIDSALIP 86.32 3.12 3.6 5 24,766 45.45 3.29 27.62 2.72 MOLAVE 42.59 3.54 8.3 630 18,793 14.51 1.57 6.60 0.89 PAGADIAN CITY (Capital)
22.80 2.48 10.9 1233 32,847 6.42 0.84 2.55 0.38
RAMON MAGSAYSAY (LIARGO)
49.91 4.10 8.2 408 11,800 17.39 1.96 7.98 1.09
SAN MIGUEL 61.32 5.95 9.7 178 10,842 24.00 3.37 11.95 2.06 SAN PABLO 76.85 3.72 4.8 28 18,503 34.86 2.73 19.14 1.96 TABINA 72.17 4.54 6.3 59 15,813 30.41 3.22 15.84 2.15 TAMBULIG 59.29 3.60 6.1 212 18,743 23.02 1.98 11.42 1.22 TUKURAN 57.05 6.32 11.1 257 19,559 21.59 3.21 10.50 1.86 ZAMBOANGA CITY 20.08 2.26 11.3 1299 139,026 5.42 0.76 2.09 0.35 LAKEWOOD 68.58 6.65 9.7 92 11,909 29.84 3.98 16.05 2.58 JOSEFINA 47.35 7.05 14.9 484 4,648 16.43 3.69 7.55 2.17 PITOGO 56.95 8.34 14.6 259 13,066 21.44 4.64 10.41 2.80 SOMINOT (DON MARIANO MARCOS)
87.54 4.12 4.7 3 13,203 46.25 4.36 28.16 3.58
VINCENZO A. SAGUN
75.80 4.38 5.8 33 14,173 34.13 3.52 18.64 2.55
2003 City and Municipal Level Poverty Estimates Page 105 NSCB/WB Intercensal Updating of Small Area Poverty Estimates
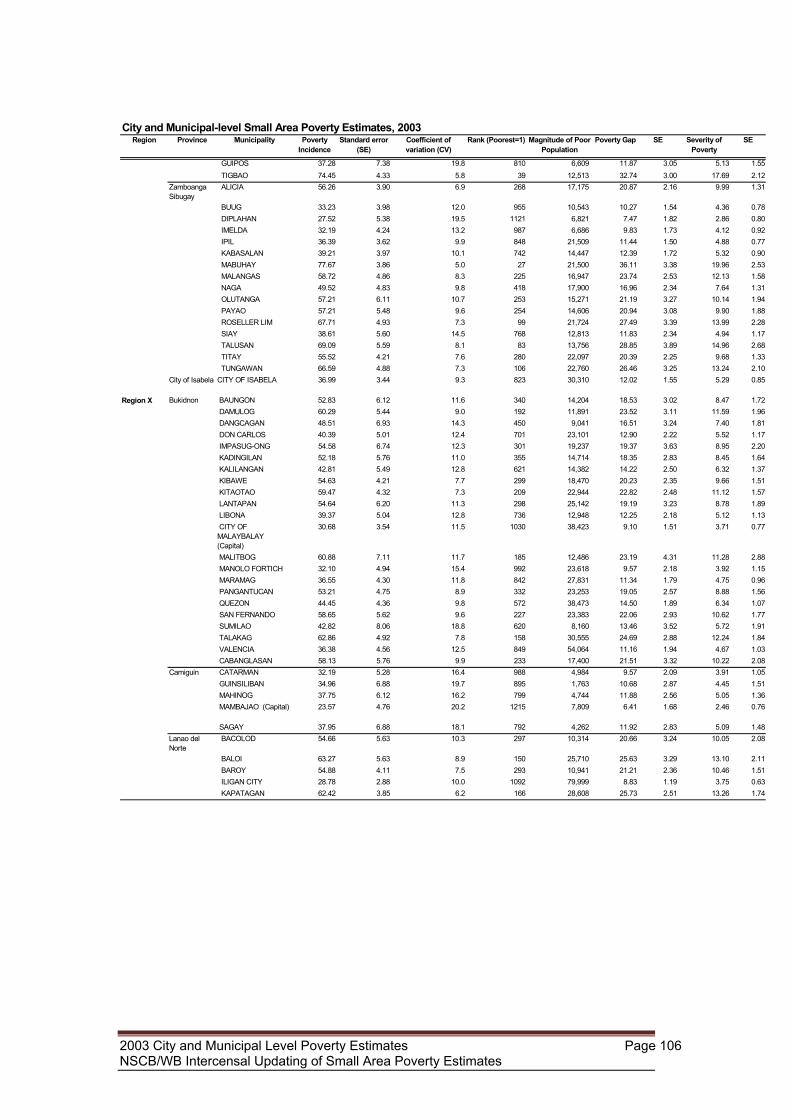
City and Municipal-level Small Area Poverty Estimates, 2003Region Province Municipality Poverty
IncidenceStandard error
(SE)Coefficient of variation (CV)
Rank (Poorest=1) Magnitude of Poor Population
Poverty Gap SE Severity of Poverty
SE
GUIPOS 37.28 7.38 19.8 810 6,609 11.87 3.05 5.13 1.55 TIGBAO 74.45 4.33 5.8 39 12,513 32.74 3.00 17.69 2.12
Zamboanga Sibugay
ALICIA 56.26 3.90 6.9 268 17,175 20.87 2.16 9.99 1.31
BUUG 33.23 3.98 12.0 955 10,543 10.27 1.54 4.36 0.78 DIPLAHAN 27.52 5.38 19.5 1121 6,821 7.47 1.82 2.86 0.80 IMELDA 32.19 4.24 13.2 987 6,686 9.83 1.73 4.12 0.92 IPIL 36.39 3.62 9.9 848 21,509 11.44 1.50 4.88 0.77 KABASALAN 39.21 3.97 10.1 742 14,447 12.39 1.72 5.32 0.90 MABUHAY 77.67 3.86 5.0 27 21,500 36.11 3.38 19.96 2.53 MALANGAS 58.72 4.86 8.3 225 16,947 23.74 2.53 12.13 1.58 NAGA 49.52 4.83 9.8 418 17,900 16.96 2.34 7.64 1.31 OLUTANGA 57.21 6.11 10.7 253 15,271 21.19 3.27 10.14 1.94 PAYAO 57.21 5.48 9.6 254 14,606 20.94 3.08 9.90 1.88 ROSELLER LIM 67.71 4.93 7.3 99 21,724 27.49 3.39 13.99 2.28 SIAY 38.61 5.60 14.5 768 12,813 11.83 2.34 4.94 1.17 TALUSAN 69.09 5.59 8.1 83 13,756 28.85 3.89 14.96 2.68 TITAY 55.52 4.21 7.6 280 22,097 20.39 2.25 9.68 1.33 TUNGAWAN 66.59 4.88 7.3 106 22,760 26.46 3.25 13.24 2.10
City of Isabela CITY OF ISABELA 36.99 3.44 9.3 823 30,310 12.02 1.55 5.29 0.85
Region X Bukidnon BAUNGON 52.83 6.12 11.6 340 14,204 18.53 3.02 8.47 1.72 DAMULOG 60.29 5.44 9.0 192 11,891 23.52 3.11 11.59 1.96 DANGCAGAN 48.51 6.93 14.3 450 9,041 16.51 3.24 7.40 1.81 DON CARLOS 40.39 5.01 12.4 701 23,101 12.90 2.22 5.52 1.17 IMPASUG-ONG 54.58 6.74 12.3 301 19,237 19.37 3.63 8.95 2.20 KADINGILAN 52.18 5.76 11.0 355 14,714 18.35 2.83 8.45 1.64 KALILANGAN 42.81 5.49 12.8 621 14,382 14.22 2.50 6.32 1.37 KIBAWE 54.63 4.21 7.7 299 18,470 20.23 2.35 9.66 1.51 KITAOTAO 59.47 4.32 7.3 209 22,944 22.82 2.48 11.12 1.57 LANTAPAN 54.64 6.20 11.3 298 25,142 19.19 3.23 8.78 1.89 LIBONA 39.37 5.04 12.8 736 12,948 12.25 2.18 5.12 1.13 CITY OF MALAYBALAY (Capital)
30.68 3.54 11.5 1030 38,423 9.10 1.51 3.71 0.77
MALITBOG 60.88 7.11 11.7 185 12,486 23.19 4.31 11.28 2.88 MANOLO FORTICH 32.10 4.94 15.4 992 23,618 9.57 2.18 3.92 1.15 MARAMAG 36.55 4.30 11.8 842 27,831 11.34 1.79 4.75 0.96 PANGANTUCAN 53.21 4.75 8.9 332 23,253 19.05 2.57 8.88 1.56 QUEZON 44.45 4.36 9.8 572 38,473 14.50 1.89 6.34 1.07 SAN FERNANDO 58.65 5.62 9.6 227 23,383 22.06 2.93 10.62 1.77 SUMILAO 42.82 8.06 18.8 620 8,160 13.46 3.52 5.72 1.91 TALAKAG 62.86 4.92 7.8 158 30,555 24.69 2.88 12.24 1.84 VALENCIA 36.38 4.56 12.5 849 54,064 11.16 1.94 4.67 1.03 CABANGLASAN 58.13 5.76 9.9 233 17,400 21.51 3.32 10.22 2.08
Camiguin CATARMAN 32.19 5.28 16.4 988 4,984 9.57 2.09 3.91 1.05 GUINSILIBAN 34.96 6.88 19.7 895 1,763 10.68 2.87 4.45 1.51 MAHINOG 37.75 6.12 16.2 799 4,744 11.88 2.56 5.05 1.36 MAMBAJAO (Capital) 23.57 4.76 20.2 1215 7,809 6.41 1.68 2.46 0.76
SAGAY 37.95 6.88 18.1 792 4,262 11.92 2.83 5.09 1.48Lanao del Norte
BACOLOD 54.66 5.63 10.3 297 10,314 20.66 3.24 10.05 2.08
BALOI 63.27 5.63 8.9 150 25,710 25.63 3.29 13.10 2.11 BAROY 54.88 4.11 7.5 293 10,941 21.21 2.36 10.46 1.51 ILIGAN CITY 28.78 2.88 10.0 1092 79,999 8.83 1.19 3.75 0.63 KAPATAGAN 62.42 3.85 6.2 166 28,608 25.73 2.51 13.26 1.74
2003 City and Municipal Level Poverty Estimates Page 106 NSCB/WB Intercensal Updating of Small Area Poverty Estimates

City and Municipal-level Small Area Poverty Estimates, 2003Region Province Municipality Poverty
IncidenceStandard error
(SE)Coefficient of variation (CV)
Rank (Poorest=1) Magnitude of Poor Population
Poverty Gap SE Severity of Poverty
SE
SULTAN NAGA DIMAPORO (KAROMATAN)
72.27 3.87 5.4 58 30,405 32.56 2.74 17.82 1.99
KAUSWAGAN 54.09 5.76 10.6 311 12,016 20.33 3.26 9.84 2.02 KOLAMBUGAN 55.21 4.12 7.5 283 13,450 21.56 2.31 10.76 1.47 LALA 59.79 4.37 7.3 200 32,224 23.82 2.53 12.01 1.59 LINAMON 46.95 7.53 16.0 498 7,244 16.59 3.57 7.69 2.03 MAGSAYSAY 75.06 3.43 4.6 36 9,089 35.07 3.02 19.74 2.43 MAIGO 53.77 5.90 11.0 322 9,480 20.29 3.14 9.88 1.90 MATUNGAO 74.04 4.81 6.5 43 6,779 34.31 4.08 19.25 3.25 MUNAI 72.00 4.79 6.7 61 13,687 30.75 3.08 16.21 2.06 NUNUNGAN 74.27 4.42 6.0 41 9,507 33.45 3.26 18.30 2.35 PANTAO RAGAT 74.03 5.39 7.3 44 13,690 34.46 4.72 19.34 3.59 POONA PIAGAPO 81.68 4.26 5.2 14 15,379 39.83 4.05 23.08 3.24 SALVADOR 73.67 5.04 6.8 46 16,374 34.07 3.83 19.01 2.83 SAPAD 72.42 5.42 7.5 56 11,667 32.18 3.63 17.43 2.54 TAGOLOAN 77.89 7.00 9.0 24 6,976 35.21 5.68 19.25 4.17 TANGCAL 86.72 4.83 5.6 4 7,730 46.55 5.90 28.78 5.13 TUBOD (Capital) 52.72 5.08 9.6 342 21,537 19.68 2.74 9.49 1.69 PANTAR 67.20 5.49 8.2 101 9,580 29.88 3.99 16.30 2.86
Misamis Occidental
ALORAN 49.45 3.99 8.1 421 11,334 17.72 2.18 8.30 1.30
BALIANGAO 60.51 5.55 9.2 190 9,065 23.83 3.39 11.86 2.21 BONIFACIO 64.09 4.21 6.6 136 17,711 26.26 2.84 13.48 1.91 CALAMBA 48.06 4.93 10.3 465 9,200 17.42 2.55 8.24 1.53 CLARIN 46.41 3.85 8.3 512 14,805 16.26 2.02 7.51 1.20 CONCEPCION 72.36 4.47 6.2 57 5,084 31.20 3.42 16.49 2.48 JIMENEZ 38.05 4.60 12.1 788 9,146 12.59 2.14 5.58 1.21 LOPEZ JAENA 58.96 4.86 8.2 220 12,784 22.88 3.12 11.29 2.04 OROQUIETA CITY (Capital)
37.59 3.38 9.0 802 23,475 12.45 1.50 5.55 0.83
OZAMIS CITY 37.06 3.00 8.1 821 42,859 12.07 1.38 5.29 0.77 PANAON 41.56 4.99 12.0 663 3,860 13.83 2.35 6.14 1.32 PLARIDEL 50.02 4.52 9.0 403 16,238 18.18 2.42 8.58 1.44 SAPANG DALAGA 56.10 5.37 9.6 269 8,678 21.24 2.90 10.30 1.73 SINACABAN 50.83 5.36 10.5 379 8,533 18.41 3.01 8.65 1.85 TANGUB CITY 57.15 3.33 5.8 255 31,335 21.98 2.09 10.79 1.37 TUDELA 53.18 3.95 7.4 333 12,397 20.03 2.18 9.71 1.36DON VICTORIANO CHIONGBIAN (DON MARIANO MARCOS)
71.99 6.21 8.6 62 6,808 30.81 3.98 16.25 2.62
Misamis Oriental
ALUBIJID 50.69 5.46 10.8 381 12,339 18.26 2.93 8.60 1.77
BALINGASAG 49.21 3.98 8.1 433 27,521 17.68 2.11 8.29 1.27 BALINGOAN 46.07 7.05 15.3 523 4,020 16.57 3.39 7.84 1.96 BINUANGAN 42.42 7.14 16.8 637 2,755 13.98 3.39 6.13 1.87 CAGAYAN DE ORO CITY (Capital)
15.50 2.35 15.2 1412 77,305 4.10 0.78 1.55 0.35
CLAVERIA 50.38 4.77 9.5 392 20,043 17.65 2.53 8.09 1.50 EL SALVADOR 41.64 5.56 13.4 659 16,556 13.93 2.60 6.22 1.44 GINGOOG CITY 47.26 2.60 5.5 487 52,383 16.68 1.37 7.73 0.84 GITAGUM 44.68 6.43 14.4 565 6,406 14.81 2.93 6.54 1.64
2003 City and Municipal Level Poverty Estimates Page 107 NSCB/WB Intercensal Updating of Small Area Poverty Estimates
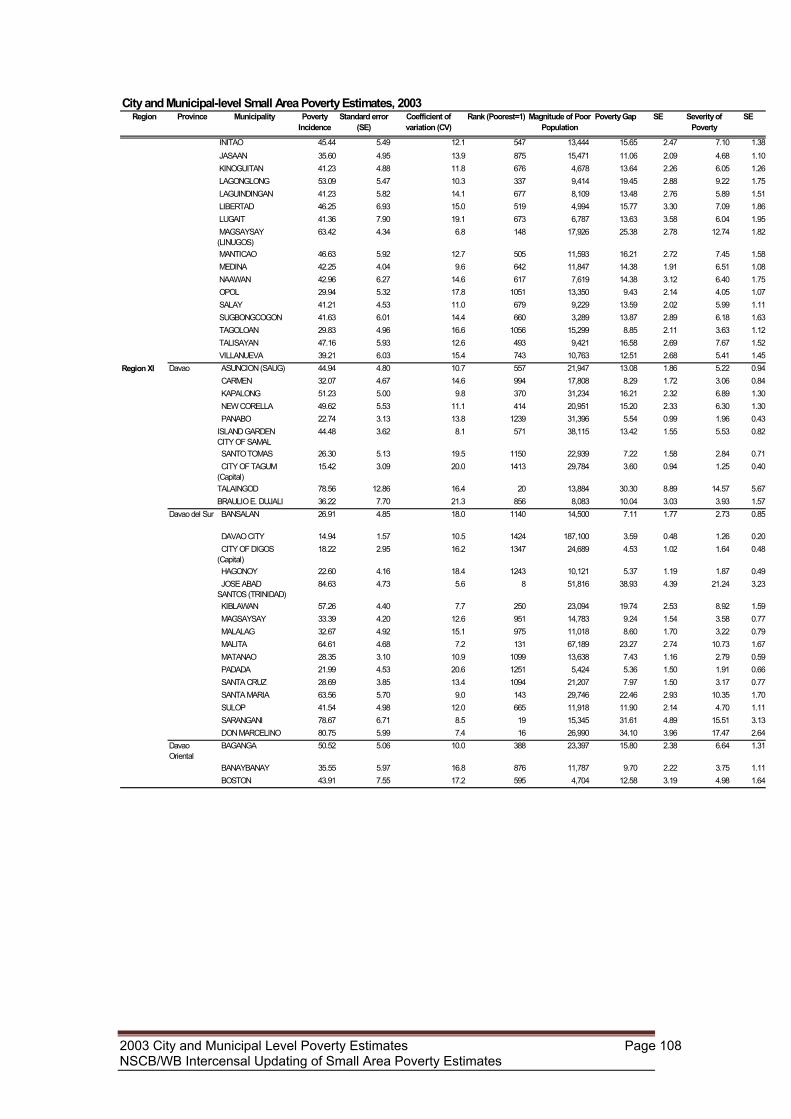
City and Municipal-level Small Area Poverty Estimates, 2003Region Province Municipality Poverty
IncidenceStandard error
(SE)Coefficient of variation (CV)
Rank (Poorest=1) Magnitude of Poor Population
Poverty Gap SE Severity of Poverty
SE
INITAO 45.44 5.49 12.1 547 13,444 15.65 2.47 7.10 1.38 JASAAN 35.60 4.95 13.9 875 15,471 11.06 2.09 4.68 1.10 KINOGUITAN 41.23 4.88 11.8 676 4,678 13.64 2.26 6.05 1.26 LAGONGLONG 53.09 5.47 10.3 337 9,414 19.45 2.88 9.22 1.75 LAGUINDINGAN 41.23 5.82 14.1 677 8,109 13.48 2.76 5.89 1.51 LIBERTAD 46.25 6.93 15.0 519 4,994 15.77 3.30 7.09 1.86 LUGAIT 41.36 7.90 19.1 673 6,787 13.63 3.58 6.04 1.95 MAGSAYSAY (LINUGOS)
63.42 4.34 6.8 148 17,926 25.38 2.78 12.74 1.82
MANTICAO 46.63 5.92 12.7 505 11,593 16.21 2.72 7.45 1.58 MEDINA 42.25 4.04 9.6 642 11,847 14.38 1.91 6.51 1.08 NAAWAN 42.96 6.27 14.6 617 7,619 14.38 3.12 6.40 1.75 OPOL 29.94 5.32 17.8 1051 13,350 9.43 2.14 4.05 1.07 SALAY 41.21 4.53 11.0 679 9,229 13.59 2.02 5.99 1.11 SUGBONGCOGON 41.63 6.01 14.4 660 3,289 13.87 2.89 6.18 1.63 TAGOLOAN 29.83 4.96 16.6 1056 15,299 8.85 2.11 3.63 1.12 TALISAYAN 47.16 5.93 12.6 493 9,421 16.58 2.69 7.67 1.52 VILLANUEVA 39.21 6.03 15.4 743 10,763 12.51 2.68 5.41 1.45
Region XI Davao ASUNCION (SAUG) 44.94 4.80 10.7 557 21,947 13.08 1.86 5.22 0.94 CARMEN 32.07 4.67 14.6 994 17,808 8.29 1.72 3.06 0.84 KAPALONG 51.23 5.00 9.8 370 31,234 16.21 2.32 6.89 1.30 NEW CORELLA 49.62 5.53 11.1 414 20,951 15.20 2.33 6.30 1.30 PANABO 22.74 3.13 13.8 1239 31,396 5.54 0.99 1.96 0.43ISLAND GARDEN CITY OF SAMAL
44.48 3.62 8.1 571 38,115 13.42 1.55 5.53 0.82
SANTO TOMAS 26.30 5.13 19.5 1150 22,939 7.22 1.58 2.84 0.71 CITY OF TAGUM (Capital)
15.42 3.09 20.0 1413 29,784 3.60 0.94 1.25 0.40
TALAINGOD 78.56 12.86 16.4 20 13,884 30.30 8.89 14.57 5.67BRAULIO E. DUJALI 36.22 7.70 21.3 856 8,083 10.04 3.03 3.93 1.57
Davao del Sur BANSALAN 26.91 4.85 18.0 1140 14,500 7.11 1.77 2.73 0.85
DAVAO CITY 14.94 1.57 10.5 1424 187,100 3.59 0.48 1.26 0.20 CITY OF DIGOS (Capital)
18.22 2.95 16.2 1347 24,689 4.53 1.02 1.64 0.48
HAGONOY 22.60 4.16 18.4 1243 10,121 5.37 1.19 1.87 0.49 JOSE ABAD SANTOS (TRINIDAD)
84.63 4.73 5.6 8 51,816 38.93 4.39 21.24 3.23
KIBLAWAN 57.26 4.40 7.7 250 23,094 19.74 2.53 8.92 1.59 MAGSAYSAY 33.39 4.20 12.6 951 14,783 9.24 1.54 3.58 0.77 MALALAG 32.67 4.92 15.1 975 11,018 8.60 1.70 3.22 0.79 MALITA 64.61 4.68 7.2 131 67,189 23.27 2.74 10.73 1.67 MATANAO 28.35 3.10 10.9 1099 13,638 7.43 1.16 2.79 0.59 PADADA 21.99 4.53 20.6 1251 5,424 5.36 1.50 1.91 0.66 SANTA CRUZ 28.69 3.85 13.4 1094 21,207 7.97 1.50 3.17 0.77 SANTA MARIA 63.56 5.70 9.0 143 29,746 22.46 2.93 10.35 1.70 SULOP 41.54 4.98 12.0 665 11,918 11.90 2.14 4.70 1.11 SARANGANI 78.67 6.71 8.5 19 15,345 31.61 4.89 15.51 3.13 DON MARCELINO 80.75 5.99 7.4 16 26,990 34.10 3.96 17.47 2.64
Davao Oriental
BAGANGA 50.52 5.06 10.0 388 23,397 15.80 2.38 6.64 1.31
BANAYBANAY 35.55 5.97 16.8 876 11,787 9.70 2.22 3.75 1.11 BOSTON 43.91 7.55 17.2 595 4,704 12.58 3.19 4.98 1.64
2003 City and Municipal Level Poverty Estimates Page 108 NSCB/WB Intercensal Updating of Small Area Poverty Estimates
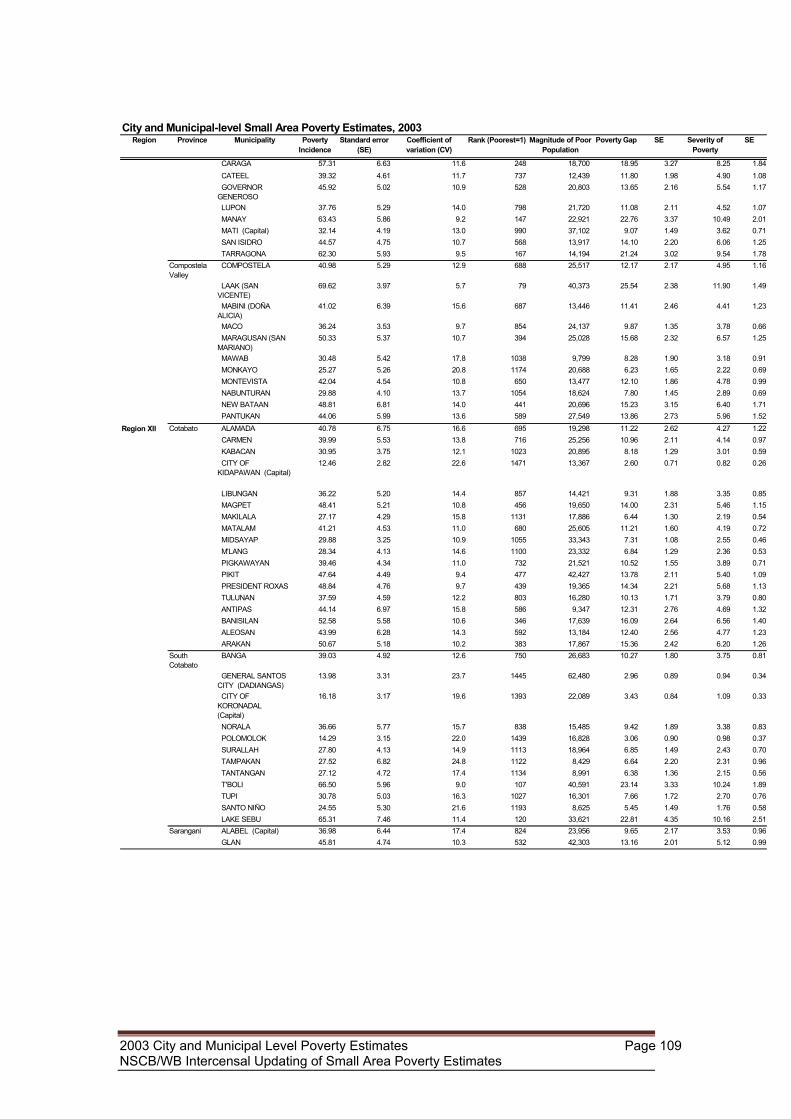
City and Municipal-level Small Area Poverty Estimates, 2003Region Province Municipality Poverty
IncidenceStandard error
(SE)Coefficient of variation (CV)
Rank (Poorest=1) Magnitude of Poor Population
Poverty Gap SE Severity of Poverty
SE
CARAGA 57.31 6.63 11.6 248 18,700 18.95 3.27 8.25 1.84 CATEEL 39.32 4.61 11.7 737 12,439 11.80 1.98 4.90 1.08 GOVERNOR GENEROSO
45.92 5.02 10.9 528 20,803 13.65 2.16 5.54 1.17
LUPON 37.76 5.29 14.0 798 21,720 11.08 2.11 4.52 1.07 MANAY 63.43 5.86 9.2 147 22,921 22.76 3.37 10.49 2.01 MATI (Capital) 32.14 4.19 13.0 990 37,102 9.07 1.49 3.62 0.71 SAN ISIDRO 44.57 4.75 10.7 568 13,917 14.10 2.20 6.06 1.25 TARRAGONA 62.30 5.93 9.5 167 14,194 21.24 3.02 9.54 1.78
Compostela Valley
COMPOSTELA 40.98 5.29 12.9 688 25,517 12.17 2.17 4.95 1.16
LAAK (SAN VICENTE)
69.62 3.97 5.7 79 40,373 25.54 2.38 11.90 1.49
MABINI (DOÑA ALICIA)
41.02 6.39 15.6 687 13,446 11.41 2.46 4.41 1.23
MACO 36.24 3.53 9.7 854 24,137 9.87 1.35 3.78 0.66 MARAGUSAN (SAN MARIANO)
50.33 5.37 10.7 394 25,028 15.68 2.32 6.57 1.25
MAWAB 30.48 5.42 17.8 1038 9,799 8.28 1.90 3.18 0.91 MONKAYO 25.27 5.26 20.8 1174 20,688 6.23 1.65 2.22 0.69 MONTEVISTA 42.04 4.54 10.8 650 13,477 12.10 1.86 4.78 0.99 NABUNTURAN 29.88 4.10 13.7 1054 18,624 7.80 1.45 2.89 0.69 NEW BATAAN 48.81 6.81 14.0 441 20,696 15.23 3.15 6.40 1.71 PANTUKAN 44.06 5.99 13.6 589 27,549 13.86 2.73 5.96 1.52
Region XII Cotabato ALAMADA 40.78 6.75 16.6 695 19,298 11.22 2.62 4.27 1.22 CARMEN 39.99 5.53 13.8 716 25,256 10.96 2.11 4.14 0.97 KABACAN 30.95 3.75 12.1 1023 20,895 8.18 1.29 3.01 0.59 CITY OF KIDAPAWAN (Capital)
12.46 2.82 22.6 1471 13,367 2.60 0.71 0.82 0.26
LIBUNGAN 36.22 5.20 14.4 857 14,421 9.31 1.88 3.35 0.85 MAGPET 48.41 5.21 10.8 456 19,650 14.00 2.31 5.46 1.15 MAKILALA 27.17 4.29 15.8 1131 17,886 6.44 1.30 2.19 0.54 MATALAM 41.21 4.53 11.0 680 25,605 11.21 1.60 4.19 0.72 MIDSAYAP 29.88 3.25 10.9 1055 33,343 7.31 1.08 2.55 0.46 M'LANG 28.34 4.13 14.6 1100 23,332 6.84 1.29 2.36 0.53 PIGKAWAYAN 39.46 4.34 11.0 732 21,521 10.52 1.55 3.89 0.71 PIKIT 47.64 4.49 9.4 477 42,427 13.78 2.11 5.40 1.09 PRESIDENT ROXAS 48.84 4.76 9.7 439 19,365 14.34 2.21 5.68 1.13 TULUNAN 37.59 4.59 12.2 803 16,280 10.13 1.71 3.79 0.80 ANTIPAS 44.14 6.97 15.8 586 9,347 12.31 2.76 4.69 1.32 BANISILAN 52.58 5.58 10.6 346 17,639 16.09 2.64 6.56 1.40 ALEOSAN 43.99 6.28 14.3 592 13,184 12.40 2.56 4.77 1.23 ARAKAN 50.67 5.18 10.2 383 17,867 15.36 2.42 6.20 1.26
South Cotabato
BANGA 39.03 4.92 12.6 750 26,683 10.27 1.80 3.75 0.81
GENERAL SANTOS CITY (DADIANGAS)
13.98 3.31 23.7 1445 62,480 2.96 0.89 0.94 0.34
CITY OF KORONADAL (Capital)
16.18 3.17 19.6 1393 22,089 3.43 0.84 1.09 0.33
NORALA 36.66 5.77 15.7 838 15,485 9.42 1.89 3.38 0.83 POLOMOLOK 14.29 3.15 22.0 1439 16,828 3.06 0.90 0.98 0.37 SURALLAH 27.80 4.13 14.9 1113 18,964 6.85 1.49 2.43 0.70 TAMPAKAN 27.52 6.82 24.8 1122 8,429 6.64 2.20 2.31 0.96 TANTANGAN 27.12 4.72 17.4 1134 8,991 6.38 1.36 2.15 0.56 T'BOLI 66.50 5.96 9.0 107 40,591 23.14 3.33 10.24 1.89 TUPI 30.78 5.03 16.3 1027 16,301 7.66 1.72 2.70 0.76 SANTO NIÑO 24.55 5.30 21.6 1193 8,625 5.45 1.49 1.76 0.58 LAKE SEBU 65.31 7.46 11.4 120 33,621 22.81 4.35 10.16 2.51
Sarangani ALABEL (Capital) 36.98 6.44 17.4 824 23,956 9.65 2.17 3.53 0.96 GLAN 45.81 4.74 10.3 532 42,303 13.16 2.01 5.12 0.99
2003 City and Municipal Level Poverty Estimates Page 109 NSCB/WB Intercensal Updating of Small Area Poverty Estimates
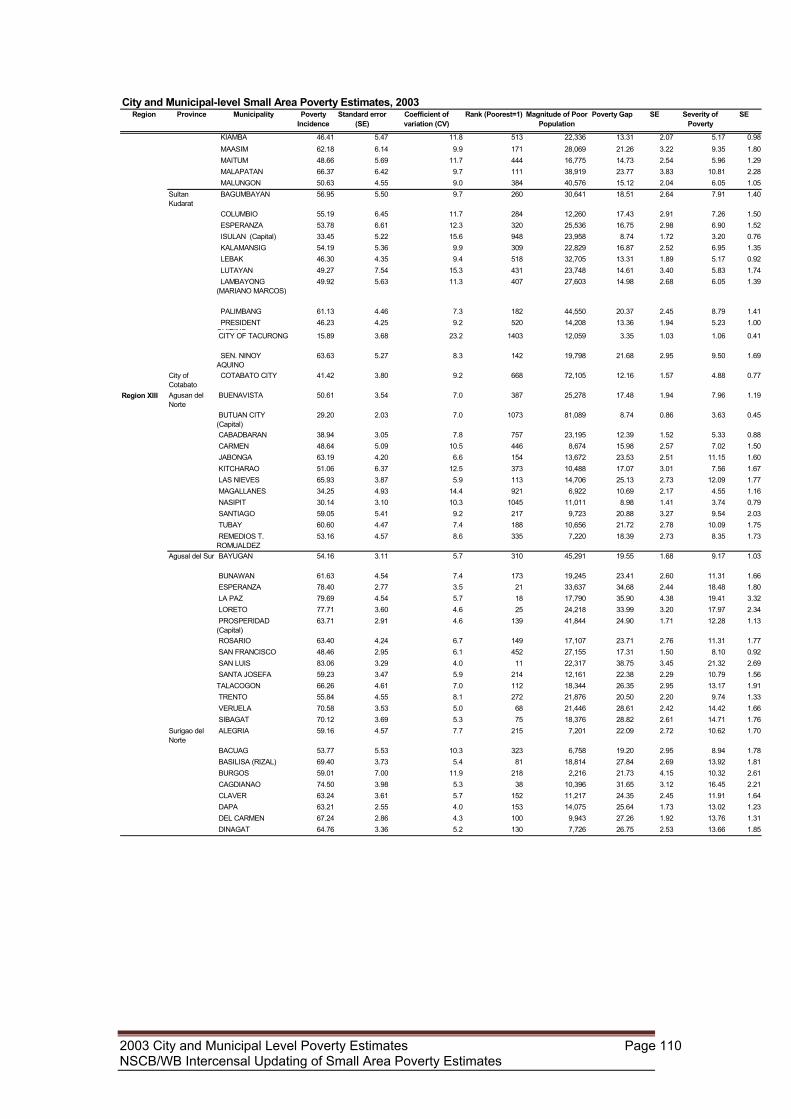
City and Municipal-level Small Area Poverty Estimates, 2003Region Province Municipality Poverty
IncidenceStandard error
(SE)Coefficient of variation (CV)
Rank (Poorest=1) Magnitude of Poor Population
Poverty Gap SE Severity of Poverty
SE
KIAMBA 46.41 5.47 11.8 513 22,336 13.31 2.07 5.17 0.98 MAASIM 62.18 6.14 9.9 171 28,069 21.26 3.22 9.35 1.80 MAITUM 48.66 5.69 11.7 444 16,775 14.73 2.54 5.96 1.29 MALAPATAN 66.37 6.42 9.7 111 38,919 23.77 3.83 10.81 2.28 MALUNGON 50.63 4.55 9.0 384 40,576 15.12 2.04 6.05 1.05
Sultan Kudarat
BAGUMBAYAN 56.95 5.50 9.7 260 30,641 18.51 2.64 7.91 1.40
COLUMBIO 55.19 6.45 11.7 284 12,260 17.43 2.91 7.26 1.50 ESPERANZA 53.78 6.61 12.3 320 25,536 16.75 2.98 6.90 1.52 ISULAN (Capital) 33.45 5.22 15.6 948 23,958 8.74 1.72 3.20 0.76 KALAMANSIG 54.19 5.36 9.9 309 22,829 16.87 2.52 6.95 1.35 LEBAK 46.30 4.35 9.4 518 32,705 13.31 1.89 5.17 0.92 LUTAYAN 49.27 7.54 15.3 431 23,748 14.61 3.40 5.83 1.74 LAMBAYONG (MARIANO MARCOS)
49.92 5.63 11.3 407 27,603 14.98 2.68 6.05 1.39
PALIMBANG 61.13 4.46 7.3 182 44,550 20.37 2.45 8.79 1.41 PRESIDENT QUIRINO
46.23 4.25 9.2 520 14,208 13.36 1.94 5.23 1.00
CITY OF TACURONG 15.89 3.68 23.2 1403 12,059 3.35 1.03 1.06 0.41
SEN. NINOY AQUINO
63.63 5.27 8.3 142 19,798 21.68 2.95 9.50 1.69
City of Cotabato
COTABATO CITY 41.42 3.80 9.2 668 72,105 12.16 1.57 4.88 0.77
Region XIII Agusan del Norte
BUENAVISTA 50.61 3.54 7.0 387 25,278 17.48 1.94 7.96 1.19
BUTUAN CITY (Capital)
29.20 2.03 7.0 1073 81,089 8.74 0.86 3.63 0.45
CABADBARAN 38.94 3.05 7.8 757 23,195 12.39 1.52 5.33 0.88 CARMEN 48.64 5.09 10.5 446 8,674 15.98 2.57 7.02 1.50 JABONGA 63.19 4.20 6.6 154 13,672 23.53 2.51 11.15 1.60 KITCHARAO 51.06 6.37 12.5 373 10,488 17.07 3.01 7.56 1.67 LAS NIEVES 65.93 3.87 5.9 113 14,706 25.13 2.73 12.09 1.77 MAGALLANES 34.25 4.93 14.4 921 6,922 10.69 2.17 4.55 1.16 NASIPIT 30.14 3.10 10.3 1045 11,011 8.98 1.41 3.74 0.79 SANTIAGO 59.05 5.41 9.2 217 9,723 20.88 3.27 9.54 2.03 TUBAY 60.60 4.47 7.4 188 10,656 21.72 2.78 10.09 1.75 REMEDIOS T. ROMUALDEZ
53.16 4.57 8.6 335 7,220 18.39 2.73 8.35 1.73
Agusal del Sur BAYUGAN 54.16 3.11 5.7 310 45,291 19.55 1.68 9.17 1.03
BUNAWAN 61.63 4.54 7.4 173 19,245 23.41 2.60 11.31 1.66 ESPERANZA 78.40 2.77 3.5 21 33,637 34.68 2.44 18.48 1.80 LA PAZ 79.69 4.54 5.7 18 17,790 35.90 4.38 19.41 3.32 LORETO 77.71 3.60 4.6 25 24,218 33.99 3.20 17.97 2.34 PROSPERIDAD (Capital)
63.71 2.91 4.6 139 41,844 24.90 1.71 12.28 1.13
ROSARIO 63.40 4.24 6.7 149 17,107 23.71 2.76 11.31 1.77 SAN FRANCISCO 48.46 2.95 6.1 452 27,155 17.31 1.50 8.10 0.92 SAN LUIS 83.06 3.29 4.0 11 22,317 38.75 3.45 21.32 2.69 SANTA JOSEFA 59.23 3.47 5.9 214 12,161 22.38 2.29 10.79 1.56TALACOGON 66.26 4.61 7.0 112 18,344 26.35 2.95 13.17 1.91 TRENTO 55.84 4.55 8.1 272 21,876 20.50 2.20 9.74 1.33 VERUELA 70.58 3.53 5.0 68 21,446 28.61 2.42 14.42 1.66 SIBAGAT 70.12 3.69 5.3 75 18,376 28.82 2.61 14.71 1.76
Surigao del Norte
ALEGRIA 59.16 4.57 7.7 215 7,201 22.09 2.72 10.62 1.70
BACUAG 53.77 5.53 10.3 323 6,758 19.20 2.95 8.94 1.78 BASILISA (RIZAL) 69.40 3.73 5.4 81 18,814 27.84 2.69 13.92 1.81 BURGOS 59.01 7.00 11.9 218 2,216 21.73 4.15 10.32 2.61 CAGDIANAO 74.50 3.98 5.3 38 10,396 31.65 3.12 16.45 2.21 CLAVER 63.24 3.61 5.7 152 11,217 24.35 2.45 11.91 1.64 DAPA 63.21 2.55 4.0 153 14,075 25.64 1.73 13.02 1.23 DEL CARMEN 67.24 2.86 4.3 100 9,943 27.26 1.92 13.76 1.31 DINAGAT 64.76 3.36 5.2 130 7,726 26.75 2.53 13.66 1.85
2003 City and Municipal Level Poverty Estimates Page 110 NSCB/WB Intercensal Updating of Small Area Poverty Estimates
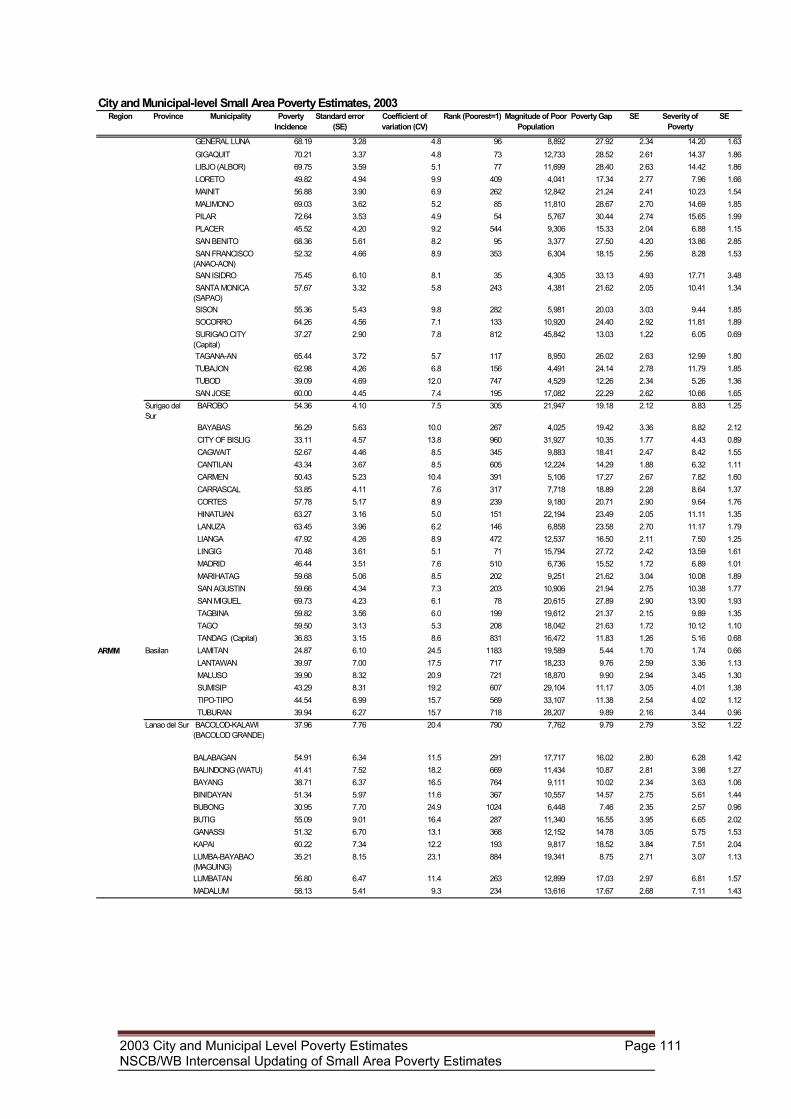
City and Municipal-level Small Area Poverty Estimates, 2003Region Province Municipality Poverty
IncidenceStandard error
(SE)Coefficient of variation (CV)
Rank (Poorest=1) Magnitude of Poor Population
Poverty Gap SE Severity of Poverty
SE
GENERAL LUNA 68.19 3.28 4.8 96 8,892 27.92 2.34 14.20 1.63 GIGAQUIT 70.21 3.37 4.8 73 12,733 28.52 2.61 14.37 1.86 LIBJO (ALBOR) 69.75 3.59 5.1 77 11,699 28.40 2.63 14.42 1.86 LORETO 49.82 4.94 9.9 409 4,041 17.34 2.77 7.96 1.66 MAINIT 56.88 3.90 6.9 262 12,842 21.24 2.41 10.23 1.54 MALIMONO 69.03 3.62 5.2 85 11,810 28.67 2.70 14.69 1.85 PILAR 72.64 3.53 4.9 54 5,767 30.44 2.74 15.65 1.99 PLACER 45.52 4.20 9.2 544 9,306 15.33 2.04 6.88 1.15 SAN BENITO 68.36 5.61 8.2 95 3,377 27.50 4.20 13.86 2.85 SAN FRANCISCO (ANAO-AON)
52.32 4.66 8.9 353 6,304 18.15 2.56 8.28 1.53
SAN ISIDRO 75.45 6.10 8.1 35 4,305 33.13 4.93 17.71 3.48 SANTA MONICA (SAPAO)
57.67 3.32 5.8 243 4,381 21.62 2.05 10.41 1.34
SISON 55.36 5.43 9.8 282 5,981 20.03 3.03 9.44 1.85 SOCORRO 64.26 4.56 7.1 133 10,920 24.40 2.92 11.81 1.89 SURIGAO CITY (Capital)
37.27 2.90 7.8 812 45,842 13.03 1.22 6.05 0.69
TAGANA-AN 65.44 3.72 5.7 117 8,950 26.02 2.63 12.99 1.80 TUBAJON 62.98 4.26 6.8 156 4,491 24.14 2.78 11.79 1.85 TUBOD 39.09 4.69 12.0 747 4,529 12.26 2.34 5.26 1.36 SAN JOSE 60.00 4.45 7.4 195 17,082 22.29 2.62 10.66 1.65
Surigao del Sur
BAROBO 54.36 4.10 7.5 305 21,947 19.18 2.12 8.83 1.25
BAYABAS 56.29 5.63 10.0 267 4,025 19.42 3.36 8.82 2.12 CITY OF BISLIG 33.11 4.57 13.8 960 31,927 10.35 1.77 4.43 0.89 CAGWAIT 52.67 4.46 8.5 345 9,883 18.41 2.47 8.42 1.55 CANTILAN 43.34 3.67 8.5 605 12,224 14.29 1.88 6.32 1.11 CARMEN 50.43 5.23 10.4 391 5,106 17.27 2.67 7.82 1.60 CARRASCAL 53.85 4.11 7.6 317 7,718 18.89 2.28 8.64 1.37 CORTES 57.78 5.17 8.9 239 9,180 20.71 2.90 9.64 1.76 HINATUAN 63.27 3.16 5.0 151 22,194 23.49 2.05 11.11 1.35 LANUZA 63.45 3.96 6.2 146 6,858 23.58 2.70 11.17 1.79 LIANGA 47.92 4.26 8.9 472 12,537 16.50 2.11 7.50 1.25 LINGIG 70.48 3.61 5.1 71 15,794 27.72 2.42 13.59 1.61 MADRID 46.44 3.51 7.6 510 6,736 15.52 1.72 6.89 1.01 MARIHATAG 59.68 5.06 8.5 202 9,251 21.62 3.04 10.08 1.89 SAN AGUSTIN 59.66 4.34 7.3 203 10,906 21.94 2.75 10.38 1.77 SAN MIGUEL 69.73 4.23 6.1 78 20,615 27.89 2.90 13.90 1.93 TAGBINA 59.82 3.56 6.0 199 19,612 21.37 2.15 9.89 1.35 TAGO 59.50 3.13 5.3 208 18,042 21.63 1.72 10.12 1.10 TANDAG (Capital) 36.83 3.15 8.6 831 16,472 11.83 1.26 5.16 0.68
ARMM Basilan LAMITAN 24.87 6.10 24.5 1183 19,589 5.44 1.70 1.74 0.66 LANTAWAN 39.97 7.00 17.5 717 18,233 9.76 2.59 3.36 1.13 MALUSO 39.90 8.32 20.9 721 18,870 9.90 2.94 3.45 1.30 SUMISIP 43.29 8.31 19.2 607 29,104 11.17 3.05 4.01 1.38 TIPO-TIPO 44.54 6.99 15.7 569 33,107 11.38 2.54 4.02 1.12 TUBURAN 39.94 6.27 15.7 718 28,207 9.89 2.16 3.44 0.96
Lanao del Sur BACOLOD-KALAWI (BACOLOD GRANDE)
37.96 7.76 20.4 790 7,762 9.79 2.79 3.52 1.22
BALABAGAN 54.91 6.34 11.5 291 17,717 16.02 2.80 6.28 1.42BALINDONG (WATU) 41.41 7.52 18.2 669 11,434 10.87 2.81 3.98 1.27BAYANG 38.71 6.37 16.5 764 9,111 10.02 2.34 3.63 1.06BINIDAYAN 51.34 5.97 11.6 367 10,557 14.57 2.75 5.61 1.44BUBONG 30.95 7.70 24.9 1024 6,448 7.46 2.35 2.57 0.96BUTIG 55.09 9.01 16.4 287 11,340 16.55 3.95 6.65 2.02GANASSI 51.32 6.70 13.1 368 12,152 14.78 3.05 5.75 1.53KAPAI 60.22 7.34 12.2 193 9,817 18.52 3.84 7.51 2.04LUMBA-BAYABAO (MAGUING)
35.21 8.15 23.1 884 19,341 8.75 2.71 3.07 1.13
LUMBATAN 56.80 6.47 11.4 263 12,899 17.03 2.97 6.81 1.57MADALUM 58.13 5.41 9.3 234 13,616 17.67 2.68 7.11 1.43
2003 City and Municipal Level Poverty Estimates Page 111 NSCB/WB Intercensal Updating of Small Area Poverty Estimates
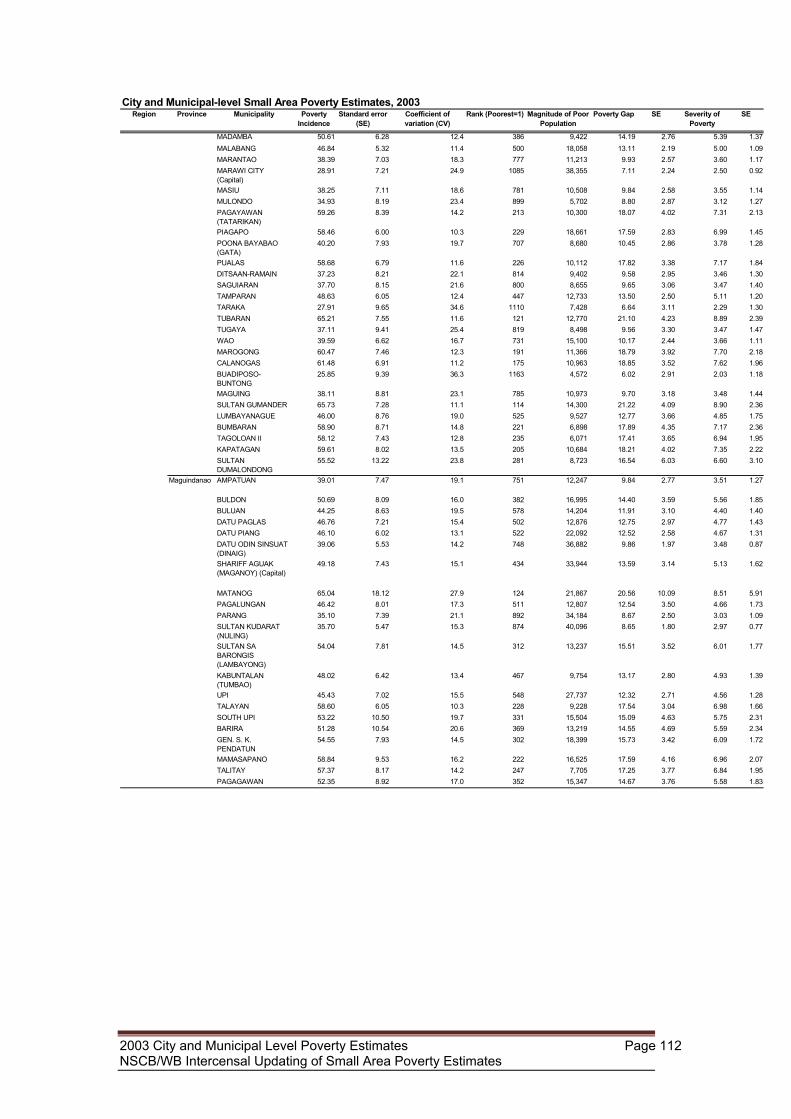
City and Municipal-level Small Area Poverty Estimates, 2003Region Province Municipality Poverty
IncidenceStandard error
(SE)Coefficient of variation (CV)
Rank (Poorest=1) Magnitude of Poor Population
Poverty Gap SE Severity of Poverty
SE
MADAMBA 50.61 6.28 12.4 386 9,422 14.19 2.76 5.39 1.37MALABANG 46.84 5.32 11.4 500 18,058 13.11 2.19 5.00 1.09MARANTAO 38.39 7.03 18.3 777 11,213 9.93 2.57 3.60 1.17MARAWI CITY (Capital)
28.91 7.21 24.9 1085 38,355 7.11 2.24 2.50 0.92
MASIU 38.25 7.11 18.6 781 10,508 9.84 2.58 3.55 1.14MULONDO 34.93 8.19 23.4 899 5,702 8.80 2.87 3.12 1.27PAGAYAWAN (TATARIKAN)
59.26 8.39 14.2 213 10,300 18.07 4.02 7.31 2.13
PIAGAPO 58.46 6.00 10.3 229 18,661 17.59 2.83 6.99 1.45POONA BAYABAO (GATA)
40.20 7.93 19.7 707 8,680 10.45 2.86 3.78 1.28
PUALAS 58.68 6.79 11.6 226 10,112 17.82 3.38 7.17 1.84DITSAAN-RAMAIN 37.23 8.21 22.1 814 9,402 9.58 2.95 3.46 1.30SAGUIARAN 37.70 8.15 21.6 800 8,655 9.65 3.06 3.47 1.40TAMPARAN 48.63 6.05 12.4 447 12,733 13.50 2.50 5.11 1.20TARAKA 27.91 9.65 34.6 1110 7,428 6.64 3.11 2.29 1.30TUBARAN 65.21 7.55 11.6 121 12,770 21.10 4.23 8.89 2.39TUGAYA 37.11 9.41 25.4 819 8,498 9.56 3.30 3.47 1.47WAO 39.59 6.62 16.7 731 15,100 10.17 2.44 3.66 1.11MAROGONG 60.47 7.46 12.3 191 11,366 18.79 3.92 7.70 2.18CALANOGAS 61.48 6.91 11.2 175 10,963 18.85 3.52 7.62 1.96BUADIPOSO-BUNTONG
25.85 9.39 36.3 1163 4,572 6.02 2.91 2.03 1.18
MAGUING 38.11 8.81 23.1 785 10,973 9.70 3.18 3.48 1.44SULTAN GUMANDER 65.73 7.28 11.1 114 14,300 21.22 4.09 8.90 2.36LUMBAYANAGUE 46.00 8.76 19.0 525 9,527 12.77 3.66 4.85 1.75BUMBARAN 58.90 8.71 14.8 221 6,898 17.89 4.35 7.17 2.36TAGOLOAN II 58.12 7.43 12.8 235 6,071 17.41 3.65 6.94 1.95KAPATAGAN 59.61 8.02 13.5 205 10,684 18.21 4.02 7.35 2.22SULTAN DUMALONDONG
55.52 13.22 23.8 281 8,723 16.54 6.03 6.60 3.10
Maguindanao AMPATUAN 39.01 7.47 19.1 751 12,247 9.84 2.77 3.51 1.27
BULDON 50.69 8.09 16.0 382 16,995 14.40 3.59 5.56 1.85BULUAN 44.25 8.63 19.5 578 14,204 11.91 3.10 4.40 1.40DATU PAGLAS 46.76 7.21 15.4 502 12,876 12.75 2.97 4.77 1.43DATU PIANG 46.10 6.02 13.1 522 22,092 12.52 2.58 4.67 1.31DATU ODIN SINSUAT (DINAIG)
39.06 5.53 14.2 748 36,882 9.86 1.97 3.48 0.87
SHARIFF AGUAK (MAGANOY) (Capital)
49.18 7.43 15.1 434 33,944 13.59 3.14 5.13 1.62
MATANOG 65.04 18.12 27.9 124 21,867 20.56 10.09 8.51 5.91PAGALUNGAN 46.42 8.01 17.3 511 12,807 12.54 3.50 4.66 1.73PARANG 35.10 7.39 21.1 892 34,184 8.67 2.50 3.03 1.09SULTAN KUDARAT (NULING)
35.70 5.47 15.3 874 40,096 8.65 1.80 2.97 0.77
SULTAN SA BARONGIS (LAMBAYONG)
54.04 7.81 14.5 312 13,237 15.51 3.52 6.01 1.77
KABUNTALAN (TUMBAO)
48.02 6.42 13.4 467 9,754 13.17 2.80 4.93 1.39
UPI 45.43 7.02 15.5 548 27,737 12.32 2.71 4.56 1.28TALAYAN 58.60 6.05 10.3 228 9,228 17.54 3.04 6.98 1.66SOUTH UPI 53.22 10.50 19.7 331 15,504 15.09 4.63 5.75 2.31BARIRA 51.28 10.54 20.6 369 13,219 14.55 4.69 5.59 2.34GEN. S. K. PENDATUN
54.55 7.93 14.5 302 18,399 15.73 3.42 6.09 1.72
MAMASAPANO 58.84 9.53 16.2 222 16,525 17.59 4.16 6.96 2.07TALITAY 57.37 8.17 14.2 247 7,705 17.25 3.77 6.84 1.95PAGAGAWAN 52.35 8.92 17.0 352 15,347 14.67 3.76 5.58 1.83
2003 City and Municipal Level Poverty Estimates Page 112 NSCB/WB Intercensal Updating of Small Area Poverty Estimates
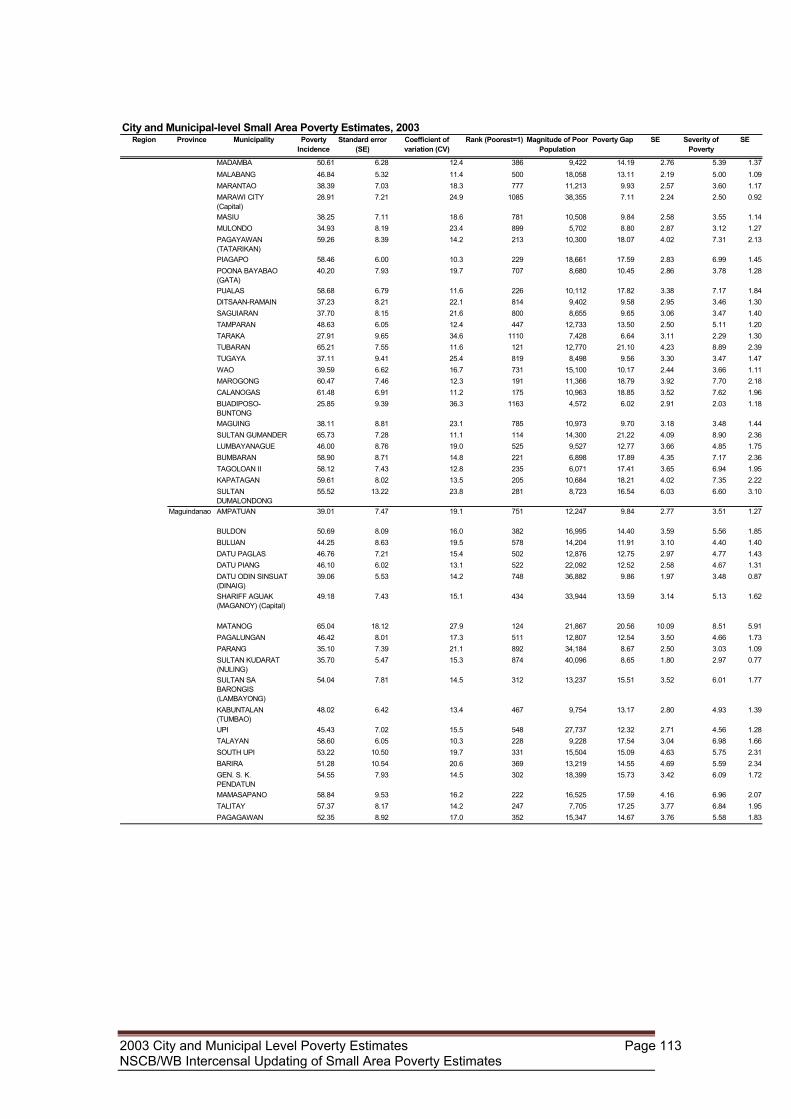
City and Municipal-level Small Area Poverty Estimates, 2003Region Province Municipality Poverty
IncidenceStandard error
(SE)Coefficient of variation (CV)
Rank (Poorest=1) Magnitude of Poor Population
Poverty Gap SE Severity of Poverty
SE
MADAMBA 50.61 6.28 12.4 386 9,422 14.19 2.76 5.39 1.37MALABANG 46.84 5.32 11.4 500 18,058 13.11 2.19 5.00 1.09MARANTAO 38.39 7.03 18.3 777 11,213 9.93 2.57 3.60 1.17MARAWI CITY (Capital)
28.91 7.21 24.9 1085 38,355 7.11 2.24 2.50 0.92
MASIU 38.25 7.11 18.6 781 10,508 9.84 2.58 3.55 1.14MULONDO 34.93 8.19 23.4 899 5,702 8.80 2.87 3.12 1.27PAGAYAWAN (TATARIKAN)
59.26 8.39 14.2 213 10,300 18.07 4.02 7.31 2.13
PIAGAPO 58.46 6.00 10.3 229 18,661 17.59 2.83 6.99 1.45POONA BAYABAO (GATA)
40.20 7.93 19.7 707 8,680 10.45 2.86 3.78 1.28
PUALAS 58.68 6.79 11.6 226 10,112 17.82 3.38 7.17 1.84DITSAAN-RAMAIN 37.23 8.21 22.1 814 9,402 9.58 2.95 3.46 1.30SAGUIARAN 37.70 8.15 21.6 800 8,655 9.65 3.06 3.47 1.40TAMPARAN 48.63 6.05 12.4 447 12,733 13.50 2.50 5.11 1.20TARAKA 27.91 9.65 34.6 1110 7,428 6.64 3.11 2.29 1.30TUBARAN 65.21 7.55 11.6 121 12,770 21.10 4.23 8.89 2.39TUGAYA 37.11 9.41 25.4 819 8,498 9.56 3.30 3.47 1.47WAO 39.59 6.62 16.7 731 15,100 10.17 2.44 3.66 1.11MAROGONG 60.47 7.46 12.3 191 11,366 18.79 3.92 7.70 2.18CALANOGAS 61.48 6.91 11.2 175 10,963 18.85 3.52 7.62 1.96BUADIPOSO-BUNTONG
25.85 9.39 36.3 1163 4,572 6.02 2.91 2.03 1.18
MAGUING 38.11 8.81 23.1 785 10,973 9.70 3.18 3.48 1.44SULTAN GUMANDER 65.73 7.28 11.1 114 14,300 21.22 4.09 8.90 2.36LUMBAYANAGUE 46.00 8.76 19.0 525 9,527 12.77 3.66 4.85 1.75BUMBARAN 58.90 8.71 14.8 221 6,898 17.89 4.35 7.17 2.36TAGOLOAN II 58.12 7.43 12.8 235 6,071 17.41 3.65 6.94 1.95KAPATAGAN 59.61 8.02 13.5 205 10,684 18.21 4.02 7.35 2.22SULTAN DUMALONDONG
55.52 13.22 23.8 281 8,723 16.54 6.03 6.60 3.10
Maguindanao AMPATUAN 39.01 7.47 19.1 751 12,247 9.84 2.77 3.51 1.27
BULDON 50.69 8.09 16.0 382 16,995 14.40 3.59 5.56 1.85BULUAN 44.25 8.63 19.5 578 14,204 11.91 3.10 4.40 1.40DATU PAGLAS 46.76 7.21 15.4 502 12,876 12.75 2.97 4.77 1.43DATU PIANG 46.10 6.02 13.1 522 22,092 12.52 2.58 4.67 1.31DATU ODIN SINSUAT (DINAIG)
39.06 5.53 14.2 748 36,882 9.86 1.97 3.48 0.87
SHARIFF AGUAK (MAGANOY) (Capital)
49.18 7.43 15.1 434 33,944 13.59 3.14 5.13 1.62
MATANOG 65.04 18.12 27.9 124 21,867 20.56 10.09 8.51 5.91PAGALUNGAN 46.42 8.01 17.3 511 12,807 12.54 3.50 4.66 1.73PARANG 35.10 7.39 21.1 892 34,184 8.67 2.50 3.03 1.09SULTAN KUDARAT (NULING)
35.70 5.47 15.3 874 40,096 8.65 1.80 2.97 0.77
SULTAN SA BARONGIS (LAMBAYONG)
54.04 7.81 14.5 312 13,237 15.51 3.52 6.01 1.77
KABUNTALAN (TUMBAO)
48.02 6.42 13.4 467 9,754 13.17 2.80 4.93 1.39
UPI 45.43 7.02 15.5 548 27,737 12.32 2.71 4.56 1.28TALAYAN 58.60 6.05 10.3 228 9,228 17.54 3.04 6.98 1.66SOUTH UPI 53.22 10.50 19.7 331 15,504 15.09 4.63 5.75 2.31BARIRA 51.28 10.54 20.6 369 13,219 14.55 4.69 5.59 2.34GEN. S. K. PENDATUN
54.55 7.93 14.5 302 18,399 15.73 3.42 6.09 1.72
MAMASAPANO 58.84 9.53 16.2 222 16,525 17.59 4.16 6.96 2.07TALITAY 57.37 8.17 14.2 247 7,705 17.25 3.77 6.84 1.95PAGAGAWAN 52.35 8.92 17.0 352 15,347 14.67 3.76 5.58 1.83
2003 City and Municipal Level Poverty Estimates Page 113 NSCB/WB Intercensal Updating of Small Area Poverty Estimates
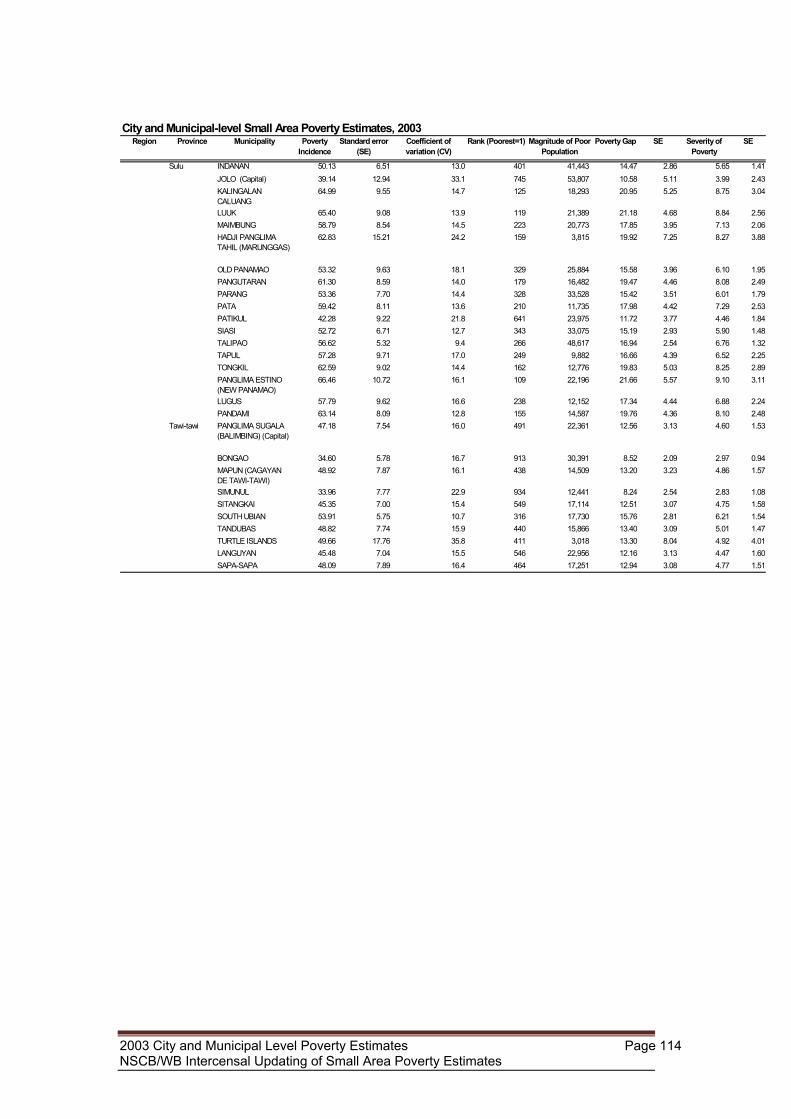
City and Municipal-level Small Area Poverty Estimates, 2003Region Province Municipality Poverty
IncidenceStandard error
(SE)Coefficient of variation (CV)
Rank (Poorest=1) Magnitude of Poor Population
Poverty Gap SE Severity of Poverty
SE
Sulu INDANAN 50.13 6.51 13.0 401 41,443 14.47 2.86 5.65 1.41JOLO (Capital) 39.14 12.94 33.1 745 53,807 10.58 5.11 3.99 2.43KALINGALAN CALUANG
64.99 9.55 14.7 125 18,293 20.95 5.25 8.75 3.04
LUUK 65.40 9.08 13.9 119 21,389 21.18 4.68 8.84 2.56MAIMBUNG 58.79 8.54 14.5 223 20,773 17.85 3.95 7.13 2.06HADJI PANGLIMA TAHIL (MARUNGGAS)
62.83 15.21 24.2 159 3,815 19.92 7.25 8.27 3.88
OLD PANAMAO 53.32 9.63 18.1 329 25,884 15.58 3.96 6.10 1.95PANGUTARAN 61.30 8.59 14.0 179 16,482 19.47 4.46 8.08 2.49PARANG 53.36 7.70 14.4 328 33,528 15.42 3.51 6.01 1.79PATA 59.42 8.11 13.6 210 11,735 17.98 4.42 7.29 2.53PATIKUL 42.28 9.22 21.8 641 23,975 11.72 3.77 4.46 1.84SIASI 52.72 6.71 12.7 343 33,075 15.19 2.93 5.90 1.48TALIPAO 56.62 5.32 9.4 266 48,617 16.94 2.54 6.76 1.32TAPUL 57.28 9.71 17.0 249 9,882 16.66 4.39 6.52 2.25TONGKIL 62.59 9.02 14.4 162 12,776 19.83 5.03 8.25 2.89PANGLIMA ESTINO (NEW PANAMAO)
66.46 10.72 16.1 109 22,196 21.66 5.57 9.10 3.11
LUGUS 57.79 9.62 16.6 238 12,152 17.34 4.44 6.88 2.24PANDAMI 63.14 8.09 12.8 155 14,587 19.76 4.36 8.10 2.48
Tawi-tawi PANGLIMA SUGALA (BALIMBING) (Capital)
47.18 7.54 16.0 491 22,361 12.56 3.13 4.60 1.53
BONGAO 34.60 5.78 16.7 913 30,391 8.52 2.09 2.97 0.94MAPUN (CAGAYAN DE TAWI-TAWI)
48.92 7.87 16.1 438 14,509 13.20 3.23 4.86 1.57
SIMUNUL 33.96 7.77 22.9 934 12,441 8.24 2.54 2.83 1.08SITANGKAI 45.35 7.00 15.4 549 17,114 12.51 3.07 4.75 1.58SOUTH UBIAN 53.91 5.75 10.7 316 17,730 15.76 2.81 6.21 1.54TANDUBAS 48.82 7.74 15.9 440 15,866 13.40 3.09 5.01 1.47TURTLE ISLANDS 49.66 17.76 35.8 411 3,018 13.30 8.04 4.92 4.01LANGUYAN 45.48 7.04 15.5 546 22,956 12.16 3.13 4.47 1.60SAPA-SAPA 48.09 7.89 16.4 464 17,251 12.94 3.08 4.77 1.51
2003 City and Municipal Level Poverty Estimates Page 114 NSCB/WB Intercensal Updating of Small Area Poverty Estimates
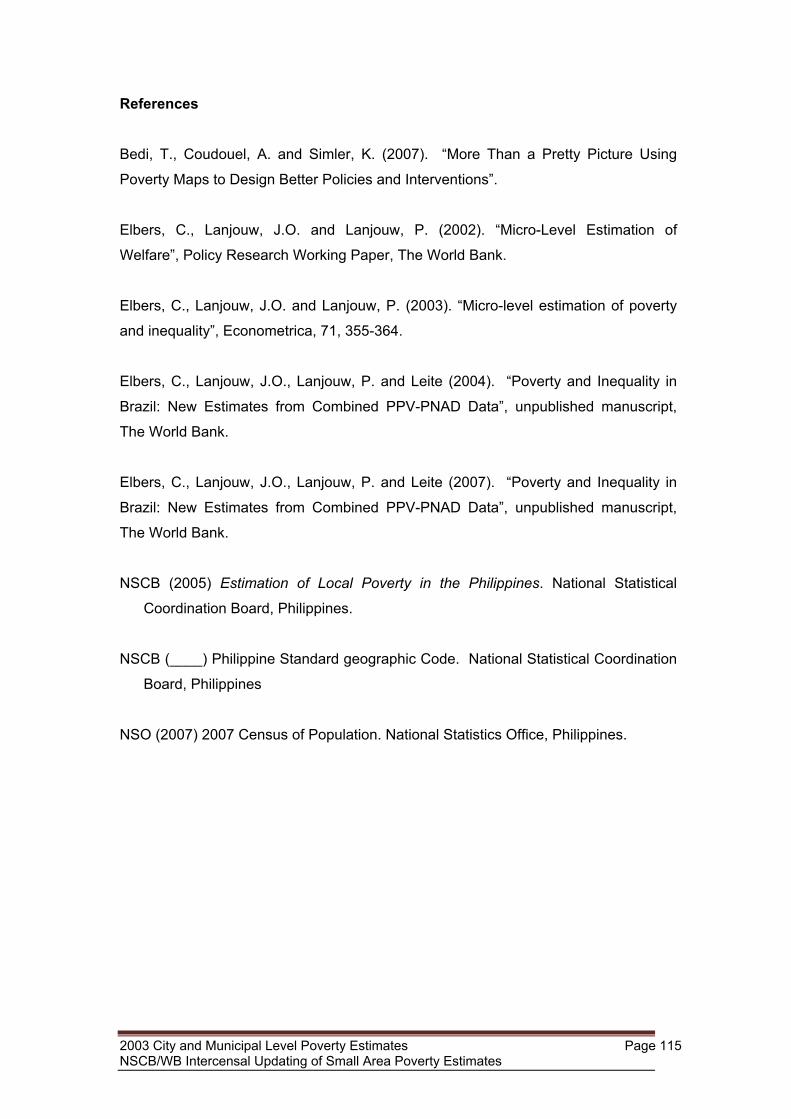
References Bedi, T., Coudouel, A. and Simler, K. (2007). “More Than a Pretty Picture Using
Poverty Maps to Design Better Policies and Interventions”.
Elbers, C., Lanjouw, J.O. and Lanjouw, P. (2002). “Micro-Level Estimation of
Welfare”, Policy Research Working Paper, The World Bank.
Elbers, C., Lanjouw, J.O. and Lanjouw, P. (2003). “Micro-level estimation of poverty
and inequality”, Econometrica, 71, 355-364.
Elbers, C., Lanjouw, J.O., Lanjouw, P. and Leite (2004). “Poverty and Inequality in
Brazil: New Estimates from Combined PPV-PNAD Data”, unpublished manuscript,
The World Bank.
Elbers, C., Lanjouw, J.O., Lanjouw, P. and Leite (2007). “Poverty and Inequality in
Brazil: New Estimates from Combined PPV-PNAD Data”, unpublished manuscript,
The World Bank.
NSCB (2005) Estimation of Local Poverty in the Philippines. National Statistical
Coordination Board, Philippines.
NSCB (____) Philippine Standard geographic Code. National Statistical Coordination
Board, Philippines
NSO (2007) 2007 Census of Population. National Statistics Office, Philippines.
2003 City and Municipal Level Poverty Estimates Page 115 NSCB/WB Intercensal Updating of Small Area Poverty Estimates
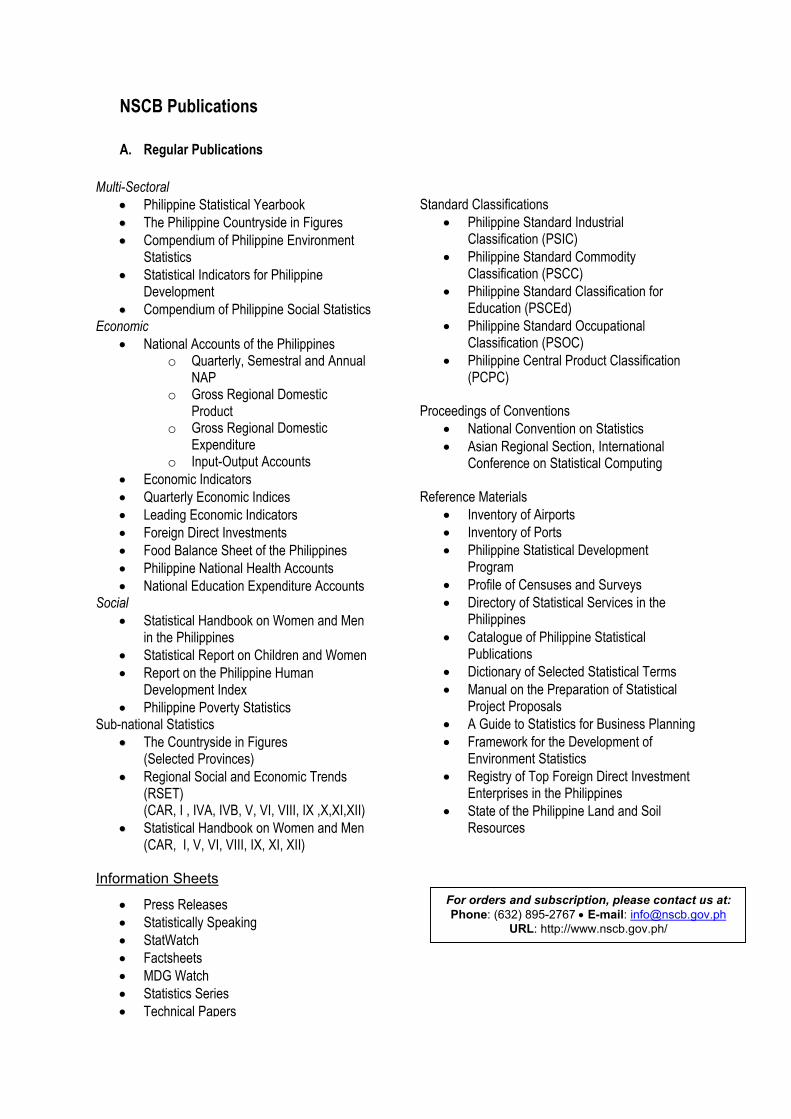
NSCB Publications
For orders and subscription, please contact us at:Phone: (632) 895-2767 • E-mail: [email protected]
URL: http://www.nscb.gov.ph/
A.
•• •• ••
••
••
••
••
••
Regular Publications Multi-Sectoral
Philippine Statistical Yearbook The Philippine Countryside in Figures Compendium of Philippine Environment Statistics Statistical Indicators for Philippine Development Compendium of Philippine Social Statistics
Economic • National Accounts of the Philippines
o Quarterly, Semestral and Annual NAP
o Gross Regional Domestic Product
o Gross Regional Domestic Expenditure
o Input-Output Accounts • Economic Indicators • Quarterly Economic Indices • Leading Economic Indicators • Foreign Direct Investments • Food Balance Sheet of the Philippines • Philippine National Health Accounts • National Education Expenditure Accounts
Social • Statistical Handbook on Women and Men
in the Philippines • Statistical Report on Children and Women • Report on the Philippine Human
Development Index • Philippine Poverty Statistics
Sub-national Statistics The Countryside in Figures (Selected Provinces) Regional Social and Economic Trends (RSET) (CAR, I , IVA, IVB, V, VI, VIII, IX ,X,XI,XII) Statistical Handbook on Women and Men (CAR, I, V, VI, VIII, IX, XI, XII)
Information Sheets
• Press Releases
Reference Materials
• Statistically Speaking • StatWatch • Factsheets • MDG Watch • Statistics Series • Technical Papers
Standard Classifications
• Philippine Standard Industrial Classification (PSIC)
• Philippine Standard Commodity Classification (PSCC)
• Philippine Standard Classification for Education (PSCEd)
• Philippine Standard Occupational Classification (PSOC)
• Philippine Central Product Classification (PCPC)
Proceedings of Conventions
• National Convention on Statistics • Asian Regional Section, International
Conference on Statistical Computing
• Inventory of Airports • Inventory of Ports • Philippine Statistical Development
Program • Profile of Censuses and Surveys • Directory of Statistical Services in the
Philippines • Catalogue of Philippine Statistical
Publications • Dictionary of Selected Statistical Terms • Manual on the Preparation of Statistical
Project Proposals • A Guide to Statistics for Business Planning • Framework for the Development of
Environment Statistics • Registry of Top Foreign Direct Investment
Enterprises in the Philippines • State of the Philippine Land and Soil
Resources
2003 City and Municipal Level Poverty Estimates Page 117 NSCB/WB Intercensal Updating of Small Area Poverty Estimates

Other NSCB Products and Services Products
1. Statistical policies and measures to resolve specific issues and provide policy directions in the Philippine Statistical System (PSS)
2. The Philippine Statistical Development
Program (PSDP) to serve as blueprint of priority programs and activities to be undertaken to improve the PSS in the Medium Term
3. National Accounts and related economic
accounts to assess the economic performance of the country thru the following:
National Accounts Regional Accounts
Gender and development statistics
6. Statistical publications to disseminate the most relevant information produced by the PSS and to make statistics more accessible to the public
9. Advocacy for statistical awareness
Government Statistics Accessibility Program
Input-Output (I-O) Accounts
4. Other economic and social indicators Poverty statistics Environment statistics Food balance sheet Indicators on children and
women
Quarterly economic indices Foreign direct investments Leading economic indicators Human development index National Health Accounts National Education Accounts
5. Standards and classification systems to
prescribe uniform standards in government statistics
Philippine Standard Occupational Classification (PSOC)
Philippine Standard Commodity Classification (PSCC)
Philippine Standard Industrial Classification (PSIC)
Philippine Standard Geographic Code (PSGC)
Philippine Standard Classification of Education (PSCED)
Philippine Classification of Commodities by Broad
Economic Categories (PCCBEC)
Philippine Central Product Classification (PCPC)
Services
1. Maintenance of a one-stop statistical information center
2. Monitoring of designated statistics 3. Coordination of subnational statistical
system 4. Coordination of inter-agency concerns on
statistics 5. Survey review and clearance 6. On-line statistical service through the
internet (www.nscb.gov.ph) 7. Servicing data requests 8. Technical services
National Statistics Month National Convention on
Statistics
Hosting of international conferences in statistics
2003 City and Municipal Level Poverty Estimates Page 118 NSCB/WB Intercensal Updating of Small Area Poverty Estimates
NSCB TECHNICAL STAFF*
ROMULO A. VIROLA Secretar
2003 City and Municipal Level Poverty Estimates Page 119 NSCB/WB Intercensal Updating of Small Area Poverty Estimates
y General
ESTRELLA V. DOMINGO Assistant Secretary
CANDIDO J. ASTROLOGO, JR. CYNTHIA S. REGALADO OIC-Director (Concurrent) OIC - Director
FE VIDA N. DY-LIACCO REDENCION M. IGNACIO Chief, Programs, Policies, and Advocacy Division
SEVERA B. DE COSTO JESSAMYN O. ENCARNACION Chief, Standards and Classification Chief, Poverty, Labor, Human Development, Systems Division and Gender Statistics Division
Director
MA. FE M. TALENTO GLENITA V. AMORANTO OIC, Production Accounts Division OIC, Integrated Accounts Division
VIVIAN R. ILARINA REGINA S. REYESChief, Expenditure Accounts Chief, Economic Indicators and Satellite
Accounts
CANDIDO J. ASTROLOGO, JR.
ROMEO M. NIMENO
OIC - Director
Chief, Administrative Services Division
RAYMUNDO J. TALENTO
Chief, Population, Health and Nutrition, and Education Statistics Division
MANAGEMENT SERVICES
SOCIAL STATISTICS OFFICEPROGRAMS, POLICIESAND STANDARDS
INFORMATION CENTERNATIONAL STATISTICAL
ECONOMIC STATISTICS OFFICE
OIC, Human Resource and International
Affairs Division
LINA V. CASTRO
Director (Concurrent)
EMALYN P. PINEDA
SUBNATIONAL STATISTICS OFFICE
* As of March 2009
LINA V. CASTRO Director (Concurrent)
Division
Director
CELESTE MAE C. ROLA
Project Team Leader
MARYMELL A. MARTILLAN
WB TFSCB/NSCB INTERCENSAL UPDATING OF SMALL AREA POVERTY ESTIMATES PROJECT STAFF
NSCB Project Management Committee
Chair ROMULO A. VIROLA
Members
ESTRELLA V. DOMINGO LINA V. CASTRO RAYMUNDO J. TALENTO CANDIDO J. ASTROLOGO, JR. CYNTHIA S. REGALADO REDENCION M. IGNACIO
Lead Technical Staff
Project Manager LINA V. CASTRO JESSAMYN O. ENCARNACION
BERNADETTE B. BALAMBAN ARTURO M. MARTINEZ, JR.
JOSEPH M. ADDAWE
Technical Staff
Administrative Staff
MILDRED B. ADDAWE
PILAR C. DAYAG NOEL S. NEPOMUCENO
FLORANDE S. POLISTICO MARK REX S. ROMARAOG
AGNES V. CAPULE TERESITA M. ALMARINES
ANDREA S. BAYLON MAGNOLIA C. SAN DIEGO
JEFFREY E. ENRADO JOSE A. DAYOT
The World Bank
Task Managers KARL KENDRICK CHUA
CHORCHING GOH
Project Technical Adviser DR. PETER LANJOUW
Foreign Consultant
DR. ROY VAN DER WEIDE
Local Consultant DR. ZITA VJ. ALBACEA
2N
003 City and Municipal Level Poverty Estimates Page 120 SCB/WB Intercensal Updating of Small Area Poverty Estimates∗ The NSCB thanks Ms. Kristine Faith S. Agtarap, Ms. Ma. Concordia S. Alfonso, Ms. Glenita V. Amoranto, Ms. Ma. Kristina V. Manalo, Ms. Ma. Ivy T. Querubin, Mr. Raymond S. Perez and Mr. Armyl S. Zaguirre for their assistance in this Project.