chicken situation report - psa.gov.ph
TRANSCRIPT
Page 2 of 37
ISSN-2546-0625
CHICKEN SITUATION
REPORT
January-December 2020

Photos: Broiler Chicken. Retrieved on May 9, 2016 from http://www.zamzammeats.com/product-category/chicken/?orderby=date.http://www.choosecagefree.org/sites/default/files/pdfs/hens3.jpg
Native Chicken with Chicks. Retrieved on May 9, 2016 from https://lolitationgson.wordpress.com/2010/01/15/integrity-report-3/
Broiler. Retrieved on May 9, 2016 from http://www.asiafarming.com/poultry-farming-information-guide/
Native Chicken. Retrieved on March13, 2017 from http://fortune.com/2016/06/08/bill-gates-chicken-farmer/Layer Farm. Retrieved on March 13, 2017 from http://agrifarming.in/poultry-layer-farming.
Chicken eggs. Retrieved on March 13, 2017 from http://www.the-chicken-Chick.com/2012/12/
Layer Farm 2. Retrieved on March 15, 2017 from http://www.filipinopoultry.com/Layer Farming in the Philippines
CHICKEN SITUATION REPORT
January-December 2020
ii
REPUBLIC OF THE PHILIPPINES
HIS EXCELLENCY PRESIDENT RODRIGO ROA DUTERTE
PHILIPPINE STATISTICS AUHORITY
DENNIS S. MAPA, Ph.D. Undersecretary
National Statistician and Civil Registrar General
ISSN-2546-0625
Copyright © 2021 by Philippine Statistics Authority PSA Complex, East Avenue, Diliman,
Quezon City, Philippines
iii
FOREWORD
The Chicken Situation Report presents the industry situation in terms of volume and
value of production, number of birds dressed in poultry dressing plants, chicken meat
imports, and monthly average farmgate and retail prices.
The Philippine Statistics Authority (PSA) disseminates the Chicken Situation Report
annually, every March, with the previous year as the reference period. The report
serves as a ready reference for PSA’s various clients and stakeholders in the
agriculture sector.
The PSA would appreciate comments, and suggestions from our data users, and readers for further improvement of this report.
DENNIS S. MAPA, Ph.D. Undersecretary
National Statistician and Civil Registrar General
Quezon City, Philippines March 2021


v
TABLE OF CONTENTS
Page Foreword iii Technical Notes vii Standard Symbols, Unit of Measure, Initials and Acronyms ix Highlights 1 A. Chicken
1. Volume of Production 1 2. Prices 3 3. Value of Production 4 4. Imports 4
B. Chicken Egg 1. Volume of Production 5 2. Prices 7 3. Value of Production 8
Statistical Tables 9 Figure 1 Volume of Chicken Production and Annual Growth Rate, Philippines
January-December 2018-2020p 1
2 Top 10 Chicken-Producing Provinces, Philippines January-December 2020p
1
3 Thematic Map of Volume of Chicken Production (by province) Philippines: January-December 2020p
2
4 Monthly Average Farmgate Prices of Broiler Chicken (Commercial) Philippines: January-December 2018-2020p
3
5 Monthly Average Retail Prices of Fully Dressed Broiler Chicken Philippines: January-December 2018-2020p
3
6 Volume of Chicken Egg Production and Annual Growth Rate Philippines: January-December 2018-2020p
5
7 Top 10 Chicken Egg-Producing Provinces, Philippines January-December 2020p
5
8 Thematic Map of Volume of Chicken Egg Production (by province) Philippines: January-December 2020p
8
9 Monthly Average Farmgate Prices of Chicken Egg (Commercial) Philippines: January-December 2018-2020p
7
10 Monthly Average Retail Prices of Chicken Egg, Philippines January-December 2018-2020p
7
Table 1 Volume of Chicken Production by Quarter, Philippines: 2018-2020p 10 2 Volume of Chicken Production by Region, Philippines: 2018-2020p 10 3 Volume of Chicken Production by Province, Philippines: 2018-2020p 11 4 Average Farmgate Prices of Broiler Chicken (Commercial) by Month
Philippines: 2018-2020p 14
Continued
vi
TABLE OF CONTENTS -- Concluded
Page 5 Average Retail Prices of Broiler Chicken by Month, Philippines
2018-2020p 14
6 Value of Chicken Production at Current and Constant Prices by Quarter, Philippines: 2018-2020p
15
7 Volume and Value of Imported Chicken Meat by Quarter Philippines: 2018-2020p
15
8 Volume of Chicken Egg Production by Quarter Philippines: 2018-2020p
16
9 Volume of Chicken Egg Production by Region Philippines: 2018-2020p
16
10 Volume of Chicken Egg Production by Province: 2018-2020p 17 11 Average Farmgate Prices of Chicken Egg (Commercial) by Month Philippines: 2018-2020p
20
12 Average Retail Prices of Chicken Egg by Month Philippines: 2018-2020p
20
13 Value of Chicken Egg Production at Current and Constant Prices by Quarter, Philippines: 2018-2020p
21
14 Number of Chicken Dressed in Poultry Dressing Plants by Quarter and Region, Philippines: 2019-2020p
22
15 Inventory of Chicken by Quarter, Type and Region Philippines: 2020p
23
vii
TECHNICAL NOTES
The data in this report are collected by the Philippine Statistics Authority (PSA) through
the two major surveys, namely:
1. Backyard Livestock and Poultry Survey (BLPS) which covers one of the four replicate samples of the Palay Production Survey (PPS) and Corn Production Survey (CPS). BLPS consists of 15,865 sample households in 1,560 sample barangays nationwide; and
2. Commercial Livestock and Poultry Survey (CLPS) which covers 713 sample layer farms and 821 broiler commercial farms as of January 2021.
Both surveys are conducted simultaneously every quarter, that is, every quarter in all
provinces.
Another activity that supplements the statistical requirements of the livestock and
poultry subsector is the Compilation of Data from Slaughterhouses and Poultry
Dressing Plants (CDSPDP). This covers 1,324 licensed to operate meat
establishments (LTOMES) and Locally Registered Meat Establishments (LRMEs)
nationwide. It is undertaken in coordination with the National Meat Inspection Service
(NMIS) and Local Government Units (LGUs).
Concepts and Definitions
Commercial farm - a farm or establishment/enterprise that raises livestock and poultry animals. Moreover, it must satisfy at least one of the following criteria:
• Tending 500 layers or 1,000 broilers; or
• Tending 100 layers and 100 broilers if raised in combination
All livestock and poultry raisers that did not satisfy the above criteria were considered
as Backyard Farm.
Farmgate price refers to the price received by poultry raisers for their produce at the
location of farm. Thus, marketing costs such as transport and other marketing costs
(if any) incurred in selling the produce is not included in the farmgate prices.
Imports refer to the number of meat products originating from foreign country. The
data on meat importation data are compiled by the Trade Statistics Division (TSD) of
PSA from the copies of Import Entry and Internal Revenue Declaration collected from
the Bureau of Customs (BOC).
Inventory refers to the actual number of chicken, in birds, present in the farm as of a specific reference date.
Continued
viii
TECHNICAL NOTES -- Concluded Licensed to Operate Meat Establishment (LTOME) refers to premises/facilities where food animals are slaughtered for human consumption. These were then referred as accredited slaughterhouses and poultry dressing plants. Locally Registered Meat Establishment (LRME) refers to slaughterhouses, meat processing plants, Poultry Dressing Plants, meat cutting plants, and cold storages that are allowed to operate by the city/municipal government but are not accredited by the NMIS. Poultry Dressing Plant (PDP) refers to premises that are approved and registered by the controlling authority in which poultry are dressed for human consumption. Retail price refers to the prices at which retailers sell their goods or commodities to consumers in the marketplace. Value at constant price refers to the valuation of transactions, wherein the influence of price change from base year to the current year has been removed. Value at current price refers to the value based on prices during the reference year; nominal year. Value of production refers to the value of the animal with reference to its farmgate price. It is derived by multiplying the volume of production by its farmgate price. Volume of production refers to the volume of locally-raised birds disposed for dressing which include birds shipped out for dressing. This is expressed in metric tons, liveweight.

ix
Standard Symbols, Unit of Measure, Initials and Acronyms
-- Data not available
- No inventory/production as of the reference period
p Preliminary
kg Kilogram
mt Metric ton
‘000 Thousand
Q1 First Quarter (January–March)
Q2 Second Quarter (April–June)
Q3 Third Quarter (July–September)
Q4 Fourth Quarter (October–December)
Sem1 First Semester (January–June)
Sem2 Second Semester (July–December)
PhP Philippine Peso
USD US dollar
CIF Cost, Insurance and Freight
CAR Cordillera Administrative Region
CALABARZON Cavite, Laguna, Batangas, Rizal, Quezon
MIMAROPA Region Occidental Mindoro, Oriental Mindoro, Marinduque, Romblon, Palawan
SOCCSKSARGEN South Cotabato, Cotabato City, Sultan Kudarat, Sarangani, General Santos City
BARMM Bangsamoro Autonomous Region in Muslim Mindanao

1
p– Preliminary Source: Philippine Statistics Authority
HIGHLIGHTS
A. Chicken 1. Volume of Production a. National
The total volume of chicken production in 2020 was 1.81 million metric tons, liveweight. This was -6.1 percent lower than the 1.93 million metric tons, liveweight output in 2019. (Figure 1 and Table 1) b. Provincial
p– Preliminary Source: Philippine Statistics Authority
1.84 1.93 1.81
2018 2019 2020
Figure 1. Volume of Chicken Production
and Annual Growth Rate, PhilippinesJanuary-December 2018-2020p
Volume of Production(in million mt, liveweight)
5.2 4.9
-6.1
2018 2019 2020
Growth Rate(in percent)
64.13
66.74
67.45
73.37
80.27
102.48
102.68
112.08
164.48
185.09
- 50.00 100.00 150.00 200.00 250.00
Bukidnon
Rizal
Cebu
Quezon
Misamis Oriental
Batangas
Tarlac
Nueva Ecija
Pampanga
Bulacan
in '000 mt, liveweight
pro
vin
ce
Figure 2. Top 10 Chicken-Producing Provinces Philippines: January-December 2020P
2
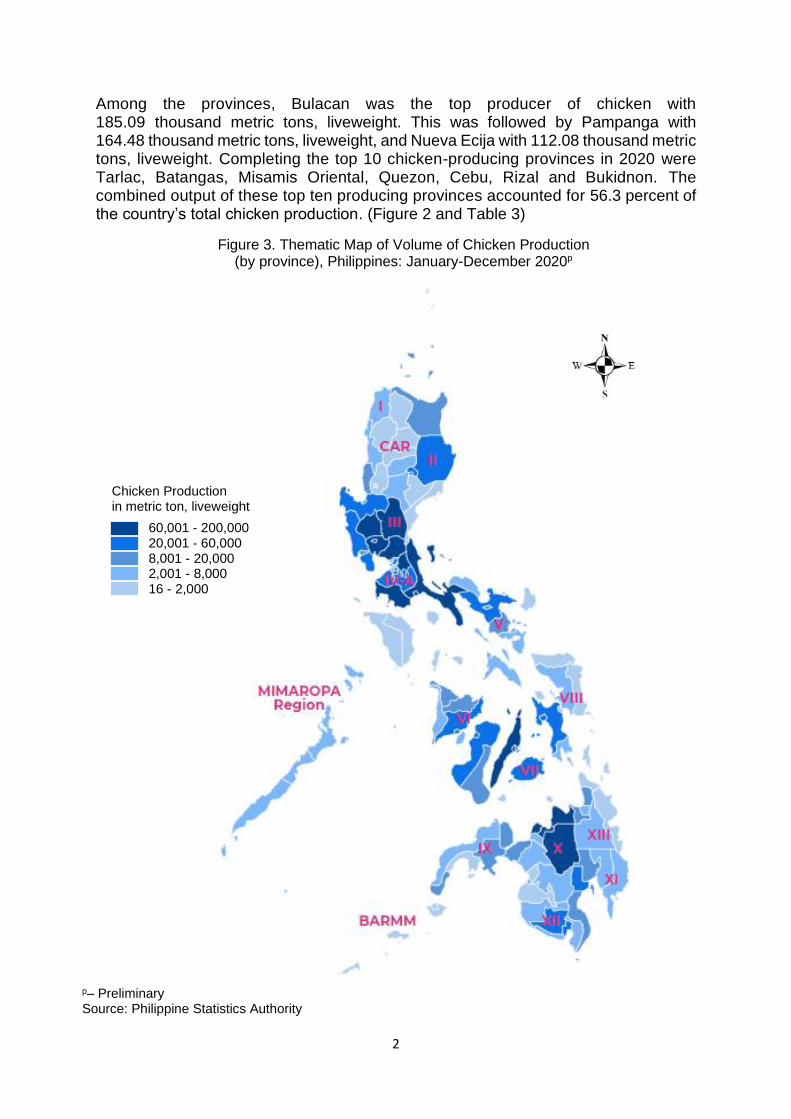
Among the provinces, Bulacan was the top producer of chicken with 185.09 thousand metric tons, liveweight. This was followed by Pampanga with 164.48 thousand metric tons, liveweight, and Nueva Ecija with 112.08 thousand metric tons, liveweight. Completing the top 10 chicken-producing provinces in 2020 were Tarlac, Batangas, Misamis Oriental, Quezon, Cebu, Rizal and Bukidnon. The combined output of these top ten producing provinces accounted for 56.3 percent of the country’s total chicken production. (Figure 2 and Table 3) Figure 3. Thematic Map of Volume of Chicken Production
(by province), Philippines: January-December 2020p
p– Preliminary Source: Philippine Statistics Authority
Chicken Production in metric ton, liveweight
60,001 - 200,000 20,001 - 60,000
8,001 - 20,000 2,001 - 8,000 16 - 2,000
3
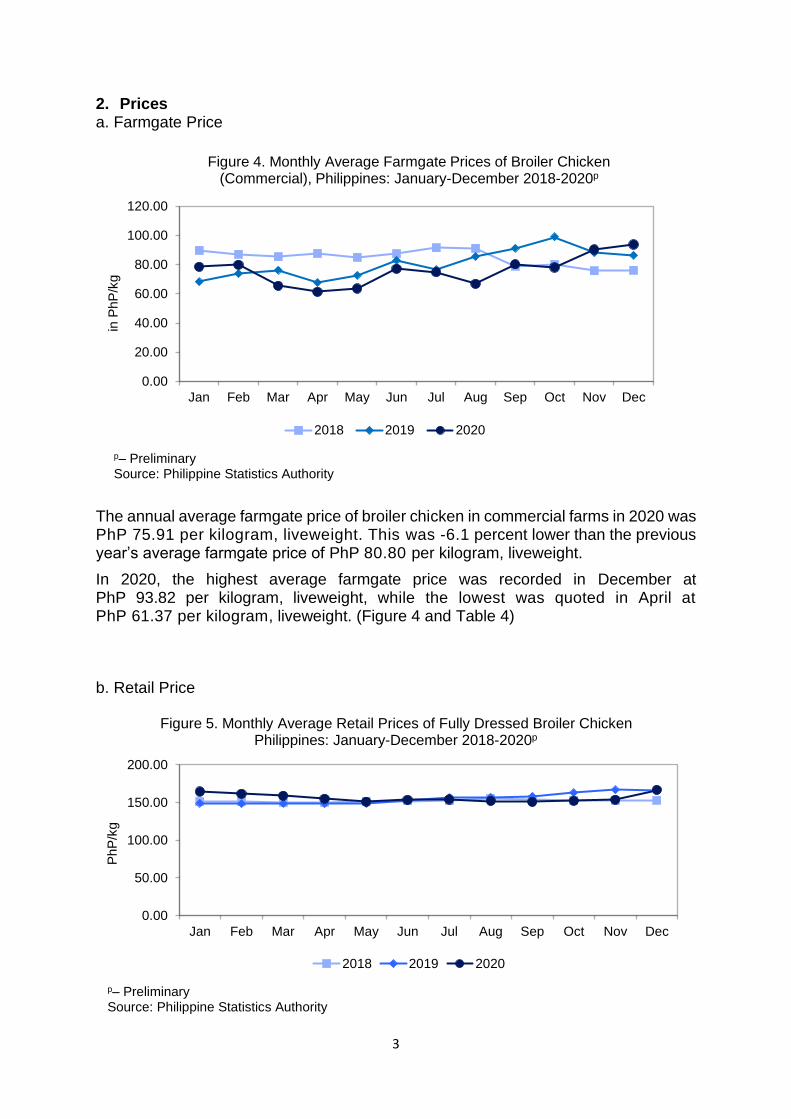
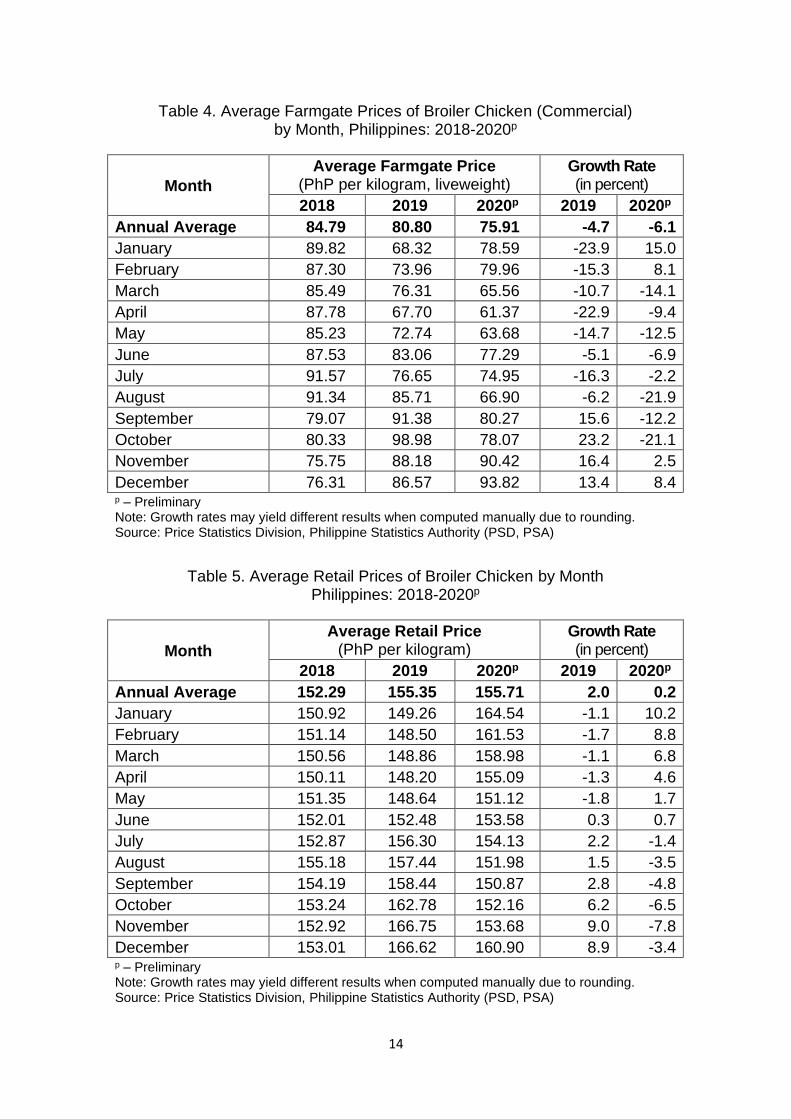
2. Prices a. Farmgate Price
The annual average farmgate price of broiler chicken in commercial farms in 2020 was PhP 75.91 per kilogram, liveweight. This was -6.1 percent lower than the previous year’s average farmgate price of PhP 80.80 per kilogram, liveweight.
In 2020, the highest average farmgate price was recorded in December at PhP 93.82 per kilogram, liveweight, while the lowest was quoted in April at PhP 61.37 per kilogram, liveweight. (Figure 4 and Table 4)
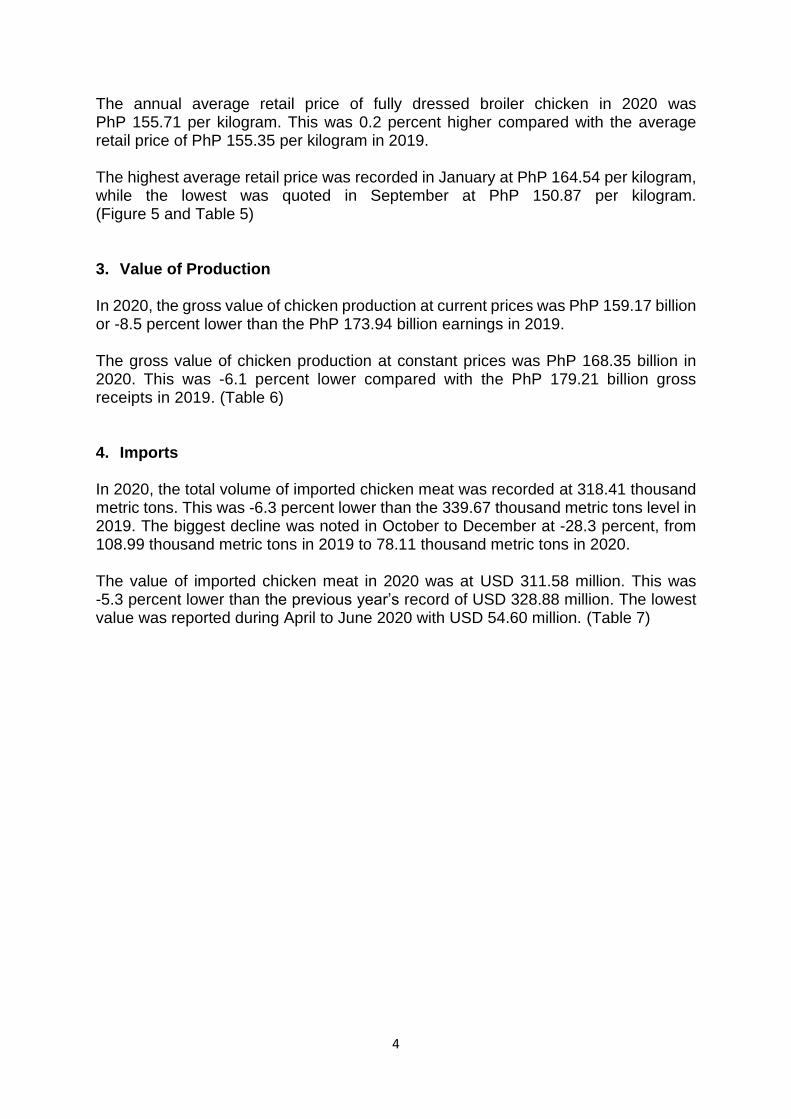
b. Retail Price
p– Preliminary Source: Philippine Statistics Authority
p– Preliminary Source: Philippine Statistics Authority
0.00
20.00
40.00
60.00
80.00
100.00
120.00
Jan Feb Mar Apr May Jun Jul Aug Sep Oct Nov Dec
in P
hP
/kg
Figure 4. Monthly Average Farmgate Prices of Broiler Chicken (Commercial), Philippines: January-December 2018-2020p
2018 2019 2020
0.00
50.00
100.00
150.00
200.00
Jan Feb Mar Apr May Jun Jul Aug Sep Oct Nov Dec
PhP
/kg
Figure 5. Monthly Average Retail Prices of Fully Dressed Broiler Chicken Philippines: January-December 2018-2020p
2018 2019 2020
4
The annual average retail price of fully dressed broiler chicken in 2020 was PhP 155.71 per kilogram. This was 0.2 percent higher compared with the average retail price of PhP 155.35 per kilogram in 2019. The highest average retail price was recorded in January at PhP 164.54 per kilogram, while the lowest was quoted in September at PhP 150.87 per kilogram. (Figure 5 and Table 5) 3. Value of Production In 2020, the gross value of chicken production at current prices was PhP 159.17 billion or -8.5 percent lower than the PhP 173.94 billion earnings in 2019. The gross value of chicken production at constant prices was PhP 168.35 billion in 2020. This was -6.1 percent lower compared with the PhP 179.21 billion gross receipts in 2019. (Table 6) 4. Imports In 2020, the total volume of imported chicken meat was recorded at 318.41 thousand metric tons. This was -6.3 percent lower than the 339.67 thousand metric tons level in 2019. The biggest decline was noted in October to December at -28.3 percent, from 108.99 thousand metric tons in 2019 to 78.11 thousand metric tons in 2020. The value of imported chicken meat in 2020 was at USD 311.58 million. This was -5.3 percent lower than the previous year’s record of USD 328.88 million. The lowest value was reported during April to June 2020 with USD 54.60 million. (Table 7)
5
B. Chicken Egg
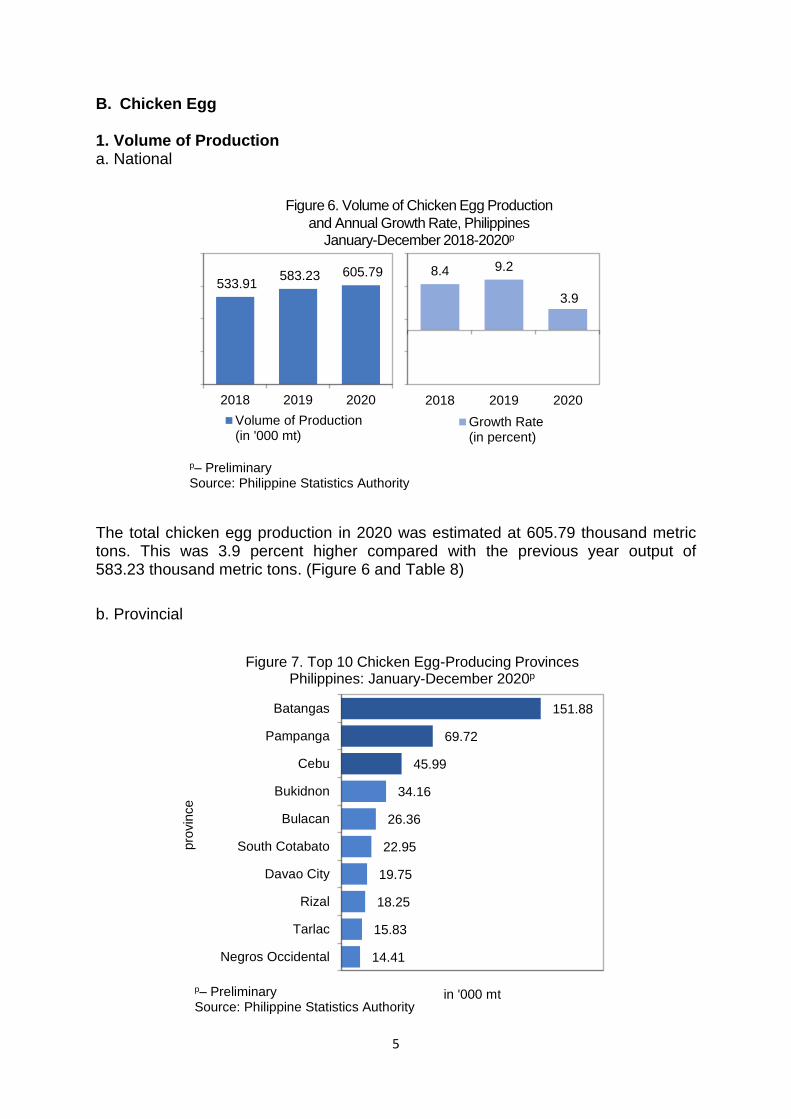
1. Volume of Production a. National
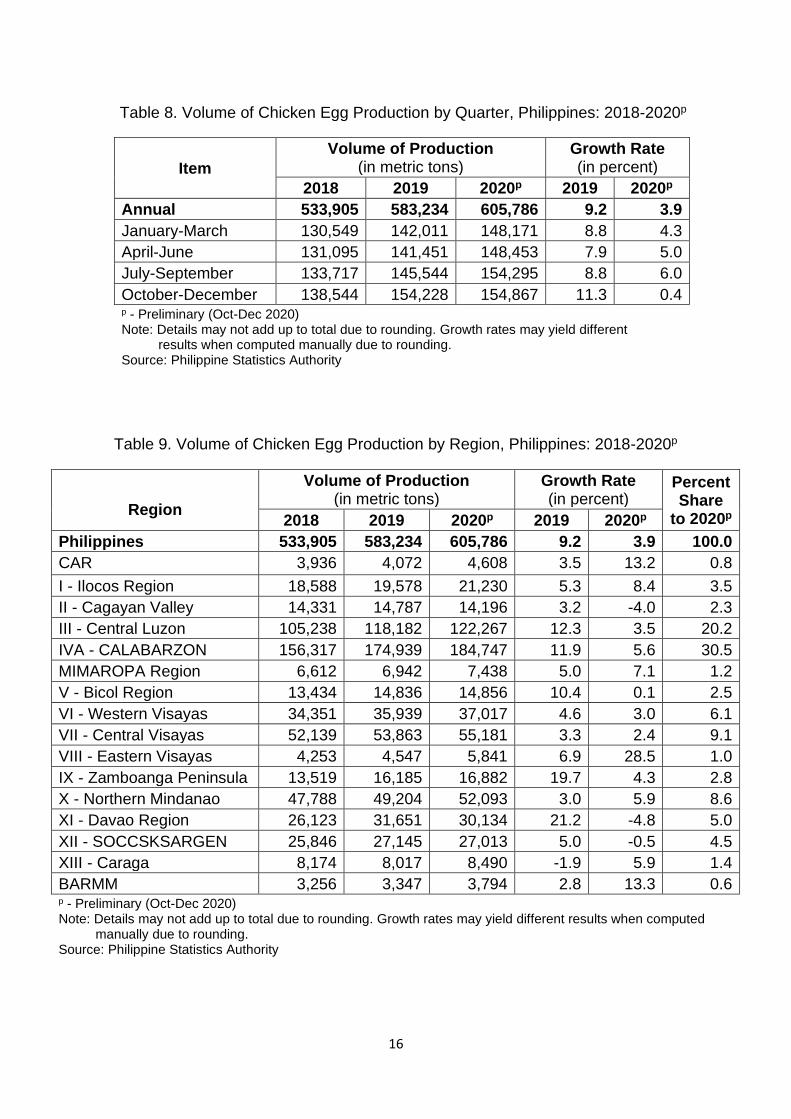
The total chicken egg production in 2020 was estimated at 605.79 thousand metric tons. This was 3.9 percent higher compared with the previous year output of 583.23 thousand metric tons. (Figure 6 and Table 8)
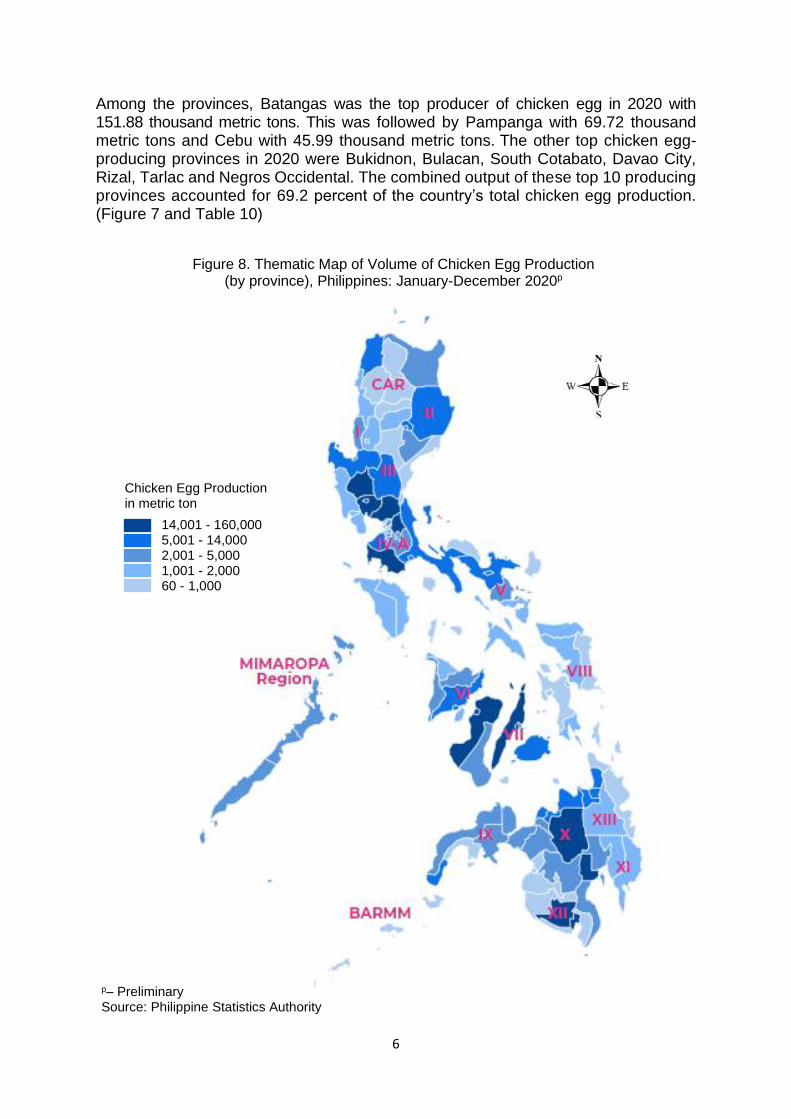
b. Provincial
p– Preliminary Source: Philippine Statistics Authority
p– Preliminary Source: Philippine Statistics Authority
533.91 583.23 605.79
2018 2019 2020
Figure 6. Volume of Chicken Egg Production
and Annual Growth Rate, PhilippinesJanuary-December 2018-2020p
Volume of Production(in '000 mt)
8.4 9.2
3.9
2018 2019 2020
Growth Rate(in percent)
14.41
15.83
18.25
19.75
22.95
26.36
34.16
45.99
69.72
151.88
- 50.00 100.00 150.00 200.00
Negros Occidental
Tarlac
Rizal
Davao City
South Cotabato
Bulacan
Bukidnon
Cebu
Pampanga
Batangas
in '000 mt
pro
vin
ce
Figure 7. Top 10 Chicken Egg-Producing Provinces Philippines: January-December 2020p
6
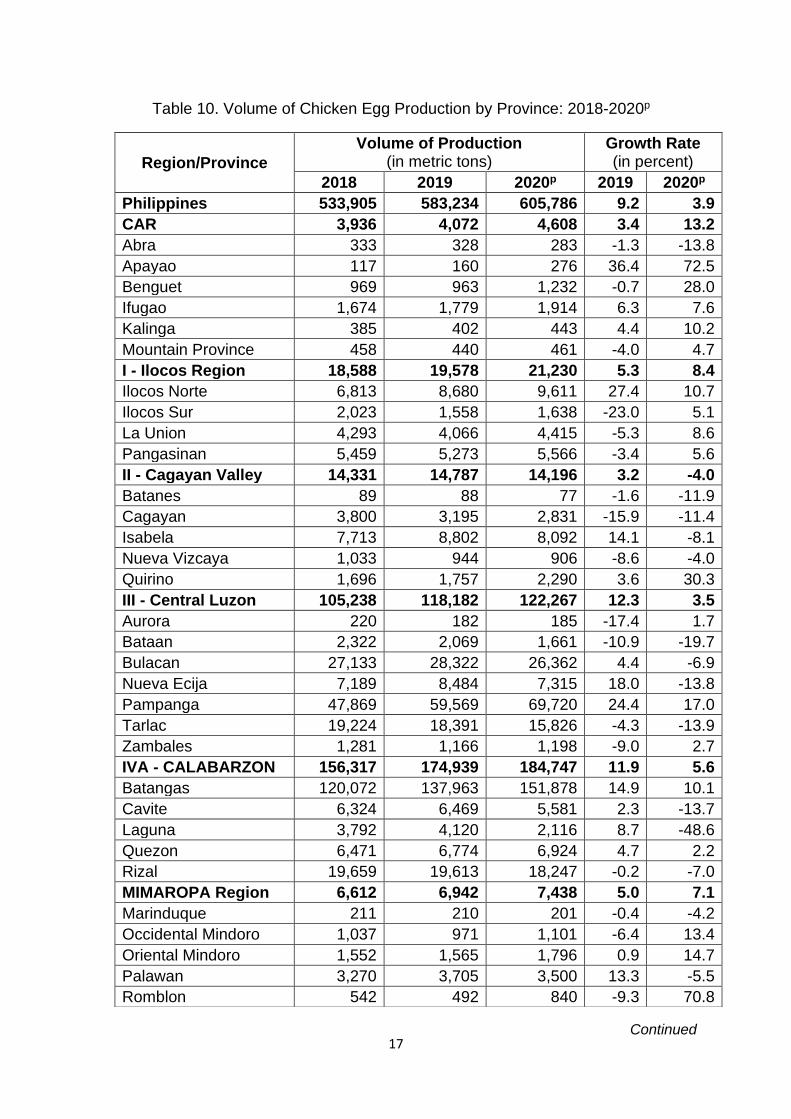
Among the provinces, Batangas was the top producer of chicken egg in 2020 with 151.88 thousand metric tons. This was followed by Pampanga with 69.72 thousand metric tons and Cebu with 45.99 thousand metric tons. The other top chicken egg-producing provinces in 2020 were Bukidnon, Bulacan, South Cotabato, Davao City, Rizal, Tarlac and Negros Occidental. The combined output of these top 10 producing provinces accounted for 69.2 percent of the country’s total chicken egg production. (Figure 7 and Table 10)
Figure 8. Thematic Map of Volume of Chicken Egg Production (by province), Philippines: January-December 2020p
p– Preliminary Source: Philippine Statistics Authority
Chicken Egg Production in metric ton
14,001 - 160,000 5,001 - 14,000
2,001 - 5,000 1,001 - 2,000 60 - 1,000
7
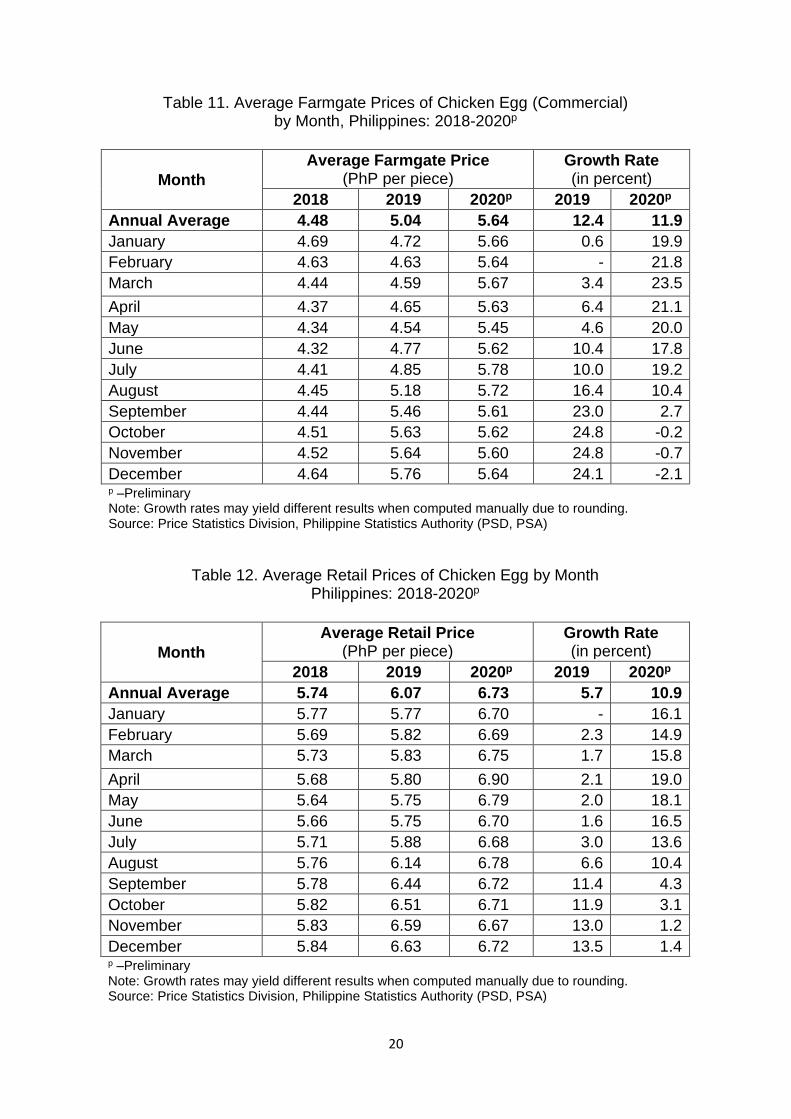
2. Prices a. Farmgate Price
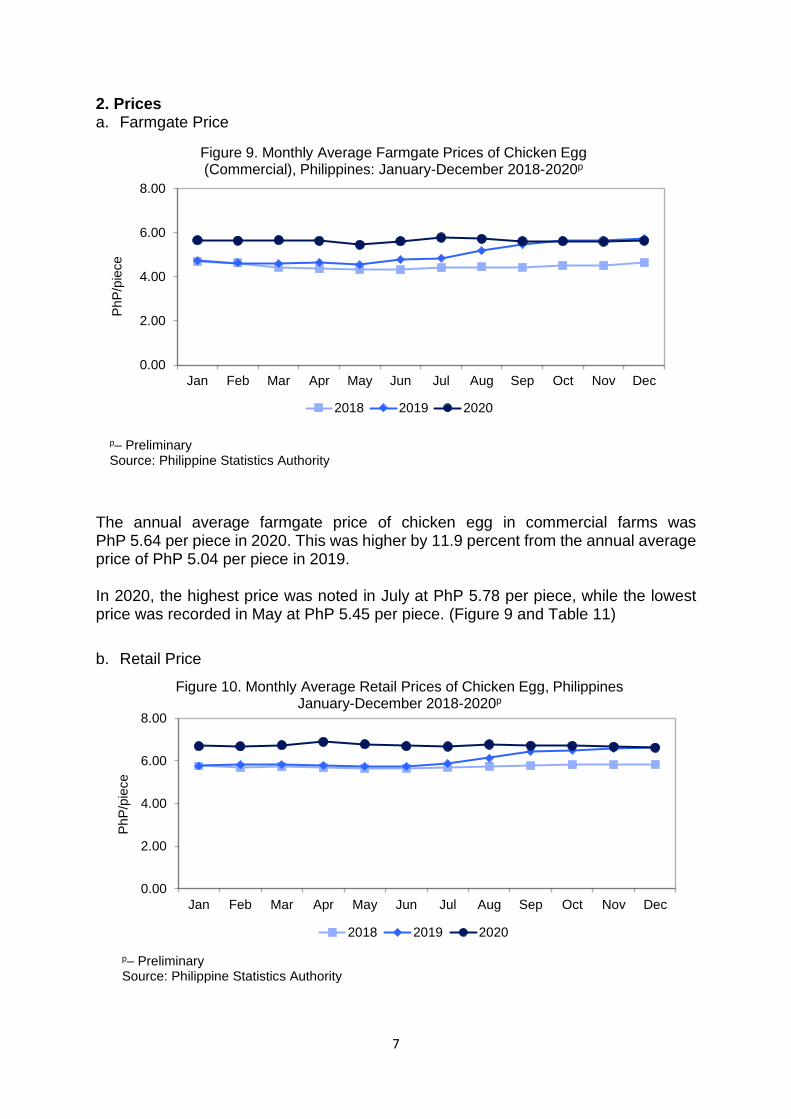
The annual average farmgate price of chicken egg in commercial farms was PhP 5.64 per piece in 2020. This was higher by 11.9 percent from the annual average price of PhP 5.04 per piece in 2019. In 2020, the highest price was noted in July at PhP 5.78 per piece, while the lowest price was recorded in May at PhP 5.45 per piece. (Figure 9 and Table 11)
b. Retail Price
p– Preliminary Source: Philippine Statistics Authority
p– Preliminary Source: Philippine Statistics Authority
0.00
2.00
4.00
6.00
8.00
Jan Feb Mar Apr May Jun Jul Aug Sep Oct Nov Dec
PhP
/pie
ce
Figure 9. Monthly Average Farmgate Prices of Chicken Egg (Commercial), Philippines: January-December 2018-2020p
2018 2019 2020
0.00
2.00
4.00
6.00
8.00
Jan Feb Mar Apr May Jun Jul Aug Sep Oct Nov Dec
PhP
/pie
ce
Figure 10. Monthly Average Retail Prices of Chicken Egg, PhilippinesJanuary-December 2018-2020p
2018 2019 2020
8
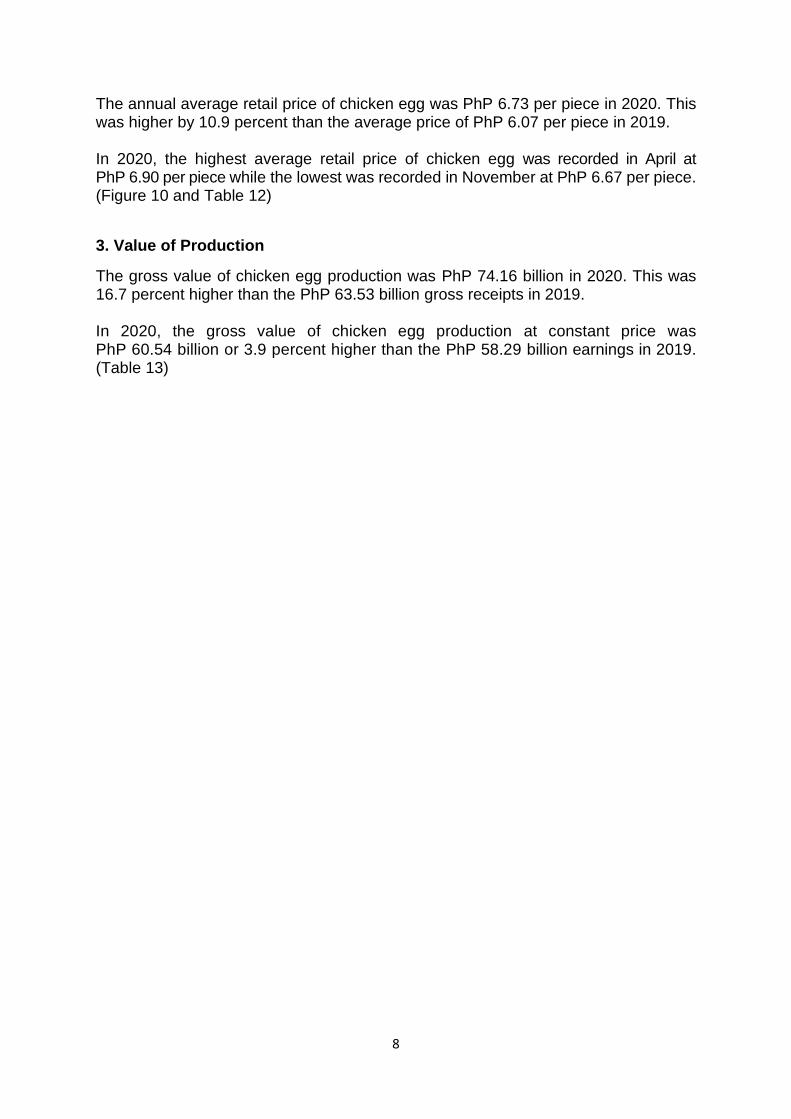
The annual average retail price of chicken egg was PhP 6.73 per piece in 2020. This was higher by 10.9 percent than the average price of PhP 6.07 per piece in 2019. In 2020, the highest average retail price of chicken egg was recorded in April at PhP 6.90 per piece while the lowest was recorded in November at PhP 6.67 per piece. (Figure 10 and Table 12)
3. Value of Production
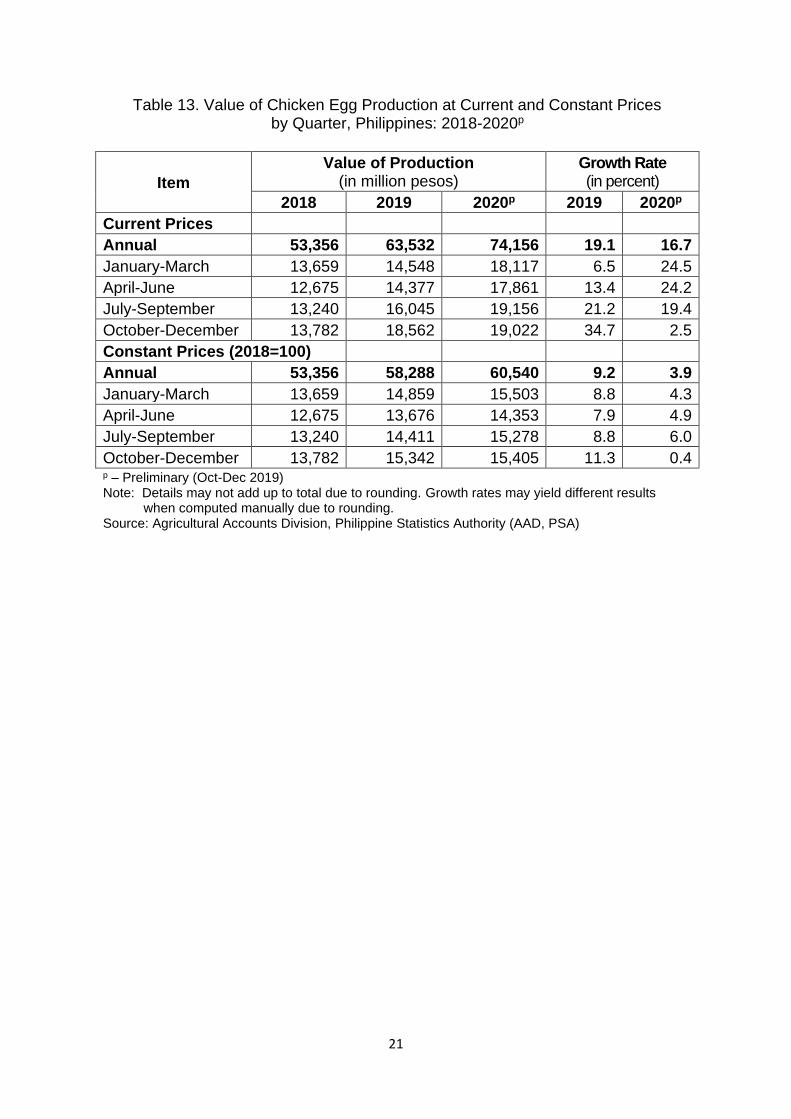
The gross value of chicken egg production was PhP 74.16 billion in 2020. This was 16.7 percent higher than the PhP 63.53 billion gross receipts in 2019. In 2020, the gross value of chicken egg production at constant price was PhP 60.54 billion or 3.9 percent higher than the PhP 58.29 billion earnings in 2019. (Table 13)

STATISTICAL TABLES
10
Table 1. Volume of Chicken Production by Quarter, Philippines: 2018-2020p
Item
Volume of Production (in metric tons, liveweight)
Growth Rate (in percent)
2018 2019 2020p 2019 2020p
Annual 1,836,664 1,927,414 1,809,853 4.9 -6.1
January-March 439,956 459,060 453,723 4.3 -1.2
April-June 462,704 477,113 439,996 3.1 -7.8
July-September 428,768 465,147 431,770 8.5 -7.2
October-December 505,236 526,095 484,364 4.1 -7.9 p – Preliminary (Oct-Dec 2020) Note: Details may not add up to total due to rounding. Growth rates may yield different results when computed manually due to rounding. Source: Philippine Statistics Authority
Table 2. Volume of Chicken Production by Region, Philippines: 2018-2020p
Region
Volume of Production (in metric tons, liveweight)
Growth Rate (in percent)
Percent Share to
2020p 2018 2019 2020p 2019 2020p
Philippines 1,836,664 1,927,414 1,809,853 4.9 -6.1 100.0
CAR 7,278 6,622 6,136 -9.0 -7.3 0.3
I – Ilocos Region 84,933 84,231 84,535 -0.8 0.4 4.7
II – Cagayan Valley 57,894 55,372 53,693 -4.4 -3.0 3.0
III – Central Luzon 658,909 699,655 635,384 6.2 -9.2 35.1
IVA – CALABARZON 330,940 343,265 317,186 3.7 -7.6 17.5
MIMAROPA Region 10,868 11,174 10,905 2.8 -2.4 0.6
V – Bicol Region 47,178 54,884 46,288 16.3 -15.7 2.6
VI – Western Visayas 110,012 117,439 117,019 6.8 -0.4 6.5
VII – Central Visayas 115,114 118,628 108,705 3.1 -8.4 6.0
VIII – Eastern Visayas 55,000 62,322 56,588 13.3 -9.2 3.1
IX – Zamboanga Peninsula 34,236 36,476 35,848 6.5 -1.7 2.0
X – Northern Mindanao 164,672 170,021 170,932 3.2 0.5 9.4
XI – Davao Region 76,341 81,090 74,380 6.2 -8.3 4.1
XII – SOCCSKSARGEN 61,916 65,563 71,209 5.9 8.6 3.9
XIII – Caraga 16,277 15,513 15,412 -4.7 -0.7 0.9
BARMM 5,096 5,161 5,634 1.3 9.2 0.3 p – Preliminary Note: Details may not add up to total due to rounding. Growth rates and percent share may yield different results when computed manually due to rounding. Source: Philippine Statistics Authority
11
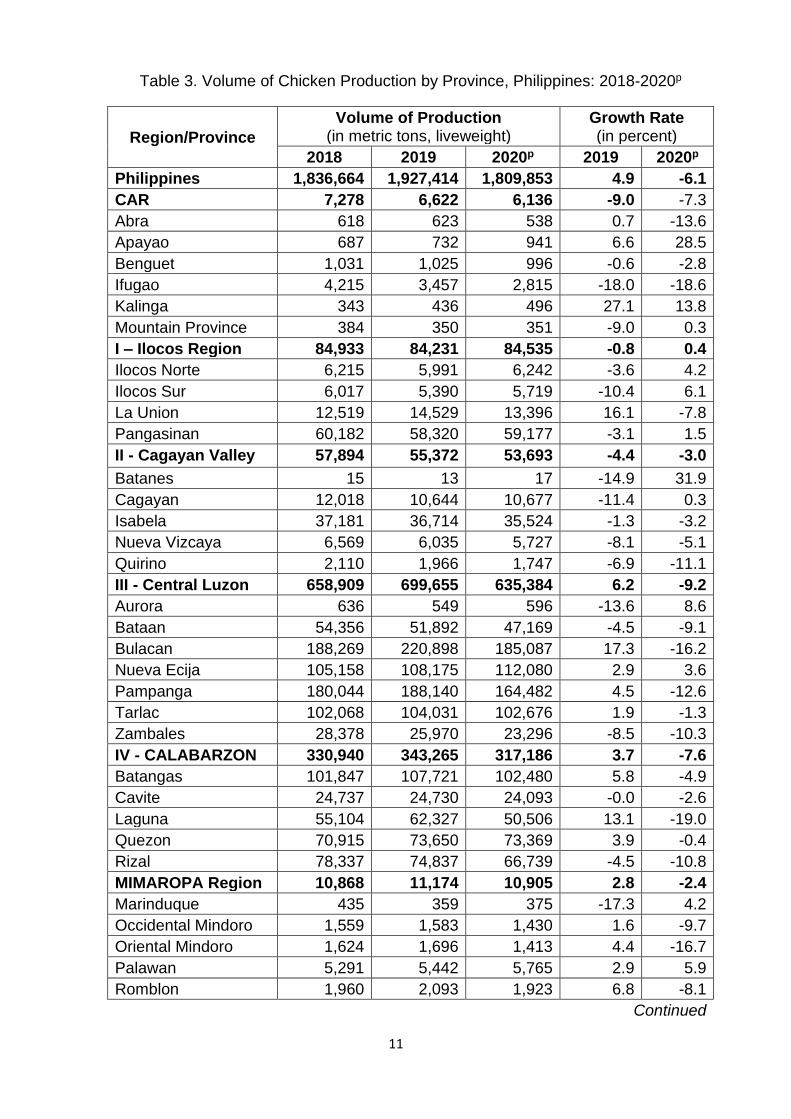
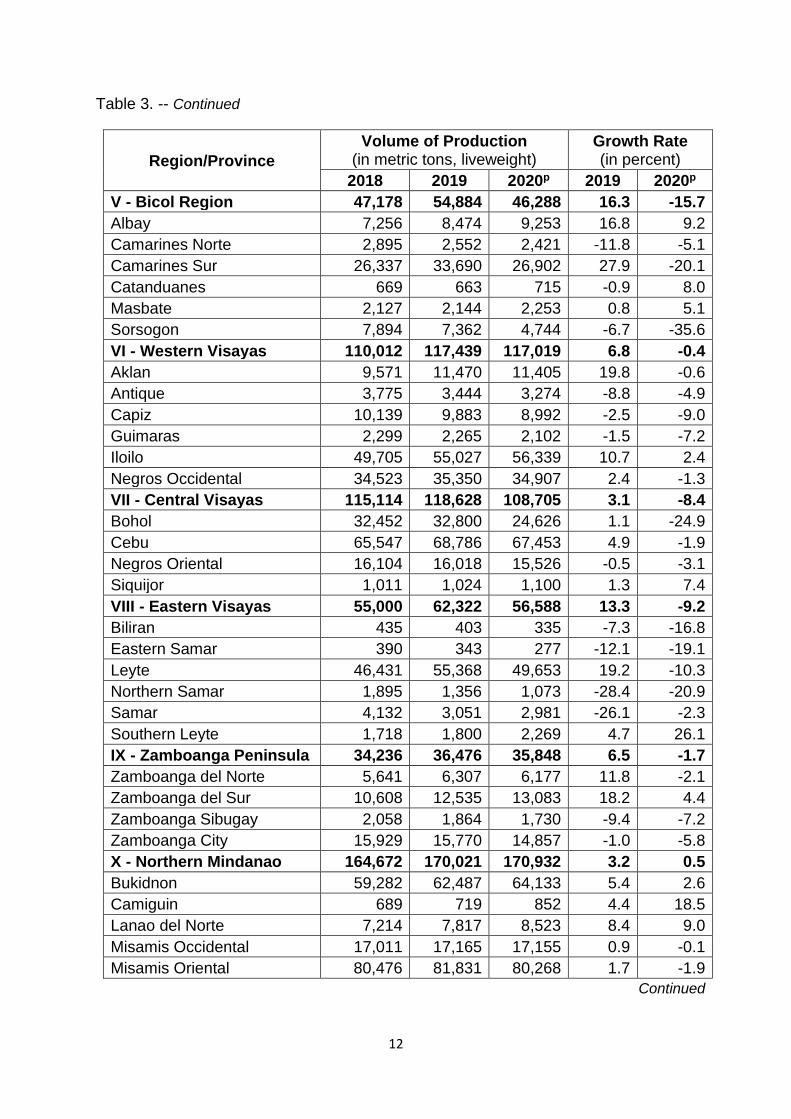
Table 3. Volume of Chicken Production by Province, Philippines: 2018-2020p
Region/Province
Volume of Production (in metric tons, liveweight)
Growth Rate (in percent)
2018 2019 2020p 2019 2020p
Philippines 1,836,664 1,927,414 1,809,853 4.9 -6.1
CAR 7,278 6,622 6,136 -9.0 -7.3
Abra 618 623 538 0.7 -13.6
Apayao 687 732 941 6.6 28.5
Benguet 1,031 1,025 996 -0.6 -2.8
Ifugao 4,215 3,457 2,815 -18.0 -18.6
Kalinga 343 436 496 27.1 13.8
Mountain Province 384 350 351 -9.0 0.3
I – Ilocos Region 84,933 84,231 84,535 -0.8 0.4
Ilocos Norte 6,215 5,991 6,242 -3.6 4.2
Ilocos Sur 6,017 5,390 5,719 -10.4 6.1
La Union 12,519 14,529 13,396 16.1 -7.8
Pangasinan 60,182 58,320 59,177 -3.1 1.5
II - Cagayan Valley 57,894 55,372 53,693 -4.4 -3.0
Batanes 15 13 17 -14.9 31.9
Cagayan 12,018 10,644 10,677 -11.4 0.3
Isabela 37,181 36,714 35,524 -1.3 -3.2
Nueva Vizcaya 6,569 6,035 5,727 -8.1 -5.1
Quirino 2,110 1,966 1,747 -6.9 -11.1
III - Central Luzon 658,909 699,655 635,384 6.2 -9.2
Aurora 636 549 596 -13.6 8.6
Bataan 54,356 51,892 47,169 -4.5 -9.1
Bulacan 188,269 220,898 185,087 17.3 -16.2
Nueva Ecija 105,158 108,175 112,080 2.9 3.6
Pampanga 180,044 188,140 164,482 4.5 -12.6
Tarlac 102,068 104,031 102,676 1.9 -1.3
Zambales 28,378 25,970 23,296 -8.5 -10.3
IV - CALABARZON 330,940 343,265 317,186 3.7 -7.6
Batangas 101,847 107,721 102,480 5.8 -4.9
Cavite 24,737 24,730 24,093 -0.0 -2.6
Laguna 55,104 62,327 50,506 13.1 -19.0
Quezon 70,915 73,650 73,369 3.9 -0.4
Rizal 78,337 74,837 66,739 -4.5 -10.8
MIMAROPA Region 10,868 11,174 10,905 2.8 -2.4
Marinduque 435 359 375 -17.3 4.2
Occidental Mindoro 1,559 1,583 1,430 1.6 -9.7
Oriental Mindoro 1,624 1,696 1,413 4.4 -16.7
Palawan 5,291 5,442 5,765 2.9 5.9
Romblon 1,960 2,093 1,923 6.8 -8.1
Continued
12
Table 3. -- Continued
Region/Province
Volume of Production (in metric tons, liveweight)
Growth Rate (in percent)
2018 2019 2020p 2019 2020p
V - Bicol Region 47,178 54,884 46,288 16.3 -15.7
Albay 7,256 8,474 9,253 16.8 9.2
Camarines Norte 2,895 2,552 2,421 -11.8 -5.1
Camarines Sur 26,337 33,690 26,902 27.9 -20.1
Catanduanes 669 663 715 -0.9 8.0
Masbate 2,127 2,144 2,253 0.8 5.1
Sorsogon 7,894 7,362 4,744 -6.7 -35.6
VI - Western Visayas 110,012 117,439 117,019 6.8 -0.4
Aklan 9,571 11,470 11,405 19.8 -0.6
Antique 3,775 3,444 3,274 -8.8 -4.9
Capiz 10,139 9,883 8,992 -2.5 -9.0
Guimaras 2,299 2,265 2,102 -1.5 -7.2
Iloilo 49,705 55,027 56,339 10.7 2.4
Negros Occidental 34,523 35,350 34,907 2.4 -1.3
VII - Central Visayas 115,114 118,628 108,705 3.1 -8.4
Bohol 32,452 32,800 24,626 1.1 -24.9
Cebu 65,547 68,786 67,453 4.9 -1.9
Negros Oriental 16,104 16,018 15,526 -0.5 -3.1
Siquijor 1,011 1,024 1,100 1.3 7.4
VIII - Eastern Visayas 55,000 62,322 56,588 13.3 -9.2
Biliran 435 403 335 -7.3 -16.8
Eastern Samar 390 343 277 -12.1 -19.1
Leyte 46,431 55,368 49,653 19.2 -10.3
Northern Samar 1,895 1,356 1,073 -28.4 -20.9
Samar 4,132 3,051 2,981 -26.1 -2.3
Southern Leyte 1,718 1,800 2,269 4.7 26.1
IX - Zamboanga Peninsula 34,236 36,476 35,848 6.5 -1.7
Zamboanga del Norte 5,641 6,307 6,177 11.8 -2.1
Zamboanga del Sur 10,608 12,535 13,083 18.2 4.4
Zamboanga Sibugay 2,058 1,864 1,730 -9.4 -7.2
Zamboanga City 15,929 15,770 14,857 -1.0 -5.8
X - Northern Mindanao 164,672 170,021 170,932 3.2 0.5
Bukidnon 59,282 62,487 64,133 5.4 2.6
Camiguin 689 719 852 4.4 18.5
Lanao del Norte 7,214 7,817 8,523 8.4 9.0
Misamis Occidental 17,011 17,165 17,155 0.9 -0.1
Misamis Oriental 80,476 81,831 80,268 1.7 -1.9
Continued
13
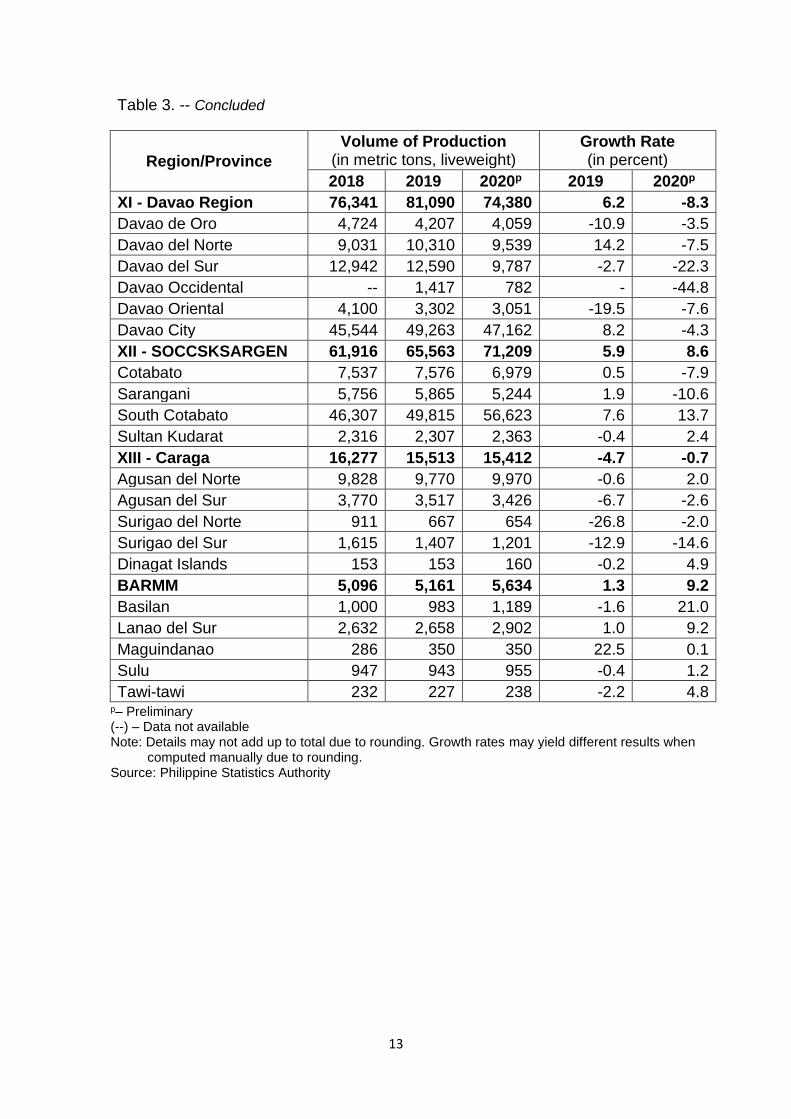
Table 3. -- Concluded
Region/Province
Volume of Production (in metric tons, liveweight)
Growth Rate (in percent)
2018 2019 2020p 2019 2020p
XI - Davao Region 76,341 81,090 74,380 6.2 -8.3
Davao de Oro 4,724 4,207 4,059 -10.9 -3.5
Davao del Norte 9,031 10,310 9,539 14.2 -7.5
Davao del Sur 12,942 12,590 9,787 -2.7 -22.3
Davao Occidental -- 1,417 782 - -44.8
Davao Oriental 4,100 3,302 3,051 -19.5 -7.6
Davao City 45,544 49,263 47,162 8.2 -4.3
XII - SOCCSKSARGEN 61,916 65,563 71,209 5.9 8.6
Cotabato 7,537 7,576 6,979 0.5 -7.9
Sarangani 5,756 5,865 5,244 1.9 -10.6
South Cotabato 46,307 49,815 56,623 7.6 13.7
Sultan Kudarat 2,316 2,307 2,363 -0.4 2.4
XIII - Caraga 16,277 15,513 15,412 -4.7 -0.7
Agusan del Norte 9,828 9,770 9,970 -0.6 2.0
Agusan del Sur 3,770 3,517 3,426 -6.7 -2.6
Surigao del Norte 911 667 654 -26.8 -2.0
Surigao del Sur 1,615 1,407 1,201 -12.9 -14.6
Dinagat Islands 153 153 160 -0.2 4.9
BARMM 5,096 5,161 5,634 1.3 9.2
Basilan 1,000 983 1,189 -1.6 21.0
Lanao del Sur 2,632 2,658 2,902 1.0 9.2
Maguindanao 286 350 350 22.5 0.1
Sulu 947 943 955 -0.4 1.2
Tawi-tawi 232 227 238 -2.2 4.8 p– Preliminary (--) – Data not available Note: Details may not add up to total due to rounding. Growth rates may yield different results when computed manually due to rounding. Source: Philippine Statistics Authority
14
Table 4. Average Farmgate Prices of Broiler Chicken (Commercial) by Month, Philippines: 2018-2020p
Month
Average Farmgate Price (PhP per kilogram, liveweight)
Growth Rate (in percent)
2018 2019 2020p 2019 2020p
Annual Average 84.79 80.80 75.91 -4.7 -6.1
January 89.82 68.32 78.59 -23.9 15.0
February 87.30 73.96 79.96 -15.3 8.1
March 85.49 76.31 65.56 -10.7 -14.1
April 87.78 67.70 61.37 -22.9 -9.4
May 85.23 72.74 63.68 -14.7 -12.5
June 87.53 83.06 77.29 -5.1 -6.9
July 91.57 76.65 74.95 -16.3 -2.2
August 91.34 85.71 66.90 -6.2 -21.9
September 79.07 91.38 80.27 15.6 -12.2
October 80.33 98.98 78.07 23.2 -21.1
November 75.75 88.18 90.42 16.4 2.5
December 76.31 86.57 93.82 13.4 8.4 p – Preliminary Note: Growth rates may yield different results when computed manually due to rounding. Source: Price Statistics Division, Philippine Statistics Authority (PSD, PSA)
Table 5. Average Retail Prices of Broiler Chicken by Month Philippines: 2018-2020p
Month
Average Retail Price (PhP per kilogram)
Growth Rate (in percent)
2018 2019 2020p 2019 2020p
Annual Average 152.29 155.35 155.71 2.0 0.2
January 150.92 149.26 164.54 -1.1 10.2
February 151.14 148.50 161.53 -1.7 8.8
March 150.56 148.86 158.98 -1.1 6.8
April 150.11 148.20 155.09 -1.3 4.6
May 151.35 148.64 151.12 -1.8 1.7
June 152.01 152.48 153.58 0.3 0.7
July 152.87 156.30 154.13 2.2 -1.4
August 155.18 157.44 151.98 1.5 -3.5
September 154.19 158.44 150.87 2.8 -4.8
October 153.24 162.78 152.16 6.2 -6.5
November 152.92 166.75 153.68 9.0 -7.8
December 153.01 166.62 160.90 8.9 -3.4 p – Preliminary Note: Growth rates may yield different results when computed manually due to rounding. Source: Price Statistics Division, Philippine Statistics Authority (PSD, PSA)

15
Table 6. Value of Chicken Production at Current and Constant Prices
by Quarter, Philippines: 2018-2020p
Item
Value of Production (in million pesos)
Growth Rate (in percent)
2018 2019 2020p 2019 2020p
Current Prices
Annual 170,724 173,939 159,173 1.9 -8.5
January-March 41,791 38,249 39,265 -8.5 2.7
April-June 43,509 40,193 35,240 -7.6 -12.3
July-September 41,085 43,359 37,342 5.5 -13.9
October-December 44,339 52,138 47,326 17.6 -9.2
Constant Prices (2018=100)
Annual 170,724 179,210 168,352 5.0 -6.1
January-March 41,791 43,606 43,099 4.3 -1.2
April-June 43,509 44,864 41,374 3.1 -7.8
July-September 41,085 44,571 41,372 8.5 -7.2
October-December 44,339 46,170 42,507 4.1 -7.9 p – Preliminary (Oct to Dec 2020) Note: Details may not add up to total due to rounding. Growth rates may yield different results when computed manually due to rounding. Source: Agricultural Accounts Division, Philippine Statistics Authority (AAD, PSA)
Table 7. Volume and Value of Imported Chicken Meat by Quarter, Philippines: 2018-2020p
Item 2018 2019 2020p
Growth Rate (in percent)
2019 2020p
Volume (in metric ton)
Annual 293,218 339,672 318,407 15.8 -6.3
January-March 55,060 79,916 105,722 45.1 32.3
April-June 84,981 66,732 57,794 -21.5 -13.4
July-September 66,238 84,032 76,784 26.9 -8.6
October-December 86,939 108,993 78,108 25.4 -28.3
Value (in CIF ‘000 USD)
Annual 281,478 328,879 311,577 16.8 -5.3
January-March 52,211 76,762 109,495 47.0 42.6
April-June 79,968 59,468 54,602 -25.6 -8.2
July-September 63,104 81,359 70,423 28.9 -13.4
October-December 86,195 111,291 77,057 29.1 -30.8 p – Preliminary CIF - Cost, Insurance and Freight Note: Details may not add up to total due to rounding. Growth rates may yield different results when
computed manually due to rounding. Source: Trade Statistics Division, Philippine Statistics Authority (TSD, PSA)
16
Table 8. Volume of Chicken Egg Production by Quarter, Philippines: 2018-2020p
Item
Volume of Production (in metric tons)
Growth Rate (in percent)
2018 2019 2020p 2019 2020p
Annual 533,905 583,234 605,786 9.2 3.9
January-March 130,549 142,011 148,171 8.8 4.3
April-June 131,095 141,451 148,453 7.9 5.0
July-September 133,717 145,544 154,295 8.8 6.0
October-December 138,544 154,228 154,867 11.3 0.4 p - Preliminary (Oct-Dec 2020) Note: Details may not add up to total due to rounding. Growth rates may yield different results when computed manually due to rounding. Source: Philippine Statistics Authority
Table 9. Volume of Chicken Egg Production by Region, Philippines: 2018-2020p
Region
Volume of Production (in metric tons)
Growth Rate (in percent)
Percent Share
to 2020p 2018 2019 2020p 2019 2020p
Philippines 533,905 583,234 605,786 9.2 3.9 100.0
CAR 3,936 4,072 4,608 3.5 13.2 0.8
I - Ilocos Region 18,588 19,578 21,230 5.3 8.4 3.5
II - Cagayan Valley 14,331 14,787 14,196 3.2 -4.0 2.3
III - Central Luzon 105,238 118,182 122,267 12.3 3.5 20.2
IVA - CALABARZON 156,317 174,939 184,747 11.9 5.6 30.5
MIMAROPA Region 6,612 6,942 7,438 5.0 7.1 1.2
V - Bicol Region 13,434 14,836 14,856 10.4 0.1 2.5
VI - Western Visayas 34,351 35,939 37,017 4.6 3.0 6.1
VII - Central Visayas 52,139 53,863 55,181 3.3 2.4 9.1
VIII - Eastern Visayas 4,253 4,547 5,841 6.9 28.5 1.0
IX - Zamboanga Peninsula 13,519 16,185 16,882 19.7 4.3 2.8
X - Northern Mindanao 47,788 49,204 52,093 3.0 5.9 8.6
XI - Davao Region 26,123 31,651 30,134 21.2 -4.8 5.0
XII - SOCCSKSARGEN 25,846 27,145 27,013 5.0 -0.5 4.5
XIII - Caraga 8,174 8,017 8,490 -1.9 5.9 1.4
BARMM 3,256 3,347 3,794 2.8 13.3 0.6 p - Preliminary (Oct-Dec 2020) Note: Details may not add up to total due to rounding. Growth rates may yield different results when computed manually due to rounding. Source: Philippine Statistics Authority
17
Continued
Table 10. Volume of Chicken Egg Production by Province: 2018-2020p
Region/Province
Volume of Production (in metric tons)
Growth Rate (in percent)
2018 2019 2020p 2019 2020p
Philippines 533,905 583,234 605,786 9.2 3.9
CAR 3,936 4,072 4,608 3.4 13.2
Abra 333 328 283 -1.3 -13.8
Apayao 117 160 276 36.4 72.5
Benguet 969 963 1,232 -0.7 28.0
Ifugao 1,674 1,779 1,914 6.3 7.6
Kalinga 385 402 443 4.4 10.2
Mountain Province 458 440 461 -4.0 4.7
I - Ilocos Region 18,588 19,578 21,230 5.3 8.4
Ilocos Norte 6,813 8,680 9,611 27.4 10.7
Ilocos Sur 2,023 1,558 1,638 -23.0 5.1
La Union 4,293 4,066 4,415 -5.3 8.6
Pangasinan 5,459 5,273 5,566 -3.4 5.6
II - Cagayan Valley 14,331 14,787 14,196 3.2 -4.0
Batanes 89 88 77 -1.6 -11.9
Cagayan 3,800 3,195 2,831 -15.9 -11.4
Isabela 7,713 8,802 8,092 14.1 -8.1
Nueva Vizcaya 1,033 944 906 -8.6 -4.0
Quirino 1,696 1,757 2,290 3.6 30.3
III - Central Luzon 105,238 118,182 122,267 12.3 3.5
Aurora 220 182 185 -17.4 1.7
Bataan 2,322 2,069 1,661 -10.9 -19.7
Bulacan 27,133 28,322 26,362 4.4 -6.9
Nueva Ecija 7,189 8,484 7,315 18.0 -13.8
Pampanga 47,869 59,569 69,720 24.4 17.0
Tarlac 19,224 18,391 15,826 -4.3 -13.9
Zambales 1,281 1,166 1,198 -9.0 2.7
IVA - CALABARZON 156,317 174,939 184,747 11.9 5.6
Batangas 120,072 137,963 151,878 14.9 10.1
Cavite 6,324 6,469 5,581 2.3 -13.7
Laguna 3,792 4,120 2,116 8.7 -48.6
Quezon 6,471 6,774 6,924 4.7 2.2
Rizal 19,659 19,613 18,247 -0.2 -7.0
MIMAROPA Region 6,612 6,942 7,438 5.0 7.1
Marinduque 211 210 201 -0.4 -4.2
Occidental Mindoro 1,037 971 1,101 -6.4 13.4
Oriental Mindoro 1,552 1,565 1,796 0.9 14.7
Palawan 3,270 3,705 3,500 13.3 -5.5
Romblon 542 492 840 -9.3 70.8
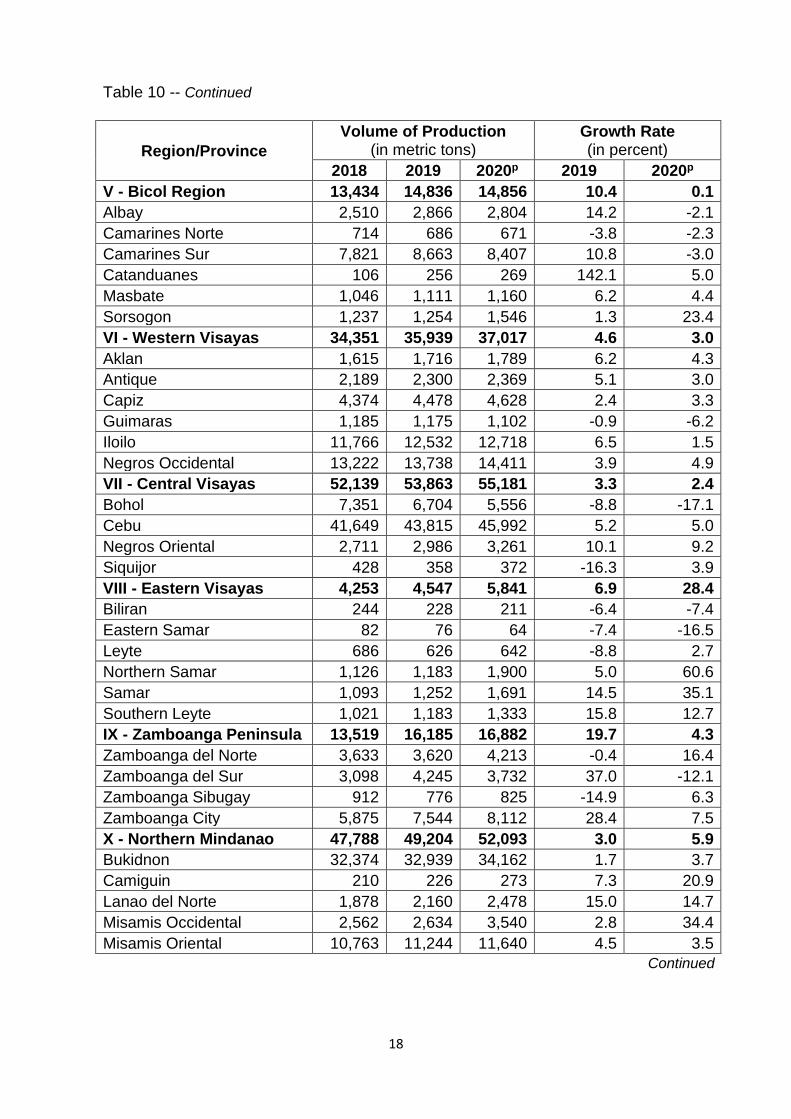
18
Table 10 -- Continued
Region/Province
Volume of Production (in metric tons)
Growth Rate (in percent)
2018 2019 2020p 2019 2020p
V - Bicol Region 13,434 14,836 14,856 10.4 0.1
Albay 2,510 2,866 2,804 14.2 -2.1
Camarines Norte 714 686 671 -3.8 -2.3
Camarines Sur 7,821 8,663 8,407 10.8 -3.0
Catanduanes 106 256 269 142.1 5.0
Masbate 1,046 1,111 1,160 6.2 4.4
Sorsogon 1,237 1,254 1,546 1.3 23.4
VI - Western Visayas 34,351 35,939 37,017 4.6 3.0
Aklan 1,615 1,716 1,789 6.2 4.3
Antique 2,189 2,300 2,369 5.1 3.0
Capiz 4,374 4,478 4,628 2.4 3.3
Guimaras 1,185 1,175 1,102 -0.9 -6.2
Iloilo 11,766 12,532 12,718 6.5 1.5
Negros Occidental 13,222 13,738 14,411 3.9 4.9
VII - Central Visayas 52,139 53,863 55,181 3.3 2.4
Bohol 7,351 6,704 5,556 -8.8 -17.1
Cebu 41,649 43,815 45,992 5.2 5.0
Negros Oriental 2,711 2,986 3,261 10.1 9.2
Siquijor 428 358 372 -16.3 3.9
VIII - Eastern Visayas 4,253 4,547 5,841 6.9 28.4
Biliran 244 228 211 -6.4 -7.4
Eastern Samar 82 76 64 -7.4 -16.5
Leyte 686 626 642 -8.8 2.7
Northern Samar 1,126 1,183 1,900 5.0 60.6
Samar 1,093 1,252 1,691 14.5 35.1
Southern Leyte 1,021 1,183 1,333 15.8 12.7
IX - Zamboanga Peninsula 13,519 16,185 16,882 19.7 4.3
Zamboanga del Norte 3,633 3,620 4,213 -0.4 16.4
Zamboanga del Sur 3,098 4,245 3,732 37.0 -12.1
Zamboanga Sibugay 912 776 825 -14.9 6.3
Zamboanga City 5,875 7,544 8,112 28.4 7.5
X - Northern Mindanao 47,788 49,204 52,093 3.0 5.9
Bukidnon 32,374 32,939 34,162 1.7 3.7
Camiguin 210 226 273 7.3 20.9
Lanao del Norte 1,878 2,160 2,478 15.0 14.7
Misamis Occidental 2,562 2,634 3,540 2.8 34.4
Misamis Oriental 10,763 11,244 11,640 4.5 3.5
Continued
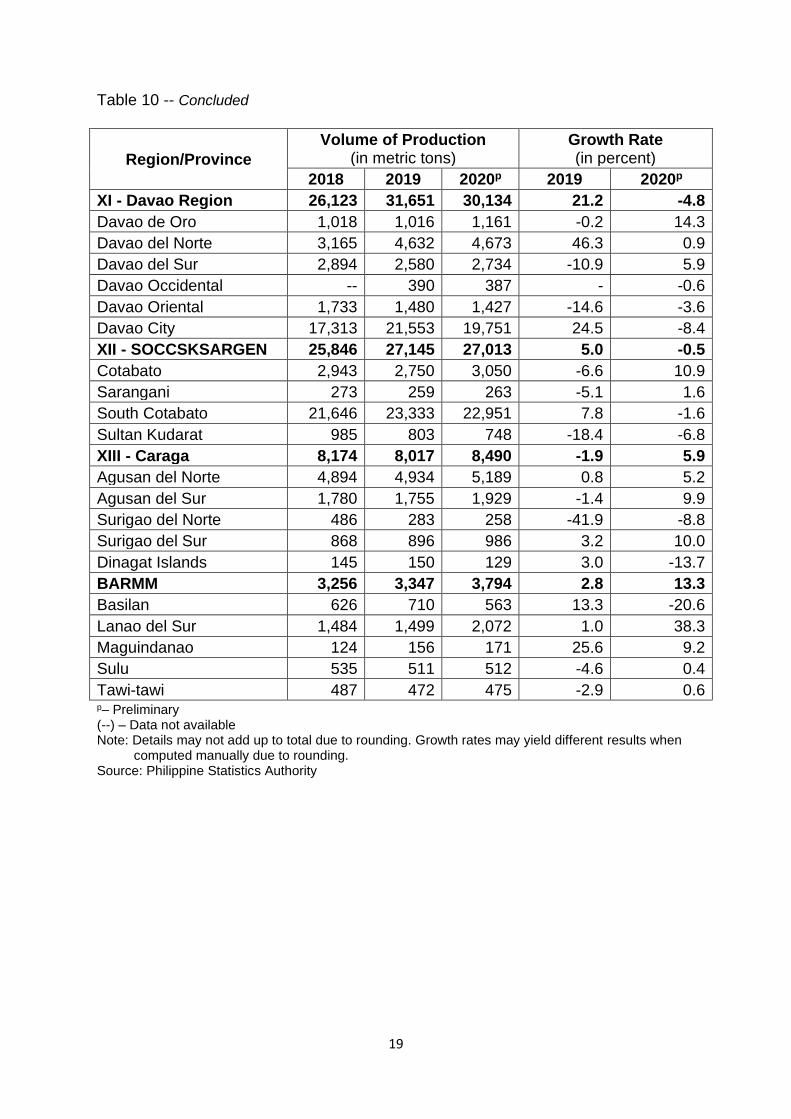
19
Table 10 -- Concluded
Region/Province
Volume of Production (in metric tons)
Growth Rate (in percent)
2018 2019 2020p 2019 2020p
XI - Davao Region 26,123 31,651 30,134 21.2 -4.8
Davao de Oro 1,018 1,016 1,161 -0.2 14.3
Davao del Norte 3,165 4,632 4,673 46.3 0.9
Davao del Sur 2,894 2,580 2,734 -10.9 5.9
Davao Occidental -- 390 387 - -0.6
Davao Oriental 1,733 1,480 1,427 -14.6 -3.6
Davao City 17,313 21,553 19,751 24.5 -8.4
XII - SOCCSKSARGEN 25,846 27,145 27,013 5.0 -0.5
Cotabato 2,943 2,750 3,050 -6.6 10.9
Sarangani 273 259 263 -5.1 1.6
South Cotabato 21,646 23,333 22,951 7.8 -1.6
Sultan Kudarat 985 803 748 -18.4 -6.8
XIII - Caraga 8,174 8,017 8,490 -1.9 5.9
Agusan del Norte 4,894 4,934 5,189 0.8 5.2
Agusan del Sur 1,780 1,755 1,929 -1.4 9.9
Surigao del Norte 486 283 258 -41.9 -8.8
Surigao del Sur 868 896 986 3.2 10.0
Dinagat Islands 145 150 129 3.0 -13.7
BARMM 3,256 3,347 3,794 2.8 13.3
Basilan 626 710 563 13.3 -20.6
Lanao del Sur 1,484 1,499 2,072 1.0 38.3
Maguindanao 124 156 171 25.6 9.2
Sulu 535 511 512 -4.6 0.4
Tawi-tawi 487 472 475 -2.9 0.6 p– Preliminary (--) – Data not available Note: Details may not add up to total due to rounding. Growth rates may yield different results when computed manually due to rounding. Source: Philippine Statistics Authority
20
Table 11. Average Farmgate Prices of Chicken Egg (Commercial) by Month, Philippines: 2018-2020p
Month
Average Farmgate Price (PhP per piece)
Growth Rate (in percent)
2018 2019 2020p 2019 2020p
Annual Average 4.48 5.04 5.64 12.4 11.9
January 4.69 4.72 5.66 0.6 19.9
February 4.63 4.63 5.64 - 21.8
March 4.44 4.59 5.67 3.4 23.5
April 4.37 4.65 5.63 6.4 21.1
May 4.34 4.54 5.45 4.6 20.0
June 4.32 4.77 5.62 10.4 17.8
July 4.41 4.85 5.78 10.0 19.2
August 4.45 5.18 5.72 16.4 10.4
September 4.44 5.46 5.61 23.0 2.7
October 4.51 5.63 5.62 24.8 -0.2
November 4.52 5.64 5.60 24.8 -0.7
December 4.64 5.76 5.64 24.1 -2.1 p –Preliminary Note: Growth rates may yield different results when computed manually due to rounding. Source: Price Statistics Division, Philippine Statistics Authority (PSD, PSA)
Table 12. Average Retail Prices of Chicken Egg by Month Philippines: 2018-2020p
Month
Average Retail Price (PhP per piece)
Growth Rate (in percent)
2018 2019 2020p 2019 2020p
Annual Average 5.74 6.07 6.73 5.7 10.9
January 5.77 5.77 6.70 - 16.1
February 5.69 5.82 6.69 2.3 14.9
March 5.73 5.83 6.75 1.7 15.8
April 5.68 5.80 6.90 2.1 19.0
May 5.64 5.75 6.79 2.0 18.1
June 5.66 5.75 6.70 1.6 16.5
July 5.71 5.88 6.68 3.0 13.6
August 5.76 6.14 6.78 6.6 10.4
September 5.78 6.44 6.72 11.4 4.3
October 5.82 6.51 6.71 11.9 3.1
November 5.83 6.59 6.67 13.0 1.2
December 5.84 6.63 6.72 13.5 1.4 p –Preliminary Note: Growth rates may yield different results when computed manually due to rounding. Source: Price Statistics Division, Philippine Statistics Authority (PSD, PSA)
21
Table 13. Value of Chicken Egg Production at Current and Constant Prices by Quarter, Philippines: 2018-2020p
Item
Value of Production (in million pesos)
Growth Rate (in percent)
2018 2019 2020p 2019 2020p
Current Prices
Annual 53,356 63,532 74,156 19.1 16.7
January-March 13,659 14,548 18,117 6.5 24.5
April-June 12,675 14,377 17,861 13.4 24.2
July-September 13,240 16,045 19,156 21.2 19.4
October-December 13,782 18,562 19,022 34.7 2.5
Constant Prices (2018=100)
Annual 53,356 58,288 60,540 9.2 3.9
January-March 13,659 14,859 15,503 8.8 4.3
April-June 12,675 13,676 14,353 7.9 4.9
July-September 13,240 14,411 15,278 8.8 6.0
October-December 13,782 15,342 15,405 11.3 0.4 p – Preliminary (Oct-Dec 2019) Note: Details may not add up to total due to rounding. Growth rates may yield different results when computed manually due to rounding. Source: Agricultural Accounts Division, Philippine Statistics Authority (AAD, PSA)
22
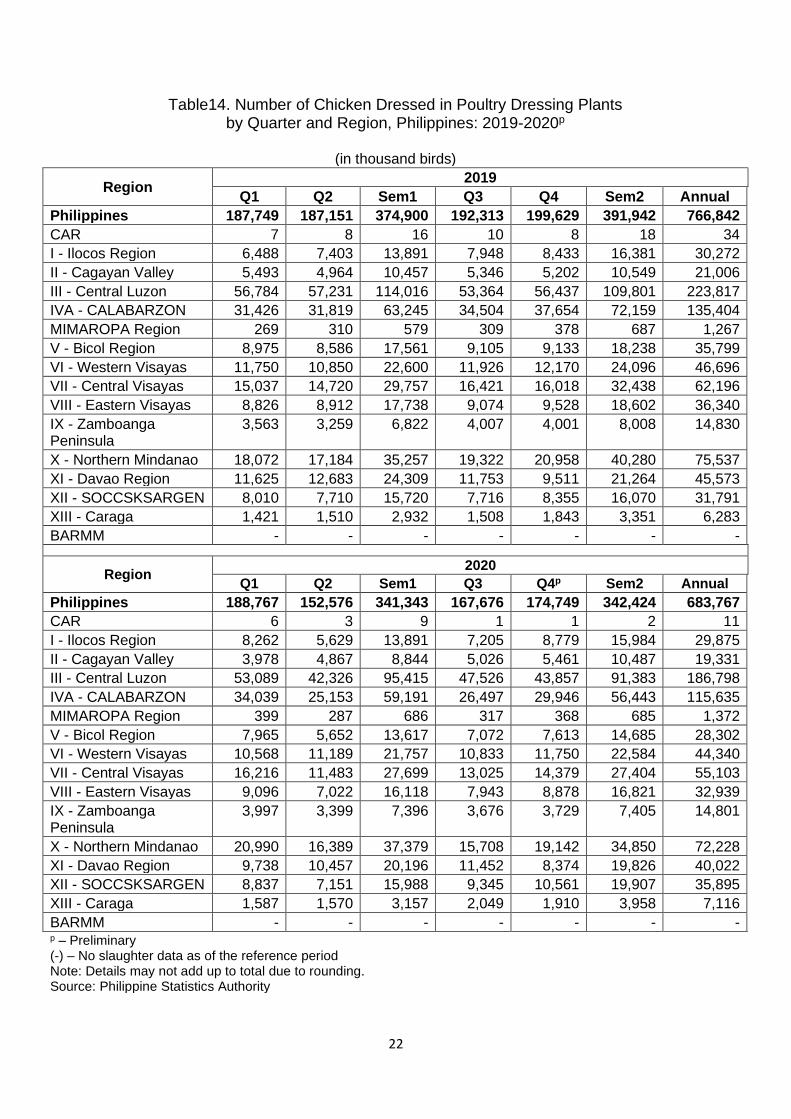
Table14. Number of Chicken Dressed in Poultry Dressing Plants by Quarter and Region, Philippines: 2019-2020p
(in thousand birds)
Region 2019
Q1 Q2 Sem1 Q3 Q4 Sem2 Annual
Philippines 187,749 187,151 374,900 192,313 199,629 391,942 766,842
CAR 7 8 16 10 8 18 34
I - Ilocos Region 6,488 7,403 13,891 7,948 8,433 16,381 30,272
II - Cagayan Valley 5,493 4,964 10,457 5,346 5,202 10,549 21,006
III - Central Luzon 56,784 57,231 114,016 53,364 56,437 109,801 223,817
IVA - CALABARZON 31,426 31,819 63,245 34,504 37,654 72,159 135,404
MIMAROPA Region 269 310 579 309 378 687 1,267
V - Bicol Region 8,975 8,586 17,561 9,105 9,133 18,238 35,799
VI - Western Visayas 11,750 10,850 22,600 11,926 12,170 24,096 46,696
VII - Central Visayas 15,037 14,720 29,757 16,421 16,018 32,438 62,196
VIII - Eastern Visayas 8,826 8,912 17,738 9,074 9,528 18,602 36,340
IX - Zamboanga Peninsula
3,563 3,259 6,822 4,007 4,001 8,008 14,830
X - Northern Mindanao 18,072 17,184 35,257 19,322 20,958 40,280 75,537
XI - Davao Region 11,625 12,683 24,309 11,753 9,511 21,264 45,573
XII - SOCCSKSARGEN 8,010 7,710 15,720 7,716 8,355 16,070 31,791
XIII - Caraga 1,421 1,510 2,932 1,508 1,843 3,351 6,283
BARMM - - - - - - -
Region 2020
Q1 Q2 Sem1 Q3 Q4p Sem2 Annual
Philippines 188,767 152,576 341,343 167,676 174,749 342,424 683,767
CAR 6 3 9 1 1 2 11
I - Ilocos Region 8,262 5,629 13,891 7,205 8,779 15,984 29,875
II - Cagayan Valley 3,978 4,867 8,844 5,026 5,461 10,487 19,331
III - Central Luzon 53,089 42,326 95,415 47,526 43,857 91,383 186,798
IVA - CALABARZON 34,039 25,153 59,191 26,497 29,946 56,443 115,635
MIMAROPA Region 399 287 686 317 368 685 1,372
V - Bicol Region 7,965 5,652 13,617 7,072 7,613 14,685 28,302
VI - Western Visayas 10,568 11,189 21,757 10,833 11,750 22,584 44,340
VII - Central Visayas 16,216 11,483 27,699 13,025 14,379 27,404 55,103
VIII - Eastern Visayas 9,096 7,022 16,118 7,943 8,878 16,821 32,939
IX - Zamboanga Peninsula
3,997 3,399 7,396 3,676 3,729 7,405 14,801
X - Northern Mindanao 20,990 16,389 37,379 15,708 19,142 34,850 72,228
XI - Davao Region 9,738 10,457 20,196 11,452 8,374 19,826 40,022
XII - SOCCSKSARGEN 8,837 7,151 15,988 9,345 10,561 19,907 35,895
XIII - Caraga 1,587 1,570 3,157 2,049 1,910 3,958 7,116
BARMM - - - - - - - p – Preliminary (-) – No slaughter data as of the reference period Note: Details may not add up to total due to rounding. Source: Philippine Statistics Authority
23
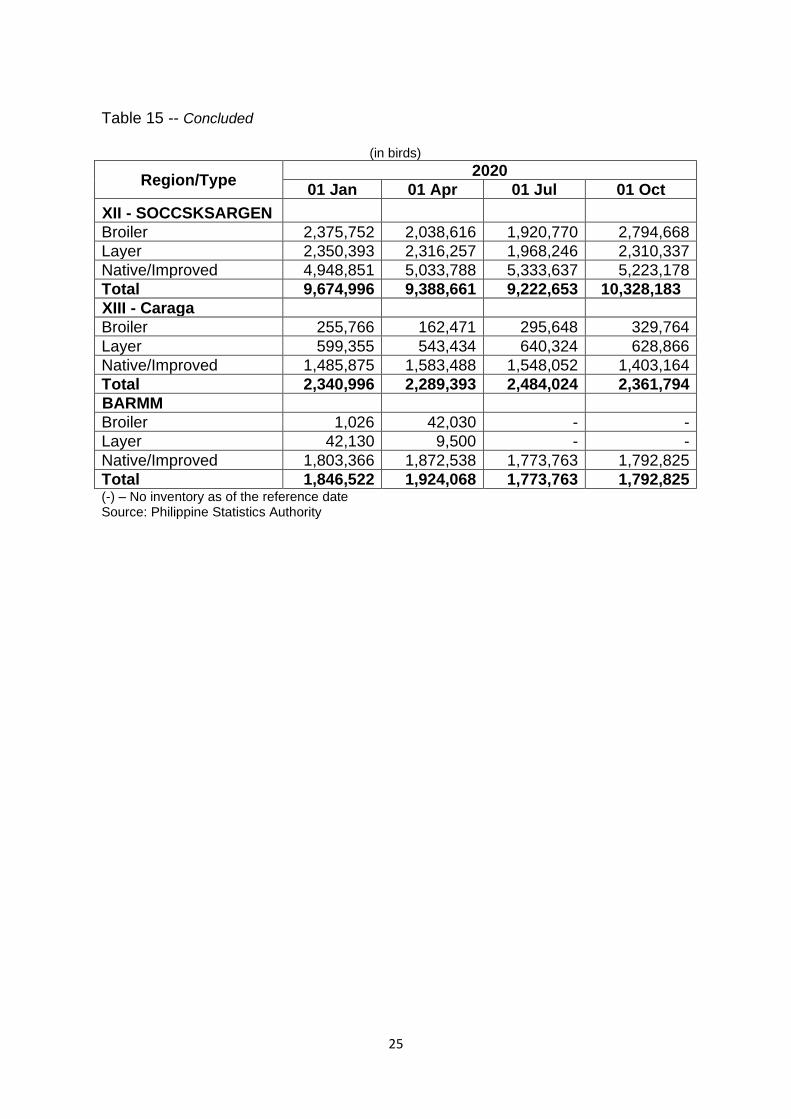
Table 15. Inventory of Chicken by Quarter, Type and Region Philippines: 2020
(in birds)
Region/Type 2020
01 Jan 01 Apr 01 Jul 01 Oct
Philippines
Broiler 56,386,934 53,736,445 61,319,815 61,447,911
Layer 41,202,461 40,829,483 39,709,860 41,408,128
Native/Improved 80,675,556 83,513,478 85,461,900 83,475,874
Total 178,264,951 178,079,406 186,491,575 186,331,913
CAR
Broiler 25,415 123,775 166,266 45,380
Layer 207,485 231,426 237,598 231,290
Native/Improved 1,330,223 1,315,838 1,421,073 1,483,234
Total 1,563,123 1,671,039 1,824,937 1,759,904
I - Ilocos Region
Broiler 4,571,955 4,280,032 3,917,176 4,369,446
Layer 1,252,145 1,151,433 1,163,703 1,231,028
Native/Improved 4,851,724 5,208,245 4,955,552 5,297,664
Total 10,675,824 10,639,710 10,036,431 10,898,138
II - Cagayan Valley
Broiler 824,864 2,211,563 1,318,020 1,706,338
Layer 838,361 785,506 763,868 831,220
Native/Improved 4,274,690 4,291,982 4,369,244 4,281,720
Total 5,937,915 7,289,051 6,451,132 6,819,278
III - Central Luzon
Broiler 13,787,464 12,870,869 18,864,537 13,772,646
Layer 8,334,853 8,215,617 8,057,378 8,542,894
Native/Improved 6,560,208 6,914,508 6,882,776 5,887,855
Total 28,682,525 28,000,994 33,804,691 28,203,395
IVA - CALABARZON
Broiler 9,790,990 8,591,366 9,405,537 6,970,236
Layer 14,694,560 14,551,421 14,348,345 14,746,753
Native/Improved 2,626,504 2,751,924 3,005,708 2,469,264
Total 27,112,054 25,894,711 26,759,590 24,186,253
MIMAROPA Region
Broiler 191,528 226,477 206,089 161,644
Layer 284,761 312,220 296,617 292,054
Native/Improved 3,862,836 3,737,189 4,002,934 3,776,823
Total 4,339,125 4,275,886 4,505,640 4,230,521 Continued
24
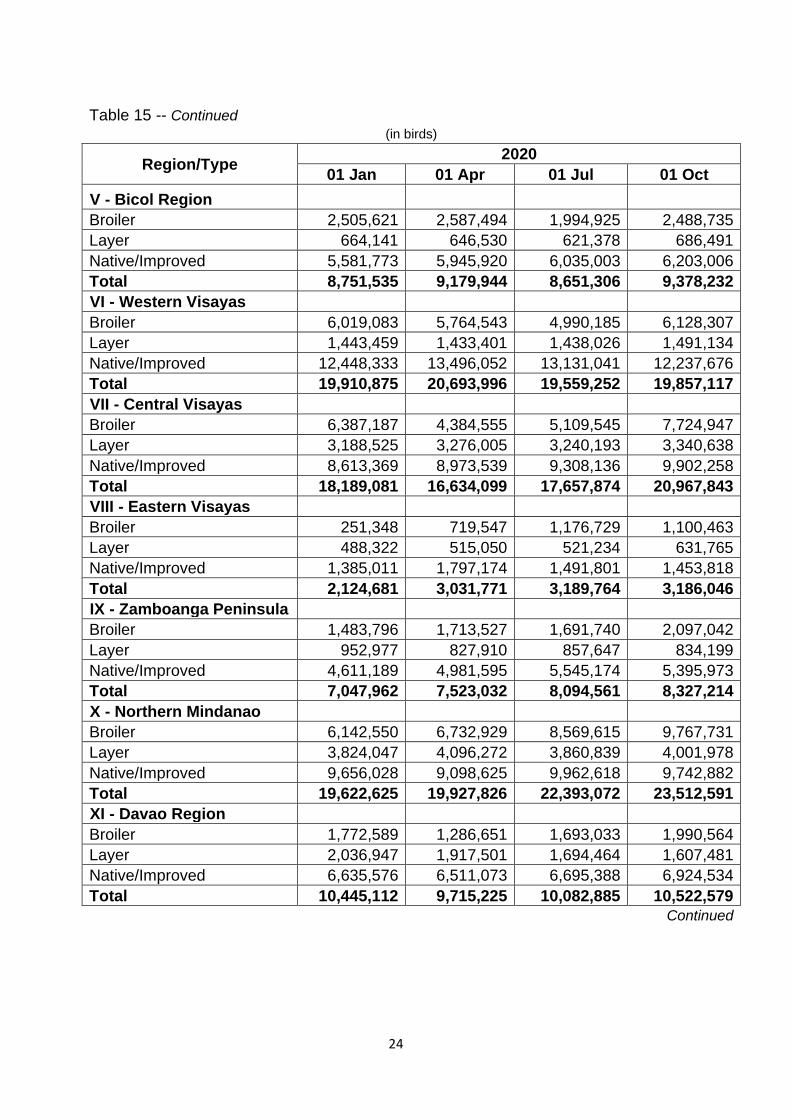
Table 15 -- Continued (in birds)
Region/Type 2020
01 Jan 01 Apr 01 Jul 01 Oct
V - Bicol Region
Broiler 2,505,621 2,587,494 1,994,925 2,488,735
Layer 664,141 646,530 621,378 686,491
Native/Improved 5,581,773 5,945,920 6,035,003 6,203,006
Total 8,751,535 9,179,944 8,651,306 9,378,232
VI - Western Visayas
Broiler 6,019,083 5,764,543 4,990,185 6,128,307
Layer 1,443,459 1,433,401 1,438,026 1,491,134
Native/Improved 12,448,333 13,496,052 13,131,041 12,237,676
Total 19,910,875 20,693,996 19,559,252 19,857,117
VII - Central Visayas
Broiler 6,387,187 4,384,555 5,109,545 7,724,947
Layer 3,188,525 3,276,005 3,240,193 3,340,638
Native/Improved 8,613,369 8,973,539 9,308,136 9,902,258
Total 18,189,081 16,634,099 17,657,874 20,967,843
VIII - Eastern Visayas
Broiler 251,348 719,547 1,176,729 1,100,463
Layer 488,322 515,050 521,234 631,765
Native/Improved 1,385,011 1,797,174 1,491,801 1,453,818
Total 2,124,681 3,031,771 3,189,764 3,186,046
IX - Zamboanga Peninsula
Broiler 1,483,796 1,713,527 1,691,740 2,097,042
Layer 952,977 827,910 857,647 834,199
Native/Improved 4,611,189 4,981,595 5,545,174 5,395,973
Total 7,047,962 7,523,032 8,094,561 8,327,214
X - Northern Mindanao
Broiler 6,142,550 6,732,929 8,569,615 9,767,731
Layer 3,824,047 4,096,272 3,860,839 4,001,978
Native/Improved 9,656,028 9,098,625 9,962,618 9,742,882
Total 19,622,625 19,927,826 22,393,072 23,512,591
XI - Davao Region
Broiler 1,772,589 1,286,651 1,693,033 1,990,564
Layer 2,036,947 1,917,501 1,694,464 1,607,481
Native/Improved 6,635,576 6,511,073 6,695,388 6,924,534
Total 10,445,112 9,715,225 10,082,885 10,522,579 Continued
25
Table 15 -- Concluded
(in birds)
Region/Type 2020
01 Jan 01 Apr 01 Jul 01 Oct
XII - SOCCSKSARGEN
Broiler 2,375,752 2,038,616 1,920,770 2,794,668
Layer 2,350,393 2,316,257 1,968,246 2,310,337
Native/Improved 4,948,851 5,033,788 5,333,637 5,223,178
Total 9,674,996 9,388,661 9,222,653 10,328,183
XIII - Caraga
Broiler 255,766 162,471 295,648 329,764
Layer 599,355 543,434 640,324 628,866
Native/Improved 1,485,875 1,583,488 1,548,052 1,403,164
Total 2,340,996 2,289,393 2,484,024 2,361,794
BARMM
Broiler 1,026 42,030 - -
Layer 42,130 9,500 - -
Native/Improved 1,803,366 1,872,538 1,773,763 1,792,825
Total 1,846,522 1,924,068 1,773,763 1,792,825 (-) – No inventory as of the reference date Source: Philippine Statistics Authority

26
For Inquiries:
PSA Complex, East Avenue Diliman, Quezon City, Philippines 1101 Tel. No. +63(2) 84626600 loc. 822 ● Telefax No. +63(2) 84626600 loc. 839 Email address: [email protected] ● [email protected]