highlights - psa.gov.ph
TRANSCRIPT
Highlights
Palay and corn production for calendar year 2014 exceeded its 2013 levels by 2.87% and 5.33%, respectively. The increments were attributed to the increase in yield brought by more utilization of high yielding variety seeds (HYVs), more fertilizer usage, favorable weather condition and government interventions. Likewise, palay and corn production for the first half of 2015 is foreseen to be higher by 2.02% and 6.02% compared to its respective records in 2014.
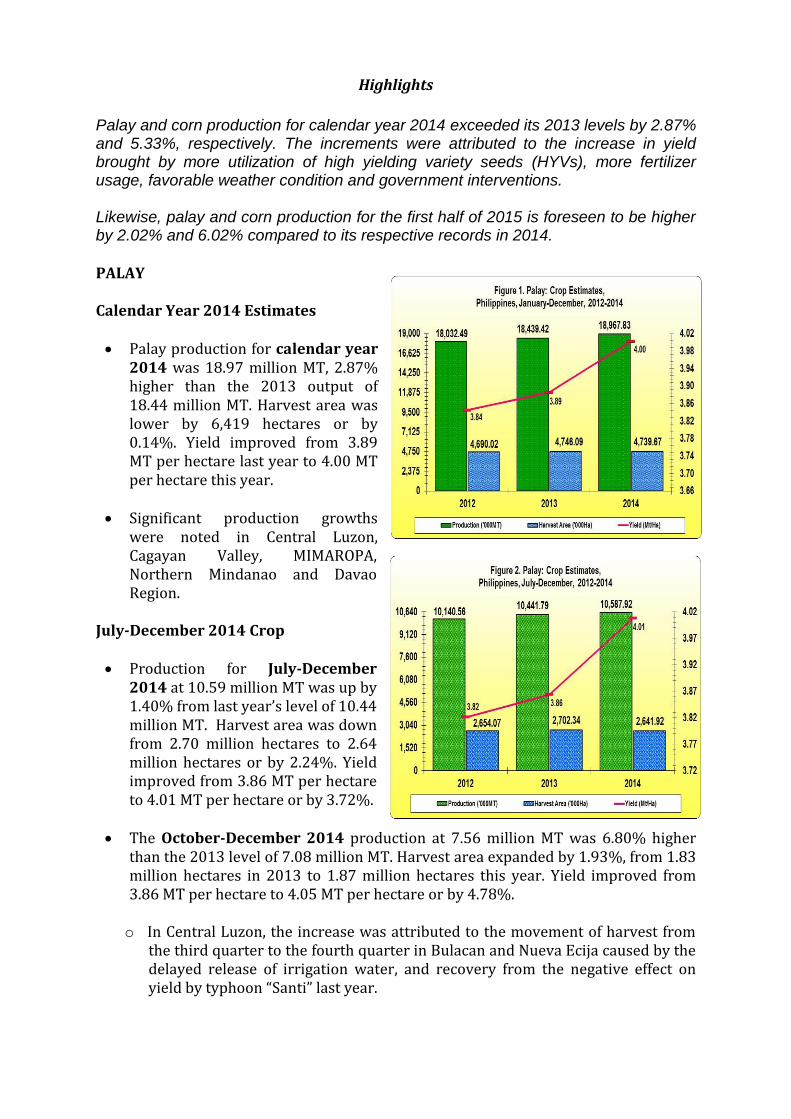
PALAY Calendar Year 2014 Estimates
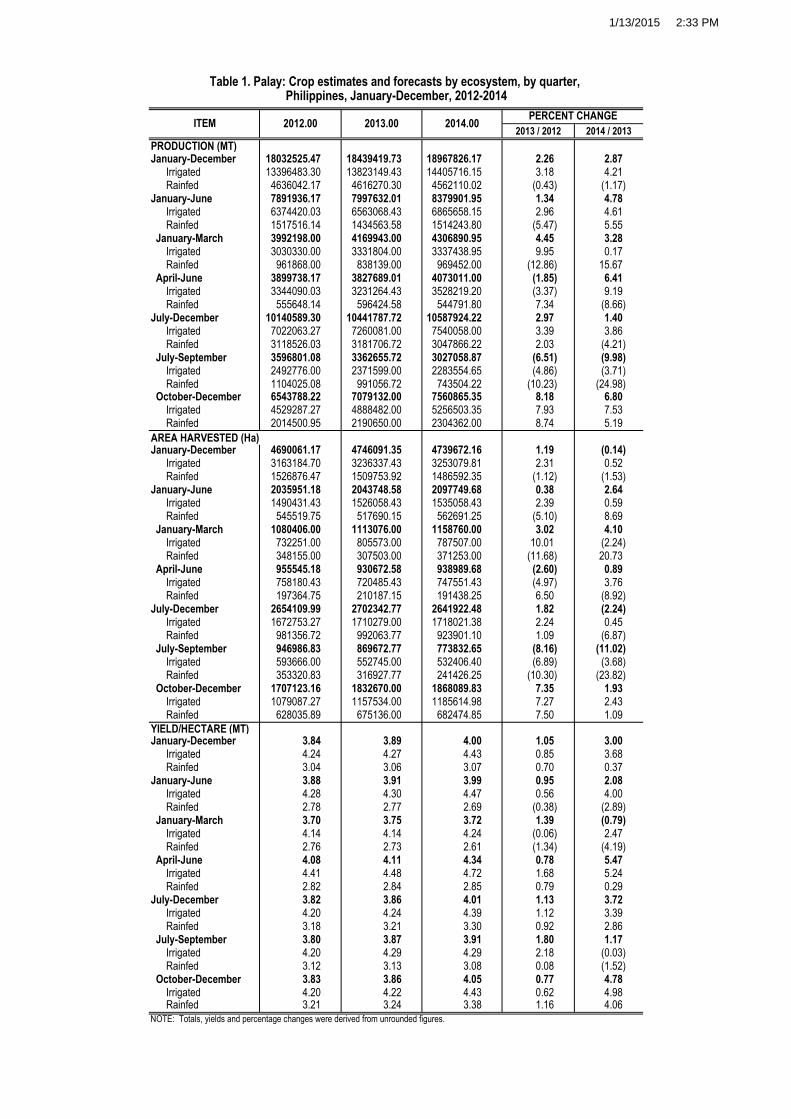
Palay production for calendar year
2014 was 18.97 million MT, 2.87% higher than the 2013 output of 18.44 million MT. Harvest area was lower by 6,419 hectares or by 0.14%. Yield improved from 3.89 MT per hectare last year to 4.00 MT per hectare this year.
Significant production growths
were noted in Central Luzon, Cagayan Valley, MIMAROPA, Northern Mindanao and Davao Region.
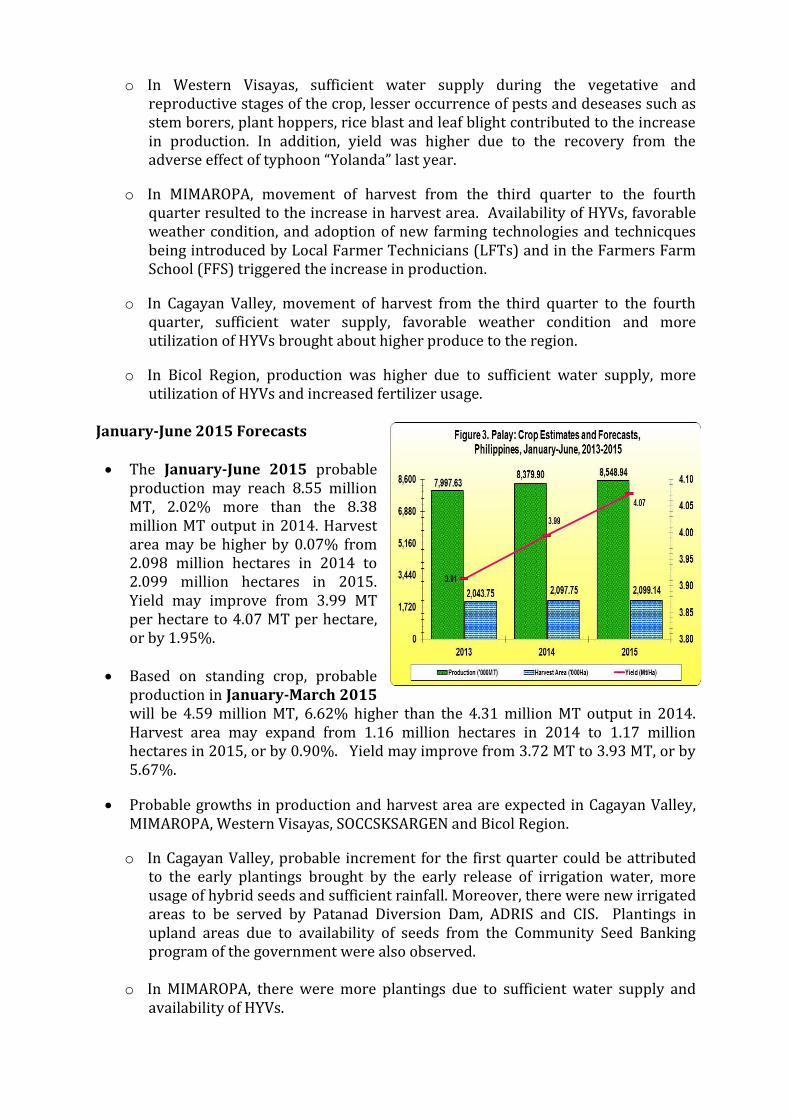
July-December 2014 Crop
Production for July-December
2014 at 10.59 million MT was up by 1.40% from last year’s level of 10.44 million MT. Harvest area was down from 2.70 million hectares to 2.64 million hectares or by 2.24%. Yield improved from 3.86 MT per hectare to 4.01 MT per hectare or by 3.72%.
The October-December 2014 production at 7.56 million MT was 6.80% higher
than the 2013 level of 7.08 million MT. Harvest area expanded by 1.93%, from 1.83 million hectares in 2013 to 1.87 million hectares this year. Yield improved from 3.86 MT per hectare to 4.05 MT per hectare or by 4.78%.
o In Central Luzon, the increase was attributed to the movement of harvest from
the third quarter to the fourth quarter in Bulacan and Nueva Ecija caused by the delayed release of irrigation water, and recovery from the negative effect on yield by typhoon “Santi” last year.
o In Western Visayas, sufficient water supply during the vegetative and reproductive stages of the crop, lesser occurrence of pests and deseases such as stem borers, plant hoppers, rice blast and leaf blight contributed to the increase in production. In addition, yield was higher due to the recovery from the adverse effect of typhoon “Yolanda” last year.
o In MIMAROPA, movement of harvest from the third quarter to the fourth quarter resulted to the increase in harvest area. Availability of HYVs, favorable weather condition, and adoption of new farming technologies and technicques being introduced by Local Farmer Technicians (LFTs) and in the Farmers Farm School (FFS) triggered the increase in production.
o In Cagayan Valley, movement of harvest from the third quarter to the fourth quarter, sufficient water supply, favorable weather condition and more utilization of HYVs brought about higher produce to the region.
o In Bicol Region, production was higher due to sufficient water supply, more utilization of HYVs and increased fertilizer usage.
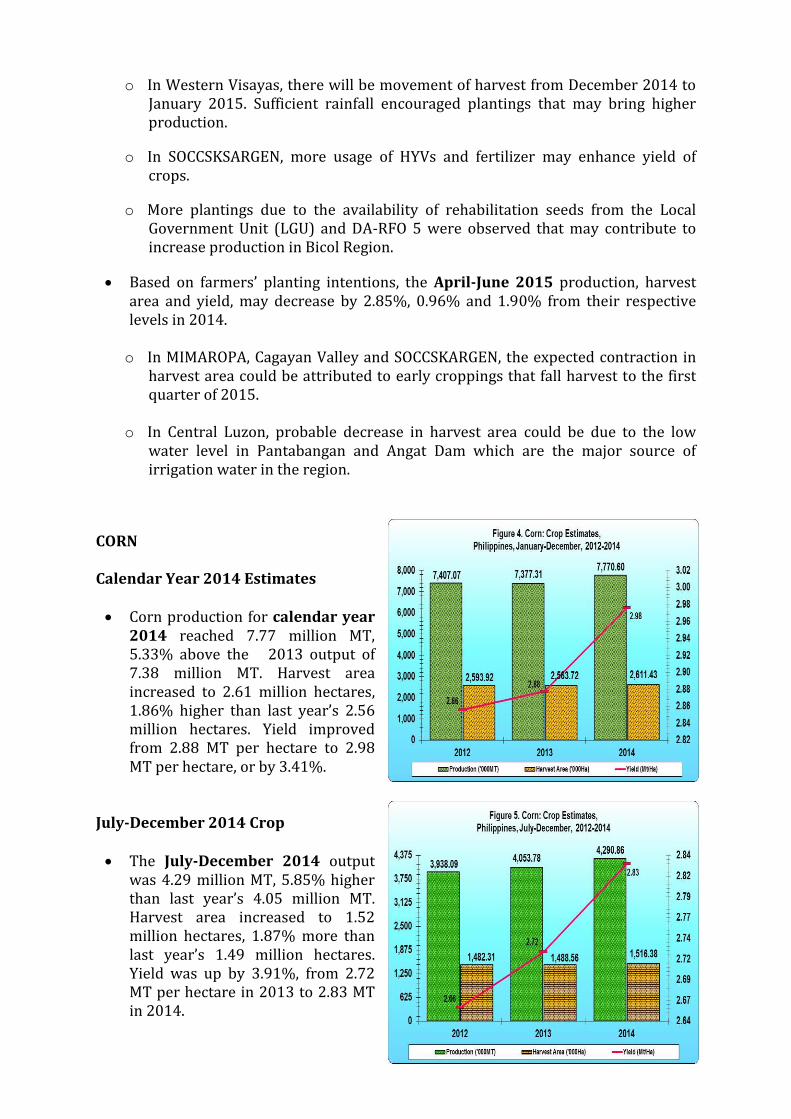
January-June 2015 Forecasts
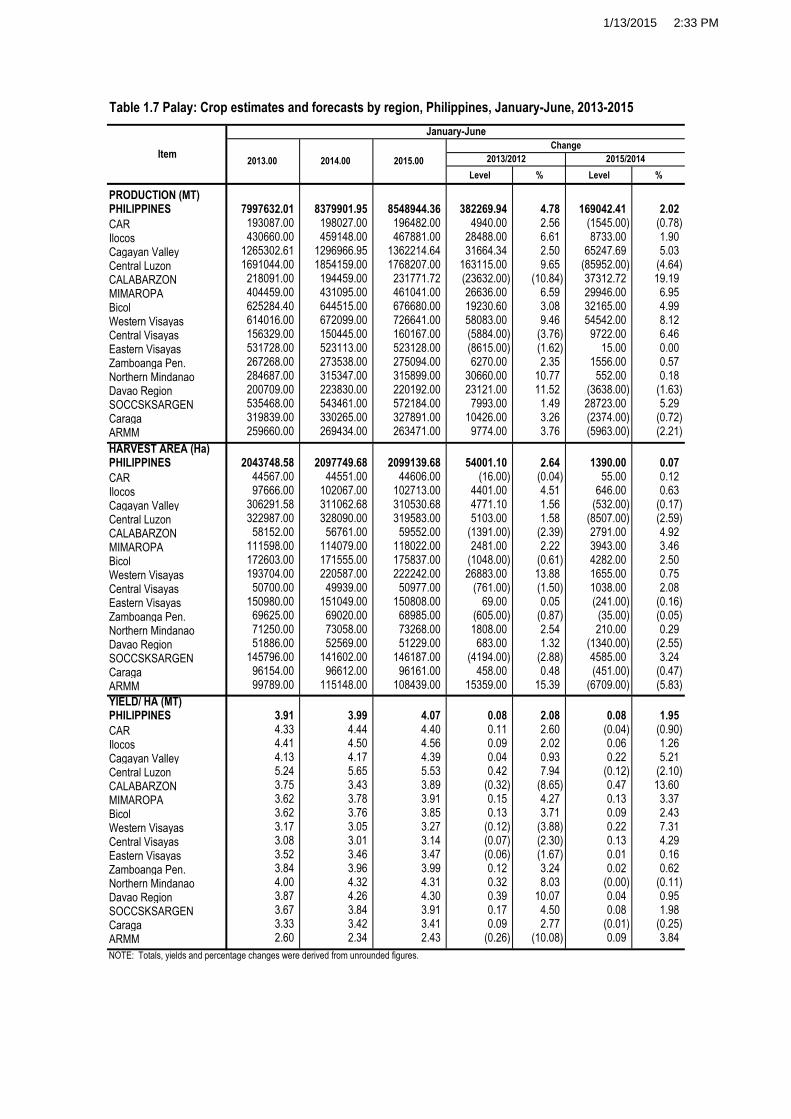
The January-June 2015 probable
production may reach 8.55 million MT, 2.02% more than the 8.38 million MT output in 2014. Harvest area may be higher by 0.07% from 2.098 million hectares in 2014 to 2.099 million hectares in 2015. Yield may improve from 3.99 MT per hectare to 4.07 MT per hectare, or by 1.95%.
Based on standing crop, probable
production in January-March 2015 will be 4.59 million MT, 6.62% higher than the 4.31 million MT output in 2014. Harvest area may expand from 1.16 million hectares in 2014 to 1.17 million hectares in 2015, or by 0.90%. Yield may improve from 3.72 MT to 3.93 MT, or by 5.67%.
Probable growths in production and harvest area are expected in Cagayan Valley, MIMAROPA, Western Visayas, SOCCSKSARGEN and Bicol Region.
o In Cagayan Valley, probable increment for the first quarter could be attributed to the early plantings brought by the early release of irrigation water, more usage of hybrid seeds and sufficient rainfall. Moreover, there were new irrigated areas to be served by Patanad Diversion Dam, ADRIS and CIS. Plantings in upland areas due to availability of seeds from the Community Seed Banking program of the government were also observed.
o In MIMAROPA, there were more plantings due to sufficient water supply and availability of HYVs.
o In Western Visayas, there will be movement of harvest from December 2014 to January 2015. Sufficient rainfall encouraged plantings that may bring higher production.
o In SOCCSKSARGEN, more usage of HYVs and fertilizer may enhance yield of crops.
o More plantings due to the availability of rehabilitation seeds from the Local Government Unit (LGU) and DA-RFO 5 were observed that may contribute to increase production in Bicol Region.
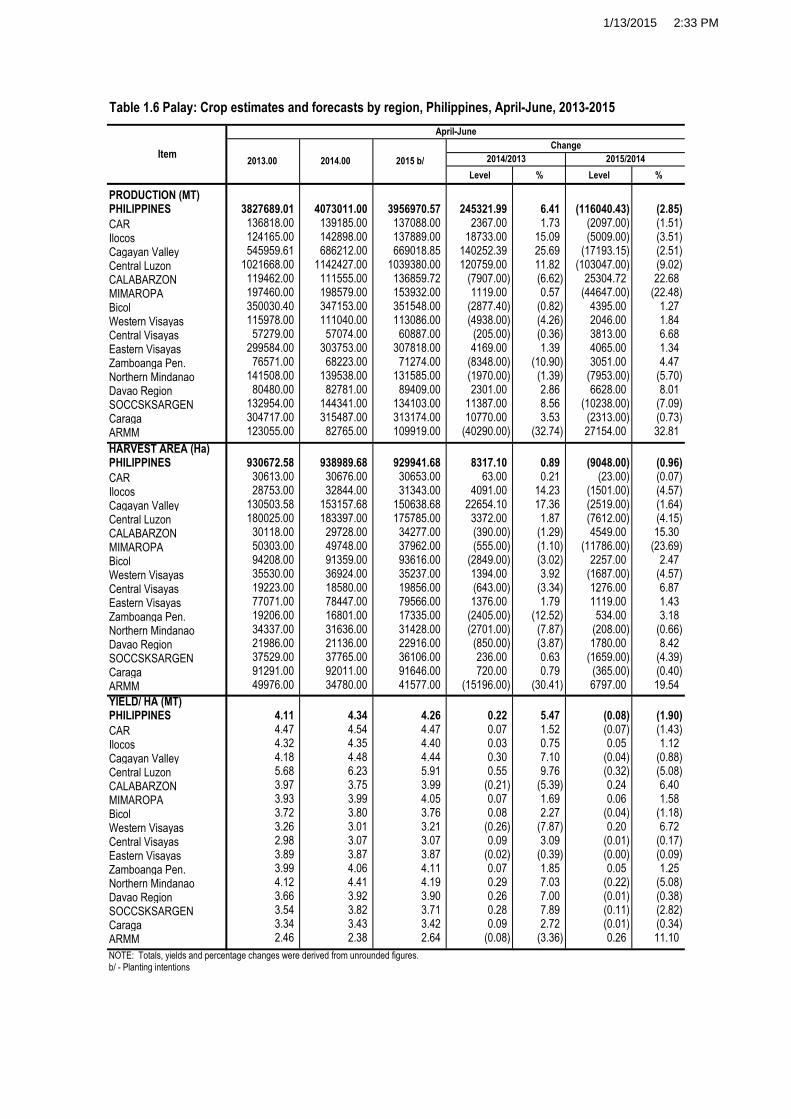
Based on farmers’ planting intentions, the April-June 2015 production, harvest area and yield, may decrease by 2.85%, 0.96% and 1.90% from their respective levels in 2014.
o In MIMAROPA, Cagayan Valley and SOCCSKARGEN, the expected contraction in
harvest area could be attributed to early croppings that fall harvest to the first quarter of 2015.
o In Central Luzon, probable decrease in harvest area could be due to the low water level in Pantabangan and Angat Dam which are the major source of irrigation water in the region.
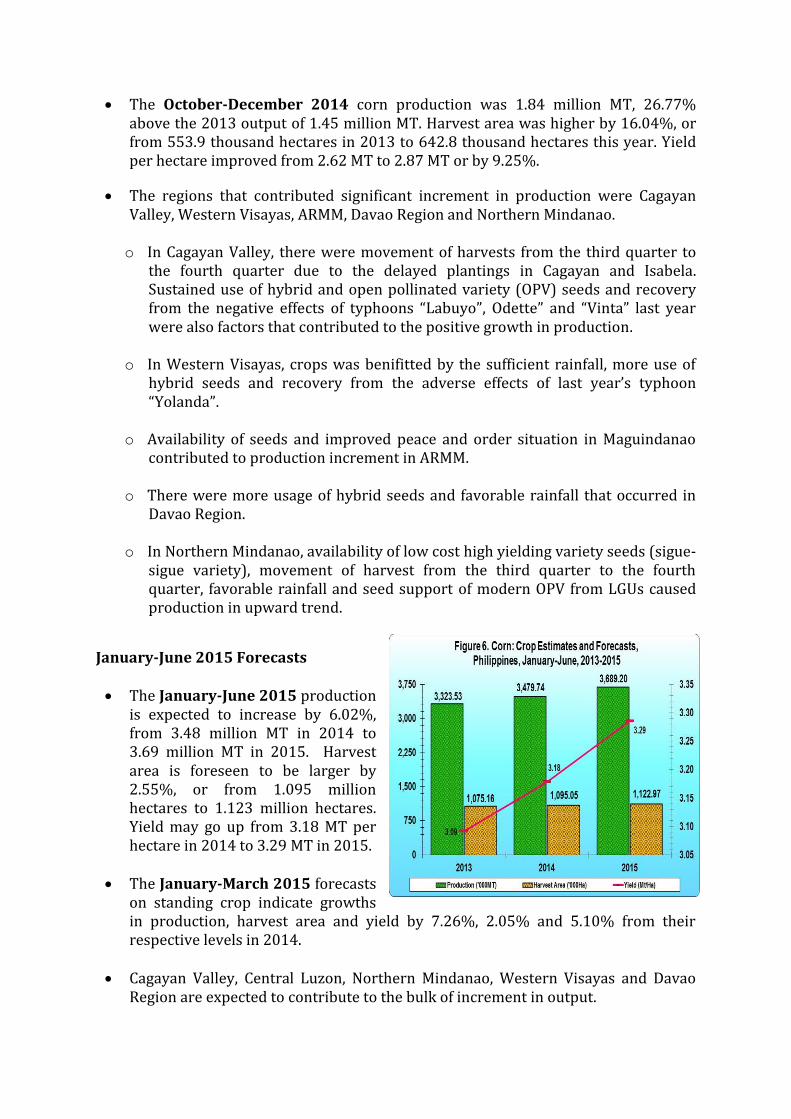
CORN Calendar Year 2014 Estimates
Corn production for calendar year
2014 reached 7.77 million MT, 5.33% above the 2013 output of 7.38 million MT. Harvest area increased to 2.61 million hectares, 1.86% higher than last year’s 2.56 million hectares. Yield improved from 2.88 MT per hectare to 2.98 MT per hectare, or by 3.41%.
July-December 2014 Crop
The July-December 2014 output
was 4.29 million MT, 5.85% higher than last year’s 4.05 million MT. Harvest area increased to 1.52 million hectares, 1.87% more than last year’s 1.49 million hectares. Yield was up by 3.91%, from 2.72 MT per hectare in 2013 to 2.83 MT in 2014.
The October-December 2014 corn production was 1.84 million MT, 26.77%
above the 2013 output of 1.45 million MT. Harvest area was higher by 16.04%, or from 553.9 thousand hectares in 2013 to 642.8 thousand hectares this year. Yield per hectare improved from 2.62 MT to 2.87 MT or by 9.25%.
The regions that contributed significant increment in production were Cagayan Valley, Western Visayas, ARMM, Davao Region and Northern Mindanao.
o In Cagayan Valley, there were movement of harvests from the third quarter to
the fourth quarter due to the delayed plantings in Cagayan and Isabela. Sustained use of hybrid and open pollinated variety (OPV) seeds and recovery from the negative effects of typhoons “Labuyo”, Odette” and “Vinta” last year were also factors that contributed to the positive growth in production.
o In Western Visayas, crops was benifitted by the sufficient rainfall, more use of
hybrid seeds and recovery from the adverse effects of last year’s typhoon “Yolanda”.
o Availability of seeds and improved peace and order situation in Maguindanao
contributed to production increment in ARMM.
o There were more usage of hybrid seeds and favorable rainfall that occurred in Davao Region.
o In Northern Mindanao, availability of low cost high yielding variety seeds (sigue-
sigue variety), movement of harvest from the third quarter to the fourth quarter, favorable rainfall and seed support of modern OPV from LGUs caused production in upward trend.
January-June 2015 Forecasts The January-June 2015 production
is expected to increase by 6.02%, from 3.48 million MT in 2014 to 3.69 million MT in 2015. Harvest area is foreseen to be larger by 2.55%, or from 1.095 million hectares to 1.123 million hectares. Yield may go up from 3.18 MT per hectare in 2014 to 3.29 MT in 2015.
The January-March 2015 forecasts on standing crop indicate growths in production, harvest area and yield by 7.26%, 2.05% and 5.10% from their respective levels in 2014.
Cagayan Valley, Central Luzon, Northern Mindanao, Western Visayas and Davao
Region are expected to contribute to the bulk of increment in output.
o In Cagayan Valley, probable increment could be attributed to sufficient rainfall which encouraged farmers to plant early, more areas planted to hybrid seeds and the sustained Package of Technology (POT) from the DA-RFO 2 and LGUs.
o In Central Luzon, more plantings were observed due to expansion of DA-Corn program in Aurora and the increase demand for green corn.
o Availability of low cost high yielding variety seeds and sufficient rainfall
contributed to the positive growth of production in Northern Mindanao.
o In Western Visayas, expansion of white corn areas, more usage of good quality seeds, favorable weather condition, more usage of fertilizer and improved cultural practices brought production up.
o In Davao Region, availability of low cost high yielding variety seeds and seed assistance from LGUs, sufficient rainfall, and lesser incidence of pests and diseases resulted to improved productivity.
Based on farmers’ planting intentions, the April-June 2015 probable production
may reach 1.25 million MT. This would be 3.68% above the 1.20 million MT output in 2014. Harvest area may be higher by 3.45% from 389.8 thousand hectares in 2014 to 403.2 thousand hectares in 2015. Yield per hectare may improve from 3.08 MT to 3.09 MT, or by 0.22%.
The probable increment could be attributed to the availability of HYV seeds and fertilizer support from LGUs, DA-RFOs and local financiers, more usage of HYVs, encouraging higher price for corn, and favorable weather condition.
1/13/2015 2:33 PM
PRODUCTION (MT)January-December 18032525.47 18439419.73 18967826.17 2.26 2.87 Irrigated 13396483.30 13823149.43 14405716.15 3.18 4.21 Rainfed 4636042.17 4616270.30 4562110.02 (0.43) (1.17)January-June 7891936.17 7997632.01 8379901.95 1.34 4.78 Irrigated 6374420.03 6563068.43 6865658.15 2.96 4.61 Rainfed 1517516.14 1434563.58 1514243.80 (5.47) 5.55 January-March 3992198.00 4169943.00 4306890.95 4.45 3.28 Irrigated 3030330.00 3331804.00 3337438.95 9.95 0.17 Rainfed 961868.00 838139.00 969452.00 (12.86) 15.67 April-June 3899738.17 3827689.01 4073011.00 (1.85) 6.41 Irrigated 3344090.03 3231264.43 3528219.20 (3.37) 9.19 Rainfed 555648.14 596424.58 544791.80 7.34 (8.66)July-December 10140589.30 10441787.72 10587924.22 2.97 1.40 Irrigated 7022063.27 7260081.00 7540058.00 3.39 3.86 Rainfed 3118526.03 3181706.72 3047866.22 2.03 (4.21) July-September 3596801.08 3362655.72 3027058.87 (6.51) (9.98) Irrigated 2492776.00 2371599.00 2283554.65 (4.86) (3.71) Rainfed 1104025.08 991056.72 743504.22 (10.23) (24.98) October-December 6543788.22 7079132.00 7560865.35 8.18 6.80 Irrigated 4529287.27 4888482.00 5256503.35 7.93 7.53 Rainfed 2014500.95 2190650.00 2304362.00 8.74 5.19
AREA HARVESTED (Ha)January-December 4690061.17 4746091.35 4739672.16 1.19 (0.14) Irrigated 3163184.70 3236337.43 3253079.81 2.31 0.52 Rainfed 1526876.47 1509753.92 1486592.35 (1.12) (1.53)January-June 2035951.18 2043748.58 2097749.68 0.38 2.64 Irrigated 1490431.43 1526058.43 1535058.43 2.39 0.59 Rainfed 545519.75 517690.15 562691.25 (5.10) 8.69 January-March 1080406.00 1113076.00 1158760.00 3.02 4.10 Irrigated 732251.00 805573.00 787507.00 10.01 (2.24) Rainfed 348155.00 307503.00 371253.00 (11.68) 20.73 April-June 955545.18 930672.58 938989.68 (2.60) 0.89 Irrigated 758180.43 720485.43 747551.43 (4.97) 3.76 Rainfed 197364.75 210187.15 191438.25 6.50 (8.92)July-December 2654109.99 2702342.77 2641922.48 1.82 (2.24) Irrigated 1672753.27 1710279.00 1718021.38 2.24 0.45 Rainfed 981356.72 992063.77 923901.10 1.09 (6.87) July-September 946986.83 869672.77 773832.65 (8.16) (11.02) Irrigated 593666.00 552745.00 532406.40 (6.89) (3.68) Rainfed 353320.83 316927.77 241426.25 (10.30) (23.82) October-December 1707123.16 1832670.00 1868089.83 7.35 1.93 Irrigated 1079087.27 1157534.00 1185614.98 7.27 2.43 Rainfed 628035.89 675136.00 682474.85 7.50 1.09
YIELD/HECTARE (MT)January-December 3.84 3.89 4.00 1.05 3.00 Irrigated 4.24 4.27 4.43 0.85 3.68 Rainfed 3.04 3.06 3.07 0.70 0.37January-June 3.88 3.91 3.99 0.95 2.08 Irrigated 4.28 4.30 4.47 0.56 4.00 Rainfed 2.78 2.77 2.69 (0.38) (2.89) January-March 3.70 3.75 3.72 1.39 (0.79) Irrigated 4.14 4.14 4.24 (0.06) 2.47 Rainfed 2.76 2.73 2.61 (1.34) (4.19) April-June 4.08 4.11 4.34 0.78 5.47 Irrigated 4.41 4.48 4.72 1.68 5.24 Rainfed 2.82 2.84 2.85 0.79 0.29July-December 3.82 3.86 4.01 1.13 3.72 Irrigated 4.20 4.24 4.39 1.12 3.39 Rainfed 3.18 3.21 3.30 0.92 2.86 July-September 3.80 3.87 3.91 1.80 1.17 Irrigated 4.20 4.29 4.29 2.18 (0.03) Rainfed 3.12 3.13 3.08 0.08 (1.52) October-December 3.83 3.86 4.05 0.77 4.78 Irrigated 4.20 4.22 4.43 0.62 4.98 Rainfed 3.21 3.24 3.38 1.16 4.06
NOTE: Totals, yields and percentage changes were derived from unrounded figures.
Table 1. Palay: Crop estimates and forecasts by ecosystem, by quarter, Philippines, January-December, 2012-2014
ITEM 2012.00 2013.00 PERCENT CHANGE
2014.00 2013 / 2012 2014 / 2013

1/13/2015 2:33 PM
PRODUCTION (MT)January-June 7997632.01 8379901.95 8548944.36 4.78 2.02 Irrigated 6563068.43 6865658.15 6974341.76 4.61 1.58 Rainfed 1434563.58 1514243.80 1574602.60 5.55 3.99 January-March 4169943.00 4306890.95 4591973.79 a/ 3.28 6.62 Irrigated 3331804.00 3337438.95 3600629.79 0.17 7.89 Rainfed 838139.00 969452.00 991344.00 15.67 2.26 April-June 3827689.01 4073011.00 3956970.57 b/ 6.41 (2.85) Irrigated 3231264.43 3528219.20 3373711.97 9.19 (4.38) Rainfed 596424.58 544791.80 583258.60 (8.66) 7.06
AREA HARVESTED (Ha)January-June 2043748.58 2097749.68 2099139.68 2.64 0.07 Irrigated 1526058.43 1535058.43 1547229.43 0.59 0.79 Rainfed 517690.15 562691.25 551910.25 8.69 (1.92) January-March 1113076.00 1158760.00 1169198.00 a/ 4.10 0.90 Irrigated 805573.00 787507.00 817682.00 (2.24) 3.83 Rainfed 307503.00 371253.00 351516.00 20.73 (5.32) April-June 930672.58 938989.68 929941.68 b/ 0.89 (0.96) Irrigated 720485.43 747551.43 729547.43 3.76 (2.41) Rainfed 210187.15 191438.25 200394.25 (8.92) 4.68
YIELD/HECTARE (MT)January-June 3.91 3.99 4.07 2.08 1.95 Irrigated 4.30 4.47 4.51 4.00 0.78 Rainfed 2.77 2.69 2.85 (2.89) 6.02 January-March 3.75 3.72 3.93 (0.79) 5.67 Irrigated 4.14 4.24 4.40 2.47 3.90 Rainfed 2.73 2.61 2.82 (4.19) 8.00 April-June 4.11 4.34 4.26 5.47 (1.90) Irrigated 4.48 4.72 4.62 5.24 (2.02) Rainfed 2.84 2.85 2.91 0.29 2.28
NOTE: Totals, yields and percentage changes were derived from unrounded figures.
a/ - Standing crop
b/ - Planting intentions
Table 1.1 Palay: Crop estimates and forecasts by ecosystem, by quarter, Philippines, January-June, 2013-2015
ITEM 2013.00 2014.00 PERCENT CHANGE
2015.00 2014 / 2013 2015 / 2014

1/13/2015 2:33 PM
Table 1.2 Palay: Crop estimates and forecasts by region, Philippines, October-December, 2012-2014
Level % Level %
PRODUCTION (MT)PHILIPPINES 6543755.00 7079132.00 7560865.35 535377.00 8.18 481733.35 6.80
CAR 191892.00 195947.00 188100.00 4055.00 2.11 (7847.00) (4.00)
Ilocos 1154379.00 1191928.00 1209690.00 37549.00 3.25 17762.00 1.49
Cagayan Valley 671254.00 827293.00 862200.35 156039.00 23.25 34907.35 4.22
Central Luzon 1435263.00 1433929.00 1707242.00 (1334.00) (0.09) 273313.00 19.06
CALABARZON 122072.00 149085.00 172887.00 27013.00 22.13 23802.00 15.97
MIMAROPA 465543.00 483182.00 547001.00 17639.00 3.79 63819.00 13.21
Bicol 325991.00 390076.00 433336.00 64085.00 19.66 43260.00 11.09
Western Visayas 658723.00 654461.00 764814.00 (4262.00) (0.65) 110353.00 16.86
Central Visayas 160153.00 170253.00 168083.00 10100.00 6.31 (2170.00) (1.27)
Eastern Visayas 310343.00 291916.00 291485.00 (18427.00) (5.94) (431.00) (0.15)
Zamboanga Pen. 138576.00 152018.00 177909.00 13442.00 9.70 25891.00 17.03
Northern Mindanao 207446.00 209736.00 207487.00 2290.00 1.10 (2249.00) (1.07)
Davao Region 62043.00 65289.00 90917.00 3246.00 5.23 25628.00 39.25
SOCCSKSARGEN 362379.00 412334.00 377354.00 49955.00 13.79 (34980.00) (8.48)
Caraga 169019.00 228573.00 212085.00 59554.00 35.24 (16488.00) (7.21)
ARMM 108679.00 223112.00 150275.00 114433.00 105.29 (72837.00) (32.65)
HARVEST AREA (Ha)PHILIPPINES 1707086.00 1832670.00 1868089.83 125584.00 7.36 35419.83 1.93
CAR 53326.00 53982.00 53568.00 656.00 1.23 (414.00) (0.77)
Ilocos 273867.00 279421.00 280454.00 5554.00 2.03 1033.00 0.37
Cagayan Valley 166571.00 200731.00 205081.83 34160.00 20.51 4350.83 2.17
Central Luzon 324447.00 330506.00 346278.00 6059.00 1.87 15772.00 4.77
CALABARZON 39461.00 43975.00 47182.00 4514.00 11.44 3207.00 7.29
MIMAROPA 128161.00 133521.00 139978.00 5360.00 4.18 6457.00 4.84
Bicol 95245.00 109552.00 110045.00 14307.00 15.02 493.00 0.45
Western Visayas 192756.00 197168.00 226850.00 4412.00 2.29 29682.00 15.05
Central Visayas 48289.00 49071.00 48487.00 782.00 1.62 (584.00) (1.19)
Eastern Visayas 86446.00 82688.00 83012.00 (3758.00) (4.35) 324.00 0.39
Zamboanga Pen. 37701.00 37442.00 43851.00 (259.00) (0.69) 6409.00 17.12
Northern Mindanao 49524.00 47008.00 46954.00 (2516.00) (5.08) (54.00) (0.11)
Davao Region 15112.00 15163.00 19646.00 51.00 0.34 4483.00 29.57
SOCCSKSARGEN 98803.00 105221.00 95784.00 6418.00 6.50 (9437.00) (8.97)
Caraga 55680.00 69723.00 67637.00 14043.00 25.22 (2086.00) (2.99)
ARMM 41697.00 77498.00 53282.00 35801.00 85.86 (24216.00) (31.25)
YIELD/ HA (MT)PHILIPPINES 3.83 3.86 4.05 0.03 0.77 0.18 4.78
CAR 3.60 3.63 3.51 0.03 0.87 (0.12) (3.26)
Ilocos 4.22 4.27 4.31 0.05 1.20 0.05 1.12
Cagayan Valley 4.03 4.12 4.20 0.09 2.27 0.08 2.01
Central Luzon 4.42 4.34 4.93 (0.09) (1.92) 0.59 13.64
CALABARZON 3.09 3.39 3.66 0.30 9.59 0.27 8.08
MIMAROPA 3.63 3.62 3.91 (0.01) (0.38) 0.29 7.99
Bicol 3.42 3.56 3.94 0.14 4.03 0.38 10.59
Western Visayas 3.42 3.32 3.37 (0.10) (2.87) 0.05 1.57
Central Visayas 3.32 3.47 3.47 0.15 4.61 (0.00) (0.09)
Eastern Visayas 3.59 3.53 3.51 (0.06) (1.66) (0.02) (0.54)
Zamboanga Pen. 3.68 4.06 4.06 0.38 10.46 (0.00) (0.07)
Northern Mindanao 4.19 4.46 4.42 0.27 6.52 (0.04) (0.96)
Davao Region 4.11 4.31 4.63 0.20 4.88 0.32 7.48
SOCCSKSARGEN 3.67 3.92 3.94 0.25 6.84 0.02 0.53
Caraga 3.04 3.28 3.14 0.24 8.00 (0.14) (4.35)
ARMM 2.61 2.88 2.82 0.27 10.46 (0.06) (2.03)
NOTE: Totals, yields and percentage changes were derived from unrounded figures.
2014.00Item
2012.00 2013.00
Change
2013/2012 2014/2013
October-December

1/13/2015 2:33 PM
Table 1.3 Palay: Crop estimates and forecasts by region, Philippines, July-December, 2012-2014
Level % Level %
PRODUCTION (MT)PHILIPPINES 10140556.08 10441787.72 10587924.22 301231.64 2.97 146136.50 1.40
CAR 266288.00 267083.00 254582.00 795.00 0.30 (12501.00) (4.68)
Ilocos 1298379.00 1319397.00 1337081.00 21018.00 1.62 17684.00 1.34
Cagayan Valley 1163057.08 1157897.72 1217967.22 (5159.36) (0.44) 60069.50 5.19
Central Luzon 1646569.00 1718424.00 1910991.00 71855.00 4.36 192567.00 11.21
CALABARZON 168275.00 193694.00 211123.00 25419.00 15.11 17429.00 9.00
MIMAROPA 610878.00 629483.00 650783.00 18605.00 3.05 21300.00 3.38
Bicol 583768.00 617957.00 613632.00 34189.00 5.86 (4325.00) (0.70)
Western Visayas 1575018.00 1476774.00 1380475.00 (98244.00) (6.24) (96299.00) (6.52)
Central Visayas 182975.00 191368.00 188377.00 8393.00 4.59 (2991.00) (1.56)
Eastern Visayas 480184.00 458066.00 459483.00 (22118.00) (4.61) 1417.00 0.31
Zamboanga Pen. 357611.00 371845.00 383239.00 14234.00 3.98 11394.00 3.06
Northern Mindanao 358724.00 390216.00 398417.00 31492.00 8.78 8201.00 2.10
Davao Region 234700.00 220983.00 228437.00 (13717.00) (5.84) 7454.00 3.37
SOCCSKSARGEN 744325.00 812178.00 821388.00 67853.00 9.12 9210.00 1.13
Caraga 196304.00 263999.00 244234.00 67695.00 34.48 (19765.00) (7.49)
ARMM 273501.00 352423.00 287715.00 78922.00 28.86 (64708.00) (18.36)
HARVEST AREA (Ha)PHILIPPINES 2654072.83 2702342.77 2641922.48 48269.94 1.82 (60420.29) (2.24)
CAR 76634.00 75352.00 73925.40 (1282.00) (1.67) (1426.60) (1.89)
Ilocos 306575.00 309147.00 310352.00 2572.00 0.84 1205.00 0.39
Cagayan Valley 282669.83 279002.77 280597.08 (3667.06) (1.30) 1594.31 0.57
Central Luzon 371761.00 387830.00 389101.00 16069.00 4.32 1271.00 0.33
CALABARZON 54283.00 57366.00 59807.00 3083.00 5.68 2441.00 4.26
MIMAROPA 166053.00 171358.00 166841.00 5305.00 3.19 (4517.00) (2.64)
Bicol 167366.00 170596.00 158018.00 3230.00 1.93 (12578.00) (7.37)
Western Visayas 450616.00 422569.00 398140.00 (28047.00) (6.22) (24429.00) (5.78)
Central Visayas 55338.00 55491.00 54349.00 153.00 0.28 (1142.00) (2.06)
Eastern Visayas 136249.00 131173.00 131971.00 (5076.00) (3.73) 798.00 0.61
Zamboanga Pen. 92467.00 92096.00 94076.00 (371.00) (0.40) 1980.00 2.15
Northern Mindanao 84710.00 87088.00 88356.00 2378.00 2.81 1268.00 1.46
Davao Region 51756.00 51408.00 51253.00 (348.00) (0.67) (155.00) (0.30)
SOCCSKSARGEN 199765.00 204550.00 205304.00 4785.00 2.40 754.00 0.37
Caraga 64418.00 80405.00 77558.00 15987.00 24.82 (2847.00) (3.54)
ARMM 93412.00 126911.00 102274.00 33499.00 35.86 (24637.00) (19.41)
YIELD/ HA (MT)PHILIPPINES 3.82 3.86 4.01 0.04 1.13 0.14 3.72
CAR 3.47 3.54 3.44 0.07 2.00 (0.10) (2.84)
Ilocos 4.24 4.27 4.31 0.03 0.77 0.04 0.95
Cagayan Valley 4.11 4.15 4.34 0.04 0.86 0.19 4.59
Central Luzon 4.43 4.43 4.91 0.00 0.04 0.48 10.84
CALABARZON 3.10 3.38 3.53 0.28 8.92 0.15 4.55
MIMAROPA 3.68 3.67 3.90 (0.01) (0.14) 0.23 6.18
Bicol 3.49 3.62 3.88 0.13 3.85 0.26 7.20
Western Visayas 3.50 3.49 3.47 (0.00) (0.01) (0.03) (0.79)
Central Visayas 3.31 3.45 3.47 0.14 4.30 0.02 0.51
Eastern Visayas 3.52 3.49 3.48 (0.03) (0.91) (0.01) (0.30)
Zamboanga Pen. 3.87 4.04 4.07 0.17 4.40 0.04 0.90
Northern Mindanao 4.23 4.48 4.51 0.25 5.81 0.03 0.64
Davao Region 4.53 4.30 4.46 (0.24) (5.21) 0.16 3.69
SOCCSKSARGEN 3.73 3.97 4.00 0.24 6.56 0.03 0.76
Caraga 3.05 3.28 3.15 0.24 7.75 (0.13) (4.09)
ARMM 2.93 2.78 2.81 (0.15) (5.16) 0.04 1.31
NOTE: Totals, yields and percentage changes were derived from unrounded figures.
2014.00Item
Change
July-December
2013/2012 2014/20132012.00 2013.00

1/13/2015 2:33 PM
Table 1.4 Palay: Crop estimates and forecasts by region, Philippines, January-December, 2012-2014
Level % Level %
PRODUCTION (MT)PHILIPPINES 18032492.25 18439419.73 18967826.17 406927.48 2.26 528406.44 2.87
CAR 453461.00 460170.00 452609.00 6709.00 1.48 (7561.00) (1.64)
Ilocos 1737695.00 1750057.00 1796229.00 12362.00 0.71 46172.00 2.64
Cagayan Valley 2425503.25 2423200.33 2514934.17 (2302.92) (0.09) 91733.84 3.79
Central Luzon 3220607.00 3409468.00 3765150.00 188861.00 5.86 355682.00 10.43
CALABARZON 389272.00 411785.00 405582.00 22513.00 5.78 (6203.00) (1.51)
MIMAROPA 1030606.00 1033942.00 1081878.00 3336.00 0.32 47936.00 4.64
Bicol 1173307.00 1243241.40 1258147.00 69934.40 5.96 14905.60 1.20
Western Visayas 2292201.00 2090790.00 2052574.00 (201411.00) (8.79) (38216.00) (1.83)
Central Visayas 327120.00 347697.00 338822.00 20577.00 6.29 (8875.00) (2.55)
Eastern Visayas 994972.00 989794.00 982596.00 (5178.00) (0.52) (7198.00) (0.73)
Zamboanga Pen. 618831.00 639113.00 656777.00 20282.00 3.28 17664.00 2.76
Northern Mindanao 637348.00 674903.00 713764.00 37555.00 5.89 38861.00 5.76
Davao Region 448703.00 421692.00 452267.00 (27011.00) (6.02) 30575.00 7.25
SOCCSKSARGEN 1270901.00 1347646.00 1364849.00 76745.00 6.04 17203.00 1.28
Caraga 469205.00 583838.00 574499.00 114633.00 24.43 (9339.00) (1.60)
ARMM 542760.00 612083.00 557149.00 69323.00 12.77 (54934.00) (8.97)
HARVEST AREA (Ha)PHILIPPINES 4690024.01 4746091.35 4739672.16 56067.34 1.20 (6419.19) (0.14)
CAR 120100.00 119919.00 118476.40 (181.00) (0.15) (1442.60) (1.20)
Ilocos 403169.00 406813.00 412419.00 3644.00 0.90 5606.00 1.38
Cagayan Valley 582520.01 585294.35 591659.76 2774.34 0.48 6365.41 1.09
Central Luzon 675781.00 710817.00 717191.00 35036.00 5.18 6374.00 0.90
CALABARZON 113010.00 115518.00 116568.00 2508.00 2.22 1050.00 0.91
MIMAROPA 280748.00 282956.00 280920.00 2208.00 0.79 (2036.00) (0.72)
Bicol 334275.00 343199.00 329573.00 8924.00 2.67 (13626.00) (3.97)
Western Visayas 668810.00 616273.00 618727.00 (52537.00) (7.86) 2454.00 0.40
Central Visayas 105797.00 106191.00 104288.00 394.00 0.37 (1903.00) (1.79)
Eastern Visayas 285394.00 282153.00 283020.00 (3241.00) (1.14) 867.00 0.31
Zamboanga Pen. 157888.00 161721.00 163096.00 3833.00 2.43 1375.00 0.85
Northern Mindanao 154712.00 158338.00 161414.00 3626.00 2.34 3076.00 1.94
Davao Region 103993.00 103294.00 103822.00 (699.00) (0.67) 528.00 0.51
SOCCSKSARGEN 345985.00 350346.00 346906.00 4361.00 1.26 (3440.00) (0.98)
Caraga 155041.00 176559.00 174170.00 21518.00 13.88 (2389.00) (1.35)
ARMM 202801.00 226700.00 217422.00 23899.00 11.78 (9278.00) (4.09)
YIELD/ HA (MT)PHILIPPINES 3.84 3.89 4.00 0.04 1.05 0.12 3.00
CAR 3.78 3.84 3.82 0.06 1.63 (0.02) (0.45)
Ilocos 4.31 4.30 4.36 (0.01) (0.19) 0.05 1.24
Cagayan Valley 4.16 4.14 4.25 (0.02) (0.57) 0.11 2.67
Central Luzon 4.77 4.80 5.25 0.03 0.65 0.45 9.45
CALABARZON 3.44 3.56 3.48 0.12 3.49 (0.09) (2.39)
MIMAROPA 3.67 3.65 3.85 (0.02) (0.46) 0.20 5.39
Bicol 3.51 3.62 3.82 0.11 3.21 0.19 5.38
Western Visayas 3.43 3.39 3.32 (0.03) (1.01) (0.08) (2.22)
Central Visayas 3.09 3.27 3.25 0.18 5.90 (0.03) (0.77)
Eastern Visayas 3.49 3.51 3.47 0.02 0.62 (0.04) (1.03)
Zamboanga Pen. 3.92 3.95 4.03 0.03 0.83 0.07 1.90
Northern Mindanao 4.12 4.26 4.42 0.14 3.47 0.16 3.74
Davao Region 4.31 4.08 4.36 (0.23) (5.38) 0.27 6.71
SOCCSKSARGEN 3.67 3.85 3.93 0.17 4.72 0.09 2.28
Caraga 3.03 3.31 3.30 0.28 9.27 (0.01) (0.25)
ARMM 2.68 2.70 2.56 0.02 0.88 (0.14) (5.09)
NOTE: Totals, yields and percentage changes were derived from unrounded figures.
Item2012.00 2013.00
Change
2013/2012
January-December
2014.00 2014/2013

1/13/2015 2:33 PM
Table 1.5 Palay: Crop estimates and forecasts by region, Philippines, January-March, 2013-2015
Level % Level %
PRODUCTION (MT)PHILIPPINES 4169943.00 4306890.95 4591973.79 136947.95 3.28 285082.84 6.62
CAR 56269.00 58842.00 59394.00 2573.00 4.57 552.00 0.94
Ilocos 306495.00 316250.00 329992.00 9755.00 3.18 13742.00 4.35
Cagayan Valley 719343.00 610754.95 693195.79 (108588.05) (15.10) 82440.84 13.50
Central Luzon 669376.00 711732.00 728827.00 42356.00 6.33 17095.00 2.40
CALABARZON 98629.00 82904.00 94912.00 (15725.00) (15.94) 12008.00 14.48
MIMAROPA 206999.00 232516.00 307109.00 25517.00 12.33 74593.00 32.08
Bicol 275254.00 297362.00 325132.00 22108.00 8.03 27770.00 9.34
Western Visayas 498038.00 561059.00 613555.00 63021.00 12.65 52496.00 9.36
Central Visayas 99050.00 93371.00 99280.00 (5679.00) (5.73) 5909.00 6.33
Eastern Visayas 232144.00 219360.00 215310.00 (12784.00) (5.51) (4050.00) (1.85)
Zamboanga Pen. 190697.00 205315.00 203820.00 14618.00 7.67 (1495.00) (0.73)
Northern Mindanao 143179.00 175809.00 184314.00 32630.00 22.79 8505.00 4.84
Davao Region 120229.00 141049.00 130783.00 20820.00 17.32 (10266.00) (7.28)
SOCCSKSARGEN 402514.00 399120.00 438081.00 (3394.00) (0.84) 38961.00 9.76
Caraga 15122.00 14778.00 14717.00 (344.00) (2.27) (61.00) (0.41)
ARMM 136605.00 186669.00 153552.00 50064.00 36.65 (33117.00) (17.74)
HARVEST AREA (Ha)PHILIPPINES 1113076.00 1158760.00 1169198.00 45684.00 4.10 10438.00 0.90
CAR 13954.00 13875.00 13953.00 (79.00) (0.57) 78.00 0.56
Ilocos 68913.00 69223.00 71370.00 310.00 0.45 2147.00 3.10
Cagayan Valley 175788.00 157905.00 159892.00 (17883.00) (10.17) 1987.00 1.26
Central Luzon 142962.00 144693.00 143798.00 1731.00 1.21 (895.00) (0.62)
CALABARZON 28034.00 27033.00 25275.00 (1001.00) (3.57) (1758.00) (6.50)
MIMAROPA 61295.00 64331.00 80060.00 3036.00 4.95 15729.00 24.45
Bicol 78395.00 80196.00 82221.00 1801.00 2.30 2025.00 2.53
Western Visayas 158174.00 183663.00 187005.00 25489.00 16.11 3342.00 1.82
Central Visayas 31477.00 31359.00 31121.00 (118.00) (0.37) (238.00) (0.76)
Eastern Visayas 73909.00 72602.00 71242.00 (1307.00) (1.77) (1360.00) (1.87)
Zamboanga Pen. 50419.00 52219.00 51650.00 1800.00 3.57 (569.00) (1.09)
Northern Mindanao 36913.00 41422.00 41840.00 4509.00 12.22 418.00 1.01
Davao Region 29900.00 31433.00 28313.00 1533.00 5.13 (3120.00) (9.93)
SOCCSKSARGEN 108267.00 103837.00 110081.00 (4430.00) (4.09) 6244.00 6.01
Caraga 4863.00 4601.00 4515.00 (262.00) (5.39) (86.00) (1.87)
ARMM 49813.00 80368.00 66862.00 30555.00 61.34 (13506.00) (16.81)
YIELD/ HA (MT)PHILIPPINES 3.75 3.72 3.93 (0.03) (0.79) 0.21 5.67
CAR 4.03 4.24 4.26 0.21 5.17 0.02 0.37
Ilocos 4.45 4.57 4.62 0.12 2.72 0.06 1.21
Cagayan Valley 4.09 3.87 4.34 (0.22) (5.48) 0.47 12.09
Central Luzon 4.68 4.92 5.07 0.24 5.06 0.15 3.04
CALABARZON 3.52 3.07 3.76 (0.45) (12.83) 0.69 22.45
MIMAROPA 3.38 3.61 3.84 0.24 7.03 0.22 6.13
Bicol 3.51 3.71 3.95 0.20 5.61 0.25 6.65
Western Visayas 3.15 3.05 3.28 (0.09) (2.98) 0.23 7.40
Central Visayas 3.15 2.98 3.19 (0.17) (5.38) 0.21 7.14
Eastern Visayas 3.14 3.02 3.02 (0.12) (3.81) 0.00 0.03
Zamboanga Pen. 3.78 3.93 3.95 0.15 3.95 0.01 0.37
Northern Mindanao 3.88 4.24 4.41 0.37 9.42 0.16 3.79
Davao Region 4.02 4.49 4.62 0.47 11.60 0.13 2.94
SOCCSKSARGEN 3.72 3.84 3.98 0.13 3.39 0.14 3.54
Caraga 3.11 3.21 3.26 0.10 3.29 0.05 1.48
ARMM 2.74 2.32 2.30 (0.42) (15.30) (0.03) (1.12)
NOTE: Totals, yields and percentage changes were derived from unrounded figures.
a/ - Standing crop
2015 a/Item
2013.00 2014.00
Change
January-March
2013/2012 2015/2014
1/13/2015 2:33 PM
Table 1.6 Palay: Crop estimates and forecasts by region, Philippines, April-June, 2013-2015
Level % Level %
PRODUCTION (MT)PHILIPPINES 3827689.01 4073011.00 3956970.57 245321.99 6.41 (116040.43) (2.85)
CAR 136818.00 139185.00 137088.00 2367.00 1.73 (2097.00) (1.51)
Ilocos 124165.00 142898.00 137889.00 18733.00 15.09 (5009.00) (3.51)
Cagayan Valley 545959.61 686212.00 669018.85 140252.39 25.69 (17193.15) (2.51)
Central Luzon 1021668.00 1142427.00 1039380.00 120759.00 11.82 (103047.00) (9.02)
CALABARZON 119462.00 111555.00 136859.72 (7907.00) (6.62) 25304.72 22.68
MIMAROPA 197460.00 198579.00 153932.00 1119.00 0.57 (44647.00) (22.48)
Bicol 350030.40 347153.00 351548.00 (2877.40) (0.82) 4395.00 1.27
Western Visayas 115978.00 111040.00 113086.00 (4938.00) (4.26) 2046.00 1.84
Central Visayas 57279.00 57074.00 60887.00 (205.00) (0.36) 3813.00 6.68
Eastern Visayas 299584.00 303753.00 307818.00 4169.00 1.39 4065.00 1.34
Zamboanga Pen. 76571.00 68223.00 71274.00 (8348.00) (10.90) 3051.00 4.47
Northern Mindanao 141508.00 139538.00 131585.00 (1970.00) (1.39) (7953.00) (5.70)
Davao Region 80480.00 82781.00 89409.00 2301.00 2.86 6628.00 8.01
SOCCSKSARGEN 132954.00 144341.00 134103.00 11387.00 8.56 (10238.00) (7.09)
Caraga 304717.00 315487.00 313174.00 10770.00 3.53 (2313.00) (0.73)
ARMM 123055.00 82765.00 109919.00 (40290.00) (32.74) 27154.00 32.81
HARVEST AREA (Ha)PHILIPPINES 930672.58 938989.68 929941.68 8317.10 0.89 (9048.00) (0.96)
CAR 30613.00 30676.00 30653.00 63.00 0.21 (23.00) (0.07)
Ilocos 28753.00 32844.00 31343.00 4091.00 14.23 (1501.00) (4.57)
Cagayan Valley 130503.58 153157.68 150638.68 22654.10 17.36 (2519.00) (1.64)
Central Luzon 180025.00 183397.00 175785.00 3372.00 1.87 (7612.00) (4.15)
CALABARZON 30118.00 29728.00 34277.00 (390.00) (1.29) 4549.00 15.30
MIMAROPA 50303.00 49748.00 37962.00 (555.00) (1.10) (11786.00) (23.69)
Bicol 94208.00 91359.00 93616.00 (2849.00) (3.02) 2257.00 2.47
Western Visayas 35530.00 36924.00 35237.00 1394.00 3.92 (1687.00) (4.57)
Central Visayas 19223.00 18580.00 19856.00 (643.00) (3.34) 1276.00 6.87
Eastern Visayas 77071.00 78447.00 79566.00 1376.00 1.79 1119.00 1.43
Zamboanga Pen. 19206.00 16801.00 17335.00 (2405.00) (12.52) 534.00 3.18
Northern Mindanao 34337.00 31636.00 31428.00 (2701.00) (7.87) (208.00) (0.66)
Davao Region 21986.00 21136.00 22916.00 (850.00) (3.87) 1780.00 8.42
SOCCSKSARGEN 37529.00 37765.00 36106.00 236.00 0.63 (1659.00) (4.39)
Caraga 91291.00 92011.00 91646.00 720.00 0.79 (365.00) (0.40)
ARMM 49976.00 34780.00 41577.00 (15196.00) (30.41) 6797.00 19.54
YIELD/ HA (MT)PHILIPPINES 4.11 4.34 4.26 0.22 5.47 (0.08) (1.90)
CAR 4.47 4.54 4.47 0.07 1.52 (0.07) (1.43)
Ilocos 4.32 4.35 4.40 0.03 0.75 0.05 1.12
Cagayan Valley 4.18 4.48 4.44 0.30 7.10 (0.04) (0.88)
Central Luzon 5.68 6.23 5.91 0.55 9.76 (0.32) (5.08)
CALABARZON 3.97 3.75 3.99 (0.21) (5.39) 0.24 6.40
MIMAROPA 3.93 3.99 4.05 0.07 1.69 0.06 1.58
Bicol 3.72 3.80 3.76 0.08 2.27 (0.04) (1.18)
Western Visayas 3.26 3.01 3.21 (0.26) (7.87) 0.20 6.72
Central Visayas 2.98 3.07 3.07 0.09 3.09 (0.01) (0.17)
Eastern Visayas 3.89 3.87 3.87 (0.02) (0.39) (0.00) (0.09)
Zamboanga Pen. 3.99 4.06 4.11 0.07 1.85 0.05 1.25
Northern Mindanao 4.12 4.41 4.19 0.29 7.03 (0.22) (5.08)
Davao Region 3.66 3.92 3.90 0.26 7.00 (0.01) (0.38)
SOCCSKSARGEN 3.54 3.82 3.71 0.28 7.89 (0.11) (2.82)
Caraga 3.34 3.43 3.42 0.09 2.72 (0.01) (0.34)
ARMM 2.46 2.38 2.64 (0.08) (3.36) 0.26 11.10
NOTE: Totals, yields and percentage changes were derived from unrounded figures.
b/ - Planting intentions
Item
April-June
2015 b/2013.00 2014.00
Change
2015/20142014/2013
1/13/2015 2:33 PM
Table 1.7 Palay: Crop estimates and forecasts by region, Philippines, January-June, 2013-2015
Level % Level %
PRODUCTION (MT)PHILIPPINES 7997632.01 8379901.95 8548944.36 382269.94 4.78 169042.41 2.02
CAR 193087.00 198027.00 196482.00 4940.00 2.56 (1545.00) (0.78)
Ilocos 430660.00 459148.00 467881.00 28488.00 6.61 8733.00 1.90
Cagayan Valley 1265302.61 1296966.95 1362214.64 31664.34 2.50 65247.69 5.03
Central Luzon 1691044.00 1854159.00 1768207.00 163115.00 9.65 (85952.00) (4.64)
CALABARZON 218091.00 194459.00 231771.72 (23632.00) (10.84) 37312.72 19.19
MIMAROPA 404459.00 431095.00 461041.00 26636.00 6.59 29946.00 6.95
Bicol 625284.40 644515.00 676680.00 19230.60 3.08 32165.00 4.99
Western Visayas 614016.00 672099.00 726641.00 58083.00 9.46 54542.00 8.12
Central Visayas 156329.00 150445.00 160167.00 (5884.00) (3.76) 9722.00 6.46
Eastern Visayas 531728.00 523113.00 523128.00 (8615.00) (1.62) 15.00 0.00
Zamboanga Pen. 267268.00 273538.00 275094.00 6270.00 2.35 1556.00 0.57
Northern Mindanao 284687.00 315347.00 315899.00 30660.00 10.77 552.00 0.18
Davao Region 200709.00 223830.00 220192.00 23121.00 11.52 (3638.00) (1.63)
SOCCSKSARGEN 535468.00 543461.00 572184.00 7993.00 1.49 28723.00 5.29
Caraga 319839.00 330265.00 327891.00 10426.00 3.26 (2374.00) (0.72)
ARMM 259660.00 269434.00 263471.00 9774.00 3.76 (5963.00) (2.21)
HARVEST AREA (Ha)PHILIPPINES 2043748.58 2097749.68 2099139.68 54001.10 2.64 1390.00 0.07
CAR 44567.00 44551.00 44606.00 (16.00) (0.04) 55.00 0.12
Ilocos 97666.00 102067.00 102713.00 4401.00 4.51 646.00 0.63
Cagayan Valley 306291.58 311062.68 310530.68 4771.10 1.56 (532.00) (0.17)
Central Luzon 322987.00 328090.00 319583.00 5103.00 1.58 (8507.00) (2.59)
CALABARZON 58152.00 56761.00 59552.00 (1391.00) (2.39) 2791.00 4.92
MIMAROPA 111598.00 114079.00 118022.00 2481.00 2.22 3943.00 3.46
Bicol 172603.00 171555.00 175837.00 (1048.00) (0.61) 4282.00 2.50
Western Visayas 193704.00 220587.00 222242.00 26883.00 13.88 1655.00 0.75
Central Visayas 50700.00 49939.00 50977.00 (761.00) (1.50) 1038.00 2.08
Eastern Visayas 150980.00 151049.00 150808.00 69.00 0.05 (241.00) (0.16)
Zamboanga Pen. 69625.00 69020.00 68985.00 (605.00) (0.87) (35.00) (0.05)
Northern Mindanao 71250.00 73058.00 73268.00 1808.00 2.54 210.00 0.29
Davao Region 51886.00 52569.00 51229.00 683.00 1.32 (1340.00) (2.55)
SOCCSKSARGEN 145796.00 141602.00 146187.00 (4194.00) (2.88) 4585.00 3.24
Caraga 96154.00 96612.00 96161.00 458.00 0.48 (451.00) (0.47)
ARMM 99789.00 115148.00 108439.00 15359.00 15.39 (6709.00) (5.83)
YIELD/ HA (MT)PHILIPPINES 3.91 3.99 4.07 0.08 2.08 0.08 1.95
CAR 4.33 4.44 4.40 0.11 2.60 (0.04) (0.90)
Ilocos 4.41 4.50 4.56 0.09 2.02 0.06 1.26
Cagayan Valley 4.13 4.17 4.39 0.04 0.93 0.22 5.21
Central Luzon 5.24 5.65 5.53 0.42 7.94 (0.12) (2.10)
CALABARZON 3.75 3.43 3.89 (0.32) (8.65) 0.47 13.60
MIMAROPA 3.62 3.78 3.91 0.15 4.27 0.13 3.37
Bicol 3.62 3.76 3.85 0.13 3.71 0.09 2.43
Western Visayas 3.17 3.05 3.27 (0.12) (3.88) 0.22 7.31
Central Visayas 3.08 3.01 3.14 (0.07) (2.30) 0.13 4.29
Eastern Visayas 3.52 3.46 3.47 (0.06) (1.67) 0.01 0.16
Zamboanga Pen. 3.84 3.96 3.99 0.12 3.24 0.02 0.62
Northern Mindanao 4.00 4.32 4.31 0.32 8.03 (0.00) (0.11)
Davao Region 3.87 4.26 4.30 0.39 10.07 0.04 0.95
SOCCSKSARGEN 3.67 3.84 3.91 0.17 4.50 0.08 1.98
Caraga 3.33 3.42 3.41 0.09 2.77 (0.01) (0.25)
ARMM 2.60 2.34 2.43 (0.26) (10.08) 0.09 3.84
NOTE: Totals, yields and percentage changes were derived from unrounded figures.
2015.00Item
January-June
2013.00 2013/20122014.00
Change
2015/2014
1/13/2015 2:29 PM
PRODUCTION (MT)
January-December 7407068.35 7377309.55 7770602.74 (0.40) 5.33
White 2165548.46 2129090.51 2262234.03 (1.68) 6.25
Yellow 5241519.89 5248219.04 5508368.71 0.13 4.96
January-June 3468978.31 3323525.48 3479744.00 (4.19) 4.70
White 888822.00 788399.69 806210.77 (11.30) 2.26
Yellow 2580156.31 2535125.79 2673533.23 (1.75) 5.46
January-March 2017630.18 2248311.21 2278186.46 11.43 1.33
White 486399.75 466246.97 520620.34 (4.14) 11.66
Yellow 1531230.43 1782064.24 1757566.12 16.38 (1.37)
April-June 1451348.13 1075214.27 1201557.54 (25.92) 11.75
White 402422.25 322152.72 285590.43 (19.95) (11.35)
Yellow 1048925.88 753061.55 915967.11 (28.21) 21.63
July-December 3938090.04 4053784.07 4290858.74 2.94 5.85
White 1276726.46 1340690.82 1456023.26 5.01 8.60
Yellow 2661363.58 2713093.25 2834835.48 1.94 4.49
July-September 2431440.10 2600615.82 2448626.94 6.96 (5.84)
White 762621.37 791647.82 802757.46 3.81 1.40
Yellow 1668818.73 1808968.00 1645869.48 8.40 (9.02)
October-December 1506649.94 1453168.25 1842231.80 (3.55) 26.77
White 514105.09 549043.00 653265.80 6.80 18.98
Yellow 992544.85 904125.25 1188966.00 (8.91) 31.50
AREA HARVESTED (Ha)January-December 2593923.59 2563718.32 2611431.80 (1.16) 1.86
White 1311619.37 1278635.19 1290212.86 (2.51) 0.91
Yellow 1282304.22 1285083.13 1321218.94 0.22 2.81
January-June 1111612.54 1075157.32 1095053.31 (3.28) 1.85
White 502620.69 470158.19 462864.69 (6.46) (1.55)
Yellow 608991.85 604999.13 632188.62 (0.66) 4.49
January-March 651018.00 702987.26 705299.10 7.98 0.33
White 292412.00 281969.59 292582.90 (3.57) 3.76
Yellow 358606.00 421017.67 412716.20 17.40 (1.97)
April-June 460594.54 372170.06 389754.21 (19.20) 4.72
White 210208.69 188188.60 170281.79 (10.48) (9.52)
Yellow 250385.85 183981.46 219472.42 (26.52) 19.29
July-December 1482311.05 1488561.00 1516378.49 0.42 1.87
White 808998.68 808477.00 827348.17 (0.06) 2.33
Yellow 673312.37 680084.00 689030.32 1.01 1.32
July-September 906767.10 934614.00 873573.32 3.07 (6.53)
White 491520.50 484941.00 475221.00 (1.34) (2.00)
Yellow 415246.60 449673.00 398352.32 8.29 (11.41)
October-December 575543.95 553947.00 642805.17 (3.75) 16.04
White 317478.18 323536.00 352127.17 1.91 8.84
Yellow 258065.77 230411.00 290678.00 (10.72) 26.16
YIELD/HECTARE (MT)January-December 2.86 2.88 2.98 0.77 3.41
White 1.65 1.67 1.75 0.85 5.30
Yellow 4.09 4.08 4.17 (0.09) 2.09
January-June 3.12 3.09 3.18 (0.94) 2.80
White 1.77 1.68 1.74 (5.17) 3.87
Yellow 4.24 4.19 4.23 (1.10) 0.92
January-March 3.10 3.20 3.23 3.20 1.00
White 1.66 1.65 1.78 (0.59) 7.61
Yellow 4.27 4.23 4.26 (0.87) 0.61
April-June 3.15 2.89 3.08 (8.31) 6.71
White 1.91 1.71 1.68 (10.58) (2.03)
Yellow 4.19 4.09 4.17 (2.29) 1.96
July-December 2.66 2.72 2.83 2.51 3.91
White 1.58 1.66 1.76 5.08 6.13
Yellow 3.95 3.99 4.11 0.93 3.13
July-September 2.68 2.78 2.80 3.77 0.73
White 1.55 1.63 1.69 5.21 3.48
Yellow 4.02 4.02 4.13 0.10 2.71
October-December 2.62 2.62 2.87 0.21 9.25
White 1.62 1.70 1.86 4.80 9.32
Yellow 3.85 3.92 4.09 2.02 4.24
NOTE: Totals, yields and percentage changes were derived from unrounded figures.
a/ - Standing crop
Table 2. Corn: Crop estimates and forecasts by croptype, by quarter, Philippines, January-December, 2012-2014
ITEM 2012.00 2013.00 PERCENT CHANGE
2014.00 2013 / 2012 2014 / 2013
1/13/2015 2:29 PM
PRODUCTION (MT)
January-June 3323525.48 3479744.00 3689197.36 4.70 6.02
White 788399.69 806210.77 870632.23 2.26 7.99
Yellow 2535125.79 2673533.23 2818565.13 5.46 5.42
January-March 2248311.21 2278186.46 2443480.96 a/ 1.33 7.26
White 466246.97 520620.34 530612.83 11.66 1.92
Yellow 1782064.24 1757566.12 1912868.13 (1.37) 8.84
April-June 1075214.27 1201557.54 1245716.40 b/ 11.75 3.68
White 322152.72 285590.43 340019.40 (11.35) 19.06
Yellow 753061.55 915967.11 905697.00 21.63 (1.12)
AREA HARVESTED (Ha)
January-June 1075157.32 1095053.31 1122972.00 1.85 2.55
White 470158.19 462864.69 482660.50 (1.55) 4.28
Yellow 604999.13 632188.62 640311.50 4.49 1.28
January-March 702987.26 705299.10 719778.00 a/ 0.33 2.05
White 281969.59 292582.90 291738.50 3.76 (0.29)
Yellow 421017.67 412716.20 428039.50 (1.97) 3.71
April-June 372170.06 389754.21 403194.00 b/ 4.72 3.45
White 188188.60 170281.79 190922.00 (9.52) 12.12
Yellow 183981.46 219472.42 212272.00 19.29 (3.28)
YIELD/HECTARE (MT)January-June 3.09 3.18 3.29 2.80 3.38
White 1.68 1.74 1.80 3.87 3.56
Yellow 4.19 4.23 4.40 0.92 4.09
January-March 3.20 3.23 3.39 1.00 5.10
White 1.65 1.78 1.82 7.61 2.21
Yellow 4.23 4.26 4.47 0.61 4.94
April-June 2.89 3.08 3.09 6.71 0.22
White 1.71 1.68 1.78 (2.03) 6.19
Yellow 4.09 4.17 4.27 1.96 2.23
NOTE: Totals, yields and percentage changes were derived from unrounded figures.
a/ - Standing crop
b/ - Planting intentions
Table 2.1 Corn: Crop estimates and forecasts by croptype, by quarter, Philippines, January-June, 2013-2015
ITEM 2013.00 2014.00 PERCENT CHANGE
2015.00 2014 / 2013 2015 / 2014

1/13/2015 2:29 PM
Table 2.2 Corn: Crop estimates and forecasts by region, Philippines, October-December, 2012-2014
Level % Level %
PRODUCTION (MT)PHILIPPINES 1506649.94 1453168.25 1842231.80 (53481.69) (3.55) 389063.55 26.77
CAR 26137.00 33790.00 27916.00 7653.00 29.28 (5874.00) (17.38)
Ilocos 6480.00 7324.00 7821.00 844.00 13.02 497.00 6.79
Cagayan Valley 184711.94 63699.25 360565.80 (121012.69) (65.51) 296866.55 466.04
Central Luzon 8386.00 8035.00 7700.00 (351.00) (4.19) (335.00) (4.17)
CALABARZON 17548.00 26747.00 34124.00 9199.00 52.42 7377.00 27.58
MIMAROPA 6806.00 7720.00 11610.00 914.00 13.43 3890.00 50.39
Bicol 34850.00 39605.00 49173.00 4755.00 13.64 9568.00 24.16
Western Visayas 45297.00 48507.00 72346.00 3210.00 7.09 23839.00 49.15
Central Visayas 41452.00 37366.00 43028.00 (4086.00) (9.86) 5662.00 15.15
Eastern Visayas 25377.00 24308.00 25248.00 (1069.00) (4.21) 940.00 3.87
Zamboanga Pen. 61446.00 65361.00 71376.00 3915.00 6.37 6015.00 9.20
Northern Mindanao 379338.00 352432.00 364333.00 (26906.00) (7.09) 11901.00 3.38
Davao Region 53483.00 78973.00 94448.00 25490.00 47.66 15475.00 19.60
SOCCSKSARGEN 382450.00 415279.00 405456.00 32829.00 8.58 (9823.00) (2.37)
Caraga 45419.00 48463.00 53359.00 3044.00 6.70 4896.00 10.10
ARMM 187469.00 195559.00 213728.00 8090.00 4.32 18169.00 9.29
HARVEST AREA (Ha)PHILIPPINES 575543.95 553947.00 642805.17 (21596.95) (3.75) 88858.17 16.04
CAR 6529.00 7610.00 7465.00 1081.00 16.56 (145.00) (1.91)
Ilocos 1825.00 1991.00 1973.00 166.00 9.10 (18.00) (0.90)
Cagayan Valley 41416.95 16629.00 83733.17 (24787.95) (59.85) 67104.17 403.54
Central Luzon 1852.00 1919.00 1774.00 67.00 3.62 (145.00) (7.56)
CALABARZON 8929.00 10828.00 14632.00 1899.00 21.27 3804.00 35.13
MIMAROPA 3097.00 3525.00 4617.00 428.00 13.82 1092.00 30.98
Bicol 11826.00 13769.00 14321.00 1943.00 16.43 552.00 4.01
Western Visayas 20761.00 19824.00 22578.00 (937.00) (4.51) 2754.00 13.89
Central Visayas 48915.00 47433.00 49852.00 (1482.00) (3.03) 2419.00 5.10
Eastern Visayas 18582.00 18092.00 18223.00 (490.00) (2.64) 131.00 0.72
Zamboanga Pen. 44192.00 40587.00 43919.00 (3605.00) (8.16) 3332.00 8.21
Northern Mindanao 106423.00 98875.00 103364.00 (7548.00) (7.09) 4489.00 4.54
Davao Region 40600.00 52267.00 50281.00 11667.00 28.74 (1986.00) (3.80)
SOCCSKSARGEN 133791.00 131183.00 127616.00 (2608.00) (1.95) (3567.00) (2.72)
Caraga 16657.00 16808.00 17455.00 151.00 0.91 647.00 3.85
ARMM 70148.00 72607.00 81002.00 2459.00 3.51 8395.00 11.56
YIELD/ HA (MT)PHILIPPINES 2.62 2.62 2.87 0.01 0.21 0.24 9.25
CAR 4.00 4.44 3.74 0.44 10.92 (0.70) (15.78)
Ilocos 3.55 3.68 3.96 0.13 3.60 0.29 7.76
Cagayan Valley 4.46 3.83 4.31 (0.63) (14.11) 0.48 12.41
Central Luzon 4.53 4.19 4.34 (0.34) (7.53) 0.15 3.66
CALABARZON 1.97 2.47 2.33 0.50 25.69 (0.14) (5.59)
MIMAROPA 2.20 2.19 2.51 (0.01) (0.34) 0.32 14.82
Bicol 2.95 2.88 3.43 (0.07) (2.39) 0.56 19.37
Western Visayas 2.18 2.45 3.20 0.27 12.15 0.76 30.95
Central Visayas 0.85 0.79 0.86 (0.06) (7.04) 0.08 9.57
Eastern Visayas 1.37 1.34 1.39 (0.02) (1.62) 0.04 3.12
Zamboanga Pen. 1.39 1.61 1.63 0.22 15.82 0.01 0.92
Northern Mindanao 3.56 3.56 3.52 (0.00) (0.00) (0.04) (1.11)
Davao Region 1.32 1.51 1.88 0.19 14.70 0.37 24.32
SOCCSKSARGEN 2.86 3.17 3.18 0.31 10.74 0.01 0.36
Caraga 2.73 2.88 3.06 0.16 5.74 0.17 6.02
ARMM 2.67 2.69 2.64 0.02 0.78 (0.05) (2.04)
NOTE: Totals, yields and percentage changes were derived from unrounded figures.
Item 2013/20122012.00 2013.00
Change
2014.00
October-December
2014/2013
1/13/2015 2:29 PM
Table 2.3 Corn: Crop estimates and forecasts by region, Philippines, July-December, 2012-2014
Level % Level %
PRODUCTION (MT)PHILIPPINES 3938090.04 4053784.07 4290858.74 115694.03 2.94 237074.67 5.85
CAR 116457.00 131776.00 127072.00 15319.00 13.15 (4704.00) (3.57)
Ilocos 14592.00 16044.00 16392.00 1452.00 9.95 348.00 2.17
Cagayan Valley 936143.04 793975.07 932923.78 (142167.97) (15.19) 138948.71 17.50
Central Luzon 24141.00 24562.00 25537.00 421.00 1.74 975.00 3.97
CALABARZON 41885.00 57407.00 52881.96 15522.00 37.06 (4525.04) (7.88)
MIMAROPA 29881.00 31946.00 34171.00 2065.00 6.91 2225.00 6.96
Bicol 107561.00 118763.00 130590.00 11202.00 10.41 11827.00 9.96
Western Visayas 179922.00 208645.00 234238.00 28723.00 15.96 25593.00 12.27
Central Visayas 138497.00 144396.00 137424.00 5899.00 4.26 (6972.00) (4.83)
Eastern Visayas 46520.00 45166.00 46294.00 (1354.00) (2.91) 1128.00 2.50
Zamboanga Pen. 144930.00 149357.00 174829.00 4427.00 3.05 25472.00 17.05
Northern Mindanao 828193.00 861013.00 836936.00 32820.00 3.96 (24077.00) (2.80)
Davao Region 123003.00 154569.00 180721.00 31566.00 25.66 26152.00 16.92
SOCCSKSARGEN 747595.00 831209.00 852812.00 83614.00 11.18 21603.00 2.60
Caraga 75797.00 93076.00 99870.00 17279.00 22.80 6794.00 7.30
ARMM 382973.00 391880.00 408167.00 8907.00 2.33 16287.00 4.16
HARVEST AREA (Ha)PHILIPPINES 1482311.05 1488561.00 1516378.49 6249.95 0.42 27817.49 1.87
CAR 31037.00 34238.00 34345.00 3201.00 10.31 107.00 0.31
Ilocos 4262.00 4562.00 4378.00 300.00 7.04 (184.00) (4.03)
Cagayan Valley 217474.05 199343.00 217425.49 (18131.05) (8.34) 18082.49 9.07
Central Luzon 6467.00 6641.00 6412.00 174.00 2.69 (229.00) (3.45)
CALABARZON 22720.00 24188.00 24951.00 1468.00 6.46 763.00 3.15
MIMAROPA 11440.00 11632.00 11962.00 192.00 1.68 330.00 2.84
Bicol 54205.00 53916.00 54772.00 (289.00) (0.53) 856.00 1.59
Western Visayas 70927.00 74808.00 73078.00 3881.00 5.47 (1730.00) (2.31)
Central Visayas 158248.00 155098.00 154873.00 (3150.00) (1.99) (225.00) (0.15)
Eastern Visayas 33452.00 32422.00 32568.00 (1030.00) (3.08) 146.00 0.45
Zamboanga Pen. 98596.00 92526.00 100967.00 (6070.00) (6.16) 8441.00 9.12
Northern Mindanao 238854.00 241078.00 241495.00 2224.00 0.93 417.00 0.17
Davao Region 87449.00 101228.00 104177.00 13779.00 15.76 2949.00 2.91
SOCCSKSARGEN 263413.00 266703.00 268093.00 3290.00 1.25 1390.00 0.52
Caraga 27948.00 32394.00 33546.00 4446.00 15.91 1152.00 3.56
ARMM 155819.00 157784.00 153336.00 1965.00 1.26 (4448.00) (2.82)
YIELD/ HA (MT)PHILIPPINES 2.66 2.72 2.83 0.07 2.51 0.11 3.91
CAR 3.75 3.85 3.70 0.10 2.58 (0.15) (3.87)
Ilocos 3.42 3.52 3.74 0.09 2.72 0.23 6.46
Cagayan Valley 4.30 3.98 4.29 (0.32) (7.47) 0.31 7.73
Central Luzon 3.73 3.70 3.98 (0.03) (0.92) 0.28 7.68
CALABARZON 1.84 2.37 2.12 0.53 28.74 (0.25) (10.70)
MIMAROPA 2.61 2.75 2.86 0.13 5.15 0.11 4.01
Bicol 1.98 2.20 2.38 0.22 11.01 0.18 8.24
Western Visayas 2.54 2.79 3.21 0.25 9.95 0.42 14.92
Central Visayas 0.88 0.93 0.89 0.06 6.38 (0.04) (4.69)
Eastern Visayas 1.39 1.39 1.42 0.00 0.17 0.03 2.04
Zamboanga Pen. 1.47 1.61 1.73 0.14 9.82 0.12 7.27
Northern Mindanao 3.47 3.57 3.47 0.10 3.00 (0.11) (2.96)
Davao Region 1.41 1.53 1.73 0.12 8.56 0.21 13.61
SOCCSKSARGEN 2.84 3.12 3.18 0.28 9.81 0.06 2.07
Caraga 2.71 2.87 2.98 0.16 5.94 0.10 3.61
ARMM 2.46 2.48 2.66 0.03 1.05 0.18 7.18
NOTE: Totals, yields and percentage changes were derived from unrounded figures.
Item
July-December
Change
2013/2012 2014/20132012.00 2013.00 2014.00
1/13/2015 2:29 PM
Table 2.4 Corn: Crop estimates and forecasts by region, Philippines, January-December, 2012-2014
Level % Level %
PRODUCTION (MT)PHILIPPINES 7407068.35 7377309.55 7770602.74 (29758.80) (0.40) 393293.19 5.33
CAR 225135.00 242074.00 244576.00 16939.00 7.52 2502.00 1.03
Ilocos 434720.00 447503.00 476740.79 12783.00 2.94 29237.79 6.53
Cagayan Valley 1875622.97 1713907.55 1856714.99 (161715.42) (8.62) 142807.44 8.33
Central Luzon 210574.00 227765.00 240870.00 17191.00 8.16 13105.00 5.75
CALABARZON 58657.00 75165.00 74328.96 16508.00 28.14 (836.04) (1.11)
MIMAROPA 87223.20 104678.00 107723.00 17454.80 20.01 3045.00 2.91
Bicol 230545.00 258115.00 285647.00 27570.00 11.96 27532.00 10.67
Western Visayas 330782.00 345527.00 368404.00 14745.00 4.46 22877.00 6.62
Central Visayas 172138.00 173225.00 164197.00 1087.00 0.63 (9028.00) (5.21)
Eastern Visayas 87333.18 89327.00 88162.00 1993.82 2.28 (1165.00) (1.30)
Zamboanga Pen. 211331.00 207787.00 223342.00 (3544.00) (1.68) 15555.00 7.49
Northern Mindanao 1228754.00 1185036.00 1196542.00 (43718.00) (3.56) 11506.00 0.97
Davao Region 198627.00 227013.00 280293.00 28386.00 14.29 53280.00 23.47
SOCCSKSARGEN 1201331.00 1305607.00 1338065.00 104276.00 8.68 32458.00 2.49
Caraga 89521.00 107476.00 125406.00 17955.00 20.06 17930.00 16.68
ARMM 764774.00 667104.00 699591.00 (97670.00) (12.77) 32487.00 4.87
HARVEST AREA (Ha)PHILIPPINES 2593923.59 2563718.32 2611431.80 (30205.27) (1.16) 47713.48 1.86
CAR 57290.00 61639.00 64832.00 4349.00 7.59 3193.00 5.18
Ilocos 82793.00 84106.00 87763.00 1313.00 1.59 3657.00 4.35
Cagayan Valley 432464.59 416823.32 437728.80 (15641.27) (3.62) 20905.48 5.02
Central Luzon 40481.00 44151.00 43535.00 3670.00 9.07 (616.00) (1.40)
CALABARZON 33080.00 33906.00 34518.00 826.00 2.50 612.00 1.80
MIMAROPA 24496.00 28022.00 29135.00 3526.00 14.39 1113.00 3.97
Bicol 112964.00 109582.00 113596.00 (3382.00) (2.99) 4014.00 3.66
Western Visayas 122569.00 123946.00 124312.00 1377.00 1.12 366.00 0.30
Central Visayas 206270.00 197941.00 193089.00 (8329.00) (4.04) (4852.00) (2.45)
Eastern Visayas 61699.00 61722.00 60752.00 23.00 0.04 (970.00) (1.57)
Zamboanga Pen. 134979.00 125949.00 130116.00 (9030.00) (6.69) 4167.00 3.31
Northern Mindanao 376800.00 372565.00 374646.00 (4235.00) (1.12) 2081.00 0.56
Davao Region 146077.00 159378.00 169306.00 13301.00 9.11 9928.00 6.23
SOCCSKSARGEN 429319.00 430007.00 428556.00 688.00 0.16 (1451.00) (0.34)
Caraga 33830.00 38017.00 41957.00 4187.00 12.38 3940.00 10.36
ARMM 298812.00 275964.00 277590.00 (22848.00) (7.65) 1626.00 0.59
YIELD/ HA (MT)PHILIPPINES 2.86 2.88 2.98 0.02 0.77 0.10 3.41
CAR 3.93 3.93 3.77 (0.00) (0.06) (0.15) (3.94)
Ilocos 5.25 5.32 5.43 0.07 1.33 0.11 2.09
Cagayan Valley 4.34 4.11 4.24 (0.23) (5.19) 0.13 3.16
Central Luzon 5.20 5.16 5.53 (0.04) (0.83) 0.37 7.25
CALABARZON 1.77 2.22 2.15 0.44 25.02 (0.06) (2.87)
MIMAROPA 3.56 3.74 3.70 0.17 4.91 (0.04) (1.02)
Bicol 2.04 2.36 2.51 0.31 15.41 0.16 6.76
Western Visayas 2.70 2.79 2.96 0.09 3.30 0.18 6.31
Central Visayas 0.83 0.88 0.85 0.04 4.87 (0.02) (2.83)
Eastern Visayas 1.42 1.45 1.45 0.03 2.24 0.00 0.27
Zamboanga Pen. 1.57 1.65 1.72 0.08 5.37 0.07 4.04
Northern Mindanao 3.26 3.18 3.19 (0.08) (2.46) 0.01 0.41
Davao Region 1.36 1.42 1.66 0.06 4.75 0.23 16.23
SOCCSKSARGEN 2.80 3.04 3.12 0.24 8.51 0.09 2.83
Caraga 2.65 2.83 2.99 0.18 6.83 0.16 5.73
ARMM 2.56 2.42 2.52 (0.14) (5.55) 0.10 4.26
NOTE: Totals, yields and percentage changes were derived from unrounded figures.
Item2012.00 2013.00
Change
2013/2012
January-December
2014.00 2014/2013
1/13/2015 2:29 PM
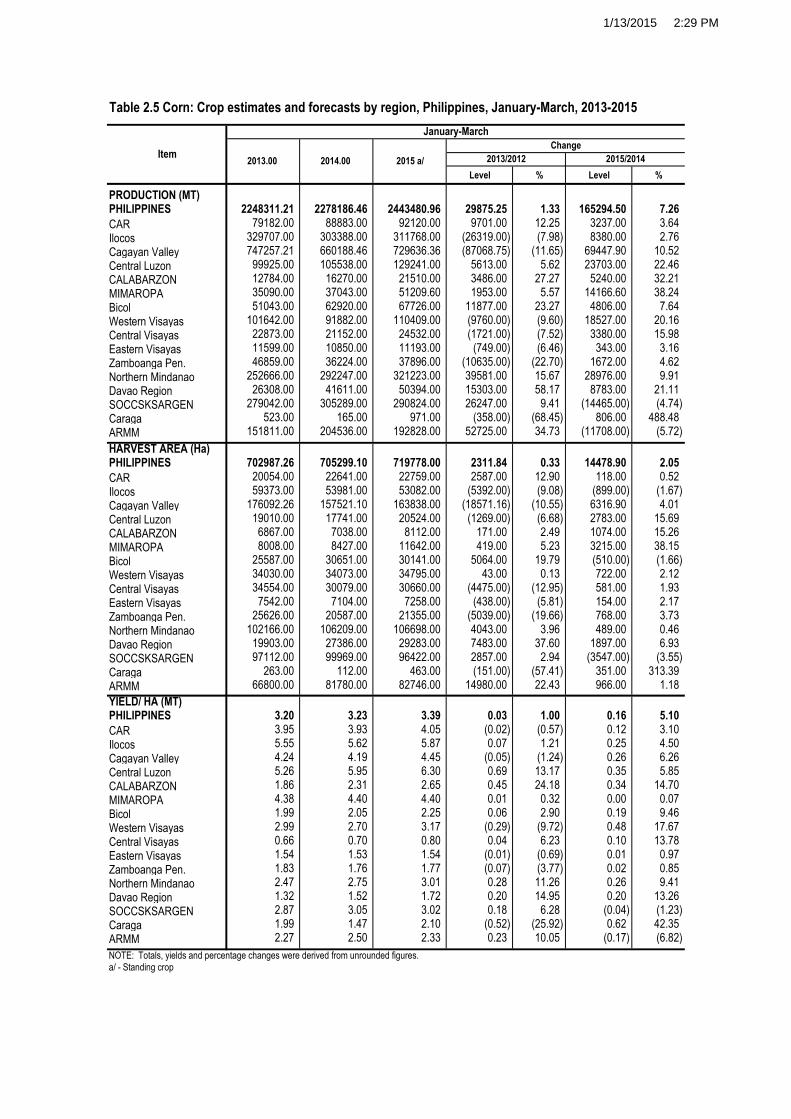
Table 2.5 Corn: Crop estimates and forecasts by region, Philippines, January-March, 2013-2015
Level % Level %
PRODUCTION (MT)PHILIPPINES 2248311.21 2278186.46 2443480.96 29875.25 1.33 165294.50 7.26
CAR 79182.00 88883.00 92120.00 9701.00 12.25 3237.00 3.64
Ilocos 329707.00 303388.00 311768.00 (26319.00) (7.98) 8380.00 2.76
Cagayan Valley 747257.21 660188.46 729636.36 (87068.75) (11.65) 69447.90 10.52
Central Luzon 99925.00 105538.00 129241.00 5613.00 5.62 23703.00 22.46
CALABARZON 12784.00 16270.00 21510.00 3486.00 27.27 5240.00 32.21
MIMAROPA 35090.00 37043.00 51209.60 1953.00 5.57 14166.60 38.24
Bicol 51043.00 62920.00 67726.00 11877.00 23.27 4806.00 7.64
Western Visayas 101642.00 91882.00 110409.00 (9760.00) (9.60) 18527.00 20.16
Central Visayas 22873.00 21152.00 24532.00 (1721.00) (7.52) 3380.00 15.98
Eastern Visayas 11599.00 10850.00 11193.00 (749.00) (6.46) 343.00 3.16
Zamboanga Pen. 46859.00 36224.00 37896.00 (10635.00) (22.70) 1672.00 4.62
Northern Mindanao 252666.00 292247.00 321223.00 39581.00 15.67 28976.00 9.91
Davao Region 26308.00 41611.00 50394.00 15303.00 58.17 8783.00 21.11
SOCCSKSARGEN 279042.00 305289.00 290824.00 26247.00 9.41 (14465.00) (4.74)
Caraga 523.00 165.00 971.00 (358.00) (68.45) 806.00 488.48
ARMM 151811.00 204536.00 192828.00 52725.00 34.73 (11708.00) (5.72)
HARVEST AREA (Ha)PHILIPPINES 702987.26 705299.10 719778.00 2311.84 0.33 14478.90 2.05
CAR 20054.00 22641.00 22759.00 2587.00 12.90 118.00 0.52
Ilocos 59373.00 53981.00 53082.00 (5392.00) (9.08) (899.00) (1.67)
Cagayan Valley 176092.26 157521.10 163838.00 (18571.16) (10.55) 6316.90 4.01
Central Luzon 19010.00 17741.00 20524.00 (1269.00) (6.68) 2783.00 15.69
CALABARZON 6867.00 7038.00 8112.00 171.00 2.49 1074.00 15.26
MIMAROPA 8008.00 8427.00 11642.00 419.00 5.23 3215.00 38.15
Bicol 25587.00 30651.00 30141.00 5064.00 19.79 (510.00) (1.66)
Western Visayas 34030.00 34073.00 34795.00 43.00 0.13 722.00 2.12
Central Visayas 34554.00 30079.00 30660.00 (4475.00) (12.95) 581.00 1.93
Eastern Visayas 7542.00 7104.00 7258.00 (438.00) (5.81) 154.00 2.17
Zamboanga Pen. 25626.00 20587.00 21355.00 (5039.00) (19.66) 768.00 3.73
Northern Mindanao 102166.00 106209.00 106698.00 4043.00 3.96 489.00 0.46
Davao Region 19903.00 27386.00 29283.00 7483.00 37.60 1897.00 6.93
SOCCSKSARGEN 97112.00 99969.00 96422.00 2857.00 2.94 (3547.00) (3.55)
Caraga 263.00 112.00 463.00 (151.00) (57.41) 351.00 313.39
ARMM 66800.00 81780.00 82746.00 14980.00 22.43 966.00 1.18
YIELD/ HA (MT)PHILIPPINES 3.20 3.23 3.39 0.03 1.00 0.16 5.10
CAR 3.95 3.93 4.05 (0.02) (0.57) 0.12 3.10
Ilocos 5.55 5.62 5.87 0.07 1.21 0.25 4.50
Cagayan Valley 4.24 4.19 4.45 (0.05) (1.24) 0.26 6.26
Central Luzon 5.26 5.95 6.30 0.69 13.17 0.35 5.85
CALABARZON 1.86 2.31 2.65 0.45 24.18 0.34 14.70
MIMAROPA 4.38 4.40 4.40 0.01 0.32 0.00 0.07
Bicol 1.99 2.05 2.25 0.06 2.90 0.19 9.46
Western Visayas 2.99 2.70 3.17 (0.29) (9.72) 0.48 17.67
Central Visayas 0.66 0.70 0.80 0.04 6.23 0.10 13.78
Eastern Visayas 1.54 1.53 1.54 (0.01) (0.69) 0.01 0.97
Zamboanga Pen. 1.83 1.76 1.77 (0.07) (3.77) 0.02 0.85
Northern Mindanao 2.47 2.75 3.01 0.28 11.26 0.26 9.41
Davao Region 1.32 1.52 1.72 0.20 14.95 0.20 13.26
SOCCSKSARGEN 2.87 3.05 3.02 0.18 6.28 (0.04) (1.23)
Caraga 1.99 1.47 2.10 (0.52) (25.92) 0.62 42.35
ARMM 2.27 2.50 2.33 0.23 10.05 (0.17) (6.82)
NOTE: Totals, yields and percentage changes were derived from unrounded figures.
a/ - Standing crop
Item
January-March
2013.00 2014.00
Change
2015 a/ 2013/2012 2015/2014
1/13/2015 2:29 PM
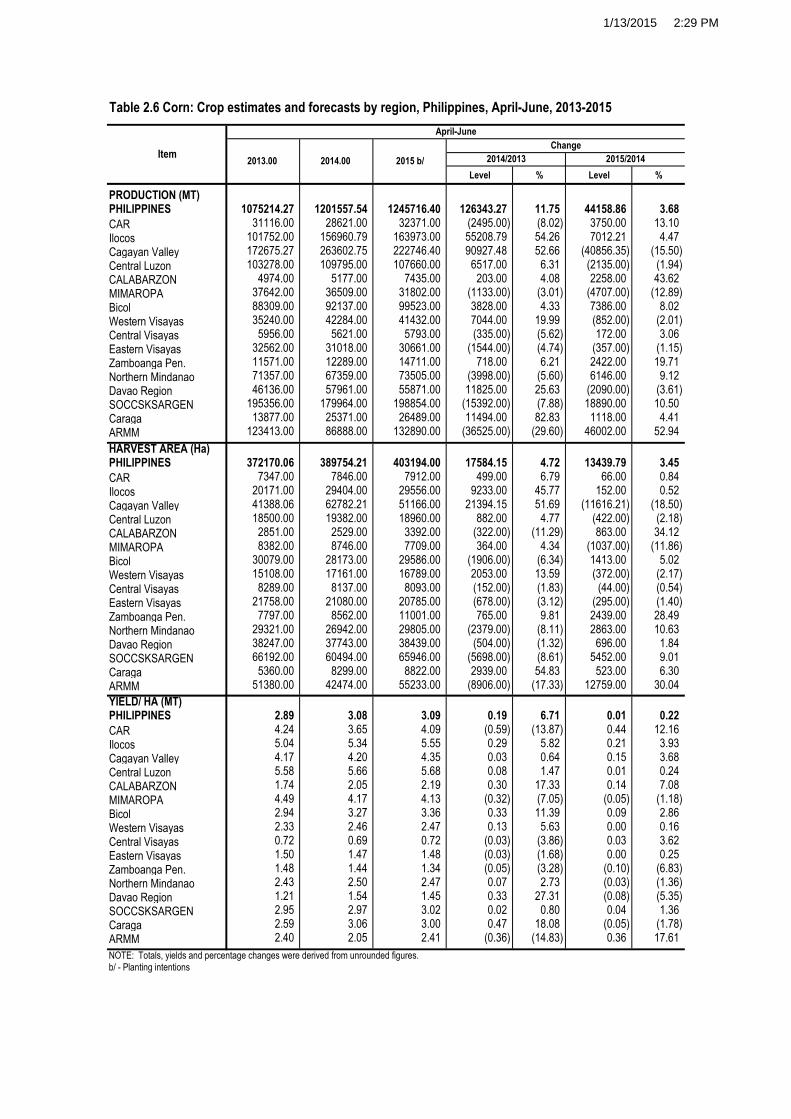
Table 2.6 Corn: Crop estimates and forecasts by region, Philippines, April-June, 2013-2015
Level % Level %
PRODUCTION (MT)PHILIPPINES 1075214.27 1201557.54 1245716.40 126343.27 11.75 44158.86 3.68
CAR 31116.00 28621.00 32371.00 (2495.00) (8.02) 3750.00 13.10
Ilocos 101752.00 156960.79 163973.00 55208.79 54.26 7012.21 4.47
Cagayan Valley 172675.27 263602.75 222746.40 90927.48 52.66 (40856.35) (15.50)
Central Luzon 103278.00 109795.00 107660.00 6517.00 6.31 (2135.00) (1.94)
CALABARZON 4974.00 5177.00 7435.00 203.00 4.08 2258.00 43.62
MIMAROPA 37642.00 36509.00 31802.00 (1133.00) (3.01) (4707.00) (12.89)
Bicol 88309.00 92137.00 99523.00 3828.00 4.33 7386.00 8.02
Western Visayas 35240.00 42284.00 41432.00 7044.00 19.99 (852.00) (2.01)
Central Visayas 5956.00 5621.00 5793.00 (335.00) (5.62) 172.00 3.06
Eastern Visayas 32562.00 31018.00 30661.00 (1544.00) (4.74) (357.00) (1.15)
Zamboanga Pen. 11571.00 12289.00 14711.00 718.00 6.21 2422.00 19.71
Northern Mindanao 71357.00 67359.00 73505.00 (3998.00) (5.60) 6146.00 9.12
Davao Region 46136.00 57961.00 55871.00 11825.00 25.63 (2090.00) (3.61)
SOCCSKSARGEN 195356.00 179964.00 198854.00 (15392.00) (7.88) 18890.00 10.50
Caraga 13877.00 25371.00 26489.00 11494.00 82.83 1118.00 4.41
ARMM 123413.00 86888.00 132890.00 (36525.00) (29.60) 46002.00 52.94
HARVEST AREA (Ha)PHILIPPINES 372170.06 389754.21 403194.00 17584.15 4.72 13439.79 3.45
CAR 7347.00 7846.00 7912.00 499.00 6.79 66.00 0.84
Ilocos 20171.00 29404.00 29556.00 9233.00 45.77 152.00 0.52
Cagayan Valley 41388.06 62782.21 51166.00 21394.15 51.69 (11616.21) (18.50)
Central Luzon 18500.00 19382.00 18960.00 882.00 4.77 (422.00) (2.18)
CALABARZON 2851.00 2529.00 3392.00 (322.00) (11.29) 863.00 34.12
MIMAROPA 8382.00 8746.00 7709.00 364.00 4.34 (1037.00) (11.86)
Bicol 30079.00 28173.00 29586.00 (1906.00) (6.34) 1413.00 5.02
Western Visayas 15108.00 17161.00 16789.00 2053.00 13.59 (372.00) (2.17)
Central Visayas 8289.00 8137.00 8093.00 (152.00) (1.83) (44.00) (0.54)
Eastern Visayas 21758.00 21080.00 20785.00 (678.00) (3.12) (295.00) (1.40)
Zamboanga Pen. 7797.00 8562.00 11001.00 765.00 9.81 2439.00 28.49
Northern Mindanao 29321.00 26942.00 29805.00 (2379.00) (8.11) 2863.00 10.63
Davao Region 38247.00 37743.00 38439.00 (504.00) (1.32) 696.00 1.84
SOCCSKSARGEN 66192.00 60494.00 65946.00 (5698.00) (8.61) 5452.00 9.01
Caraga 5360.00 8299.00 8822.00 2939.00 54.83 523.00 6.30
ARMM 51380.00 42474.00 55233.00 (8906.00) (17.33) 12759.00 30.04
YIELD/ HA (MT)PHILIPPINES 2.89 3.08 3.09 0.19 6.71 0.01 0.22
CAR 4.24 3.65 4.09 (0.59) (13.87) 0.44 12.16
Ilocos 5.04 5.34 5.55 0.29 5.82 0.21 3.93
Cagayan Valley 4.17 4.20 4.35 0.03 0.64 0.15 3.68
Central Luzon 5.58 5.66 5.68 0.08 1.47 0.01 0.24
CALABARZON 1.74 2.05 2.19 0.30 17.33 0.14 7.08
MIMAROPA 4.49 4.17 4.13 (0.32) (7.05) (0.05) (1.18)
Bicol 2.94 3.27 3.36 0.33 11.39 0.09 2.86
Western Visayas 2.33 2.46 2.47 0.13 5.63 0.00 0.16
Central Visayas 0.72 0.69 0.72 (0.03) (3.86) 0.03 3.62
Eastern Visayas 1.50 1.47 1.48 (0.03) (1.68) 0.00 0.25
Zamboanga Pen. 1.48 1.44 1.34 (0.05) (3.28) (0.10) (6.83)
Northern Mindanao 2.43 2.50 2.47 0.07 2.73 (0.03) (1.36)
Davao Region 1.21 1.54 1.45 0.33 27.31 (0.08) (5.35)
SOCCSKSARGEN 2.95 2.97 3.02 0.02 0.80 0.04 1.36
Caraga 2.59 3.06 3.00 0.47 18.08 (0.05) (1.78)
ARMM 2.40 2.05 2.41 (0.36) (14.83) 0.36 17.61
NOTE: Totals, yields and percentage changes were derived from unrounded figures.
b/ - Planting intentions
Item2013.00 2014.00
Change
April-June
2015/20142015 b/ 2014/2013
1/13/2015 2:29 PM
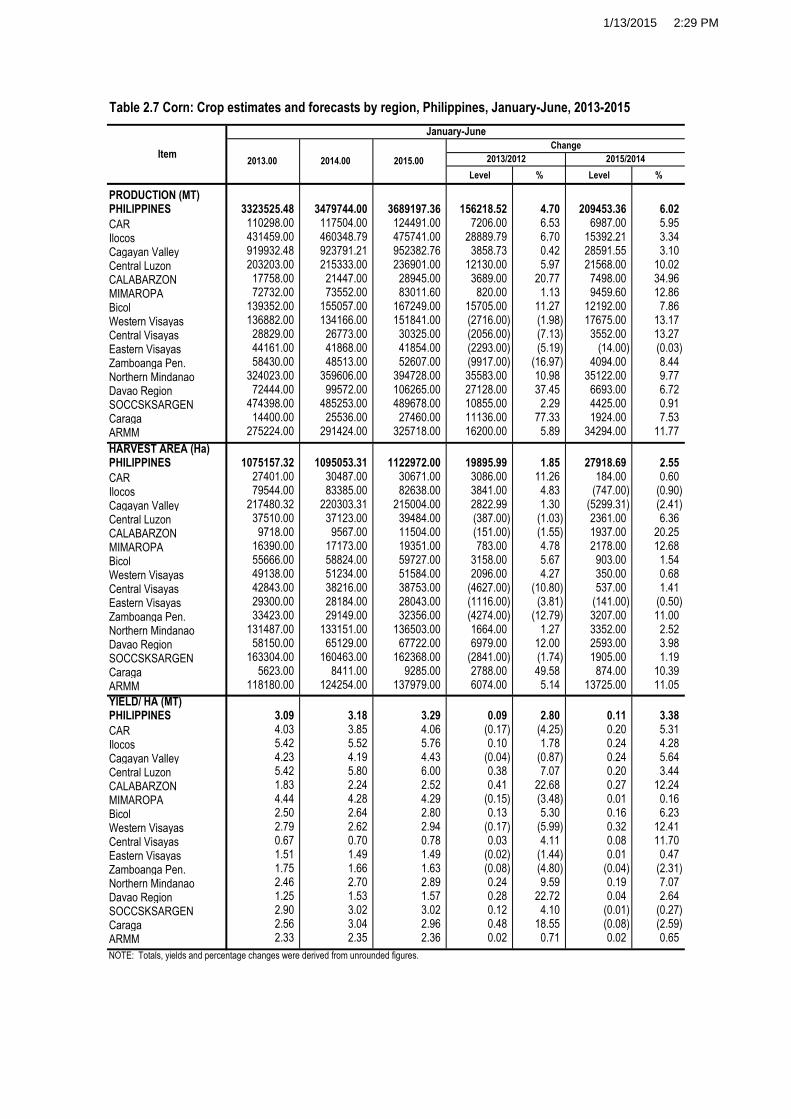
Table 2.7 Corn: Crop estimates and forecasts by region, Philippines, January-June, 2013-2015
Level % Level %
PRODUCTION (MT)PHILIPPINES 3323525.48 3479744.00 3689197.36 156218.52 4.70 209453.36 6.02
CAR 110298.00 117504.00 124491.00 7206.00 6.53 6987.00 5.95
Ilocos 431459.00 460348.79 475741.00 28889.79 6.70 15392.21 3.34
Cagayan Valley 919932.48 923791.21 952382.76 3858.73 0.42 28591.55 3.10
Central Luzon 203203.00 215333.00 236901.00 12130.00 5.97 21568.00 10.02
CALABARZON 17758.00 21447.00 28945.00 3689.00 20.77 7498.00 34.96
MIMAROPA 72732.00 73552.00 83011.60 820.00 1.13 9459.60 12.86
Bicol 139352.00 155057.00 167249.00 15705.00 11.27 12192.00 7.86
Western Visayas 136882.00 134166.00 151841.00 (2716.00) (1.98) 17675.00 13.17
Central Visayas 28829.00 26773.00 30325.00 (2056.00) (7.13) 3552.00 13.27
Eastern Visayas 44161.00 41868.00 41854.00 (2293.00) (5.19) (14.00) (0.03)
Zamboanga Pen. 58430.00 48513.00 52607.00 (9917.00) (16.97) 4094.00 8.44
Northern Mindanao 324023.00 359606.00 394728.00 35583.00 10.98 35122.00 9.77
Davao Region 72444.00 99572.00 106265.00 27128.00 37.45 6693.00 6.72
SOCCSKSARGEN 474398.00 485253.00 489678.00 10855.00 2.29 4425.00 0.91
Caraga 14400.00 25536.00 27460.00 11136.00 77.33 1924.00 7.53
ARMM 275224.00 291424.00 325718.00 16200.00 5.89 34294.00 11.77
HARVEST AREA (Ha)PHILIPPINES 1075157.32 1095053.31 1122972.00 19895.99 1.85 27918.69 2.55
CAR 27401.00 30487.00 30671.00 3086.00 11.26 184.00 0.60
Ilocos 79544.00 83385.00 82638.00 3841.00 4.83 (747.00) (0.90)
Cagayan Valley 217480.32 220303.31 215004.00 2822.99 1.30 (5299.31) (2.41)
Central Luzon 37510.00 37123.00 39484.00 (387.00) (1.03) 2361.00 6.36
CALABARZON 9718.00 9567.00 11504.00 (151.00) (1.55) 1937.00 20.25
MIMAROPA 16390.00 17173.00 19351.00 783.00 4.78 2178.00 12.68
Bicol 55666.00 58824.00 59727.00 3158.00 5.67 903.00 1.54
Western Visayas 49138.00 51234.00 51584.00 2096.00 4.27 350.00 0.68
Central Visayas 42843.00 38216.00 38753.00 (4627.00) (10.80) 537.00 1.41
Eastern Visayas 29300.00 28184.00 28043.00 (1116.00) (3.81) (141.00) (0.50)
Zamboanga Pen. 33423.00 29149.00 32356.00 (4274.00) (12.79) 3207.00 11.00
Northern Mindanao 131487.00 133151.00 136503.00 1664.00 1.27 3352.00 2.52
Davao Region 58150.00 65129.00 67722.00 6979.00 12.00 2593.00 3.98
SOCCSKSARGEN 163304.00 160463.00 162368.00 (2841.00) (1.74) 1905.00 1.19
Caraga 5623.00 8411.00 9285.00 2788.00 49.58 874.00 10.39
ARMM 118180.00 124254.00 137979.00 6074.00 5.14 13725.00 11.05
YIELD/ HA (MT)PHILIPPINES 3.09 3.18 3.29 0.09 2.80 0.11 3.38
CAR 4.03 3.85 4.06 (0.17) (4.25) 0.20 5.31
Ilocos 5.42 5.52 5.76 0.10 1.78 0.24 4.28
Cagayan Valley 4.23 4.19 4.43 (0.04) (0.87) 0.24 5.64
Central Luzon 5.42 5.80 6.00 0.38 7.07 0.20 3.44
CALABARZON 1.83 2.24 2.52 0.41 22.68 0.27 12.24
MIMAROPA 4.44 4.28 4.29 (0.15) (3.48) 0.01 0.16
Bicol 2.50 2.64 2.80 0.13 5.30 0.16 6.23
Western Visayas 2.79 2.62 2.94 (0.17) (5.99) 0.32 12.41
Central Visayas 0.67 0.70 0.78 0.03 4.11 0.08 11.70
Eastern Visayas 1.51 1.49 1.49 (0.02) (1.44) 0.01 0.47
Zamboanga Pen. 1.75 1.66 1.63 (0.08) (4.80) (0.04) (2.31)
Northern Mindanao 2.46 2.70 2.89 0.24 9.59 0.19 7.07
Davao Region 1.25 1.53 1.57 0.28 22.72 0.04 2.64
SOCCSKSARGEN 2.90 3.02 3.02 0.12 4.10 (0.01) (0.27)
Caraga 2.56 3.04 2.96 0.48 18.55 (0.08) (2.59)
ARMM 2.33 2.35 2.36 0.02 0.71 0.02 0.65
NOTE: Totals, yields and percentage changes were derived from unrounded figures.
Item2014.00
Change
2013.00
January-June
2013/20122015.00 2015/2014