2011 py chapter 19 - philippine statistics...
TRANSCRIPT
19 Transportation
Introduction
n efficient transport system together with reliable communications facilities are
essentials to the viability and vitality of the trading system. Movements of people and of products and services from one place to another and vice versa necessitate fast delivery system. These activities can only be made easy and comfortable by capable and competent system of conveyances.
The Department of Transportation and Communications (DOTC) is one agency responsible for the maintenance and expansion of viable, efficient, and dependable transportation and communications systems as effective instruments for economic progress. The Department is likewise responsible for the country's rail, air, sea and communications infrastructure.
As the primary agency of the government tasked to supervise and implement policies, programs, and projects pertaining to transportation and communications, DOTC plays a crucial role in the attainment of the country’s thrust toward national development. Created pursuant to Executive Order No. 546, the DOTC has gone miles in achieving its mandate of providing transportation services nationwide.
This chapter presents the transport system in the country by air, rail and water, its operations and services, along with other related statistics such as passenger and cargo movements, revenues and collections for 2010. Roads, bridges and other network construction are likewise being mentioned. 19.1 Land Transport
The concept of land transportation in the country began when early Filipinos
used animals in moving people and goods from one place to another. At present, mobility has become more sophisticated with the advent of modern vehicles and infrastructure. These land transport infrastructures are classified into two components: the static and the dynamic. Roads and railroad networks are considered the static components, while dynamic components refer to all motor vehicles used for moving passengers and freight over land.
Rail Transportation
. In decongesting Metro Manila, the DOTC set off a rail initiative that will allow
an increased share of rail transit in transporting passengers. This was done through a more reliable service by way of predictable train arrival and scheduled frequency.
The existing rail systems have been color-coded for purpose of uniformity and ease of recall. The following are the new names of the LRT, MRT, and Philippine
A
Transportation
National Railways (PNR) lines: LRT Line 1/Metrorail – Yellow Line, MRT Line 2/Megatren – Purple Line, MRT Line 3/Metrostar – Blue Line, PNR Northrail – Green Line, and PNR Southrail – Orange Line.
The LRT Line 1 or Yellow Line, consists of the 15-kilometer elevated railway system servicing the Taft Avenue–Rizal Avenue route between Baclaran, Pasay City, and the Bonifacio Monument in Caloocan City. It is considered to be the first LRT system in Southeast Asia.
The Megatren, more popularly known by its generic name Purple Line, is a 13.8-kilometer mass transit line that transverses five cities in Metro Manila namely Pasig, Marikina, Quezon City, San Juan and Manila along the major thoroughfares of Marcos Highway, Aurora Boulevard, Ramon Magsaysay Boulevard, Legarda and Recto Avenue.
Among the three lines that operate in Metro Manila, the MRT Line 3 or the Blue Line has the highest ridership with an average 400,000 passengers daily. The train, which runs in a 16.9-kilometer route in EDSA runs at a maximum speed of 65 kilometers per hour, enough to cover the rail system’s 13 stations in about 30 minutes. This includes short stopovers of about 25 to 35 seconds in each station.
LRT Line 1 include the modernization Phase-II and Capacity Expansion while the MRT Line 2 East Extension Project (a 4-km extension of Line 2 from Santolan station in Marikina City to Masinag Junction in Antipolo, Rizal) is in place.
The PNR outstretches the various provinces of Luzon. For its regular operations, the PNR handles the Northrail and Southrail. The Northrail and Southrail lines run through a combined 1,296-kilometer route stretch. The Northrail serves the provincial capitals of San Fernando City in Pampanga, Dagupan City in Pangasinan, Tarlac City in Tarlac, San Jose del Monte City and Malolos City in Bulacan, and Cabanatuan City in Nueva Ecija. On the other hand, the Southrail snakes through the provincial capitals of Sta. Cruz in Laguna, Lucena City in Quezon, Polangui and Legazpi City in Albay.
In 2005, PNR operations were temporarily suspended because of a train derailment in Padre Burgos, Quezon in November 2004. Though starting to make a rebound in 2006, services were again suspended towards the end of September due to the damages caused by Typhoon Milenyo. With only two trains running daily in between Manila and Legaspi in 2006, only 534 trips were made.
The Consultancy Services for the Northrail-Southrail Linkage Project Phase I (Caloocan to Alabang) started in May 2006. The bidding process for the civil works and supply of rolling stock portion of the project was started during the year. The National Economic and Development Authority Investment Coordination Committee also approved the Northrail-Southrail Linkage Project Phase II in December 2006.
Railway statistics. Train operations of the PNR include passenger, commuter, freight, and express services. Passenger service differs from commuter service in terms of distance traveled. Commuter service caters primarily to Metro Manila riders, while passenger service shuttles travelers bound for the provinces.
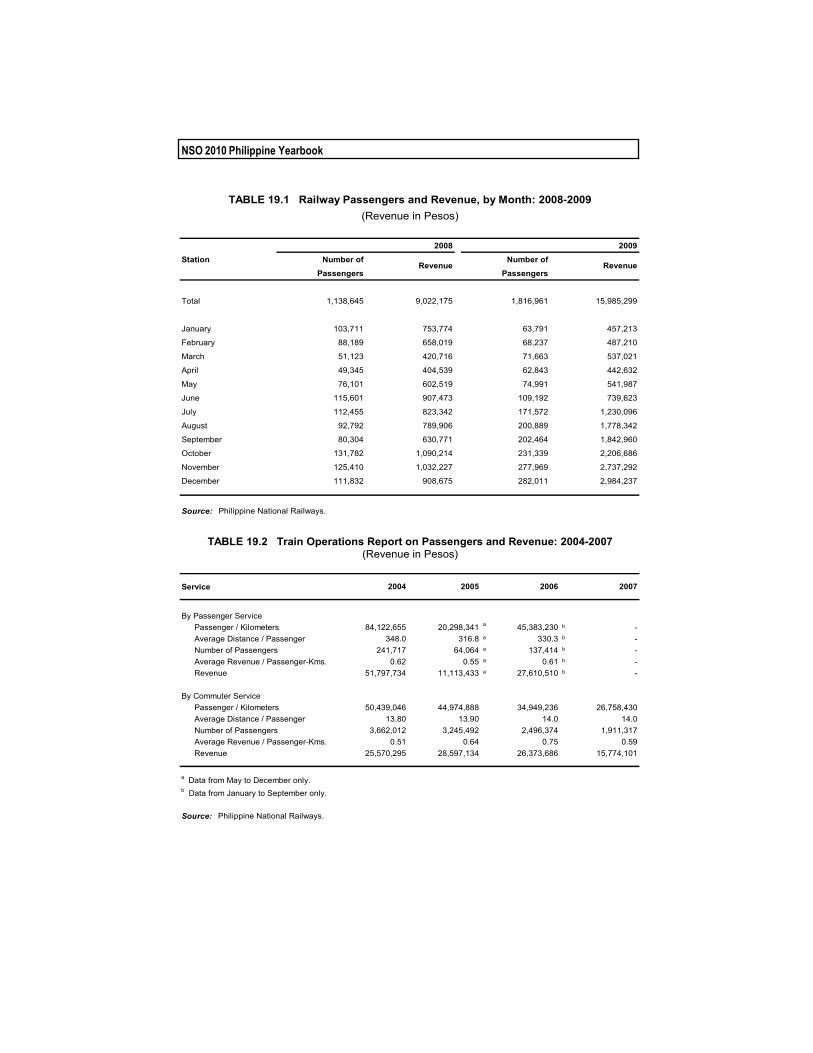
PNR's services stretched along 22 stations and served 1.82 million passengers in 2009. This was an increase of 59.6 percent from 1.14 million passengers in 2008. A total of PhP15.99 million in revenues was raised in 2009 or an increase of PhP6.96 million or 77.2 percent. (See Table 19.1.)
NSO 2010 Philippine Yearbook
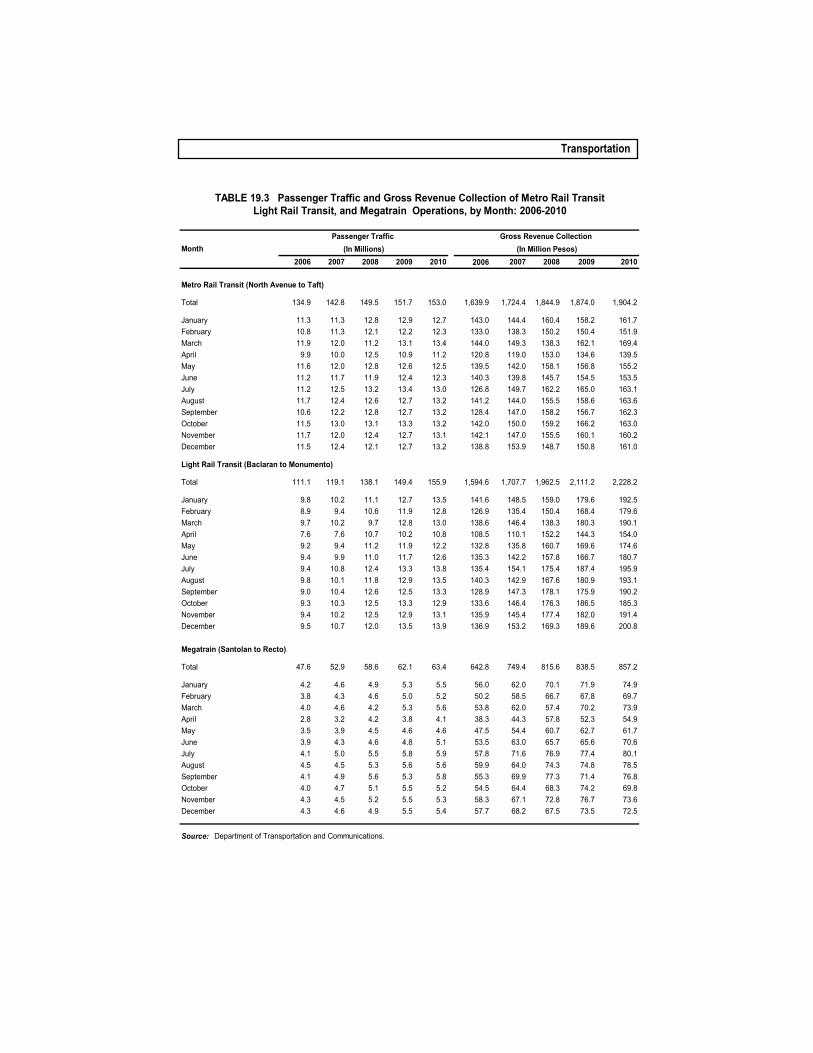
In 2010, ridership in LRT 1 (Yellow Line) and MRT 3 (Blue Line) trains registered 155.9 million and 153.0 million passengers, resulting to revenues of PhP2.23 billion and PhP1.90 billion, respectively. Meanwhile, ridership in LRT Line 2 (purple line) was 63.4 million passengers, turning out a revenue collection of PhP857.2 million. Final tallies for 2010 revealed increases in both passengers and revenues for all the three metropolis trains. (See Table 19.3.)
Road Transportation
The Land Transportation Office. The Land Transportation Office (LTO) plans, formulates, and implements policies, rules, and regulations governing the land transport system in the country. It steers resources to promote and maintain safe, efficient, convenient, and economical land transportation services throughout the country by providing a rationalized system of motor vehicle registration, license issuance, law enforcement, and adjudication of traffic violation cases.
The LTO functions under the DOTC. Aside from a central office in the National Capital Region, the LTO network of regional offices branches out to regular offices, extension offices, licensing centers, motor vehicle inspection stations, and mobile units nationwide.
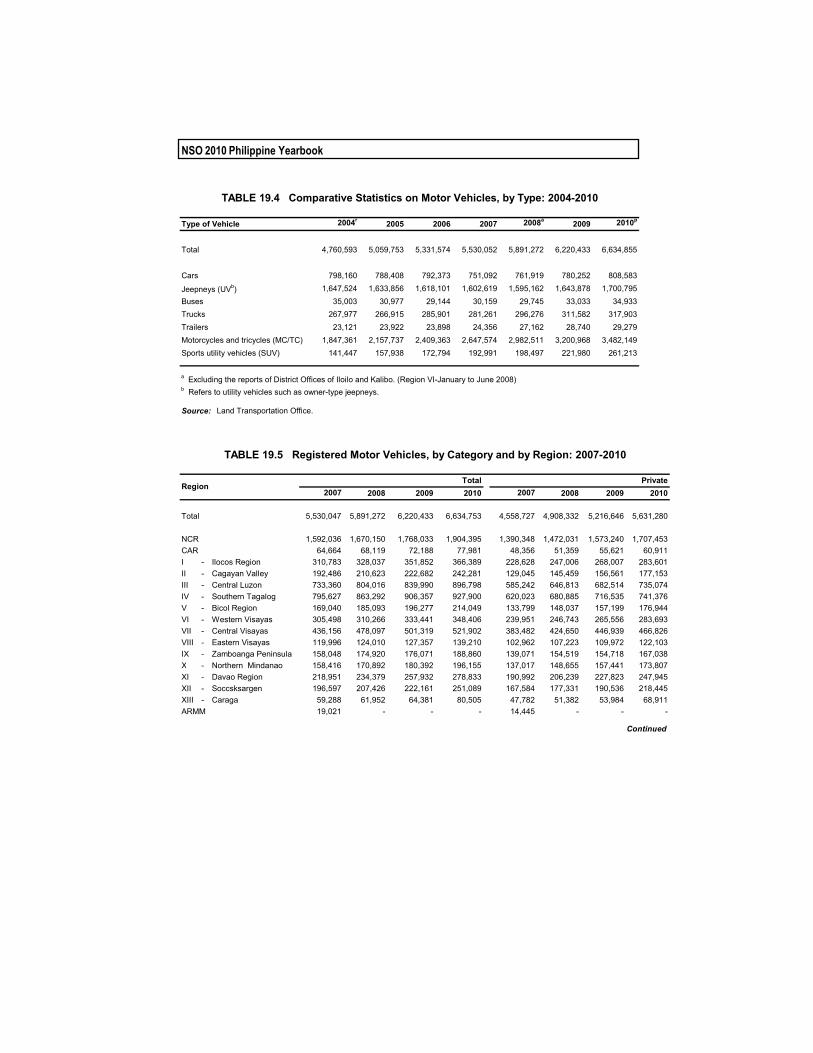
1. Motor Vehicle Registration. In 2010, there were 6.63 million vehicles registered.
This figure was 6.7 percent higher than 2009’s 6.22 million registered vehicles. Of the total number, 3.48 million or 52.5 percent were motorcycles and tricycles. Also registered were 1.70 million jeepneys (25.6%); 808,583 cars (12.2%); 317,903 trucks (4.8%); 34,933 buses (0.5%); 29,279 trailers (0.4%); and 261,213 sports utility vehicles (3.9%). Refer to Table 19.4.)
Compared with 2009 figures of 3.2 million, there was an increase by 8.9 percent in registered motor vehicles and tricycles in 2010, 5.8 percent increase in buses, 3.5 percent in jeepneys, 3.6 percent in cars, 2.0 percent in trucks, and 1.9 percent in trailers. The biggest increase of 17.8 percent, however, was noted in sports utility vehicles with 39,233 units added to the number registered the previous year.
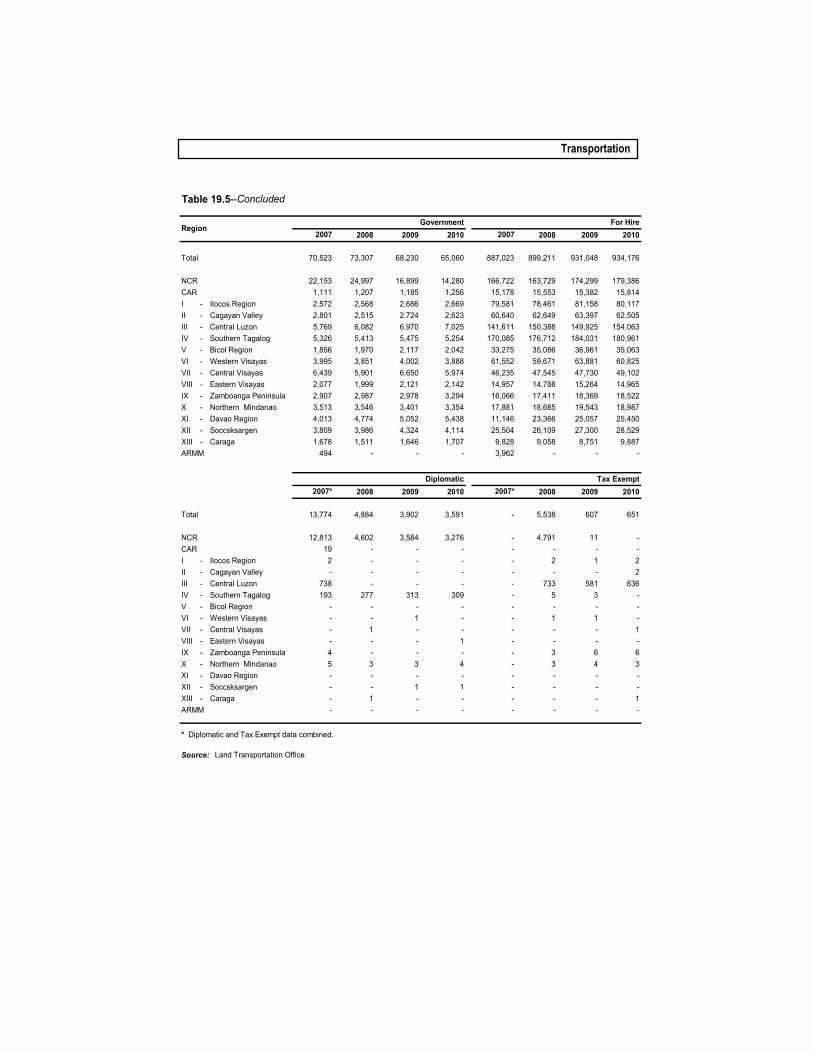
Of the total motor vehicles registered in 2010, private vehicles were about 84.9 percent of the total. Government vehicles made up some 1.0 percent, while for hire transportation made up the biggest portion of 14.1 percent. Diplomatic and tax exempt vehicles were less than one percent each. (See Table 19.5.)
By region, NCR had the biggest number of registered vehicles (1.90 million), followed by Southern Tagalog and Central Luzon, respectively, with 927,900 and 896,798. CAR registered the least number with only about 1.2 percent of the total.
2. Licensing System. Driver’s and conductor’s licenses issued in the country are
valid for three years. When renewing, drivers who have not erred in the past three years are automatically issued licenses with five-year validity. LTO issued 3.25 million licenses and permits from January to September 2010 as compared to 2.95 million during the same period the previous year, or showing an increase by 10.2 percent. NCR had the most number of licenses and permits issued (954,007), followed by Region III (414,414), Region IV-A (389,058) and Region VII (235,115).
Transportation
The Land Transportation Franchising and Regulatory Board. This office is mandated to rationalize, regulate, and supervise motorized land-based public transportation services by virtue of Executive Order (EO) 202 released in June 1987. Its primary functions are to issue, revise, and suspend public transport franchise; identify transport routes; prescribe and approve transport fares; investigate complaints for violations of public land transportation service rules and regulations; and collect and adjust fees and related charges for services rendered in accordance with prescribed law. The country’s transport system depends heavily on the road network, which controls the movement of passengers and freight. The Office of Transport Cooperatives. EO 898 reorganized the Committee on Transportation Cooperatives into the Office of Transport Cooperatives (OTC). This government agency attached to the DOTC functions to supervise, regulate, and set the direction for the activities of transport cooperatives. Road network. The Department of Public Works and Highways (DPWH) is mandated to provide the needed infrastructure, primarily roads and bridges that would interconnect the Philippine archipelago. Through its efforts, new economic opportunities are opened; transportation and transaction costs of business are reduced; and access to social services is made easier.
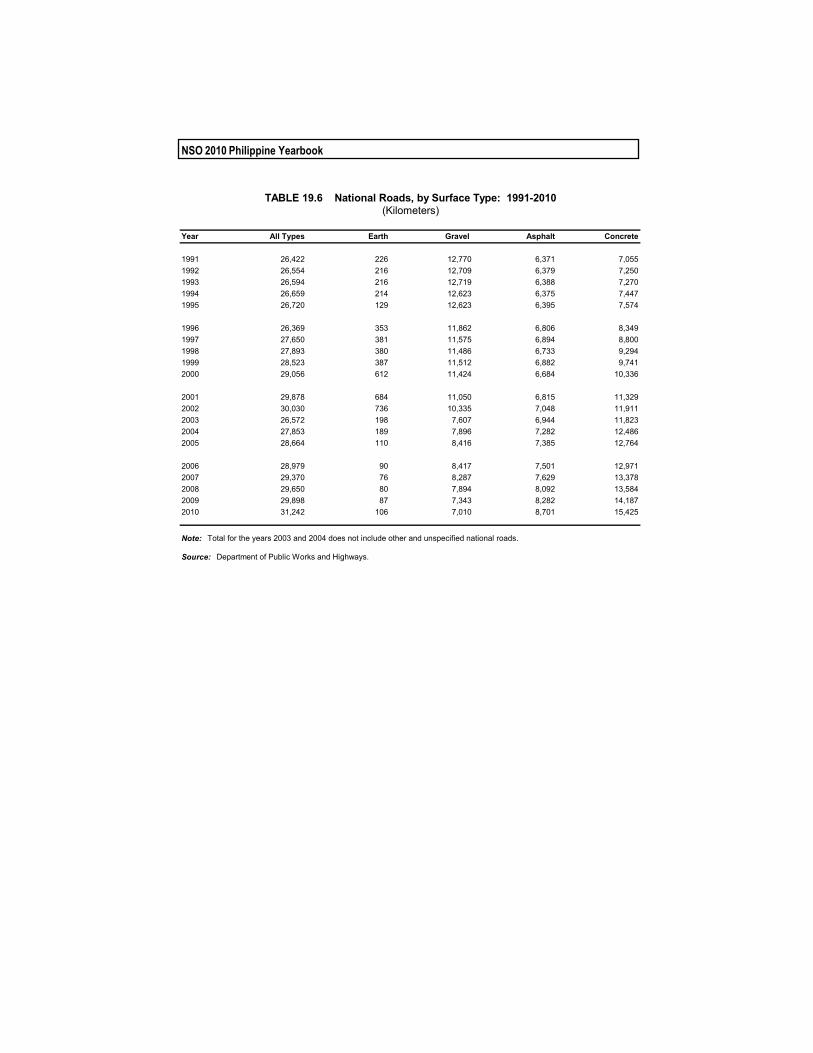
The country’s transport system depends heavily on the road network, which controls the movement of passengers and freight. Philippine roads, as of 2010, spanned a total length of 31,242 kilometers. Charging mainly to the expansion of barangay roads, this total road length was 1,344 kilometers or 4.5 percent more than the total length in 2009. By surface, 49.4 percent of Philippine national roads were made of concrete. The remaining percentages were either roads made up of gravel (22.4%), asphalt (27.9%), and earth (0.3%). (See Table 19.6 for details.)
Year 2010 was the transition from Arroyo administration to the Aquino administration which began in July 1, 2010. The DPWH continued its mandate to design, construct and maintain national roads and bridges, flood control systems in major and principal rivers. Under the Regular Infrastructure Program and Carry-over Project Plans the following were accomplished during the year:
1. Constructed, repaired and rehabilitated 8,457.511 km. roads and 14,946 lm. of
national bridges at a cost of PhP111.309 billion; 2. 1,798 flood control drainage projects costing PhP14,090 billion; and 3. 9,971 other infrastructure projects costing PhP8.840 billion ranging from school
buildings, water systems, national buildings and other infrastructure.
Projects accomplished and funded under non-infrastructure;
1. Improvement/construction of 16 kilometers of farm-to-market roads costing PhP10.60 million under the Department of Agrarian Reform;
2. Improved and/or constructed 716 kilometers of farm-to-market roads with a total cost of PhP1.153 billion under the Department of Agriculture;
3. Completed 1,033 classrooms, providing more conducive facilities for learning and helps alleviate shortage due to bigger school population, at a cost of
NSO 2010 Philippine Yearbook
PhP651 million under the Department of Education and school building program; and
4. Improved/rehabilitated 546 kilometers of roads, 95 lineal meters of bridges, and 153 other related work projects with a total value of PhP2.939 billion; undertaken 286 flood control project with a value of PhP2.538 billion; and three buildings with a value of PhP2.80 million, under the Department of Energy budget.
19.2 Water Transport
An archipelago such as the Philippines clearly depends on water
transportation as one of the chief means to move people, goods, and services. Main entries to the country through the sea are the Manila International Cargo Terminal and the Eva Macapagal Port Terminal, both in the pier area of Manila. Other cities with bustling ports and piers include Bacolod, Batangas City, Cagayan de Oro, Cebu, Davao, Butuan, Iligan, Iloilo, Jolo, Legazpi, Lucena, Puerto Princesa, San Fernando, Subic, Zamboanga, Cotabato, Ormoc, Ozamiz and Tagbilaran.
Most of these terminals comprise the Strong Republic Nautical Highway, a nautical system conceptualized under the term of President Gloria Macapagal Arroyo where land vehicles can use the 24-hour RoRo ship service to travel to the different islands at lower costs.
Marine Port Network
Providing the backbone of sea transport facilities is a network of ports. The
Philippine Port Authority (PPA) Network in the country has five major port district offices (PDOs) ruling over port management offices (PMOs) scattered nationwide. The PDOs and PMOs are as follows: PDO Metro Manila, which oversees PMOs in the North and South Harbors and in Manila International Container Terminal; PDO Luzon, controlling PMOs in Batangas, Legazpi, Puerto Princesa, and San Fernando in La Union; PDO Visayas, consisting of PMOs in Dumaguete, Iloilo, Pulupandan, Tacloban, and Tagbilaran; PDO Northern Mindanao, taking charge of PMOs in Cagayan de Oro, Iligan, Nasipit, Ozamis, and Surigao; and PDO Southern Mindanao, administering over PMOs in Davao, General Santos, Jolo, Zamboanga, and Polloc in Cotabato.
Each unit, headed by a port manager, is located in a national port, and serves as a base for the day-to-day management and administration of all ports within the port district. It is a semi autonomous center that undertakes operation, engineering and maintenance, and finance and commercial development functions. It is also controlled by and accountable to the head office of the PPA on matters of policy execution and performance.
Ports, as well as private wharves and piers, are spread all over the archipelago, especially in areas abounding with factories or commercial establishments. National ports are owned by the government, while municipal ports are operated by the municipality, with contractors and maintenance services appropriated by the national government.
Transportation
The common facilities found in the Philippine ports are berthing, storage, and other port structures. Berthing facilities include piers, wharves, or both; storage facilities include transit sheds, warehouses, open storages, causeways, and port areas. Other port structures include breakwaters, bulk heads, jetties, and sea walls.
The PPA carries out planning, financing, management, and operations of public ports throughout the country. Its objective as stated in its charter, Presidential Decree 857, as amended, is to implement an integrated port system that would result to the acceleration of maritime trade and commerce.
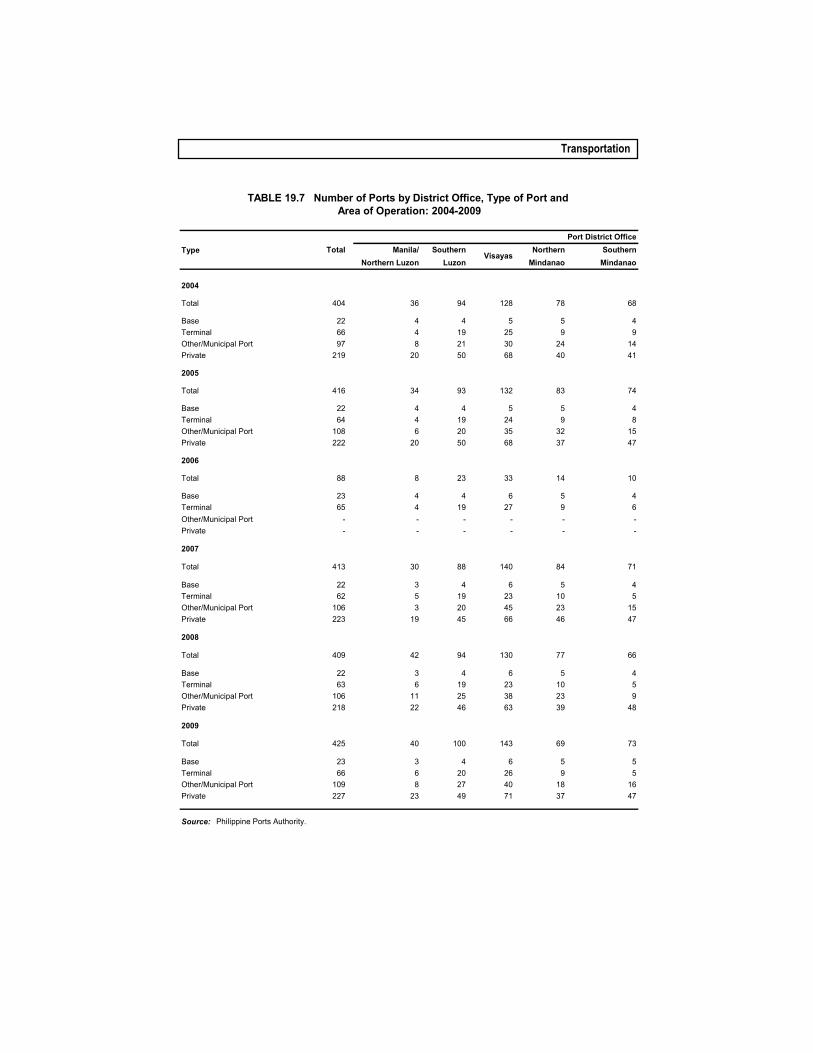
In 2009, the PPA listed a total of 425 ports that includes private ports, base, terminal and other/municipal ports in the country. The number was higher by 3.9 percent than 409 ports registered in 2008. Visayas had the bulk of the ports with 143 (33.6%). Manila/Northern Luzon had 40 ports (9.4%), and Mindanao (Northern and Southern) had 142 ports (33.4%) in the country. (See Table 19.7.)
Shipping
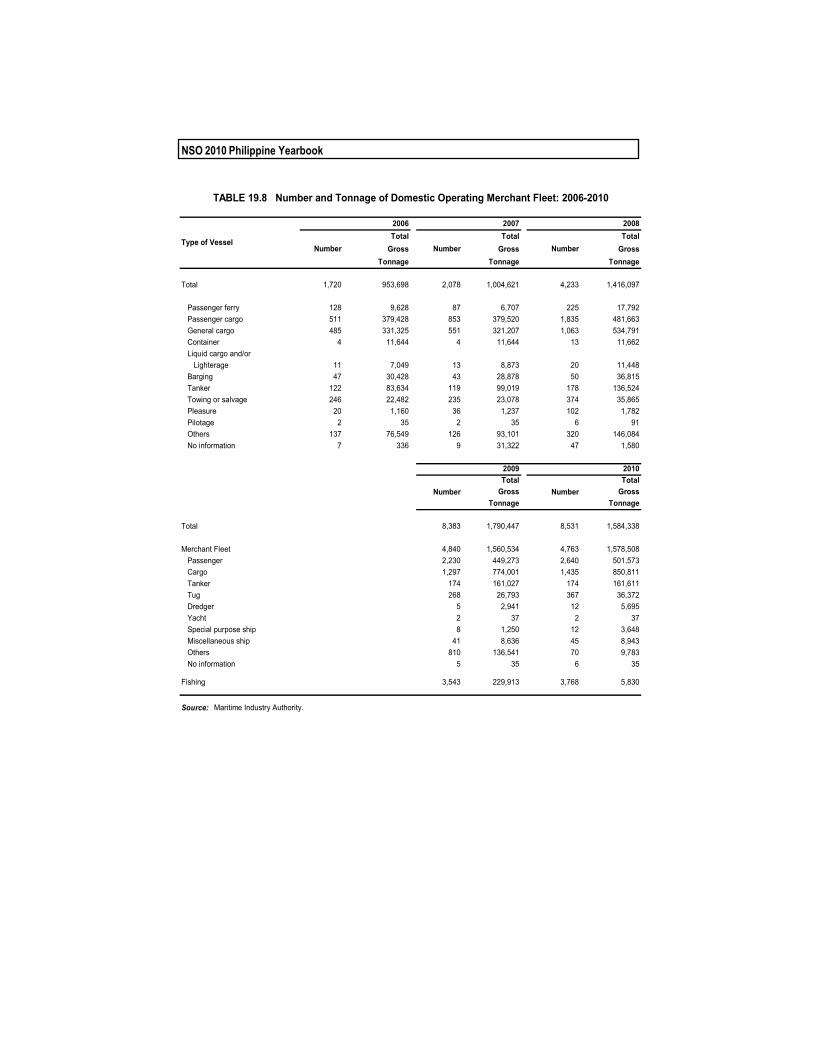
In 2010, the Philippine domestic merchant fleet increased to 8,531 vessels
which had a gross tonnage of 1,584,338. This was an increase of 1.8 percent (148 vessels) from 2009’s 8,383 vessels. Gross tonnage (1,584,338), on the other hand, decreased by 11.5 percent from 2009’s gross tonnage of 1,790,447. Passenger vessels comprise the bulk of the total operating fleet with 30.9 percent or 2,640 vessels, followed by general cargo ships with 4.8 percent of the aggregate or 1,435 vessels. Tug vessels account for 4.3 percent or 367 vessels. The remaining percentage was distributed among other types of vessel. (See Table 19.8.)
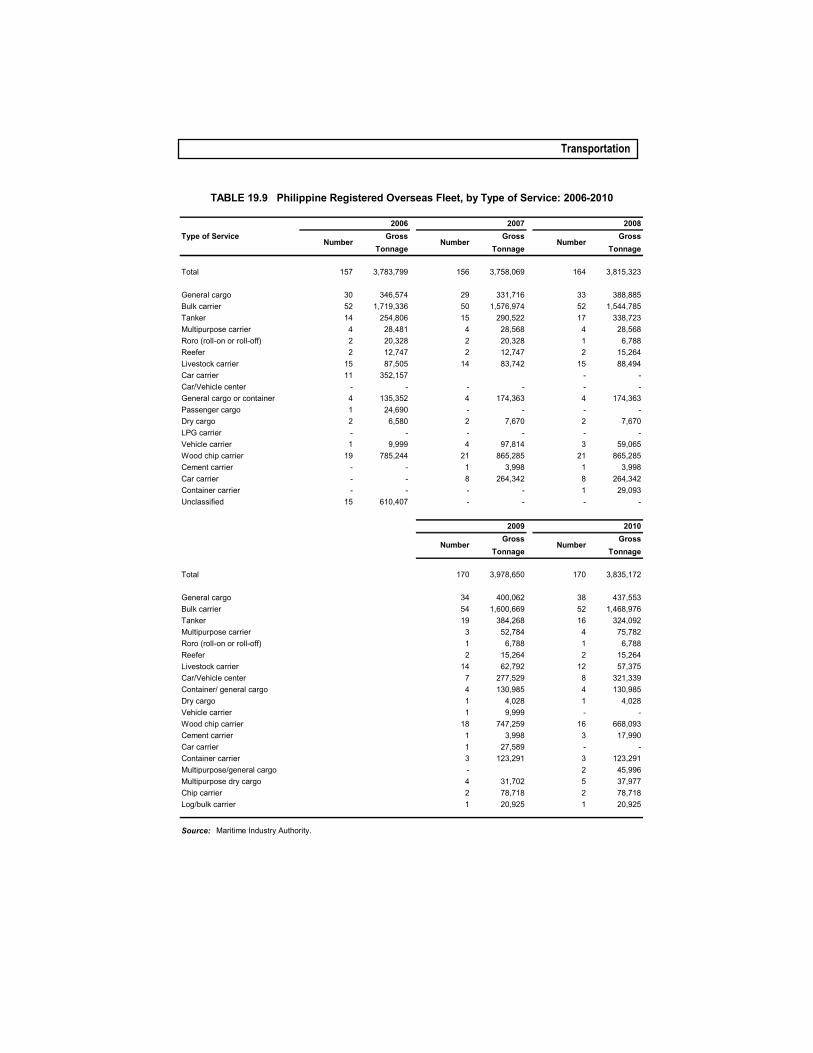
Registered overseas fleet in the country remained at 170 in 2010. Gross tonnage totaled to 3.84 million tons, marking a 3.3 percent decrease from 2009’s gross tonnage of 3.98 million tons. Comprising the majority of the vessels were 52 bulk carriers and 38 general cargo vessels. (See Table 19.9.)
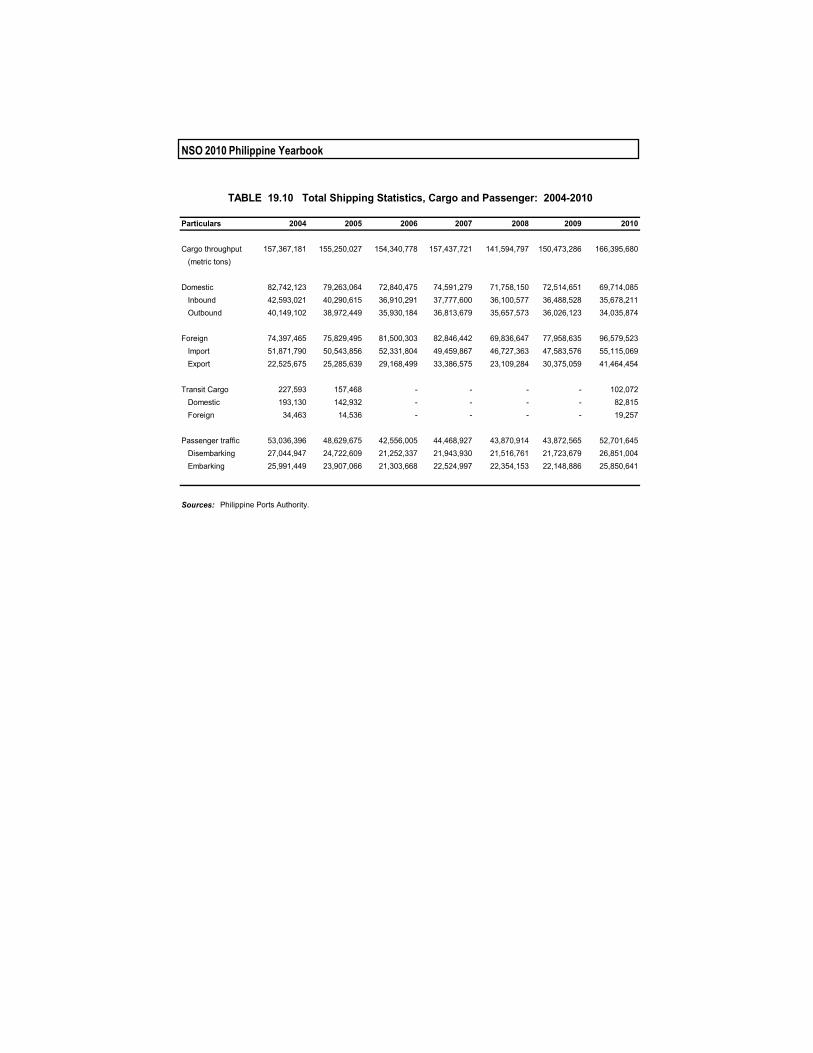
Cargo throughput in 2010 summed up to 166.40 million metric tons (MT), a 10.6 percent increase from 2009’s 150.47 million MT. Total foreign cargo throughput was posted at 96.58 million MT while domestic cargo throughput was at 69.71 million MT. Passenger traffic registered 52.70 million MT in 2010, posted a 20.1 percent increase of 8,830,732 metric tons. (See Table 19.10 for details.)
The Maritime Industry Authority. Securing safe and efficient water transportation in the country is the Maritime Industry Authority, otherwise known as MARINA. MARINA's functions involve enhancing industry competitiveness in domestic and overseas shipping, promoting maritime safety, and encouraging pro-poor initiatives for increased water mobility. The MARINA has been serving these functions under Presidential Decree (PD) 474. 19.3 Air Transport
Air transportation does more than make travel easy. In a way, it takes up in
flight-speed the course of domestic trade and tourism as well. Over recent decades, the demand loomed large for competitive air travel rates and services. New industry
NSO 2010 Philippine Yearbook
players, composed of new local and foreign investors, eagerly put up local airline companies that rival the Philippines' and Asia's first carrier, Philippine Airlines (PAL).
The aviation industry had no other recourse but to open up new routes and encourage the entry of new domestic airlines. Grand International Airways was first to enter in 1995. Three other companies, namely, Air Philippines Corporation, Asian Spirit, and Cebu Pacific entered in 1996, bringing to five the number of airlines flying domestic routes. For scheduled and nonscheduled aircraft movement, passenger traffic and cargo movement and airport operations please refer to Tables 19.12 to 19.14.
Civil Aviation Administration and Policy
The Civil Aeronautics Board (CAB) handles the economics of Philippine
aviation. In fulfilling this mission, part of the Board's strategy is to provide technical representation for the country in air bilateral talks and similar consultations. Its responsibility extends up to the regulation of airline routes and frequencies, and licensing of aircraft operations. The CAB is a special body whose members include well-respected aviation technocrats.
Its partner, the Civil Aviation Authority of the Philippines (CAAP), formerly the Air Transportation Office, oversees and monitors the development of the air transportation system.
Air Transportation Statistics
Air transport operations translated into 47.99 million passenger traffic in
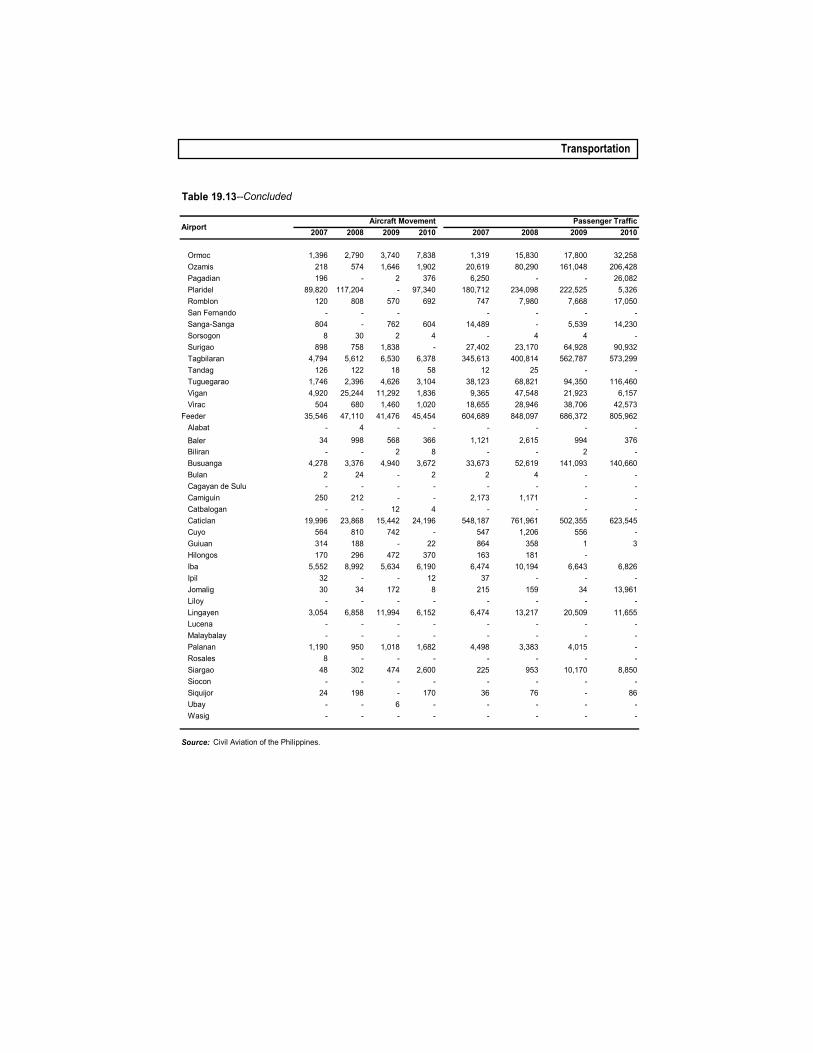
2010, with the Ninoy Aquino International Airport (NAIA) seeing the busiest passenger traffic at 27.32 million. The NAIA had also seen the busiest domestic aircraft traffic movement 235,995 or 35.6 percent of total international aircraft movement. Among trunk line airports, Iloilo sped off with the highest flight frequency by registering 32,068 flights. (See Table 19.13.)
According to the CAAP, air flights in 2010 were highest in May with 60,310 flights and March with 60,399 flights in 2009. Air passengers carried were some total of 47.99 million passengers for 2010 and 40.93 million in 2009. Cargo/freight movement, on the other hand, peaked in September for 2010 and November for 2009. (See Table 19.14.)
Philippine Airports
The five major classifications of Philippine airports are as follows:
Regular international airports are used for the operation of aircraft engaged in international air navigation. Their basic runway dimensions are 3,354 meters by 60 meters.
Alternate international airports are intended for international air navigation in lieu of a regular international airport.

Transportation
Trunk line airports serve as principal commercial centers and are used by medium jets.
Secondary airports provide service to principal towns and cities with regular traffic densities that warrant the operation of jet-propelled aircraft.
Feeder airports serve towns and rural communities, with limited passenger traffic, and are intended for use by piston aircraft.
The number of operational airports in the country remained at 203 in 2009.
Of this figure, 118 (58.1%) are private and 85 (41.9%) are national airports. (See Table 9.12.)
Of the national airports, four were regular international airports, namely, the NAIA in Manila, Mactan International Airport in Cebu, Diosdado Macapagal International Airport in Pampanga, and Subic International Airport in Zambales. Another four were alternate international airports--the Davao International Airport, General Santos International Airport, Laoag International Airport, and Zamboanga International Airport. The remaining national airports were trunk lines, feeders or secondary airports. Sources: 19.1 Philippine National Railways. Light Rail Transit Authority. Land Transportation Office. Land Transportation Franchising and Regulatory Board. Metro Manila Transit Corporation. Department of Transportation and Communications. Office of Transport Cooperatives. Department of Public Works and Highways. 19.2 Philippine Ports Authority. Maritime Industry Authority. Department of Transportation and Communications. 19.3 Civil Aeronautics Board.
Civil Aviation Authority of the Philippines formerly the Air Transportation Office.
Manila International Airport Authority. Department of Transportation and Communications.
NSO 2010 Philippine Yearbook
2008 2009
Station Number of Number of
Passengers Passengers
Total 1,138,645 9,022,175 1,816,961 15,985,299
January 103,711 753,774 63,791 457,213
February 88,189 658,019 68,237 487,210
March 51,123 420,716 71,663 537,021
April 49,345 404,539 62,843 442,632
May 76,101 602,519 74,991 541,987
June 115,601 907,473 109,192 739,623
July 112,455 823,342 171,572 1,230,096
August 92,792 789,906 200,889 1,778,342
September 80,304 630,771 202,464 1,842,960
October 131,782 1,090,214 231,339 2,206,686
November 125,410 1,032,227 277,969 2,737,292
December 111,832 908,675 282,011 2,984,237
Source: Philippine National Railways.
TABLE 19.1 Railway Passengers and Revenue, by Month: 2008-2009(Revenue in Pesos)
Revenue Revenue
Service 2004 2005 2006 2007
By Passenger ServicePassenger / Kilometers 84,122,655 20,298,341 a 45,383,230 b -Average Distance / Passenger 348.0 316.8 a 330.3 b -Number of Passengers 241,717 64,064 a 137,414 b -Average Revenue / Passenger-Kms. 0.62 0.55 a 0.61 b -Revenue 51,797,734 11,113,433 a 27,610,510 b -
By Commuter ServicePassenger / Kilometers 50,439,046 44,974,888 34,949,236 26,758,430Average Distance / Passenger 13.80 13.90 14.0 14.0Number of Passengers 3,662,012 3,245,492 2,496,374 1,911,317Average Revenue / Passenger-Kms. 0.51 0.64 0.75 0.59Revenue 25,570,295 28,597,134 26,373,686 15,774,101
a Data from May to December only. b Data from January to September only.
Source: Philippine National Railways.
TABLE 19.2 Train Operations Report on Passengers and Revenue: 2004-2007(Revenue in Pesos)
Transportation
2006 2007 2008 2009 2010 2006 2007 2008 2009 2010
Metro Rail Transit (North Avenue to Taft)
Total 134.9 142.8 149.5 151.7 153.0 1,639.9 1,724.4 1,844.9 1,874.0 1,904.2
January 11.3 11.3 12.8 12.9 12.7 143.0 144.4 160.4 158.2 161.7February 10.8 11.3 12.1 12.2 12.3 133.0 138.3 150.2 150.4 151.9March 11.9 12.0 11.2 13.1 13.4 144.0 149.3 138.3 162.1 169.4April 9.9 10.0 12.5 10.9 11.2 120.8 119.0 153.0 134.6 139.5May 11.6 12.0 12.8 12.6 12.5 139.5 142.0 158.1 156.8 155.2June 11.2 11.7 11.9 12.4 12.3 140.3 139.8 145.7 154.5 153.5July 11.2 12.5 13.2 13.4 13.0 126.8 149.7 162.2 165.0 163.1August 11.7 12.4 12.6 12.7 13.2 141.2 144.0 155.5 158.6 163.6September 10.6 12.2 12.8 12.7 13.2 128.4 147.0 158.2 156.7 162.3October 11.5 13.0 13.1 13.3 13.2 142.0 150.0 159.2 166.2 163.0November 11.7 12.0 12.4 12.7 13.1 142.1 147.0 155.5 160.1 160.2December 11.5 12.4 12.1 12.7 13.2 138.8 153.9 148.7 150.8 161.0
Light Rail Transit (Baclaran to Monumento)
Total 111.1 119.1 138.1 149.4 155.9 1,594.6 1,707.7 1,962.5 2,111.2 2,228.2
January 9.8 10.2 11.1 12.7 13.5 141.6 148.5 159.0 179.6 192.5February 8.9 9.4 10.6 11.9 12.8 126.9 135.4 150.4 168.4 179.6March 9.7 10.2 9.7 12.8 13.0 138.6 146.4 138.3 180.3 190.1April 7.6 7.6 10.7 10.2 10.8 108.5 110.1 152.2 144.3 154.0May 9.2 9.4 11.2 11.9 12.2 132.8 135.8 160.7 169.6 174.6June 9.4 9.9 11.0 11.7 12.6 135.3 142.2 157.8 166.7 180.7July 9.4 10.8 12.4 13.3 13.8 135.4 154.1 175.4 187.4 195.9August 9.8 10.1 11.8 12.9 13.5 140.3 142.9 167.6 180.9 193.1September 9.0 10.4 12.6 12.5 13.3 128.9 147.3 178.1 175.9 190.2October 9.3 10.3 12.5 13.3 12.9 133.6 146.4 176.3 186.5 185.3November 9.4 10.2 12.5 12.9 13.1 135.9 145.4 177.4 182.0 191.4December 9.5 10.7 12.0 13.5 13.9 136.9 153.2 169.3 189.6 200.8
Megatrain (Santolan to Recto)
Total 47.6 52.9 58.6 62.1 63.4 642.8 749.4 815.6 838.5 857.2
January 4.2 4.6 4.9 5.3 5.5 56.0 62.0 70.1 71.9 74.9February 3.8 4.3 4.6 5.0 5.2 50.2 58.5 66.7 67.8 69.7March 4.0 4.6 4.2 5.3 5.6 53.8 62.0 57.4 70.2 73.9April 2.8 3.2 4.2 3.8 4.1 38.3 44.3 57.8 52.3 54.9May 3.5 3.9 4.5 4.6 4.6 47.5 54.4 60.7 62.7 61.7June 3.9 4.3 4.6 4.8 5.1 53.5 63.0 65.7 65.6 70.6July 4.1 5.0 5.5 5.8 5.9 57.8 71.6 76.9 77.4 80.1August 4.5 4.5 5.3 5.6 5.6 59.9 64.0 74.3 74.8 78.5September 4.1 4.9 5.6 5.3 5.8 55.3 69.9 77.3 71.4 76.8October 4.0 4.7 5.1 5.5 5.2 54.5 64.4 68.3 74.2 69.8November 4.3 4.5 5.2 5.5 5.3 58.3 67.1 72.8 76.7 73.6December 4.3 4.6 4.9 5.5 5.4 57.7 68.2 67.5 73.5 72.5
Source: Department of Transportation and Communications.
TABLE 19.3 Passenger Traffic and Gross Revenue Collection of Metro Rail TransitLight Rail Transit, and Megatrain Operations, by Month: 2006-2010
MonthPassenger Traffic Gross Revenue Collection
(In Millions) (In Million Pesos)
NSO 2010 Philippine Yearbook
Type of Vehicle 2004r 2005 2006 2007 2008a 2009 2010p
Total 4,760,593 5,059,753 5,331,574 5,530,052 5,891,272 6,220,433 6,634,855
Cars 798,160 788,408 792,373 751,092 761,919 780,252 808,583
Jeepneys (UVb) 1,647,524 1,633,856 1,618,101 1,602,619 1,595,162 1,643,878 1,700,795Buses 35,003 30,977 29,144 30,159 29,745 33,033 34,933Trucks 267,977 266,915 285,901 281,261 296,276 311,582 317,903Trailers 23,121 23,922 23,898 24,356 27,162 28,740 29,279Motorcycles and tricycles (MC/TC) 1,847,361 2,157,737 2,409,363 2,647,574 2,982,511 3,200,968 3,482,149Sports utility vehicles (SUV) 141,447 157,938 172,794 192,991 198,497 221,980 261,213
a Excluding the reports of District Offices of Iloilo and Kalibo. (Region VI-January to June 2008)
Source: Land Transportation Office.
TABLE 19.4 Comparative Statistics on Motor Vehicles, by Type: 2004-2010
b Refers to utility vehicles such as owner-type jeepneys.
2007 2008 2009 2010 2007 2008 2009 2010
Total 5,530,047 5,891,272 6,220,433 6,634,753 4,558,727 4,908,332 5,216,646 5,631,280
NCR 1,592,036 1,670,150 1,768,033 1,904,395 1,390,348 1,472,031 1,573,240 1,707,453CAR 64,664 68,119 72,188 77,981 48,356 51,359 55,621 60,911I - Ilocos Region 310,783 328,037 351,852 366,389 228,628 247,006 268,007 283,601II - Cagayan Valley 192,486 210,623 222,682 242,281 129,045 145,459 156,561 177,153III - Central Luzon 733,360 804,016 839,990 896,798 585,242 646,813 682,514 735,074IV - Southern Tagalog 795,627 863,292 906,357 927,900 620,023 680,885 716,535 741,376V - Bicol Region 169,040 185,093 196,277 214,049 133,799 148,037 157,199 176,944VI - Western Visayas 305,498 310,266 333,441 348,406 239,951 246,743 265,556 283,693VII - Central Visayas 436,156 478,097 501,319 521,902 383,482 424,650 446,939 466,826VIII - Eastern Visayas 119,996 124,010 127,357 139,210 102,962 107,223 109,972 122,103IX - Zamboanga Peninsula 158,048 174,920 176,071 188,860 139,071 154,519 154,718 167,038X - Northern Mindanao 158,416 170,892 180,392 196,155 137,017 148,655 157,441 173,807XI - Davao Region 218,951 234,379 257,932 278,833 190,992 206,239 227,823 247,945XII - Soccsksargen 196,597 207,426 222,161 251,089 167,584 177,331 190,536 218,445XIII - Caraga 59,288 61,952 64,381 80,505 47,782 51,382 53,984 68,911ARMM 19,021 - - - 14,445 - - -
Continued
TABLE 19.5 Registered Motor Vehicles, by Category and by Region: 2007-2010
RegionTotal Private
Transportation
Table 19.5--Concluded
2007 2008 2009 2010 2007 2008 2009 2010
Total 70,523 73,307 68,230 65,060 887,023 899,211 931,048 934,176
NCR 22,153 24,997 16,899 14,280 166,722 163,729 174,299 179,386CAR 1,111 1,207 1,185 1,256 15,178 15,553 15,382 15,814I - Ilocos Region 2,572 2,568 2,686 2,669 79,581 78,461 81,158 80,117II - Cagayan Valley 2,801 2,515 2,724 2,623 60,640 62,649 63,397 62,505III - Central Luzon 5,769 6,082 6,970 7,025 141,611 150,388 149,925 154,063IV - Southern Tagalog 5,326 5,413 5,475 5,254 170,085 176,712 184,031 180,961V - Bicol Region 1,856 1,970 2,117 2,042 33,275 35,086 36,961 35,063VI - Western Visayas 3,995 3,851 4,002 3,888 61,552 59,671 63,881 60,825VII - Central Visayas 6,439 5,901 6,650 5,974 46,235 47,545 47,730 49,102VIII - Eastern Visayas 2,077 1,999 2,121 2,142 14,957 14,788 15,264 14,965IX - Zamboanga Peninsula 2,907 2,987 2,978 3,294 16,066 17,411 18,369 18,522X - Northern Mindanao 3,513 3,546 3,401 3,354 17,881 18,685 19,543 18,987XI - Davao Region 4,013 4,774 5,052 5,438 11,146 23,366 25,057 25,450XII - Soccsksargen 3,809 3,986 4,324 4,114 25,504 26,109 27,300 28,529XIII - Caraga 1,678 1,511 1,646 1,707 9,828 9,058 8,751 9,887ARMM 494 - - - 3,962 - - -
2007* 2008 2009 2010 2007* 2008 2009 2010
Total 13,774 4,884 3,902 3,591 - 5,538 607 651
NCR 12,813 4,602 3,584 3,276 - 4,791 11 -CAR 19 - - - - - - -I - Ilocos Region 2 - - - - 2 1 2II - Cagayan Valley - - - - - - - 2III - Central Luzon 738 - - - - 733 581 636IV - Southern Tagalog 193 277 313 309 - 5 3 -V - Bicol Region - - - - - - - -VI - Western Visayas - - 1 - - 1 1 -VII - Central Visayas - 1 - - - - - 1VIII - Eastern Visayas - - - 1 - - - -IX - Zamboanga Peninsula 4 - - - - 3 6 6X - Northern Mindanao 5 3 3 4 - 3 4 3XI - Davao Region - - - - - - - -XII - Soccsksargen - - 1 1 - - - -XIII - Caraga - 1 - - - - - 1ARMM - - - - - - - -
* Diplomatic and Tax Exempt data combined.
Source: Land Transportation Office.
Region
Diplomatic Tax Exempt
Government For Hire
NSO 2010 Philippine Yearbook
Year All Types Earth Gravel Asphalt Concrete
1991 26,422 226 12,770 6,371 7,0551992 26,554 216 12,709 6,379 7,2501993 26,594 216 12,719 6,388 7,2701994 26,659 214 12,623 6,375 7,4471995 26,720 129 12,623 6,395 7,574
1996 26,369 353 11,862 6,806 8,3491997 27,650 381 11,575 6,894 8,8001998 27,893 380 11,486 6,733 9,2941999 28,523 387 11,512 6,882 9,7412000 29,056 612 11,424 6,684 10,336
2001 29,878 684 11,050 6,815 11,3292002 30,030 736 10,335 7,048 11,9112003 26,572 198 7,607 6,944 11,8232004 27,853 189 7,896 7,282 12,4862005 28,664 110 8,416 7,385 12,764
2006 28,979 90 8,417 7,501 12,9712007 29,370 76 8,287 7,629 13,3782008 29,650 80 7,894 8,092 13,5842009 29,898 87 7,343 8,282 14,1872010 31,242 106 7,010 8,701 15,425
Note: Total for the years 2003 and 2004 does not include other and unspecified national roads.
Source: Department of Public Works and Highways.
TABLE 19.6 National Roads, by Surface Type: 1991-2010(Kilometers)
Transportation
Port District OfficeType Total Manila/ Southern Northern Southern
Northern Luzon Luzon Mindanao Mindanao
Total 404 36 94 128 78 68
Base 22 4 4 5 5 4Terminal 66 4 19 25 9 9Other/Municipal Port 97 8 21 30 24 14Private 219 20 50 68 40 41
Total 416 34 93 132 83 74
Base 22 4 4 5 5 4Terminal 64 4 19 24 9 8Other/Municipal Port 108 6 20 35 32 15Private 222 20 50 68 37 47
Total 88 8 23 33 14 10
Base 23 4 4 6 5 4Terminal 65 4 19 27 9 6Other/Municipal Port - - - - - -Private - - - - - -
Total 413 30 88 140 84 71
Base 22 3 4 6 5 4Terminal 62 5 19 23 10 5Other/Municipal Port 106 3 20 45 23 15Private 223 19 45 66 46 47
Total 409 42 94 130 77 66
Base 22 3 4 6 5 4Terminal 63 6 19 23 10 5Other/Municipal Port 106 11 25 38 23 9Private 218 22 46 63 39 48
Total 425 40 100 143 69 73
Base 23 3 4 6 5 5Terminal 66 6 20 26 9 5Other/Municipal Port 109 8 27 40 18 16Private 227 23 49 71 37 47
Source: Philippine Ports Authority.
2006
2007
2008
2009
TABLE 19.7 Number of Ports by District Office, Type of Port and Area of Operation: 2004-2009
Visayas
2004
2005
NSO 2010 Philippine Yearbook
Total Total TotalGross Gross Gross
Tonnage Tonnage Tonnage
Total 1,720 953,698 2,078 1,004,621 4,233 1,416,097
Passenger ferry 128 9,628 87 6,707 225 17,792 Passenger cargo 511 379,428 853 379,520 1,835 481,663 General cargo 485 331,325 551 321,207 1,063 534,791 Container 4 11,644 4 11,644 13 11,662 Liquid cargo and/or Lighterage 11 7,049 13 8,873 20 11,448 Barging 47 30,428 43 28,878 50 36,815 Tanker 122 83,634 119 99,019 178 136,524 Towing or salvage 246 22,482 235 23,078 374 35,865 Pleasure 20 1,160 36 1,237 102 1,782 Pilotage 2 35 2 35 6 91 Others 137 76,549 126 93,101 320 146,084 No information 7 336 9 31,322 47 1,580
Total TotalGross Gross
Tonnage Tonnage
Total 8,383 1,790,447 8,531 1,584,338
Merchant Fleet 4,840 1,560,534 4,763 1,578,508 Passenger 2,230 449,273 2,640 501,573 Cargo 1,297 774,001 1,435 850,811 Tanker 174 161,027 174 161,611 Tug 268 26,793 367 36,372 Dredger 5 2,941 12 5,695 Yacht 2 37 2 37 Special purpose ship 8 1,250 12 3,648 Miscellaneous ship 41 8,636 45 8,943 Others 810 136,541 70 9,783 No information 5 35 6 35
Fishing 3,543 229,913 3,768 5,830
Source: Maritime Industry Authority.
TABLE 19.8 Number and Tonnage of Domestic Operating Merchant Fleet: 2006-2010
Type of Vessel
2006 2007 2008
2009 2010
Number Number
Number Number Number
Transportation
Type of Service Gross Gross GrossTonnage Tonnage Tonnage
Total 157 3,783,799 156 3,758,069 164 3,815,323
General cargo 30 346,574 29 331,716 33 388,885Bulk carrier 52 1,719,336 50 1,576,974 52 1,544,785Tanker 14 254,806 15 290,522 17 338,723Multipurpose carrier 4 28,481 4 28,568 4 28,568Roro (roll-on or roll-off) 2 20,328 2 20,328 1 6,788Reefer 2 12,747 2 12,747 2 15,264Livestock carrier 15 87,505 14 83,742 15 88,494Car carrier 11 352,157 - -Car/Vehicle center - - - - - -General cargo or container 4 135,352 4 174,363 4 174,363Passenger cargo 1 24,690 - - - -Dry cargo 2 6,580 2 7,670 2 7,670LPG carrier - - - - - -Vehicle carrier 1 9,999 4 97,814 3 59,065Wood chip carrier 19 785,244 21 865,285 21 865,285Cement carrier - - 1 3,998 1 3,998Car carrier - - 8 264,342 8 264,342Container carrier - - - - 1 29,093Unclassified 15 610,407 - - - -
Gross GrossTonnage Tonnage
Total 170 3,978,650 170 3,835,172
General cargo 34 400,062 38 437,553Bulk carrier 54 1,600,669 52 1,468,976Tanker 19 384,268 16 324,092Multipurpose carrier 3 52,784 4 75,782Roro (roll-on or roll-off) 1 6,788 1 6,788Reefer 2 15,264 2 15,264Livestock carrier 14 62,792 12 57,375Car/Vehicle center 7 277,529 8 321,339Container/ general cargo 4 130,985 4 130,985Dry cargo 1 4,028 1 4,028Vehicle carrier 1 9,999 - -Wood chip carrier 18 747,259 16 668,093Cement carrier 1 3,998 3 17,990Car carrier 1 27,589 - -Container carrier 3 123,291 3 123,291Multipurpose/general cargo - 2 45,996Multipurpose dry cargo 4 31,702 5 37,977Chip carrier 2 78,718 2 78,718Log/bulk carrier 1 20,925 1 20,925
Source: Maritime Industry Authority.
TABLE 19.9 Philippine Registered Overseas Fleet, by Type of Service: 2006-2010
2006 2007 2008
Number Number Number
Number Number
2009 2010
NSO 2010 Philippine Yearbook
Particulars 2004 2005 2006 2007 2008 2009 2010
Cargo throughput 157,367,181 155,250,027 154,340,778 157,437,721 141,594,797 150,473,286 166,395,680 (metric tons)
Domestic 82,742,123 79,263,064 72,840,475 74,591,279 71,758,150 72,514,651 69,714,085 Inbound 42,593,021 40,290,615 36,910,291 37,777,600 36,100,577 36,488,528 35,678,211 Outbound 40,149,102 38,972,449 35,930,184 36,813,679 35,657,573 36,026,123 34,035,874
Foreign 74,397,465 75,829,495 81,500,303 82,846,442 69,836,647 77,958,635 96,579,523 Import 51,871,790 50,543,856 52,331,804 49,459,867 46,727,363 47,583,576 55,115,069 Export 22,525,675 25,285,639 29,168,499 33,386,575 23,109,284 30,375,059 41,464,454
Transit Cargo 227,593 157,468 - - - - 102,072 Domestic 193,130 142,932 - - - - 82,815 Foreign 34,463 14,536 - - - - 19,257
Passenger traffic 53,036,396 48,629,675 42,556,005 44,468,927 43,870,914 43,872,565 52,701,645 Disembarking 27,044,947 24,722,609 21,252,337 21,943,930 21,516,761 21,723,679 26,851,004 Embarking 25,991,449 23,907,066 21,303,668 22,524,997 22,354,153 22,148,886 25,850,641
Sources: Philippine Ports Authority.
TABLE 19.10 Total Shipping Statistics, Cargo and Passenger: 2004-2010

Transportation
ShipcallsTotal Domestic Foreign Total Domestic Foreign Total Domestic Foreign
2010
At Berth
Total 346,000 335,202 10,798 302,637,117 183,839,386 118,797,731 14,914,474 13,623,321 1,291,153Manila/North Luzon 23,093 17,645 5,448 100,510,269 27,833,595 72,676,674 1,817,677 1,090,688 726,989Southern Luzon 96,853 95,321 1,532 63,853,385 46,596,479 17,256,906 3,908,701 3,746,822 161,879Visayas 132,904 132,250 654 60,136,108 55,268,690 4,867,418 5,185,078 5,119,992 65,086Northern Mindanao 53,189 52,354 835 38,049,038 33,977,686 4,071,352 2,373,068 2,316,756 56,312Southern Mindanao 39,961 37,632 2,329 40,088,317 20,162,936 19,925,381 1,629,950 1,349,063 280,887
At Anchorage
Total 4,547 2,960 1,587 27,497,461 1,825,019 25,672,442 342,011 122,050 219,961Manila/North Luzon 1,269 649 620 8,265,472 288,499 7,976,973 101,985 26,169 75,816Southern Luzon 2,016 1,779 237 3,756,683 1,012,056 2,744,627 89,714 63,672 26,042Visayas 196 72 124 2,805,341 130,149 2,675,192 26,243 5,275 20,968Northern Mindanao 395 41 354 10,310,593 21,501 10,289,092 67,349 1,896 65,453Southern Mindanao 671 419 252 2,359,372 372,814 1,986,558 56,720 25,038 31,682
2009
At Berth
Total 311,029 302,325 8,704 271,950,488 160,578,797 111,371,691 13,511,309 12,277,236 1,234,073Manila/North Luzon 21,274 16,843 4,431 90,986,504 25,162,386 65,824,118 1,738,347 1,067,559 670,788Southern Luzon 86,835 85,592 1,243 54,902,770 38,843,576 16,059,194 3,481,554 3,322,069 159,485Visayas 117,094 116,598 496 52,085,249 46,912,740 5,172,509 4,541,160 4,478,608 62,552Northern Mindanao 48,577 48,083 494 35,464,985 30,996,965 4,468,020 2,216,463 2,155,740 60,723Southern Mindanao 37,249 35,209 2,040 38,510,980 18,663,130 19,847,850 1,533,785 1,253,260 280,525
At Anchorage
Total 3,390 2,316 1,074 19,930,278 1,713,501 18,216,777 258,334 104,226 154,108Manila/North Luzon 1,067 525 542 7,873,938 230,300 7,643,638 93,087 21,991 71,096Southern Luzon 1,333 1,214 119 3,055,424 962,952 2,092,472 66,320 50,802 15,518Visayas 101 99 2 210,266 158,239 52,027 7,029 6,698 331Northern Mindanao 298 40 258 7,300,738 27,032 7,273,706 49,480 1,931 47,549Southern Mindanao 591 438 153 1,489,912 334,978 1,154,934 42,418 22,804 19,614
Note: MICT - Manila International Container Terminal.
Source: Philippine Ports Authority.
TABLE 19.10a Shipping Statistics At Berth and At Anchorageby Port Management Office: 2009-2010
Port OfficeGross Registered Tonnage Length (meters)
NSO 2010 Philippine Yearbook
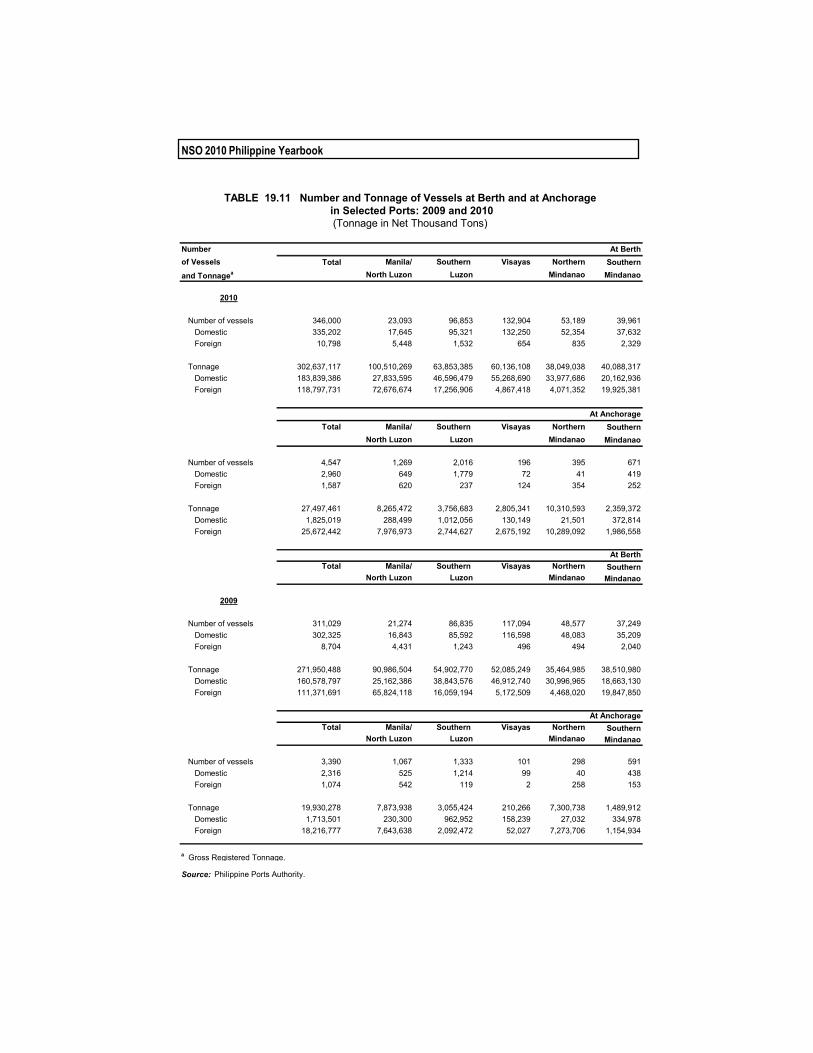
Numberof Vessels Total Manila/ Southern Visayas Northern Southernand Tonnagea North Luzon Luzon Mindanao Mindanao
2010
Number of vessels 346,000 23,093 96,853 132,904 53,189 39,961 Domestic 335,202 17,645 95,321 132,250 52,354 37,632 Foreign 10,798 5,448 1,532 654 835 2,329
Tonnage 302,637,117 100,510,269 63,853,385 60,136,108 38,049,038 40,088,317 Domestic 183,839,386 27,833,595 46,596,479 55,268,690 33,977,686 20,162,936 Foreign 118,797,731 72,676,674 17,256,906 4,867,418 4,071,352 19,925,381
Total Manila/ Southern Visayas Northern SouthernNorth Luzon Luzon Mindanao Mindanao
Number of vessels 4,547 1,269 2,016 196 395 671 Domestic 2,960 649 1,779 72 41 419 Foreign 1,587 620 237 124 354 252
Tonnage 27,497,461 8,265,472 3,756,683 2,805,341 10,310,593 2,359,372 Domestic 1,825,019 288,499 1,012,056 130,149 21,501 372,814 Foreign 25,672,442 7,976,973 2,744,627 2,675,192 10,289,092 1,986,558
Total Manila/ Southern Visayas Northern SouthernNorth Luzon Luzon Mindanao Mindanao
2009
Number of vessels 311,029 21,274 86,835 117,094 48,577 37,249 Domestic 302,325 16,843 85,592 116,598 48,083 35,209 Foreign 8,704 4,431 1,243 496 494 2,040
Tonnage 271,950,488 90,986,504 54,902,770 52,085,249 35,464,985 38,510,980 Domestic 160,578,797 25,162,386 38,843,576 46,912,740 30,996,965 18,663,130 Foreign 111,371,691 65,824,118 16,059,194 5,172,509 4,468,020 19,847,850
Total Manila/ Southern Visayas Northern SouthernNorth Luzon Luzon Mindanao Mindanao
Number of vessels 3,390 1,067 1,333 101 298 591 Domestic 2,316 525 1,214 99 40 438 Foreign 1,074 542 119 2 258 153
Tonnage 19,930,278 7,873,938 3,055,424 210,266 7,300,738 1,489,912 Domestic 1,713,501 230,300 962,952 158,239 27,032 334,978 Foreign 18,216,777 7,643,638 2,092,472 52,027 7,273,706 1,154,934
a Gross Registered Tonnage.
Source: Philippine Ports Authority.
At Anchorage
TABLE 19.11 Number and Tonnage of Vessels at Berth and at Anchorage in Selected Ports: 2009 and 2010(Tonnage in Net Thousand Tons)
At Berth
At Anchorage
At Berth

Transportation
Year Total National Private Year Total National Private
1967 125 77 48 1988 180 86 941968 136 77 59 1989 208 86 1221969 125 77 48 1990 209 86 1231970 123 75 48 1991 229 89 1401971 123 75 48 1992 216 86 130
1972 135 76 59 1993 249 87 1621973 139 77 62 1994 300 86 2141974 146 78 68 1995 190 86 1041975 149 78 71 1996 266 86 1801976 131 79 52 1997 192 89 103
1977 135 79 56 1998 167 92 751978 181 82 99 1999 172 85 871979 202 85 117 2000 172 85 871980 206 86 120 2001 157 87 701981 205 85 120 2002 174 87 87
1982 226 85 141 2003 163 85 781983 227 86 141 2004 196 85 1111984 227 86 141 2005 203 85 1181985 228 87 141 2006 203 85 1181986 230 87 143 2007 203 85 1181987 227 84 143 2008 203 85 118
2009 203 85 118
Source: Air Transportation Office.
TABLE 19.12 Number of Airports in Operation: 1967-2009

NSO 2010 Philippine Yearbook
2007 2008 2009 2010 2007 2008 2009 2010
Philippines 609,419 565,970 625,582 663,009 34,259,543 36,163,102 40,934,947 47,988,119
International Airport 372,051 251,452 287,688 320,343 25,296,666 25,896,020 28,503,377 33,292,507 Diosdado Macapagal 5,173 - - - 515,824 - - - Mactan 62,973 46,206 64,900 84,348 4,069,448 3,642,862 4,394,823 5,971,387 NAIA 188,797 205,246 222,788 235,995 20,693,746 22,253,158 24,108,554 27,321,120 Subic 115,108 - - - 17,648 - - -Alternate International Airports 25,374 28,422 29,812 33,146 2,493,700 3,409,228 2,855,549 3,486,681 Davao 14,904 16,176 19,198 19,822 1,555,222 2,482,482 1,967,950 2,229,177 General Santos 2,326 2,348 - 2,858 310,233 302,887 169,209 456,526 Laoag 2,386 3,118 3,190 2,856 143,027 154,319 135,473 177,339 Zamboanga 5,758 6,780 7,424 7,610 485,218 469,540 582,917 623,639Trunkline 53,317 56,320 79,366 96,770 4,250,893 8,146,945 5,885,728 7,394,774 Bacolod 9,839 9,860 12,258 19,354 785,931 843,488 1,050,429 1,223,491 Baguio 1,484 1,492 1,546 1,094 57,989 9,805 2,279 1,784 Cagayan de Oro 6,846 7,260 10,914 12,590 702,405 902,184 1,110,468 1,301,502 Cotabato 1,968 1,606 4,076 2,976 127,198 104,535 199,133 219,014 Dumaguete 7,858 2,714 5,880 5,212 276,228 3,642,862 360,515 363,021 Iloilo 10,532 12,160 16,880 32,068 1,002,618 1,073,907 1,324,148 1,581,304 Legaspi 2,456 2,556 4,418 4,198 225,062 282,409 139,265 435,151 Puerto Princesa 4,538 5,488 8,478 7,520 392,039 481,756 587,753 813,516 Roxas 1,348 1,498 2,022 1,978 134,712 115,375 173,132 203,840 San Jose 1,978 6,448 3,870 3,126 35,389 63,423 106,956 103,175 Tacloban 4,470 5,238 9,024 6,654 511,322 627,201 831,650 1,148,976Secondary 123,066 183,108 73,788 169,585 1,612,181 1,989,725 3,171,727 3,190,175 Allah Valley 58 104 104 66 159 238 88 - Antique 20 306 - - 90 2,381 - - Bagabag 686 710 516 462 788 1,135 953 1,097 Basco 1,204 766 1,246 968 19,550 24,288 19,308 26,089 Bislig - - - 2,858 - - 404,859 - Butuan 1,936 3,294 3,648 3,366 200,346 308,405 385,331 382,843 Calapan - 574 708 1,354 - 1,188 604 - Calbayog 304 504 1,078 1,924 11,138 20,616 62,777 52,510 Catarman 314 428 1,736 3,478 17,235 22,624 125,762 88,051 Cauayan 1,626 3,402 13,348 6,406 6,397 10,973 9,158 38,025 Daet 54 110 - - 20 300 - Dipolog 1,402 3,458 2,104 2,494 121,232 143,819 188,664 181,386 Iligan 30 16 - - 38 8 - - Jolo 850 862 640 470 14,245 18,749 9,029 9,931 Kalibo 4,300 4,706 8,876 14,504 470,169 400,042 615,024 1,048,288 Lubang 2,504 2,978 2,910 4,346 11,136 12,952 11,039 13,961 Mamburao 186 1,384 640 378 343 2,629 1,201 1,552 Marinduque 78 34 488 708 133 1,099 15,387 10,276 Masbate 912 1,118 286 1,360 22,859 23,585 1,384 44,068 Mati - - - - - - - Naga 1,052 2,136 2,974 3,290 52,997 87,168 125,890 162,444
Continued
Table 19.13 Scheduled and Nonscheduled Domestic Aircraft Movement and Passenger Traffic, by Airport: 2007-2010
AirportsAircraft Movement Passenger Traffic
Transportation
Table 19.13--Concluded
2007 2008 2009 2010 2007 2008 2009 2010
Ormoc 1,396 2,790 3,740 7,838 1,319 15,830 17,800 32,258 Ozamis 218 574 1,646 1,902 20,619 80,290 161,048 206,428 Pagadian 196 - 2 376 6,250 - - 26,082 Plaridel 89,820 117,204 - 97,340 180,712 234,098 222,525 5,326 Romblon 120 808 570 692 747 7,980 7,668 17,050 San Fernando - - - - - - - Sanga-Sanga 804 - 762 604 14,489 - 5,539 14,230 Sorsogon 8 30 2 4 - 4 4 - Surigao 898 758 1,838 - 27,402 23,170 64,928 90,932 Tagbilaran 4,794 5,612 6,530 6,378 345,613 400,814 562,787 573,299 Tandag 126 122 18 58 12 25 - - Tuguegarao 1,746 2,396 4,626 3,104 38,123 68,821 94,350 116,460 Vigan 4,920 25,244 11,292 1,836 9,365 47,548 21,923 6,157 Virac 504 680 1,460 1,020 18,655 28,946 38,706 42,573Feeder 35,546 47,110 41,476 45,454 604,689 848,097 686,372 805,962 Alabat - 4 - - - - - - Baler 34 998 568 366 1,121 2,615 994 376 Biliran - - 2 8 - - 2 - Busuanga 4,278 3,376 4,940 3,672 33,673 52,619 141,093 140,660 Bulan 2 24 - 2 2 4 - - Cagayan de Sulu - - - - - - - - Camiguin 250 212 - - 2,173 1,171 - - Catbalogan - - 12 4 - - - - Caticlan 19,996 23,868 15,442 24,196 548,187 761,961 502,355 623,545 Cuyo 564 810 742 - 547 1,206 556 - Guiuan 314 188 - 22 864 358 1 3 Hilongos 170 296 472 370 163 181 - Iba 5,552 8,992 5,634 6,190 6,474 10,194 6,643 6,826 Ipil 32 - - 12 37 - - - Jomalig 30 34 172 8 215 159 34 13,961 Liloy - - - - - - - - Lingayen 3,054 6,858 11,994 6,152 6,474 13,217 20,509 11,655 Lucena - - - - - - - - Malaybalay - - - - - - - - Palanan 1,190 950 1,018 1,682 4,498 3,383 4,015 - Rosales 8 - - - - - - - Siargao 48 302 474 2,600 225 953 10,170 8,850 Siocon - - - - - - - - Siquijor 24 198 - 170 36 76 - 86 Ubay - - 6 - - - - - Wasig - - - - - - - -
Source: Civil Aviation of the Philippines.
AirportAircraft Movement Passenger Traffic

NSO 2010 Philippine Yearbook
Month Aircraft Movemennt Passenger Traffic Cargo/Freight Movement
2010 663,009 47,988,119 636,831,800
January 56,989 3,804,917 48,710,340February 53,102 3,532,254 47,290,383March 58,159 4,016,635 55,080,372April 58,953 4,433,807 52,568,449May 60,310 3,879,765 51,893,161June 53,963 3,956,062 48,084,592July 54,401 3,838,930 51,998,268August 50,912 3,884,634 55,866,144September 49,462 3,923,621 58,429,495October 52,955 3,875,876 55,213,595November 55,867 3,879,765 54,576,130December 57,936 4,300,093 57,265,705
2009 625,582 40,934,947 595,804,359
January 52,207 3,727,016 40,238,158February 49,239 2,880,643 30,338,362March 60,399 3,579,645 35,223,970April 55,170 4,046,125 34,561,052May 57,946 4,093,267 39,455,670June 48,408 3,334,948 40,158,249July 51,638 3,401,725 43,834,548August 50,486 3,481,921 40,766,284September 40,512 2,691,939 45,330,154October 50,095 3,253,687 44,936,461November 54,274 3,284,041 145,789,327December 56,024 3,661,894 55,172,124
Source: Civil Aviation Authority of the Philippines.
TABLE 19.14 Scheduled Domestic Aircraft Movement, Passenger Trafficand Cargo Movement, by Month: 2009-2010
(Cargo/Freight Movement in Kilograms)